Article

Quantitative Analysis of Multi-Angle Correlation Between Fractal Dimension of Anthracite Surface and Its Coal Quality Indicators in Different Regions

1
Key Laboratory of Intelligent Underground Detection Technology, College of Civil Engineering, Anhui Jianzhu University, Hefei 230601, China
2
School of Earth and Space Sciences, University of Science and Technology of China, Hefei 230026, China
*
Author to whom correspondence should be addressed.
Fractal Fract. 2025, 9(8), 538; https://doi.org/10.3390/fractalfract9080538
Submission received: 21 July 2025 / Revised: 11 August 2025 / Accepted: 12 August 2025 / Published: 15 August 2025
(This article belongs to the Special Issue Applications of Fractal Dimensions in Rock Mechanics and Geomechanics)

Abstract

The nanoporous structure of coal is crucial for the occurrence and development of coalbed methane (CBM). This study, leveraging the combined characterization of atomic force microscopy (AFM) and Gwyddion software (v2.62), investigated six anthracite samples with varying degrees of metamorphism (Ro = 2.11–3.36%). It revealed the intrinsic relationships between their nanoporous structures, surface morphologies, fractal characteristics, and coalification processes. The research found that as Ro increases, the surface relief of coal decreases significantly, with pore structures evolving from being macropore-dominated to micropore-enriched, and the surface tending towards smoothness. Surface roughness parameters (Ra, Rq) exhibit a negative correlation with Ro. Quantitative data indicate that area porosity, pore count, and shape factor positively correlate with metamorphic grade, while mean pore diameter negatively correlates with it. The fractal dimensions calculated using the variance partition method, cube-counting method, triangular prism measurement method, and power spectrum method all show nonlinear correlations with Ro, moisture (Mad), ash content (Aad), and volatile matter (Vdaf). Among these, the fractal dimension obtained by the triangular prism measurement method has the highest correlation with Ro, Aad, and Vdaf, while the variance partition method shows the highest correlation with Mad. This study clarifies the regulatory mechanisms of coalification on the evolution of nanoporous structures and surface properties, providing a crucial theoretical foundation for the precise evaluation and efficient exploitation strategies of CBM reservoirs.

1. Introduction

In the context of the global push for carbon neutrality, optimizing energy structures and developing green and low-carbon technologies have become core strategies for industrial economies [1,2,3,4]. This process involves both seeking alternatives to fossil fuels and urgently enhancing the clean and efficient utilization of existing fossil fuels, particularly coal. As a crucial unconventional natural gas resource, the commercial development of coalbed methane (CBM) not only provides a relatively clean energy source but also effectively reduces methane emissions during coal mining, making it a key pathway to the low-carbon utilization of coal resources [5,6]. The complex nanoporous system within coal, serving as the primary space for gas (CH4, CO2) occurrence and the critical pathway for gas migration, fundamentally governs the recoverability of CBM, the potential for CO2 sequestration, and the efficiency of related engineering technologies through its structural characteristics (such as pore size, shape, connectivity, specific surface area, and surface roughness) [7,8]. Therefore, precise characterization of the nanoporous structure of coal is not only fundamental to advancing our understanding of coal geology but also a critical scientific issue supporting innovations in clean coal utilization technologies and serving national energy security and “dual-carbon” strategic goals. Currently, pore structure characterization techniques are mainly classified into two categories: fluid intrusion methods [9,10] and microscopic imaging methods [10,11,12,13]. Among them, fluid intrusion methods encompass gas adsorption analysis, nuclear magnetic resonance (NMR) technology, mercury intrusion porosimetry, etc., while microscopic imaging methods include scanning electron microscopy (SEM), atomic force microscopy (AFM), computed tomography (CT) scanning, optical microscopy, and others. Microscopic imaging methods, due to their non-destructive nature, have gradually become mainstream research methods. In particular, the breadth of their application has significantly increased after the implementation of automated pore network identification through digital image processing techniques [14]. As a pivotal technique within microscopic imaging methods, AFM, with its sub-nanometer resolution capability and in situ characterization advantage in real environments, has become a key technological support in various disciplines such as materials science [15,16] and biochemistry [17,18], continuously driving the development of related fields. With AFM, the surface structure and properties of materials can be studied by detecting the extremely weak intermolecular interactions between the sample surface and a miniature force-sensitive element. During scanning, the sensor detects these changes and captures force distribution information, enabling the acquisition of surface morphology and roughness information at a nanometer resolution. In the past decade, numerous scholars have conducted in-depth explorations of the pore structure characteristics on coal and rock surfaces using AFM [19].
Lawrie et al. [20] employed AFM technology to microscopically characterize the pore structure of coal matrices in the Bowen Basin, thereby expanding the observational dimensions of coal microstructure research. Liu et al. [21] observed the three-dimensional morphology of coal using AFM, simultaneously measured surface roughness information, and conducted fractal analysis on ultrafine coal. They found a positive correlation between the fractal dimension of ultrafine coal particles and coal particle size. Xie et al. [22] utilized AFM and SEM techniques to reveal the evolution law of pore structures on the surface of tectonically deformed coal bodies. Specifically, tectonic stress significantly increased the fractal dimension and pore density of the coal sample surfaces. Qiao et al. [23] analyzed the surface morphology of high-rank coal through AFM and High-Resolution Transmission Electron Microscope (HRTEM) experiments. Their research revealed that, during the graphitization process, the morphology of the coal matrix evolved towards regularization and smoothness, accompanied by the regular contraction of interlayer spacing between carbon layers. AFM is capable of not only measuring pore parameters on coal surfaces but also providing in-depth analysis of pore surface roughness. AFM technology combines the ability to measure pore geometric parameters with the capability to analyze pore wall roughness. When combined with the specialized surface analysis software Gwyddion for statistical characterization of microscopic imaging, it can simultaneously obtain nanoscale pore topological parameters and surface roughness characteristic parameters [24]. Microscopic pores within the coal matrix exhibit multiscale heterogeneous topological morphologies, and their structural complexity makes it challenging to effectively characterize them using traditional Euclidean geometry theories. This limitation has prompted the introduction of fractal geometry theory into the pore structure analysis framework, enabling the establishment of quantitative descriptive models for microscopic pore systems through characteristic parameters such as fractal dimension [25].
Currently, fractal research on coal structure focuses on the fractal characterization of nanopores and micrometer-scale fractures in coal. Many scholars have calculated the fractal dimension of pore structures using models such as the Menger sponge model, thermodynamic model, and FHH model [26,27,28], but research on the fractal characterization of coal nanopores based on AFM remains inadequate. In this study, high-rank anthracite samples with different volatile matter contents were selected to visualize the three-dimensional morphology of their nanoscale pores through AFM and obtain the spatial distribution characteristics of their pores. The surface features of the coal were quantitatively analyzed using both Gwyddion software and NanoScope analysis, from which three core sets of parameters were extracted: nanopore structure parameters (including pore count, surface porosity, average pore diameter, and shape factor), surface roughness indicators, and fractal dimension values. The study systematically explored the correlation between coalification degree and pore-roughness parameters, establishing quantitative functional relationships among these parameters. It focused on the coupling mechanism between Ro, proximate analysis components, and fractal dimensions, revealing the physical essence of how coal parameters control pore structure relationships. This characterization system can deepen the understanding of the correlation between pore fractal characteristics and gas storage capacity, providing theoretical support for natural gas reserve assessments, outburst risk early warnings, and emission control.

2. Materials and Methods

2.1. Geological Background

The coal samples were collected from two mining areas: the No. 9 coal seam at the North Pit of Dongpang Mine in Xingtai City, Hebei Province, and the No. 15 coal seam at Xiaoxi Coal Mine in Jincheng City, Shanxi Province. The North Pit of Dongpang Mine is located in the piedmont alluvial–proluvial plain in the middle section of the eastern foothills of the Taihang Mountains (Figure 1). The terrain slopes westward to eastward, with an elevation ranging from +80 m to +125 m. The mountain range in the north-northeast direction in the west forms a striking contrast with the alluvial plain at a low altitude of +70 m in the east, while the north bank of the Baima River in the southwest maintains an elevation between +100 m and +130 m. The No. 9 coal seam at this mine has a thickness ranging from 5.25 m to 9.13 m, with an average of 6.95 m. The coefficient of variation in coal thickness is γ = 14%, and the minability index Km is 1, indicating a geologically stable coal seam.
Xiaoxi Coal Mine is situated in the structural junction zone of the Taihang Mountains and Zhongtiao Mountains (Figure 1), characterized by a landscape of moderately low-lying mountains with intense erosion. The development of a valley–ridge system has resulted in fragmented terrain. The overall terrain of the mining area slopes northward to southward, with the peak of Zaoyan Hill in the northwest reaching the highest point at 1348.01 m, descending to the lowest point of 850.00 m near the southern boundary highway, creating a relief of 498.01 m. The No. 15 coal seam has a thickness ranging from 2.50 m to 4.21 m, with an average thickness of 3.07 m, and a minable coal-bearing coefficient of 3.52%.

2.2. Experimental Methods

In this study, coal samples from the mining areas of Xingtai in Hebei Province and Jincheng in Shanxi Province were selected as experimental subjects, with a focus on the micro-morphological heterogeneity and pore configuration evolution during the coalification process of coal bodies. AFM was employed to quantitatively characterize the pore topology and fractal features of high-rank anthracite samples with different volatile matter contents. Combined with industrial component analysis, vitrinite reflectance determination, and maceral measurement methods, the material composition and thermal evolution degree of the samples were systematically analyzed. Based on multi-parameter correlation analysis, the control mechanisms governing pore structure evolution during metamorphism and the influencing factors of fractal dimension were revealed. Sample preparation and all experimental procedures were completed at the Center for Physical Science and Technology Instruments of the University of Science and Technology of China. The sample preparation and experimental protocol are detailed as follows.

2.2.1. Proximate Analysis and Vitrinite Reflectance

The moisture, ash, and volatile matter contents of the high-rank anthracite samples were determined according to ASTM standards D3173-23 (2023), D3174 (2019), and D3175-20 (2020). For specific experimental analysis procedures, please refer to our previous research [29]. For vitrinite reflectance testing, 10 mm × 10 mm × 5 mm coal bricks were used, with the test surface flattened with water sandpaper and polished with polishing solution. Testing was conducted after drying in a desiccator for 12 h, using a binocular polarizing microscope and spectrophotometer as experimental equipment. The experimental procedure is as follows: (1) Start and preheat the instrument to a stable working state. (2) Calibrate the microscope photometry using the dual-standard method. (3) Place the sample and, under oil-immersion reflected light, move the sample to the measurement area for determination. When the instrument has been running continuously for about 2 h, remeasure the standard sample to ensure the accuracy of the experimental data.

2.2.2. Maceral Measurement

Quantitative analysis of the macerals in the coal samples was conducted following the standard methods of the International Committee for Coal and Organic Petrology (ICCP) 74, 75. Detailed experimental analysis procedures can be found in our previous research [29]. Additionally, to ensure the reliability of the experimental data, each sample was subjected to triplicate experiments. The basic data of the coal samples (Table 1) were based on the average values obtained from these three experiments.

2.2.3. Atomic Force Microscope Experiment

The experiment utilized a nanoscale Atomic Force Microscope (SPA-300HV, Digital Instruments, Chiba, Japan) for surface morphology characterization, with a maximum scanning dimension of 30 μm × 30 μm × 2 μm. The configuration of an 1800/mm standard grating significantly enhanced the surface morphology resolution. Detailed sample preparation procedures and testing parameters can be found in our previous research results [30]. Scanning data were processed and analyzed using NanoScope analysis v3.0 software.
The surface morphology of the samples was analyzed using NanoScope analysis software. Prior to processing AFM data and images, necessary flattening treatments were applied to the samples to improve measurement accuracy and prevent misinterpretation of data. Based on the surface morphology images obtained from AFM scanning and the open-source image segmentation software Gwyddion, the watershed method was employed to delineate the pore areas on the image surface. Statistical analysis was then conducted to obtain characteristics such as the surface porosity, average pore diameter, pore count, shape factor, and fractal dimension of the samples. To enhance data accuracy, each parameter was measured three times, and the data presented in the table represent the average of these three measurements.

3. Results and Discussion

3.1. AFM Image Analysis

The three-dimensional morphological analysis of coal holds significant importance in coal resource extraction, safety management, and methane control. Through three-dimensional morphological analysis, the spatial distribution patterns of fractures, pores, and structural characteristics within the coal structure can be revealed, providing crucial data support for assessing coal seam permeability and subsequently enhancing mining efficiency and safety. Furthermore, with the aid of three-dimensional modeling and dynamic monitoring technologies, early warnings for geological hazards can be issued, ensuring safe production in coal mines. Meanwhile, precise analysis of the micropore structure, including pore morphology and pore size distribution, aids in-depth research into methane adsorption and migration mechanisms, providing a scientific basis for methane drainage. In recent years, numerous scholars have utilized techniques such as CT, AFM, and SEM to study the three-dimensional morphological changes in coal. Zhang et al. [31] employed computed tomography (CT) combined with fractal theory to investigate the evolution characteristics of three-dimensional fractures in coal induced by CO2 phase-change fracturing. Chang et al. [32] conducted three-dimensional measurements of the micro-topography of coal surfaces using atomic force microscopy (AFM), observing nanoscale pore structures with an average pore diameter of 92.25 nm. Li et al. [33] obtained pore morphologies and distributions at different scales by fusing 800 high-resolution SEM images into a single image.
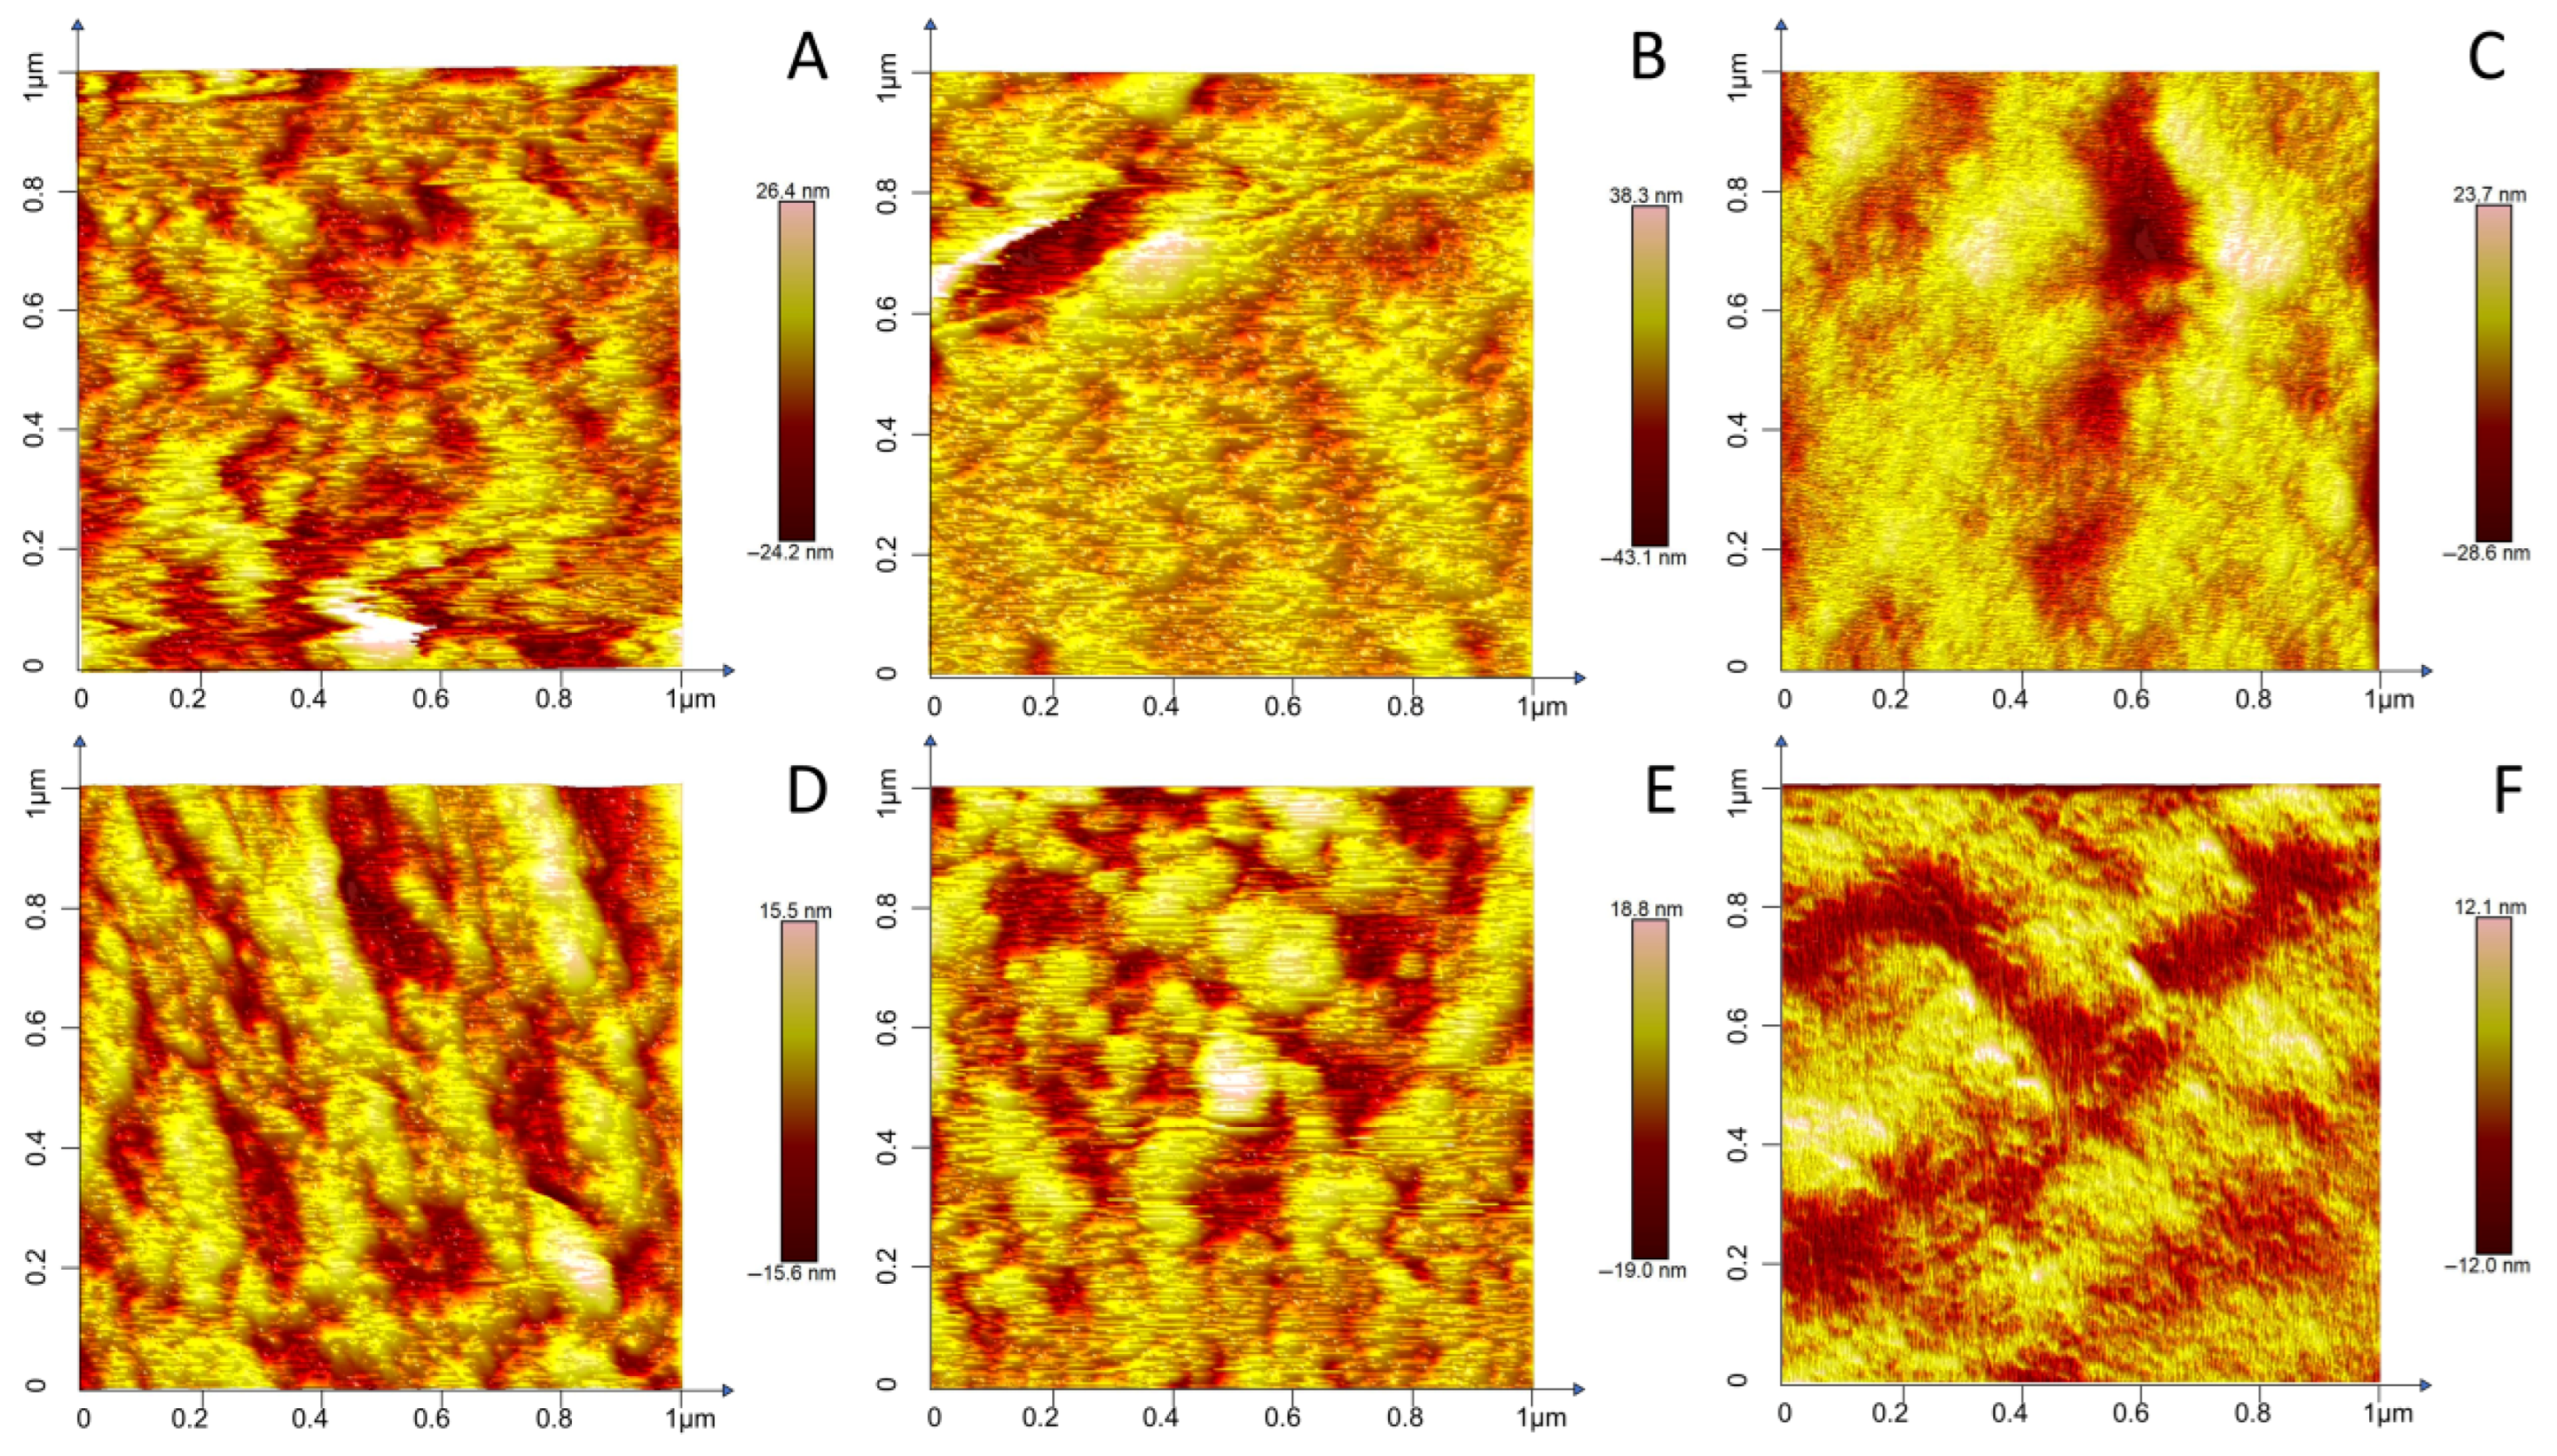
Compared to other techniques, atomic force microscopy (AFM) demonstrates unique advantages in the three-dimensional morphological analysis of coal. AFM enables non-destructive three-dimensional measurement of coal surfaces without requiring a vacuum environment, directly acquiring authentic morphological data. This avoids issues of deformation or distortion that may arise from sample conductivity treatment in scanning electron microscopy (SEM). Furthermore, AFM boasts an atomic-level resolution, with lateral resolution up to 0.1 nm and vertical resolution reaching 0.01 nm, capable of accurately characterizing the morphology and distribution of nanoscale pores in coal. This provides high-precision data support for analyzing the diffusion pathways of methane molecules within pores. In contrast, SEM is limited by its lower resolution (typically above 1 nm) and the constraints of two-dimensional imaging, making it challenging to achieve equivalent precision in three-dimensional characterization. Therefore, this study utilized AFM experiments to obtain the three-dimensional surface morphologies of different samples, as shown in Figure 2. In these three-dimensional images, brighter colors represent higher surface heights, while darker colors indicate lower surface heights. The variation in image color reflects the degree of undulation and pore distribution on the sample surface.
The three-dimensional surface morphology results of the samples reveal a systematic variation in surface morphology characteristics as the Ro increases. Sample M-2 (Ro = 2.11) exhibits a surface height difference of 81.4 nm, while the surface height differences for samples ranging from M-2 to M-6 are 52.3 nm, 31.1 nm, 37.8 nm, and 24.1 nm, respectively. This finding indicates that as the metamorphic grade of coal increases, the surface height difference in the samples tends to decrease. This may be attributed to the gradual cleavage of aliphatic side chains (such as -CH2-, -O-, etc.) in coal as temperature and pressure increase (Ro from 2.11 to 3.36), leading to the formation of larger and more ordered layered structures through polycondensation reactions within the aromatic condensed ring system. This ordering of molecular arrangement results in the densification of coal, macroscopically manifesting as a reduction in surface relief height difference. The research by Chen et al. [34] further confirms this phenomenon. Simultaneously, this study finds that the macromolecules in sample M-2 are loosely arranged, developing abundant macroporous structures. As Ro increases, the number of macroporous structures gradually decreases (from M-3 to M-5), and dispersed micropores gradually increase. Among them, the highest-metamorphic-grade sample M-6 (Ro = 3.36) significantly develops a large number of micropores. Macroscopically, low-volatile anthracite samples (M-5, M-6) exhibit smoother surface structures. This is due to the release of volatiles (such as CO2, CH4) during the coalification process, which leads to the contraction of the pore wall carbon skeleton, forming a finer molecular-scale pore network.
Although 3D micromorphological images based on AFM can characterize apparent properties to some extent, the 3D surface data obtained by AFM cannot directly correlate internal structure with macroscopic properties. However, cross-sectional analysis allows for the establishment of multiscale correlations. Therefore, we selected three samples with different volatile matters and high degrees of metamorphism and performed cross-sectional operations. Cross-sectional analysis can be used to directly measure the depth of surface features by selecting the surface contour curve of the cross-section in the 3D image, as shown in Figure 3B,D,F. Figure 3A,C,E exhibit the pore distribution (indicated by purple areas) in cross-sections B, D, and F of the samples, respectively. Cross-section B exhibits pores with diameters ranging from 6.4 nm to 17.29 nm, corresponding to depths of 4.369 nm to 9.818 nm, and features three prominent large pores. Cross-section D has a maximum pore diameter (17.05 nm) and depth (9.817 nm) similar to those of cross-section B, but with an increased number of micropores. Cross-section F shows a decrease in height differences and a further increase in the number of micropores. The variations in pore structure across these cross-sections indicate a systematic evolution in the surface pore distribution as the degree of coal metamorphism increases.

3.2. Surface Roughness Analysis

The surface roughness of coal, serving as a quantitative indicator of its surface undulations, is an indirect parameter representing the development status of pore structures in coal samples. Generally, a decrease in surface smoothness correlates with an increase in pore development. However, surface roughness is influenced by multiple factors, including the degree of metamorphism, oxidation reactions, particle size, and maceral types. Wu et al. [30] demonstrated that the surface roughness of bituminous coal is higher than that of anthracite. Bruening et al. [35] observed that the oxidation process can significantly alter the surface morphological characteristics of coal. Liu et al. [36] found that reducing the particle size of coal results in a notable decrease in its surface roughness. Morga et al. [37] discovered that within the same coal sample, fusinite components exhibit higher surface roughness than semifusinite components.
To further explore the trend of metamorphic grade’s influence on coal surface roughness, this study selected coals with different Ro values from M-1 to M-6 and obtained surface roughness parameters for each coal sample based on AFM surface morphology images. These parameters include average roughness, root mean square roughness, skewness, and kurtosis, which represent the average value of surface roughness, the degree of variation, the symmetry of distribution, and the concentration of distribution [38], respectively. The calculation formulas are as follows:
R a = 1 N x N y i = 1 N x j = 1 N y | z ( i , j ) Z mean |
Z mean = 1 N x N y i = 1 N x j = 1 N y z ( i , j )
R q = 1 N x N y i = 1 N x j = 1 N y ( z ( i , j ) Z mean ) 2
R sk = 1 R q 3 1 N i = 1 N Z i 3
R ku = 1 R q 4 1 N i = 1 N Z i 3
Terms in the equation: Average Roughness (Ra): The arithmetic mean of the absolute deviations of the individual profile heights from the arithmetic mean height within a specified sampling length (unit: nm). Root Mean Square Roughness (Rq): The standard deviation of the surface height distribution, representing the degree of dispersion of profile heights from the mean value (unit: nm). Scanning Dimensions: The number of discrete measurement points in the directions of the x-axis and y-axis, denoted as Nx and Ny, respectively (dimensionless). Height Reference: The profile height at any coordinate point (i, j) is denoted as z(i, j); the arithmetic mean of the heights of all measurement points is Zmean (unit: nm). Skewness (Rsk): The third moment statistic of the surface height distribution, reflecting the asymmetry of the probability density function relative to the mean value (dimensionless). Kurtosis (Rku): The fourth moment statistic of the surface height distribution, characterizing the sharpness of the concentration of profile heights around the mean value (dimensionless).
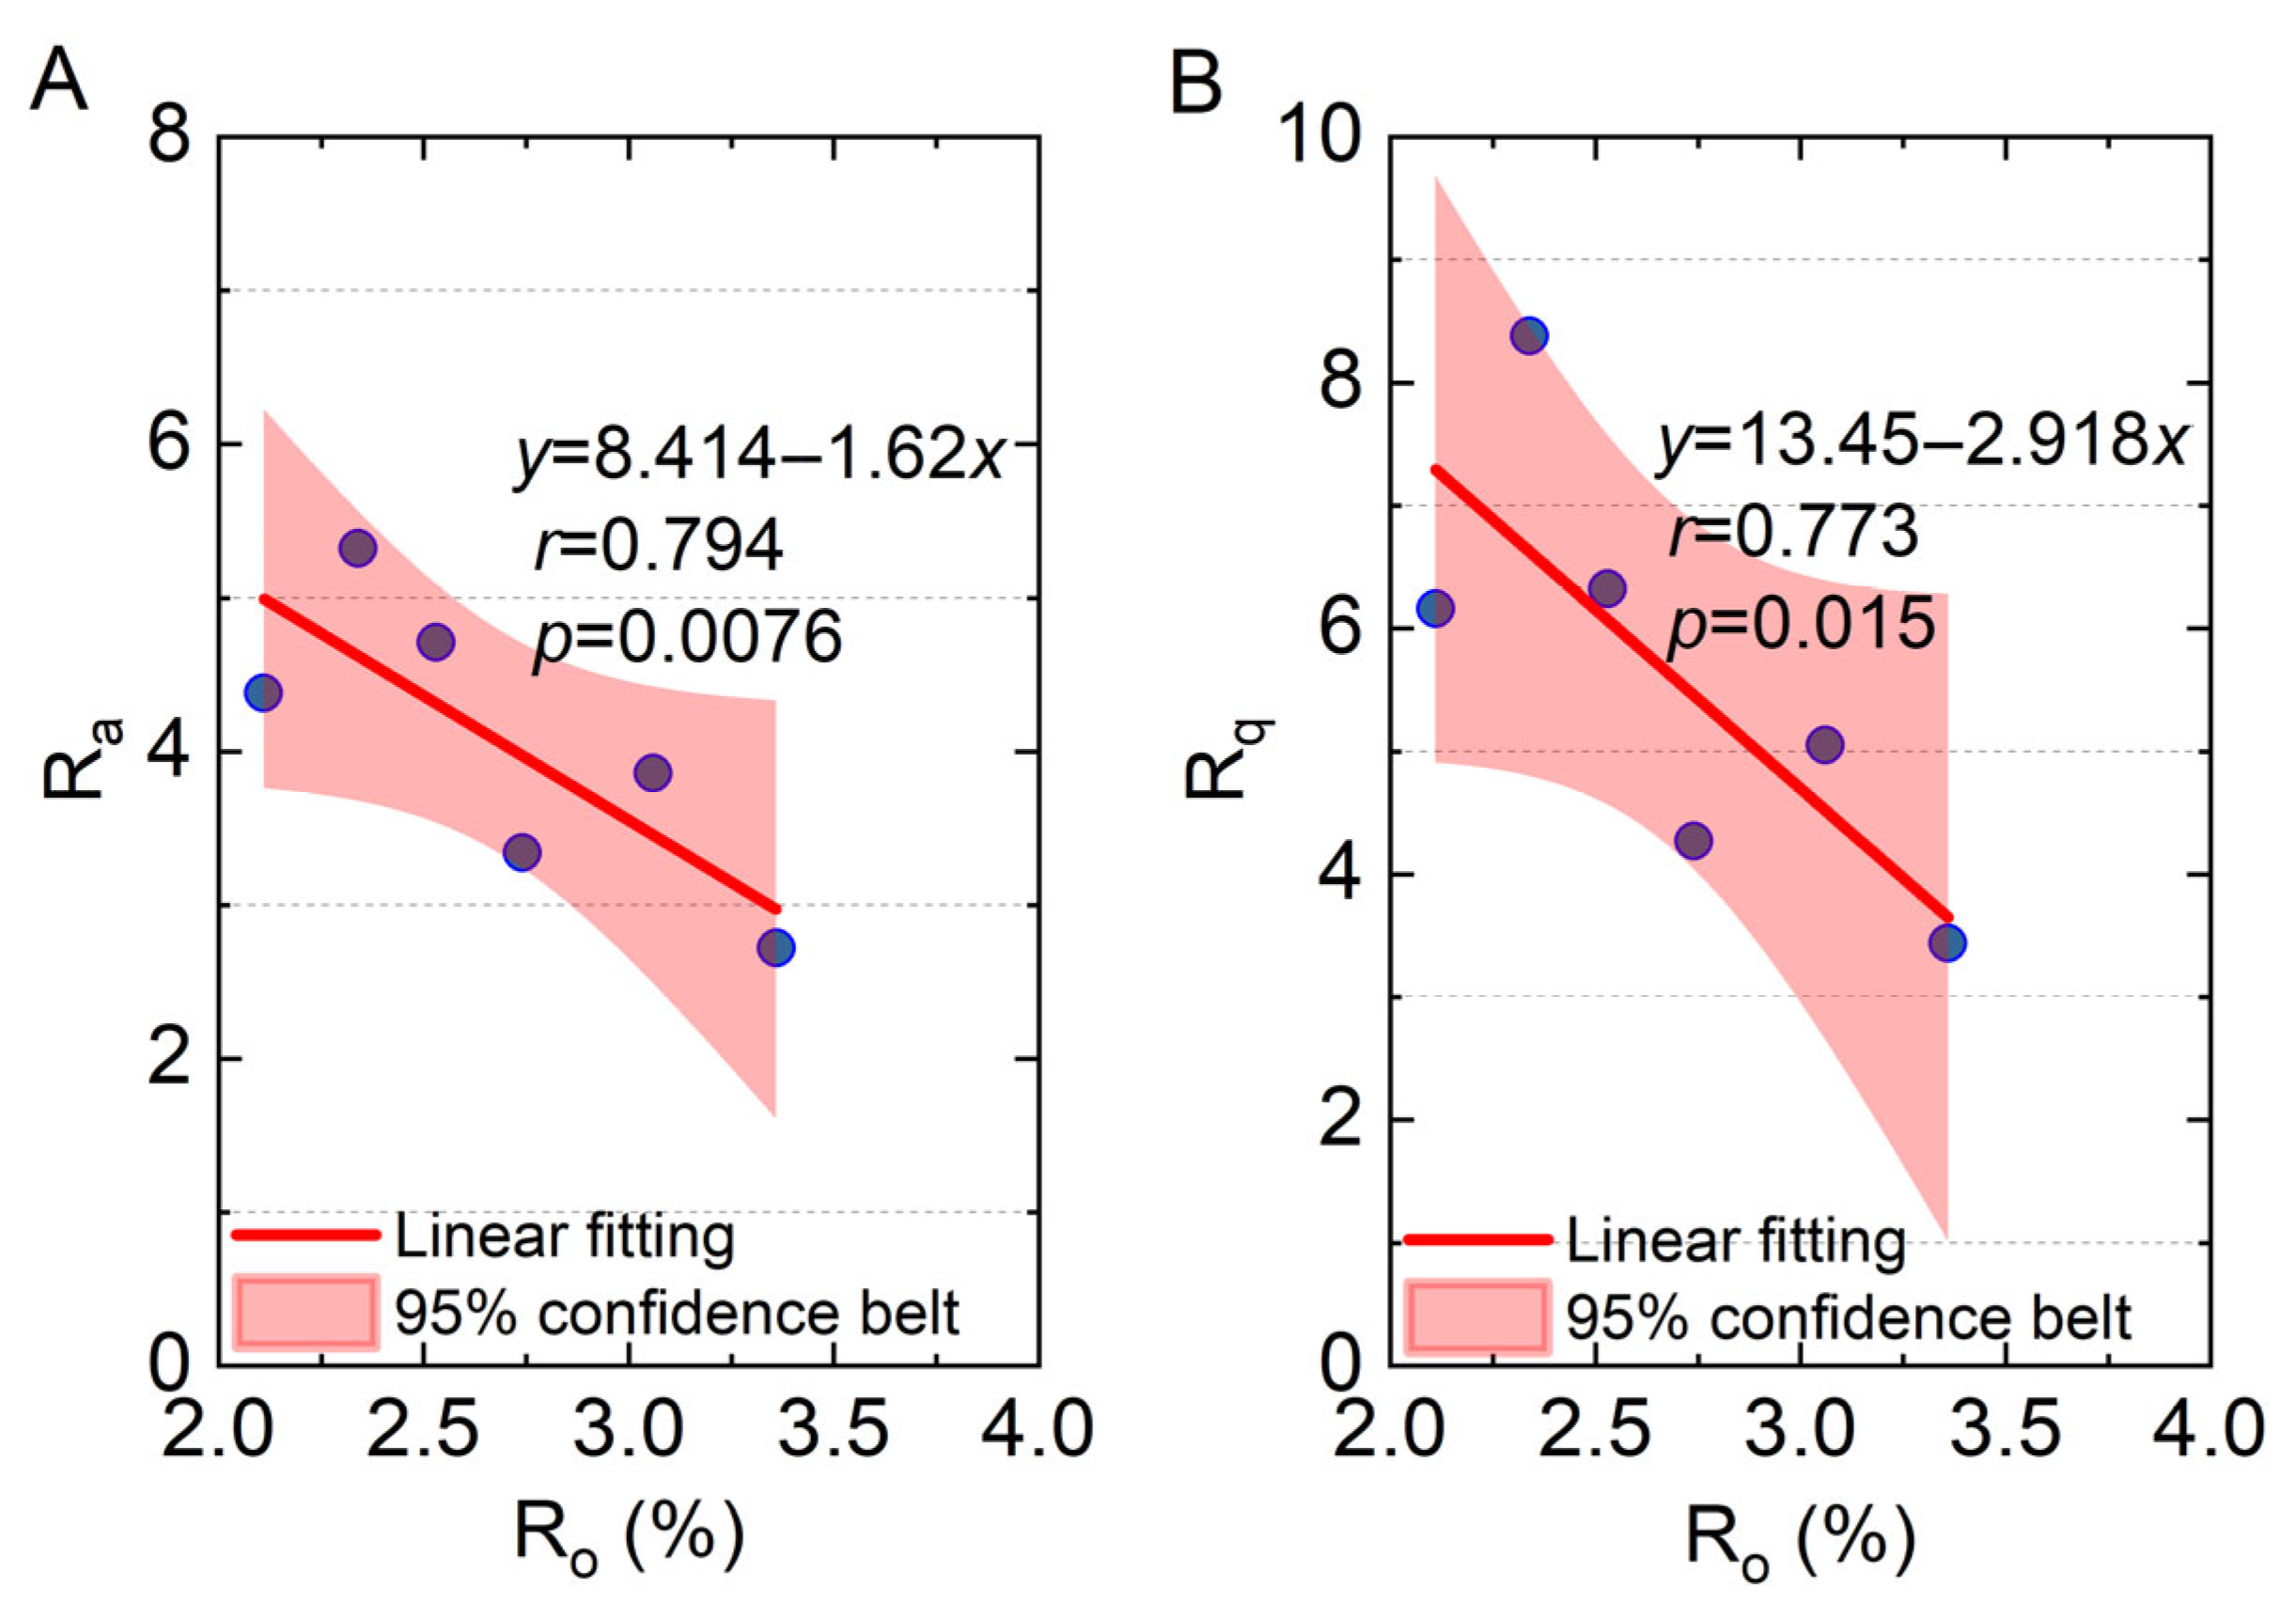
In the statistical characteristics of coal surface morphology, the Rsk quantifies the asymmetry of the height distribution. When Rsk is at zero, it indicates that surface protrusions and depressions are consistent in magnitude and spatial distribution. A positive deviation of Rsk reveals a surface morphology dominated by protrusions, while a negative deviation reflects the dominance of concave structures in the surface configuration [39]. Compared to the baseline kurtosis value (K = 3) for a Gaussian height distribution, the Rku exhibits differentiated geological significance: Rku < 3 indicates that the surface height distribution tends to be flat; Rku > 3 suggests the presence of numerous sharp protrusions and deep, steep depressions on the surface. This high-steepness distribution corresponds to the intense development of pore–fracture systems within the coal body and reveals a highly heterogeneous distribution of pore geometric parameters [40]. The results of the surface roughness parameters for the samples are presented in Table 2. The Rsk value for the M-1 coal sample is greater than 0, while the Rsk values for samples M-1 to M-6 are less than 0, indicating that the majority of anthracite samples have more troughs than peaks on their surfaces, which aligns with the morphological observation of more developed pores. Additionally, it was found that the Rku for all the samples is greater than 3, suggesting that the surfaces of each anthracite sample have relatively steep peaks and troughs, indicating a high degree of pore development. The ranges of Ra and Rq for the coal samples are 2.72–5.32 nm and 3.44–8.38 nm, respectively. The correlation between the surface roughness parameters (Ra, Rq) and vitrinite reflectance (Ro) is shown in Figure 3. The study revealed that both the Ra and Rq of the samples exhibit a significant decreasing trend as Ro increases. This is due to the condensation polymerization reaction of coal macromolecules during the gradual increase in anthracite Ro, which makes the coal structure more ordered (Figure 2). Meanwhile, low-rank anthracite is characterized by abundant nanopores and complex pore structures, leading to relatively high roughness (Figure 4). As the degree of coalification increases, the shape factor rises (Figure 5), the pore structure becomes more mature and regular in shape, and its roughness gradually decreases.

3.3. Analysis of Nanopore Structure Parameters

Based on the hierarchical structure of pore networks in coal as a porous medium and their differential impact on gas storage capacity, this study employed a collaborative analysis using Nano Scope analysis software and the open-source Gwyddion software to accurately extract quantitative structural parameters of the nanoscale pores in the samples [41]. The pore structure of the samples was analyzed and their roughness parameters were calculated using Nanoscope analysis. Then, grain analysis in Gwyddion was used to quantitatively characterize the coal surface. Grain analysis methods include the threshold method and the watershed method. Since the watershed method is more suitable for segmenting complex structures and is more sensitive to weak edges, this study selected the watershed method to quantitatively analyze the pore structure of coal. The watershed algorithm treats the image as a topographic map, with gray values representing height. By simulating the process of flooding, water is injected, starting from local minima (basins), and watershed lines (boundaries) are formed when water from different basins meets. The study constructed a quantitative analysis framework for the pore characteristics of coal samples by precisely controlling the number of particle displacement steps, the drop size, and setting thresholds, as well as implementing height inversion operations.
Given that conventional pore parameters struggle to comprehensively characterize the microstructure features of coal surfaces, this study integrated unconventional parameters (such as shape factors) with conventional parameters to establish a multi-parameter collaborative representation system, enabling precise quantitative analysis of the structural features of coal surfaces. The shape factor (ff) quantitatively characterizes the regularity of pore shapes through the geometric relationship between pore area and perimeter and is an important parameter for assessing the complexity of nanopore structures. For an ideal circle, ffmax = 1.0, and for a square, ff is approximately 0.785. Lower ff values indicate more complex pore boundaries. The calculation formula is shown in Equation (6) [42]:
f f = 4 π S C 2
where C represents the perimeter of a single pore and S represents the projected area of a single pore.
Quantitative analysis of pore surfaces on coal samples based on the watershed algorithm (Table 2) reveals the following: The number of pores in the samples ranges from 3568 to 6887, with the average pore diameter distributed between 6.57 and 13.56 nm. The measured area porosity values are between 5.73% and 11.48%, and the pore shape factor ranges from 0.64 to 0.86. The data indicate significant changes in pore structure characteristics during coalification: as the metamorphic grade increases, the decrease in average pore diameter reflects a trend of pore structure densification. The variation in area porosity values reveals the regulatory mechanism of coalification on the degree of pore development. Changes in the shape factor suggest that metamorphism makes pore shapes more regular.
Linear regression analysis indicates that there is a significant statistical correlation between coal nanopore structural parameters and vitrinite reflectance (Ro). As coalification increases, the number of pores exhibits a significant positive correlation (r = 0.908, Figure 5A). Correspondingly, the average pore diameter parameter shows a negative correlation trend (r = 0.876, Figure 5B). Specifically, an increase in Ro leads to a linear increase in pore density per unit volume, accompanied by a systematic decrease in average pore size. These changes suggest that as the degree of metamorphism increases, primary large pores are compressed, closed, or even destroyed. Meanwhile, aromatization and condensation reactions occur in the organic matter molecular structure, generating new micropores. Additionally, the study found a significant positive correlation between areal porosity and Ro (r = 0.836, Figure 5C). This is primarily due to the condensation and orderly arrangement of aromatic lamellae, along with the precipitation of small molecular compounds, which create a large number of new, smaller-diameter micropores within the coal matrix, thereby increasing the surface area porosity. Figure 5D shows a positive correlation between the shape factor and Ro, suggesting that during coalification, the shapes of nanopores in coal tend to become more regular. This is because the large and medium pores with the most complex morphologies decrease during coalification, leaving mostly enclosed micropores whose morphologies are controlled by the highly ordered carbon layer structure, making them closer to polygonal or quasi-circular shapes. Consequently, the shape factor increases, and the morphologies become relatively regular.

3.4. Fractal Dimension Analysis

Coal, as a highly heterogeneous and complex organic rock, exhibits structural heterogeneity that makes it difficult for traditional Euclidean geometry to effectively characterize its irregular surface features. Fractal theory establishes a correlation model between the microscopic pore structure and macroscopic physicochemical properties of the reservoir through quantitative dimensionality, providing a mathematical representation of pore surface roughness and the complexity of spatial distribution [43,44]. In this study, the fractal analysis function in Gwyddion software was utilized to systematically determine the fractal dimension of coal samples based on four computationally distinct principles: the cube-counting method [23], the triangulation method [45], the variance partition method [46], and the power spectrum method [47]. The specific values are presented in Table 3.

3.4.1. Cube-Counting Method

The technical procedure for determining the fractal dimension using the cube-counting method is as follows: (1) Initial Grid Construction: Establish an initial cubic lattice targeting the extension of the target surface in the z-axis direction. Set the lattice constant I to be half of the characteristic length X of the surface (I = X/2). At this point, the lattice divides the space into eight initial cubic unit cells. (2) Coverage Counting: Count the total number of cubic unit cells that contain at least one surface pixel within this lattice division, denoted as N. (3) Grid Refinement Iteration: Systematically halve the lattice constant I and, after each reduction, repeat the coverage counting operation in step 2 to obtain the corresponding N value for each I value. This iterative process continues until the lattice constant I is reduced to equal the smallest spacing between adjacent surface pixels. (4) Dimension Calculation: Collect all (I, N) data pairs obtained from the iterative steps. Plot a double logarithmic coordinate graph with log(N) on the vertical axis and log(1/I) on the horizontal axis. The slope of the linear trend presented in this data plot is defined as the fractal dimension Df of the measured surface. The calculation is performed using the formula:
log N = D f log ( 1 I ) + B
where N represents the total number of grid units required to cover the surface (dimensionless parameter); Df denotes the fractal dimension, which characterizes the intensity of self-similarity of the surface; I is the characteristic size of the smallest cubic unit (unit: nm); and B corresponds to a dimensionless coefficient in the scaling relationship.
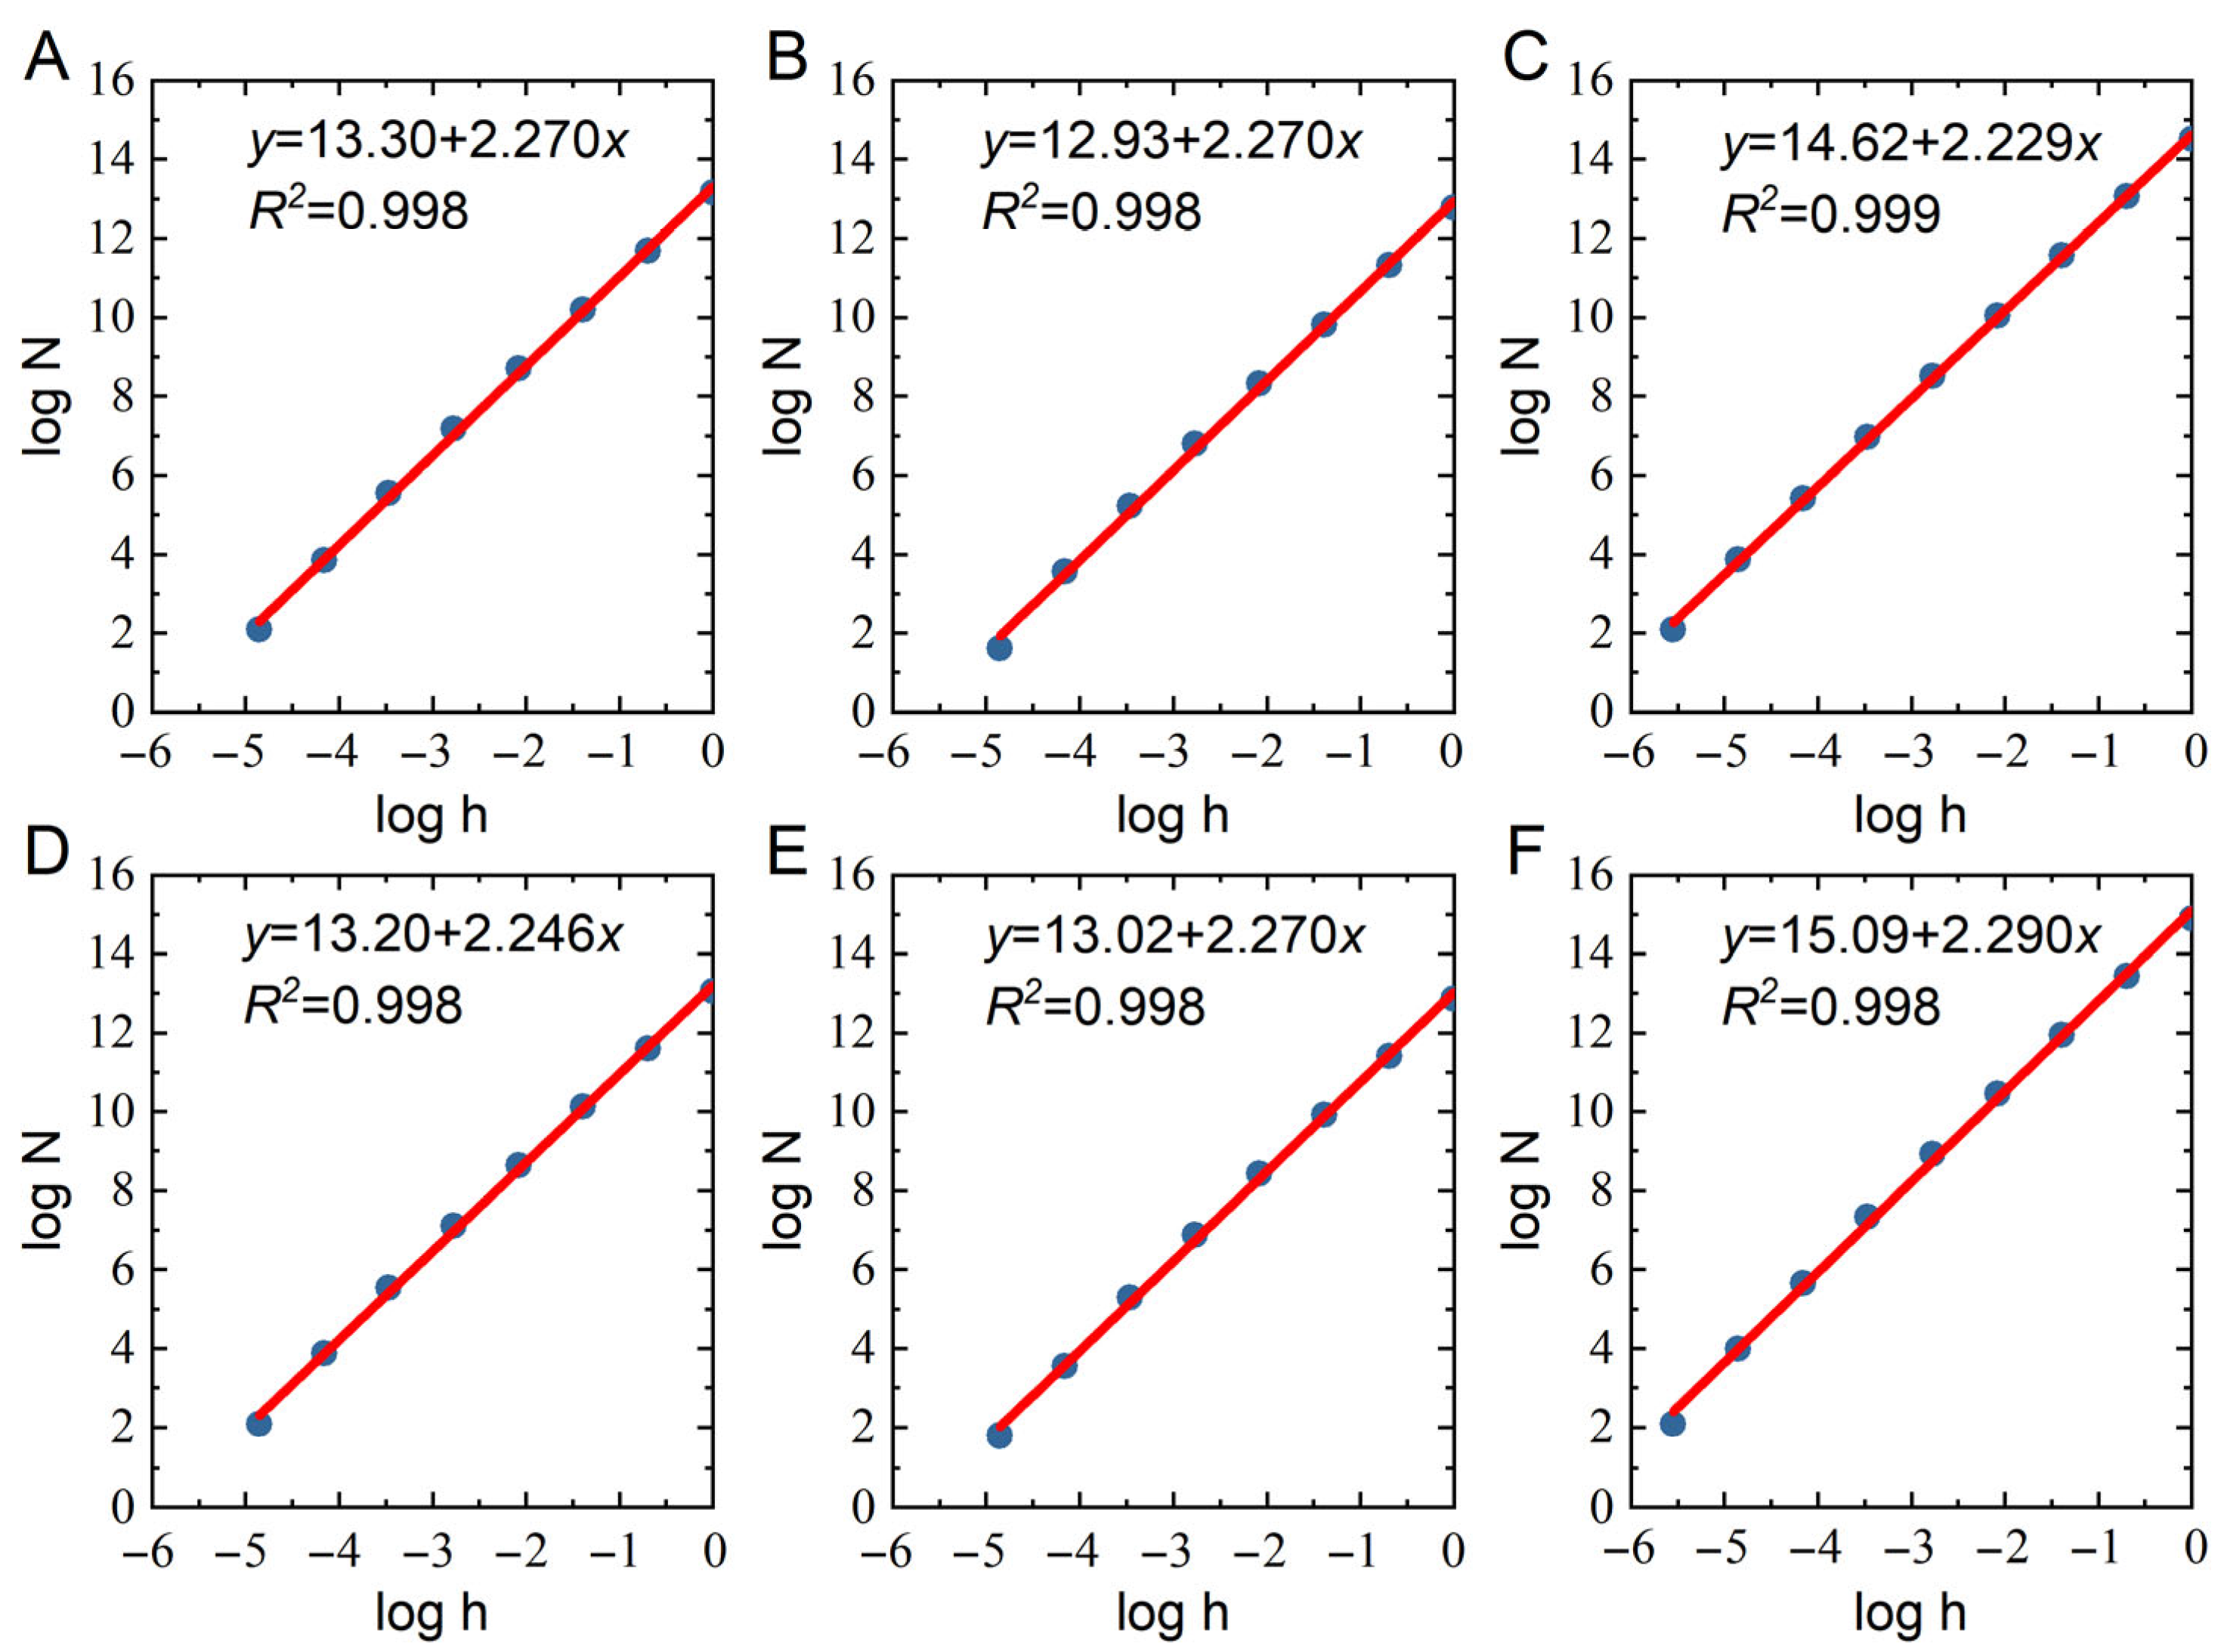
This study employed the cube-counting method to analyze the fractal dimension of six coal samples (Figure 6). The optimal fitting line for the data points was constructed based on a linear regression model, and the fractal dimension values for each coal sample were calculated using the slope of the fitting line according to Equation (7). The correlation coefficients of the fitting results were all above 0.99, indicating that the linear regression was statistically significant. This result confirms the applicability of fractal theory in characterizing the microstructure of coal samples. As seen in Figure 6, the log N of all coal surfaces exhibited positive power-law variations. Meanwhile, as the Ro increased, the fractal dimension of the coal samples first decreased from 2.270 to 2.229 and then increased from 2.229 to 2.290. The larger fractal dimensions of M-1 and M-2 are due to their open pores, rich functional groups, and disordered structures, presenting complexity at the microscopic scale. The relatively smaller fractal dimensions of M-3 and M-4 result from the increased metamorphism leading to devolatilization, compaction, and aromatization processes, which regularize and smooth the coal surface. The high complexity of the fractal dimensions of M-5 and M-6 stems from their high metamorphism, stacking disorder in graphitization tendencies, and microfracture development, introducing new complexities at the nanoscale.

3.4.2. Triangulation Method

Triangulation is utilized to estimate the fractal dimension of surface area based on the principle of grid discretization. An initial grid spacing I (unit: nm) is set, and grid nodes are positioned on the three-dimensional surface morphology to construct triangular elements. When the grid spacing is set to a specific value (e.g., X/4), the surface is covered by 32 triangles with different areas and spatial orientations. The approximate surface area A(I) at this scale is obtained by summing the areas of all the triangles. Subsequently, a continuous bisection operation is performed on the grid spacing, and the process of triangle construction and area summation is repeated until the grid spacing reaches the minimum resolution of adjacent pixels. Finally, a double logarithmic coordinate system is established, with lg(1/I) as the independent variable and lgA(I) as the dependent variable. The slope of the resulting linear relationship equals Df − 2, where Df is the fractal dimension of the surface. The calculation is performed as follows:
log A = D f 2 log ( 1 I ) + C
In the formula, A is the surface area calculated based on atomic force microscopy morphology data (unit: nm2); slope is a geometric parameter characterizing fractal features (dimensionless); I is the minimum side length of the grid cells in the fractal analysis (unit: nm); and C is a proportional constant (dimensionless).
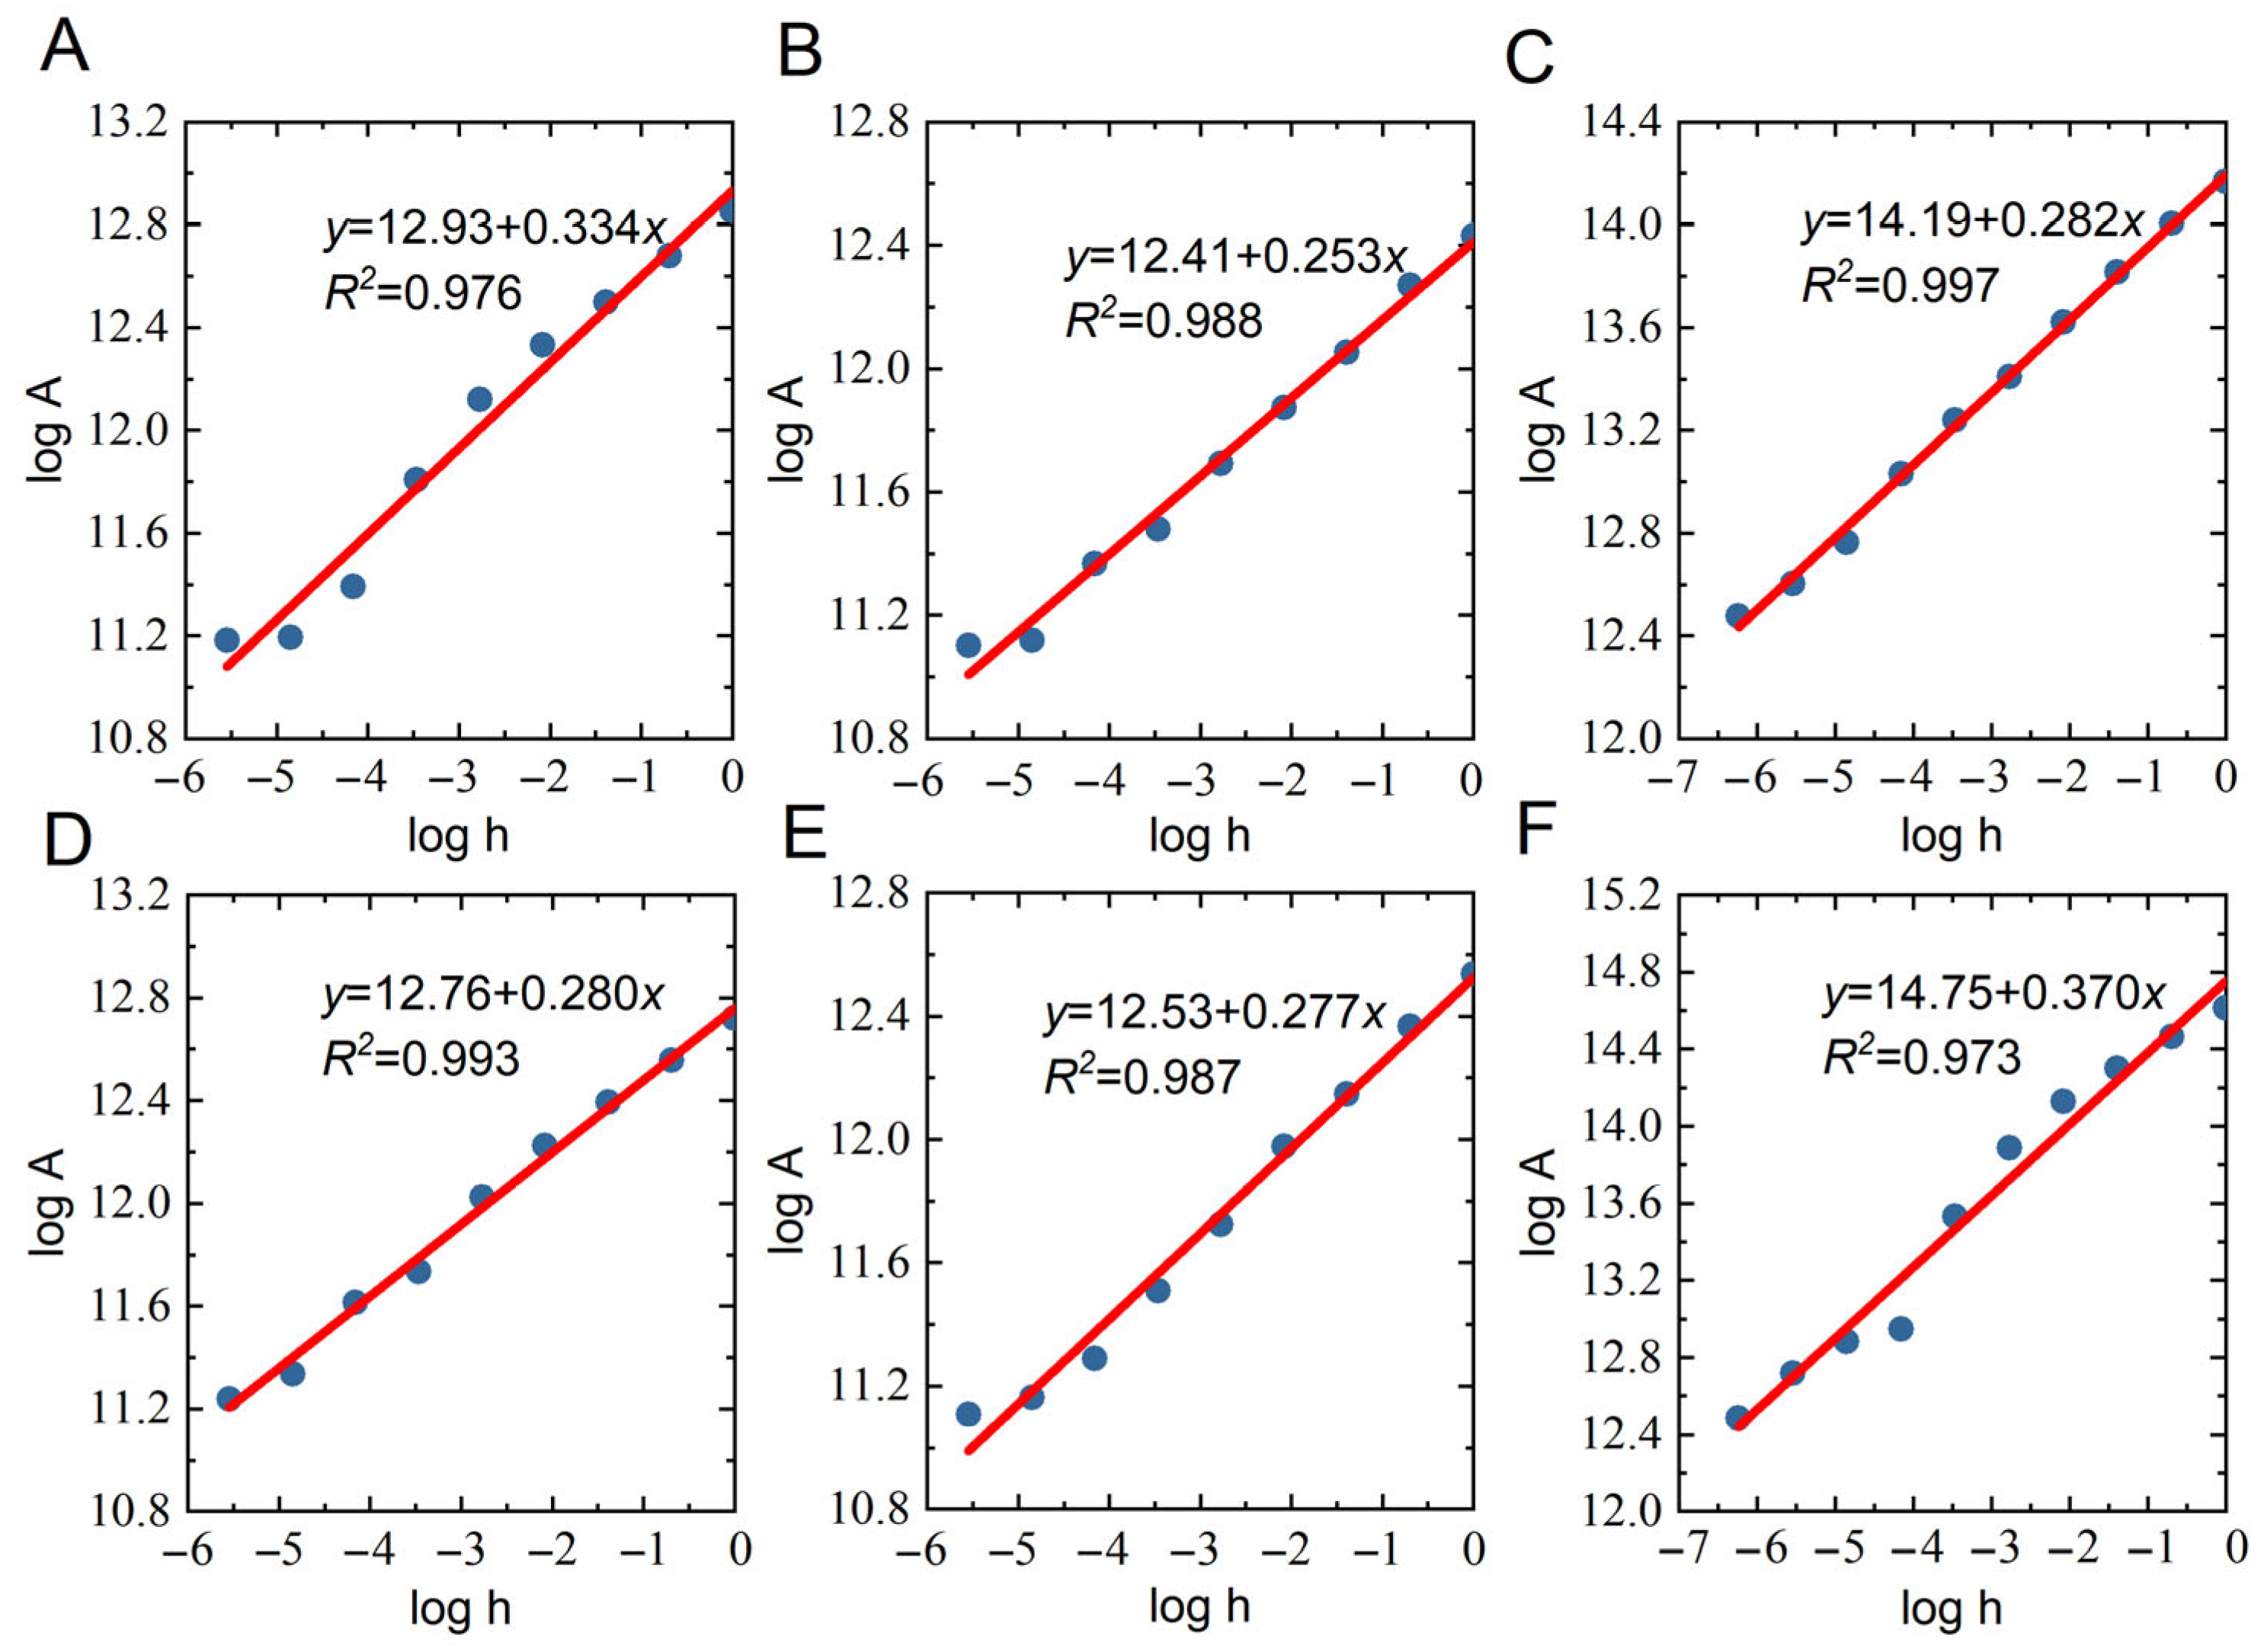
Fractal dimension analysis was conducted on six coal samples using the triangulation method (Figure 7). A linear regression model was established based on the principle of least squares, and the fractal dimension values of each coal sample were obtained according to Equation (8) by calculating the slope of the best-fit straight line through the data points. The correlation coefficient R2 for all fitted models exceeded 0.97, indicating a statistically significant linear correlation. This quantitative result demonstrates that the pore structure of coal exhibits significant fractal characteristics, confirming the applicability of fractal theory in the characterization of the microstructure of coal samples. As can be seen from Figure 7, log A for all the coal surfaces exhibited a positive power-law variation. Meanwhile, as the Ro increased, the fractal dimension of the coal samples first decreased from 2.334 to 2.253 and then increased from 2.253 to 2.370.

3.4.3. Variance Partitioning Method

The variance partitioning method is based on the statistical properties of surface height fluctuations, particularly the power-law relationship between the variance of height differences (structure function) and distance. For all possible points (i, j) and (k, l) in the image, the Euclidean distance h = sqrt((I − k)2 + (j − l)2) and the square of height difference (z(i, j) − z(k, l))2 between them are calculated. Then, the distance h is divided into several intervals of equal spacing or logarithmic spacing. For each distance interval [h, h + dh], the average value of the square of height differences for all point pairs within that interval is calculated: S(h) = [(z(x1, y1) − z(x2, y2))2]/{h}. S(h) is known as the structure function, and for fractal surfaces, the structure function satisfies a power-law relationship with distance h: S(h) ∝ h2H, where H is the Hurst exponent [48] (0 < H < 1). In a double logarithmic coordinate plot, data points are plotted with log(h) as the abscissa and log(S(h)) as the ordinate. Linear regression is performed on these data points. The relationship between the fractal dimension Df and the slope β (i.e., 2H) is Df = 3 − H = 3 − β/2. The calculation is performed as follows:
log S = β log h + E
where S is the average value of the square of height differences for all points within the interval, in units of nm2; β is the slope; h is the reciprocal of lattice constant I; and E is a dimensionless coefficient.
The study conducted fractal dimension analysis on six coal samples using the variance partition method, as shown in Figure 8. The slope of the best-fit line through the data points was determined using linear regression, and the fractal dimension for each coal sample was obtained according to Df = 3 − β/2. The correlation coefficients of the fitted lines were all above 0.92, indicating good linear fits, thus supporting the applicability of fractal theory. As can be seen from Figure 8, log S for all the coal surfaces exhibited positive power-law variations. Meanwhile, as shown in Table 3, with increasing Ro, the fractal dimension of the coal samples first decreased from 2.449 to 2.351 and then increased from 2.351 to 2.519.

3.4.4. Power Spectral Method

The fractal dimension power spectrum analysis method based on Gwyddion software hinges on the core principle that surfaces with fractal characteristics exhibit a linear feature in their power spectral density (PSD) function when plotted on a double logarithmic coordinate system. The slope β of this linear relationship bears a definite mathematical relationship with the fractal dimension Df of the surface. The standard analysis process comprises the following steps: (1) Discrete Fourier Transform (DFT) of the Original AFM Topography Image: Apply the DFT to the original AFM topography image. (2) PSD Calculation for All One-Dimensional Height Profiles: Compute the PSD for all one-dimensional height profiles within the image. (3) Spatial Orientation Averaging of All Calculated PSDs: Perform an average of these PSDs in terms of spatial orientation. (4) Plotting Data Points on a Double Logarithmic Coordinate System: Plot the data points on a double logarithmic coordinate system where the abscissa is the logarithm of the spatial frequency k (logk) and the ordinate is the logarithm of the average PSD W(k) (logW). Use a linear regression algorithm to fit the data points and obtain the slope β of the best-fit straight line. (5) Calculation of the Fractal Dimension of the Surface: Compute the fractal dimension Df of the surface using the formula Df = 7/2 + β/2.
The study conducted power spectrum analysis on six coal samples (Figure 9), obtaining slope values (β) by fitting data points through least squares linear regression. The fractal dimension of each coal sample was then calculated using the formula Df = 7/2 + β/2, based on the fractal dimension calculation. The linear correlation coefficients for all fitting results exceeded 0.94, indicating a high degree of fit for the linear model and validating the applicability of fractal theory in the analysis of coal samples in this study. As seen in Figure 9, the log W of all coal surfaces exhibited negative power-law variations. Meanwhile, according to Table 3, with increasing Ro, the fractal dimension of the coal samples first decreased from 2.311 to 2.001 and then increased to 2.178.

3.5. Factors Influencing Fractal Dimension

The fractal dimension, as a core metric parameter in fractal theory within the realm of geometry, provides a mathematical foundation for quantifying the complexity and heterogeneity of coal pore structures. This parameter directly reflects the degree of heterogenization within pore systems by characterizing pore surface roughness and spatial distribution features. Research indicates that the fractal dimension of coal samples is influenced synergistically by multiple factors, including coal composition, pore topology, coal rank evolution, and particle size distribution, among other key variables. Specific correlation patterns are exhibited as follows: there is a significant positive correlation between the fractal dimension of pore surfaces in lignite from the Hailar Basin and ash yield, and a nonlinear U-shaped relationship with fixed carbon content [49]; fractal characteristics of adsorption pores in the Fukang mining area reveal a negative correlation between fractal dimension and pore diameter, and a positive correlation with specific surface area and pore volume [50]. Studies in the Xishan Coalfield have found that as coal rank increases and burial depth deepens, the fractal dimension of coal surfaces exhibits systematic growth, indicating an increase in pore complexity [51]. Morphological studies of ultrafine coal powder have discovered that fractal dimensions based on SIM and PSD exhibit a monotonically increasing response to changes in particle size [21].
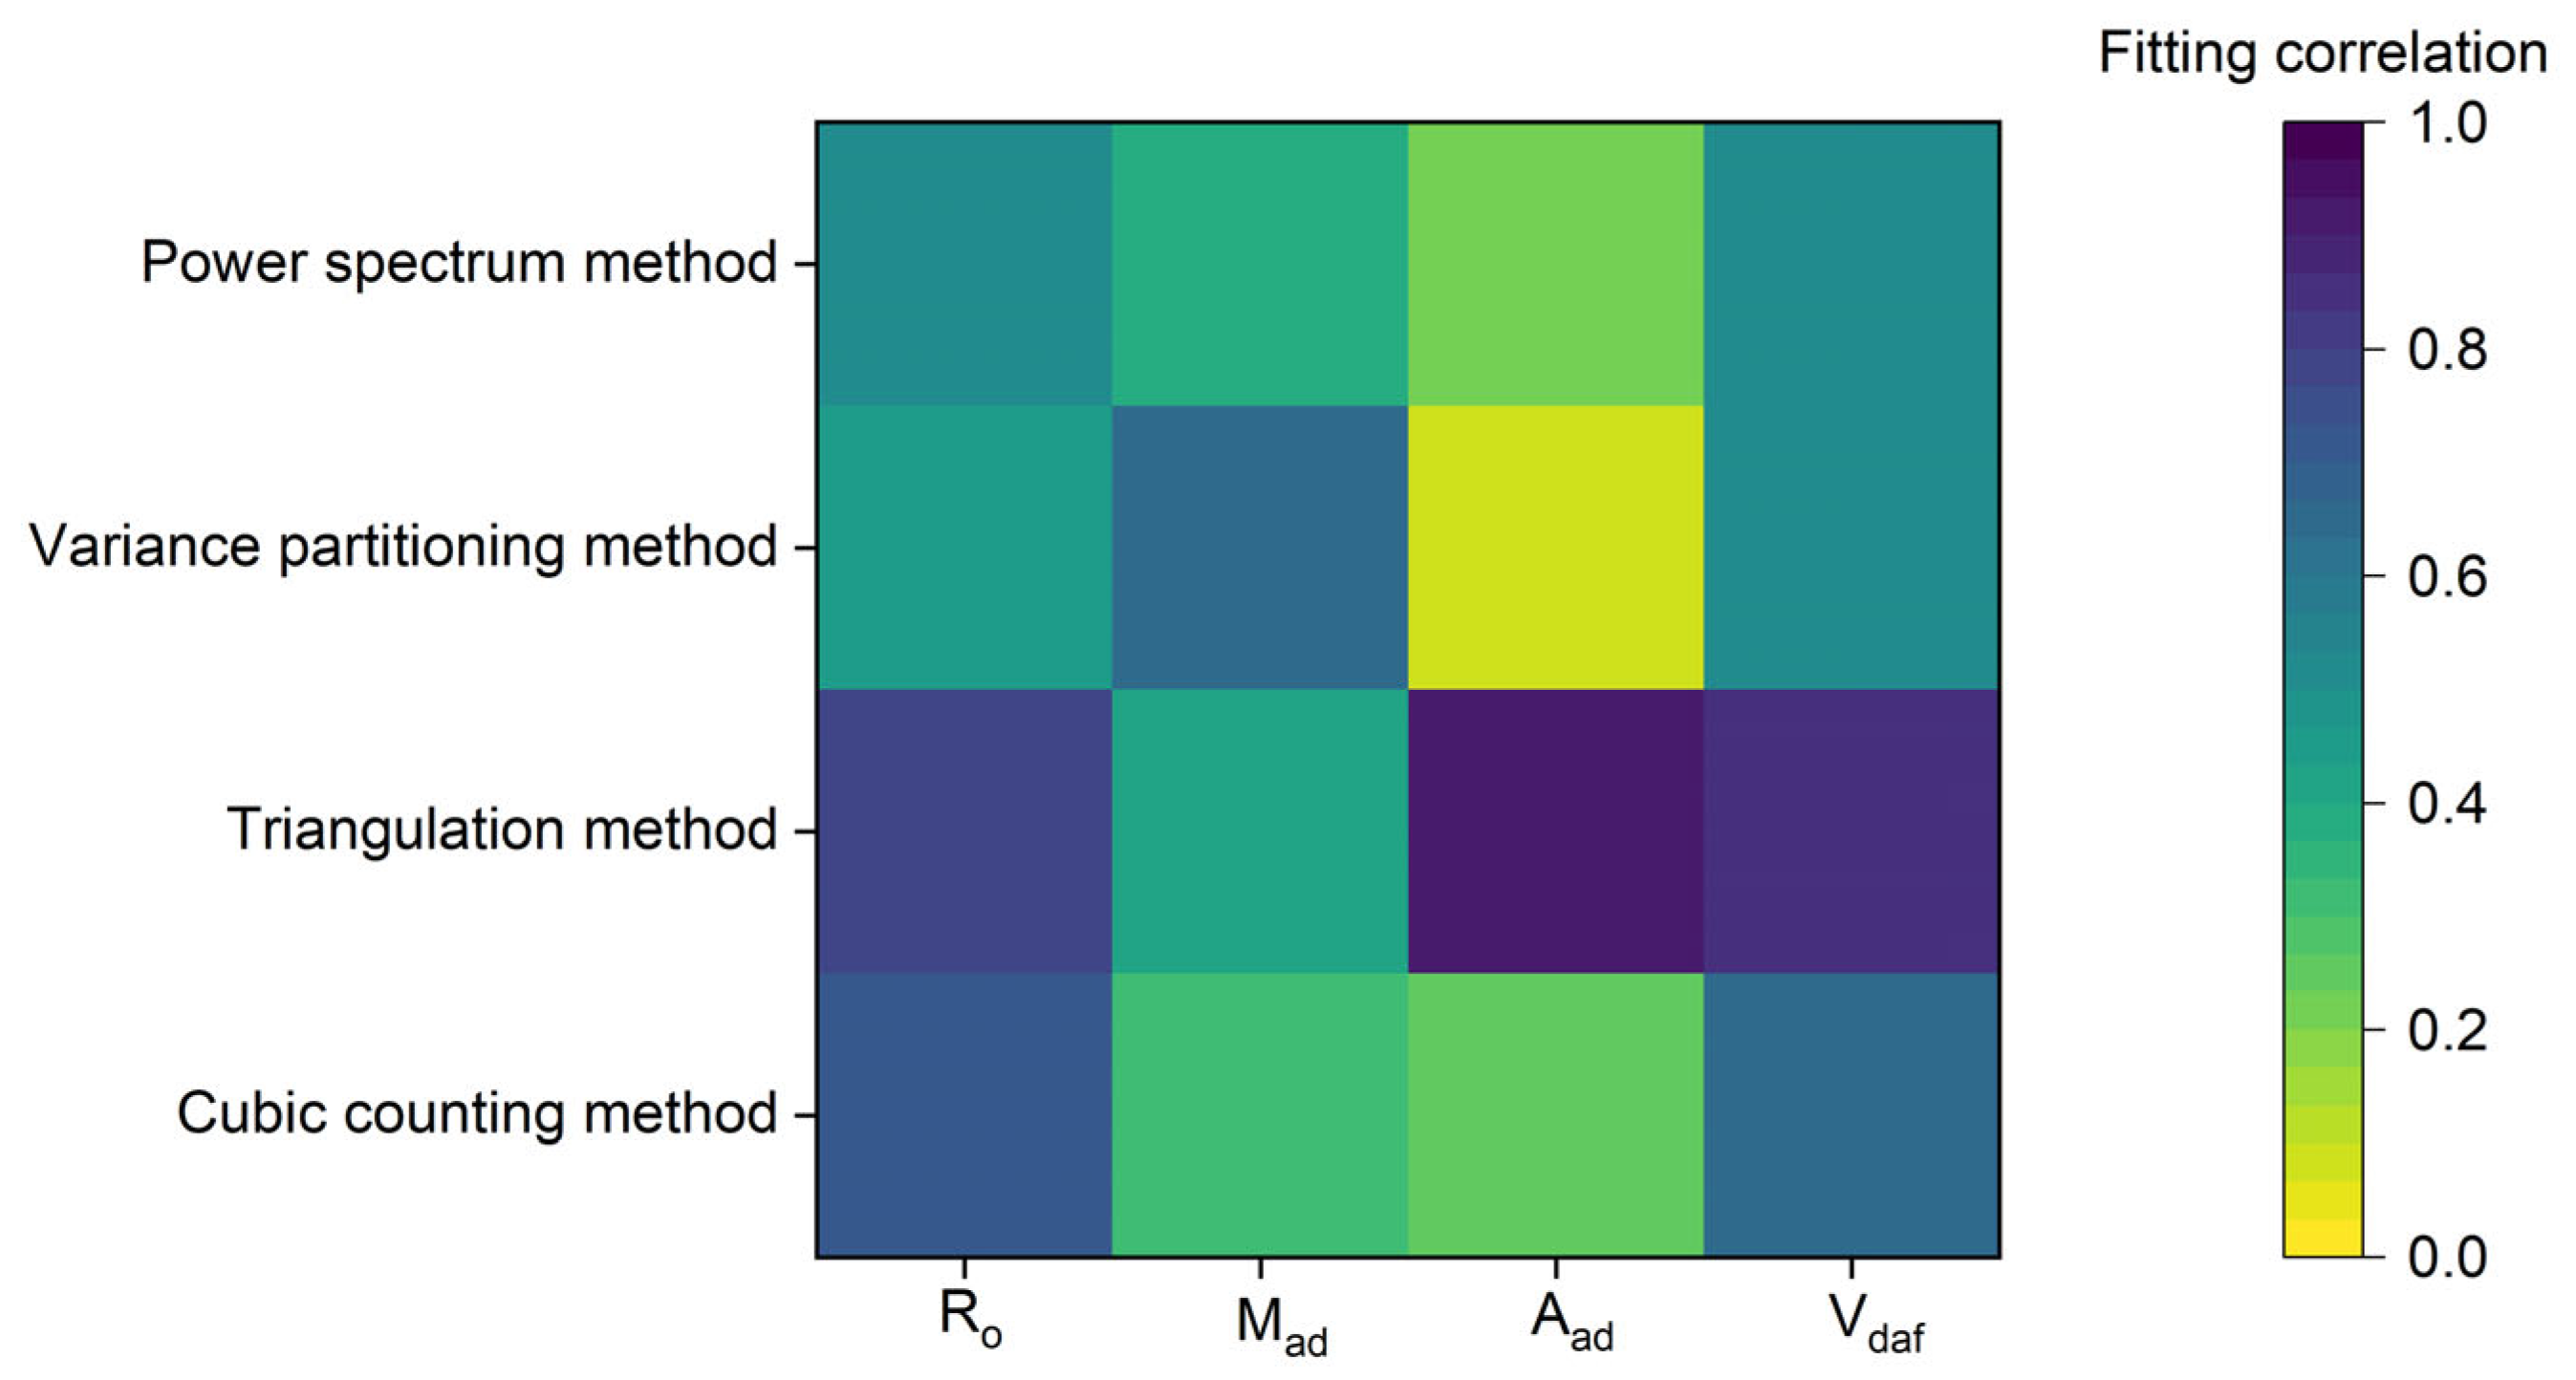
To investigate the trends in the influence of Ro and proximate analysis parameters on the fractal dimension of coal samples, this study employed various methods such as the cube-counting method, triangulation method, variance partition method, and power spectrum method to obtain fractal dimension analysis results. The fitting analysis based on fractal dimension and the aforementioned parameters (Figure 10) reveals that the fractal dimension obtained through the triangulation method exhibits the best correlation with coal metamorphism degree, ash content, and volatile matter. In contrast, the fractal dimension derived from the variance partitioning method shows the highest correlation with moisture parameters. The specific influences of these factors on the fractal dimension of coal samples are detailed below.

3.5.1. Metamorphic Grade

The varying degrees of metamorphism affect the pore structure and organic macromolecule structure of coal, leading to changes in its fractal dimension. Understanding the relationship between Ro and fractal dimension is of great significance for gaining insights into the physicochemical properties of coal, evaluating its engineering application potential, and studying the evolutionary history of coal. Figure 11 illustrates the correlation between the fractal dimensions of selected samples obtained through different analytical methods and their Ro. As the Ro increases, it can be observed that the fractal dimension of the coal samples first decreases and then increases. This trend indicates that in the earlier stage, as the Ro rises, the interlayer spacing in coal begins to decrease. Driven by thermal forces, aromatic lamellae tend to stack in parallel and closely, with their arrangement gradually aligning in the same direction. With the enlargement and close stacking of aromatic lamellae, micropores gradually close, making the overall structure denser and more ordered. Simultaneously, the surface morphology measured by AFM reflects these internal structural changes. The orderly stacking of aromatic lamellae leads to a reduction in the roughness of the coal surface, with undulations becoming gentler and more regular. This results in a decrease in the geometric complexity of the coal surface, manifesting as a lower fractal dimension in AFM fractal dimension analysis. In the later stage, the fractal dimension exhibits an increasing trend, suggesting that the intense enlargement and close stacking of aromatic lamellae in coal generate significant internal stresses. These stresses may cause local bending and the misalignment of aromatic lamellae during stacking, forming new nanoscale pores. Although the overall background may tend to be flatter when AFM measures the surface morphology, new, finer nanoscale undulations and structures emerge, increasing the structural complexity. Even though smooth macromolecular structures appear in coal, these small-scale irregularities are captured by AFM’s high resolution and dominate the results of fractal analysis, leading to an increase in the calculated fractal dimension once again.

3.5.2. Moisture

Moisture primarily exists in the pores and fractures of coal. By filling micropores and covering rough surfaces, it alters the pore structure and surface morphology, thereby affecting the irregularity and complexity of the coal surface. Figure 12 illustrates the correlation between the fractal dimensions of the selected samples and their Mad using different analytical methods. As the Mad increases, the fractal dimensions of the coal samples exhibit a trend of first decreasing and then increasing. This trend suggests that in the initial stage, the originally dry and exposed coal surface is abundant with rough nanoscale details (high peaks and deep valleys), with AFM images showing significant height fluctuations and a higher fractal dimension (Df), indicating a more complex and irregular surface. As the Mad increases, it gradually fills in the surface depressions, grooves, and entrances of small-scale pores at the atomic scale, rendering the apparent morphology detected by AFM relatively smoother and more continuous, thus diminishing the surface irregularities. In the subsequent stage, the fractal dimension trends upwards, indicating that a large amount of moisture fills the open nanopores on the surface and forms nanoscale liquid bridges between adjacent surface protrusions, particles, or pores, increasing the surface complexity with more irregular connections and fluctuations appearing at the micrometer scale.

3.5.3. Ash Content

The ash content in coal, as the mineral component remaining after combustion, exhibits distinct pore characteristics and surface properties compared to the organic coal matrix. The presence of these mineral phases disrupts the continuity of the organic phase in coal, thereby enhancing the heterogeneity of the coal structure. Figure 13 illustrates the correlation between the fractal characteristics of the samples (obtained through various analytical methods) and the ash content: as the Aad increases, the fractal dimension of the coal exhibits a nonlinear response, first decreasing and then increasing. The occurrence state of minerals in anthracite and their interaction with the organic matrix change with increasing Aad. This transition is crucial in causing the fractal dimension to first decrease and then increase. At low Aad, minerals primarily exist in discrete, isolated particle forms, randomly dispersed and embedded within the relatively continuous and dense organic matrix of anthracite.
These rigid mineral particles typically have smoother and more regular surfaces compared to the surrounding anthracite organic matter. They fill in certain concave areas on the originally relatively rough and microporous surface of the coal matrix, reducing the overall average roughness and complexity of the surface and causing a downward trend in the fractal dimension. As the Aad continues to increase to a certain critical range, mineral particles aggregate in large numbers, forming larger clusters, bands, layered structures, or interconnected networks. Numerous smaller-scale, irregular surface fluctuations form on their surfaces, increasing the irregularity of the surface and causing the fractal dimension to exhibit an upward trend.

3.5.4. Volatile Matter

Volatile matter refers collectively to the gaseous and liquid products released through the pyrolysis of the organic matter in coal under specific conditions. It essentially serves as an indicator for measuring the content of thermally unstable components in the organic matter of coal. During the release of Vdaf, the structure of coal undergoes significant changes: closed pores open up, existing pore channels expand, and new pores form, even creating complex pore networks. These changes alter the pore structure of the coal samples, which in turn affects the fractal dimension. Figure 14 illustrates the response relationship between the fractal dimensions of coal samples and their volatile matter contents: as the volatile matter content increases, the fractal dimension exhibits a nonlinear evolution, first decreasing and then increasing. This evolution pattern reflects a continuous enhancement in the condensation degree of aromatic carbon rings within the macromolecular structure of coal as the volatile matter decreases. The orderly arrangement and increased size of aromatic lamellae make the spacing between lamellae more uniform. Many of the originally existing tiny pores are compressed and closed under strong lateral pressure and thermal forces. Consequently, the overall structure of coal becomes denser, and its surface tends to be simpler, more regular, and smoother, leading to a reduction in fractal dimension. When Vdaf decreases to a certain range, the condensation and graphitization trend of aromatic lamellae reach a critical point. The carbon atom network tends towards a more stable graphite structure, resulting in intense volumetric contraction. Enormous internal stresses arise within and between the highly ordered and rigid aromatic lamellar structures. When the stress exceeds the local strength, numerous nanoscale or even micrometer-scale microfractures form, greatly increasing surface irregularity.

4. Conclusions

Based on the morphological characterization by AFM and quantitative analysis using Gwyddion, the evolution laws and fractal characteristics of the nanoporous structure of highly metamorphosed anthracite are revealed as follows:
(1) Based on three-dimensional imaging and cross-sectional analysis using AFM, the study found that an increase in Ro significantly reduced the surface height difference in coal, with macroporous systems being replaced by nanoscale dispersed pores, resulting in a tendency towards a smoother surface morphology. This phenomenon is attributed to the refinement of pore networks and densification of structures caused by molecular condensation and volatile matter expulsion during the coalification process.
(2) Both the Ra and Rq of the samples exhibit a similar downward trend as Ro increases. Furthermore, the number of pores, areal porosity, and shape factor of coal positively correlate with Ro, while mean pore diameter negatively correlates with volatile matter content. These observations collectively support the tendency of high-rank coal to form a pore system with more pores, smaller sizes, more regular shapes, but overall higher density.
(3) The fractal dimension (Df), obtained in this study through four types of algorithms, including triangulation method and variance partition method, exhibits a “U”-shaped nonlinear correlation with Ro, Aad, Mad, and Vdaf. Among these, the fractal dimension calculated using the triangular prism method shows the highest correlation with metamorphic grade, ash content, and volatile matter content. The fractal dimension obtained from the variance partition method has the highest correlation with moisture content. This reflects a dynamic process where the structure of anthracite undergoes ordering (decreasing Df) at the medium metamorphic stage but generates new microcracks or irregularities due to internal stress at the high metamorphic stage (increasing Df).
(4) This study utilizes advanced nanoscale characterization combined with multi-parameter quantitative analysis to uncover the systematic evolution of the pore structure and surface properties of anthracite coal as a function of Ro. The research establishes quantitative correlation models between Ro and key pore parameters, surface roughness, and fractal characteristics, providing core experimental support for deepening the theoretical framework of coal pore evolution and optimizing the evaluation system for CBM reservoirs. The biphasic variation pattern of the fractal dimension (decreasing first and then increasing) offers new insights into elucidating the microscopic occurrence and migration mechanisms of CBM. Future research can be extended to more coal rank samples to verify the universality of these patterns and further utilize molecular simulation and multiscale imaging technologies (such as CT-SEM-AFM) to deeply analyze gas behavior within pore networks and construct cross-scale models.

Author Contributions

In this study, D.W. was responsible for conceptualization, methodological guidance, and the research work of the article; S.Z. was responsible for writing the first draft and organizing the data. All authors have read and agreed to the published version of the manuscript.

Funding

This research was funded by the Anhui Jianzhu University Introduction of Talents and Doctoral Initiation Fund Project (2022QDZ22).

Data Availability Statement

Data are contained within the article.

Acknowledgments

Thank you to the anonymous reviewer for their valuable comments and suggestions on this manuscript.

Conflicts of Interest

The authors declare no conflicts of interest.

References

  1. Yu, Z.H.; Ning, Z.; Zhang, H.; Yang, H.Q.; Chang, S.J. A generalized Faustmann model with multiple carbon pools. For. Policy Econ. 2024, 169, 103363. [Google Scholar] [CrossRef]
  2. Yu, Z.H.; Ning, Z.; Chang, W.Y.; Chang, S.J.; Yang, H.Q. Optimal harvest decisions for the management of carbon sequestration forests under price uncertainty and risk preferences. For. Policy Econ. 2023, 151, 102957. [Google Scholar] [CrossRef]
  3. Li, B.; Wang, X.; Khurshid, A.; Saleem, S.F. Environmental governance, green finance, and mitigation technologies: Pathways to carbon neutrality in European industrial economies. Int. J. Environ. Sci. Technol. 2025. [Google Scholar] [CrossRef]
  4. Wang, X.Y.; Wang, Y.Y.; Khurshid, A.; Saleem, S.F. E-governance and policy efforts advancing carbon neutrality and sustainability in European countries. Public Money Manag. 2025. [Google Scholar] [CrossRef]
  5. Wang, X.Y.; Su, H.Y.; Liu, X. The Impact of Green Technological Innovation on Industrial Structural Optimization Under Dual-Carbon Targets: The Role of the Moderating Effect of Carbon Emission Efficiency. Sustainability 2025, 17, 6313. [Google Scholar] [CrossRef]
  6. Fan, J.; Zhang, X.; He, N.; Song, F.H.; Wang, X. Investigation on novel deep eutectic solvents with high carbon dioxide adsorption performance. J. Environ. Chem. Eng. 2025, 13, 117870. [Google Scholar] [CrossRef]
  7. Li, Y.; Xu, L.F.; Zhang, S.R.; Wu, J.; Bi, J.J.; Meng, S.Z.; Tao, C.Q. Gas bearing system difference in deep coal seams and corresponded development strategy. J. China Coal Soc. 2023, 48, 900–917. [Google Scholar]
  8. Guo, T.; Jin, X.B.; Wu, D.D.; Xie, F.; Liu, J.X. Accumulation characteristics and exploration prospects of deep coalbed methane in the Longtan Formation of the Nanchuan block on the southeastern margin of the Sichuan Basin. Coal Geol. Explor. 2024, 52, 60–67. [Google Scholar] [CrossRef]
  9. Jiang, J.Y.; Yang, W.H.; Cheng, Y.P.; Zhao, K.; Zheng, S.J. Pore structure characterization of coal particles via MIP, N2 and CO2 adsorption: Effect of coalification on nanopores evolution. Powder Technol. 2019, 354, 136–148. [Google Scholar] [CrossRef]
  10. He, L.; Cao, J.; Lu, J.; Lin, B.; Lu, Y.; Shi, S.; Liu, M. Effect of microwave-assisted cyclic oxidation on the coal internal and surface structure based on NMR and AFM. Energy 2024, 288, 129872. [Google Scholar]
  11. Zeng, F.; Dong, C.; Lin, C.; Tian, S.; Wu, Y.; Lin, J.; Zhang, X. Pore structure characteristics of reservoirs of Xihu Sag in East China Sea Shelf Basin based on dual resolution X-ray computed tomography and their influence on permeability. Energy 2022, 239, 122386. [Google Scholar] [CrossRef]
  12. Zang, J.; Liu, J.L.; He, J.B.; Zhang, X.P. Characterization of the pore structure in Chinese anthracite coal using FIB-SEM tomography and deep learning-based segmentation. Energy 2023, 282, 128686. [Google Scholar] [CrossRef]
  13. Zhao, Y.X.; Liu, S.M.; Elsworth, D.; Jiang, Y.D.; Zhu, J. Pore structure characterization of coal by synchrotron small-angle X-ray scattering and transmission electron microscopy. Energy Fuels 2014, 28, 3704–3711. [Google Scholar] [CrossRef]
  14. Yu, X.L.; Li, L.L.; Jiang, H.; Lu, L.F.; Du, C.J. Application of sparry grain limestone petrographic analysis combining image processing and deep learning. Pet. Geol. Exp. 2023, 45, 1026–1038. [Google Scholar] [CrossRef]
  15. Collinson, D.W.; Nepal, D.; Zwick, J.; Dauskardt, R.H. Gas cluster etching for the universal preparation of polymer composites for nano chemical and mechanical analysis with AFM. Appl. Surf. Sci. 2022, 599, 153954. [Google Scholar] [CrossRef]
  16. Gojzewski, H.; Van Drongelen, M.; Imre, B.; Hempenius, M.A.; Check, C.; Chartoff, C.; Wurm, F.R.; Vancso, G.J. AFM monitoring of the cut surface of a segmented polyurethane unveils a microtome-engraving induced growth process of oriented hard domains. Polym. Test. 2023, 120, 107961. [Google Scholar] [CrossRef]
  17. Flechsig, H.; Ando, T. Protein dynamics by the combination of high-speed AFM and computational modeling. Curr. Opin. Struct. Biol. 2023, 80, 102591. [Google Scholar] [CrossRef]
  18. Lostao, A.; Lim, K.S.; Pallarés, M.C.; Ptak, A.; Marcuello, C. Recent advances in sensing the inter-biomolecular interactions at the nanoscale–A comprehensive review of AFM-based force spectroscopy. Int. J. Biol. Macromol. 2023, 238, 124089. [Google Scholar] [CrossRef]
  19. Liu, X.F.; Song, D.Z.; He, X.Q.; Wang, Z.P.; Zeng, M.R.; Deng, K. Nanopore structure of deep-burial coals explored by AFM. Fuel 2019, 246, 9–17. [Google Scholar] [CrossRef]
  20. Lawrie, G.A.; Gentle, I.R.; Fong, C.; Glikson, M. Atomic force microscopy studies of Bowen Basin coal macerals. Fuel 1997, 76, 1519–1526. [Google Scholar] [CrossRef]
  21. Liu, J.X.; Jiang, X.M.; Huang, X.Y.; Wu, S.H. Morphological characterization of super fine pulverized coal particle. Part 2. AFM investigation of single coal particle. Fuel 2010, 89, 3884–3891. [Google Scholar] [CrossRef]
  22. Xie, H.G.; Li, X.J. Microstructure and nanomechanical characterization of tectonic coal based on SEM, AFM, XRD and DSI. Surf. Interfaces 2024, 46, 104158. [Google Scholar] [CrossRef]
  23. Qiao, P.; Ju, Y.W.; Yu, K.; Ju, L.T.; Xiao, L.; Feng, H.Y.; Yao, Y.B.; Nie, B.S.; Li, X.; Tian, J.J.; et al. Nanoscale quantitative characterization of microstructure evolution of partly graphitized high rank coal: Evidence from AFM and HRTEM. Fuel 2022, 324, 124802. [Google Scholar] [CrossRef]
  24. Chen, S.B.; Li, X.Y.; Chen, S.; Wang, Y.; Gong, Z.; Zhang, Y.K. A new application of atomic force microscopy in the characterization of pore structure and pore contribution in shale gas reservoirs. J. Nat. Gas Sci. Eng. 2021, 88, 103802. [Google Scholar] [CrossRef]
  25. Li, Z.B.; Ren, T.; Li, X.C.; Qiao, M.; Yang, X.H.; Tan, L.H.; Nie, B.S. Multi-scale pore fractal characteristics of differently ranked coal and its impact on gas adsorption. Int. J. Min. Sci. Technol. 2023, 33, 389–401. [Google Scholar] [CrossRef]
  26. Liu, Z.; Li, R.R.; Yang, H.; Tian, F.C.; Zhu, D.L. A new fractal model of coal permeability based on the increasing fractal construction method of the menger sponge. Fractals 2021, 29, 2150187. [Google Scholar] [CrossRef]
  27. Cai, Y.D.; Liu, D.M.; Yao, Y.B.; Li, J.Q.; Liu, J.L. Fractal characteristics of coal pores based on classic geometry and thermodynamics models. Acta Geol. Sin. 2011, 85, 1150–1162. [Google Scholar] [CrossRef]
  28. Zhang, S.H.; Tang, S.H.; Tang, D.Z.; Huang, W.H.; Pan, Z.J. Determining fractal dimensions of coal pores by FHH model: Problems and effects. J. Nat. Gas Sci. Eng. 2014, 21, 929–939. [Google Scholar] [CrossRef]
  29. Wu, D.; Zhao, L.; Li, B.; Kataza, N.N. Geochemical study on nitrogen isotope composition, speciation distribution, and influencing factors of vitrinite-rich coal seams during the Late Carboniferous. Sci. Rep. 2025, 15, 19095. [Google Scholar] [CrossRef]
  30. Wu, D.; Liu, G.J.; Sun, R.Y.; Chen, S.C. Influences of magmatic intrusion on the macromolecular and pore structures of coal: Evidences from Raman spectroscopy and atomic force microscopy. Fuel 2014, 119, 191–201. [Google Scholar] [CrossRef]
  31. Zhang, Z.; Liu, G.F.; Lin, J.; Barakos, G.; Chang, P. Fractal evolution characteristics on the three-dimensional fractures in coal induced BY CO2 phase transition fracturing. Fractal Fract. 2024, 8, 273. [Google Scholar] [CrossRef]
  32. Chang, Y.M.; Yang, H.G.; Ma, T.; Fan, L.; Zhang, H. Study of the Coal Micro-Structure Based on AFM. Mod. Sci. Instrum. 2006, 16, 71–72. [Google Scholar]
  33. Li, Y.; Yang, J.H.; Pan, Z.J.; Tong, W.S. Nanoscale pore structure and mechanical property analysis of coal: An insight combining AFM and SEM images. Fuel 2020, 260, 116352. [Google Scholar] [CrossRef]
  34. Chen, Y.Y.; Mastalerz, M.; Schimmelmann, A. Characterization of chemical functional groups in macerals across different coal ranks via micro-FTIR spectroscopy. Int. J. Coal Geol. 2012, 104, 22–33. [Google Scholar] [CrossRef]
  35. Bruening, F.A.; Cohen, A.D. Measuring surface properties and oxidation of coal macerals using the atomic force microscope. Int. J. Coal Geol. 2005, 63, 195–204. [Google Scholar] [CrossRef]
  36. Liu, M.; Zhang, Y.F.; Guo, F.Y.; Luo, J.Q.; Ding, S.H.; Cao, Y.J.; Xing, Y.W.; Gui, X.H. Effect of surface roughness on floatability of coal slime. Coal Sci. Technol. 2019, 47, 253–258. [Google Scholar] [CrossRef]
  37. Morga, R. Changes of semifusinite and fusinite surface roughness during heat treatment determined by atomic force microscopy. Int. J. Coal Geol. 2011, 88, 218–226. [Google Scholar] [CrossRef]
  38. Yu, H.; Shen, R.; Guo, H.K.; Wang, G.D.; Shao, G.Y.; Shang, Z.H. Application progress of atomic force microscopy in shale reservoir characterization. Appl. Chem. Ind. 2023, 52, 511–516. [Google Scholar]
  39. Li, C.X.; Ostadhassan, M.; Guo, S.L.; Gentzis, T.; Kong, L.Y. Application of PeakForce tapping mode of atomic force microscope to characterize nanomechanical properties of organic matter of the Bakken Shale. Fuel 2018, 233, 894–910. [Google Scholar] [CrossRef]
  40. Poon, C.Y.; Bhushan, B. Nano-asperity contact analysis and surface optimization for magnetic head slider/disk contact. Wear 1996, 202, 83–98. [Google Scholar] [CrossRef]
  41. Nečas, D.; Klapetek, P. Gwyddion: An open-source software for SPM data analysis. Open Phys. 2012, 10, 181–188. [Google Scholar] [CrossRef]
  42. Soroushian, P.; Elzafraney, M. Morphological operations, planar mathematical formulations, and stereological interpretations for automated image analysis of concrete microstructure. Cem. Concr. Compos. 2005, 27, 823–833. [Google Scholar] [CrossRef]
  43. Xue, K.S.; Pu, H.; Li, M.; Luo, P.; Liu, D.J.; Yi, Q.Y. Fractal-based analysis of stress-induced dynamic evolution in geometry and permeability of porous media. Phys. Fluids. 2025, 37, 036630. [Google Scholar] [CrossRef]
  44. Pu, H.; Xue, K.S.; Wu, Y.; Zhang, S.J.; Liu, D.J.; Xu, J.C. Estimating the permeability of fractal rough rock fractures with variable apertures under normal and shear stresses. Phys. Fluids. 2025, 37, 036635. [Google Scholar] [CrossRef]
  45. Du, S.W.; Li, Y.T. Fractal characteristics and microstructure evolution of magnetron sputtering Cu thin films. Chin. J. Mech. Eng. 2013, 26, 137–143. [Google Scholar] [CrossRef]
  46. Mannelquist, A.; Almqvist, N.; Fredriksson, S. Influence of tip geometry on fractal analysis of atomic force microscopy images. Appl. Phys. A Mater. Sci. Process. 1998, 66, S891–S896. [Google Scholar] [CrossRef]
  47. Shrivastava, S.C.; Shrivastava, R.; Priyanka. Comparative analysis of fractal dimension of CdS, CdZnS and CdZnS: Ce thin films. Indian J. Phys. 2023, 97, 757–765. [Google Scholar] [CrossRef]
  48. Roman, H.E.; Cesura, F.; Maryam, R.; Levchenko, I.; Alexander, K.; Riccardi, C. The fractal geometry of polymeric materials surfaces: Surface area and fractal length scales. Soft Matter 2024, 20, 3082–3096. [Google Scholar] [CrossRef]
  49. Shao, L.Y.; Li, J.X.; Wang, S.; Hou, H.H.; Li, J.A.; Zhu, M.Y. Pore structures and fractal characteristics ofliquid nitrogen adsorption pores in lignite in the Hailar Basin. Nat. Gas Ind. 2020, 40, 15–25. [Google Scholar]
  50. Lin, H.F.; Cheng, B.; Zeng, Q.; Yan, M.; Zhang, C. The experimental study on the fractal characteristies of coal adsorbed porein Fukang mining district of Xinjiang. China Coal 2016, 42, 103–108. [Google Scholar]
  51. Qin, X.L. Study on the fractal feature of coal pore structure with different ranks and its influencing factors in Xishan coal field. China Min. Mag. 2021, 30, 157–161. [Google Scholar] [CrossRef]
Figure 1. Distribution map of major basins in North China. Note: In the figure, TC stands for Tarim Craton, QB for Qaidam Block, and QM for Qiangtang Block.
Fractalfract 09 00538 g001
Figure 2. Three-dimensional surface morphology of coal samples: (A) Sample M-1; (B) Sample M-2; (C) Sample M-3; (D) Sample M-4; (E) Sample M-5; (F) Sample M-6.
Fractalfract 09 00538 g002
Figure 3. Surface morphology and cross-sectional characteristics of samples. (A) Surface structure of sample M-2; (B) height distribution of the corresponding cross-section for M-2; (C) surface structure of sample M-4; (D) height distribution of the corresponding cross-section for M-4; (E) surface structure of sample M-6; (F) height distribution of the corresponding cross-section for M-6. Note: ①②③④⑥⑦ indicate the representative pore numbers in the cross-section.
Fractalfract 09 00538 g003
Figure 4. Correlation between surface roughness and vitrinite reflectance. (A) Average roughness Ra; (B) root mean square roughness Rq.
Fractalfract 09 00538 g004
Figure 5. Variation in nanopore structural parameters with Ro. (A) Number of pores; (B) average pore diameter; (C) areal porosity; (D) shape factor.
Fractalfract 09 00538 g005
Figure 6. The relationship between log N and log h for the samples: (A) M-1; (B) M-2; (C) M-3; (D) M-4; (E) M-5; (F) M-6. Here, h represents the reciprocal of the lattice constant I.
Fractalfract 09 00538 g006
Figure 7. The relationship between log A and log h for the samples (A) M-1; (B) M-2; (C) M-3; (D) M-4; (E) M-5; (F) M-6. Here, h is the reciprocal of the lattice constant I.
Fractalfract 09 00538 g007
Figure 8. The relationship between log S and log h for the samples (A) M-1; (B) M-2; (C) M-3; (D) M-4; (E) M-5; (F) M-6.
Fractalfract 09 00538 g008
Figure 9. The relationship between log W and log K for the samples (A) M-1; (B) M-2; (C) M-3; (D) M-4; (E) M-5; (F) M-6.
Fractalfract 09 00538 g009
Figure 10. The fitting correlation between the fractal dimension of samples obtained through different analytical methods and the degree of metamorphism, as well as proximate analysis parameters.
Fractalfract 09 00538 g010
Figure 11. Statistical correlation between fractal dimension and Ro of coal samples based on different fractal characterization techniques: (A) cube-counting method; (B) triangulation method; (C) variance partition method; (D) power spectrum method.
Fractalfract 09 00538 g011
Figure 12. Statistical correlation between fractal dimension and Mad of coal samples based on different fractal characterization techniques: (A) cube-counting method; (B) triangulation method; (C) variance partition method; (D) power spectrum method.
Fractalfract 09 00538 g012
Figure 13. Statistical correlation between fractal dimension and Aad of coal samples based on different fractal characterization techniques: (A) cube-counting method; (B) triangulation method; (C) variance partition method; (D) power spectrum method.
Fractalfract 09 00538 g013
Figure 14. Statistical correlation between fractal dimension and Vdaf of coal samples based on different fractal characterization techniques: (A) cube-counting method; (B) triangulation method; (C) variance partition method; (D) power spectrum method.
Fractalfract 09 00538 g014
Table 1. Basic data of coal samples.
Sample NumberOriginRoProximate Analysis (wt%)Macerals (%)
MadAadVdafVitriniteLiptiniteInertinite
M-1Hebei Xingtai2.111.8712.5715.792.365.152.49
M-2Hebei Xingtai2.341.3613.8813.1293.534.332.14
M-3Shanxi Jincheng2.531.5413.1912.2393.713.512.78
M-4Shanxi Jincheng2.740.9715.3611.9992.543.973.49
M-5Shanxi Jincheng3.060.8514.829.4194.332.722.95
M-6Shanxi Jincheng3.360.8815.877.5993.693.362.95
Note: Mad represents moisture on an air-dried basis; Aad represents ash on an air-dried basis; Vdaf represents volatile matter on a dry, ash-free basis.
Table 2. Nanopore structure parameters and surface roughness of coal samples.
Sample NumberRoNanopore ParametersSurface Roughness
Pore QuantityAverage Pore Diameter (nm)Areal Porosity (%)Form Factor (ff)Ra (nm)Rq (nm)Rsk (nm)Rku (nm)
M-12.11356813.565.730.644.386.160.5087.56
M-22.34463810.288.350.755.328.38−0.35415.90
M-32.53496612.477.380.724.716.32−0.5765.04
M-42.7447148.849.170.843.344.27−0.1433.48
M-53.0651746.5711.480.813.865.05−0.0524.4
M-63.3668877.379.830.862.723.44−0.0603.22
Table 3. Fractal dimensions of each sample.
Sample NumberRoProximate Analysis (wt%)Fractal Dimension
MadAadVdafCubic Counting MethodTriangulation MethodVariance Partition MethodPower Spectrum Method
M-12.111.8712.5715.72.2702.3342.4492.311
M-22.341.3613.8813.122.2702.2532.3742.217
M-32.531.5413.1912.232.2292.2822.3552.001
M-42.740.9715.3611.992.2462.2802.3512.079
M-53.060.8514.829.412.2702.2772.5192.178
M-63.360.8815.877.592.2902.3702.4622.056
Disclaimer/Publisher’s Note: The statements, opinions and data contained in all publications are solely those of the individual author(s) and contributor(s) and not of MDPI and/or the editor(s). MDPI and/or the editor(s) disclaim responsibility for any injury to people or property resulting from any ideas, methods, instructions or products referred to in the content.