Article

Study on Multi-Scale Damage Evolution of Sandstone Under Freeze–Thaw Cycles: A Computational Perspective Based on Pore Structure and Fractal Dimension

1
School of Resources and Safety Engineering, Central South University, Changsha 410083, China
2
Mining Engineering Technology Research Center of High Altitude Cold Region, Central South University, Changsha 410083, China
*
Author to whom correspondence should be addressed.
Fractal Fract. 2025, 9(8), 534; https://doi.org/10.3390/fractalfract9080534
Submission received: 28 July 2025 / Revised: 11 August 2025 / Accepted: 12 August 2025 / Published: 15 August 2025
(This article belongs to the Special Issue Applications of Fractal Dimensions in Rock Mechanics and Geomechanics)

Abstract

Understanding the intrinsic relationship between microscopic structures and macroscopic mechanical properties of rock under freeze–thaw (F-T) conditions is essential for ensuring the safety and stability of geotechnical engineering in cold regions. In this study, a series of F-T cycle tests, nuclear magnetic resonance (NMR) measurements, and uniaxial compression tests were conducted on sandstone samples. The mechanisms by which F-T cycles influence pore structure and mechanical behavior were analyzed, revealing their internal correlation. A degradation model for peak strength was developed using mesopore porosity as the key influencing parameter. The results showed that with increasing F-T cycles, the total porosity and mesopore and macropore porosities all exhibited increasing trends, whereas the micropore and different fractal dimensions decreased. The compaction stage in the stress–strain curves became increasingly prominent with more F-T cycles. Meanwhile, the peak strength and secant modulus decreased, while the peak strain increased. When the frost heave pressure induced by water–ice phase transitions exceeded the ultimate bearing capacity of pore walls, smaller pores progressively evolved into larger ones, leading to an increase in the mesopores and macropores. Notably, mesopores and macropores demonstrated significant fractal characteristics. The transformation in pore size disrupted the power-law distribution of pore radii and reduced fractal dimensions. A strong correlation was observed between peak strength and both the mesopore and mesopore fractal dimensions. The increase in mesopores and macropores enhanced the compaction stage of the stress–strain curve. Moreover, the expansion and interconnection of mesopores under loading conditions degraded the deformation resistance and load-bearing capacity, thereby reducing both the secant modulus and peak strength. The degradation model for peak strength, developed based on changes in mesopore ratio, proved effective for evaluating the mechanical strength when subjected to different numbers of F-T cycles.

1. Introduction

The safety and stability analyses of geotechnical structures in cold regions differ fundamentally from those in temperate climates [1,2,3,4]. In cold environments, geotechnical materials are exposed to repeated F-T cycles, during which the pore water in load-bearing components—such as rock, concrete, and soil—undergoes phase transitions between liquid water and ice. The associated volumetric expansion damages the original microstructure of these materials. Previous studies have demonstrated a strong correlation between the microstructure of porous geomaterials and their macroscopic mechanical properties. Consequently, freeze–thaw cycling not only modifies the internal structure of load-bearing units but also degrades their mechanical performance, thereby compromising the overall safety and stability of the engineering system. Investigating the evolution of the rock microstructure and its mechanical response under F-T conditions, and elucidating the intrinsic relationship between microstructure and macroscopic parameters, is therefore essential. These studies offer critical insights for evaluating the safety and reliability of engineering structures in cold regions and for mitigating F-T-induced failures.
In recent years, the effects of F-T cycles on the microstructure of porous geomaterials have garnered increasing attention in geotechnical research. Some scholars conducted laboratory-based F-T and mechanical tests on sandstone to investigate the evolution of its microstructure and corresponding mechanical behavior under F-T conditions. Their results demonstrated that with an increasing number of cycles, the pore radius within the sandstone expanded significantly, with notable changes observed in both small and large pores. Furthermore, the overall porosity exhibited an upward trend [5,6,7,8]. Gao [9] employed NMR techniques to examine the microstructural evolution of red sandstone subjected to F-T cycles in chemically reactive environments. The results indicated that chemical conditions significantly influenced the microstructural response during F-T cycling. Under the combined effects of ionic reactions and frost heave, the pore radius increased markedly, and porosity rose linearly with the number of cycles. Liu [10] focused on granite and utilized NMR to investigate its microstructural changes under repeated F-T cycles. The findings revealed that F-T action substantially altered the internal pore structure of granite, leading to progressive increases in pore radius and the gradual transformation of small pores into larger ones. Xiong [11] integrated NMR testing, P-wave velocity measurements, and fractal analysis to examine the microstructural evolution and damage mechanisms of sandstone under F-T conditions. The study found that in centrifuged sandstone, both the amplitude of the T 2 spectrum and P-wave velocity decreased with increasing F-T cycles, whereas in saturated sandstone, the T 2 amplitude exhibited an increasing trend. Moreover, both total and effective porosity increased, while the corresponding fractal dimensions demonstrated a distinct exponential decline with the number of cycles.
Rock, concrete, and clay are fundamental load-bearing materials in geotechnical engineering. Understanding how their mechanical properties respond to F-T cycles is crucial for ensuring the safety and stability of related structures. The behavior of geotechnical materials under repeated freezing and thawing has long been a central focus of research in this field. Gao [12,13] conducted laboratory F-T and mechanical tests on sandstone to examine the evolution of its mechanical properties. The results indicated that as the number of F-T cycles increased, both the peak strength and tangent modulus decreased, while peak strain and full compaction strain increased. Moreover, the compaction phase in the stress–strain curve became more pronounced. Changes in porosity were identified as effective indicators for assessing the peak strength of sandstone subjected to varying numbers of F-T cycles. The study also proposed a segmented constitutive model to characterize the compaction and post-compaction stages of sandstone. Yang et al. [14] employed NMR and infrared thermal imaging to investigate the mechanical responses of marble, granite, and sandstone under F-T cycling. Their analysis of failure modes revealed that marble exhibited the highest frost resistance, followed by granite, while sandstone was the most vulnerable to F-T damage. Focusing on sandstone, Li [15] conducted F-T and creep tests and developed a constitutive model to describe creep damage under sustained loading. The results showed that an increasing number of F-T cycles diminished the viscoplastic properties of sandstone and led to a progressive decline in its long-term strength.
In summary, current research on the relationship between the microstructure and macroscopic mechanical properties of rock subjected to F-T cycles primarily focuses on total porosity as the key microstructural parameter. However, few studies have differentiated porosity characteristics based on pore size or incorporated fractal dimension analysis, potentially limiting the accuracy of correlations between microstructural features and macroscopic behavior. To address this gap, the present study employed NMR testing, freeze–thaw cycling, and uniaxial compression tests on sandstone samples. Pores were classified by radius, and fractal dimensions were calculated across different pore size ranges. The coupled evolution of microstructural and mechanical responses under repeated F-T cycles was analyzed, revealing the mechanisms by which F-T processes influence pore-scale structures and overall mechanical performance. Furthermore, a deterioration model was developed based on changes in mesopore porosity. These findings can provide a scientific basis for assessing the stability of geotechnical structures in cold regions and offer practical guidance for mitigating F-T-induced failures [16,17,18,19].

2. Materials and Methods

2.1. Raw Material Selection and Sample Preparation

To reduce experimental costs, a rock-like material was used in this study. The prototype rock was a yellow sandstone obtained from the slope of an open-pit mine in Shandong Province, China. Referring to existing studies on artificial rock materials, ordinary Portland cement (P.O 42.5) was selected as the binder [20,21,22,23,24,25,26]. Quartz sand with a particle size of 0.5–1 mm was used as the aggregate, and the admixtures included a naphthalene-based superplasticizer and silica fumes. The detailed parameters of the raw materials are listed in Table 1. Based on previous studies on artificial sandstone, the mass ratio of the materials used to prepare the specimens was water: cement: quartz sand: silica fumes: naphthalene superplasticizer = 0.32:1.00:1.30:0.10:0.01. During specimen preparation, the raw materials were first weighed according to the specified proportions. The materials were then mixed, poured into molds, vibrated, demolded, labeled, and cured. The specimens were cured in an HBY-40A standard curing chamber for cement and concrete, maintained at a constant temperature of 20 ± 1 °C and a relative humidity of 95%. The overall experimental procedure is illustrated in Figure 1.

2.2. Laboratory Test

The F-T cycling tests were conducted using a TDS-300 F-T testing machine manufactured by Suzhou Donghua Testing Instrument Co., Ltd, China. The F-T process adopted an air-freezing and water-thawing method. The freezing temperature and duration were set at −20 °C and 4 h, respectively, while the thawing temperature and duration were set at 20 °C and 4 h. NMR measurements were performed using the MesoMR23-060H device produced by Suzhou Niumag Analytical Instrument Corporation, China. The magnetic field strength and central resonance frequency of the device were 0.3 T and 12.8 MHz, respectively. The probe coil diameter and number of sampling points were 60 mm and 4, while the sampling interval and number of echoes were 6000 ms and 7000, respectively. To improve the accuracy of pore structure measurements, specimens were subjected to vacuum saturation. The vacuum pressure was set at 0.1 MPa, with the dry and wet evacuation times set to 360 min and 240 min, respectively. Uniaxial compression tests were performed using a WHY-300 microcomputer-controlled testing machine manufactured by Shanghai Hualong Testing Instrument Co., Ltd, China. The loading method was displacement-controlled at a rate of 1 mm/min. According to rock mechanics testing standards [27], cylindrical specimens with a diameter of 50 mm and a height of 100 mm were used. In the mechanical testing, three samples were used for each F-T cycle condition. After testing, the average value was calculated for analysis. The uniaxial compressive strength (UCS) was calculated using Equation (1), where σ c is the UCS, and F and A represent the failure load and the cross-sectional area of the specimen, respectively. r s is the radius of the cross-section of the cylindrical specimen.
σ c = F A = F π r s 2

2.3. Pore Radius Decision and Fractal Dimension Calculation

According to the principles of NMR detection [28,29,30], the relaxation time ( T 2 ) is primarily influenced by surface relaxation of the pore water within the internal pore structure of the rock. Based on the existing literature, the expression for surface relaxation is given in Equation (2). In this equation, ρ 2 represents the surface relaxivity of the rock pore particles, which depends on the mineral composition and surface properties of the rock. S and V denote the surface area and volume of the pores, respectively.
1 T 2 = 1 T 2 s u r f a c e = ρ 2 ( S V )
In NMR analysis, the internal pores of rock samples are typically assumed to be spherical. Under this assumption, Equation (2) can be rewritten as Equation (3), where F s is the pore shape factor, with a value of 3, and r c is the pore radius. Since both F s and ρ 2 are constants, Equation (3) can be further simplified to Equation (4), where C is a constant. Based on the existing literature, the value of C is taken as 0.01. These equations indicate a one-to-one correspondence between the T 2 relaxation time measured by NMR and the pore radius within the rock. Therefore, T 2 can be used as an indicator to characterize the pore size.
1 T 2 = ρ 2 ( F s r c )
r c = C T 2
To improve the accuracy when establishing the relationship between microstructural features and macroscopic mechanical properties of rock samples, this study conducted a detailed classification of pore types. Based on previous research on sandstone pore structure classification [31], the pores were categorized into micropores (pore radius < 0.1 μm), mesopores (0.1 μm < pore radius < 1 μm), and macropores (pore radius > 1 μm). The classification results are shown in Figure 2.
Previous studies have shown that the pore structures of porous geomaterials such as rock, concrete, and clay exhibit clear fractal characteristics. According to fractal theory [11],
N ( > r ) = r r m a x p r d r = a r D
V ( < r ) = r m i n r p ( r ) b r 3 d r
In Equations (5) and (6), N represents the number of pores within the specimen with a radius greater than r , and V denotes the cumulative volume of pores with a radius less than r . p r and D represent the pore size distribution function and the fractal dimension, respectively. a is a proportionality constant used for calculation, and b is the pore shape factor, which takes a value of 4π/3 for spherical pores. By differentiating Equation (5) and substituting the result into Equation (6), followed by integration, Equation (7) is obtained.
V ( < r ) = b ( r 3 D r m i n 3 D )
Additionally, the proportion of the cumulative volume of pores with a radius less than r relative to the total pore volume ( S V ) can be expressed by Equation (8).
S V = ( r 3 D r m i n 3 D ) ( r m a x 3 D r m i n 3 D )
In the pore distribution within the rock sample, extremely small pore sizes have a negligible effect on the calculation results. Therefore, S V can be simplified as
S V = r 3 D r m a x 3 D
As shown in Equation (4), the T 2 relaxation time measured by nuclear magnetic resonance is linearly related to the pore radius within the rock sample. Therefore, Equation (9) can be rewritten as Equation (10). By applying a logarithmic transformation, the equation can be further expressed as
S V = T 2 c 3 D T 2 m a x 3 D
ln ( S V ) = ( 3 D ) ln ( T 2 c ) ( 3 D ) ln ( T 2 m a x )
In Equation (11), T 2 c is the T 2 value detected by NMR for pores with a radius of r , and T 2 m a x is the T 2 value detected by NMR for pores with the maximum radius. As indicated by Equation (11), if the pore structure of the rock sample exhibits fractal characteristics, then ln ( S V ) and ln ( T 2 c ) show a linear relationship. Therefore, the fractal dimension ( D ) can be determined through linear fitting. The calculation procedure is illustrated in Figure 3.

3. Results’ Analysis

3.1. Evolutionary Patterns of Microstructural Parameters Under F-T Cycles

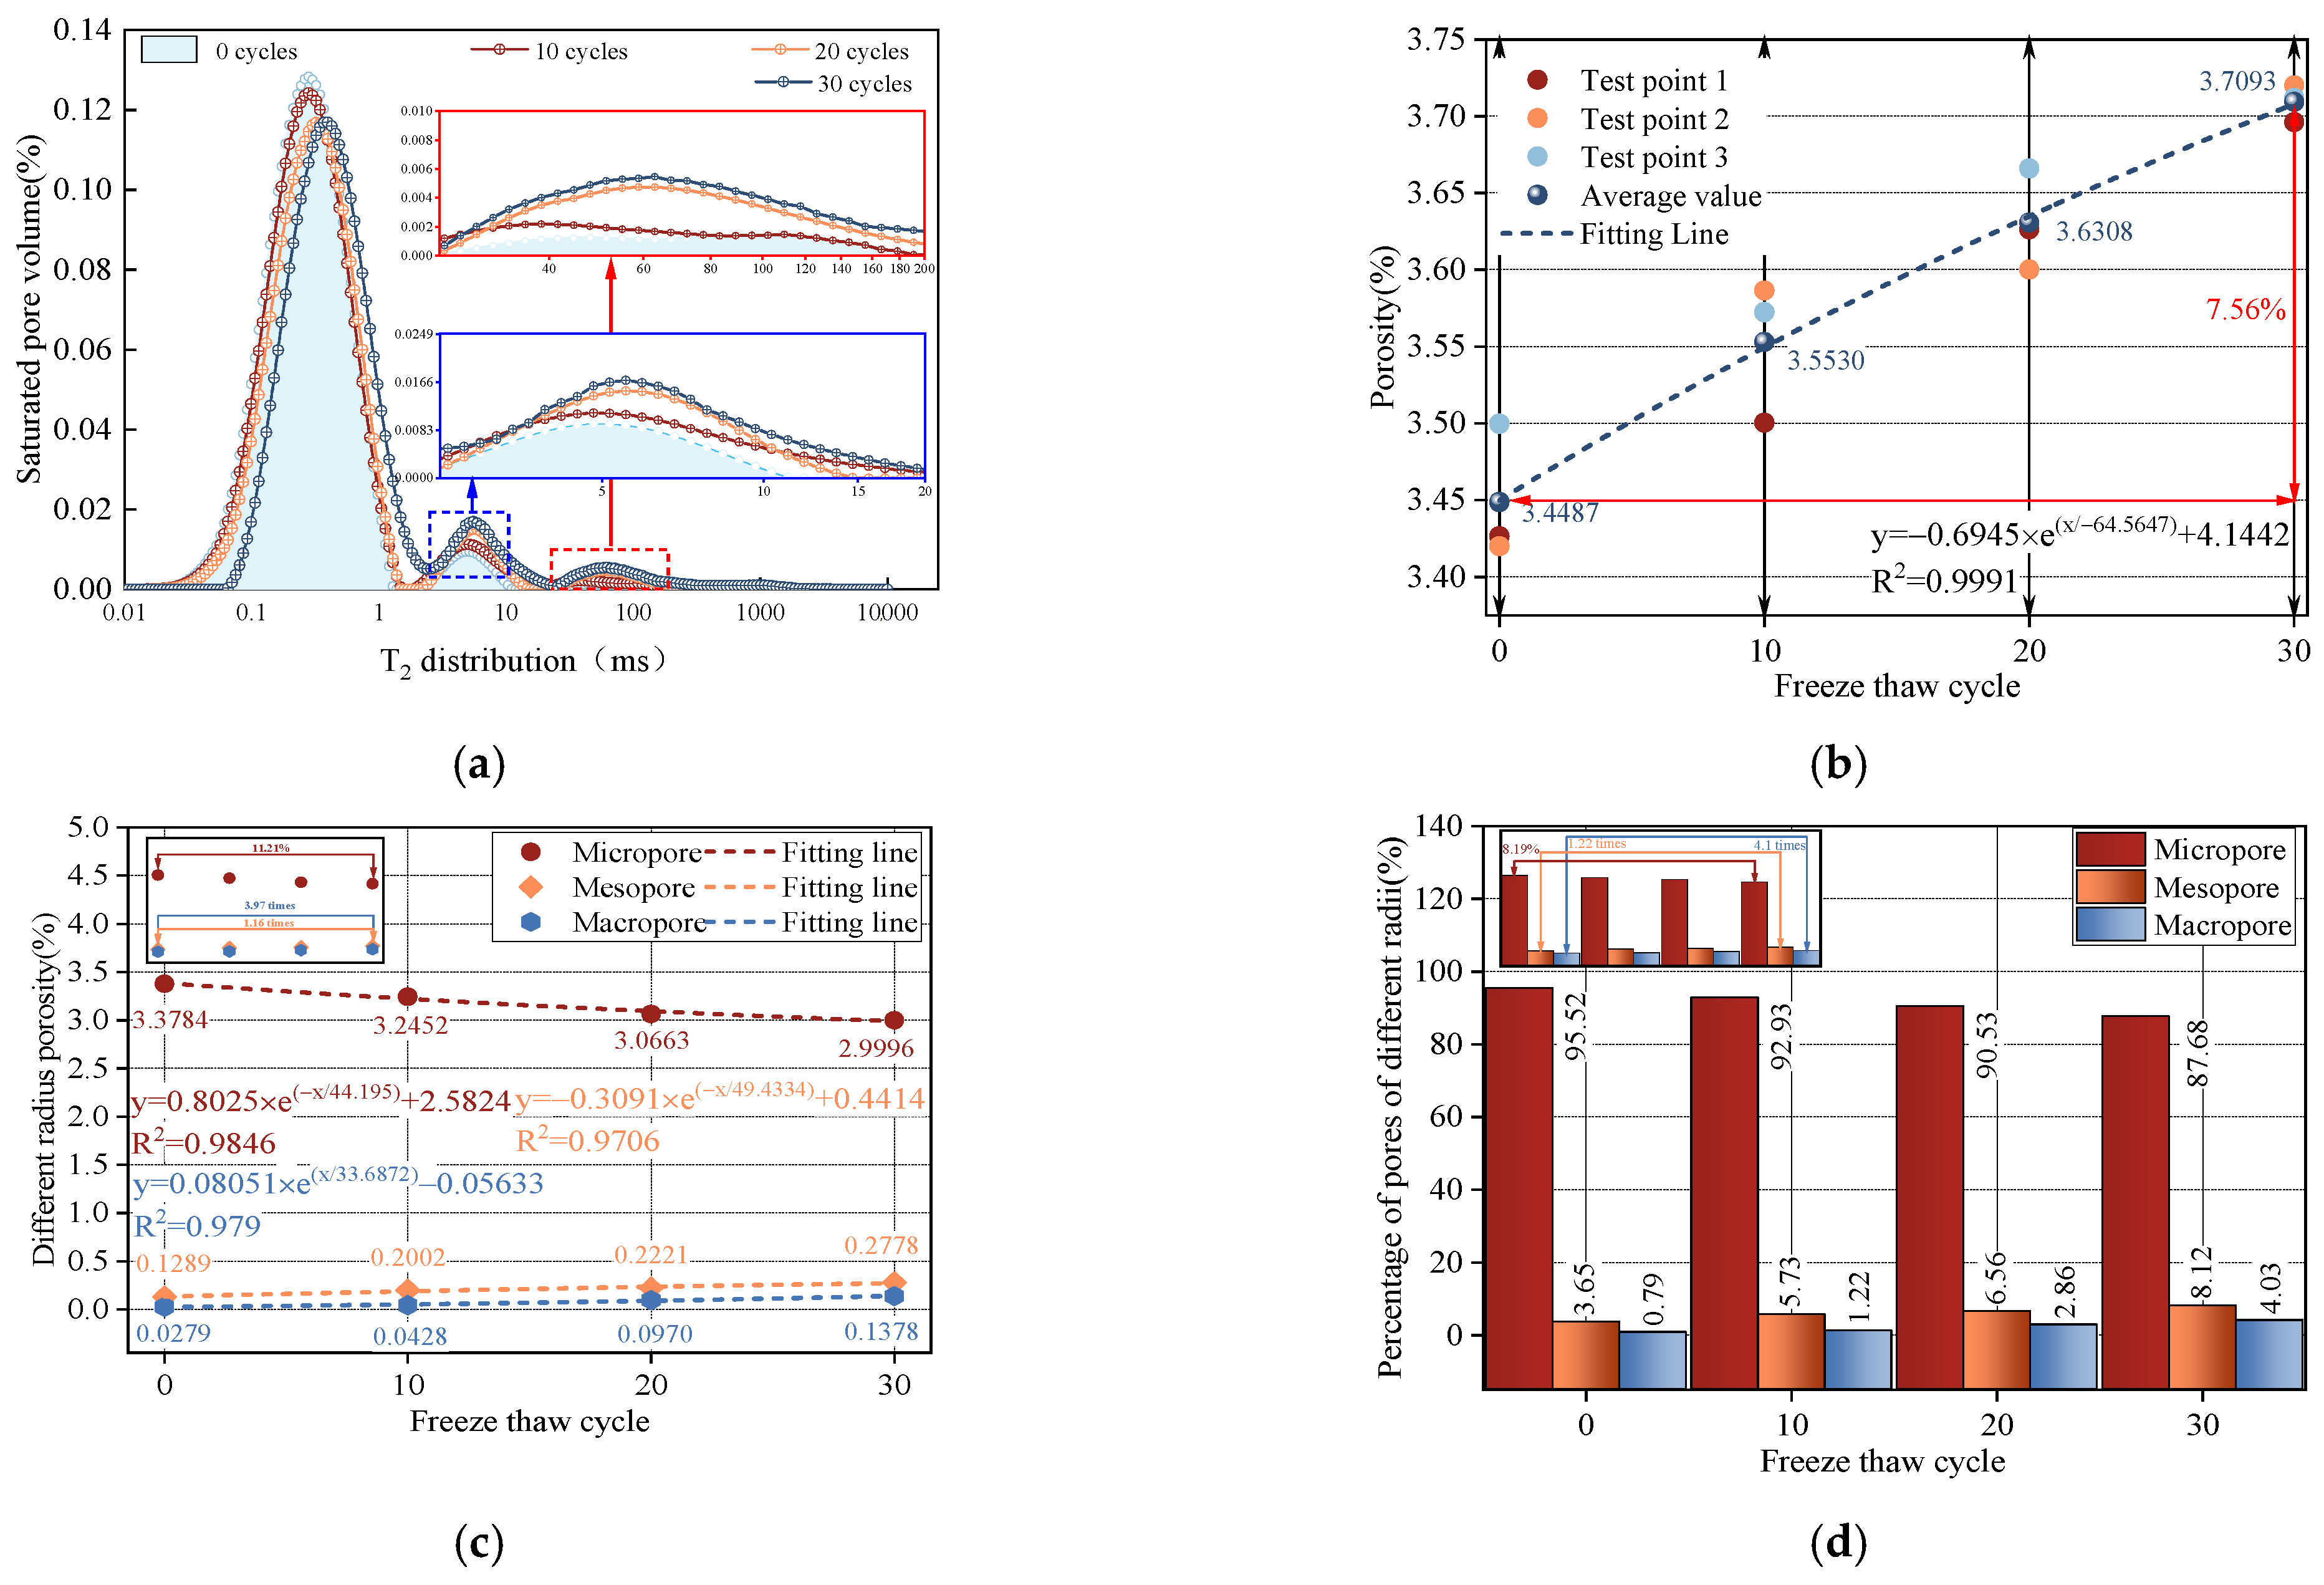
Figure 4a shows the T 2 spectrum distribution of sandstone under different F-T cycles as measured by NMR. As can be seen in the figure, the T 2 spectra exhibit a distinct three-peak feature across different numbers of cycles. With an increase in F-T cycles from 0 to 30, the T 2 spectrum clearly shifts to the right. This indicates a one-to-one correspondence between the T 2 relaxation time and pore radius in sandstone, suggesting that the pore radius increases with the number of F-T cycles. Furthermore, as the number of cycles increases, the amplitude of the T 2 signal corresponding to small pores decreases, while that of large pores increases. Figure 4b,c illustrate the effects of F-T cycles on total porosity and the porosity of different pore size ranges. As shown in Figure 4b, the total porosity of sandstone increases from 3.4487% to 3.7093% as the number of cycles increases from 10 to 30, representing a 7.56% increase. The relationship between total porosity and F-T cycles follows a clear exponential trend, with a fitted coefficient of determination of 0.9991. With respect to pore size classification, the mesopore and macropore porosities increase from 0.1289% and 0.0279% to 0.2778% and 0.1387%, corresponding to increases by factors of 1.16 and 3.97, respectively. Both mesopore and macropore porosities show significant exponential relationships with the number of F-T cycles, with fitting coefficients of 0.9706 and 0.979. In contrast, the micropore porosity decreases from 3.3784% to 2.9996%, representing a reduction of 11.21%, and also follows a clear exponential trend with a fitting coefficient of 0.9846. Figure 4d presents the evolution of pore size distribution ratios under F-T cycles. As the number of cycles increases from 0 to 30, the proportion of micropores decreases from 95.50% to 87.68%, a reduction of 8.19%. Meanwhile, mesopores and macropores increase from 3.65% and 0.79% to 8.12% and 4.03%, with respective growth factors of 1.22 and 4.10.
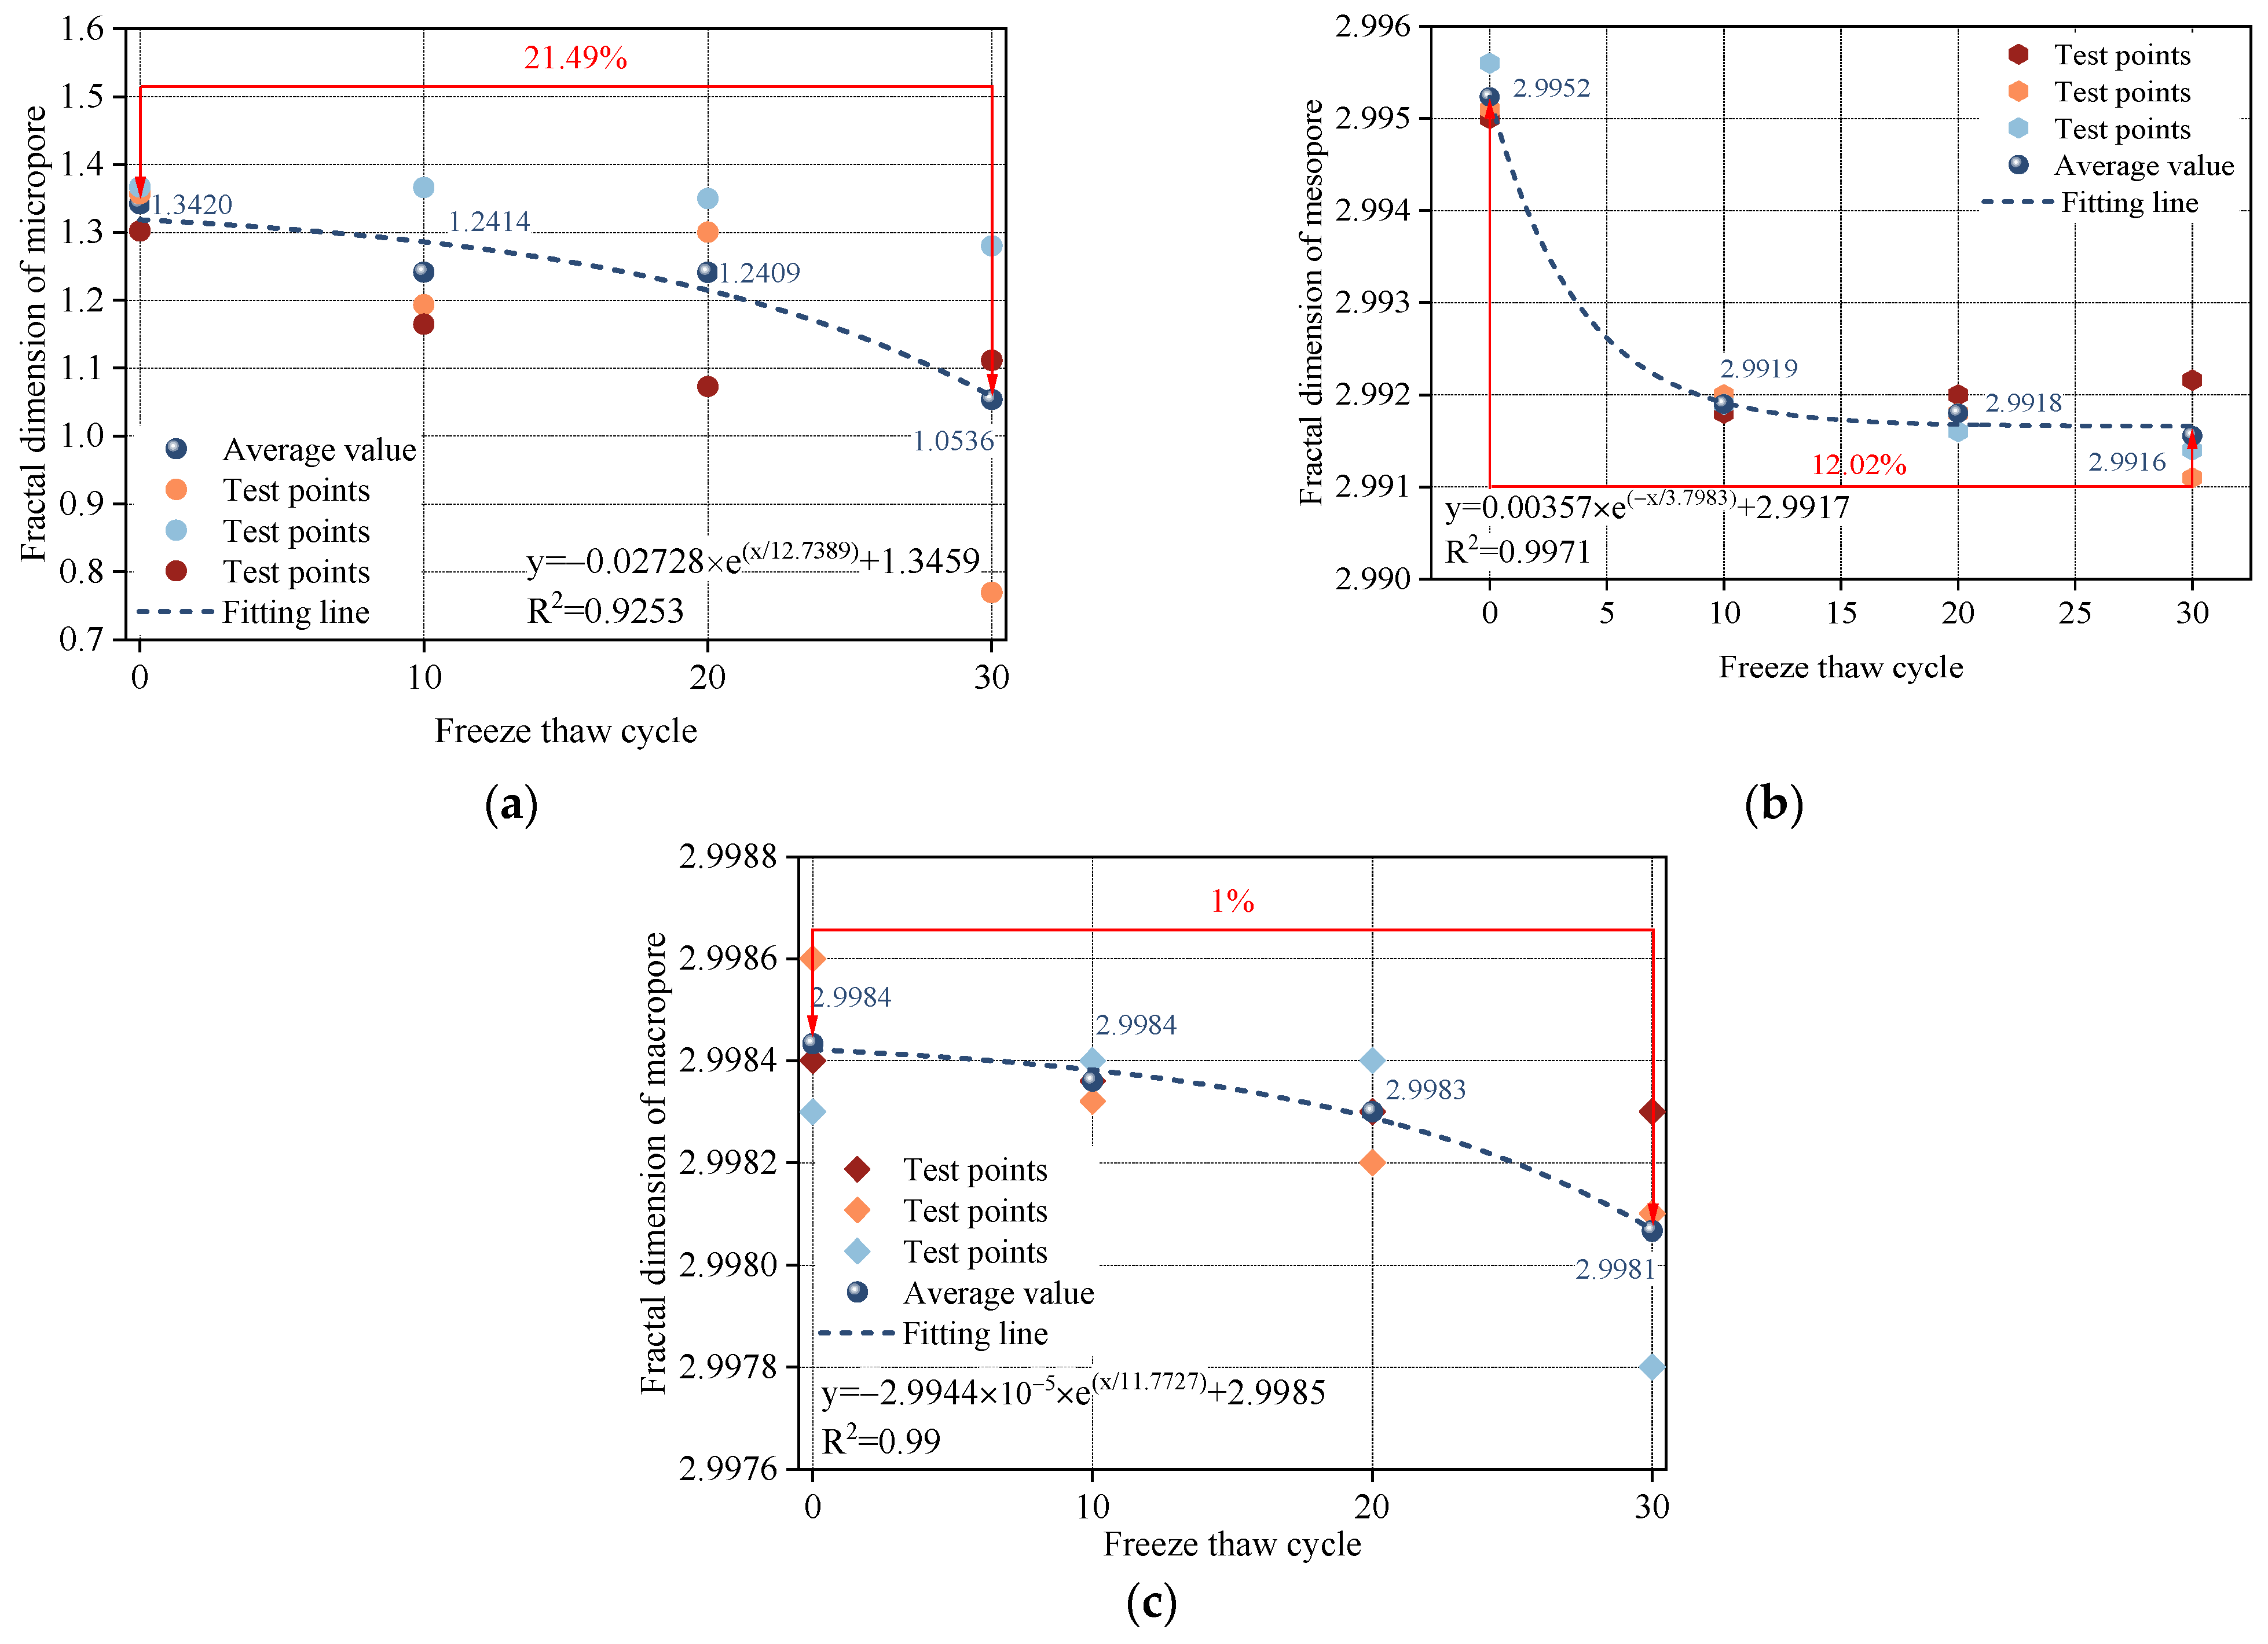
Figure 5a illustrates the effect of F-T cycles on the fractal dimension of micropores in sandstone. As shown in the figure, when the number of F-T cycles increases from 0 to 30, the micropore fractal dimension decreases from 1.3420 to 1.0536, representing a reduction of 21.49%. Moreover, the micropore fractal dimension exhibits a clear exponential relationship with cycles, with a fitting coefficient of 0.9253. Figure 5b,c present the evolution of the fractal dimensions for mesopores and macropores under F-T conditions. As the number of cycles increases, the fractal dimensions of mesopores and macropores decrease from 2.9952 and 2.9984 to 2.9916 and 2.9981, with reduction rates of 12.02% and 1%, respectively. Both mesopore and macropore fractal dimensions show significant exponential relationships with F-T cycles, with fitting coefficients of 0.9971 and 0.99, respectively.

3.2. Evolutionary Patterns of Uniaxial Mechanical Properties Under F-T Cycles

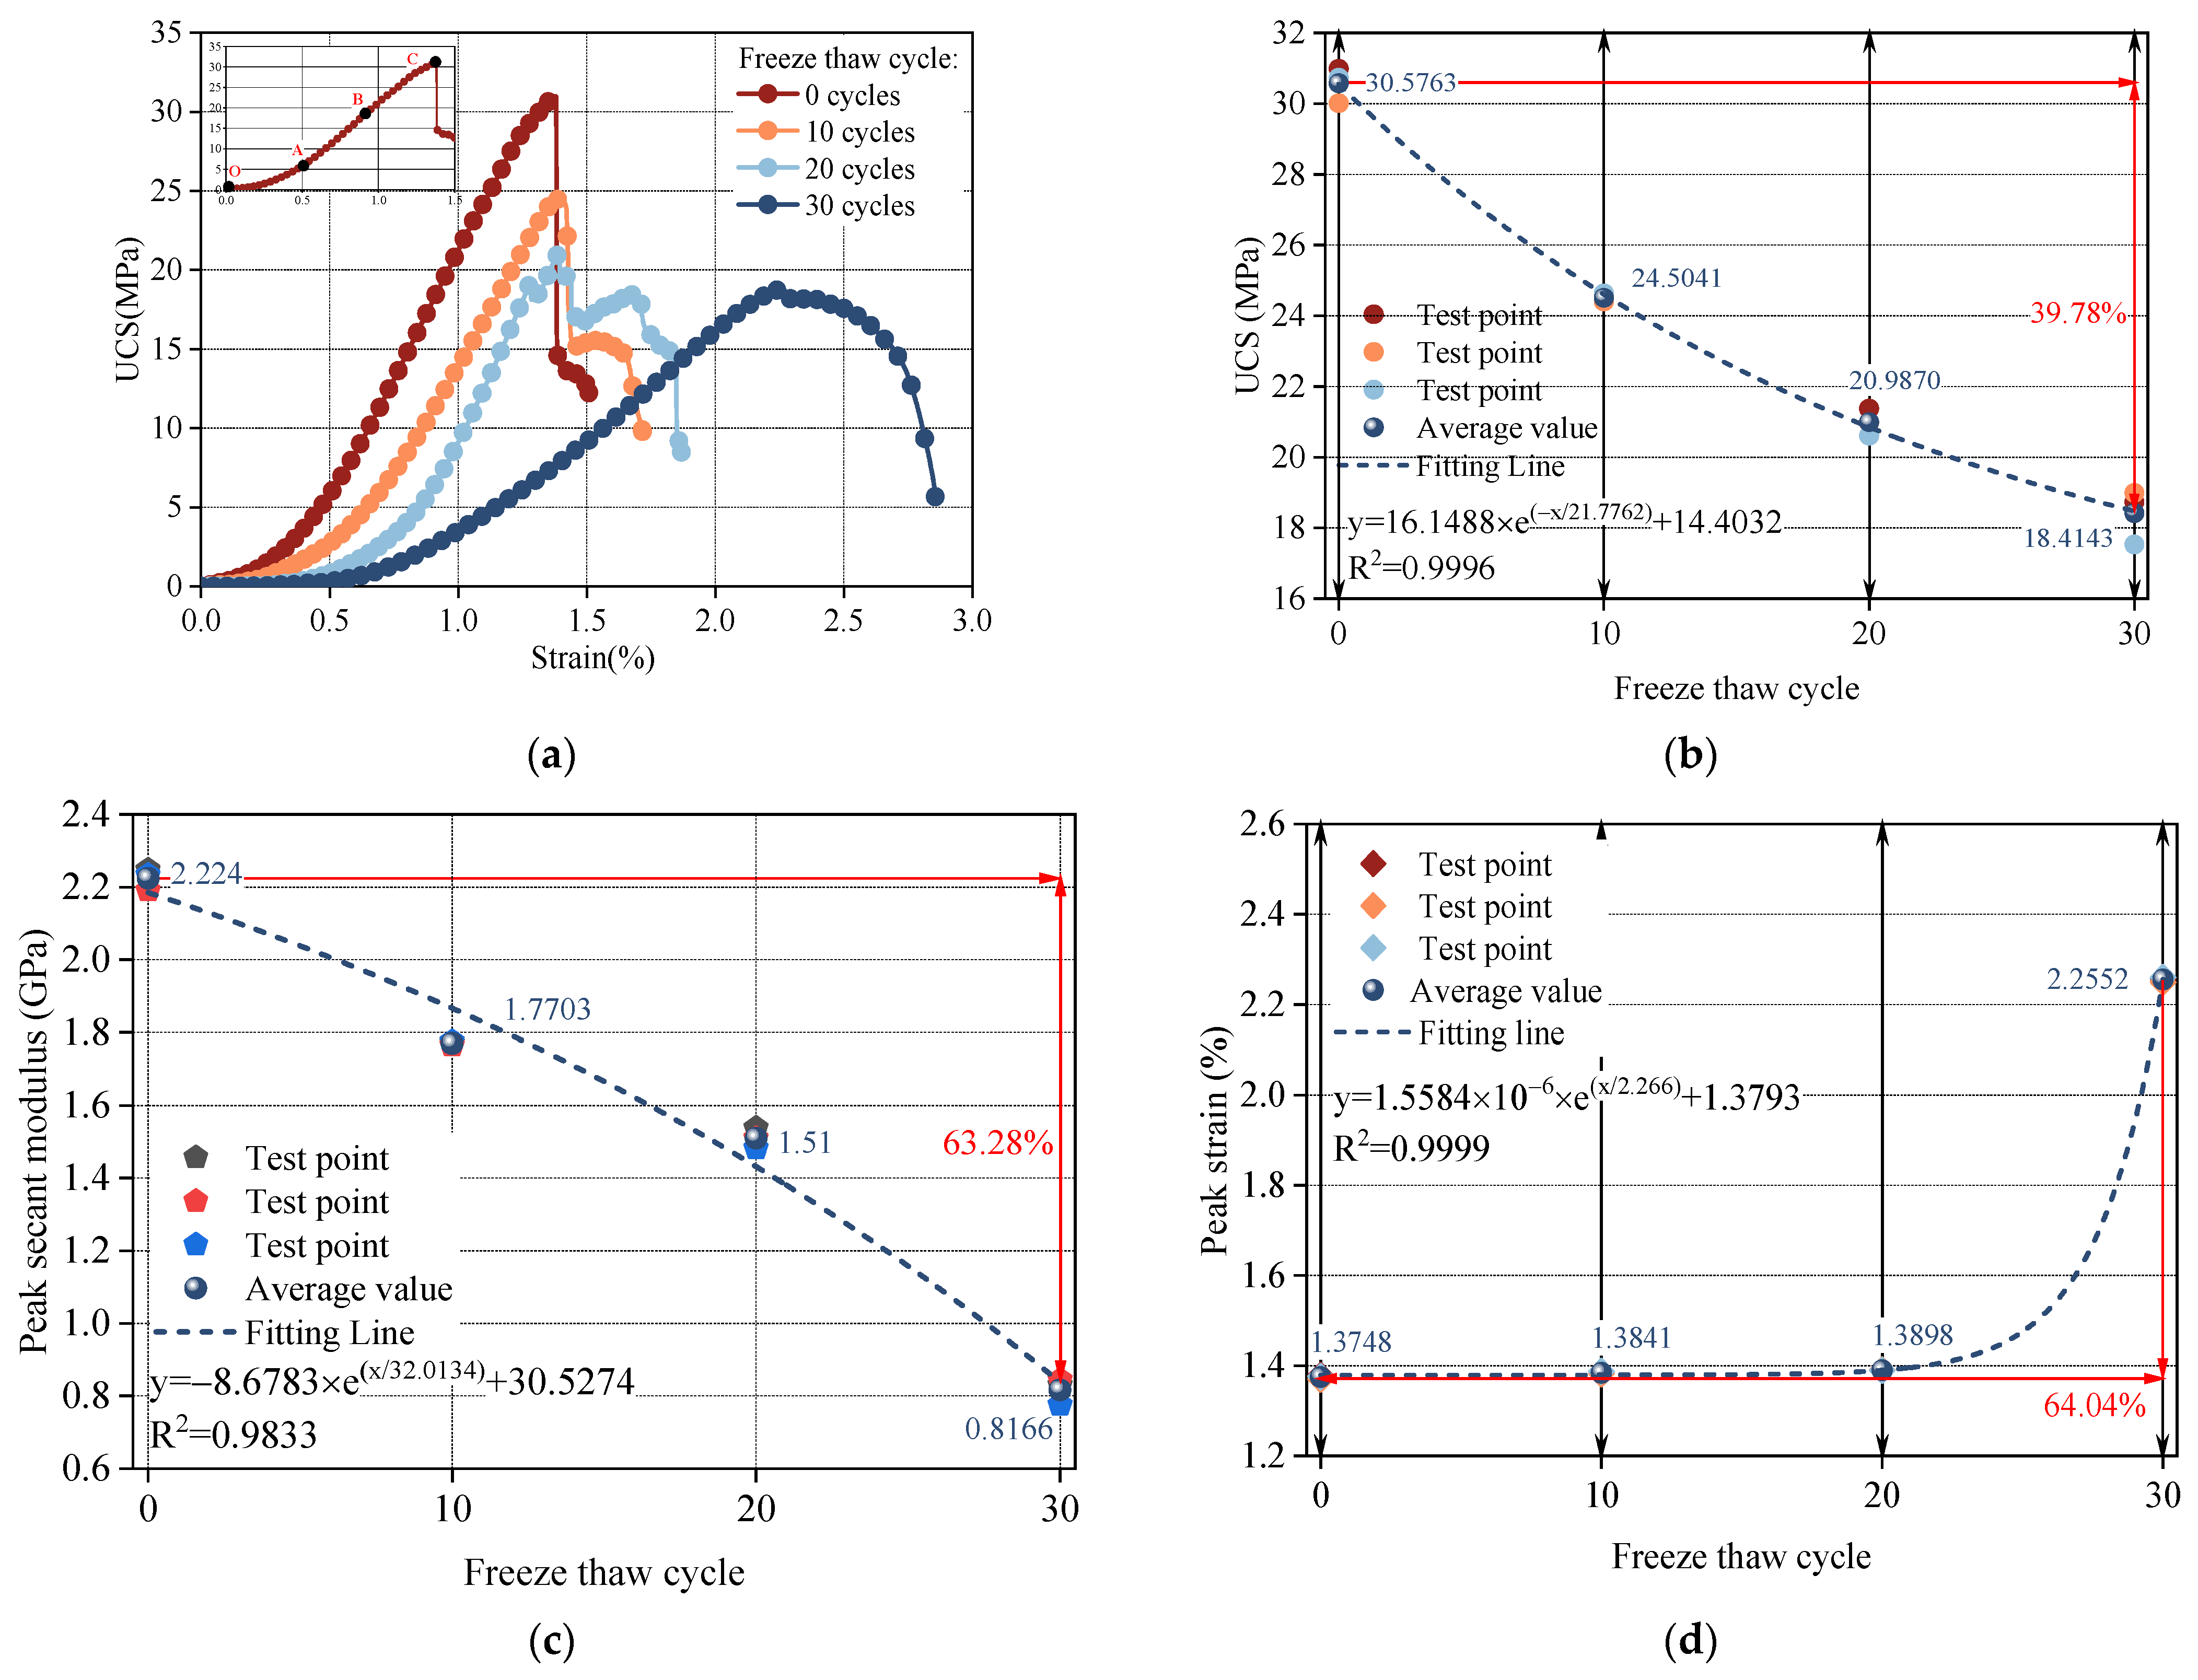
Figure 6a presents the stress–strain curves from uniaxial compression tests on sandstone subjected to different numbers of F-T cycles. As shown, the stress–strain behavior includes four distinct stages: micropore compaction (OA), elastic deformation (AB), plastic deformation (BC), and the post-peak stage (after point C). With an increase in F-T cycles from 0 to 30, the compaction phase becomes increasingly pronounced. In addition, peak stress and peak strain show a decreasing and increasing trend. Figure 6b illustrates the evolution of peak strength under F-T cycles. As the number of cycles increases from 0 to 30, the peak strength decreases from 30.5763 MPa to 18.4143 MPa, representing a reduction of 39.78%. Moreover, peak strength exhibits a clear exponential relationship with the number of cycles, with a fitted correlation coefficient of 0.9996. Figure 6c,d show the effects of F-T cycles on the peak secant modulus and peak strain, respectively. As the number of cycles increases from 10 to 30, the peak secant modulus decreases from 2.224 GPa to 0.8166 GPa, a reduction of 63.28%, while the peak strain increases from 1.3748% to 2.2552%, an increase of 64.04%. Both parameters exhibit significant exponential relationships with cycles, with fitted correlation coefficients of 0.9833 and 0.9991, respectively.

4. Discussion

4.1. Correlation Analysis Between Microscopic Structure and Uniaxial Strength Under F-T Cycles

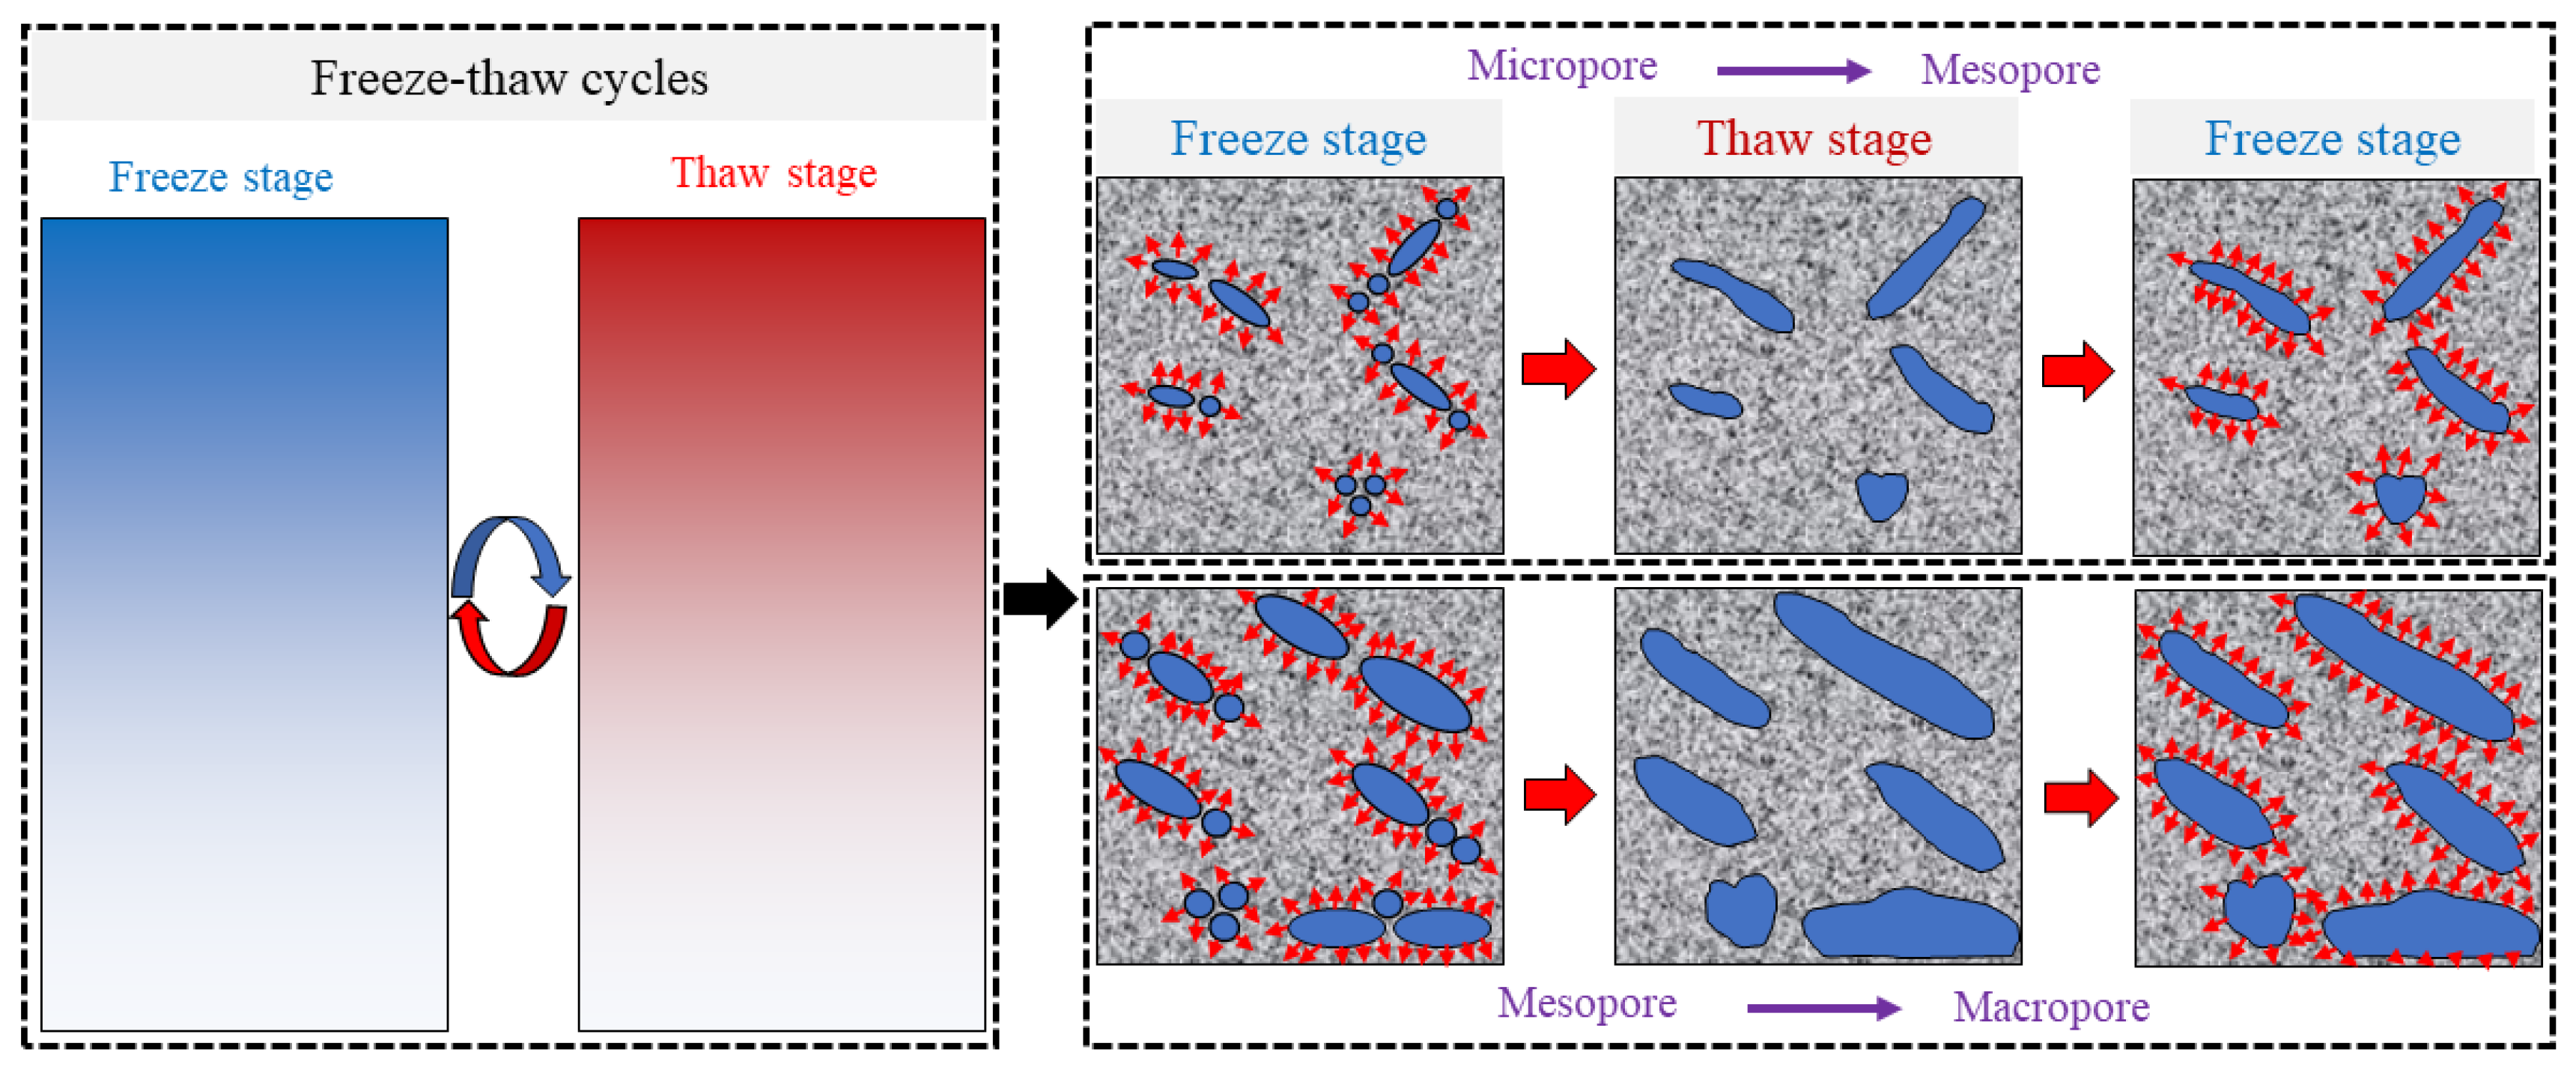
In existing studies on the relationship between the microscopic pore structure and macroscopic mechanical properties of geotechnical materials, many correlation analyses used the total porosity as the microscopic structural parameter. However, these studies have not conducted pore classification or performed calculations on the relationship between pores of different radii and mechanical properties. Additionally, they have not discussed the degree of correlation between pores of different radii and mechanical parameters [11,20]. Figure 7 illustrates the mechanism by which F-T cycles affect the microscopic structure of sandstone. Based on the F-T evolution patterns of pores with different radii, it can be observed that as the number of F-T cycles increases from 0 to 30, the total porosity, mesopore porosity, and macropore porosity all increase, while micropore porosity decreases. Simultaneously, the fractal dimensions of pores across all radii exhibit a decreasing trend. As shown in Figure 7, when the temperature falls below 0 °C, the pore water in the sandstone undergoes a phase transition from liquid to ice. The resulting volumetric expansion exerts frost heave pressure on the inner walls of pores of different sizes. When this pressure exceeds the load-bearing capacity of the pore walls, pores begin to expand and interconnect. Micropores gradually transform into mesopores, and mesopores subsequently evolve into macropores. This mechanism explains the experimental observation that micropore porosity decreases, while mesopore and macropore porosities increase with the number of F-T cycles. Since the rate of increase in mesopore and macropore porosities is greater than the rate of micropore reduction, the total porosity of sandstone increases overall.
Regarding the evolution of fractal dimensions, micropores across all F-T cycles exhibit fractal dimensions below 1.342, while mesopores and macropores consistently show values above 2.99. This suggests that micropores lack fractal characteristics, whereas mesopores and macropores clearly exhibit fractal behavior. As the number of F-T cycles increases from 0 to 30, the fractal dimensions of mesopores and macropores decrease. As shown in Figure 7, the repeated transformation of micropores into mesopores, and mesopores into macropores, increases the complexity of the pore structure. This disrupts the self-similarity of the power-law distribution of pore radii, ultimately reducing the fractal dimensions of the various pore types.
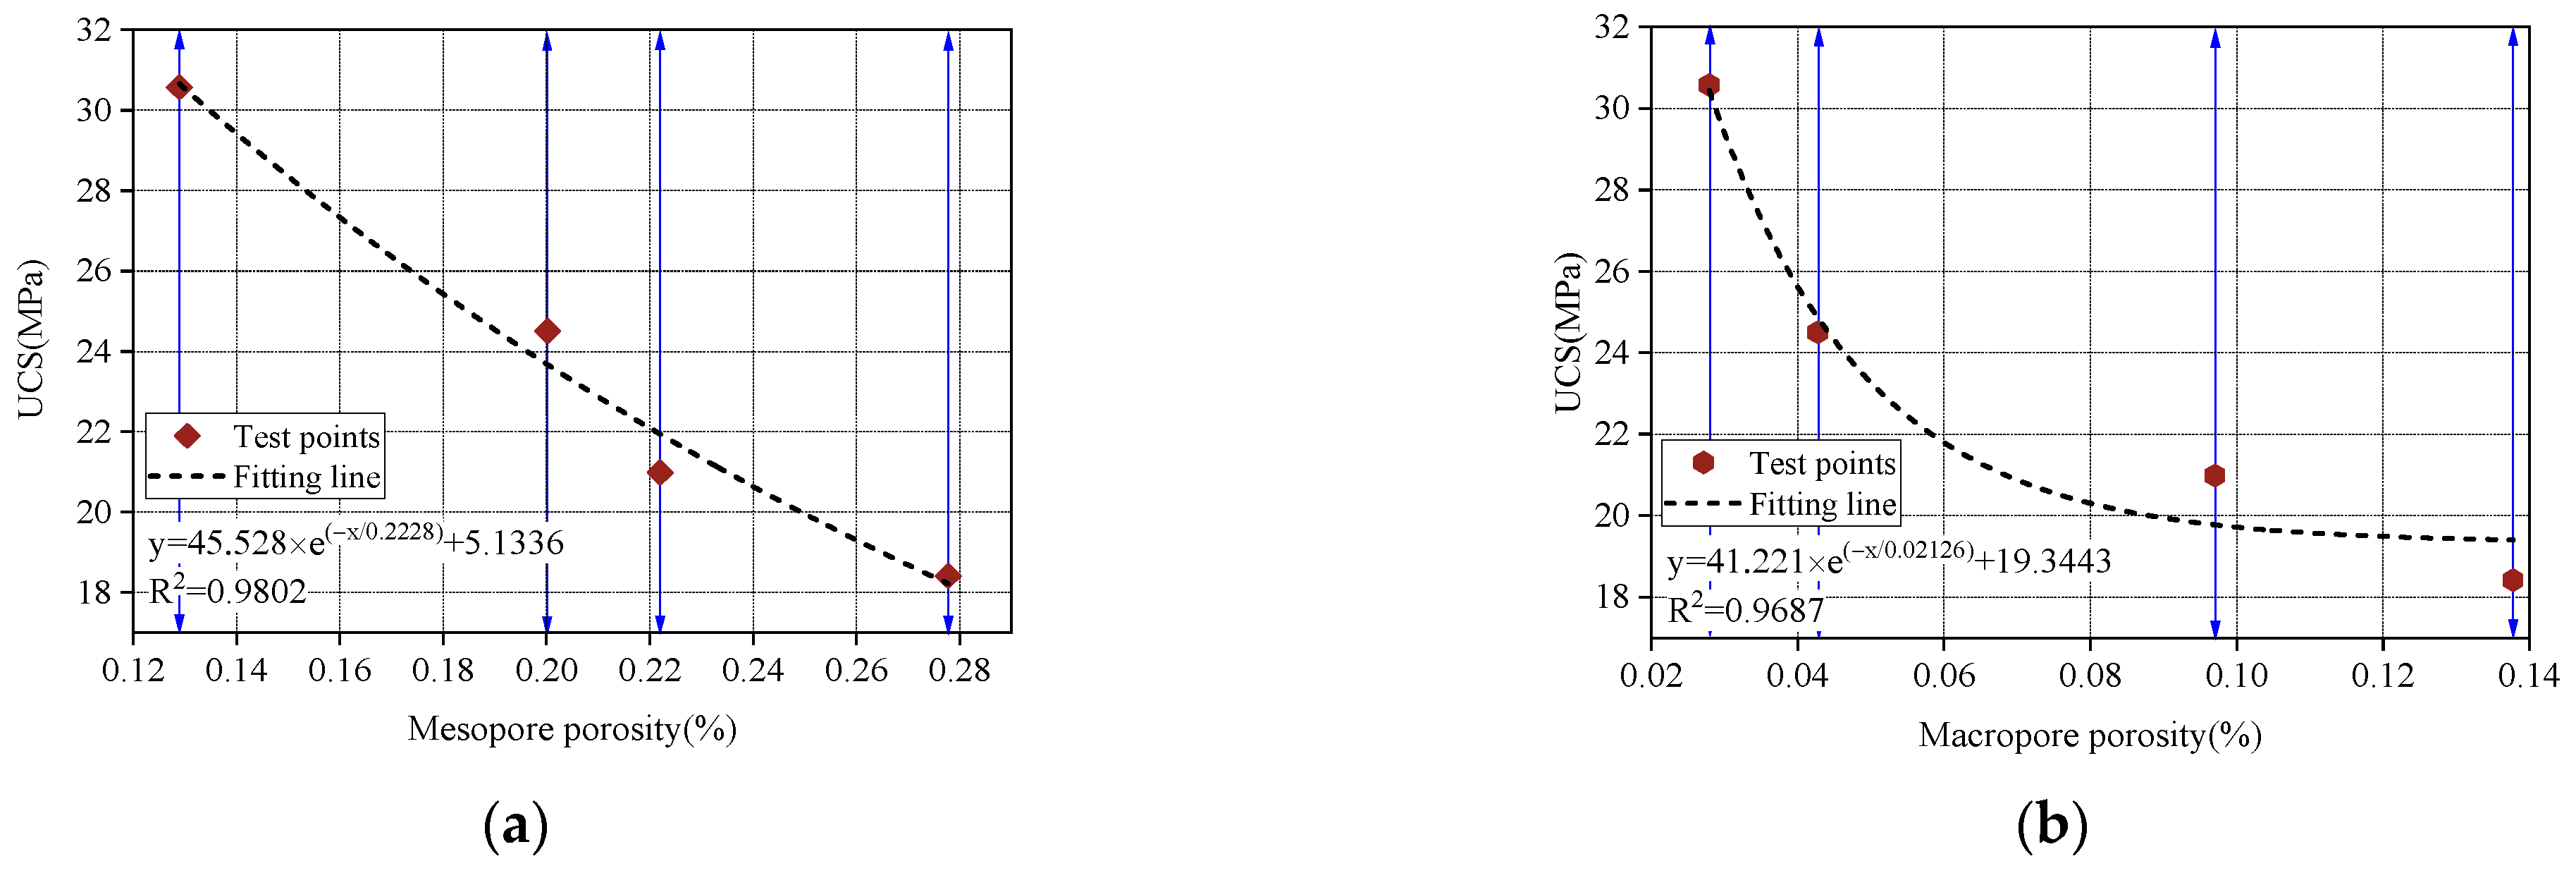
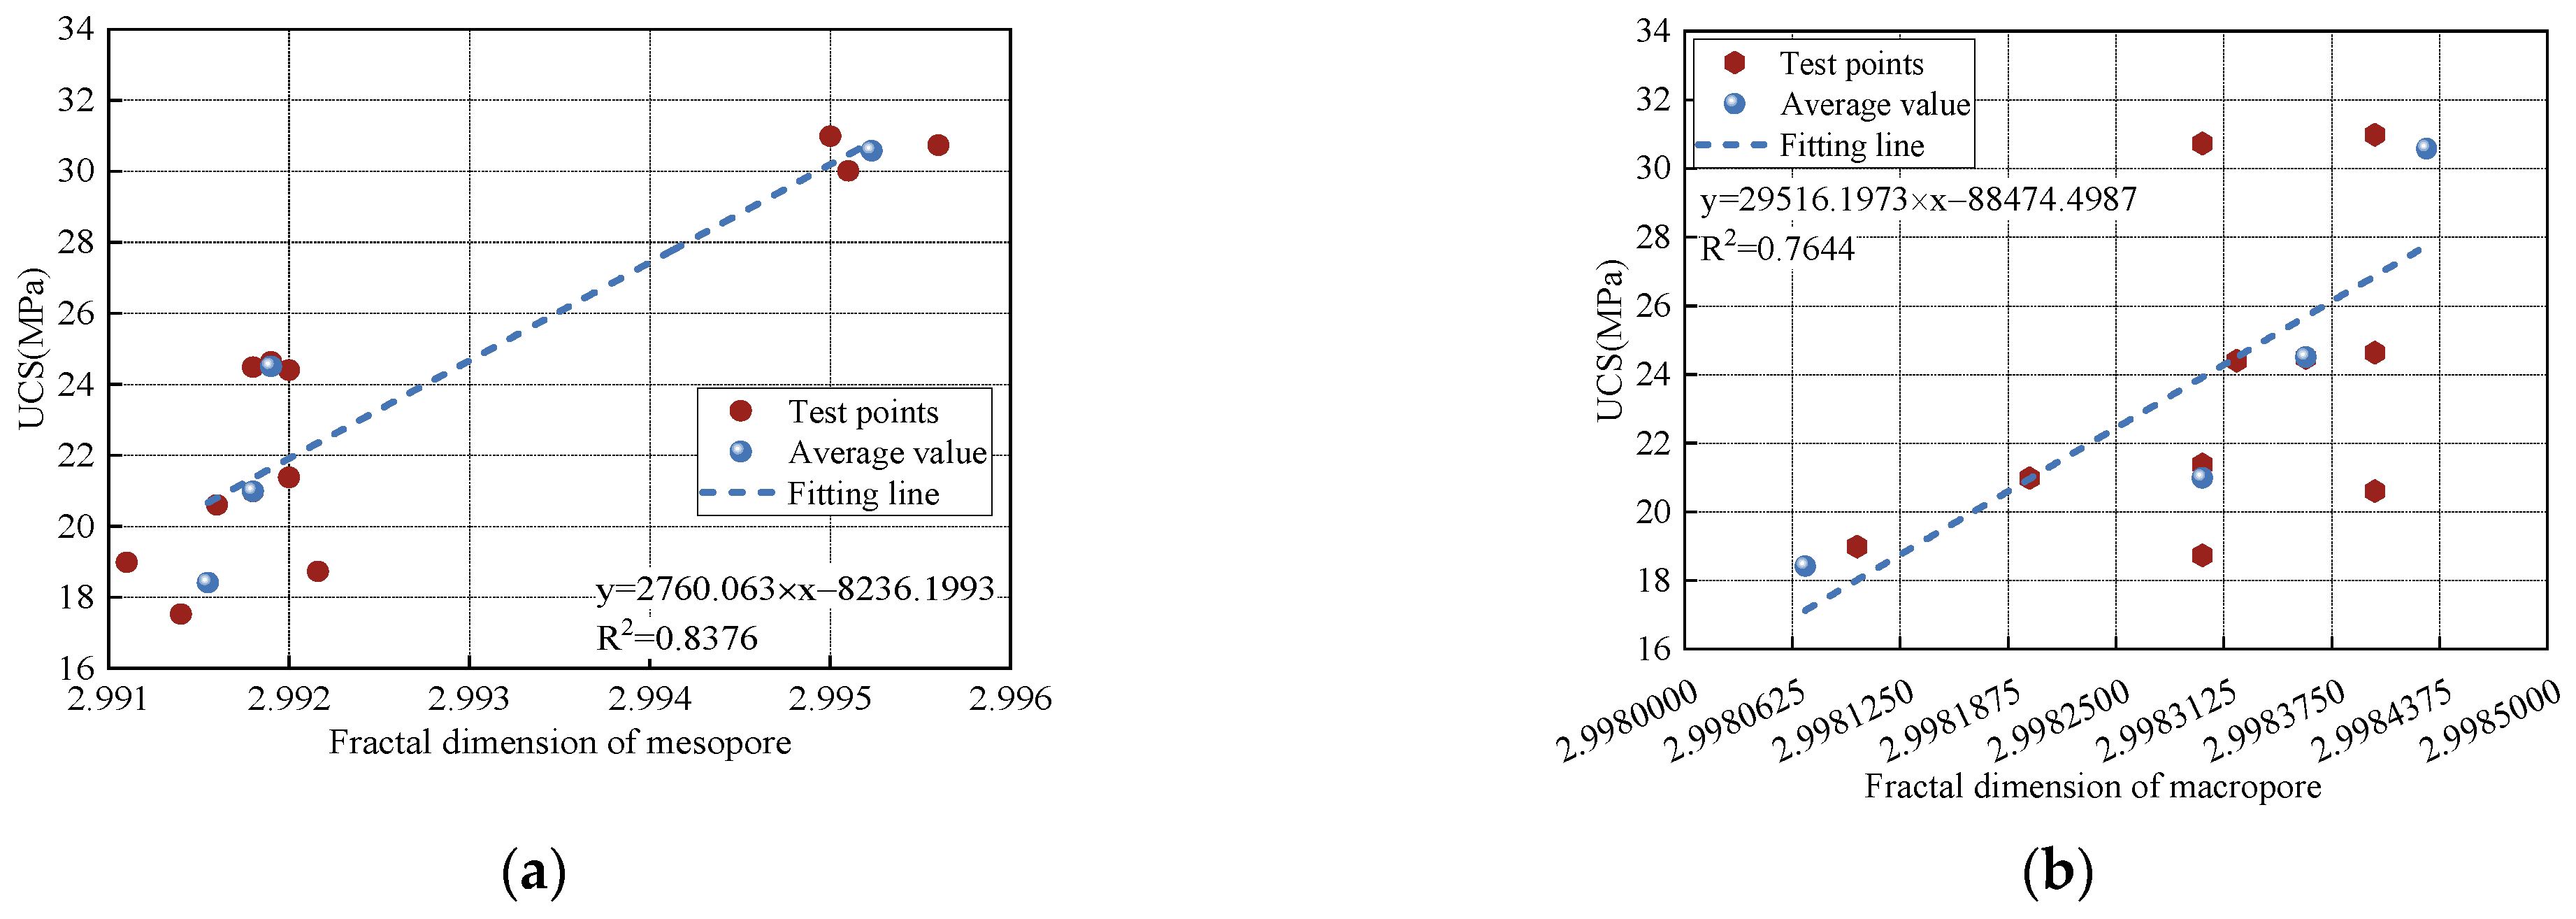
Studies have confirmed a strong relationship between the microstructural pore characteristics of rock and its macroscopic mechanical properties [32,33]. Since micropore porosity shows a trend opposite to that of total porosity under F-T cycles, this study focuses on the correlation between mesopore and macropore characteristics and UCS. Figure 8 presents the regression results between pore volume and UCS. As the number of F-T cycles increases, the mesopore and macropore porosities increase, while UCS decreases. Both porosity types exhibit a clear exponential relationship with UCS; however, the correlation is stronger for mesopores, as indicated by a higher regression coefficient. Figure 9 shows the relationship between the fractal dimensions of mesopores and macropores and UCS. With increasing F-T cycles, the fractal dimensions of both pore types decline, accompanied by a reduction in UCS. Again, exponential trends are observed, with the mesopore fractal dimension demonstrating a stronger correlation with UCS than that of macropores. Figure 10 illustrates the underlying mechanism linking induced pore structure changes with macroscopic strength degradation in F-T cycles. As cycles increase, frost heave caused by the water–ice phase transition leads to higher mesopore and macropore porosities. This contributes to a more pronounced compaction stage in the stress–strain response and an increasing trend in peak strain. Meanwhile, the progressive expansion and interconnection of mesopores reduce the deformation resistance and peak strength, explaining the observed decline in peak secant modulus and UCS.

4.2. Construction of a F-T Deterioration Model for UCS Based on Mesopore Porosity

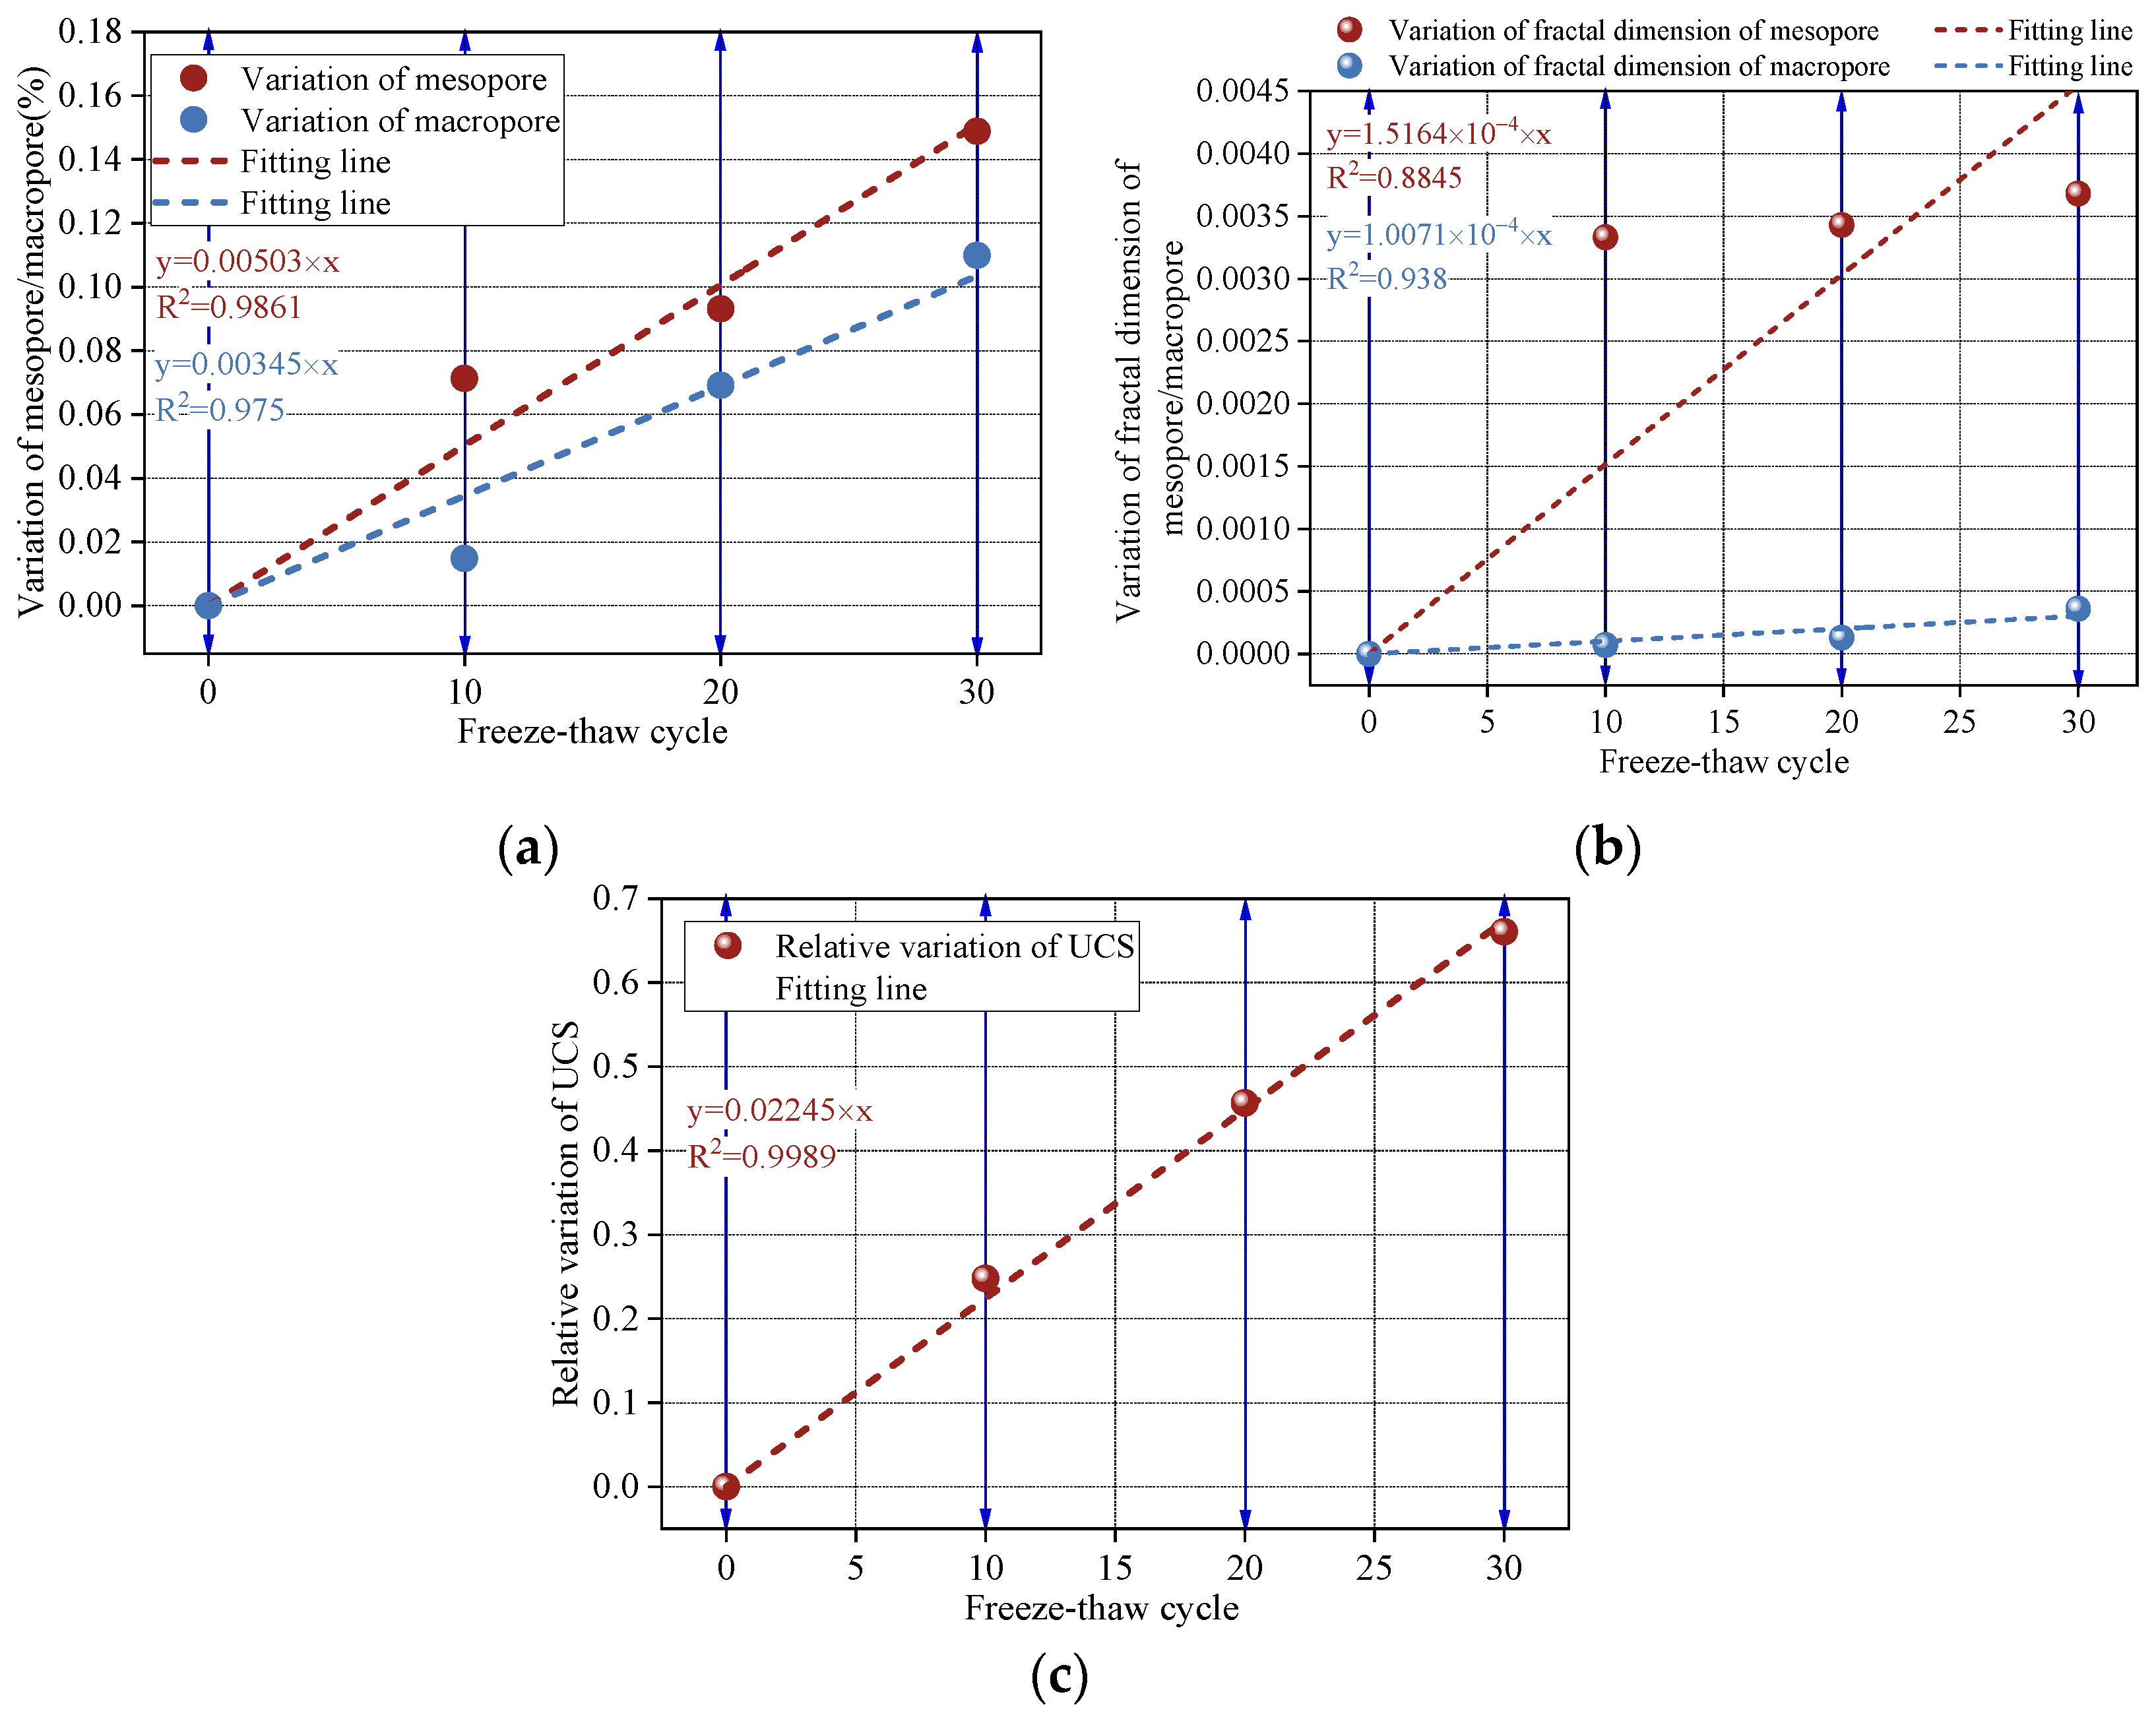
Based on the above analysis of the relationship between the microstructural pore characteristics and macroscopic mechanical properties of sandstone under F-T cycles, mesopore porosity and the mesopore fractal dimension were found to have the strongest correlation with UCS. Therefore, these two parameters were selected as influencing factors to construct a F-T degradation model for sandstone UCS. Figure 11 presents the regression relationships between F-T cycles, microstructural pore characteristics, and macroscopic mechanical properties. As shown in Figure 11a,b, the variations in pore volume and fractal dimension for different pore sizes exhibit strong linear relationships with the number of F-T cycles, with correlation coefficients exceeding 0.88. Hence, the evolution of porosity and the fractal dimension can be described by Equation (12). In this equation, P m e s o t   and P m a c r o t represent the mesopore and macropore porosities after t freeze–thaw cycles, respectively, while P m e s o 0 and P m a c r o 0 denote the corresponding values before freeze–thaw cycles. Similarly, D m e s o t and D m a c r o t are the fractal dimensions of mesopores and macropores after t cycles, and D m e s o 0 and D m a c r o 0 are their initial values.
P m e s o t = P m e s o t P m e s o 0 = k 1 t k 1 > 0   P m a c r o t = P m a c r o t P m a c r o 0 = k 2 t k 2 > 0 D m e s o t = D m e s o t D m e s o 0 = k 3 t k 3 > 0 D m a c r o t = D m a c r o t D m a c r o 0 = k 4 t k 4 > 0
By transforming Equation (12), Equation (13) can be obtained. Based on the fitted relationships between freeze–thaw cycles and both the pore size-dependent porosities and fractal dimensions, P m e s o t ,    P m a c r o t ,    D m e s o t , and D m a c r o t can be considered differentiable functions. Therefore, by integrating Equation (13), Equation (14) can be derived.
P m e s o t P m e s o 0 t = d P m e s o t d t = k 1 P m a c r o t P m a c r o 0 t = d P m a c r o t d t = k 2 D m e s o t D m e s o 0 t = d D m e s o t d t = k 3 D m a c r o t D m a c r o 0 t = d D m a c r o t d t = k 4
t = P m e s o t P m e s o 0 k 1 t = P m a c r o t P m a c r o 0 k 2 t = D m e s o t D m e s o 0 k 3 t = D m a c r o t D m a c r o 0 k 4
Figure 11c presents the fitted relationship between the number of F-T cycles and the relative change in UCS. As shown, the relative change exhibits a strong linear correlation with the number of cycles, with a fitting coefficient of 0.9838. Therefore, the relative change in UCS can be expressed by Equation (15), where F 0 and F ( t ) represent the UCS at 0 and t cycles, respectively. By rearranging Equation (15), Equation (16) can be derived. Given that the peak strength shows a clear exponential relationship with the number of cycles in Figure 6b, F ( t ) can be considered a differentiable function. Thus, integrating Equation (16) yields Equation (17).
F t F ( 0 ) F t = k 5 t ( k 5 > 0 )
F t F 0 t = d F t d t = k 5 F t
F t = e x p k 5 × t
By substituting Equation (14) into Equation (17), the final expression can be obtained as Equation (18).
F t = e x p k 5 × P m e s o t P m e s o 0 k 1 F t = e x p k 5 × P m a c r o t P m a c r o 0 k 2 F t = e x p k 5 × D m e s o t D m e s o 0 k 3 F t = e x p k 5 × D m a c r o t D m a c r o 0 k 4
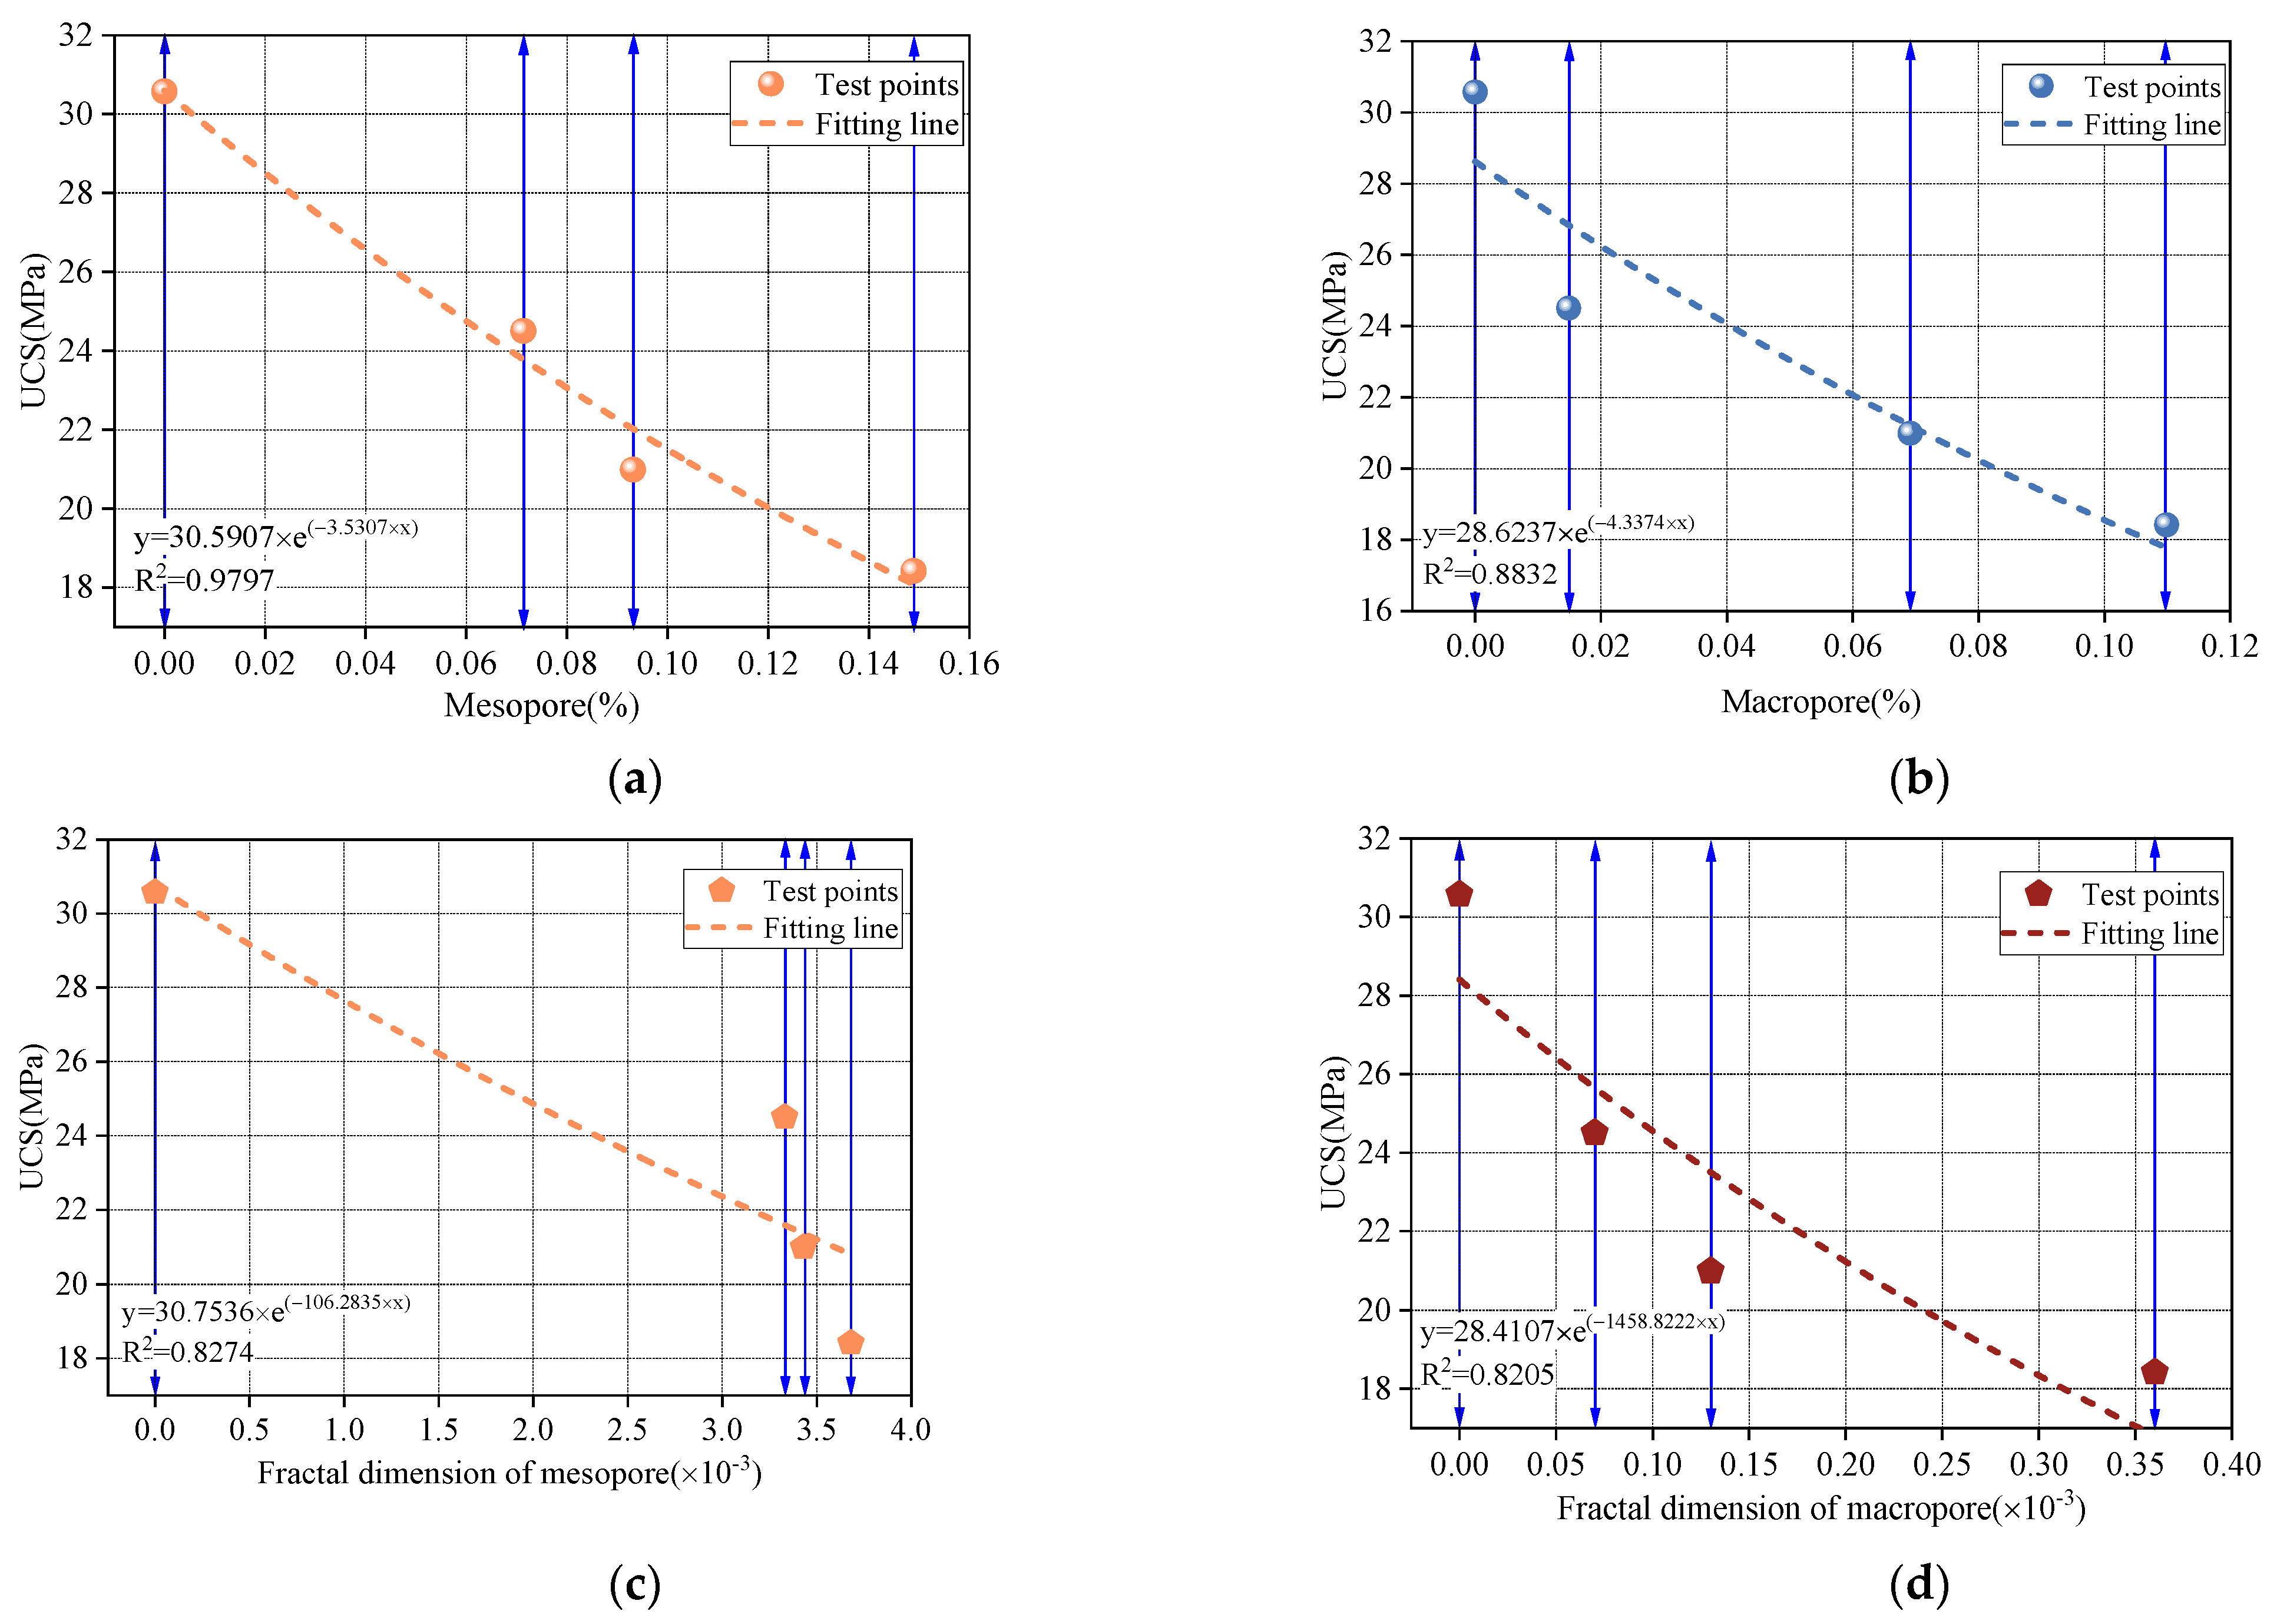
According to Equation (18), the peak strength after t cycles exhibits an exponential relationship with the changes in pore ratios and fractal dimensions across different pore size categories. Therefore, exponential fitting was performed between F t and various mesoscopic structural parameters, as shown in Figure 12. The results demonstrate a clear exponential correlation between peak strength and the variations in both pore ratio and fractal dimension, with all fitting coefficients exceeding 0.82. Among these, the change in mesopore ratio showed the strongest correlation with peak strength, with an exponentially fitted correlation coefficient of 0.9797. Thus, the F-T degradation model for peak strength is expressed as
F t = α × e x p ( k 5 k 1 P m e s o t )
F t F 0 = 30.5907 × e x p ( 3.5307 P m e s o )
In Equation (19), α represents a correction coefficient, and P m e s o t denotes the variation in mesopore ratio after F-T cycles. Based on the fitting results shown in Figure 12a, the values of α and k 5 / k 1 were determined to be 30.5907 and 3.5307, respectively. Therefore, the final freeze–thaw degradation model for peak strength is expressed by Equation (20). In summary, the variation in mesopore ratio exhibits a strong exponential correlation with UCS. Compared with the F-T deterioration model of sandstone UCS established with total porosity as the influencing factor [12], the mesopore can also be used as an influencing factor to construct a F-T deterioration model of UCS based on the variation in mesopore porosity. Furthermore, the F-T deterioration model also exhibits a clear exponential fitting relationship. Thus, the mesopore ratio variation can be used to evaluate the peak mechanical strength of sandstone after different numbers of cycles.

5. Conclusions

In this study, a series of freeze–thaw cycling tests, NMR measurements, and uniaxial compression tests were conducted on sandstone to investigate the evolution of mesoscopic pore structure and macroscopic mechanical parameters under F-T conditions. The mechanisms through which F-T cycles influence the pore size distribution, fractal dimensions, and mechanical responses were explored. Furthermore, the internal relationship between the mesoscopic pore structure and macroscopic strength parameters was revealed. An F-T degradation model for peak strength was developed using the mesopore ratio as the primary influencing factor. The main conclusions are as follows:
(1)
With increasing F-T cycles, the total porosity, mesopore porosity, and macropore porosity of sandstone all showed an increasing trend, while the micropore ratio decreased. All porosity parameters exhibited clear exponential relationships with the number of cycles. Additionally, the fractal dimensions of micropores, mesopores, and macropores decreased exponentially with F-T cycles.
(2)
The compaction stage in the stress–strain curve became more pronounced as the number of F-T cycles increased. Meanwhile, both the peak strength and peak secant modulus decreased, whereas peak strain increased. All these parameters exhibited significant exponential relationships with the number of cycles.
(3)
Repeated F-T cycles induced water–ice phase transitions within pore water. When the volumetric expansion caused by the phase change exceeded the tensile resistance of the pore walls, micropores tended to expand into mesopores, and mesopores further evolved into macropores. Consequently, the micropore ratio decreased while mesopore and macropore ratios increased, resulting in an overall increase in total porosity. Micropores did not exhibit fractal characteristics, whereas mesopores and macropores showed clear fractal features. The transition from micropores to mesopores and from mesopores to macropores disrupted the self-similar power-law distribution of pore radii, leading to a decrease in fractal dimensions.
(4)
The mesopore and macropore porosity both exhibited strong exponential correlations with UCS, with the mesopore ratio showing a stronger correlation. Similarly, the fractal dimensions of mesopores and macropores also showed exponential relationships with strength, with the mesopore fractal dimension demonstrating a stronger association. As the mesopore and macropore ratios increased, the compaction stage in the stress–strain curve became more evident, and peak strain increased. During loading failure, the interconnected mesopores caused by freeze–thaw damage reduced the deformation resistance and bearing capacity, resulting in a decrease in both the peak secant modulus and peak strength.
(5)
The variation in mesopore showed a strong exponential correlation with UCS. The F-T degradation model established based on mesopore variation provided a reliable means to evaluate the peak mechanical strength of sandstone subjected to different F-T cycles.

Author Contributions

Methodology, K.Z.; software, G.T.; formal analysis, J.Q.; investigation, G.T.; data curation, J.Q.; writing—original draft preparation, J.Q.; writing—review and editing, K.Z., T.L. and G.T.; supervision, K.Z.; project administration, T.L.; funding acquisition, T.L. All authors have read and agreed to the published version of the manuscript.

Funding

This research was funded by the National Natural Science Foundation of China, grant number 52374108.

Data Availability Statement

The original contributions presented in this study are included in the article. Further inquiries can be directed to the corresponding author.

Conflicts of Interest

The authors declare no conflicts of interest.

References

  1. Liu, D.; Pu, H.; Xue, K.; Xu, J.; Ni, H. Mechanical Response and Damage Characteristics of Frozen–Thawed Sandstone Across Various Temperature Ranges Under Impact Loads. Fractal Fract. 2025, 9, 128. [Google Scholar] [CrossRef]
  2. Li, J.; Tan, S.; Yang, C.; Chen, H.; Lin, Y. Analysis of damage characteristics for skarn subjected to F-T cycles based on fractal theory. Fractal Fract. 2023, 7, 354. [Google Scholar] [CrossRef]
  3. Kang, X.; Li, H.; Zhang, G.; Li, S.; Shan, L.; Zhao, J.; Zhang, Z. A Binary Medium Constitutive Model for Frozen Solidified Saline Soil in Cold Regions and Its Fractal Characteristics Analysis. Fractal Fract. 2024, 8, 33. [Google Scholar] [CrossRef]
  4. Xiong, X.; Gao, F.; Zhou, K.; Yang, C.; Li, J. Mechanical Properties and Strength Evolution Model of Sandstone Subjected to Freeze–Thaw Weathering Process: Considering the Confining Pressure Effect. Mathematics 2022, 10, 3841. [Google Scholar] [CrossRef]
  5. Yu, S.; Deng, J.; Deng, H.; Gao, F.; Li, J.; Wang, Y. Brittle Characteristic and Microstructure of Sandstone under Freezing-Thawing Weathering. Adv. Civ. Eng. 2020, 2020, 8893278. [Google Scholar] [CrossRef]
  6. Deng, H.; Yu, S.; Deng, J.; Ke, B.; Bin, F. Experimental investigation on energy mechanism of freezing-thawing treated sandstone under uniaxial static compression. KSCE J. Civ. Eng. 2019, 23, 2074–2082. [Google Scholar] [CrossRef]
  7. Zhang, J.; Deng, H.; Taheri, A.; Ke, B.; Liu, C.; Yang, X. Degradation of physical and mechanical properties of sandstone subjected to freeze-thaw cycles and chemical erosion. Cold Reg. Sci. Technol. 2018, 155, 37–46. [Google Scholar] [CrossRef]
  8. Li, J.; Zhou, K.; Liu, W.; Deng, H. NMR research on deterioration characteristics of microscopic structure of sandstones in F-T cycles. Trans. Nonferrous Met. Soc. China 2016, 26, 2997–3003. [Google Scholar] [CrossRef]
  9. Gao, F.; Wang, Q.; Deng, H.; Zhang, J.; Tian, W.; Ke, B. Coupled effects of chemical environments and freeze–thaw cycles on damage characteristics of red sandstone. Bull. Eng. Geol. Environ. 2017, 76, 1481–1490. [Google Scholar] [CrossRef]
  10. Liu, C.; Deng, H.; Zhao, H.; Zhang, J. Effects of F-T treatment on the dynamic tensile strength of granite using the Brazilian test. Cold Reg. Sci. Technol. 2018, 155, 327–332. [Google Scholar] [CrossRef]
  11. Xiong, X.; Gao, F.; Li, J.; Zhou, K.; Yang, C. Pore Structure Evolution Characteristics and Damage Mechanism of Sandstone Subjected to Freeze–Thaw Cycle Treatment: Insights from Low-Field Nuclear Magnetic Resonance Testing and Fractal Theory. Fractal Fract. 2025, 9, 293. [Google Scholar] [CrossRef]
  12. Gao, F.; Xiong, X.; Xu, C.; Zhou, K. Mechanical property deterioration characteristics and a new constitutive model for rocks subjected to F-T weathering process. Int. J. Rock Mech. Min. Sci. 2021, 140, 104642. [Google Scholar] [CrossRef]
  13. Gao, F.; Xiong, X.; Zhou, K.; Li, J.; Shi, W. Strength deterioration model of saturated sandstone under F-T cycles. Rock Soil Mech. 2019, 40, 926–932. [Google Scholar]
  14. Yang, C.; Zhou, K.; Xiong, X.; Deng, H.; Pan, Z. Experimental investigation on rock mechanical properties and infrared radiation characteristics with F-T cycle treatment. Cold Reg. Sci. Technol. 2021, 183, 103232. [Google Scholar] [CrossRef]
  15. Li, J.; Zhu, L.; Zhou, K.; Chen, H.; Gao, L.; Lin, Y.; Shen, Y. Non-linear creep damage model of sandstone under F-T cycle. J. Cent. South Univ. 2021, 28, 954–967. [Google Scholar] [CrossRef]
  16. Yu, M.; Wang, Z.; Xu, Y.; Wang, Y.; Wang, L.; Wen, J. Study on mechanical properties and energy evolution characteristics of excavation unloading rock under freeze–thaw temperature range. Eng. Fract. Mech. 2025, 325, 111293. [Google Scholar] [CrossRef]
  17. Zhao, Y.; Li, N.; Niu, H.; Shi, J. Study on in-situ CT damage of concrete subjected to compressive loading after F-T cycles based on deep learning and DVC technology. Constr. Build. Mater. 2025, 482, 141599. [Google Scholar] [CrossRef]
  18. Wu, B.; Zhu, H.H.; Guo, X.H.; Wang, D.Y.; Wang, C.; Meguid, M.A. Experimental investigation of thermo-hydro-mechanical interactions in frozen soil using an integrated monitoring system. Eng. Geol. 2025, 335, 108136. [Google Scholar] [CrossRef]
  19. Gou, D.; Li, Y.; Hu, Y.; Zhou, Z.; Zhang, S.; Li, K.; Wang, K. Investigations on mechanical behaviors and failure mechanisms of rock-concrete composite specimens with different interface inclinations subjected to F-T cycles and uniaxial compression. Eng. Fract. Mech. 2025, 332, 111196. [Google Scholar] [CrossRef]
  20. Jiang, C.; Guo, W.; Chen, H.; Zhu, Y.; Jin, C. Effect of filler type and content on mechanical properties and microstructure of sand concrete made with superfine waste sand. Constr. Build. Mater. 2018, 192, 442–449. [Google Scholar] [CrossRef]
  21. Diambra, A.; Festugato, L.; Ibraim, E.; Peccin da Silva, A.; Consoli, N.C. Modelling tensile/compressive strength ratio of artificially cemented clean sand. Soils Found. 2018, 58, 199–211. [Google Scholar] [CrossRef]
  22. Ueyendah, S.; Lezgy-Nazargah, M.; Eskandari-Naddaf, H.; Emamian, S.A. Predicting the mechanical properties of cement mortar using the support vector machine approach. Constr. Build. Mater. 2021, 291, 123396. [Google Scholar] [CrossRef]
  23. Chuta, E.; Colin, J.; Jeong, J. The impact of the water-to-cement ratio on the surface morphology of cementitious materials. J. Build. Eng. 2020, 32, 101716. [Google Scholar] [CrossRef]
  24. Dai, S.; Sun, Q.; Hao, R.; Xiao, Y. Study on failure characteristics and Acoustic Emission laws of Rock-like specimens under Uniaxial Compression. Appl. Sci. 2024, 14, 8893. [Google Scholar] [CrossRef]
  25. Cui, Y.; Xu, C.; Xue, L.; Dong, J.; Jiang, T. Experimental study on the reasonable proportions of rock-like materials for water-induced strength degradation in rock slope model test. Sci. Rep. 2023, 13, 9288. [Google Scholar] [CrossRef] [PubMed]
  26. Wang, P.; Zhang, M.; Chen, H.; Zhang, C.; Ma, F.; Zheng, P. Mechanical properties of cement-based rocks with arc-shaped cracks under uniaxial compression. Constr. Build. Mater. 2025, 484, 141838. [Google Scholar] [CrossRef]
  27. SL/T 264-2020; Rock Test Regulations for Water Conservancy and Hydropower Engineering. People’s Republic of China Ministry of Water Resources: Beijing, China, 2020. (In Chinese)
  28. Jiang, Z.; Cai, G.; Liu, Y.; Wang, P.; Yu, S. Pore structure and mechanical characteristics of CRS mortar based on NMR and fractal theory. Constr. Build. Mater. 2024, 457, 139459. [Google Scholar] [CrossRef]
  29. Liu, Y.; Deng, H.; Jiang, Z.; Tian, G.; Wang, P.; Yu, S. Research on influence laws of aggregate sizes on pore structures and mechanical characteristics of cement mortar. Constr. Build. Mater. 2024, 442, 137606. [Google Scholar] [CrossRef]
  30. Jiang, Z.; Cai, G.; He, H.; Tian, G.; Liu, Y.; Wu, M. Pore structure evolution of mortars with manufactured sand aggregate under the influence of aggregate size and water saturation environment. Measurement 2025, 241, 115736. [Google Scholar] [CrossRef]
  31. Jiang, Z.; Deng, H.; Liu, T.; Tian, G.; Tang, L. Study on Microstructural Evolution of Marble Under Cyclic Dynamic Impact Based on NMR. IEEE Access 2019, 7, 138043–138055. [Google Scholar] [CrossRef]
  32. Li, K.S.; Chen, L.X.; Yang, S.Q.; Song, G.L.; Liu, C.X. Multiscale Deterioration of Physical and Triaxial Mechanical Behaviors of Fine-Grained Sandstone Under Cyclic Freezing–Thawing: Experimental Observation and Microstructural Interpretation. Rock Mech. Rock Eng. 2025, 1–25. [Google Scholar] [CrossRef]
  33. Shi, Y.; Mu, Y.; Ma, W.; Zhang, L.; Yang, C.; Ding, Z.; Han, D. A novel NMR-based experimental study of the water-heat transfer of coarse-grained soil during the F-T process. Int. Commun. Heat Mass Transf. 2025, 165, 109011. [Google Scholar]
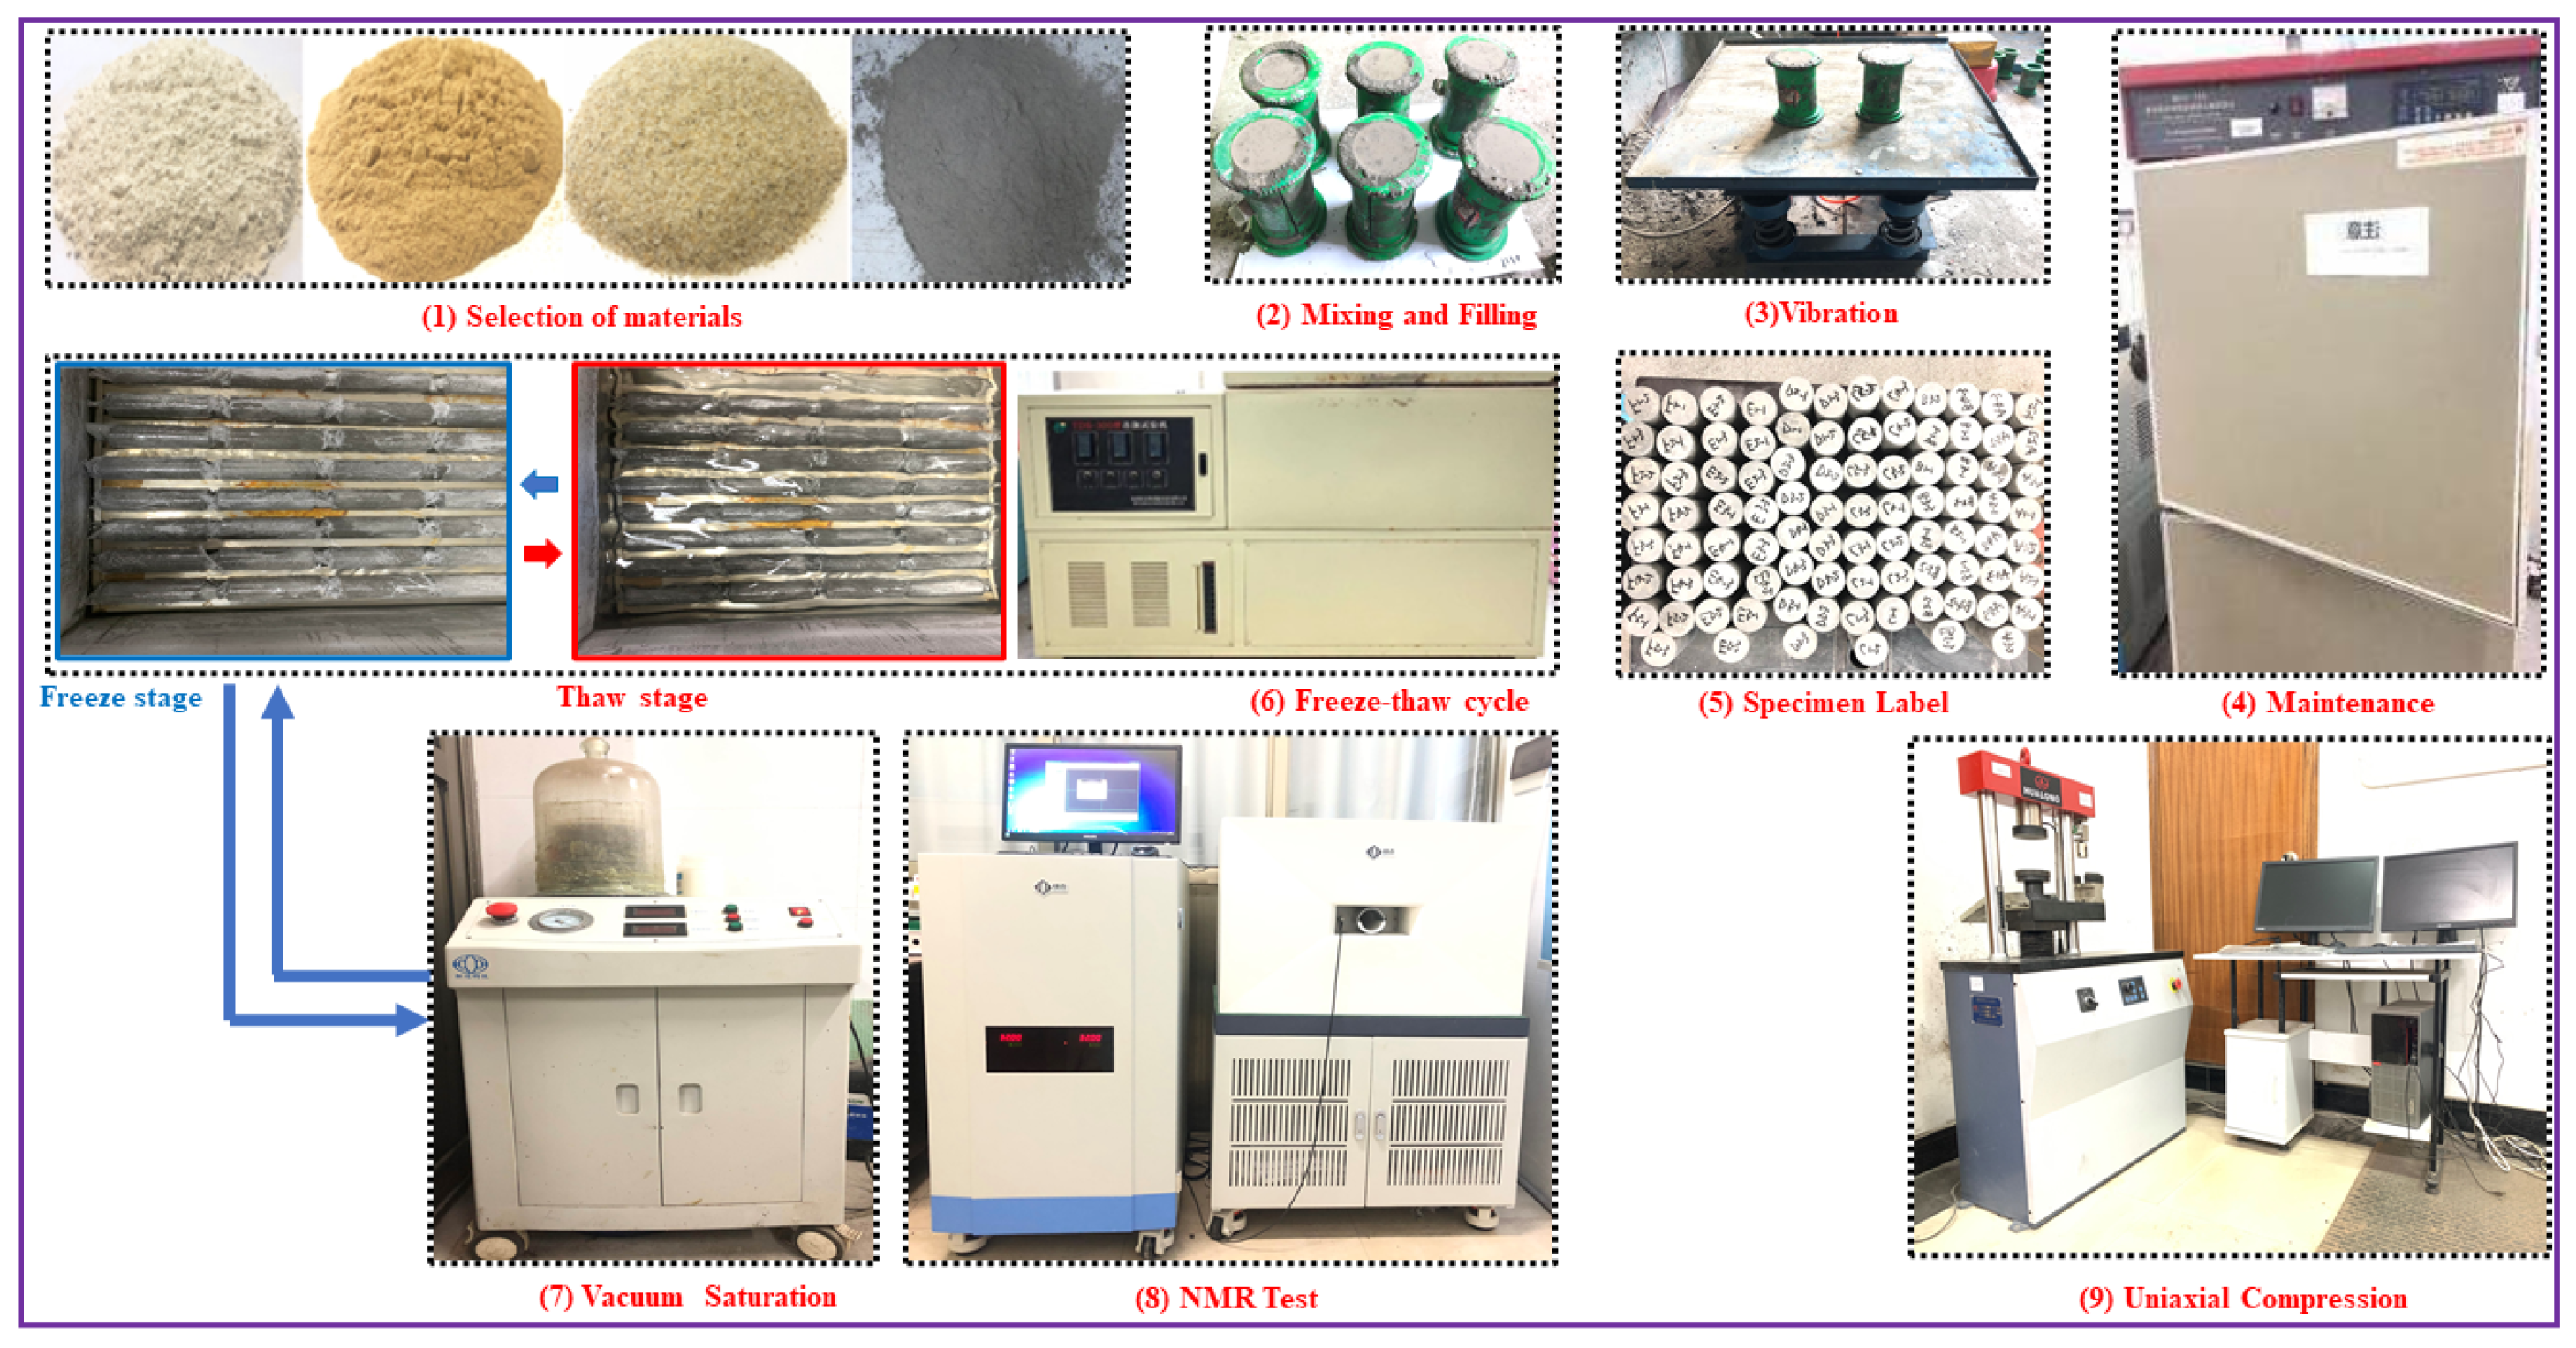
Figure 1. Test procedure.
Fractalfract 09 00534 g001
Figure 2. Pore division results.
Fractalfract 09 00534 g002
Figure 3. Fractal dimension calculation.
Fractalfract 09 00534 g003
Figure 4. The effect of F-T cycles on microporous structure. (a) The effect of F-T cycles on magnetic resonance T2 distribution; (b) the effect of F-T cycles on porosity; (c) the effect of F-T cycles on pore volume fraction at different radii; (d) the effect of F-T cycles on the proportion of pores of different radii.
Fractalfract 09 00534 g004
Figure 5. The effect of F-T cycles on different fractal dimensions. (a) The effect of F-T cycles on the fractal dimension of micropores; (b) the effect of F-T cycles on the fractal dimension of mesopores; (c) the effect of F-T cycles on the fractal dimension of macropores.
Fractalfract 09 00534 g005
Figure 6. The effect of F-T cycles on mechanical properties. (a) The effect of F-T cycles on stress–strain curves; (b) the effect of F-T cycles on UCS; (c) the effect of F-T cycles on peak secant modulus; (d) the effect of F-T cycles on peak strain.
Fractalfract 09 00534 g006
Figure 7. The mechanism of F-T cycles on the microporous structure of sandstone.
Fractalfract 09 00534 g007
Figure 8. Fitting results of different porosity and uniaxial strength under F-T cycles. (a) Fitting results for mesopore porosity and uniaxial strength; (b) fitting results for macropore porosity and uniaxial strength.
Fractalfract 09 00534 g008
Figure 9. Fitting results of different fractal dimension and uniaxial strength under F-T cycles. (a) Fitting results for mesopore fractal dimension and uniaxial strength; (b) fitting results for macropore fractal dimension and uniaxial strength.
Fractalfract 09 00534 g009
Figure 10. The mechanism of interaction between microscopic structure and macroscopic strength under F-T cycling.
Fractalfract 09 00534 g010
Figure 11. The relationship between the number of F-T cycles and the microporous structure and macroscopic mechanical parameters of sandstone. (a) Fitting relationship between F-T cycle number and porosity for different radii; (b) fitting relationship between F-T cycle number and changes in different fractal dimensions; (c) fitting relationship between F-T cycle number and relative change in UCS.
Fractalfract 09 00534 g011
Figure 12. The F-T deterioration model based on different microstructural parameters. (a) The uniaxial strength F-T deterioration model based on mesopore porosity; (b) the uniaxial strength F-T deterioration model based on macropore porosity; (c) the uniaxial strength F-T deterioration model based on the mesopore fractal dimension; (d) the uniaxial strength F-T deterioration model based on the macropore fractal dimension.
Fractalfract 09 00534 g012
Table 1. Detailed parameters of raw materials.
MaterialTraitsMain IngredientsParticle SizeDensity (g/cm3)
Portland cementTaupe powder3CaO·SiO22CaO·SiO23CaO·Al2O34CaO·Al2O3·Fe2O3--
52.8%20.7%11.5%8.8%
Quartz sandYellow and white particlesQuartz > 99%0.5–1.0 mm1.49
Naphthalene water reductionBrow–yellow powderβ-Naphthalene sulfonate sodium formaldehyde condensate--
Silica fumesWhite powderSiO2 > 99%1 µm2.2–2.6
Disclaimer/Publisher’s Note: The statements, opinions and data contained in all publications are solely those of the individual author(s) and contributor(s) and not of MDPI and/or the editor(s). MDPI and/or the editor(s) disclaim responsibility for any injury to people or property resulting from any ideas, methods, instructions or products referred to in the content.