Article

Pore Evolution and Fractal Characteristics of Marine Shale: A Case Study of the Silurian Longmaxi Formation Shale in the Sichuan Basin

1
School of Geoscience and Technology, Southwest Petroleum University, Chengdu 610500, China
2
College of Energy (College of Modern Shale Gas Industry), Chengdu University of Technology, Chengdu 610059, China
*
Author to whom correspondence should be addressed.
Fractal Fract. 2025, 9(8), 492; https://doi.org/10.3390/fractalfract9080492
Submission received: 31 May 2025 / Revised: 14 July 2025 / Accepted: 15 July 2025 / Published: 28 July 2025

Abstract

The Silurian marine shale in the Sichuan Basin is currently the main reservoir for shale gas reserves and production in China. This study investigates the reservoir evolution of the Silurian marine shale based on fractal dimension, quantifying the complexity and heterogeneity of the shale’s pore structure. Physical simulation experiments were conducted on field-collected shale samples, revealing the evolution of total organic carbon, mineral composition, porosity, and micro-fractures. The fractal dimension of shale pore was characterized using the Frenkel–Halsey–Hill and capillary bundle models. The relationships among shale components, porosity, and fractal dimensions were investigated through a correlation analysis and a principal component analysis. A comprehensive evolution model for porosity and micro-fractures was established. The evolution of mineral composition indicates a gradual increase in quartz content, accompanied by a decline in clay, feldspar, and carbonate minerals. The thermal evolution of organic matter is characterized by the formation of organic pores and shrinkage fractures on the surface of kerogen. Retained hydrocarbons undergo cracking in the late stages of thermal evolution, resulting in the formation of numerous nanometer-scale organic pores. The evolution of inorganic minerals is represented by compaction, dissolution, and the transformation of clay minerals. Throughout the simulation, porosity evolution exhibited distinct stages of rapid decline, notable increase, and relative stabilization. Both pore volume and specific surface area exhibit a trend of decreasing initially and then increasing during thermal evolution. However, pore volume slowly decreases after reaching its peak in the late overmature stage. Fractal dimensions derived from the Frenkel–Halsey–Hill model indicate that the surface roughness of pores (D1) in organic-rich shale is generally lower than the complexity of their internal structures (D2) across different maturity levels. Additionally, the average fractal dimension calculated based on the capillary bundle model is higher, suggesting that larger pores exhibit more complex structures. The correlation matrix indicates a co-evolution relationship between shale components and pore structure. Principal component analysis results show a close relationship between the porosity of inorganic pores, microfractures, and fractal dimension D2. The porosity of organic pores, the pore volume and specific surface area of the main pore size are closely related to fractal dimension D1. D1 serves as an indicator of pore development extent and characterizes the changes in components that are “consumed” or “generated” during the evolution process. Based on mineral composition, fractal dimensions, and pore structure evolution, a comprehensive model describing the evolution of pores and fractal dimensions in organic-rich shale was established.

1. Introduction

In recent years, China’s marine shale gas research has progressively advanced into deeper strata, yielding promising outcomes in exploration and development [1,2]. Shale is an unconventional hydrocarbon system, serving as both source and reservoir. It has diverse origins, a wide pore size distribution, and complex nanopore structures [2,3]. Nanopores affect gas occurrence. However, their low porosity, poor permeability, and limited connectivity restrict economic viability and the EUR of individual wells [4,5]. Most marine shale reservoirs in China have undergone complex processes of sedimentary burial, diagenesis, hydrocarbon generation, and tectonic transformation, resulting in significant differences in pore structure characteristics and enrichment mechanisms of shale reservoirs. Teng et al. [6] noted that Silurian shale in the Sichuan Basin experienced similar early burial and hydrocarbon generation followed by varied uplift affecting gas accumulation and preservation. Wei et al. [7] found that in deep shale reservoirs, porosity stays stable, but pore size and connectivity decline. They highlighted quartz-supported pore preservation and overpressure as key to reservoir quality. Wang et al. [8] emphasized that during uplift and evolution, higher overpressure leads to more stable pore structures, increased pore roundness, and enhanced storage capacity. The formation and evolution of organic-rich shale reservoirs are influenced not only by diagenesis but also by the hydrocarbon generation process of organic matter [9,10]. Research on the coupling evolution of hydrocarbon generation, diagenesis, and nanometer-scale porosity is crucial for understanding shale reservoir evolution, and understanding shale gas accumulation mechanisms is essential for promoting further exploration and development efforts [11,12].
Fractal theory offers a quantitative approach to describing the complex pore structures of shale reservoirs and has seen broad application in unconventional reservoir investigations [13,14]. The application of fractal theory in reservoir studies typically involves tools like the field emission-scanning electron microscope (FE-SEM), low-temperature nitrogen adsorption (LTNA), mercury intrusion porosimetry (MIP), and nuclear magnetic resonance (NMR) [15,16]. Models like Frenkel–Halsey–Hill (FHH), Brunauer–Emmett–Teller (BET), and the Menger sponge have been introduced and applied to diverse unconventional reservoirs. Avnir et al. [17] applied the Frenkel–Halsey–Hill (FHH) model to N2 adsorption data, characterizing the fractal nature of mesopores and micropores based on capillary condensation theory. Neimark and Unger [18] proposed a method to identify surface fractality based on nitrogen adsorption, applicable to pore sizes ranging from 1 to 100 nm. Pfeifer et al. [19] extended the traditional BET model by incorporating the fractal dimension (D) to better capture the influence of complex pore structures on adsorption behavior. Karl Menger’s [20] concept of the Menger sponge provides a fractal geometric model to describe heterogeneous pore distributions in shale and similar porous materials, offering a fundamental framework for understanding adsorption and fluid flow processes. Additionally, some researchers have used fractal dimensions to conduct mathematical analyses on pore structures and shale components, among other parameters. This approach helps identify the features and controlling factors of fractal dimensions, allowing for the development of evaluation models for the homogeneity of reservoir porosity. Chang et al. [21] showed that maceral type and maturity strongly influence pore structure and complexity in marine and continental shales. Clay minerals affect pore characteristics differently; illite content correlates positively with specific surface area (SSA) and pore volume (PV), enhancing pore roughness and heterogeneity. Li et al. [22] used a fractal analysis based on N2 adsorption and imaging to find that pore structures in shales are controlled by kerogen type, diagenesis, and matrix composition. Li et al. [23] revealed that the fractal characteristics of macropores are primarily controlled by mineral composition, while the heterogeneity of micropores and mesopores is mainly influenced by the enrichment level of organic carbon and the development scale of organic pores. Research methods for studying reservoir evolution are mainly divided into two types: direct observation and physical simulation. Direct observation involves selecting outcrop or downhole samples from different maturity or diagenetic stages and analyzing them with high-resolution instruments to reveal evolutionary differences [24,25,26]. However, this method is affected by regional sampling variations, sample heterogeneity, and researcher subjectivity. In contrast, physical simulation uses low-maturity samples and subjects them to controlled temperature and pressure to induce hydrocarbon generation. This produces samples at different evolutionary stages, reduces heterogeneity effects, and offers a clearer understanding of pore evolution during reservoir development [9,27,28].
The Longmaxi Formation deep shale reservoir features high pressure, high porosity, and a high gas content, indicating strong resource potential [1,29]. In this study, mature shale samples from the Silurian Formation were selected for thermal simulation under reservoir conditions. The simulated samples were analyzed using a series of techniques, including TOC, mineral composition, FB-SEM, LTNA, MIP, and NMR. Fractal analysis was used to characterize the pore structures of the sample. The present study aims to comprehensively investigate the evolution of shale components, pore structures, and fractal characteristics during thermal maturation. By conducting detailed correlation analyses, this work explores how mineral and organic matter influence the development of nanopores, and further reveals the coupled relationships among diagenesis, organic matter thermal evolution, and pore evolution. To deepen an understanding of pore system complexity, a principal component analysis (PCA) is employed to examine the interrelations between pore structure parameters and their fractal dimensions, thereby identifying the dominant factors governing fractal behavior. Ultimately, a unified model is proposed to describe the evolution of pores and fractal dimensions throughout the burial and maturation history. This work offers new insights into the mechanisms driving pore structure transformation and heterogeneity across different stages of shale reservoir development, contributing to a more accurate characterization of shale reservoir quality.

2. Geological Setting

During the Late Ordovician to Early Silurian period, the Sichuan Basin and adjacent regions underwent alternating uplift events involving the Central Sichuan and Qianzhong-Xuefeng paleo-uplifts. This tectonic framework created a semi-enclosed, stagnant marine basin within the ‘three uplifts and one depression’ setting (Figure 1a). Between these ancient uplifts, a semi-closed stagnant marine basin developed, with two subsidence centers forming in the southern Sichuan Weiyuan-Changning area and the eastern Sichuan Fuling-Jiaoshiba area, where organic-rich Ordovician-Silurian shales were deposited [30]. Influenced by two global marine transgressions, the Silurian marine shale deposition formed a sedimentary sequence characterized by progressively shallowing waters, coarser rock grain sizes, and lighter colors (Figure 1b) [31]. During the marine shale deposition period, organic-rich black shales in deep- to semi-deep shelf facies were widely developed and had a stable planar distribution [29]. The lithology primarily consists of siliceous and calcareous siliceous shales, providing the primary material basis for shale gas generation and storage. These strata are currently the main focus of shale gas exploration in the Sichuan Basin and its surrounding areas [3].

3. Sample and Method

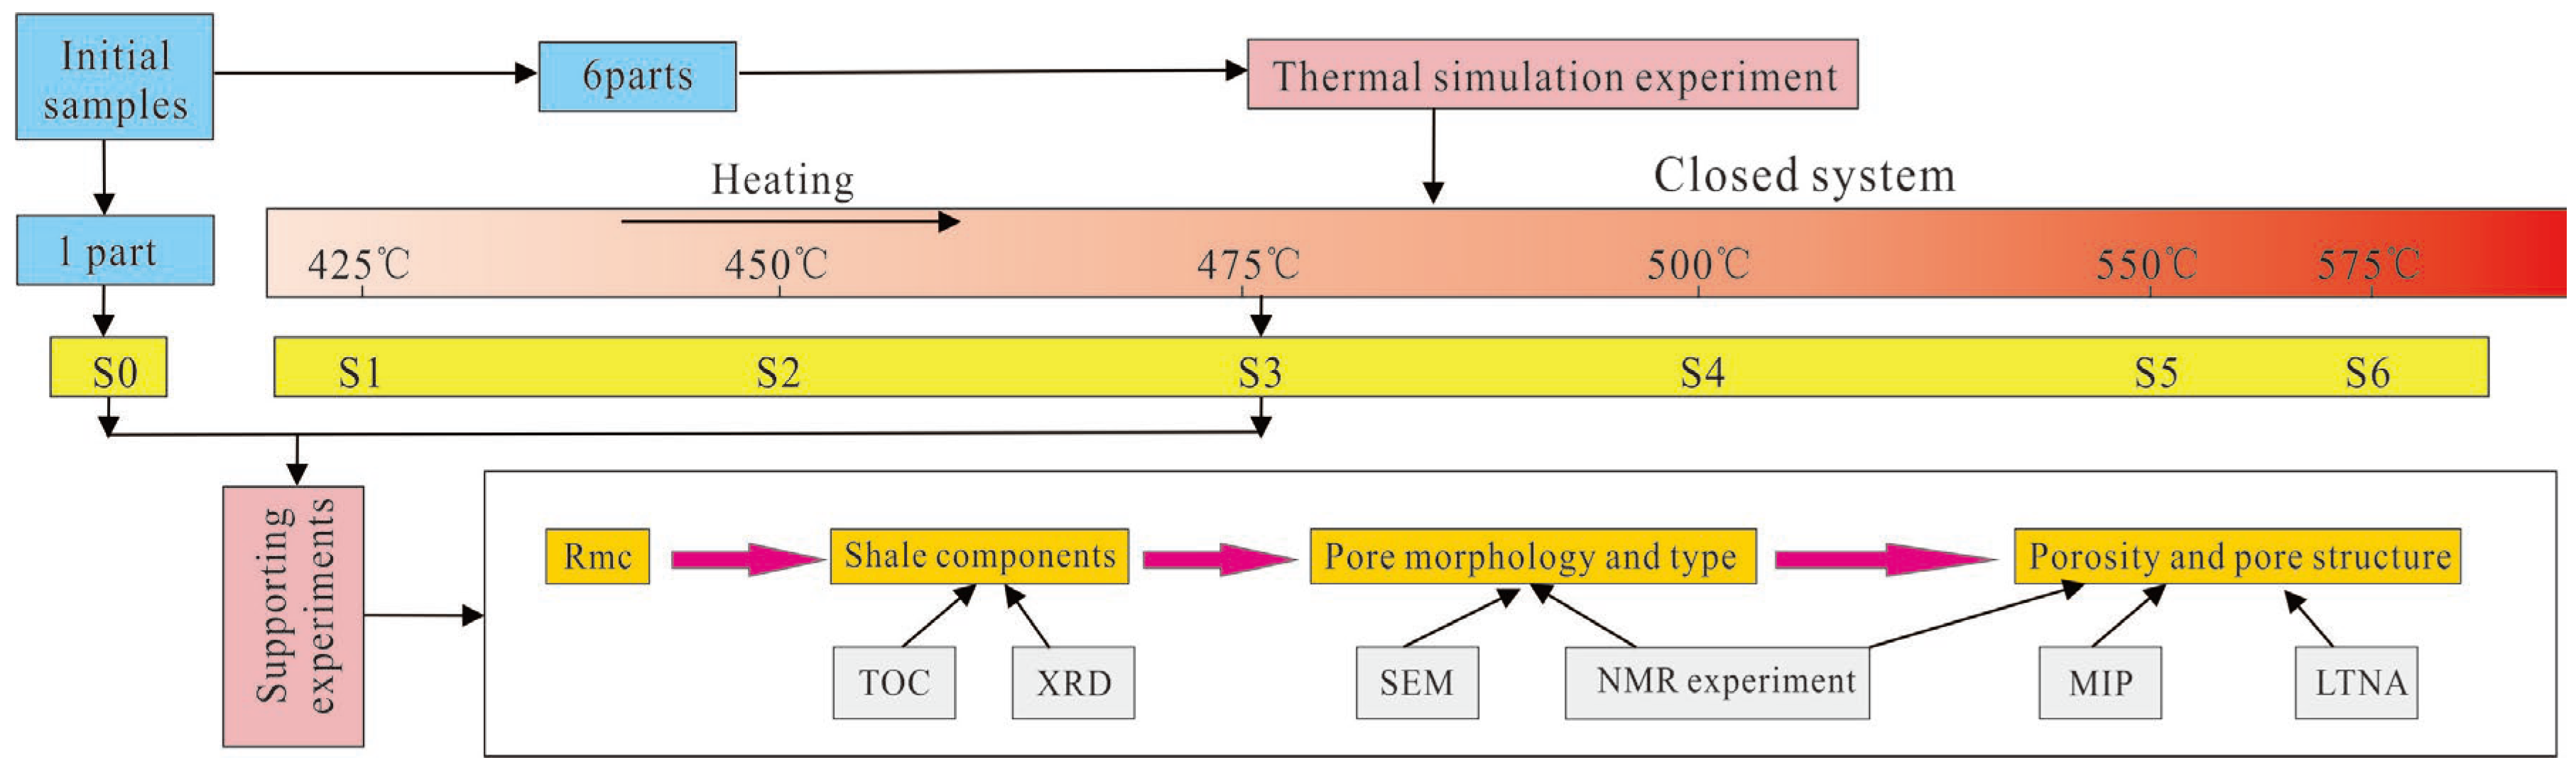
3.1. Samples and Simulation Experiment

The Longmaxi Formation shale in the Chengkou field outcrop was selected for thermal simulation experiments [33]. The original field sample (S0) is black organic-rich shale, with a TOC of 3.24% and a great potential for hydrocarbon generation. The vitrinite reflectance converted based on Raman spectroscopy (Rmc) is 1.18%, which is in the middle stage of maturity [34].
The hydrocarbon generation potential and capacity of organic-rich marine shale were simulated using a closed system. The diagenetic simulation experiments were conducted using the pore-thermal pressure hydrocarbon generation simulator developed by the Wuxi Research Institute of Petroleum Geology, Sinopec Petroleum Exploration and Production Research Institute (Wuxi, China). Detailed procedures and apparatus specifications are available in previous studies [35]. The samples were prepared in the laboratory following published procedures to simulate reservoir conditions. For each stage of the simulation experiment, the sample chamber contained one cylindrical core sample (6 cm × 2.5 cm × 2.5 cm) and block samples with volumes greater than 1 cm3. To prevent damage to the block samples, the remaining space was filled with powdered material finer than 100 mesh. After placing the samples, the autoclave was filled with deionized water to ensure fluid saturation through water absorption. A programmed increase in temperature and pressure was then applied to simulate the diagenesis and pore evolution of shale under continuous burial conditions. The experiment produced six sets of samples corresponding to different temperature–pressure gradients (Table 1).
Given that the least mature Longmaxi Formation shales exposed in the Sichuan Basin have already reached the mature stage, the six samples used in this study were obtained through thermal simulation to represent the post-mature evolution of the shale. Although the sample size is limited, all specimens were derived from the same natural outcrop and span a range of thermal maturity stages, allowing for a reasonable approximation of the Longmaxi shale’s diagenetic evolution under natural conditions.

3.2. Supporting Experiments

A series of complementary analytical tests, including Rmc, TOC, mineral composition, NMR, MIP, and LTNA, were performed with varying maturity levels (Figure 2). An Rmc analysis was conducted by measuring the Raman spectral peak distance and calculating it using the formula 0.0537 × d (G-D) − 11.21 [36]. TOC was analyzed with the CS-230 carbon–sulfur instrument (Guangzhou, China). X-ray Diffraction (XRD) was performed at the Research Institute of Petroleum Exploration and Development, using a Rigaku X-ray diffractometer (Beijing, China). FE-SEM was carried out at the China University of Petroleum with a ZEISS Crossbeam 540 (Beijing, China), which offers a maximum resolution of 0.9 nm. T2 NMR spectra were acquired using an NMRC 12-010V low-temperature nanopore analyzer from the Suzhou Niumag analytical instrument corporation (Suzhou, China). The measurements were conducted on dry samples, deionized water-saturated samples, dodecane-saturated samples, and Mn2+-saturated samples, following the methods and theory outlined in Yin et al. [37]. Surface area and pore distribution via LTNA were analyzed using the Autosorb-IQ3 system from Quantachrome Instruments (Waltham, MA, USA), with measurements conducted at Southwest Petroleum University, China. An HPMI (High Pressure Mercury Intrusion) analysis was carried out with the AutoPore IV 9520 from Micromeritics Instruments (Norcross, GA, USA), tested at China University of Geosciences (Wuhan, China).

3.3. Fractal Dimension Analysis

3.3.1. LTNA Data with FHH Model

The fractal dimension serves as a robust parameter to characterize pore space complexity, surface irregularity, and heterogeneity in rock formations [23,38]. Pfeifer et al. [19] introduced a modified FHH model that successfully captures the multiscale fractal nature of shale pore systems. This model describes the fractal characteristics of shale pore surfaces within the mesopore and micropore ranges by relating adsorption amounts to relative pressure through a power-law during multilayer adsorption. Additionally, methods based on capillary condensation are better suited for analyzing the heterogeneity of shale reservoirs [38]. The specific equation used for calculations based on LTNA data is provided below:
l n   V = C + ( D 3 ) l n   l n   P 0 / P
In Equation (1), P0 denotes the saturation vapor pressure (MPa), and V is the gas adsorption volume under the absolute pressure P (ml/g). D indicates the fractal dimension, and C represents a constant. When calculating D, it is obtained through a scatter plot fitting of ln (ln P0/P) and ln V. Fractal dimension values generally range from 2 to 3, with higher values indicating greater pore complexity and irregularity of shale pores. The double logarithmic curve frequently exhibits a clear inflection point, indicating different fractal dimensions corresponding to distinct adsorption stages [13,14]. In this study, the fractal dimension D1 is defined for the relative pressure range P/P0 = 0.01–0.45, corresponding to the low-pressure region where nitrogen adsorption occurs primarily as a monolayer. Thus, D1 reflects the roughness of the pore surfaces. For the relative pressure range P/P0 = 0.45–0.98, corresponding to the high-pressure region, the fractal dimension D2 is defined. In this range, nitrogen molecules undergo capillary condensation, and D2 characterizes the complexity of the pore space and pore structure within the reservoir.

3.3.2. HPMI Data with Capillary Bundle Model

In HPMI analysis, the capillary bundle model is widely adopted. This model simplifies the pore system as a collection of cylindrical capillaries with varying radii, enabling an effective estimation of fractal dimensions associated with pore-throat structures in the macropore range (>50 nm). Serving as the standard method for univariate fractal analysis in HPMI studies, the model has been extensively applied [38,39]. The calculation formula is given as follows:
log P c 1 S H g = D 3 × l o g   P c D 3 × l o g   P m i n
In Equation (2), SHg refers to the percentage of mercury volume intruded into shale pores (%), serving as an indicator of PV fraction. With Pc indicating capillary pressure (MPa), which can be converted to aperture, the above equation can be modified to
l o g   S = 3 D × l o g   r + D 3 × l o g   r m a x
In Equation (3), r and r m a x denote the pore radius and the largest pore radius (nm), respectively. S stands for the cumulative PV percentage corresponding to radius r. The fractal dimension D is derived from the slopes of l o g   S versus l o g   r . Due to the low precision of HPMI in measuring small pores, and considering the primary pore size range, the fractal dimension parameters (DM) was performed only on pores within 20 to 1000 nm. DM derived from HPMI fitting effectively characterize the complexity, connectivity, and heterogeneity of the pore system, enabling the classification and evaluation of reservoir pore structures.

4. Results

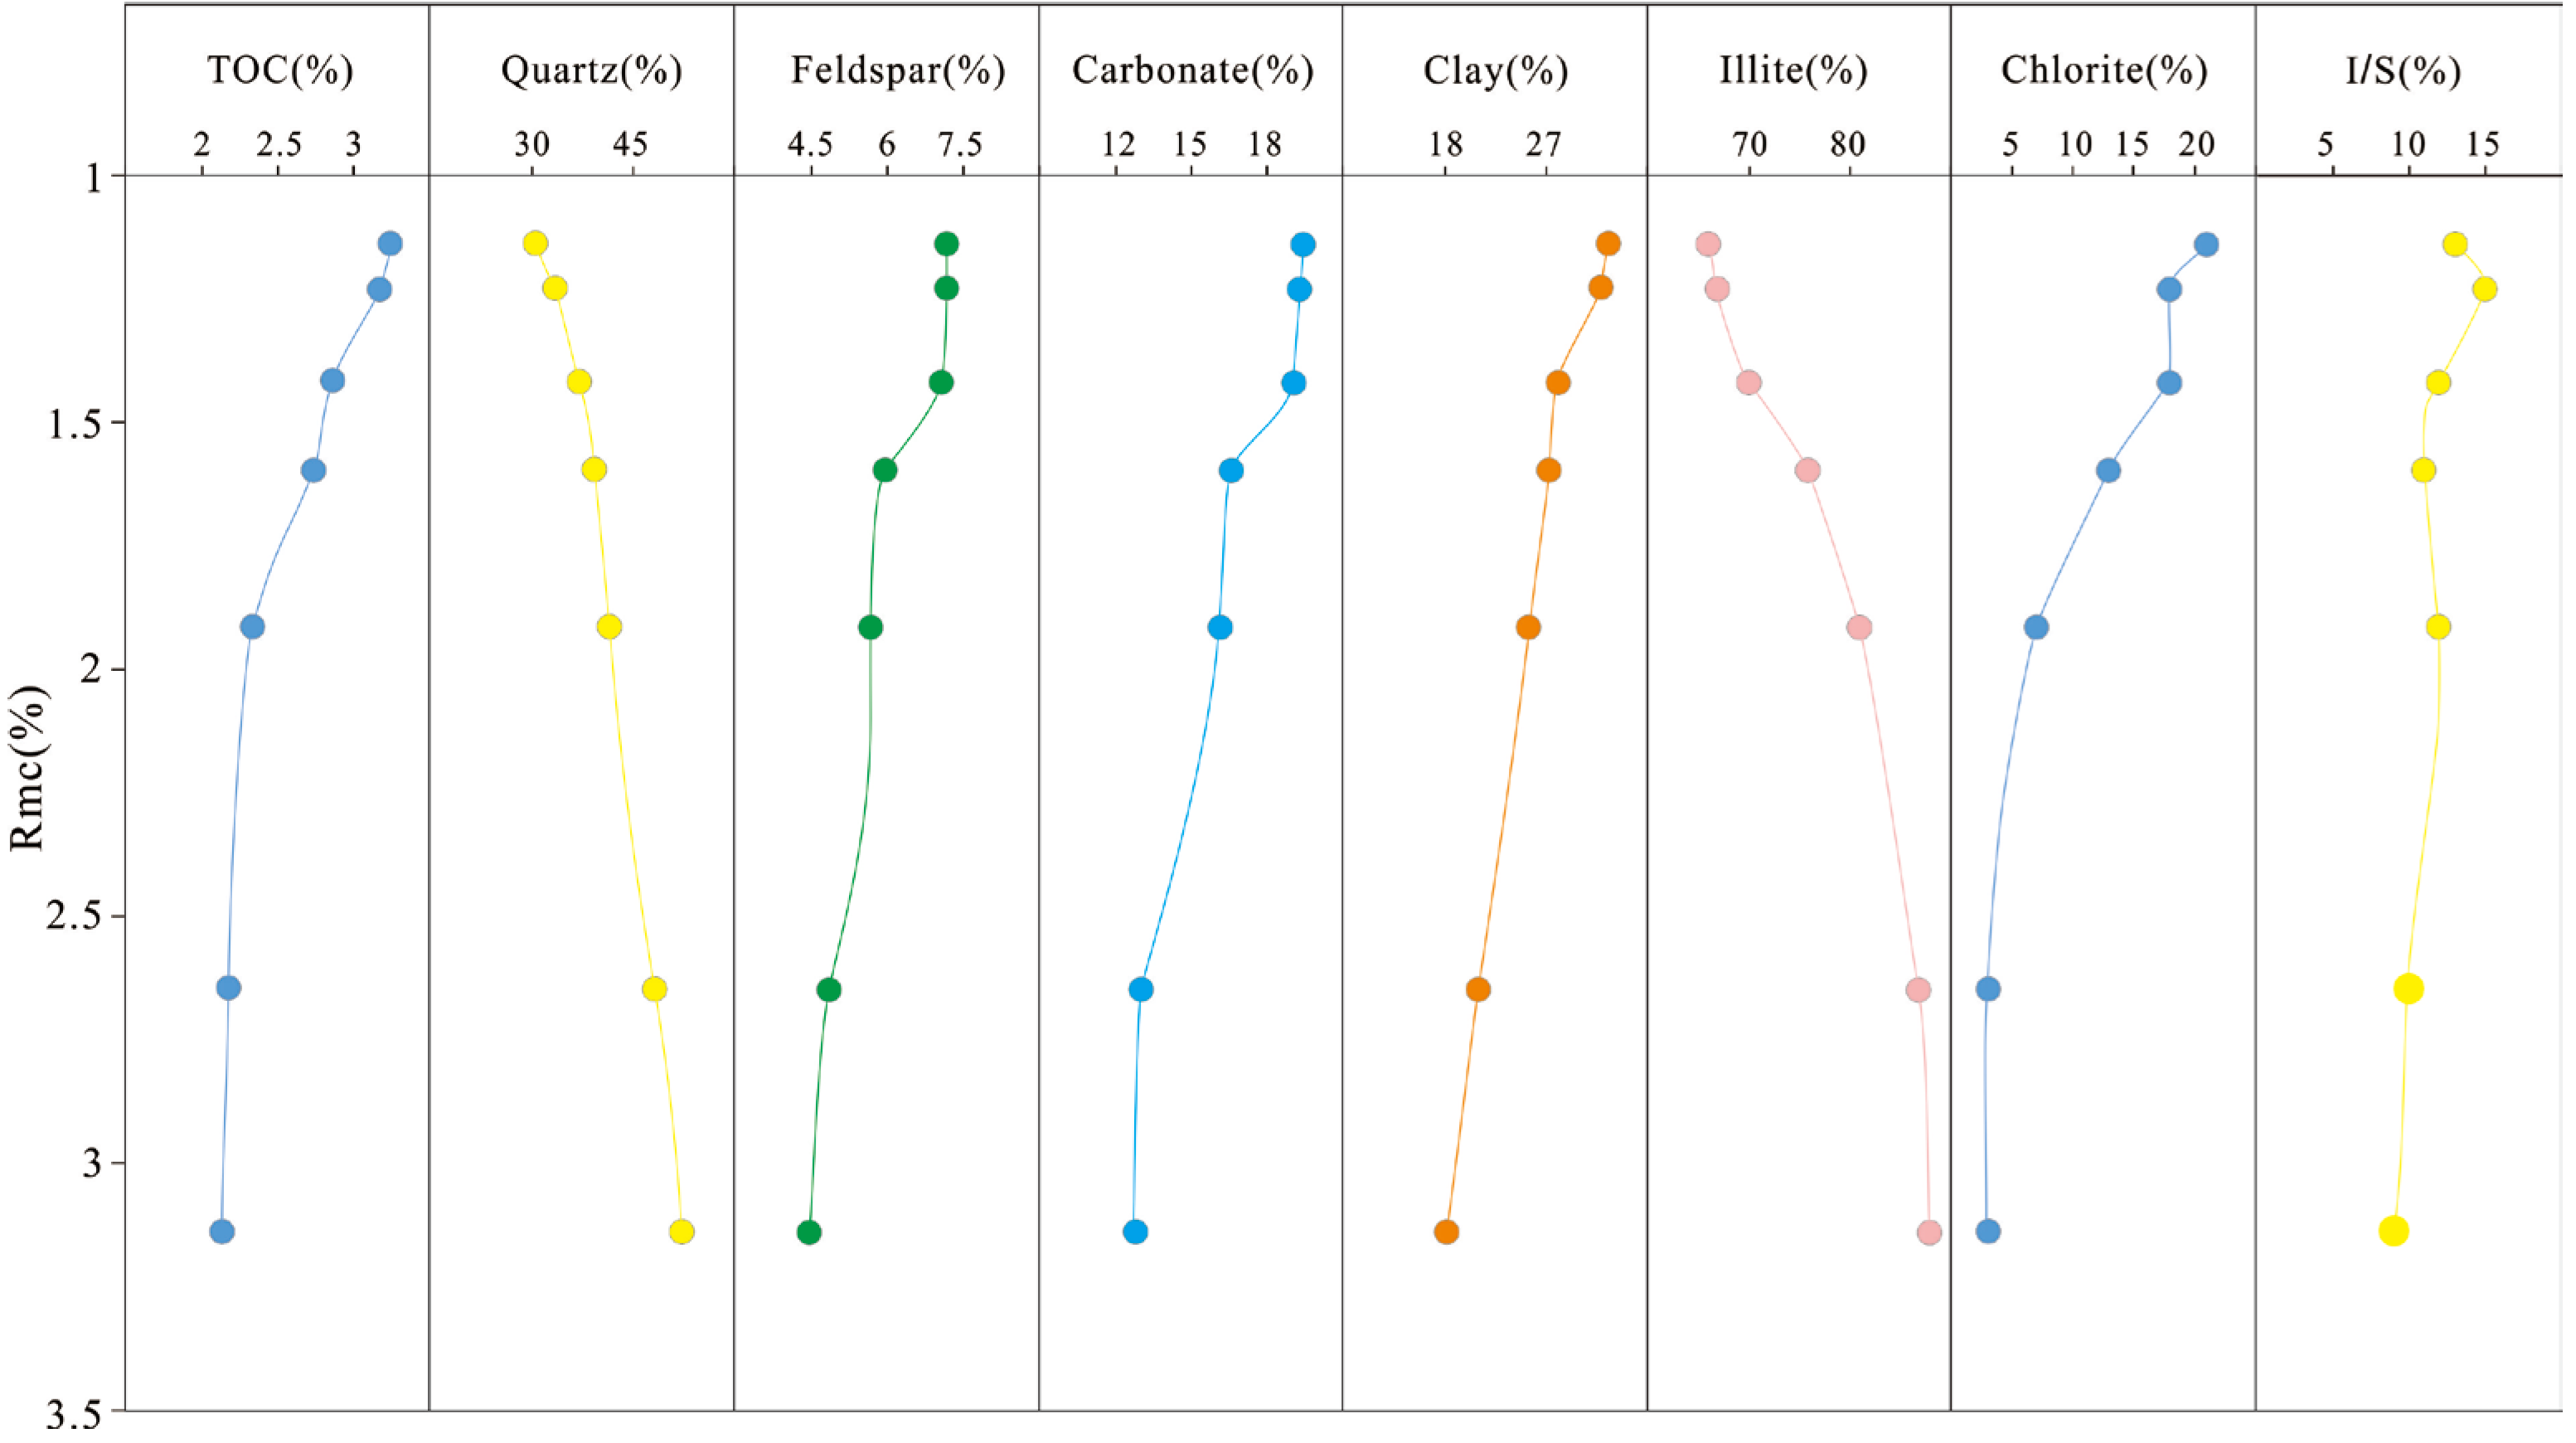
4.1. Evolution of TOC and Mineral Composition

With increasing thermal maturity, TOC tends to decline in accordance with the transformation of organic matter into hydrocarbons. When Rmc reaches 1.91%, a significant decrease in TOC is observed (Figure 3). This could be attributed to the extensive transformation of retained hydrocarbons into wet gas at the high maturity stage, with the consumption of retained hydrocarbons leading to a sharp decline in TOC [10,34].
The original sample is mainly composed of quartz (31.0%) and clay minerals (32.8%), followed by carbonate minerals (19.5%). Illite makes up the majority of the clay minerals (66.0%), followed by chlorite. As thermal maturation progresses, the quartz content gradually increases, rising from 31.0% in the initial sample to 52.4% (Figure 3). In contrast, the content of feldspar, carbonate minerals, and clay minerals gradually decreases. The decrease in clay content is the most significant, dropping from 32.0% in the original sample to 18.4%. Clay mineral evolution exhibits complex patterns. Illite content gradually increases from 66.0% to 88.0%, whereas chlorite experiences a sharp decline from 21.0% to 3.0%. The illite–smectite mixed-layer minerals decrease slightly over time (Figure 3).

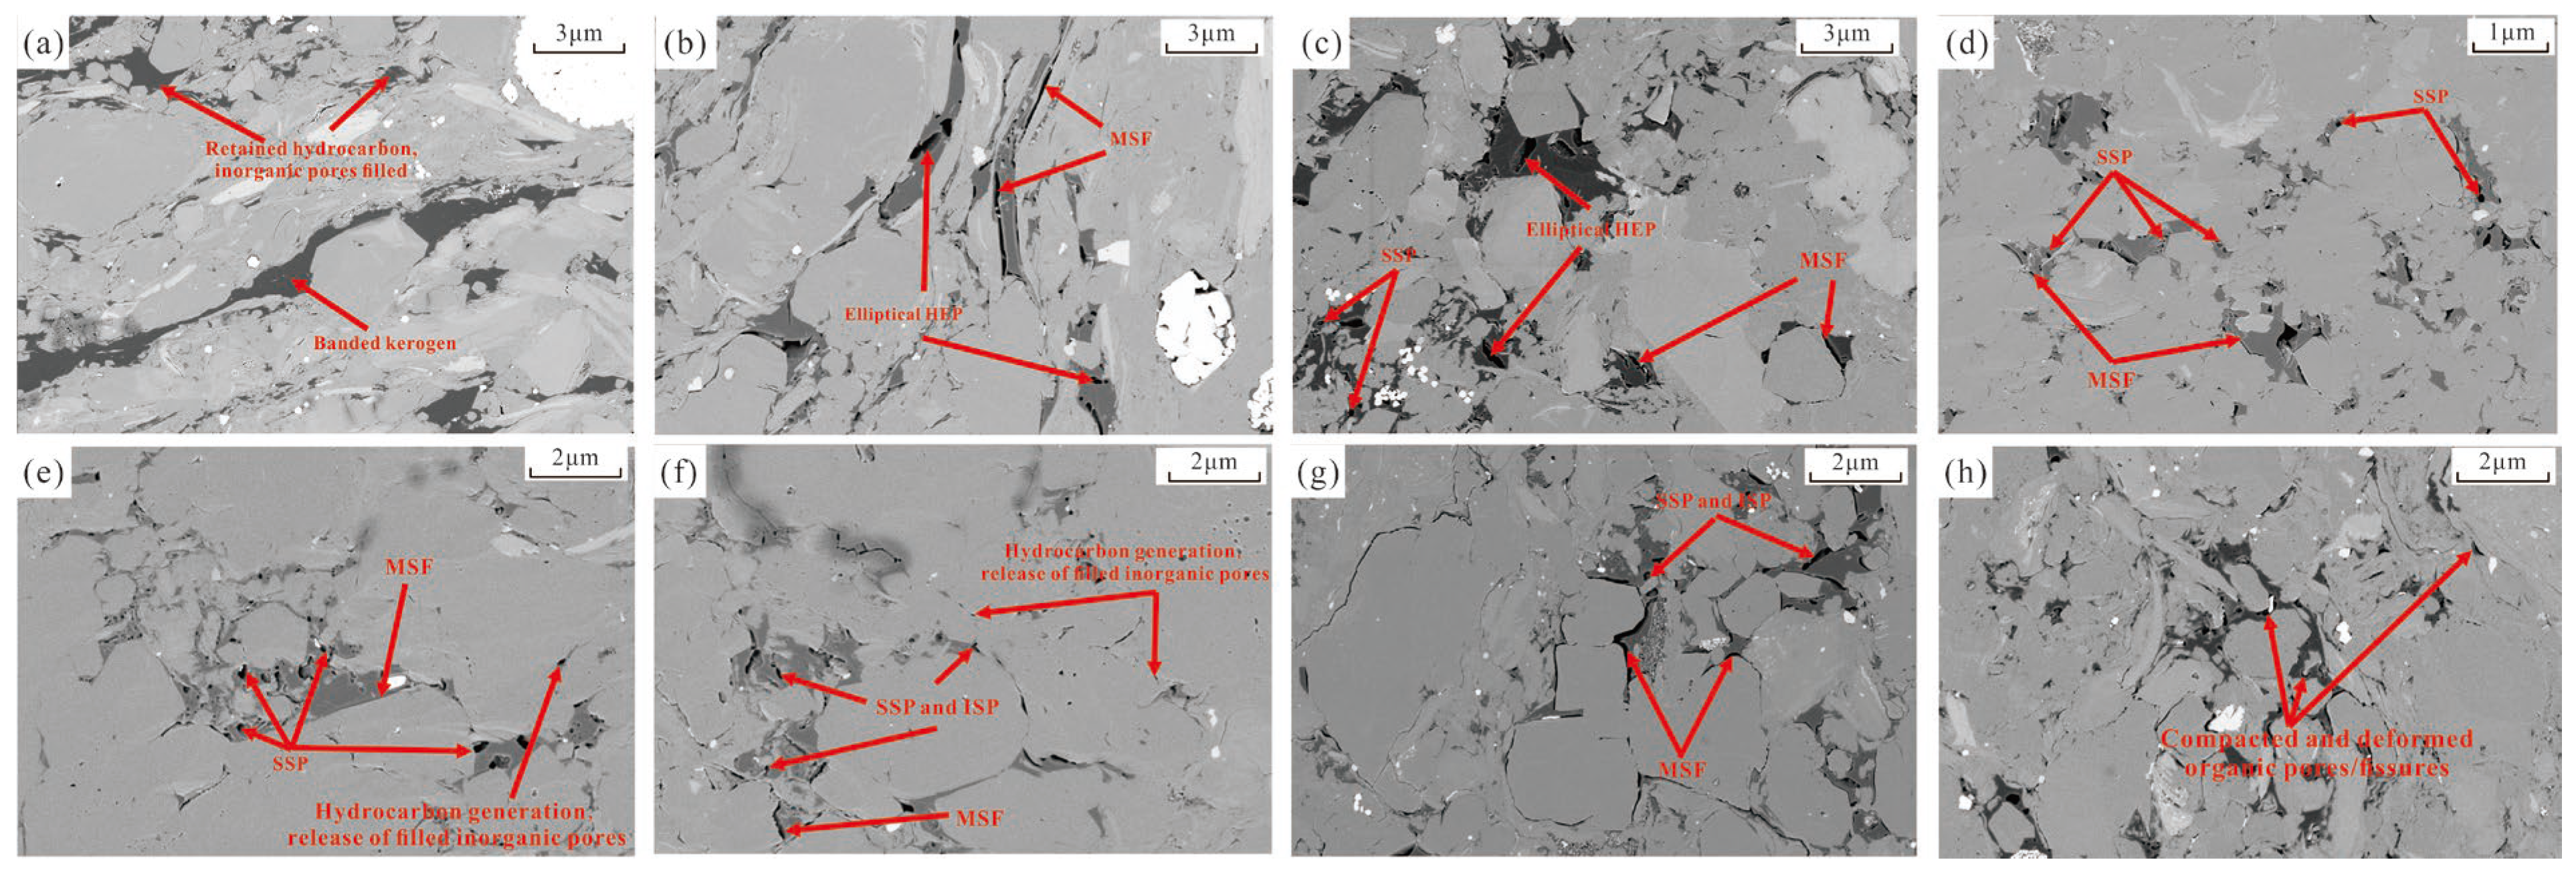
4.2. SEM Image Analysis and Pore Morphology

4.2.1. Organic Pores

The formation and characteristics of organic pores including their shape, size, and abundance are controlled by the amount, type, and maturity of organic matter [27,40]. In the early maturity stage, kerogen mainly appears in banded and fragmental forms. Retained hydrocarbons, along with their adsorption and swelling effects, inhibit the development of organic pores on kerogen surfaces and fill many inorganic pores (Figure 4a). As maturity increases, retained hydrocarbons begin to crack and expel from both kerogen surfaces and inorganic pores, leading to the formation of a small number of organic pores. These pores are typically larger, elliptical or flattened, and located at the edges or within the organic matter (Figure 4b). The expulsion of hydrocarbons also causes volume shrinkage, resulting in contraction fractures. At higher maturity stages, cracking intensifies, producing large volumes of gas. This process reopens earlier inorganic pores and generates more nano-scale organic pores with spherical or elliptical shapes (Figure 4c–f). Numerous narrow, irregular shrinkage fractures form along the edges of the organic matter (Figure 4d,e). As residual hydrocarbons and kerogen fragments continue to decompose, abundant spherical or irregular pores develop within the organic matter (Figure 4g,h). With further maturation, compaction enhances the formation of edge fractures, but when Ro reaches 3.2%, strong compaction leads to the deformation or closure of some pores and fractures (Figure 4h).

4.2.2. Inorganic Pores and Microfracture

Before organic matter matures, the initial sample shows well-developed inorganic pores, mainly residual intergranular pores between rigid minerals. During maturation, the presence of retained hydrocarbons inhibits further development of inorganic pores, as observed in SEM images (Figure 5a). Compaction causes clay minerals to deform, rapidly reducing interlayer pores and fractures (Figure 5b). At high maturity, organic acid generation leads to the dissolution of minerals such as calcite, feldspar, and pyrite, forming numerous dissolution pores and fractures (Figure 5c). In this acidic environment, chlorite alters, and feldspar and illite–smectite (I/S) transform into illite, accompanied by the formation of dissolution pores, authigenic quartz, and inter-clay mineral pores (Figure 5c–e). As hydrocarbon cracking intensifies, early-filled inorganic pores and fractures are released and further developed (Figure 5d). Meanwhile, clay minerals transform into authigenic microcrystalline quartz, primarily growing along pore edges, consistent with the observed increase in quartz content (Figure 5e,f). In the overmature stage, acidic conditions weaken, dissolution pores are limited. Continuous compaction compresses early pores, reducing their development, while microfractures become more developed (Figure 5g). At this late stage, unstable clays largely convert to stable illite. Flaky illite forms triangular support structures under compaction, generating a number of inter-clay mineral pores and fractures (Figure 5f–h).

4.3. Evolution of Shale Porosity and Pore Structures Parameter

4.3.1. Porosity Characterization

Based on the difference in wettability between organic and inorganic pores, the development of these pores is quantitatively characterized using NMR technology [41,42]. Since paramagnetic ions can accelerate the relaxation and attenuation rate of nuclear magnetic resonance in the aqueous phase, Mn2+ is used to shield the aqueous phase signal accordingly [43]. The specific procedure and its significance are shown in Figure 6. First, the shale sample was dried at 120 °C for 48 h, and the NMR transverse relaxation time (T2) spectrum of the dried sample was obtained. Subsequently, dodecane, deionized water, and saturated Mn2+ solution were saturated at a pressure of 30 MPa for 48 h. Then, the development characteristics of the microfractures were characterized by the part of the relaxation time greater than 100 ms in the T2 spectrum. Finally, the proportions of organic pores, inorganic pores, and micro-cracks in all the simulated samples were calculated (Figure 7).
The results indicate that the initial sample exhibits the highest porosity in inorganic pores at 4.27%, whereas organic pores account for a relatively small percentage. As thermal maturation progresses, the porosity of inorganic pores and microfractures rapidly decreases (Figure 7a). When Rmc reaches 1.91%, the porosity of all pore types gradually increases slightly (Figure 7a). The porosity of organic pores follows a “unimodal” distribution, with the highest development occurring when Rmc reaches 2.65%. The porosity of organic pores reaches 2.87%, accounting for 40.25% of the total porosity (Figure 7b). At the late of overmature stage, the porosity of organic pores decreases to some extent (Figure 7b). The evolution of porosity exhibits characteristics of three distinct stages (Figure 7c).

4.3.2. Pore Structure Parameter Characterization

The pore size distribution of the simulated samples was analyzed using both LTNA and HPMI techniques. LTNA was employed to characterize pores smaller than 50 nm, while HPMI was used for pores larger than 50 nm. The results indicate that the PV is distributed between 0.0015–0.0076 cm3/g (average 0.0045 cm3/g TOC), while the SSA varies from 0.37–3.34 m2/g (average 1.84 m2/g TOC). With increasing evolutionary stage, total PV and SSA first decline and then rise. However, PV gradually decreases after reaching a peak in the late overmature stage (Figure 8). This study classified pores into four diameter intervals (2–10 nm, 10–50 nm, 50–100 nm, and 100–1000 nm) to characterize PV and SSA changes. The simulation results showed that PV was dominated by pores sized 10–50 nm (Figure 8a), and SSA was mainly controlled by pores in the 5–10 nm and 10–50 nm ranges (Figure 8d).
As the thermal maturation increases, PV and SSA for most pore size ranges rapidly decrease before reaching the high maturity stage (Figure 8b,e). This is especially true for 2–10 nm pores (Figure 8c,f), which contribute significantly to total PV and total SSA. SSA reaches its lowest value of 0.37 m2/g in the late mature stage. Compared to the initial sample, pores smaller than 10 nm show a significant decrease (Figure 8c,f). In the early stages of high maturity, PV reaches its lowest value of 0.0015 cm3/g. In contrast to the initial sample, there is a notable decline in PV, with 10–50 nm pores being the main contributors. Throughout the mid to late high maturity stages, both PV and SSA show growth across all pore diameters, notably in pores sized 10–50 nm (Figure 8). In the early overmature stage, the PV of pores smaller than 50 nm continues to increase slowly, while the PV of pores larger than 100 nm decreases significantly (Figure 8b,c). In the late overmature stage, after reaching its peak, the total PV slightly decreases due to compaction effects. However, the SSA for all pore sizes gradually increases in the late overmature stage (Figure 8e).

4.4. Fractal Characteristics

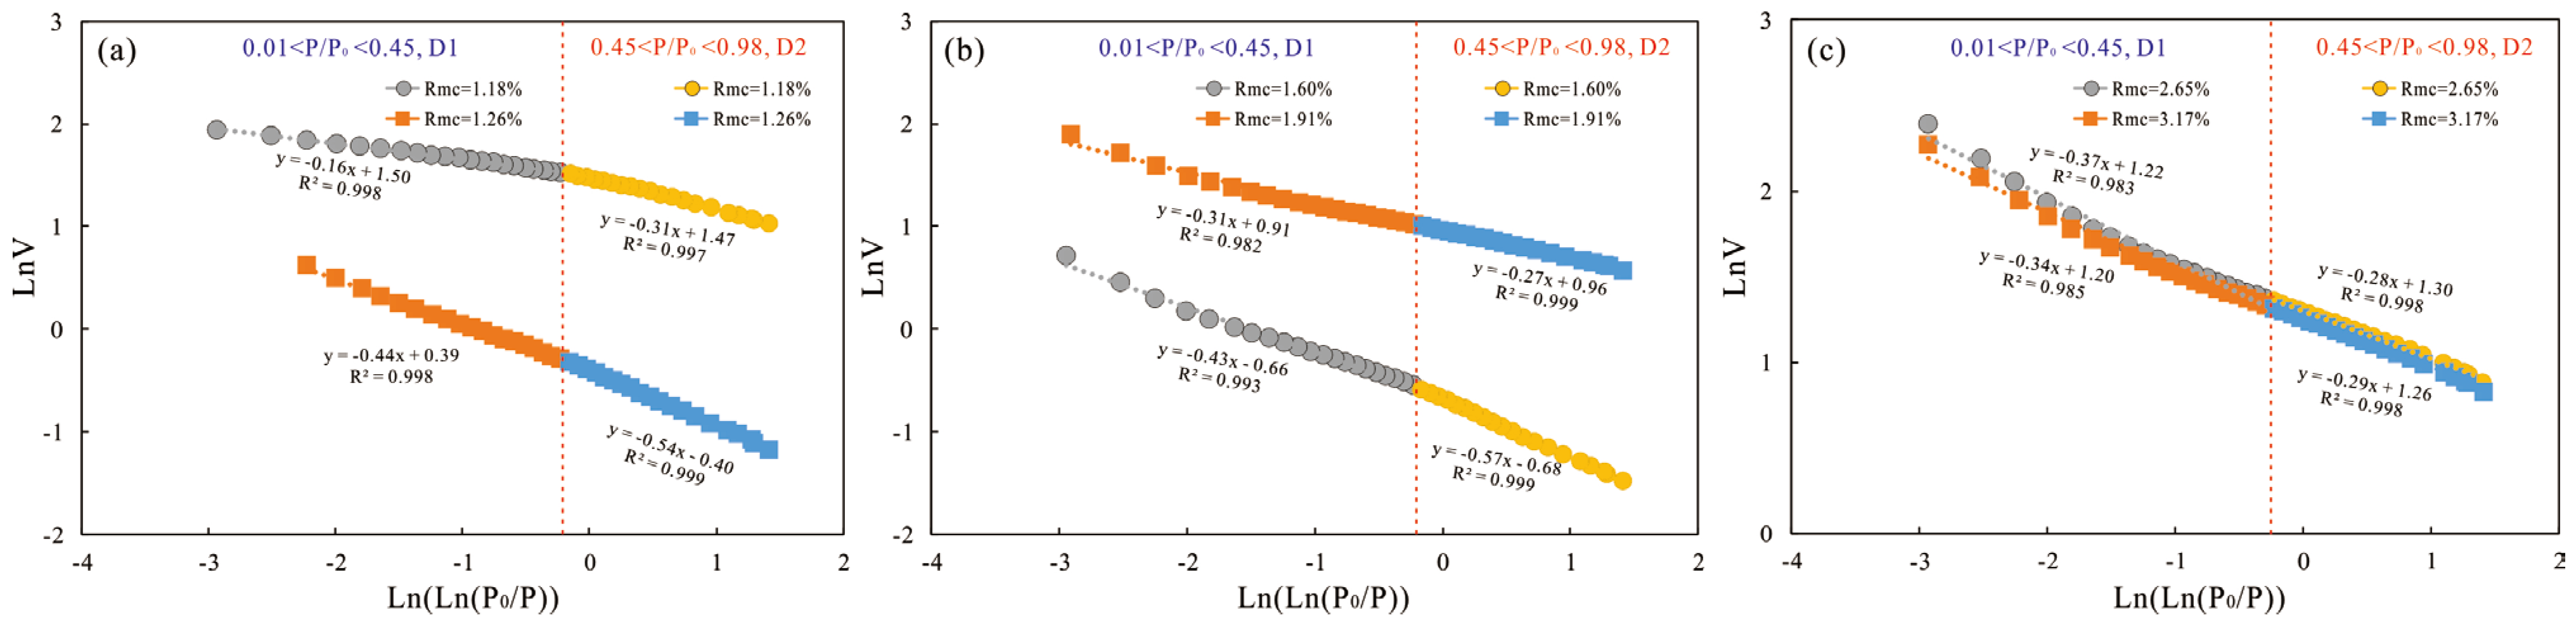
4.4.1. The Fractal Dimension Calculated by LTNA

According to the FHH model, the adsorption volume in samples varies logarithmically with P/P0 (Figure 9). When P/P0 ranges from 0.01 to 0.45 and from 0.45 to 0.98, two distinct adsorption characteristics are revealed, indicating that the pores in organic-rich shale exhibit a dual fractal nature. The fractal dimension D1 (P/P0 < 0.45) reflects the monomolecular and multimolecular adsorption and filling within the micropores [38]. D1 serves as an indicator of the pore surface’s irregularity, roughness, and complexity [13,39]. Gas molecules primarily undergo capillary condensation when P/P0 exceeds 0.45, and D2 reflects the complexity and irregularity of the pore space and structure. Calculation results indicate that D1 values for all shale samples vary between 2.43 and 2.73 (Table 2), averaging 2.62. D2 values range from 2.56 to 2.84, with a mean of 2.66. Both D1 and D2 fractal dimension models exhibit correlation coefficients exceeding 0.98, demonstrating pronounced fractal features in the pore structures of all samples. The average value of D2 calculated by the FHH model is greater than that of D1. At different maturities, the complexity of the internal pore structure is greater than the roughness of the pore surface.

4.4.2. The Fractal Dimension Calculated by HPMI

According to HPMI model fitting, cumulative PV and pore size display a logarithmic correlation. Two separate adsorption characteristics appear within the 20–50 nm and 50–1000 nm pore size intervals, reflecting the dual fractal properties of the shale samples (Figure 10). The DM values vary between 2.32 and 2.94. average 2.69, higher than that of D1 and D2, indicating greater complexity in larger pores.

5. Discussion

5.1. Shale Composition–Pore Structure Co-Evolution

To investigate the relationship between mineral composition, porosity, and pore structure, a correlation matrix was established (Figure 11). TOC exhibits a negative correlation with the porosity, PV, and SSA of 2–100 nm pores. This is attributed to the progressive consumption of organic matter and the formation of organic pores during thermal maturation, which enhances pore development. Additionally, retained hydrocarbons contribute to the release of previously filled inorganic pores. Additionally, during hydrocarbon generation, the substantial release of H+ ions from organic acids enhances inorganic diagenetic processes such as mineral dissolution and clay mineral transformation, thereby contributing to better reservoir pore development. Quartz content shows a strong positive correlation with the porosity, PV, and SSA of the dominant pore sizes. This is because quartz resists compaction during reservoir evolution, helping to preserve pores. In addition, authigenic quartz formed through mineral transformation further contributes to increased PV and SSA. Illite, formed by clay mineral transformation, also shows a positive correlation with pore structure parameters. In contrast, carbonate minerals, feldspar, and clay content are negatively correlated with PV and SSA. These minerals are typically dissolved or altered during diagenesis and participate in pore-enhancing reactions. Although they do not significantly increase inorganic pores or microfractures, they exhibit a strong negative correlation with organic pore porosity. This suggests that these minerals mainly serve as precursors for inorganic pore development during shale evolution.

5.2. Fractal Dimension Characteristics and Influencing Factors

5.2.1. Relationship Between Fractal Dimension and Pore Development Characteristics

PCA was used to explore the relationship between pore development characteristics and fractal parameters (D1, D2, DM) [44]. Six samples from different simulation stages were analyzed, with porosity, pore structure, and fractal dimensions as input variables. In Figure 12a, each original variable is represented by an arrow, where the direction and length indicate its loading on a principal component. The projection of an arrow onto a principal component axis reflects the strength and direction of its contribution. A negative projection indicates an inverse relationship, while the angle between arrows reflects correlations among variables [45].
As shown in Figure 12a, Principal Component 1 (PC1) explains 59.8% of the total variance, while PC2 explains 19.2%, indicating that PC1 captures the most variation. Variables marked in red have strong positive projections along the D1 axis, suggesting a close correlation with D1. Those in black are strongly associated with D2, while green variables relate to both D1 and D2. These results indicate that inorganic pore porosity and microfractures mainly influence pore complexity and irregularity, whereas organic pore porosity and the development of 10–100 nm pores mainly affect surface roughness and complexity. Greater pore development corresponds to a rougher and more intricate surface. Additionally, the PV and SSA of 2–10 nm pores affect both pore space complexity and surface characteristics. The relatively short arrow representing DM suggests it contributes little to describing heterogeneity in this context (Figure 12a).
Porosity, PV, and SSA of the dominant pore sizes show large and similar loading coefficients along the PC1 axis (Figure 12a), indicating a strong correlation with PC1. Their projections lie to the right of the origin, suggesting a positive relationship with PC1. Since these variables reflect pore development, PC1 can be interpreted as a proxy for the degree of pore development. D1 exhibits a strong positive projection on PC1, reflecting a significant positive correlation between D1 (surface roughness and irregularity) and pore development. In contrast, D2 shows a smaller projection length on PC1, implying that D2 (pore space complexity) is less indicative of pore development. For samples of different maturities, a larger projection length on PC1 corresponds to a higher score for that observation along PC1. Since PC1 represents the degree of pore development, samples S5 and S6 exhibit larger projection lengths on PC1. Samples S1 and S3, located to the left of the origin, display lower degrees of pore development.

5.2.2. Relationship Between Fractal Dimension and Shale Components

During the thermal evolution of organic-rich shale, the pore structure is influenced by changes in organic matter and the diagenetic alteration of inorganic minerals, which in turn affects the fractal dimension [26,40]. The PCA helps clarify how shale components relate to fractal parameters. As shown in Figure 12b, PC1 accounts for 72.1% of the variance, and PC2 explains 16.3%, indicating that PC1 captures the most critical features. D1 is located to the left of the origin, while D2 and DM are positioned to the right, suggesting that different shale components influence each fractal parameter differently. Quartz and illite show strong positive projections along D1, while variables in orange show strong negative projections, indicating a strong relationship with D1. Therefore, higher quartz and illite contents increase pore surface complexity and irregularity. Likewise, lower contents of TOC, feldspar, and carbonate minerals also correspond to higher D1 values. Feldspar is more closely associated with D2, suggesting that increased feldspar content enhances the complexity and irregularity of pore space.
Figure 12b shows that mineral components with large projection lengths at both ends of the PC1 axis dominate the features captured by PC1. Components on the right side represent “depletion” variables that decrease during pore structure evolution, while those on the left represent “generation” variables that increase. Thus, PC1 reflects changes in unstable components during shale pore evolution. D2 has a small positive projection and a low loading coefficient on PC1, indicating a weak correlation with component changes. In contrast, D1 has a large negative projection on PC1, suggesting it is more sensitive to variations in shale composition. This implies that D1 (pore surface roughness and irregularity) is negatively correlated with “depletion” components. DM, with a very short projection on PC1, shows a limited ability to capture the influence of mineral changes on fractal behavior. Among the samples, PC1 positively reflects the abundance of “depletion” components. Samples S0 and S1, located to the right of the origin, contain higher amounts of these components in early stages. In contrast, S5 and S6, positioned to the left, are richer in “generation” components.

5.3. Comprehensive Evolutionary Model

The results indicate that D1 effectively reflects both the degree of pore development and the “depletion” components in shale, such as TOC, carbonates, and feldspar. By integrating hydrocarbon generation, mineral composition, pore structure, and fractal characteristics [25,26], the pore evolution pattern of organic-rich shale is illustrated (Figure 13).
(1)
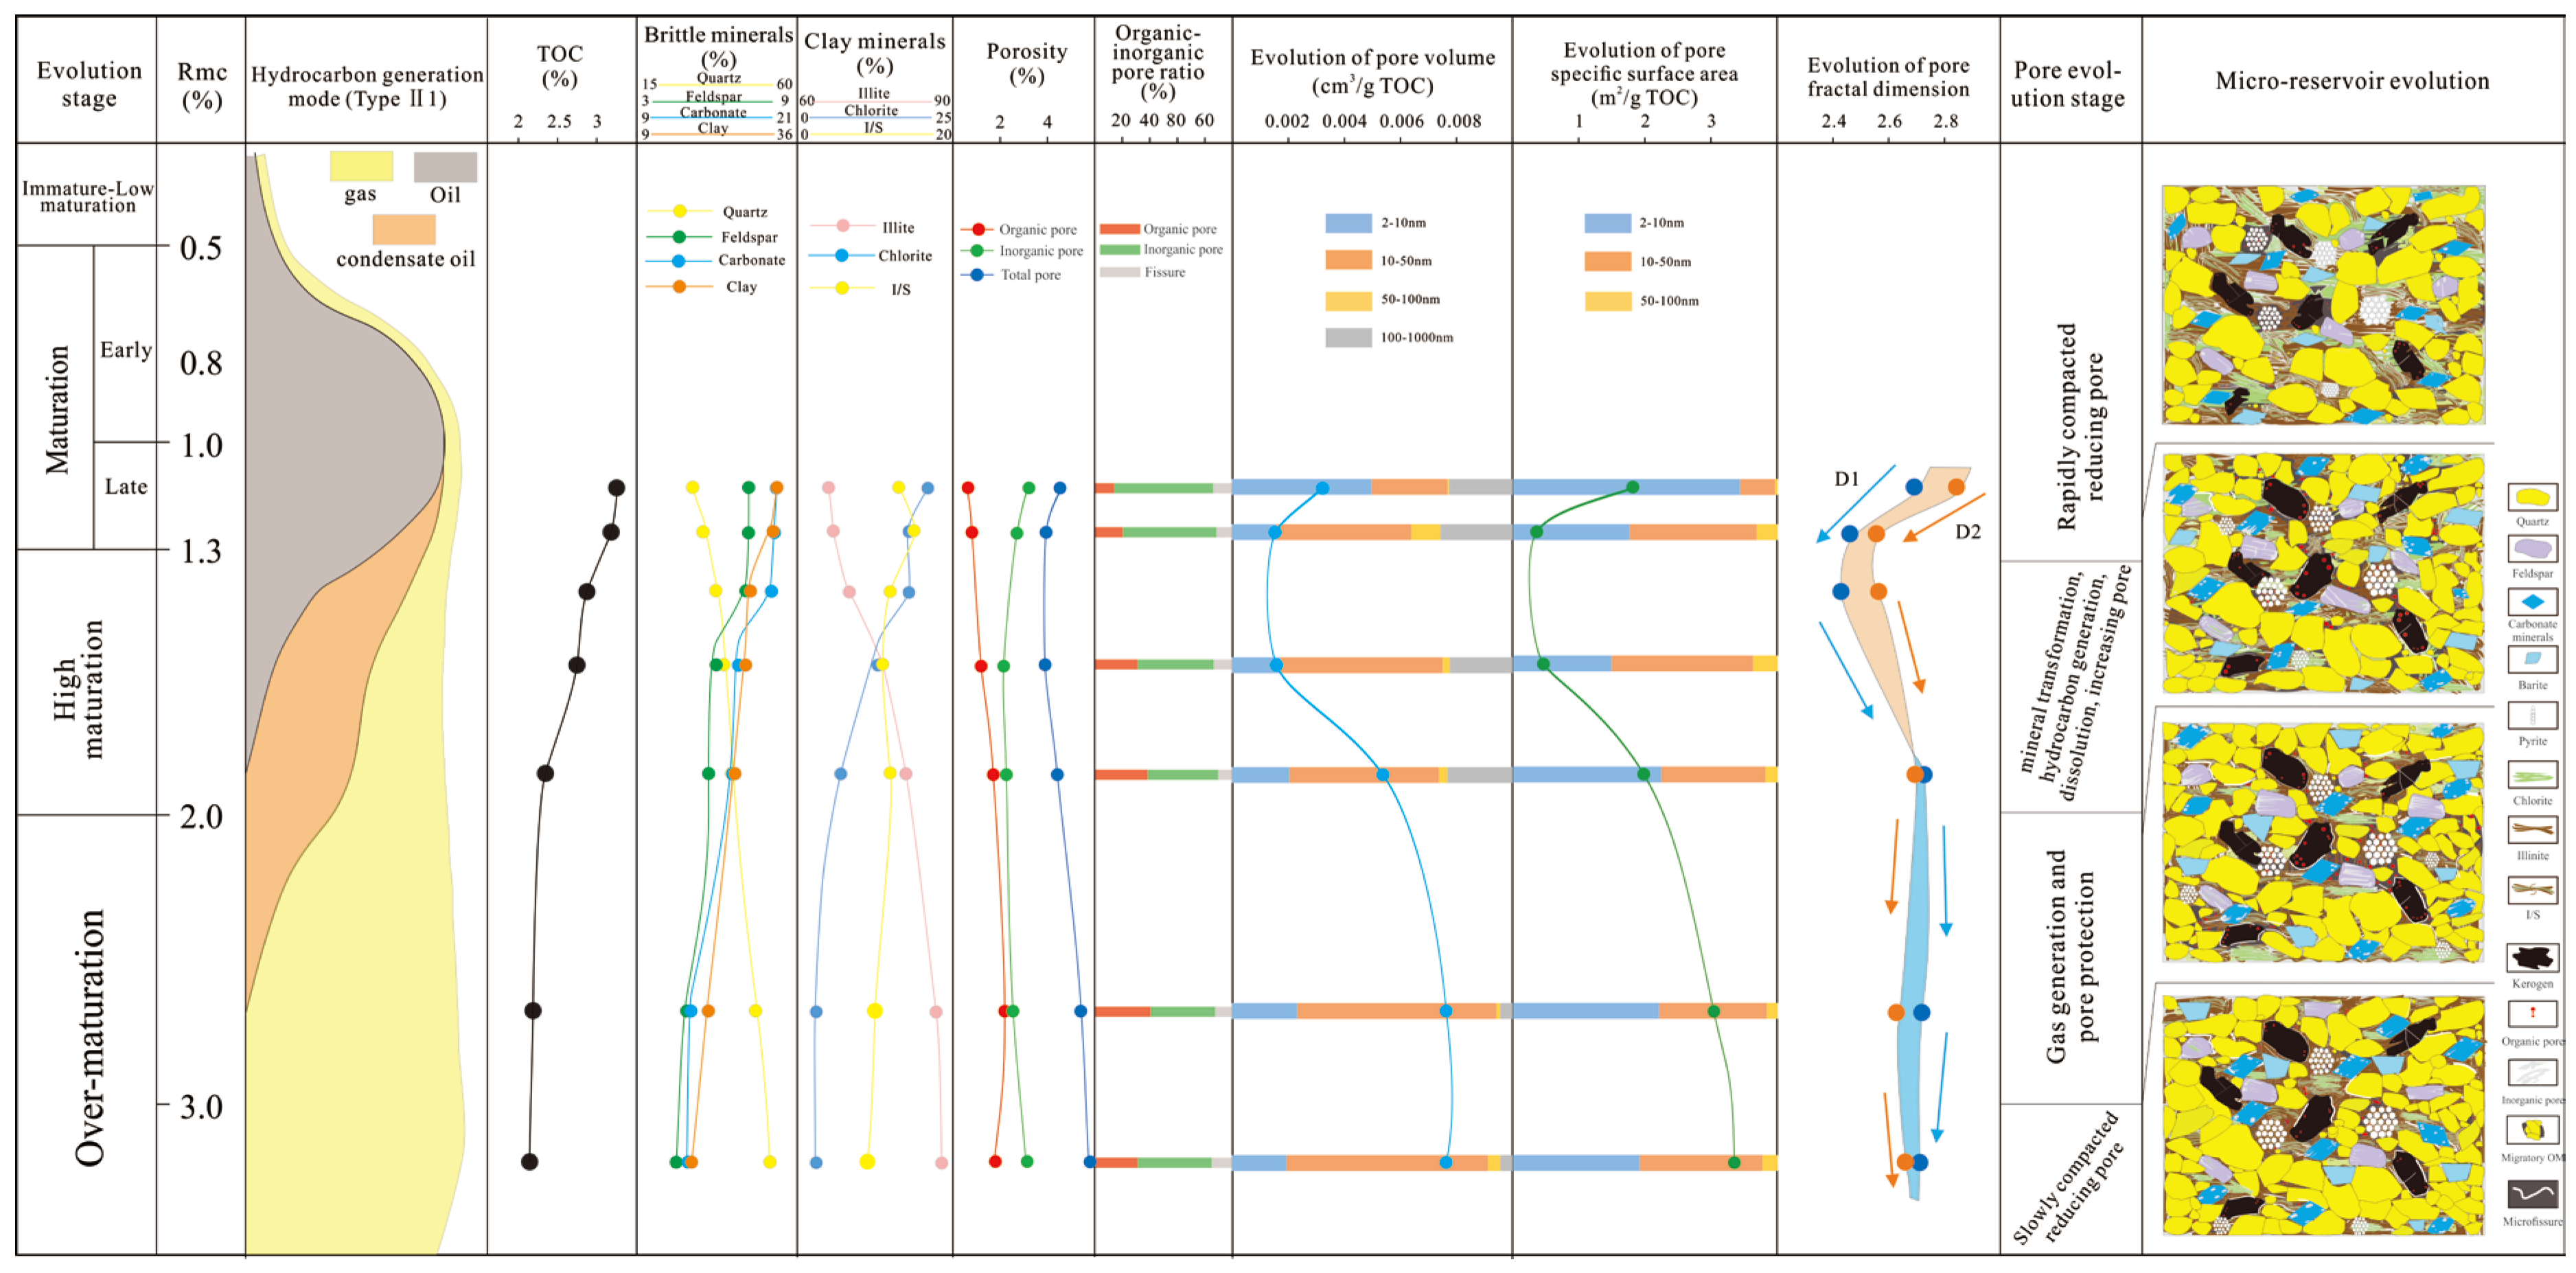
Stage One (Rmc < 1.3%): Before organic matter reaches maturity, pore development rapidly decreases due to compaction, with residual primary intergranular pores dominating [46]. As kerogen undergoes thermal cracking and volume contraction, small organic pores and fractures begin to form on the surface and edges of the organic matter, gradually increasing the relative abundance of organic pores. However, adsorption, filling, and ongoing compaction by retained hydrocarbons continue to suppress pore development. The PV and SSA of most pores decline, especially for 2–10 nm pores. Compaction results in more regular pore geometries and smoother pore surfaces, reducing both the PV and SSA. Consequently, fractal dimension D1 decreases, indicating lower surface roughness, complexity, and higher self-similarity. Quartz content correlates positively with D1 (Figure 12b), reflecting its resistance to compaction, the enhancement of reservoir brittleness, and the promotion of pore and microfracture preservation. Retained hydrocarbons tend to smooth originally irregular pore surfaces, reducing tortuous pathways and surface heterogeneity for gas adsorption, which further lowers D1. Together, these effects suppress the development of inorganic pores and microfractures, decrease overall pore complexity, and lead to a gradual decline in fractal dimension D2.
(2)
Stage Two (Rmc = 1.3–2.0%): With increasing thermal maturity, kerogen and residual hydrocarbons break down into condensates and wet gas, promoting the formation of abundant nanoscale pores and reopening previously occluded inorganic pores. Consequently, the proportion of organic pores steadily increases. Organic acids released from kerogen enhance the dissolution of “depletion” components such as feldspar and carbonates, and drive clay mineral transformation, notably increasing the intensity of clay alteration. During the late high maturity stage, the porosity of inorganic pores and microfractures gradually increases, accompanied by a rise in fractal dimension D2. The proportion of pores sized 5–60 nm significantly grows, indicating enhanced pore development and a marked increase in fractal dimension D1. Dissolution produces numerous pores with rough, uneven surfaces characterized by high curvature, increasing surface complexity, tortuosity of adsorption pathways, and steepening adsorption isotherms, resulting in higher D1 values. Moreover, dissolution enlarges existing pores and opens blocked pores, enhancing pore connectivity and spatial heterogeneity. Dissolution pores in shale are typically irregular and asymmetric, forming multiscale pore systems that increase pore space complexity and contribute to a higher D2. Additionally, illitization of clay minerals forms irregular plate-like structures and alters microscopic pore morphology, promoting pore structure reorganization and pore throat expansion. This significantly increases the roughness and complexity of pore surfaces and networks, likely elevating both D1 and D2.
(3)
Stage Three (Rmc = 2.1–3.0%): The cracking of kerogen alkyl side chains generates C1–C3 compounds. Retained hydrocarbons and wet gas continue to crack into methane, leading to the formation of numerous spherical organic pores. Due to the “hydrocarbon generation pressure preservation” effect, both the quantity and size of organic pores peak at Ro = 2.7%. In contrast, inorganic diagenetic processes, primarily illitization and compaction, reduce the porosity of inorganic pores and microfractures. After an initial increase, pore development stabilizes, with a notable rise in pores within the 10–50 nm range. As a result, D1 initially increases before stabilizing, while D2 gradually decreases.
(4)
Stage Four (Rmc > 3.0%): At this stage, shale components stabilize, and organic matter evolution is limited to kerogen decarbonation reactions. Inorganic diagenesis is dominated by intense compaction. As a result, organic pores become less prevalent, while inorganic pores and microfractures increasingly dominate. Total porosity and pore development continue to decline gradually, causing D1 to decrease further. In contrast, D2 shows an increasing trend. Total PV slightly decreases due to inorganic compaction, reflecting a slow reduction in porosity and pore development. Pores smaller than 10 nm decrease significantly, whereas pores larger than 10 nm increase. Meanwhile, SSA increases, likely due to the closure of micropores caused by carbonization and compaction, while overpressure-induced microfracturing and brittle failure at organic–mineral interfaces enlarge the larger pores. These changes enhance pore heterogeneity and complexity, contributing to the rise in D2.

6. Conclusions

Utilizing thermal simulation, shale samples covering the full thermal evolution stages of the Longmaxi Formation were obtained and subjected to comprehensive analyses, including TOC, mineralogy, and pore structure parameters. Using fractal theory, the relationships between reservoir pore development, shale components, and fractal dimensions were investigated, and a comprehensive model describing their coupled evolution was established.
(1)
The evolution of mineral composition indicates a gradual increase in quartz content, accompanied by a decline in clay, feldspar, and carbonate minerals. The thermal evolution of organic matter is primarily reflected in the formation of organic pores and marginal shrinkage fissures on the kerogen surface, while retained hydrocarbons filling inorganic pores generate numerous nanoscale pores in the later stages. Inorganic diagenetic evolution is mainly characterized by compaction, dissolution, and clay mineral transformation.
(2)
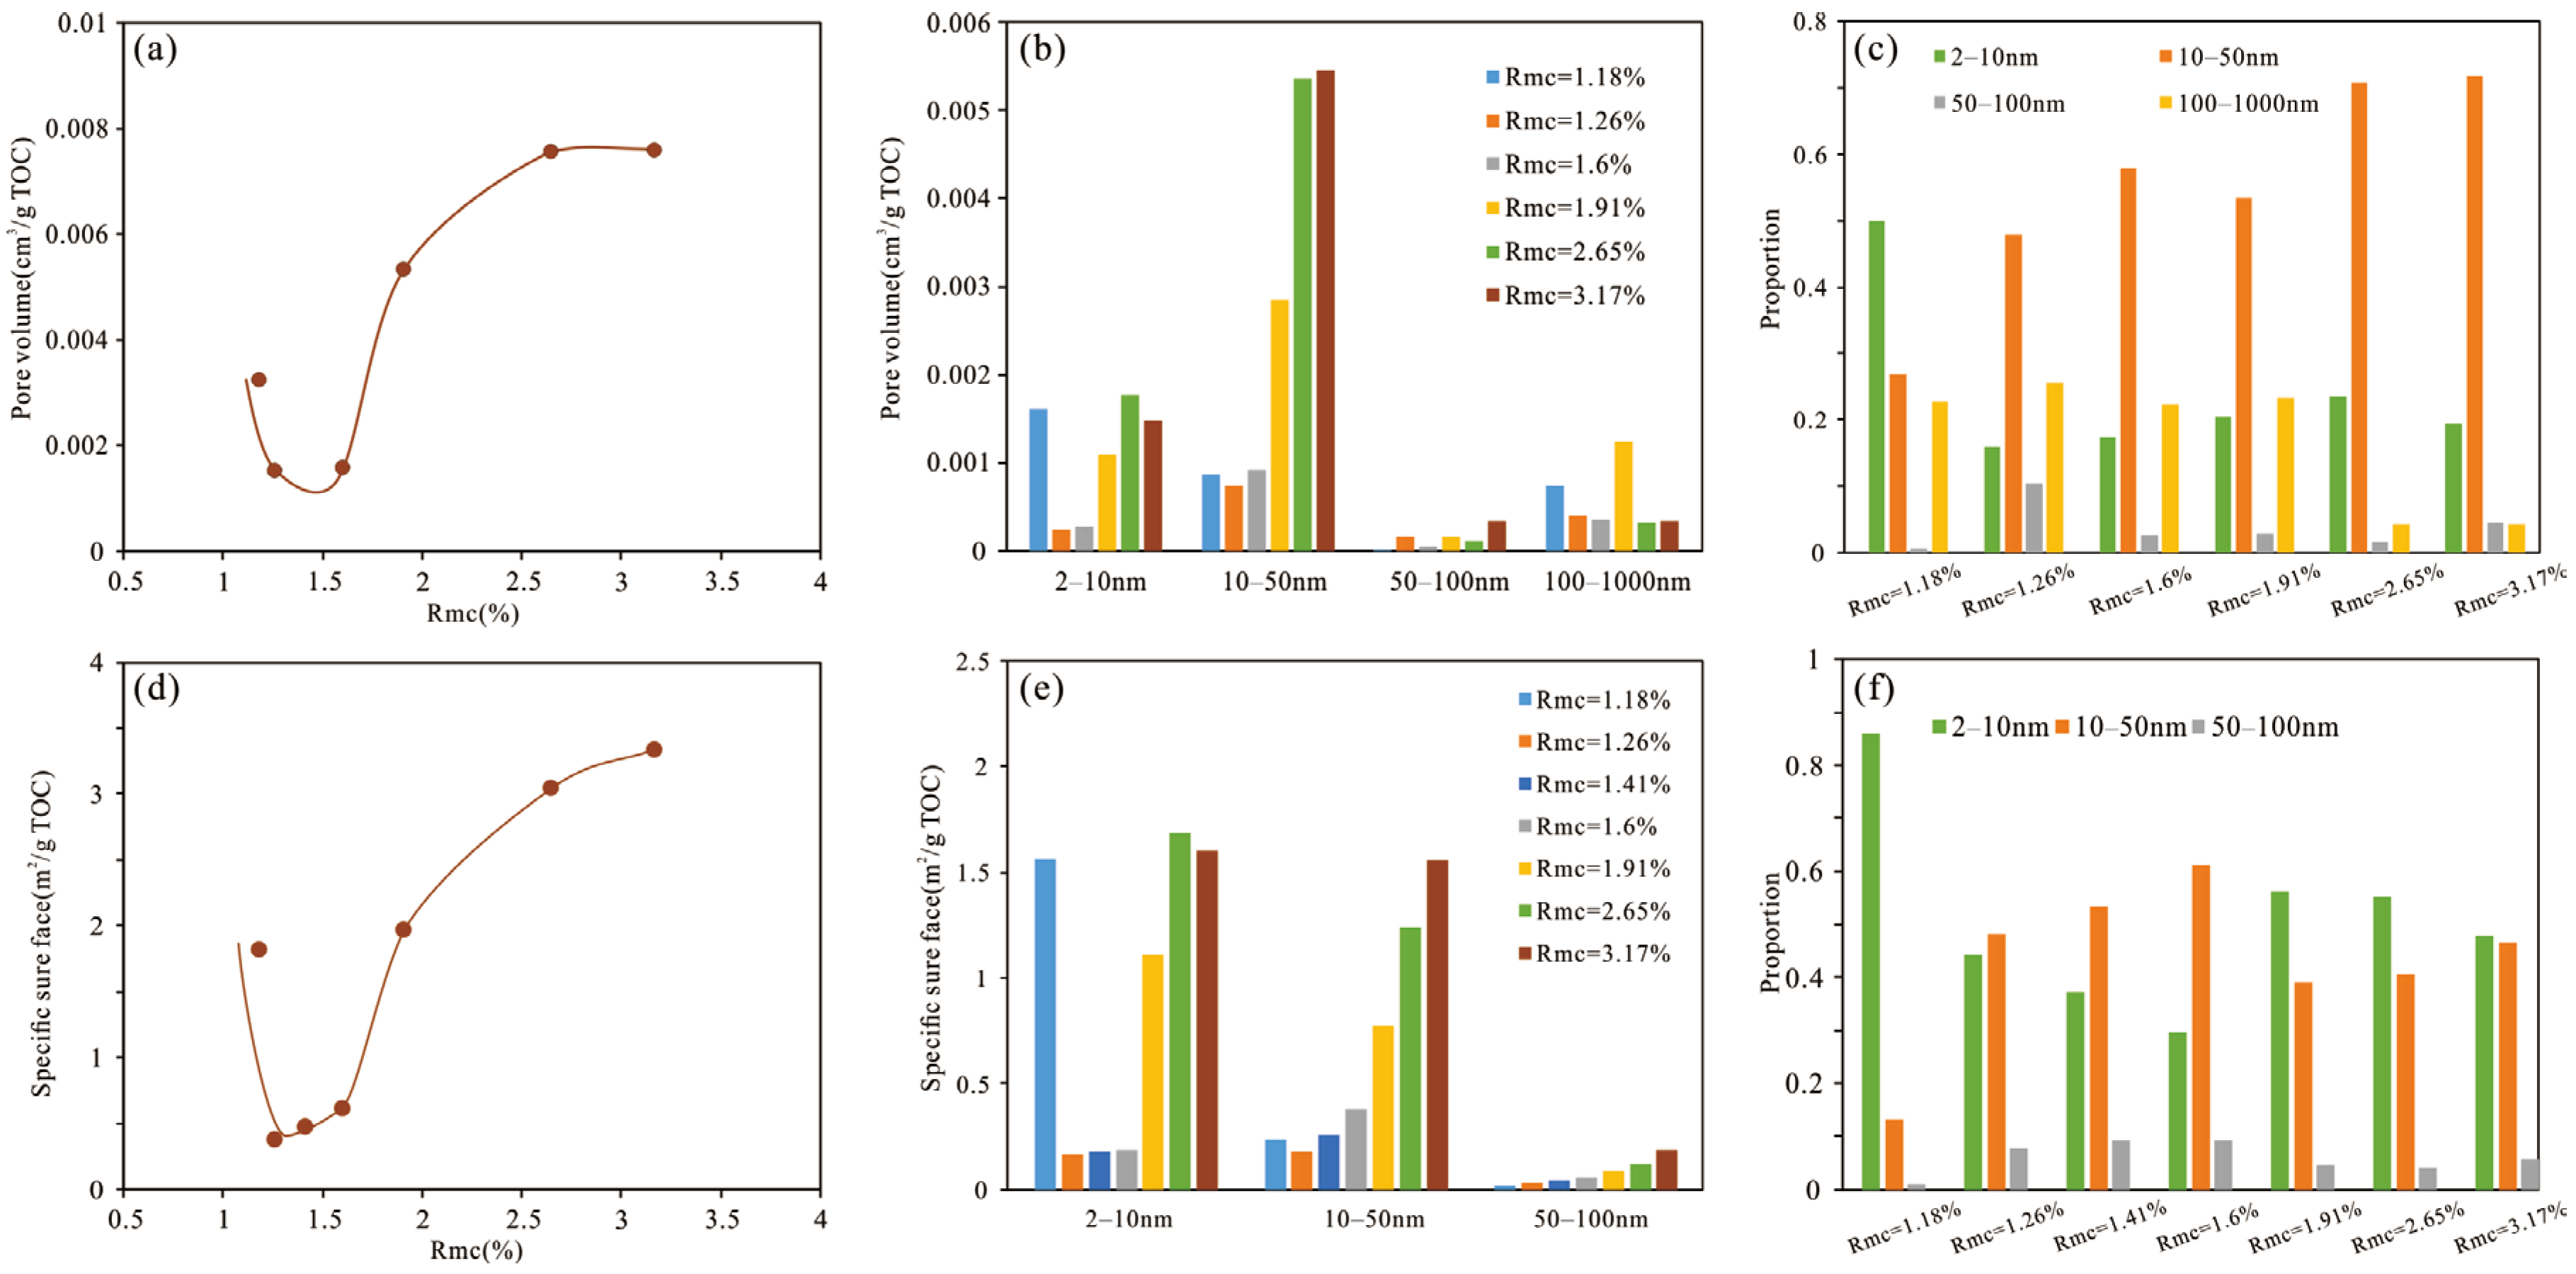
Throughout the simulation, the porosity evolution exhibited distinct stages of rapid decline, notable increase, and relative stabilization. The proportion of organic pores peaked at approximately Rmc = 2.7%. Both the PV and SSA showed a trend of initial decrease followed by an increase. However, the PV declined gradually after reaching its maximum in the late overmature stage. During the entire process, the dominant pore size contributing to the PV ranged from 10–50 nm, while for the SSA, it ranged from 2–50 nm.
(3)
The FHH model results show that D1 (average 2.62) is lower than D2 (average 2.66), indicating that pore surface roughness across different maturity levels is less complex than the internal pore structure. DM values derived from the capillary bundle model range from 2.32 to 2.94 (average 2.69), higher than the average values of D1 and D2, suggesting that macropores possess more complex pore structures.
(4)
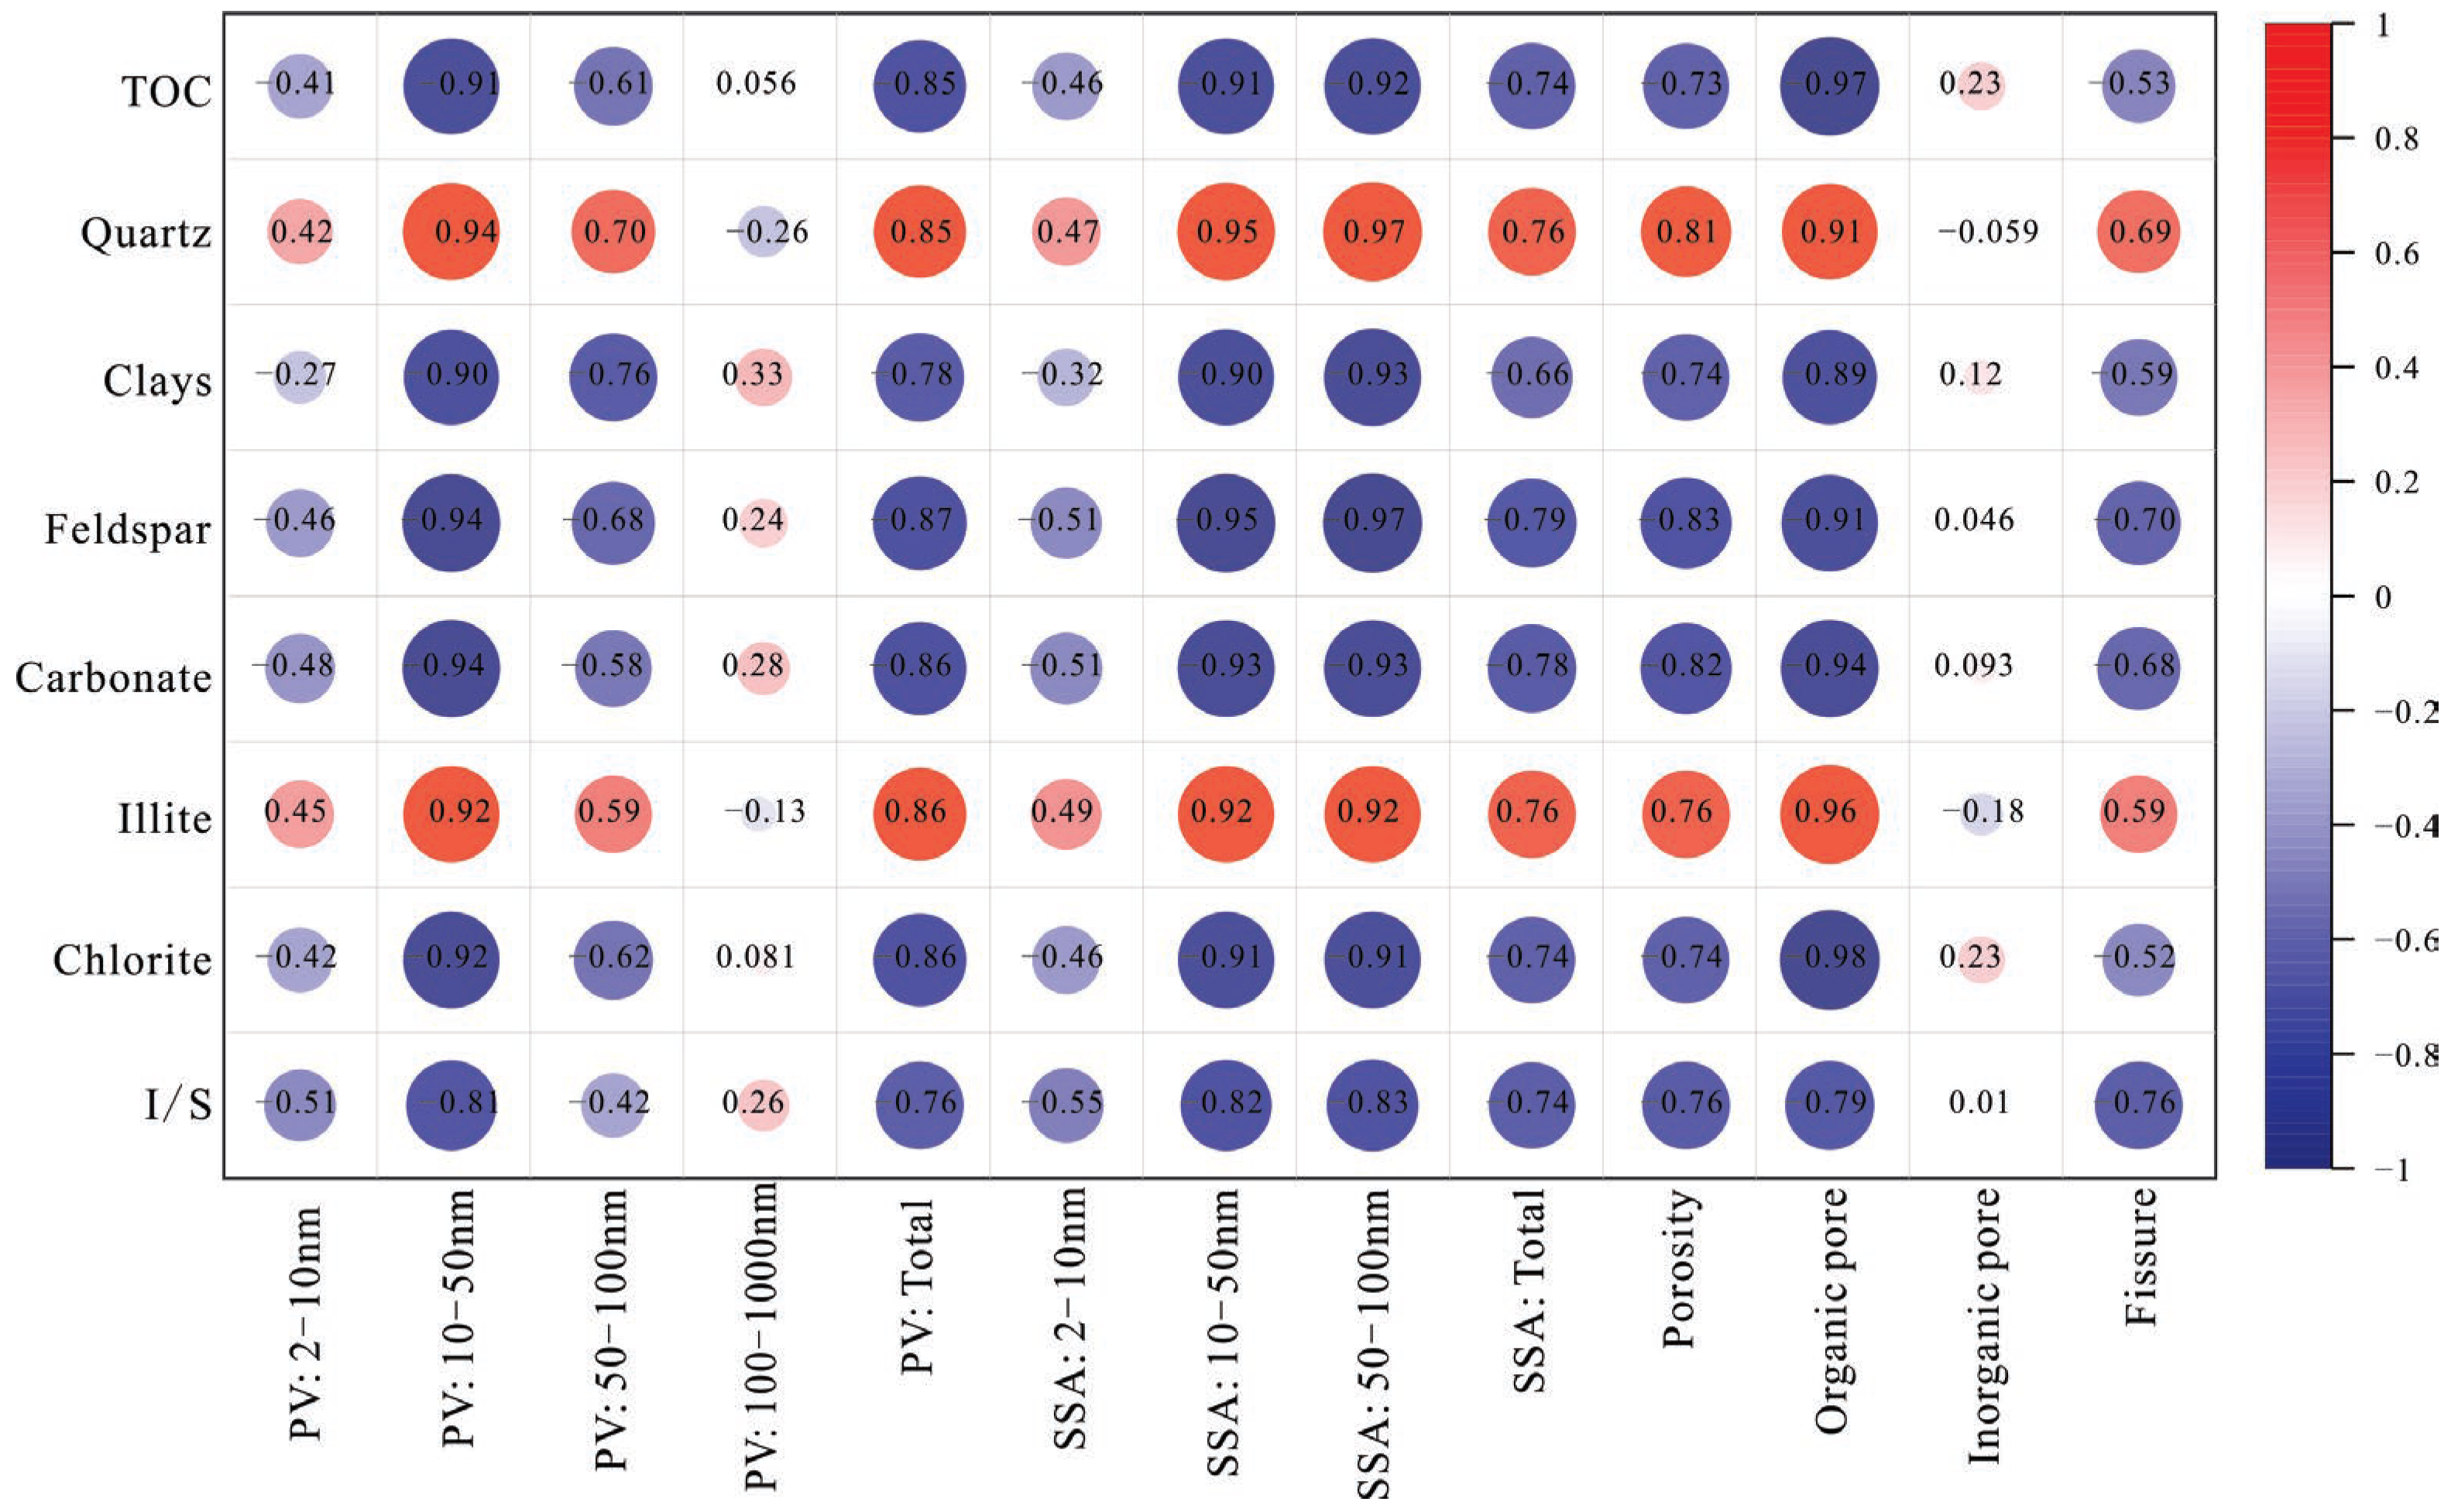
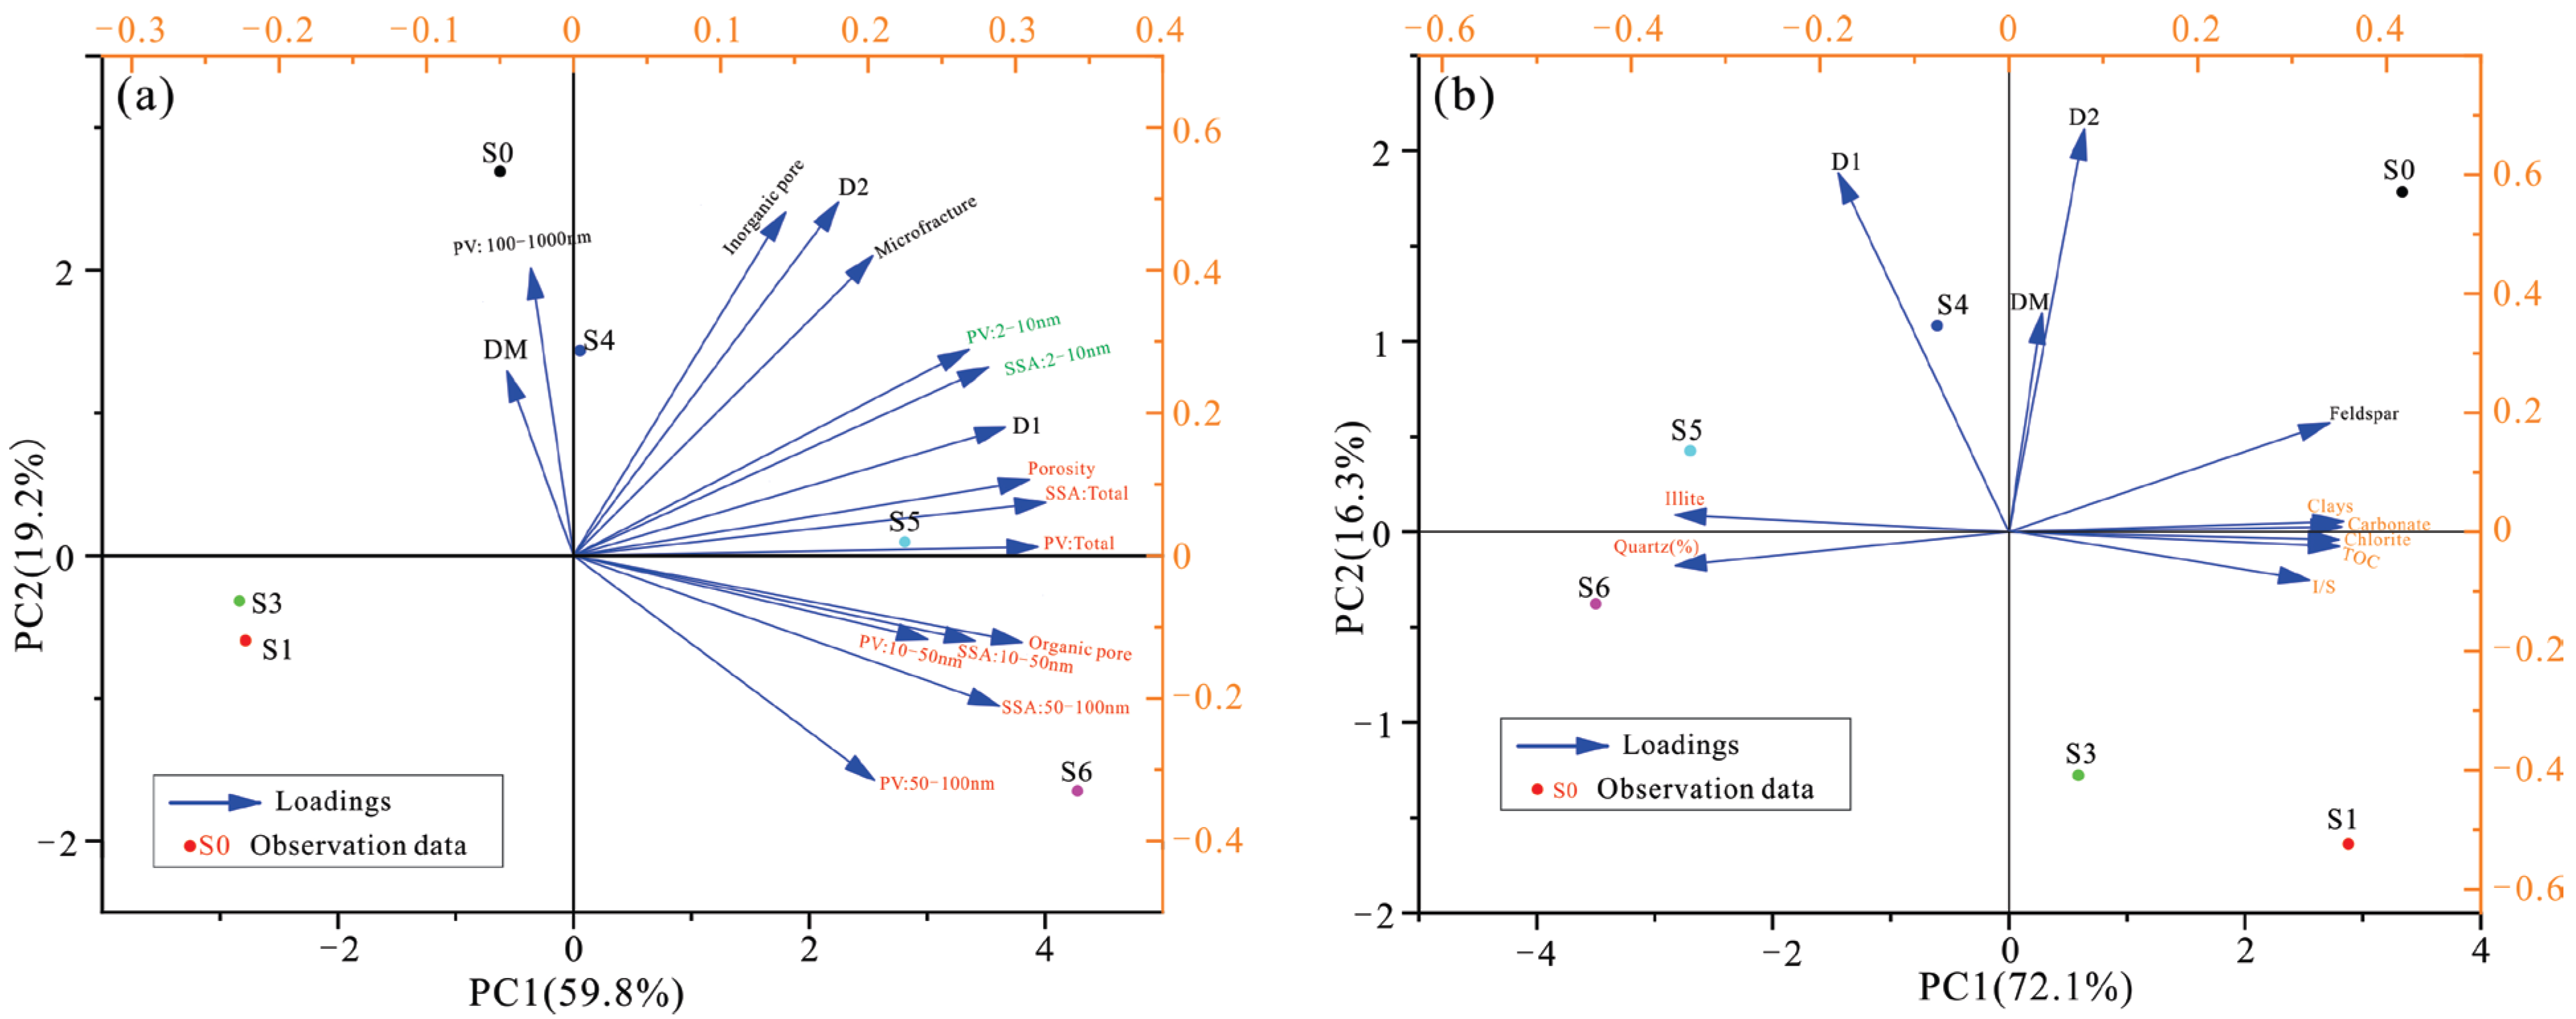
The correlation matrix reveals a co-evolutionary relationship between shale composition and pore structure. The PCA analysis demonstrates a strong association between inorganic and microfracture porosity with fractal dimension D2, whereas organic pore porosity, dominant pore diameter, PV, and SSA are closely linked to D1. D1 serves as an indicator of pore development extent and reflects changes in components that are either consumed or generated during thermal evolution. Based on shale composition, fractal dimensions, and pore structure evolution patterns, a comprehensive evolution model for pores and fractal dimensions in organic-rich shale was established.

Author Contributions

Conceptualization, Y.J. and H.Z.; methodology, X.Y.; validation, Q.G.; formal analysis, Y.G.; investigation, X.Y. and H.Z.; data curation, Q.G.; writing—original draft preparation, H.Z. and Y.J.; writing—review and editing, X.Y. and Y.G.; visualization, Q.G.; supervision, Y.G.; project administration, Y.J. All authors have read and agreed to the published version of the manuscript.

Funding

This research was funded by the National Natural Science Foundation of China (grant number 42202192), the National Natural Science Foundation of China (grant number 42272171), and supported by the Sichuan Science and Technology Program, grant number 2024NSFSC0811.

Data Availability Statement

All of the data and models generated or used in the present study are available from the corresponding author upon request.

Conflicts of Interest

The authors declare that they have no known competing financial interest or personal relationships that might have influenced the work presented in this article.

Abbreviations

BETBrunauer–Emmett–Teller
D1The fractal dimension indicative of pore surface roughness, calculated using the FHH model from the low-pressure region (0.1 < P/P0 < 0.45) of N2 adsorption
D2The fractal dimension indicative of pore structure complexity, calculated using the FHH model from the high-pressure region (0.45 < P/P0 < 0.98) of N2 adsorption
DMFractal dimension indicating pore heterogeneity, calculated via the capillary bundle model from mercury intrusion over 20–1000 nm pore sizes
FE-SEMField Emission-Scanning Electron Microscope
FHH Frenkel–Halsey–Hill
HPMIHigh pressure mercury intrusion
LTNALow-Temperature Nitrogen Adsorption
MIPMercury intrusion porosimetry
NMRNuclear Magnetic Resonance
PCPrincipal Component
PCAPrincipal Component Analysis
PVPore Volume
RmcReflectance estimated from Raman spectroscopy
SSASpecific Surface Area
T2Transverse relaxation time from NMR
TOCThe Organic Carbon
XRDX-ray Diffraction

References

  1. Guo, X.; Hu, Z.; Li, S.; Zheng, L.; Zhu, D.; Liu, J.; Shen, B.; Du, W.; Yu, L.; Liu, Z.; et al. Progress and prospect of natural gas exploration and research in deep and ultra-deep strata. Pet. Sci. Bull. 2023, 4, 461–474. (In Chinese) [Google Scholar]
  2. Guo, X.; Wang, R.; Shen, B.; Wang, G.; Wan, C.; Wang, Q. Geological characteristics, resource potential, and development direction of shale gas in China. Pet. Explor. Dev. 2025, 52, 15–28. [Google Scholar] [CrossRef]
  3. Zou, C.; Dong, D.; Wang, S.; Li, J.; Li, X.; Wang, Y.; Li, D.; Cheng, K. Geological characteristics and resource potential of shale gas in China. Pet. Explor. Dev. 2010, 37, 641–653. [Google Scholar] [CrossRef]
  4. Guo, X.; Teng, B.; Wei, X.; Yu, L.; Lu, X.; Sun, L.; Wei, F. Occurrence mechanism and exploration potential of deep marine shale gas in Sichuan Basin. Acta Pet. Sin. 2022, 43, 453–468. (In Chinese) [Google Scholar]
  5. Li, X.; Jiang, Z.; Wang, S.; Wu, F.; Miao, Y.; Wang, X.; Wang, H.; Liu, X. Differences of marine and transitional shales in the case of dominant pore types and exploration strategies, in China. J. Nat. Gas Sci. Eng. 2022, 103, 104628. [Google Scholar] [CrossRef]
  6. Teng, B.; Qiu, N.; Yu, L.; Guo, T.; Feng, Q.; Shen, B.; Lu, L.; Zeng, W.; Li, H.; Chen, W.; et al. Differential preservation mechanisms of marine shale gas under varying burial conditions in southern China. Acta Geol. Sin. 2024, 98, 3285–3301. (In Chinese) [Google Scholar]
  7. Wei, F.; Liu, Z.; Chen, F.; Yuan, T.; Li, F. Characteristics of the deep and ultra-deep shale reservoirs of the Wufeng–Longmaxi formations in the southeastern Sichuan Basin and the significance of shale gas exploration. Pet. Geol. Exp. 2023, 45, 751–760. (In Chinese) [Google Scholar]
  8. Wang, D.; Jiang, Z.; Du, W.; Liu, D.; Chen, W.; Yang, Y.; Feng, X. Pore structure difference characteristics and evolution model in the process of gas reservoir uplift: A case study of the shale reservoir of Wufeng Formation- Longmaxi Formation in Sichuan basin and its surrounding areas. Acta Geol. Sin. 2025, 99, 1381–1397. [Google Scholar]
  9. Xu, L.; Yang, K.; Wei, H.; Liu, L.; Li, X.; Chen, L.; Xu, T.; Wang, X. Diagenetic evolution sequence and pore evolution model of Mesoproterozoic Xiamaling organic-rich shale in Zhangjiakou, Hebei, based on pyrolysis simulation experiments. Mar. Petrol. Geol. 2021, 132, 105233. [Google Scholar] [CrossRef]
  10. Wang, X.M. Formation and Evolution of Pores in Organic-Rich Shale and Its Controlling on Shale Gas Content. Ph.D. Thesis, China University of Petroleum, Beijing, China, 2020. (In Chinese). [Google Scholar]
  11. Guo, S.; Mao, W. Division of diagenesis and pore evolution of a Permian Shanxi shale in the Ordos Basin, China. J. Petrol. Sci. Eng. 2019, 182, 106351. [Google Scholar] [CrossRef]
  12. Wang, F.; Feng, Z.; Wang, X.; Zeng, H. Effect of organic matter, thermal maturity and clay minerals on pore formation and evolution in the Gulong Shale, Songliao Basin, China. Geoenergy Sci. Eng. 2023, 223, 211507. [Google Scholar] [CrossRef]
  13. Qian, C.; Li, X.; Shen, W.; Zhang, Q.; Guo, W.; Hu, Y.; Cui, Y.; Jia, Y. Study on the Pore Structure and Fractal Characteristics of Different Lithofacies of Wufeng–Longmaxi Formation Shale in Southern Sichuan Basin, China. ACS Omega 2022, 7, 8724–8738. [Google Scholar] [CrossRef] [PubMed]
  14. Guan, Q.; Dong, D.; Sun, S.; Hu, L.; Qi, L.; Li, C.; Chen, C.; Chen, X. Fractal characteristics of organic-rich shale pore structure and its geological implications: A case study of the Lower Silurian Longmaxi Formation in the Weiyuan block, Sichuan Basin. Nat. Gas Ind. 2024, 44, 108–118. (In Chinese) [Google Scholar]
  15. Guo, X.; Huang, Z.; Zhao, L.; Han, W.; Ding, C.; Sun, X.; Yan, R.; Zhang, T.; Yang, X.; Wang, R. Pore structure and multi-fractal analysis of tight sandstone using MIP, NMR and NMRC methods: A case study from the Kuqa depression, China. J. Pet. Sci. Eng. 2019, 178, 544–558. [Google Scholar] [CrossRef]
  16. Sun, W.; Zuo, Y.; Wu, Z.; Liu, H.; Xi, S.; Shui, Y.; Wang, J.; Liu, R.; Lin, J. Fractal analysis of pores and the pore structure of the Lower Cambrian Niutitang shale in northern Guizhou province: Investigations using NMR, SEM and image analyses. Mar. Pet. Geol. 2019, 99, 416–428. [Google Scholar] [CrossRef]
  17. Avnir, D.; Jaroniec, M. An isotherm equation for adsorption on fractal surfaces of heterogeneous porous materials. Langmuir 1989, 5, 1431–1433. [Google Scholar] [CrossRef]
  18. Neimark, A.V.; Unger, K.K. Method of discrimination of surface fractality. J. Colloid Interface Sci. 1993, 158, 412–419. [Google Scholar] [CrossRef]
  19. Pfeifer, P.; Wu, Y.; Cole, M.W.; Krim, J. Multilayer adsorption on a fractally rough surface. Phys. Rev. Lett. 1989, 62, 1997–2000. [Google Scholar] [CrossRef] [PubMed]
  20. Menger, K. General Spaces and Cartesian Spaces I. Communications to the Amsterdam; Academy of Sciences: 1926; Reprinted in Classics on Fractals; Edgar, G.A., Ed.; Addison-Wesley: Boston, MA, USA, 1993; pp. 3–9. [Google Scholar]
  21. Chang, J.; Fan, X.; Jiang, Z.; Wang, X.; Chen, L.; Li, J.; Wu, L.; Wan, C.; Chen, Z. Differential impact of clay minerals and organic matter on pore structure and its fractal characteristics of marine and continental shales in China. Appl. Clay Sci. 2022, 216, 106334. [Google Scholar] [CrossRef]
  22. Li, X.; Jiang, Z.; Jiang, S.; Li, Z.; Song, Y.; Jiang, H.; Qiu, H.; Cao, X.; Miao, Y. Various controlling factors of matrix-related pores from differing depositional shales of the Yangtze Block in south China: Insight from organic matter isolation and fractal analysis. Mar. Pet. Geol. 2020, 111, 720–734. [Google Scholar] [CrossRef]
  23. Li, Y.; Liu, D.; Feng, X.; Zhao, F.; Chen, Y.; Wang, Y.; Lin, R.; Du, W.; Fan, Q.; Song, Y.; et al. Heterogeneity characteristics and its controlling factors of marine shale reservoirs from the Wufeng–Longmaxi Formation in the Northern Guizhou area. Geol. China 2024, 51, 780–798. (In Chinese) [Google Scholar]
  24. Wang, F.; Guo, S. Influential factors and model of shale pore evolution: A case study of a continental shale from the Ordos Basin. Mar. Petrol. Geol. 2019, 102, 271–282. [Google Scholar] [CrossRef]
  25. Lu, C.; Xiao, X.; Gai, H.; Feng, Y.; Li, G.; Meng, G.; Gao, P. Nanopore structure characteristics and evolution of type III kerogen in marine-continental transitional shales from the Qinshui basin, northern China. Geoenergy Sci. Eng. 2023, 221, 211412. [Google Scholar] [CrossRef]
  26. Liu, B.; Mohammadi, M.; Ma, Z.; Bai, L.; Wang, L.; Xu, Y.; Ostadhassan, M.; Hemmati-Sarapardeh, A. Evolution of porosity in kerogen type I during hydrous and anhydrous pyrolysis: Experimental study, mechanistic understanding, and model development. Energy 2023, 338, 127149. [Google Scholar] [CrossRef]
  27. Cao, T.; Deng, M.; Cao, Q.; Huang, Y.; Yu, Y.; Cao, X. Pore formation and evolution of organic-rich shale during the entire hydrocarbon generation process: Examination of artificially and naturally matured samples. J. Nat. Gas Sci. Eng. 2021, 93, 104020. [Google Scholar] [CrossRef]
  28. He, Q.; Chen, S.; Li, S.; Guo, B.; Lu, J.; Li, Y.; Li, X.; Zhao, L.; Ma, Z. Organic geochemical characteristics and hydrocarbon generation mechanism of marine-continental transitional organic-rich shale: A case study from the Shanxi formation in the eastern margin of the Ordos Basin. J. Pet. Sci. Eng. 2022, 219, 111116. [Google Scholar] [CrossRef]
  29. Wu, J.; Li, H.; Yang, X.; Zhao, S.; Guo, W.; Sun, Y.; Liu, Y.; Liu, Z. Types and combinations of deep marine shale laminae and their effects on reservoir quality: A case study of the first submember of Member 1 of Longmaxi Formation in Luzhou block, south Sichuan Basin. Acta Pet. Sin. 2023, 44, 1517–1531. (In Chinese) [Google Scholar]
  30. Gu, M.; Liu, R.; Zhang, H.; He, Y.; Li, X.; Hao, Y.; Jiang, H.; Li, W. Characteristics and geological response of Caledonian tectonic movement in the Sichuan Basin. Nat. Gas Ind. 2023, 43, 32–43. (In Chinese) [Google Scholar]
  31. Wang, H.; Shi, Z.; Zhou, T.; Zhao, Q.; Sun, S.; Qi, L.; Liang, P. Types and characteristics of sweet spots of marine black shale and significance for shale gas exploration: A case study of Wufeng–Longmaxi in southern Sichuan Basin. Nat. Gas Ind. 2023, 43, 1–13. (In Chinese) [Google Scholar]
  32. Zou, C.; Dong, D.; Wang, Y.; Li, X.; Huang, J.; Wang, S.; Guan, Q.; Zhang, C.; Wang, H.; Liu, H.; et al. Shale gas in China: Characteristics, challenges and prospects (II). Pet. Explor. Dev. 2016, 43, 166–178. [Google Scholar] [CrossRef]
  33. Wang, Y.; Qiu, N.; Yang, Y.; Rui, X.; Zhou, Y.; Fang, G.; Wu, H.; Shen, B.; Cheng, L.; Teng, G. Thermal Maturity of Wufeng-Longmaxi Shale in Sichuan Basin. Earth Sci. 2019, 44, 953–971. [Google Scholar]
  34. Li, J.; Ma, W.; Wang, Y.; Wang, D.; Xie, Z.; Li, Z.; Ma, C. Modeling of the whole hydrocarbon-generating process of sapropelic source rock. Pet. Explor. Dev. 2018, 45, 445–454. [Google Scholar] [CrossRef]
  35. Ma, Z.L.; Zheng, L.J.; Li, Z.M. The Thermocompression Simulation Experiment of Source Rock Hydrocarbon Generation and Expulsion in Formation Porosity. Acta Sedimentol. Sin. 2012, 30, 955–963. (In Chinese) [Google Scholar]
  36. Liu, D.; Xiao, X.; Tian, H.; Min, Y.; Zhou, Q.; Cheng, P.; Shen, J. Sample maturation calculated using Raman spectroscopic parameters for solid organics: Methodology and geological applications. Chin. Sci. Bull. 2013, 58, 1285–1298. [Google Scholar] [CrossRef]
  37. Yin, N.; Hu, Q.; Becker, S.J.; Jones, R.; Meng, M.; Zhu, X.; Liu, H. Development of an NMR workflow for determining nano-petrophysical properties of marine and lacustrine mudrocks. J. Petrol. Sci. Eng. 2022, 214, 110491. [Google Scholar] [CrossRef]
  38. Zhang, C.; Guan, P.; Zhang, J.; Liang, X.; Ding, X.; You, Y. A Review of the Progress on Fractal Theory to Characterize the Pore Structure of Unconventional Oil and Gas Reservoirs. Acta Sci. Nat. Univ. Pekin. 2023, 59, 897–908. (In Chinese) [Google Scholar]
  39. Li, P.; Zheng, M.; Bi, H.; Wu, S.; Wang, X. Pore throat structure and fractal characteristics of tight oil sandstone: A case study in the Ordos Basin, China. J. Pet. Sci. Eng. 2017, 149, 665–674. [Google Scholar] [CrossRef]
  40. Milliken, K.L.; Rudnicki, M.; Awwiller, D.N.; Zhang, T. Organic matter-hosted pore system, Marcellus Formation (Devonian), Pennsylvania. AAPG Bull. 2013, 97, 177–200. [Google Scholar] [CrossRef]
  41. Arif, M.; Zhang, Y.H.; Iglauer, S. Shale Wettability: Data Sets, Challenges, and Outlook. Energy Fuels 2021, 35, 2965–2980. [Google Scholar] [CrossRef]
  42. Zhou, B. The Applications of NMR Relaxometry, NMR Cryoporometry, and FFC NMR to Nanoporous Structures and Dynamics in Shale at Low Magnetic Fields. Energy Fuels 2018, 32, 8897–8904. [Google Scholar] [CrossRef]
  43. Wang, Z.; Wang, D. Experimental Study on the Influence of Paramagnetic Ions on the Relaxation Response of Nuclear Magnetic Resonance and Its Application. Well Logging Technol. 2003, 27, 270–273. (In Chinese) [Google Scholar]
  44. Xue, J.; Lee, C.; Wakeham, S.G.; Armstrong, R. Using principal components analysis (PCA) with cluster analysis to study the organic geochemistry of sinking particles in the ocean. Org. Geochem. 2011, 42, 356–367. [Google Scholar] [CrossRef]
  45. Gotelli, N.J.; Ellison, A.M. A Primer of Ecological Statistics; Sinauer Associates: Sunderland, MA, USA, 2004. [Google Scholar]
  46. Wang, G.P.; Jin, Z.J.; Zhang, Q.; Zhu, R.K.; Tang, X.; Liu, K.Q.; Dong, L. Effects of clay minerals and organic matter on pore evolution of the early mature lacustrine shale in the Ordos Basin, China. J. Asian Earth Sci. 2023, 246, 105516. [Google Scholar] [CrossRef]
Figure 1. (a) Location of Sichuan Basin (modified from Zou et al. [32]). (b) Stratigraphic column of the Silurian Longmaxi Formation.
Fractalfract 09 00492 g001
Figure 2. Experiment flowchart of this research.
Fractalfract 09 00492 g002
Figure 3. Mineral composition variation of the simulated samples.
Fractalfract 09 00492 g003
Figure 4. SEM microscopic characteristics of organic pores. MSF = Marginal shrinkage fissures; HEP = Hydrocarbon expulsion pores; SSP = Spherical or sub-spherical shaped pores; ISP = irregular shaped pores. (a) Banded kerogen with few organic pores due to retained hydrocarbon filling, S0, Rmc = 1.18%; (b) Hydrocarbon generation and expulsion from kerogen form elliptical pores, while shrinkage at the edges creates marginal fissures, S1, Rmc = 1.26%; (c) Early expulsion and cracking of retained hydrocarbons form elliptical organic pores, S2, Rmc = 1.41%; (d) The surface of organic matter exhibits organic pores and marginal fissures, S3, Rmc = 1.60%; (e,f) Increased cracking of retained hydrocarbons produces much gas, releasing inorganic pores and creating many nanoscale spherical or elliptical organic pores, S4, Rmc = 1.91%; (g) Spherical or irregular organic pores develop, S5, Rmc = 2.65%; (h) A few organic pores/fissures are compressed or deformed, S6, Rmc = 3.17%.
Fractalfract 09 00492 g004
Figure 5. SEM microscopic characteristics of inorganic pores and microfracture. (a) Retained hydrocarbons fill inorganic pores, resulting in low pore development, S0, Rmc = 1.18%; (b) Compacted and deformed clay minerals with no interlayer pore development, S1, Rmc = 1.26%; (c) Clay mineral transformation, and the formation of authigenic quartz and interlayer pores and fractures, S2, Rmc = 1.41%; (d) Retained hydrocarbons in early-filled inorganic pores and fractures are released, facilitating the development of inorganic pores, S3, Rmc = 1.60%; (e) Authigenic microcrystalline quartz forms from clay transformation, mostly as overgrowths, S4, Rmc = 1.91%; (f) Inorganic pore development is continuously affected by compaction, S4, Rmc = 1.91%; (g) Microfractures develop between clay mineral layers and along brittle mineral edges. S5, Rmc = 2.65%; (h) Interlayer pores and fractures develop in clay minerals under the influence of compaction and illitization, S6, Rmc = 3.17%.
Fractalfract 09 00492 g005
Figure 6. Nuclear magnetic resonance experimental procedures.
Fractalfract 09 00492 g006
Figure 7. (a) Porosity and (b) proportion characteristics of different types of pores; (c) total porosity evolution of simulated samples.
Fractalfract 09 00492 g007
Figure 8. Evolution of PV and SSA with thermal maturity and pore size of simulated samples. (a,d) Total PV and SSA versus maturity. (b,e) PV and SSA distribution by pore size (c,f) Contribution of pore size to PV and SSA within different maturity stages.
Fractalfract 09 00492 g008
Figure 9. Fractal properties of shale pore structures analyzed using LTNA. (a) S0 and S1, (b) S2 and S3; (c) S4 and S5.
Fractalfract 09 00492 g009
Figure 10. Fractal properties of shale pore structures analyzed using HPMI. (a) S0, (b) S1, (c) S2, (d) S3, (e) S4, (f) S5.
Fractalfract 09 00492 g010
Figure 11. Correlation coefficient matrix between shale components, porosity, and pore structure parameters.
Fractalfract 09 00492 g011
Figure 12. PCA plots showing fractal dimension in relation to (a) pore structure variables and (b) shale component variables for simulated samples; variables are indicated by arrows.
Fractalfract 09 00492 g012
Figure 13. Integrated model diagram illustrating the hydrocarbon generation, diagenesis, fractal dimension, and pore evolution of Longmaxi Formation shale.
Fractalfract 09 00492 g013
Table 1. Simulation parameter information of samples.
Sample IDSimulated Burial Depth (m)Lithostatic Pressure (MPa)Heating Rate (°C/min)Final Temperature (°C)Holding Time (h)Rmc
(%)
S0//// 1.18
S1250062.52425721.26
S23000752450841.41
S33500902475961.60
S440001002500841.91
S54500112.525501682.65
S6500012525752403.17
Table 2. Fractal parameters of simulated sample. DM1 and DM2 represent pore sizes below and above 50 nm, respectively, calculated using the method from Li et al. [39].
Sample IDRmc
(%)
0.01 < P/P0 < 0.450.45 < P/P0 < 0.98HPMI (20 nm < r < 1000 nm)
D195% CI Half-WidthD295% CI Half-WidthDM195% CI
Half-Width
DM295% CI
Half-Width
DM
S01.182.690.0092.840.0042.670.0082.970.0042.74
S11.262.460.0022.560.0052.520.0282.990.0042.53
S31.602.430.0082.570.0032.620.0222.920.0042.75
S41.912.730.0022.700.0102.930.0042.940.0022.94
S52.652.720.0122.630.0122.870.0202.980.0012.90
S63.172.710.012.660.0032.280.0982.990.0012.32
Disclaimer/Publisher’s Note: The statements, opinions and data contained in all publications are solely those of the individual author(s) and contributor(s) and not of MDPI and/or the editor(s). MDPI and/or the editor(s) disclaim responsibility for any injury to people or property resulting from any ideas, methods, instructions or products referred to in the content.

