Article

Multifractal Characterization of Marine Shale Pore Structure Alteration Induced by Supercritical CO2–Water–Rock Interaction

1
National and Local Joint Engineering Research Center for Carbon Capture Utilization and Sequestration, Shaanxi Key Laboratory for Carbon Neutral Technology, State Key Laboratory of Continental Dynamics, Department of Geology, Northwest University, Xi’an 710069, China
2
College of Geology and Environment, Xi’an University of Science & Technology, Xi’an 710054, China
3
Dagang Oilfield Research Institute of Petroleum Engineering, China National Petroleum Corporation, Tianjin 300280, China
4
School of Engineering, King’s College, University of Aberdeen, Aberdeen AB24 3FX, UK
5
Key Laboratory of Continental Shale Hydrocarbon Accumulation and Efficient Development, Ministry of Education, Northeast Petroleum University, Daqing 163318, China
6
Guizhou Provincial Engineering and Technology Research Center of Coalbed Methane and Shale Gas, China Guizhou Provincial Coalfield Geology Bureau, Guiyang 550008, China
*
Authors to whom correspondence should be addressed.
Fractal Fract. 2025, 9(9), 582; https://doi.org/10.3390/fractalfract9090582
Submission received: 25 July 2025 / Revised: 27 August 2025 / Accepted: 27 August 2025 / Published: 2 September 2025

Abstract

Supercritical CO2 (ScCO2) injection has emerged as a promising method to enhance shale gas recovery while simultaneously achieving CO2 sequestration. This research investigates how ScCO2 interacts with water and shale rock, altering the pore structure characteristics of shale reservoirs. The study examines shale samples from three marine shale formations in southern China under varying thermal and pressure regimes simulating burial conditions at 1000 m (45 °C and 10 MPa) and 2000 m (80 °C and 20 MPa). The research employs multiple analytical techniques including XRD for mineral composition analysis, MICP, N2GA, and CO2GA for comprehensive pore characterization, FE–SEM for visual observation of mineral and pore changes, and multifractal theory to analyze pore structure heterogeneity and connectivity. Key findings indicate that ScCO2–water–shale interactions lead to dissolution of minerals such as kaolinite, calcite, dolomite, and chlorite, and as the reaction proceeds, substantial secondary mineral precipitation occurs, with these changes being more pronounced under 2000 m simulation conditions. Mineral dissolution and precipitation cause changes in pore structure parameters of different pore sizes, with macropores showing increased PV and decreased SSA, mesopores showing decreased PV and SSA, and micropores showing insignificant changes. Moreover, mineral precipitation effects are stronger than dissolution effects. These changes in pore structure parameters lead to alterations in multifractal parameters, with mineral precipitation reducing pore connectivity and consequently enhancing pore heterogeneity. Correlation analysis further revealed that H and D−10D10 exhibit a significant negative correlation, confirming that reduced connectivity corresponds to stronger heterogeneity, while mineral composition strongly controls the multifractal responses of macropores and mesopores, with micropores mainly undergoing morphological changes. However, these changes in micropores are mainly manifested as modifications of internal space. Siliceous shale samples exhibit stronger structural stability compared to argillaceous shale, which is attributed to the mechanical strength of the quartz framework. By integrating multifractal theory with multi–scale pore characterization, this study achieves a unified quantification of shale pore heterogeneity and connectivity under ScCO2–water interactions at reservoir–representative pressure–temperature conditions. This novelty not only advances the methodological framework but also provides critical support for understanding CO2–enhanced shale gas recovery mechanisms and CO2 geological sequestration in depleted shale gas reservoirs, highlighting the complex coupling between geochemical reactions and pore structure evolution.

1. Introduction

Shale gas, as an important unconventional energy source, occupies an increasingly important position in global energy development due to its abundant resource potential [1,2,3]. Shale reservoirs have extremely low permeability and complex pore structures with strong heterogeneity, resulting in generally low shale gas recovery rates in actual production processes [4]. In recent years, methods to enhance shale gas recovery through CO2 injection have gradually become a research hotspot. The injected CO2 forms competitive adsorption with the shale surface, effectively displacing methane gas originally adsorbed on pore surfaces, thereby improving shale gas recovery rates [5,6,7]. After CO2 injection into deep shale gas reservoirs, CO2 reaches a supercritical state due to high–temperature and high–pressure geological conditions (31.1 °C and 7.38 MPa) [8,9,10]. Supercritical CO2 (ScCO2), due to its unique physical properties (such as high density, low viscosity, no capillary forces, and good miscibility with hydrocarbons), is considered a potential fracturing medium for unconventional shale gas development to improve natural gas recovery [11]. The low viscosity of ScCO2 facilitates the formation of complex multi–directional fracture networks, thereby achieving higher fluid flow rates, and ScCO2 has a lower chemical potential than methane, making it significantly advantageous in desorbing methane [12]. When ScCO2 is used as fracturing fluid, shale gas reservoirs also have the potential to become CO2 storage sites, achieving synergistic effects between shale gas production and carbon reduction [11,13]. However, uncertainties remain regarding the impact of ScCO2–shale interactions on natural gas recovery rates. As the storage sites for shale gas, shale pores and their fracture structures determine the storage capacity and production potential of shale gas.
ScCO2–water–rock interactions play a critical role in the shale gas development process [14]. The injected ScCO2 contacts organic matter, minerals, and other components in the rock, and these interactions may affect shale rocks in various ways, such as dissolution of minerals in the rock matrix and re–precipitation of dissolved minerals [15,16]. Studies have found that carbonate minerals such as dolomite and calcite are more reactive under ScCO2–water–shale interactions, mainly due to the rapid dissolution kinetics of calcite and dolomite [17,18]. Quartz, feldspar, and clay minerals such as kaolinite, illite, and chlorite can also dissolve in weakly acidic environments [19,20]. However, under different pressure, temperature, and reaction time conditions, different minerals exhibit different changes [10]. Under the same conditions, the degree of mineral dissolution increases with reaction time, with carbonate minerals showing the most intense reactions [21]. Under different temperature conditions, as temperature increases, which affects ScCO2 solubility, not only does the mineral reaction rate accelerate, but the reaction equilibrium state also changes. With the dissolution of clay minerals such as chlorite and illite, as well as potassium feldspar and sodium feldspar, the released Ca2+, Mg2+, Fe2+ and other metal cations produce new carbonate mineral precipitates at higher temperatures [22]. Therefore, understanding these possible interactions is crucial for evaluating performance changes after ScCO2 acts on shale gas reservoirs.
ScCO2–water–rock interactions also significantly affect shale pore structure characteristics [23,24,25]. IUPAC classifies shale pores by size: micropores (<2 nm), mesopores (2–50 nm), and macropores (>50 nm) [26,27]. Existing studies have found significant changes in shale pore structure under ScCO2–water action through various technical methods, including low–pressure nitrogen gas adsorption (N2GA) [28], CO2 adsorption (CO2GA) [29], and mercury intrusion capillary pressure (MICP) [30]. Wang et al. [31] employed N2GA and FE–SEM to investigate the effects of ScCO2 on shale pore–throat structures under high–temperature and high–pressure conditions, and the results indicated that both BET specific surface area (SSA) and pore volume (PV) increased with rising temperature and pressure. Jiang et al. [10] used FE–SEM and MICP to study the effects of ScCO2 on shale microstructure, finding that increasing treatment time, pressure, and temperature enables ScCO2 to extract more organic matter and widen gas flow channels. In addition to these studies mainly focusing on microstructural and pore-scale observations, fractal theory has been increasingly applied in recent years to quantitatively describe pore structure complexity. Zhou et al. [32] used X–ray diffraction (XRD) and N2GA to analyze the changes in shale after ScCO2–water treatment. Increasing pressure decreased specific surface area (SSA) while increasing porosity and average pore size, improving connectivity and reducing fractal dimension. Lu et al. [30] employed N2GA, MICP, and FE-SEM to analyze the effects of ScCO2–water treatment, revealing that carbonate and feldspar minerals in shale underwent significant dissolution, accompanied by secondary precipitation of clay minerals, this led to a notable increase in SSA and micropore abundance, as well as an elevated fractal dimension, indicating enhanced surface roughness and increased structural complexity of the pores. In addition to reservoir-scale and pore–scale studies, broader engineering perspectives have also been explored. For example, Jiang et al. [33] developed CO2–resistant latex materials for shale reservoir cementing, highlighting the necessity of addressing CO2–induced alterations at both wellbore and reservoir scales.
However, single fractal models are limited to characterizing one type of elementary fractal behavior through a sole parameter–the fractal dimension (D0)–which quantifies structural irregularities within bounded size ranges [34,35,36]. Heterogeneous rock formations present pore size distribution (PSD) curves that demonstrate stochastic fluctuations spanning multiple pore diameter ranges, often displaying diverse self–similar patterns [37]. Such structural heterogeneity renders single fractal dimension inadequate for comprehensive PSD characterization [38]. To address these limitations, multifractal methodology offers solutions for analyzing intricate pore architectures in heterogeneous geological formations. This approach represents either an enhanced fractal framework or a set of monofractal components [39]. The technique dissects self–similar distributions into interconnected fractal subsets, each possessing distinct singularity characteristics that yield enhanced structural detail. Recent applications of multifractal methodology have encompassed various lithologies, including carbonate formations and unconventional shale gas [40,41,42]. Nevertheless, investigations examining microstructural modifications in shale following ScCO2 treatment through multifractal approaches remain unexplored.
In the context of this study, the application of multifractal analysis is particularly important and innovative. Unlike previous work that mainly relied on conventional pore characterization methods, this study applies the multifractal approach under controlled ScCO2–water–shale reaction conditions to achieve a unified quantitative characterization of pore heterogeneity (Δa, D−10D10) and connectivity (H). This provides new evidence for understanding how ScCO2–water interactions at different burial depths modify the shale pore system–evidence that could not be captured by traditional analytical methods.
Although significant progress has been made in understanding the mineral reactions and pore-scale modifications of shale under ScCO2 or water alone, comprehensive evaluations that integrate full–scale pore characterization and multifractal analysis remain scarce. The heterogeneous nature of shale pore networks, coupled with the complexity of ScCO2–water–shale interactions under different burial conditions, makes it difficult to accurately predict reservoir performance and CO2 storage potential. To address these issues, this study uses XRD testing to analyze mineral composition changes, comprehensively uses CO2GA, N2GA, and MICP for joint pore characterization, uses scanning electron microscopy to observe mineral and pore changes, and combines multifractal theory to analyze the heterogeneity and connectivity change characteristics of shale pore structures and discuss their influencing factors.

2. Materials and Methods

2.1. Shale Samples

Four representative shale samples were selected from three major shale gas enrichment formations in southern China, collected from the Qiongzhusi Formation, Wufeng Formation, and Longmaxi Formation. The Qiongzhusi Formation samples (numbered Q1 and Q2) were collected from Well Qudi-1 in the eastern Yunnan block, with sampling depths of 1152.74 m (Q1) and 1170.15 m (Q2), respectively. The strata mainly consist of shallow-water shelf black shale, with high organic matter abundance [43], making them representative. The Wufeng Formation sample (W) and Longmaxi Formation sample (L) were collected from Wells Anye-2HF and Anye-3HF in the Zheng’an block of northern Guizhou, with sampling depths of 1970 m (W) and 2479 m (L), respectively. This area represents typical deep-water shelf facies [44] and is currently the main formation for shale gas exploration and development in China.
Mineral compositions vary significantly among samples from different formations (Table 1). Since the accuracy of clay mineral detection highly depends on pretreatment methods and test conditions, and pure clay was not extracted in this experiment, clay types were not subdivided. Q1 and Q2 samples show high clay mineral and albite contents of 45.8% and 38.0%, and 27.2%, respectively, while quartz content is relatively low at 21.0% and 28.5%, respectively, with no carbonate minerals detected, showing overall argillaceous characteristics. In contrast, W and L samples are rich in quartz at 66.5% and 58.9%, respectively, with relatively low clay mineral content and carbonate minerals at 5.0% and 8.1%, respectively, showing strong brittleness. Organic geochemical analysis shows that all samples have TOC (Total Organic Carbon) values above 3%, with W and L samples at 4.63% and 4.31%, respectively, slightly higher than Q1 and Q2; Ro values range from 1.36% to 2.03%, indicating that all samples are in the high–maturity to over-maturity stage with good hydrocarbon generation capacity.
Mineral composition analysis of shale specimens (200 mesh powder) employed a Japanese–manufactured Shimadzu XRD–6100 X–ray diffractometer. This instrument features a 3 kW X–ray generator operating within a 2–90° testing range, with specimen rotation maintained at 10 rev/min. Analytical procedures followed the SY/T 5163–2018 [45] industry protocol for whole–rock X–ray diffraction examination. Maximum vitrinite reflectance measurements utilized a German–produced Leitz Orthoplan microscope fitted with photomultiplier tube detection. These analyses adhered to SY/T 5124–2012 [46] industry specifications for shale vitrinite reflectance evaluation. TOC quantification was performed using a German–manufactured Vario TOC analyzer, with sample processing conforming to national standard GB/T 19145–2003 [47].

2.2. Experimental Procedure

Two experimental conditions of 80 °C and 20 MPa (2000 m) and 45 °C and 10 MPa (1000 m) were selected for simulation reactions, with a reaction time of 3 days for both. Samples before reaction and under different reaction conditions were numbered as Untr–, Tr–1000 m, and Tr–2000 m, respectively. CO2 is in a critical state under these temperature and pressure conditions. Samples need to be processed before experiments begin. The particle size for MICP testing is 40–60 mesh. Since MICP testing is destructive to samples, samples for MICP testing are divided into 3 portions: one for pre–reaction testing, and the other two for post-simulation reaction testing. The particle size for N2GA and CO2GA adsorption is 60–80 mesh. Unlike MICP testing, N2GA and CO2GA are non-destructive to samples, so only two sample portions need to be prepared: one for pre–reaction and post–1000 m burial depth simulation testing, and another for post–2000 m burial depth simulation testing. The particle size for XRD analysis is powder less than 200 mesh, with sample preparation the same as for N2GA and CO2GA adsorption testing. Samples for scanning electron microscopy are 1 cm × 1 cm argon-ion-polished blocks, with one prepared for each formation for pre-reaction and post-2000 m burial depth simulation testing.
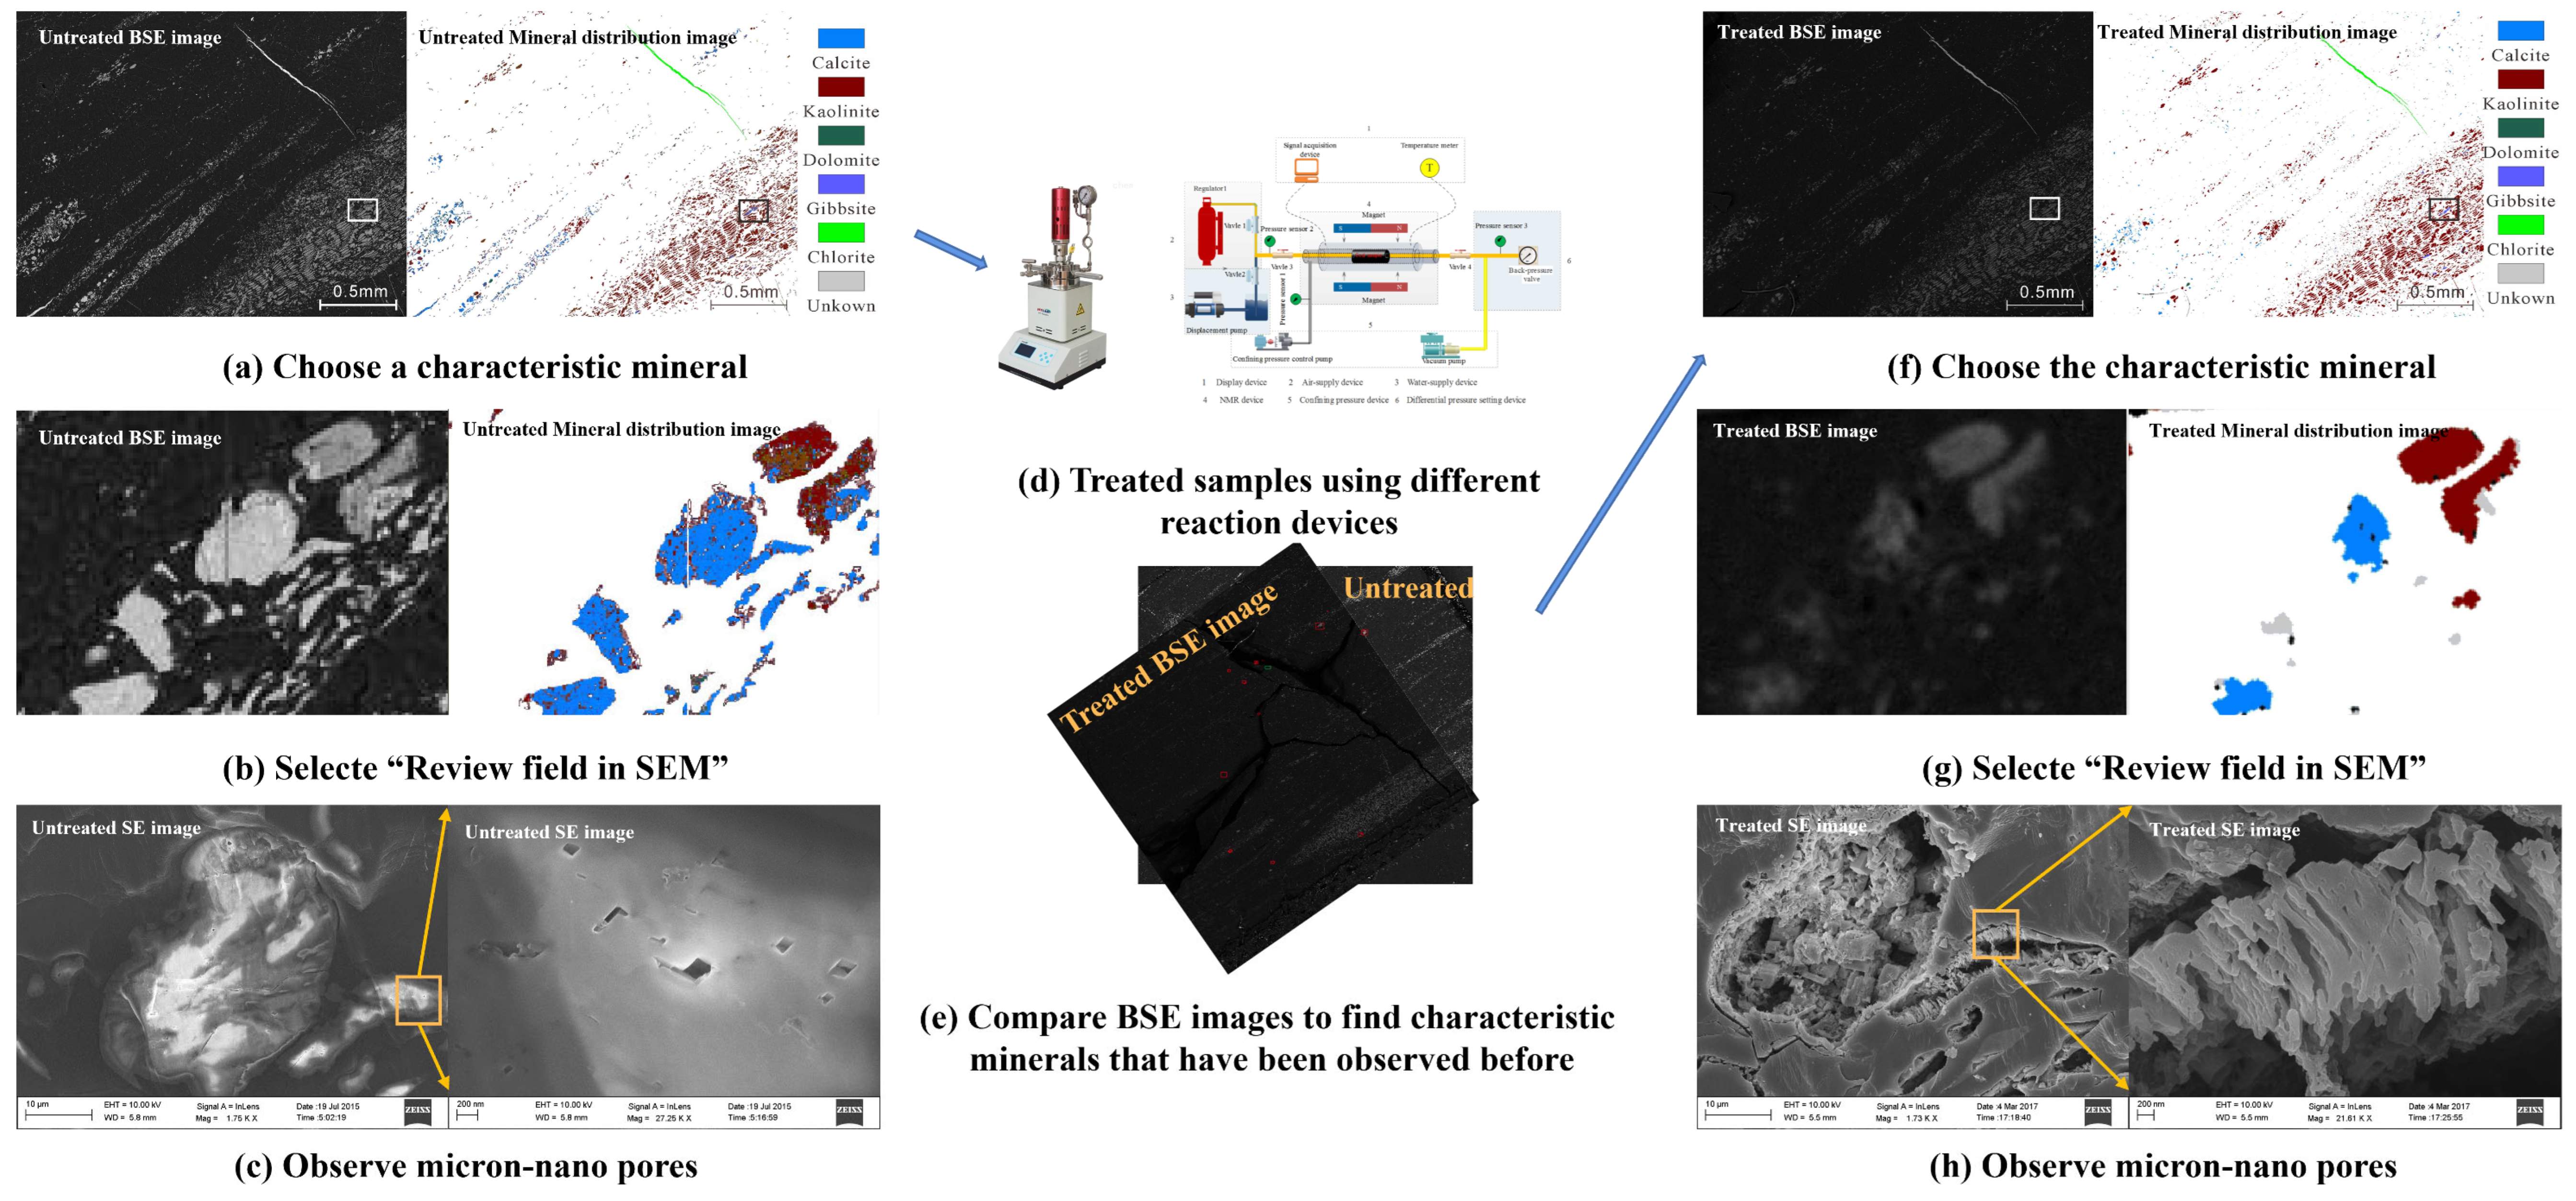
The experimental procedure is shown in Figure 1, with the following steps:
(1)
Prepare the required samples for experiments.
(2)
Place samples in ScCO2–water–rock reaction equipment for reaction under set reaction conditions.
(3)
Use reacted and unreacted samples for MICP, N2GA, CO2GA, XRD, and scanning electron microscopy experiments.
(4)
Analyze pre– and post–reaction experimental data and conduct further research based on multifractal theory.

2.3. Experimental Setup

2.3.1. In-Situ Scanning Electron Microscopy Testing

Before experiments, a thin layer of gold needs to be coated on the surface of argon-ion-polished samples, and conductive tape is used to connect the sample surface with the sample stage to conduct charges, ensuring accurate observation results. Subsequently, mineral components are preliminarily identified through The Advanced Mineral Identification and Characterization System (AMICS). This system consists of a Bruker EDX QUANTAX (Bruker Nano GmbH, Berlin, Germany), a Sigma 300 VP SEM (Carl Zeiss Microscopy GmbH, Jena, Germany), and AMICS control software (M4 TORNADO AMICS). The instrument has a resolution up to 1.2 nm, magnification of 10 to 105 times, with an element detection range from Be (4) to Am (95) and detection limit of 0.1% to 0.5%. For each treatment condition, images were collected as extensively as possible at multiple fields of view to ensure representativeness and reproducibility of the results, rather than setting a fixed number of images. These images were analyzed using the AMICS software for mineral phase recognition. It should be noted that the images were not binarized; instead, mineral phases were recognized directly from EDX mapping within the AMICS system. To observe in-situ mineral changes before and after reaction (Figure 2), specific steps were conducted by comparing BSE images of the same review field, as referenced in the literature [48].

2.3.2. Pore Structure Testing

Pore identification was carried out by combining CO2GA (<2 nm), N2GA (2–50 nm), and MICP (>50 nm) to construct full–scale PSD curves.
MICP testing was performed using an Auto Pore IV 9500 automatic analyzer (Micromeritics Instrument Corporation, Norcross, GA, USA). Before testing, 24 g samples were dried at 60 °C and degassed under 30 μm Hg vacuum for 30 min. The pressure range for mercury intrusion testing was 1.59 kPa to 227.5 MPa. From the experimental mercury intrusion curves, combined with the Washburn equation [49], characteristic parameters, including pore volume (PV), SSA, and PSD, can be obtained.
N2GA/CO2GA analysis uses TriStarII3020 rapid specific surface area analyzer (Microtrac, Montgomeryville, PA, USA) and Autosorb iQ Station 1 physical adsorption systems for pore structure evaluation. Sample preparation required vacuum degassing powdered specimens at 110 °C for a minimum of 8 h to eliminate moisture and volatile compounds [50]. N2 and CO2 adsorption/desorption isotherms were acquired at 77 K and 273 K, respectively, spanning relative pressure ranges of 0.01–0.98 and 0.01–0.03, respectively. For N2GA data, the SSA was computed using the Brunauer–Emmett–Teller (BET) model [51], while PV determination utilized the density functional theory (DFT) model [52]. PSD was characterized using BJH models. For CO2GA data, the DFT model facilitated the calculations for SSA, PV, and the characterization of PSD [53].

2.4. Multifractal Analysis

The box-counting methodology served to examine multifractal characteristics within the dataset [54]. Multifractal evaluation of porous materials utilized pressure or relative pressure spans from MICP, N2GA, and CO2AG measurements as the complete range, subsequently partitioned into N subintervals of scale ε through bisection techniques.
Taking N2GA experiments as an example, the relative pressure (P/P0) serves as the length scale ε. Initially, the mass probability for the i–th box needs to be determined [55]:
p i ( ε ) = V i ( ε ) i = 1 N ( ε ) V i ( ε )
where Vi (ε) represents the adsorption amount within the i–th pressure interval and N (ε) denotes the total number of boxes at scale ε.
To quantitatively characterize the distribution of gas adsorption within each box, the mass probability function for the i–th box follows a scaling relationship:
p i ( ε ) ~ ε α i
αi represents the singularity exponent, which reflects local singularity strength [56]. Elevated values correspond to enhanced data smoothness or uniformity, while reduced values imply heightened variability or structural heterogeneity. It should be noted that αi is not a direct measure of gas adsorption amount but rather an indirect indicator derived from adsorption-based pore structure data, reflecting the uniformity or heterogeneity of the adsorption process.
For systems, the box count N (ε) demonstrates exponential growth with varying scale ε:
N α ( ε ) ~ ε f ( α )
Nα (ε) represents the count of boxes with singularity strength between α and α + dα, while f(α) denotes the multifractal singularity spectrum, representing the fractal dimension of subsets sharing identical singularity indices. The parameters α and f(α) can be computed using the formulation proposed by Chhabra and Jensen [57]:
α i = 1 N ( ε ) μ i ( q , ε ) ln p i ( ε ) / ln ε
f ( α ) i = 1 N ( ε ) μ i ( q , ε ) ln μ i ( q , ε ) / ln ε
μ i ( q , ε ) = p i q ( ε ) i = 1 N ( ε ) p i q ( ε )
q represents the order moment or weight factor, with values within the range [−∞, +∞]. For this analysis, q values were set as integers from −10 to 10 with a step size of 1; α and f(α) parameters were derived through linear regression analysis of Equations (4) and (5). Multifractal applications require defining a probability distribution function as:
u ( q , ε ) = i = 1 N ( ε ) p i q ( ε ) ε r ( q )
where τ(q) represents the mass scaling function of order q, defined as:
τ ( q ) = l i m ε 0 log u ( q , ε ) log ε
Consequently, the generalized dimension Dq related to q can be expressed as [38]:
D q = τ ( q ) q 1 ( q 1 )
When q = 1, Dq becomes:
D 1 = l i m ε 0 i = 1 N ( ε ) p i ( ε ) log p i ( ε ) log ε
The connection between generalized fractal dimensions and multifractal spectra is governed by the Legendre transformation, formulated as:
a ( q ) = d τ ( q ) d q f ( a ) = q × a ( q ) τ ( q )
This creates the linkage between independent parameters q and τ and dependent parameters α and f(α), offering a complete analytical framework for multifractal characterization. The calculations were carried out using Python 3.13, and the plotting of the multifractal spectra was performed in MATLAB R2024a [58].

2.5. Correlation Analysis

Correlation analysis was performed using Microsoft Excel and MATLAB. First, scatter plots were generated for each pair of variables in Microsoft Excel, and a linear trendline was fitted to the data. The coefficient of determination (R2) was calculated to evaluate the strength of the correlation, while the slope of the trendline was used to determine the direction of the relationship: a positive slope indicated a positive correlation, whereas a negative slope indicated a negative correlation. Finally, MATLAB was employed to generate correlation heatmaps among the variables, which facilitated a clearer and more comprehensive discussion of the results.

3. Results

3.1. Changes in Mineral Compositions

The ScCO2–water system showed different degrees of alteration to mineral compositions (Figure 3). From the perspective of simulated formation depths, reactions under 1000 m and 2000 m depth conditions showed different characteristics. Under 2000 m depth conditions, due to higher temperature and pressure, the ScCO2–water reaction with shale was generally enhanced. Specifically, the magnitude of mineral composition changes for Q1 and Q2 samples under 2000 m depth was generally greater than under 1000 m simulated depth; carbonate mineral dissolution in W and L samples was more pronounced under 2000 m depth conditions. Quartz content in Q1 and Q2 samples increased by approximately 23.3% (1000 m)–39.5% (2000 m) and 9.5% (1000 m)–11.6% (2000 m), respectively, compared to pre-treatment, while clay mineral content decreased by about 23.6% (1000 m)–22.7% (2000 m) and 3.2% (1000 m)–8.9% (2000 m), respectively. Although no carbonate minerals were detected, scanning electron microscopy results showed observable carbonate minerals and carbonate mineral dissolution phenomena in Qiongzhusi Formation samples. Conversely, Quartz content in W and L samples decreased by about 9.9% (1000 m)–6.0% (2000 m) and 5.4% (1000 m)–5.6% (2000 m), respectively, compared to pre-treatment, while clay mineral content increased by approximately 11.2% (1000 m)–10.7% (2000 m) and 20.4% (1000 m)–19.5% (2000 m), respectively. Carbonate content also decreased in both W and L samples, by about 20.0% (1000 m)–36.0% (2000 m) and 12.3% (1000 m)–27.2% (2000 m), respectively. Albite content showed minimal overall change with no clear trend, and pyrite content decreased in most samples compared to pre-treatment. Therefore, alterations in minerals following the reaction of ScCO2 with water and shale are associated with intricate chemical processes that relate to the acidic conditions created by the interaction of CO2 and water, as widely reported in previous studies [19,31,59].
Due to XRD detection limits, trace minerals visible under SEM (e.g., carbonates) may remain unidentified. FE–SEM observations provide essential verification for comprehensive mineral composition analysis, as detailed in Section 4.1.

3.2. Changes in the Pore Structure

3.2.1. Changes in Pore Types

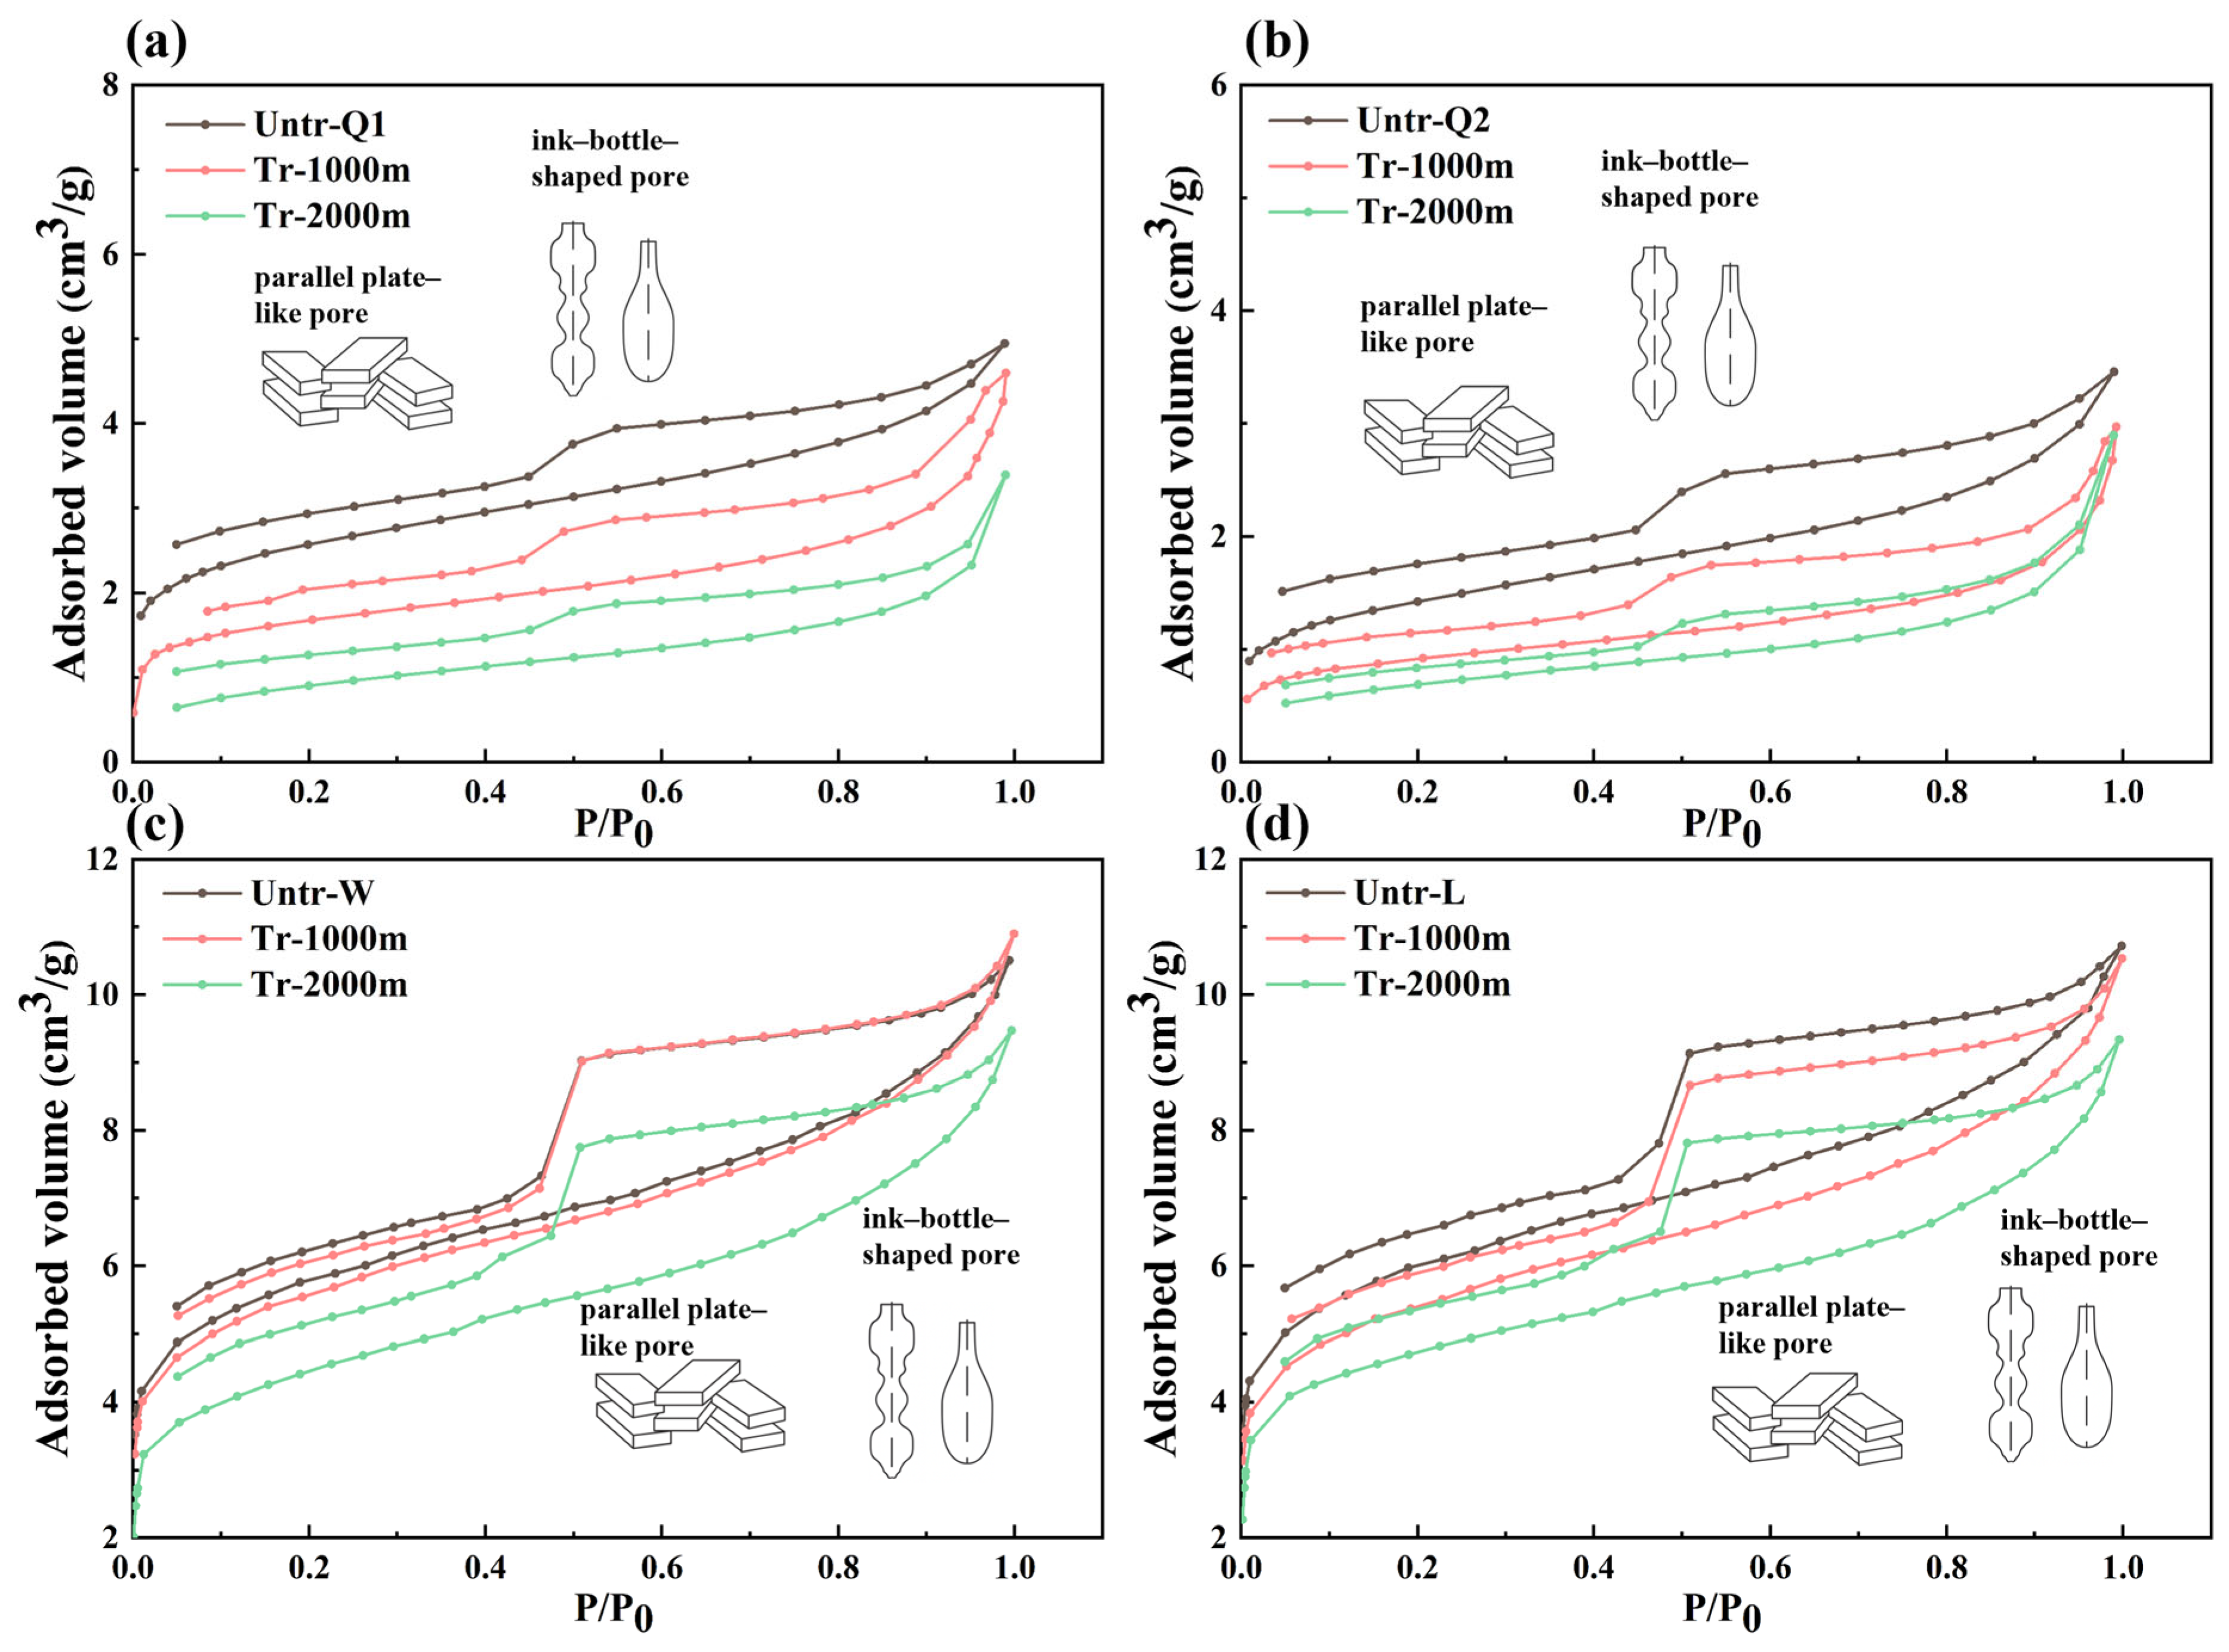
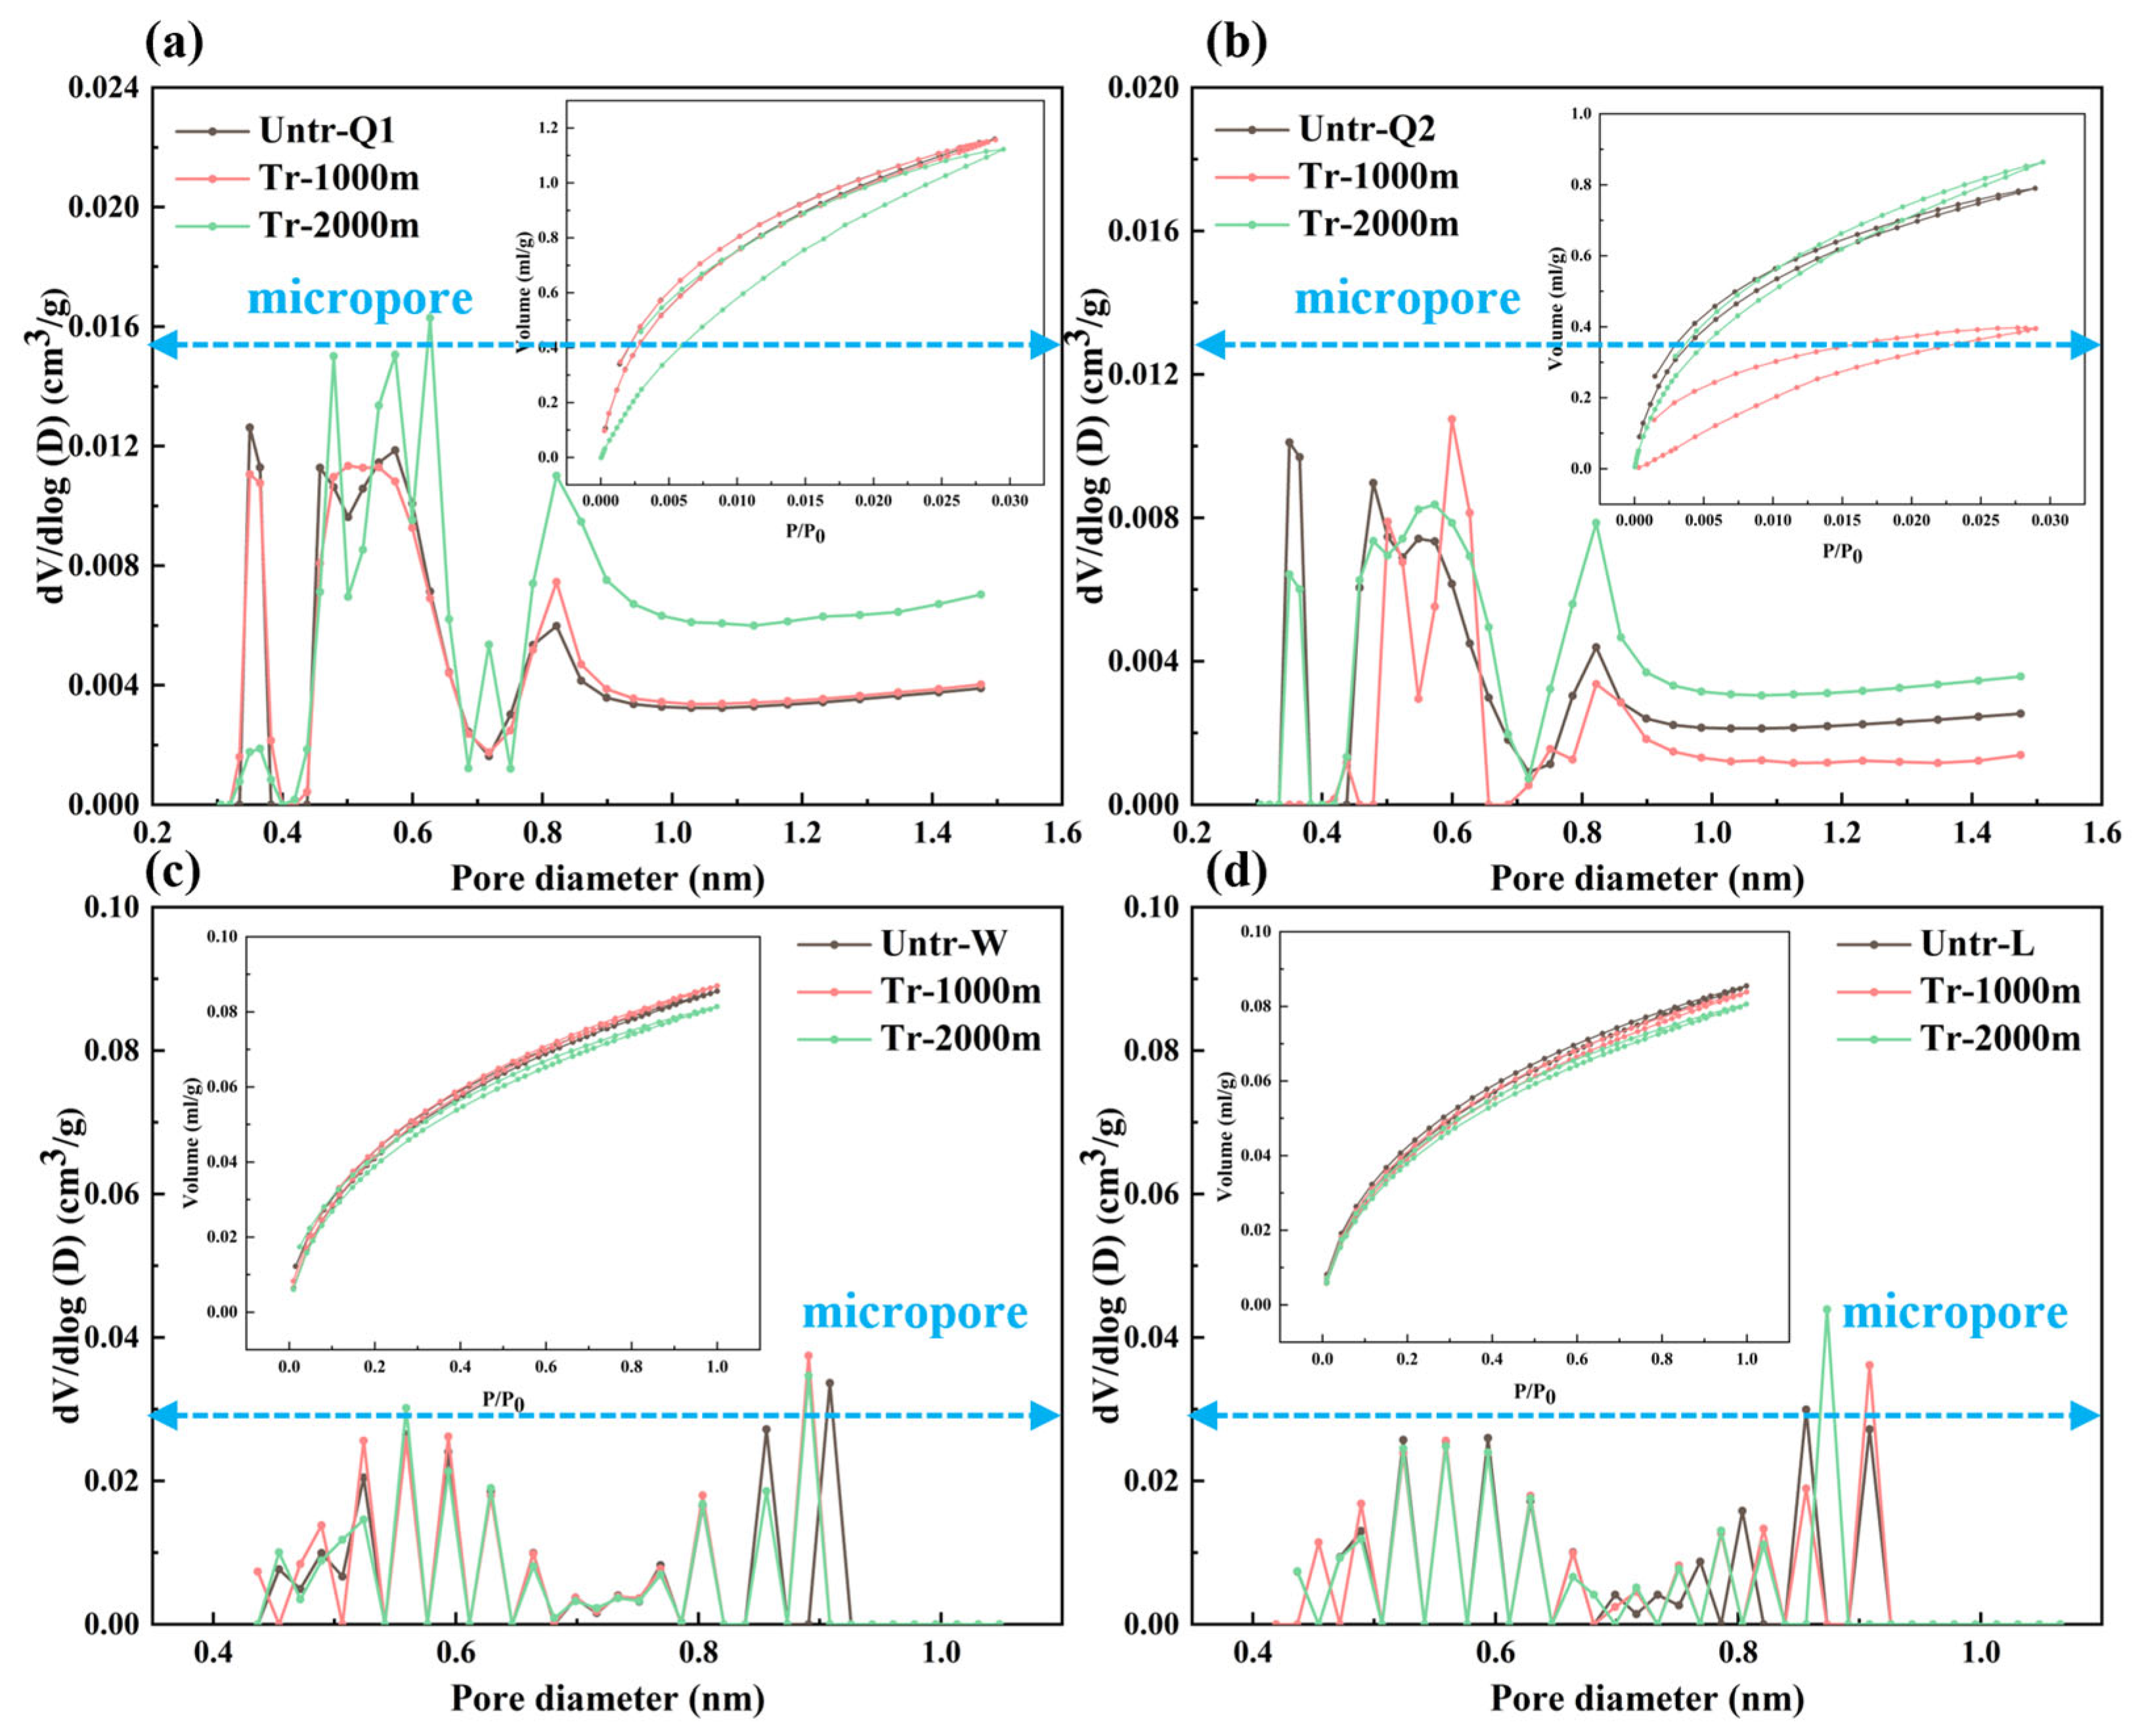
The N2GA isotherms of both untreated and treated shale are depicted in Figure 4. Based on IUPAC, all isotherms observed are of Type IV and feature hysteresis loops that display H3 and H4 characteristics. This suggests that the samples primarily contain slit-shaped and parallel plate–like pores, with only a minor presence of ink–bottle–shaped pores [29,49]. Moreover, the isotherms and hysteresis loop types of the untreated and treated samples remained unchanged, indicating that the ScCO2–water–shale reaction did not change the pore types. The sample adsorption isotherms can be divided into three stages: at P/P0 < 0.5, micropores are filled with N2; between P/P0 of 0.5–0.9, obvious hysteresis loop phenomena appear with multilayer adsorption occurring and localized capillary condensation; while in the P/P0 > 0.9 region, adsorption amount increases rapidly due to significant capillary condensation in mesopores and macropores, reaching maximum adsorption at P/P0 = 1.

3.2.2. Changes in Pore-Structure Parameters

MICP Test
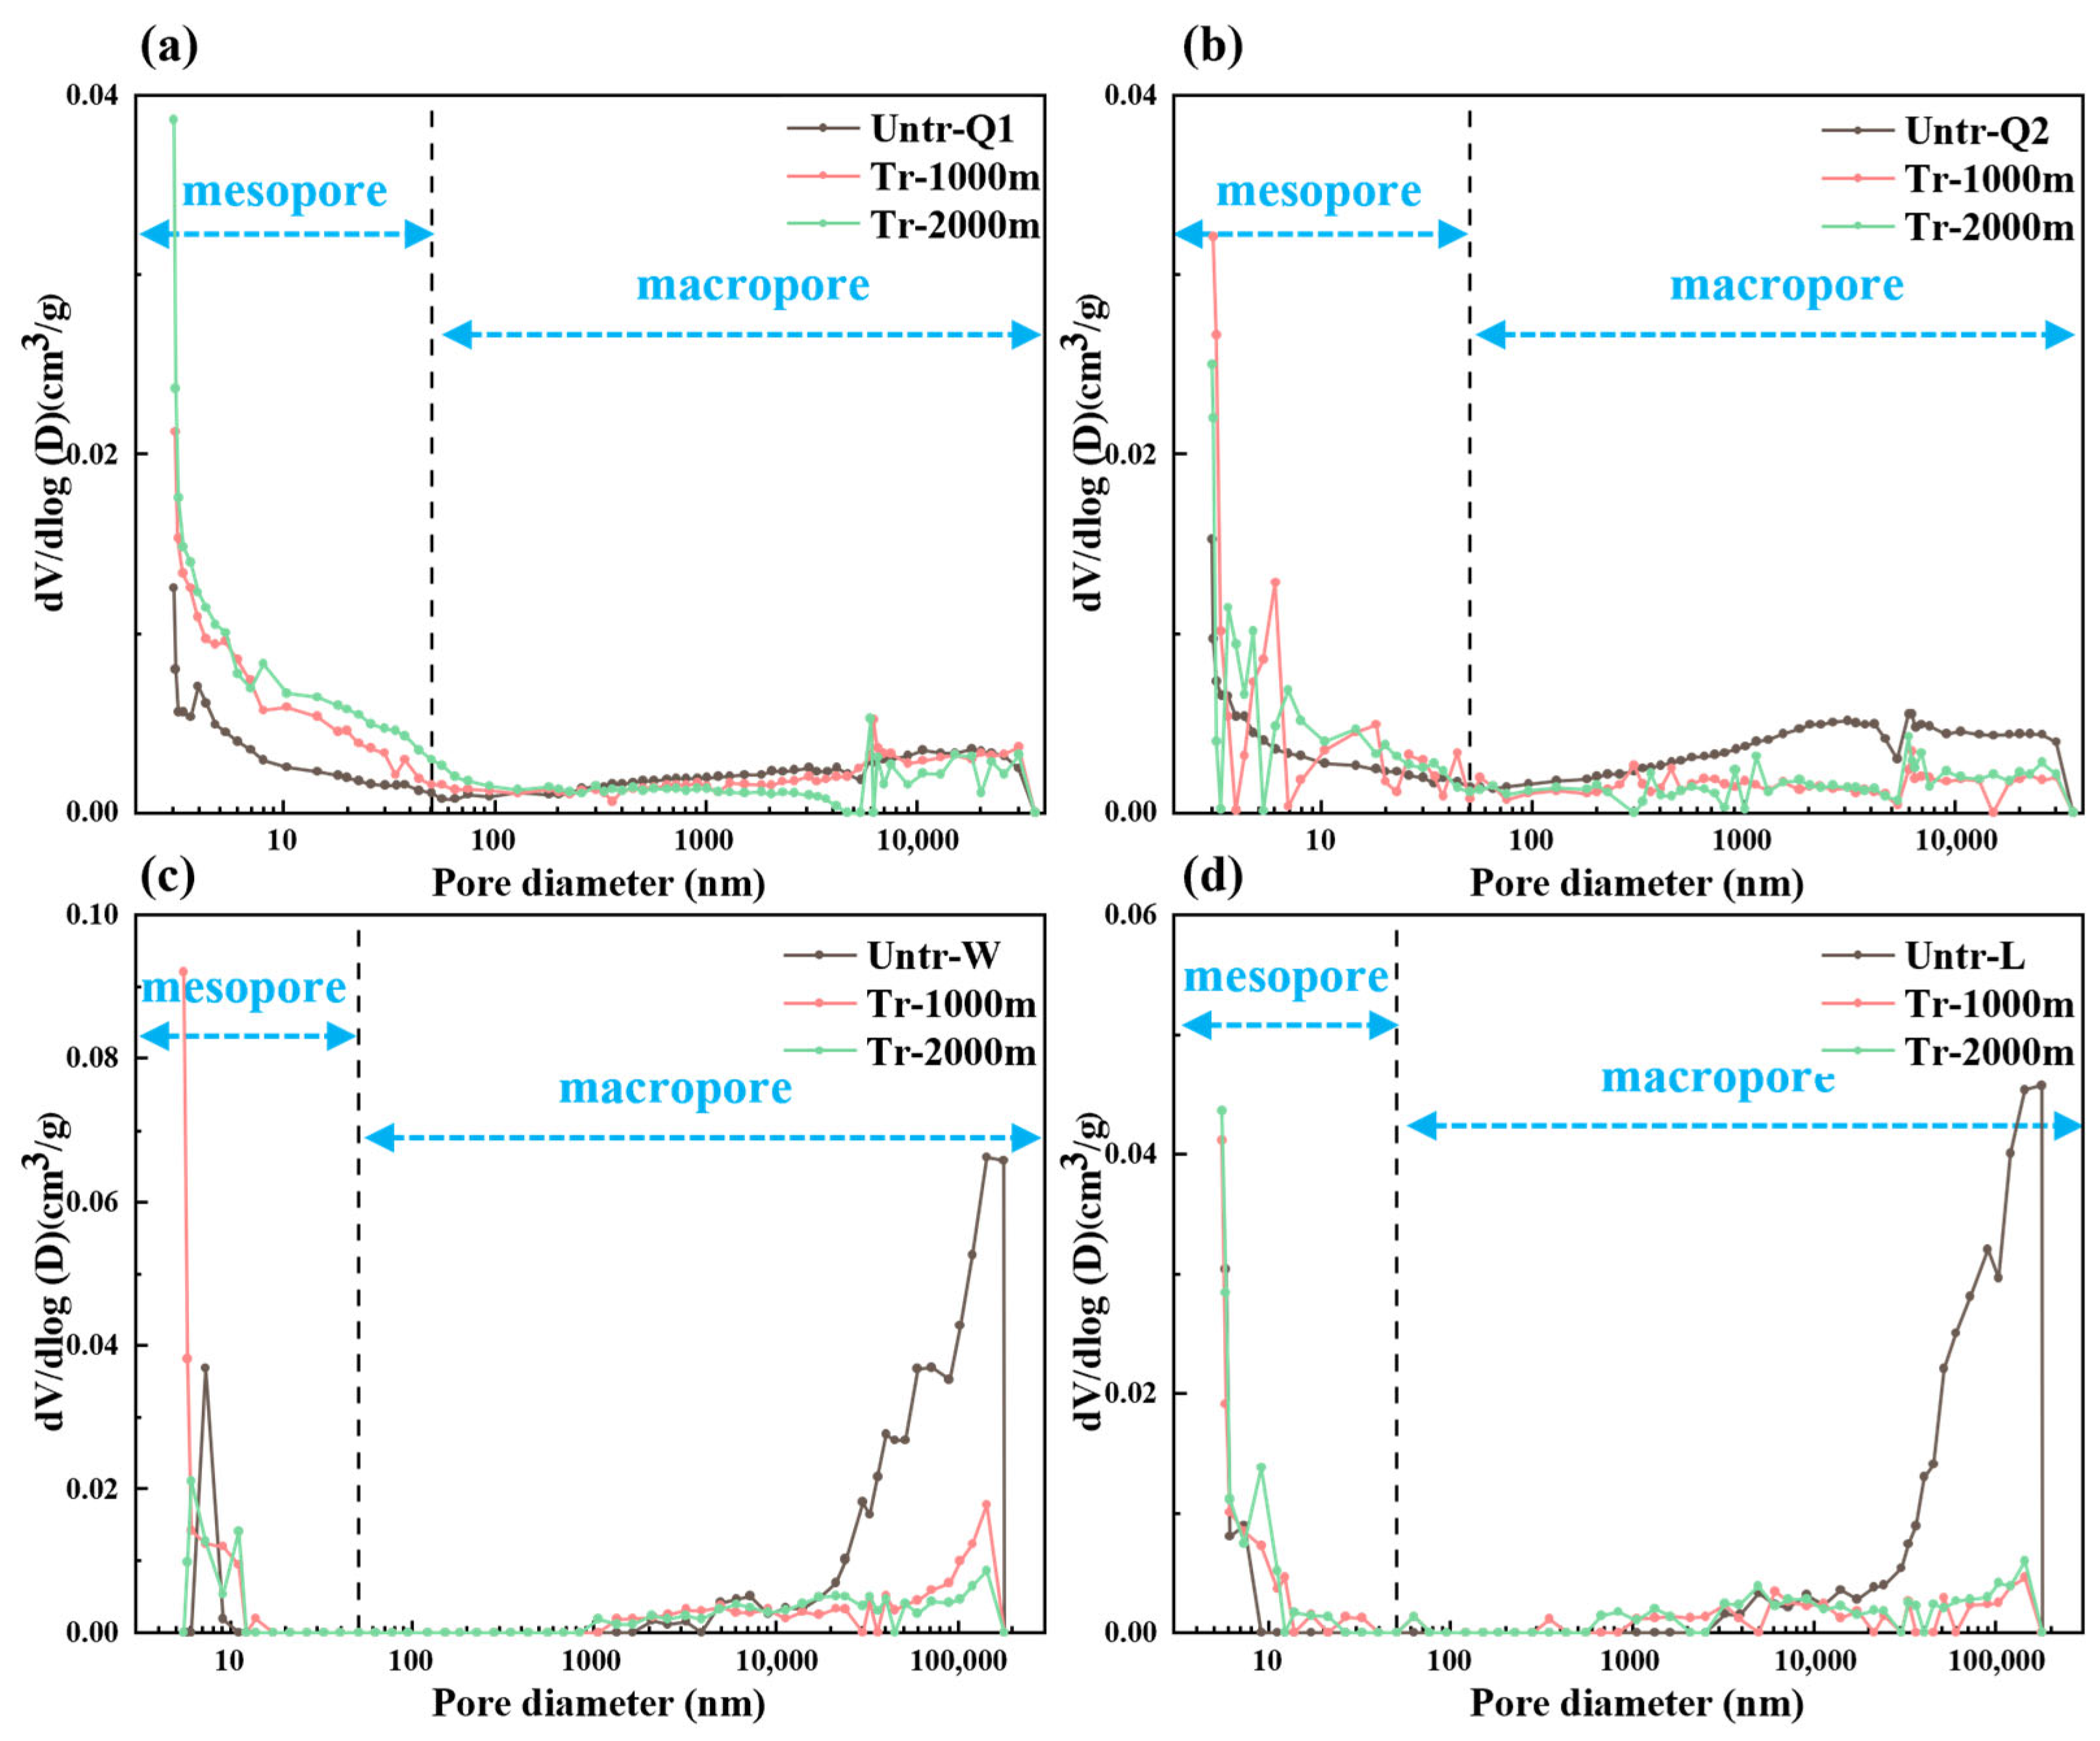
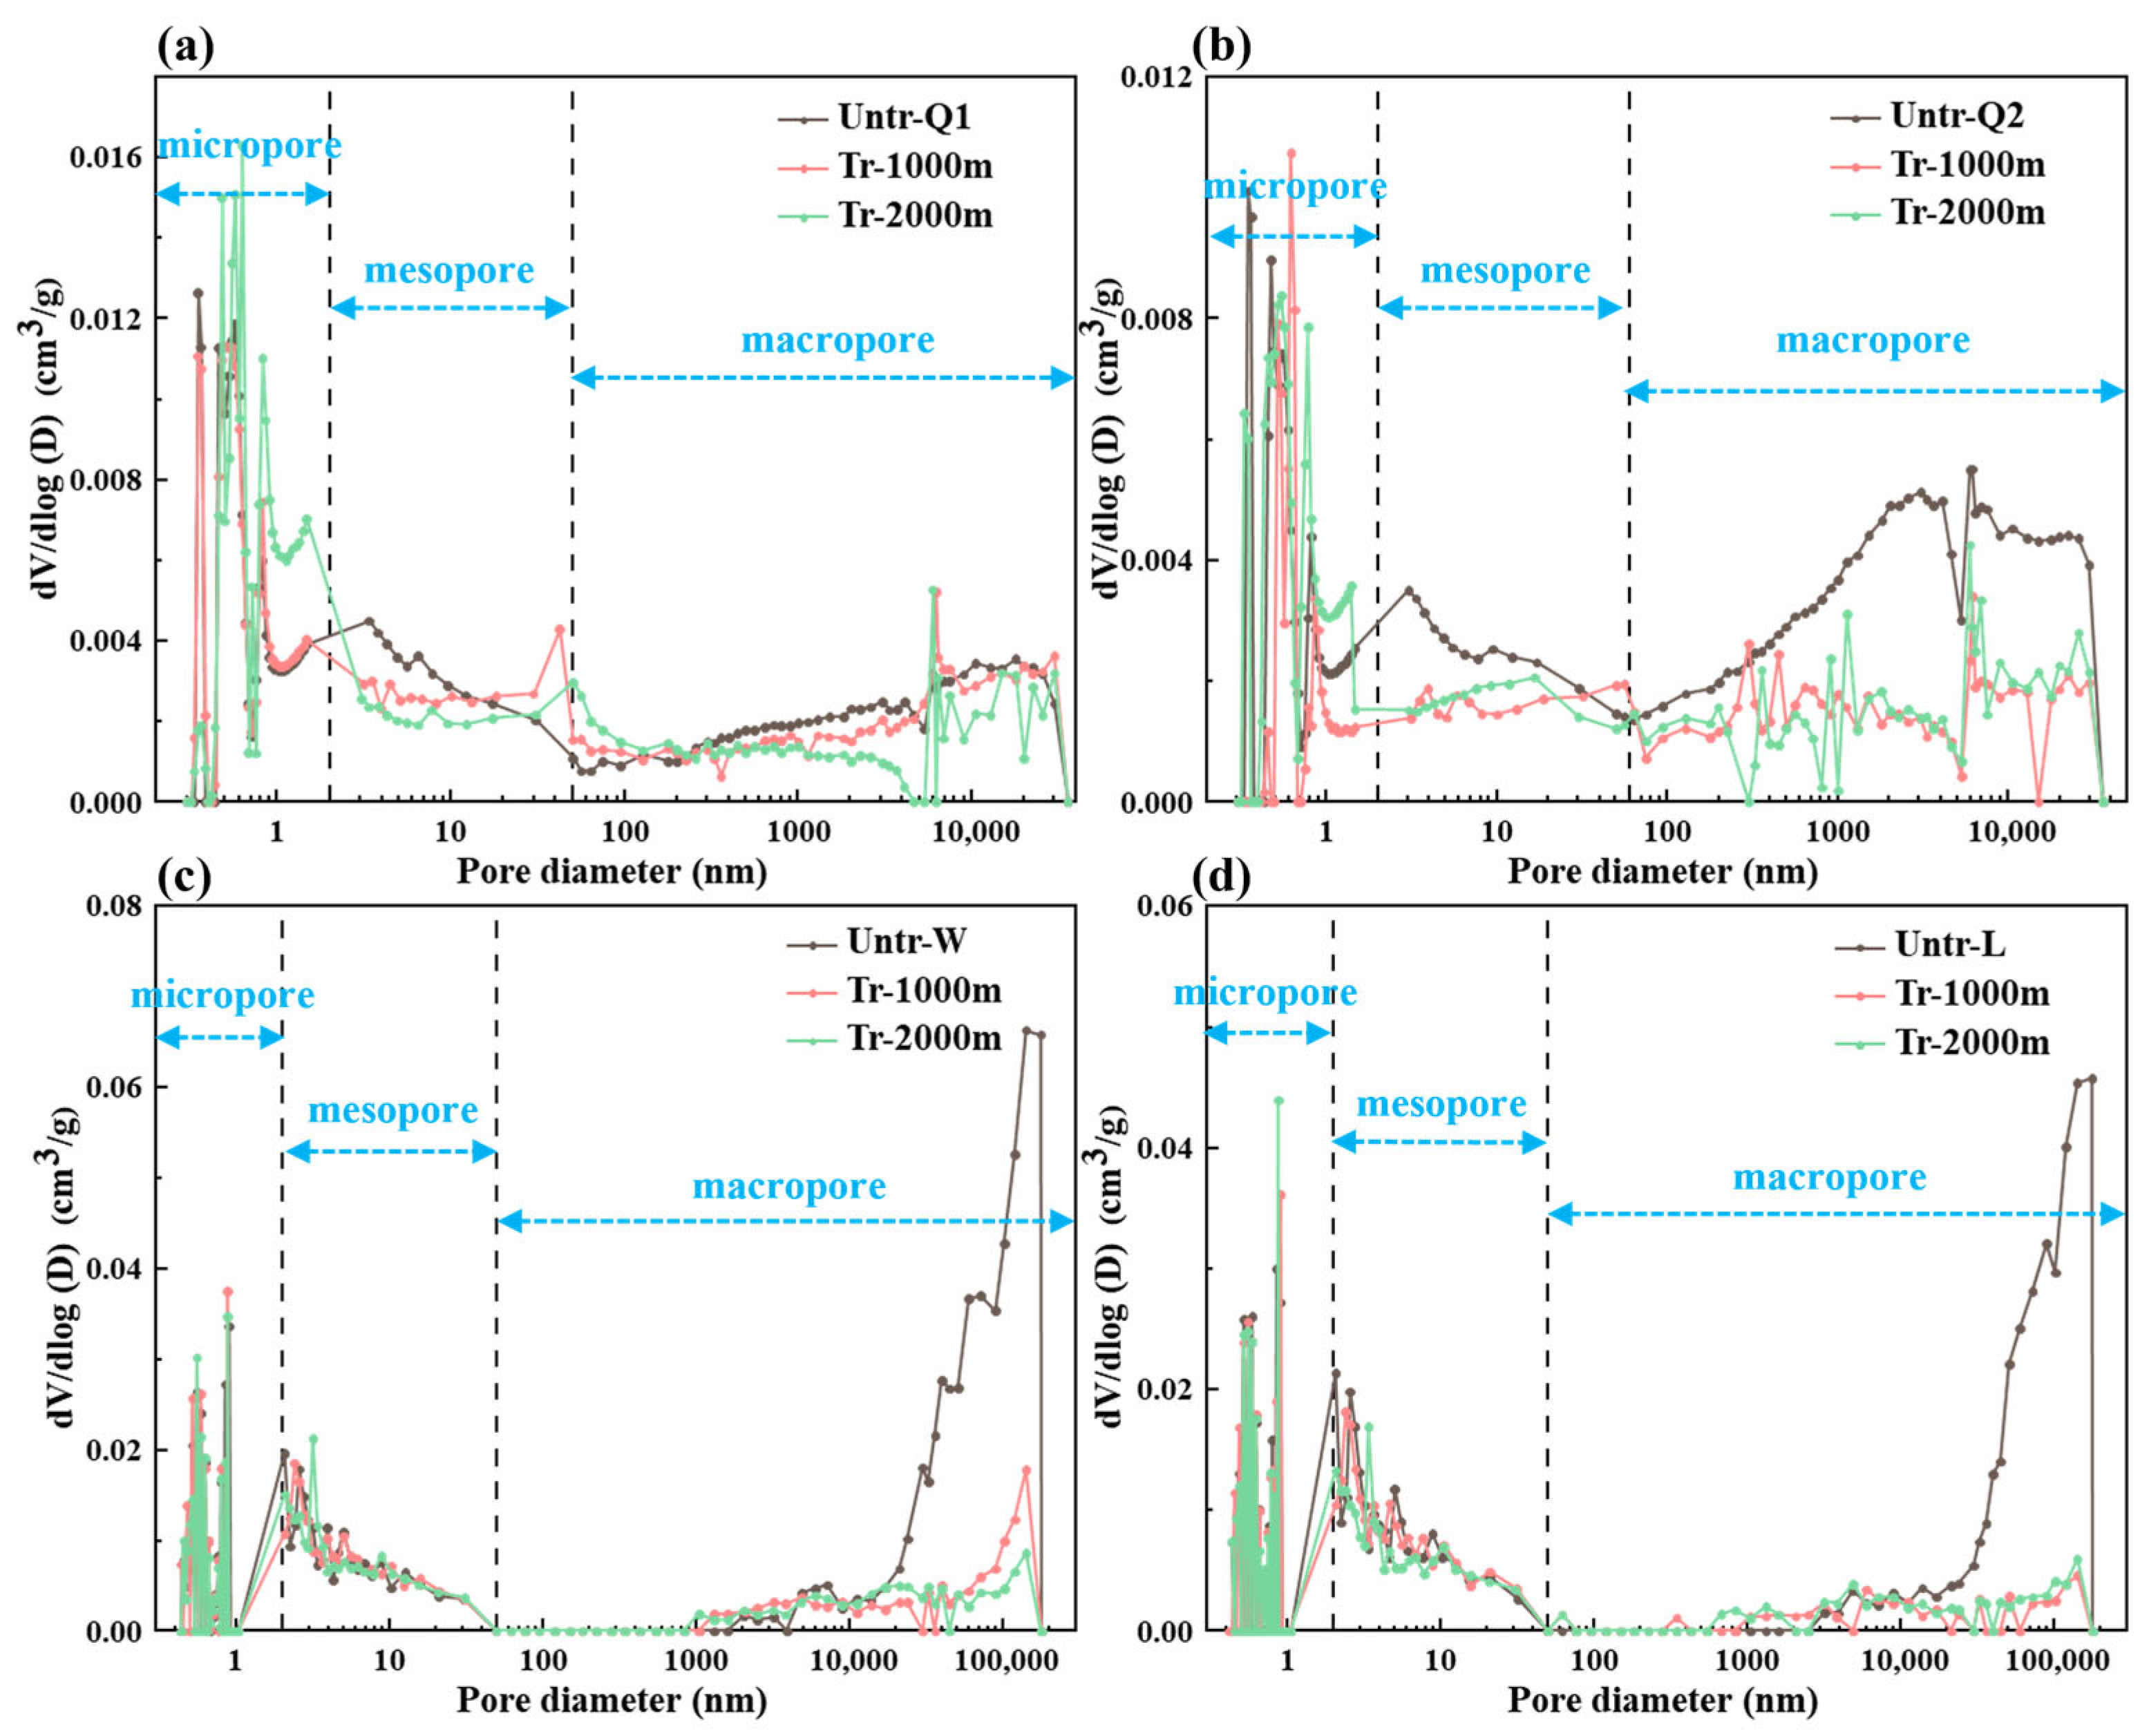
MICP test results demonstrate the PSD characteristics of samples (Figure 5). According to the IUPAC classification, pores are categorized as micropores (<2 nm), mesopores (2–50 nm), and macropores (>50 nm) [26,27]. Samples Q1 and Q2 exhibit similar PSD characteristics to W and L, all showing bimodal distribution, with pores in samples Q1 and Q2 mainly concentrated in two ranges of 2–100 nm and 1–40 μm; while pores in W and L samples are primarily distributed in the ranges of 4–10 nm and 10–200 μm (Figure 5). After the ScCO2–water–shale reaction, the PSD characteristics of the samples remained unchanged, with abundant mesopores and macropores still being developed. However, the reaction altered the PSD curves, leading to changes in pore volume within different pore size ranges.
MICP can provide more accurate characterization for macropores. In the initial state, the macropore PV of W and L was significantly higher than Q1 and Q2, with W and L samples at 0.0335 and 0.0227 cm3/g, respectively, while Q1 and Q2 were only 0.0059 and 0.0098 cm3/g (Table 2). The ScCO2–water–rock reaction produced distinctly different effects on the macropore structure of the two groups of samples. The macropore PV of all four samples decreased after reaction, but the reduction in macropore PV of W and L samples was significantly greater than that of Q1 and Q2 samples. Conversely, the macropore SSA of all four samples generally increased after the reaction but similarly showed that the change magnitude of macropore SSA in W and L samples was greater than in Q1 and Q2 samples. Higher temperature and pressure conditions make the reactions between ScCO2 and water and shale more intense. Specifically, the change rates of macropore PV and SSA under 2000 m simulation conditions were generally greater than those under 1000 m simulation conditions. After ScCO2–water treatment of shale, on the one hand, the precipitation of secondary minerals leads to decreased PV by blocking some connected macropores [33]; on the other hand, mineral precipitation adheres to pore walls, and this change in pore walls increases SSA while reducing PV [29].
N2GA Test
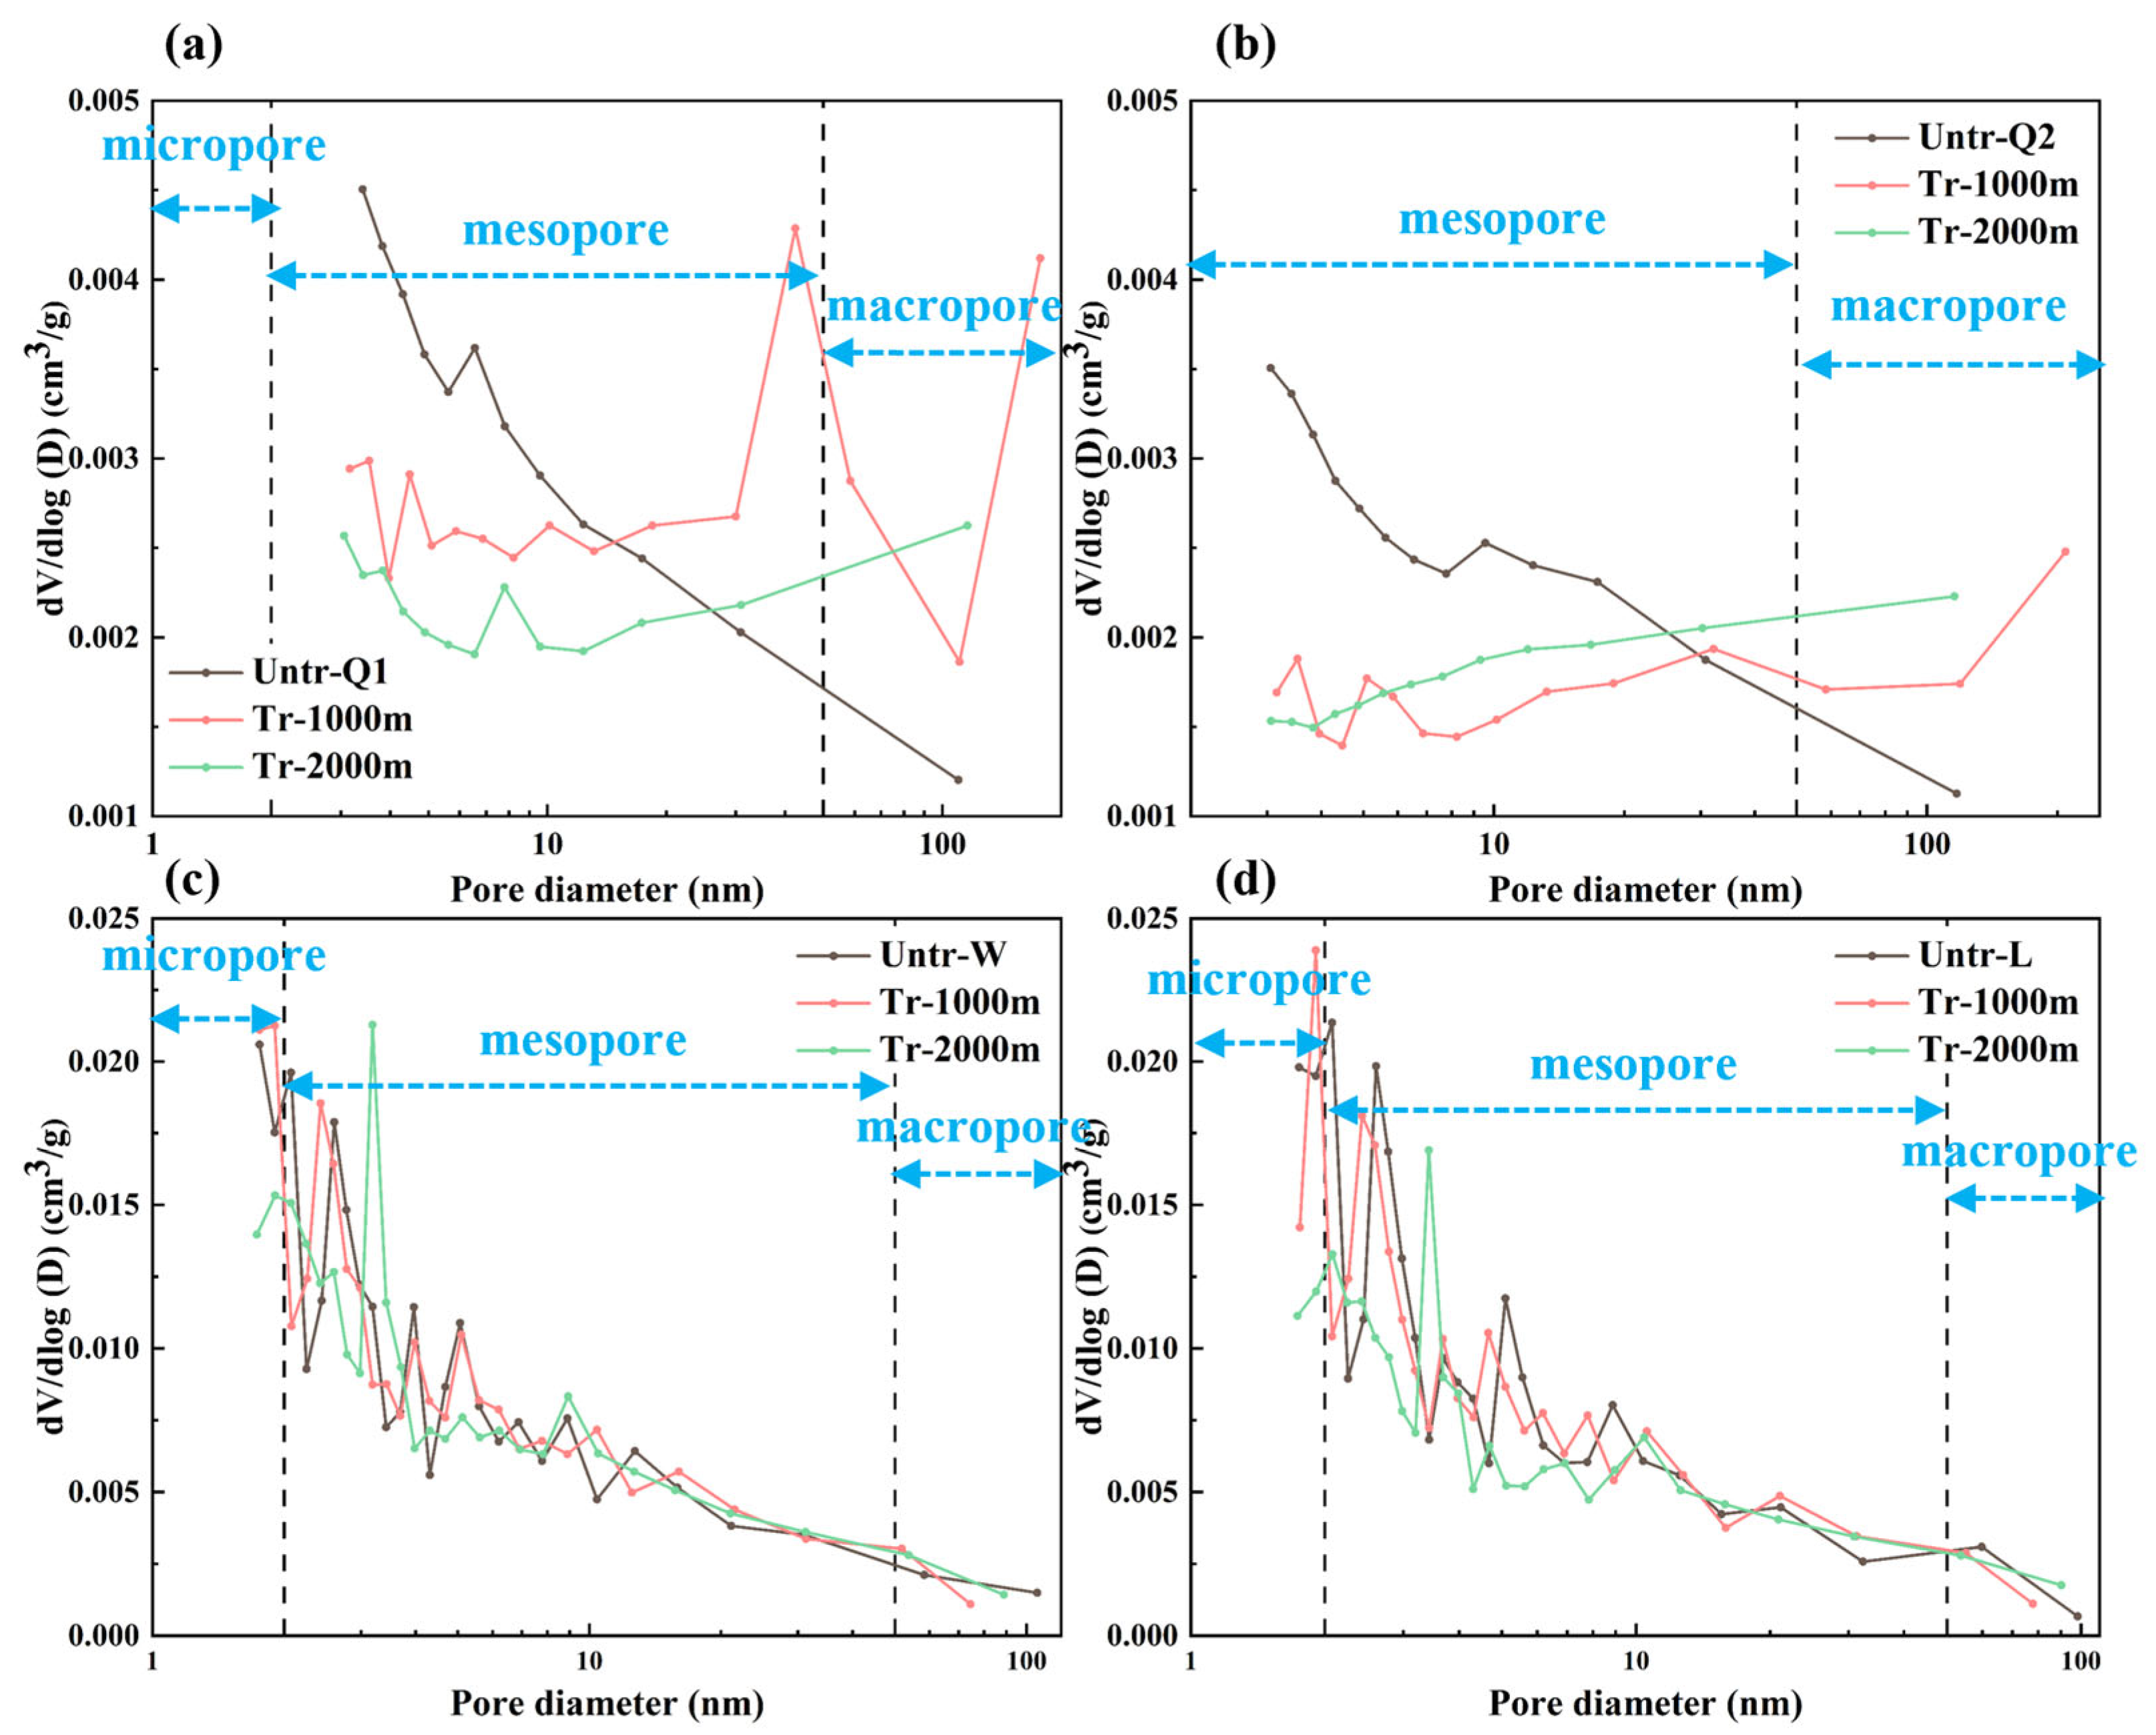
PSD curves from N2GA tests appear in Figure 6. PSD shows that Q1 and Q2 have similar PSD, W and L have similar PSD, and the pores of all four samples are mainly concentrated in the range of 2–20 nm (Figure 6). After reaction, the PSD characteristics of Q1 and Q2 changed, with peak values in the 2–20 nm pore size range decreasing and new peaks appearing in the 20–120 nm pore size range, which may be due to carbonate mineral dissolution causing some smaller mesopores to transform into macropores. The PSD characteristics of W and L remained unchanged after the reaction. However, the reaction altered the PSD curves, leading to changes in pore volume within different pore size ranges.
Compared to MICP, N2GA can provide more accurate characterization for mesopores. In the initial state, the mesopore PV (W: 0.0101 cm3/g, L: 0.0113 cm3/g) and SSA (W: 18.85 m2/g, L: 19.54 m2/g) of Wufeng and Longmaxi Formation samples were significantly higher than the mesopore PV (Q1: 0.0056 cm3/g, Q2: 0.0039 cm3/g) and SSA (Q1: 9.27 m2/g, Q2: 5.09 m2/g) of Qiongzhusi Formation samples (Table 3). After the reaction, the mesopore SSA and PV of all four samples generally decreased. Moreover, as the simulated burial depth increased, the reduction in PV and SSA of all four samples became more pronounced. The decrease in PV and SSA reflects a significant reduction in mesopore quantity after ScCO2–water treatment of shale, where secondary mineral precipitation blocks some connected mesopores, or carbonate mineral dissolution causes some smaller mesopores to transform into macropores, both leading to decreased mesopore PV and SSA.
CO2GA Test
The CO2 adsorption isotherms all show a Langmuir pattern, belonging to Type I isotherm according to IUPAC (Figure 7). PSD shows that all samples exhibit multi–peak distribution in the pore size range less than 1 nm, representing the micropore structure in shale, with a relatively small proportion of micropores larger than 1 nm (Figure 7). The peaks of samples Q1 and Q2 are mainly in three pore size ranges: 0.3–0.4 nm, 0.4–0.7 nm, and 0.7–0.9 nm, while W and L have multiple peaks in two ranges of 0.4–0.7 nm and 0.7–0.9 nm. Initial micropore specific surface areas show significant differences, with sample Q1 being the highest (12.099 m2/g), followed by W (8.897 m2/g), L (8.574 m2/g), and Q2 (8.239 m2/g) (Table 4). The micropore PV distribution is relatively uniform, mostly within the range of 0.002–0.004 cm3/g.
After ScCO2–water treatment of shale, samples Q1, W, and L showed stable CO2 adsorption capacity before and after reaction with little change; Q2 sample showed decreased adsorption capacity under 1000 m reaction conditions, while increased under 2000 m reaction conditions. The PSD characteristics of the samples remained unchanged before and after the reaction, with abundant micropores still being developed. However, the PSD curves showed significant changes. Both samples Q1 and Q2 showed decreased peak values in the 0.3–0.4 nm pore size range, new peaks appeared in the 0.4–0.7 nm range, Q1 showed increased peak values in the 0.7–0.9 nm range, while Q2 showed decreased peak values in the 0.7–0.9 nm range only under 1000 m burial depth conditions. Samples W and L showed significant differences in peak changes under different burial depth conditions after the reaction. Samples Q1, W, and L showed small changes in micropore PV before and after the reaction, with minor changes in SSA, which is mainly attributed to the adjustment of the internal micropore space by ScCO2–water. Sample Q2 showed more obvious changes, with decreased SSA and PV under 1000 m conditions, where mineral clogging and precipitation significantly reduced SSA and PV; while under 2000 m conditions, SSA and PV increased, mainly manifesting as micropore expansion by ScCO2–water.
PSD Joint Characterization
The complexity and multi–scale characteristics of shale pore structure make it difficult for a single test method to comprehensively and accurately characterize its complete pore size distribution. MICP testing is more suitable for characterizing macropores (>50 nm); N2GA testing is suitable for precise characterization of mesopores (2–50 nm) but has limited capability for characterizing micropores and macropores; CO2GA testing is used for micropore (<2 nm) analysis but cannot cover larger-sized pores. Therefore, the integrated use of these three test methods for joint characterization can obtain complete pore size distribution information of shale from micropores to macropores, thereby more accurately evaluating the influence mechanism of ScCO2–water–rock reactions on pores of different scales. By integrating the test results of CO2GA (0–2 nm), N2GA (2–50 nm), and MICP (>50 nm), the full–scale PSD curves of shale samples were constructed (Figure 8). Within the micropore range, the reaction mainly changes the internal morphology of pores through chemical action on mineral surfaces, with only Q2 sample showing obvious mineral precipitation and dissolution [29]. The micropore structure of the W and L samples is relatively stable, which may be attributed to their higher quartz content, as quartz exhibits strong chemical stability and provides a more robust pore framework [59]. Changes in the mesopore portion are mainly manifested as general decreases in PV and SSA, with all four samples showing varying degrees of reduction in pore size distribution intensity within the 2–10 nm range, especially more pronounced under 2000 m simulated depth conditions. This change is mainly attributed to the precipitation of secondary minerals, with newly formed mineral precipitates tending to clog some mesopores. In the macropore range, the reduction in macropore volume of W and L samples is significantly higher than that of Q1 and Q2 samples, which is closely related to their initial higher macropore content and the rapid dissolution–reprecipitation process of carbonate minerals.
Overall, the interaction between ScCO2 and water with rock modifies the pore architecture of shale via the combined processes of dissolution and precipitation, with mineral precipitation being significantly higher than mineral dissolution. Higher temperature and pressure also mainly affect changes in mesopore and macropore structures.

3.3. Multifractal Characteristics of the Pore Structure

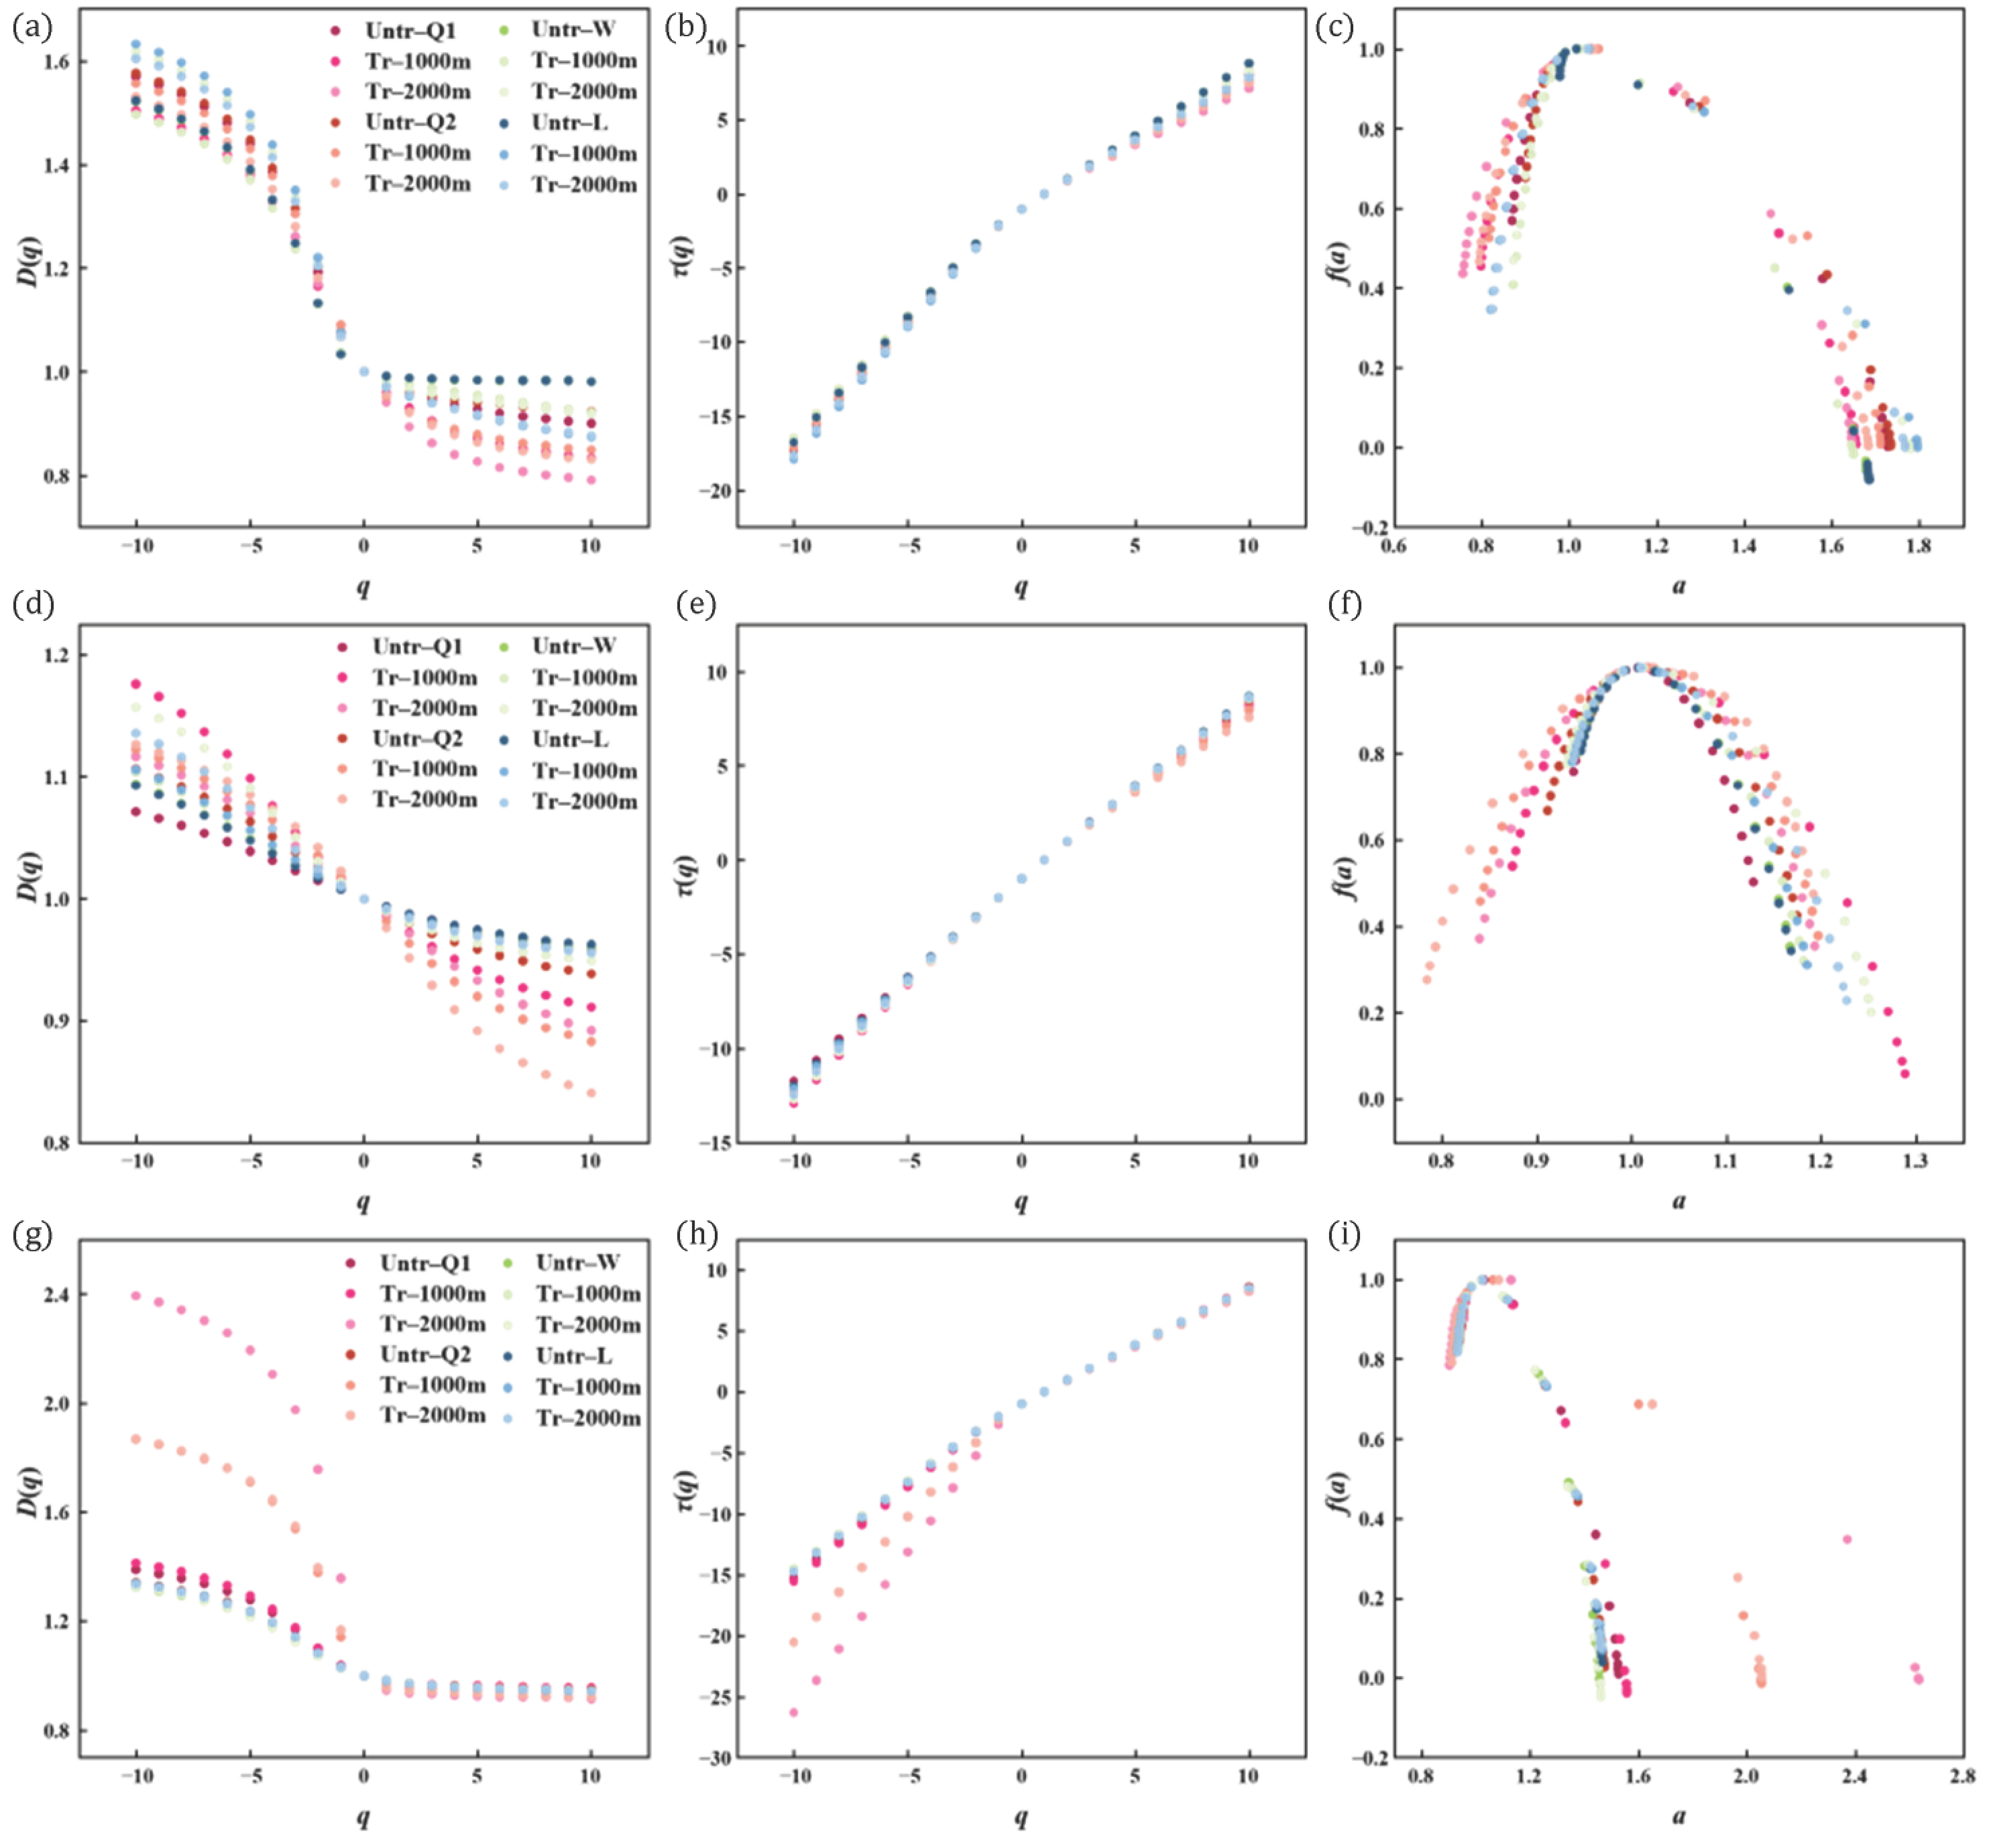
The results calculated from the three test methods all exhibit multifractal characteristics, specifically manifested as: (1) D(q) shows a strict monotonic decrease with q; (2) τ(q) presents a strictly increasing convex function with q; (3) f(α) shows a convex function relationship with α. The morphology of D(q) for all four samples shows strict monotonic decrease with increasing q. τ(q) strictly increases with increasing q, presenting an upward convex characteristic. f(α) shows convex function characteristics with α (Figure 9).

3.3.1. The MICP Multifractal Characteristics

The inequality D0 > D1 > D2 verifies that the PSD within the MICP test range has multifractal characteristics (Table 5) [29]. Analysis reveals that D1 and D0 values are close, indicating greater uniformity in PSD. Conversely, lower D1 indicates stronger heterogeneity. All four specimens exhibit consistent monotonic Dqq spectral decreases (Figure 9a–c), forming inverted “S” configurations with steep drops at q < 0 and gradual declines at q > 0 for both untreated and treated shales [60,61]. The generalized multifractal dimension spectrum width (D−10D10) quantifies PSD heterogeneity. Larger values indicate stronger heterogeneity within specific pore size ranges. The spectral width of all samples showed a significant increase after reaction, indicating enhanced overall heterogeneity of pore structure. For all samples, both before and after reaction, the left spectral width (D−10D0) is significantly larger than the right spectral width (D0D10). This difference indicates that the heterogeneity of shale pore structure is mainly concentrated in smaller–scale pore segments. H is the Hurst index (H = (D2 + 1)/2), characterizing pore connectivity, with smaller H indicating poorer connectivity [38]. The H of all samples decreased significantly after reaction, indicating deteriorated pore connectivity.
When q < 0, the multifractal mass exponent spectrum τ(q) demonstrates pronounced elevation as q increases; conversely, q > 0 regions exhibit moderate progression (Figure 9a–c). The different trends on both sides of q = 0 in the mass exponent spectrum indicate that PSD within the MICP test range maintains multifractal properties during the entire reaction sequence [29]. The morphology of the τ(q)–q curves for the four samples showed consistency both prior to and following the reaction, with larger spectral width observed in the left segment (q < 0) compared to the right segment (q > 0), suggesting an increased heterogeneity in the smaller PSDs. This finding is consistent with the phenomena observed in the Dqq curve plots.
The multifractal singularity spectrum f(α) versus singularity strength α shows a downward–opening parabola (Figure 9a–c). The symmetry of the f(α)–α spectrum indicates the multifractal characteristics of pore size distribution within the MICP test range. When q < 0, f(α) increases significantly with increasing singularity strength α. Conversely, when q > 0, f(α) shows a decreasing trend with increasing singularity strength α [62]. The singularity strength range (Δα = α−10α10) represents the spectrum width of the f(α)–α curve and directly reflects the heterogeneity of PSD. Our observations and calculated results consistently show that Δα increased after the ScCO2–water–shale reaction, indicating enhanced pore heterogeneity. In parallel, the Hausdorff dimension α0 provides complementary information on the degree of pore clustering [29]. Consistent with the increase in Δα, a0 also increased in all samples after the reaction, further confirming that the ScCO2–water–shale reaction not only enhances heterogeneity but also promotes local aggregation of pore structures.

3.3.2. The N2GA Multifractal Characteristics

Multifractal analysis based on N2GA also verifies the inequality D0 > D1 > D2 (Table 6), both before and after reaction, indicating that PSD within the N2GA test range has multifractal characteristics. The Dqq spectra of the four samples show consistent monotonic decrease (Figure 9d–f), resembling an inverted “S” shape, with a sharp decline when q < 0 and a gentler decline when q > 0, both before and after the reaction. After reaction, D−10D10 of all four samples increased, indicating increased heterogeneity after the reaction. For all samples, both before and after the reaction, the left spectral width is significantly larger than the right spectral width, indicating that the heterogeneity of shale pores within the N2GA test range is mainly concentrated in smaller–scale pore segments. After the reaction, the H of all samples decreased to varying degrees, indicating deteriorated pore connectivity after the reaction.
The connection between τ(q) and q exhibits clear multifractal traits, observed both prior to and following the reaction (Figure 9d–f). The different trends on both sides of q = 0 in the mass exponent spectrum indicate the multifractal characteristics of PSD in shale samples throughout the reaction process. The τ(q)–q curves show a shape of wide left and narrow right both before and after reaction. This suggests that smaller pores demonstrate increased heterogeneity within the N2GA test range, which is consistent with the phenomena in the Dqq curves.
The f(α) versus α shows a downward–opening parabola (Figure 9d–f). The symmetry of the f(α)–α spectrum indicates the multifractal characteristics of pore size distribution within the N2GA test range. When q < 0, f(α) increases with increasing α. Conversely, when q > 0, f(α) shows a decreasing trend with increasing α. After the reaction, the Δα of all samples increased significantly, especially prominent in Qiongzhusi Formation samples, indicating enhanced heterogeneity of pore structure. The changing trend in the Hausdorff dimension further reveals the local aggregation degree of PSD. Overall, all samples showed varying degrees of increases in α0 values after the reaction, indicating that the ––ScCO2–water–shale reaction promotes more pronounced aggregation of pore structures at local scales.

3.3.3. The CO2GA Multifractal Characteristics

After the reaction, different shale samples showed different changes in multifractal characteristics within the CO2GA test range (Table 7). The inequality D0 > D1 > D2 verifies the multifractal characteristics within the CO2GA test range. Q1 and Q2 showed a significant increase in D−10D10 after the reaction, indicating the enhanced heterogeneity of samples, while W and L samples showed little change in D−10D10. For all samples, both before and after the reaction, D−10D0 is greater than D0D10, combined with PSD, indicating that Q1 and Q2 are mainly controlled by the pore size range of 0.3–0.7 nm, while W and L samples are mainly controlled by the pore size range of 0.4–0.7 nm. The H of Q1 and Q2 samples generally decreased after the reaction, indicating deteriorated pore connectivity; W and L showed no significant change in H after the reaction, indicating little change in connectivity.
The different trends on both sides of q = 0 in the mass exponent spectrum indicate the multifractal characteristics of PSD in shale samples throughout the reaction process (Figure 9g–i). Similarly, the left branch of the τ(q)–q curve is larger than the right narrow branch both before and after the reaction. This suggests that smaller pores demonstrate increased heterogeneity within the CO2GA test range, which is consistent with the phenomena in the Dqq curves.
The f(α)–α curves show downward–opening parabolas (Figure 9g–i). When q < 0, f(α) rises as α increases, when q > 0, f(α) shows a decreasing trend with increasing α. The spectral width Δα of Q1 and Q2 samples increased significantly after reaction, showing extremely obvious enhancement of heterogeneity. In contrast, the spectral width Δα changes in W and L samples were relatively moderate, with relatively small overall increases, consistent with the changes in D−10D10. The changes in α0 were also basically similar. Only Q1 and Q2 samples showed large changes in α0, mainly showing an upward trend, indicating increased pore aggregation, while W and L samples showed small or basically unchanged α0 changes.

4. Discussion

4.1. Microcompositional Alteration Mechanisms in Shale

Upon ScCO2 injection into formations and subsequent water interaction, it forms carbonic acid (H2CO3), which further releases large amounts of H+, thereby establishing a local acidic environment [19,27,30]:
C O 2 + H 2 O H 2 C O 3 H + + HC O 3
The released H+ directly act on the surfaces of shale minerals, promoting various reactions, including dissolution, transformation, and precipitation of minerals, thereby altering the types and contents of minerals as well as the microstructure of rocks [16,23,60]. Therefore, changes in shale microscopic composition are essentially controlled by the acidic environment formed by the ScCO2–water system. Under weakly acidic conditions, shale minerals may undergo the following reactions [30,59]:
CaC O 3 + H + C a 2 + + HC O 3
NaAlS i 3 O 8 ( Albite ) + C O 2 + 5.5 H 2 O N a + + HC O 3 + 0.5 A l 2 S i 2 O 5 ( OH ) 4 ( Kaolinite ) + 2 H 4 Si O 4
Illite + 8 H + = 0.25 M g 2 + + 0.6 K + + 2.3 A l 3 + + 3.5 Si O 2 ( aq ) + 5 H 2 O
Chlorite + 16 H + = 5 F e 2 + + 2.3 A l 3 + + 3 Si O 2 ( aq ) + 12 H 2 O
pyrite ( 4 F e 2 + ) + O 2 ( aq ) + 4 H + 4 F e 3 + + 2 H 2 O
C a 2 + + C O 3 2 CaC O 3
M g 2 + + C O 3 2 MgC O 3
C a 2 + + M g 2 + + 2 C O 3 2 CaMg ( C O 3 ) 2 ( Dolomite )
F e 2 + + C O 3 2 FeC O 3
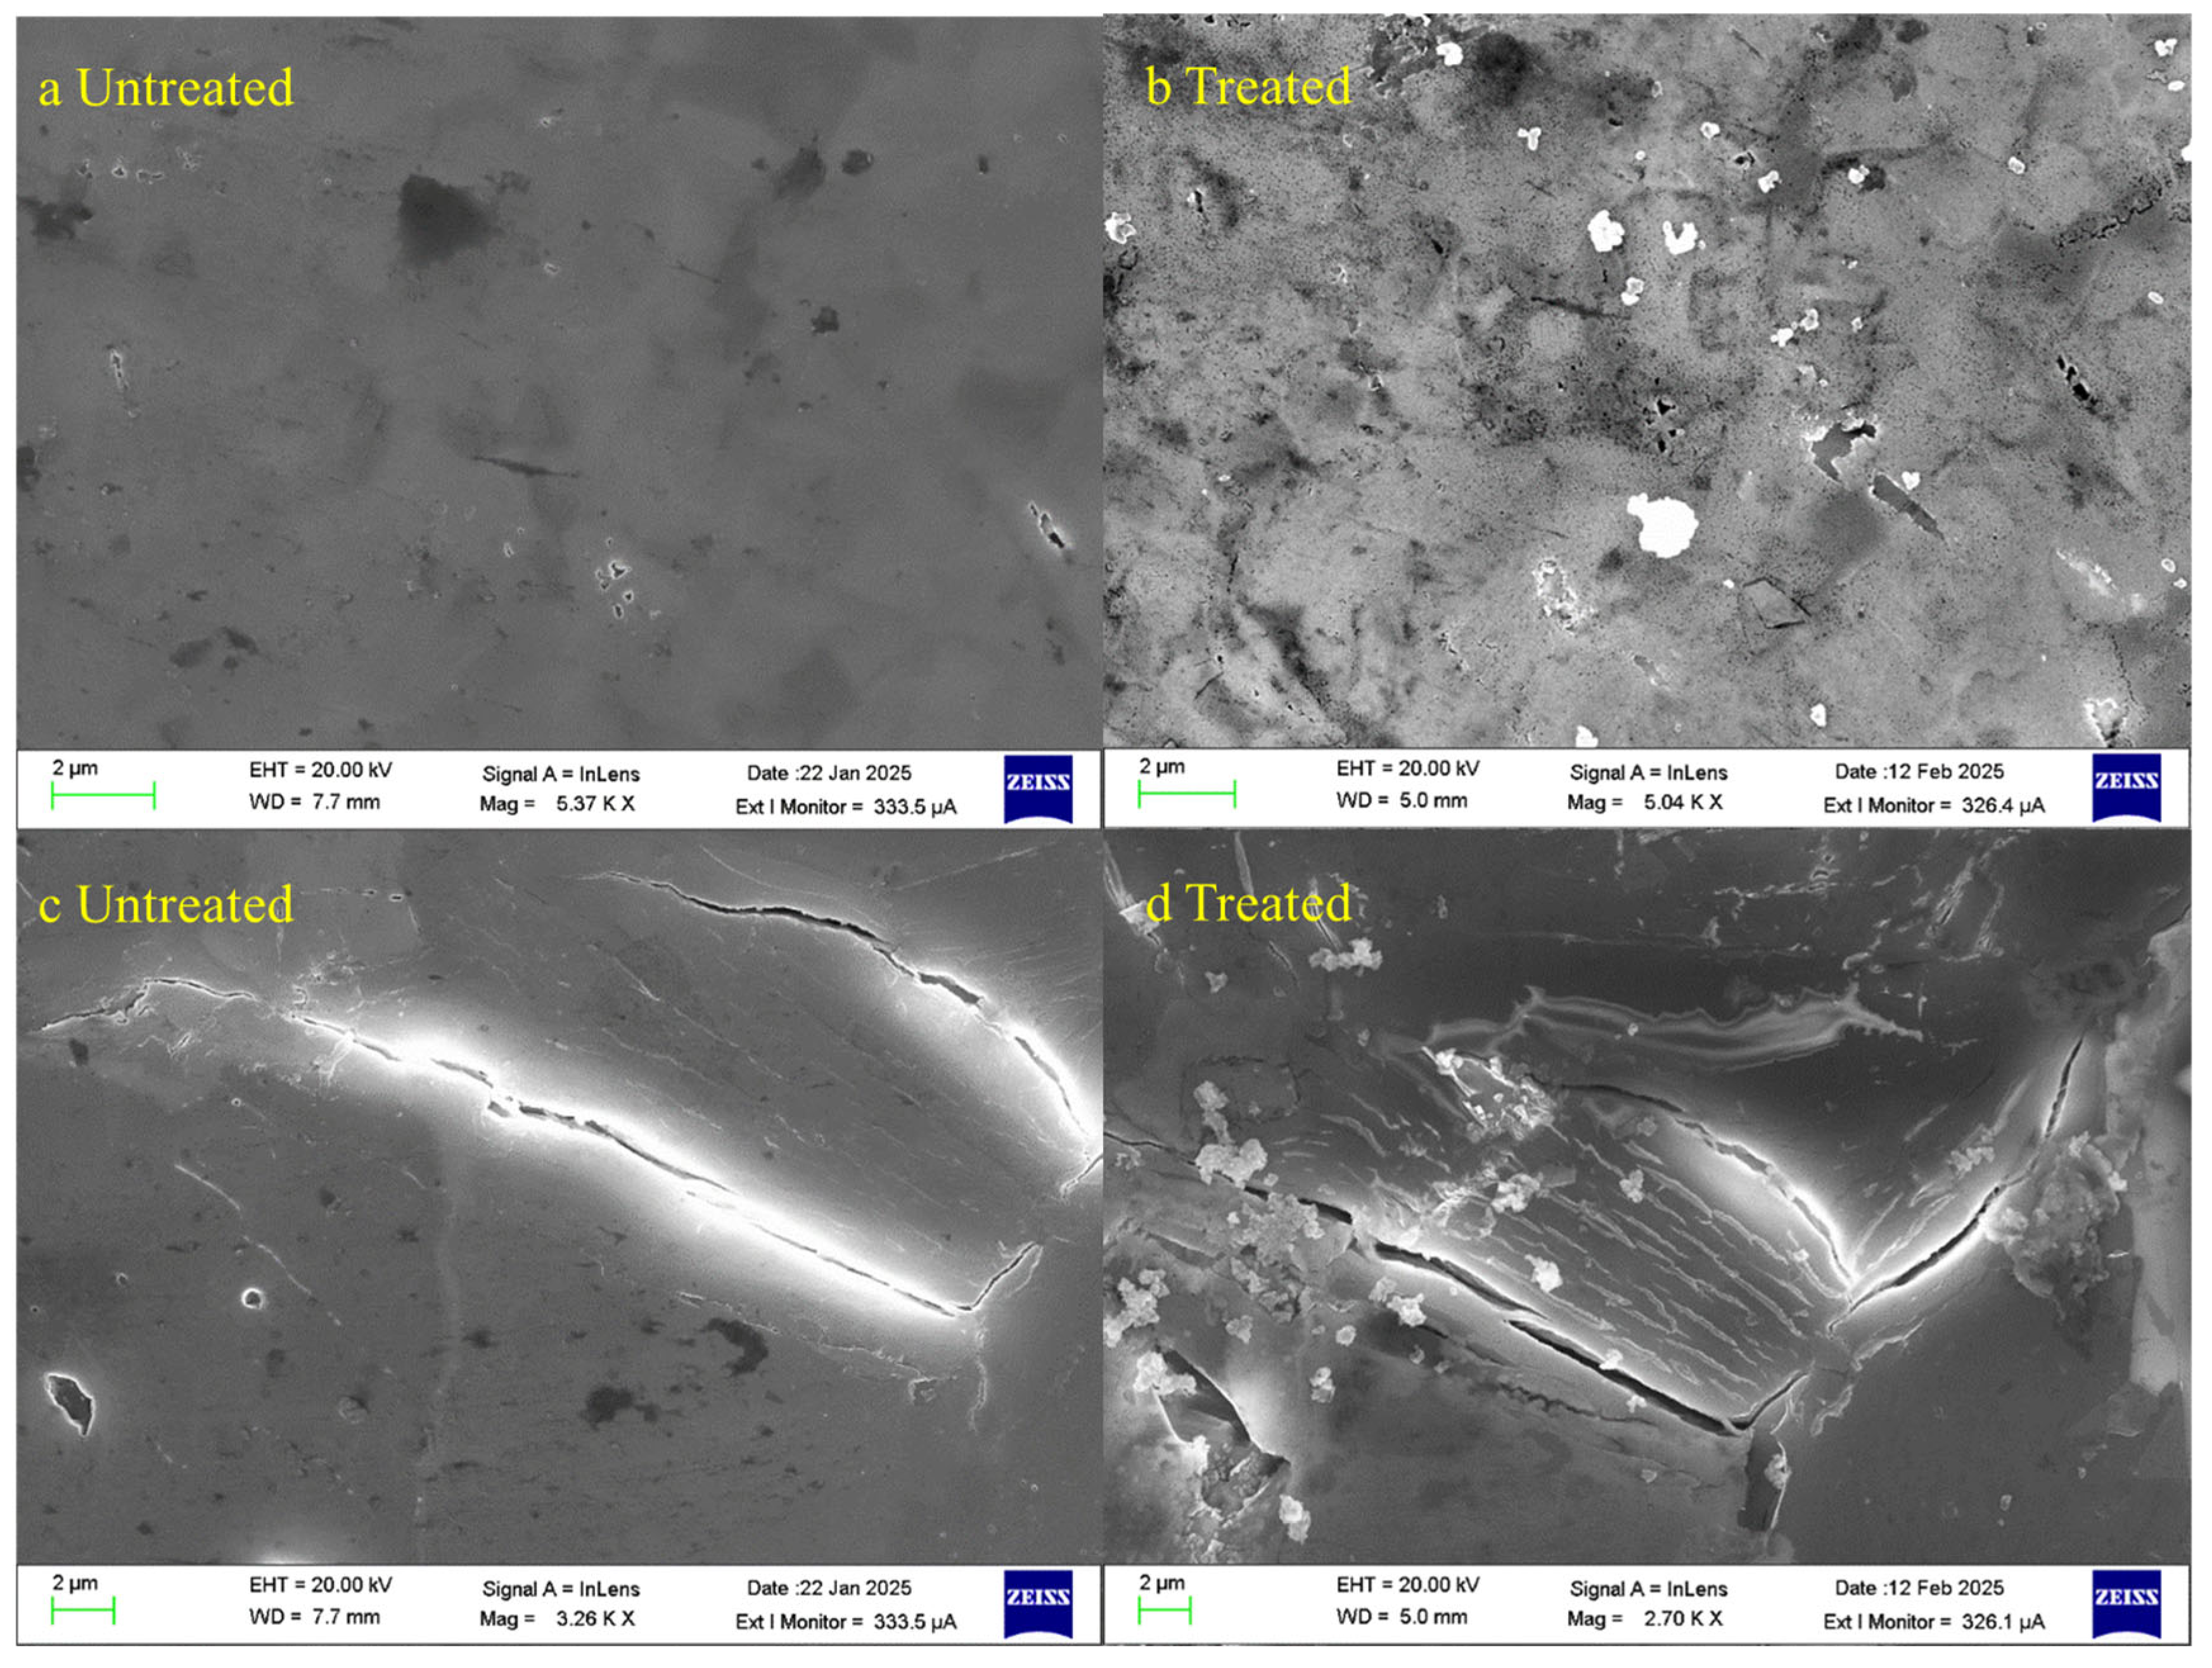
Different types of shale samples showed significantly different mineralogical responses to the –ScCO2–water system, which is closely related to differences in initial mineral components and reaction environment. After treatment, Q1 and Q2 samples showed significant increases in quartz content, while clay mineral content decreased significantly. This change may be mainly attributed to the easy dissolution and transformation of clay such as illite, kaolinite, and chlorite under weakly acidic conditions (Equations (15) and (16)). Although carbonate minerals were not detected during the experiment, scanning electron microscope observations showed that obvious dissolution phenomena of carbonate minerals did exist in Qiongzhusi Formation samples (Figure 10a–d). However, the mineral change trends in W and L samples were different, with both quartz and carbonate mineral contents decreasing and clay mineral content increasing. Similarly, dissolution phenomena of carbonate minerals and clay minerals can be observed under the microscope (Figure 10e–n). This result suggests that under different geological backgrounds, the change mechanism of shale mineral composition may be strongly influenced by initial mineral content. The –ScCO2–water system preferentially dissolves shales rich in carbonate minerals, followed by shales rich in clay minerals [17,20,63].
According to Equation (14), the change trend of feldspar minerals is mainly the transformation to clay minerals. However, the overall change in albite content is small, and the albite content in most samples increased after the reaction. This phenomenon may be due to the short reaction time in this experiment, with a slow dissolution rate of albite, changing under short–term reaction conditions due to changes in the relative content of other minerals. Quartz, due to its strong stability, is usually considered non–reactive, with changes in its relative content mainly dependent on changes in the relative content of other minerals [59]. However, fine cracks can still be observed on quartz surfaces and at the interfaces between quartz and other minerals under scanning electron microscopy. Pyrite content generally decreased after reaction due to weak oxidation reactions in the presence of oxygen (Equation (17)) (Figure 10o,p), leading to reduced content. As the reaction proceeds, ions such as Fe2+, Ca2+, Mg2+ released from mineral dissolution will recombine with CO32– to form new precipitates [33] (Equations (18)–(21)), and abundant mineral precipitates can be observed under FE–SEM (Figure 11).
To conclude, within the short reaction time, a preferential dissolution of clay and carbonate minerals was observed in all four samples, while the variations in the contents of quartz, feldspar, and pyrite can primarily be attributed to changes in the relative abundance of different minerals. The interaction of ScCO2 with water and rock primarily alters the pore structure of shale via the combined processes of dissolution and precipitation.

4.2. Analysis of Differences Between MICP and N2GA Test Results for Mesopores and Macropores

MICP and N2GA testing methods are based on different physical principles, with significant differences in their theoretical testing ranges. MICP is based on the Washburn equation, forcing mercury into pores through applied pressure, theoretically allowing for the measurement of pore sizes from a few nanometers up to several hundred micrometers [64]. While N2GA is based on gas adsorption principles, utilizing the physical adsorption behavior of nitrogen molecules at 77 K low temperature, it is theoretically capable of testing pore sizes of approximately 0.35–300 nm, but in practical applications, it is mainly used for precise characterization of 2–50 nm mesopores [64]. This difference in testing ranges directly leads to different macropore PV test results, with MICP–measured macropore PV values generally larger than N2GA (Figure 12), because MICP can detect larger pores beyond N2GA’s testing range.
In the unreacted state of all samples, N2GA–measured mesopore PV are essentially all larger than MICP–measured mesopore PV. This difference may be because, even under high–pressure conditions, mercury, due to its high surface tension and contact angle with shale, still cannot fully enter some mesopores with small openings or complex morphologies [65]. Particularly for ink–bottle–shaped pores, mercury may only enter the neck portion without filling the entire pore space. In contrast, N2GA is based on physical adsorption principles, with nitrogen molecules spontaneously adsorbing on pore walls through van der Waals forces [66], unrestricted by surface tension and contact angle, enabling more thorough exploration of mesopore structures and thus providing more complete mesopore information.
The destructive characteristics of mercury intrusion testing are particularly evident in Q1 and Q2 samples. After reaction, MICP testing of these two samples showed increased mesopore PV, which may be the result of combined effects from mercury intrusion destructive action and the ––ScCO2–water–shale reaction. In contrast, N2GA as a non–destructive testing method, conducted under low pressure conditions, can more accurately reflect the true changes in pore structure, with test results mainly reflecting the modification effects of the –ScCO2–water––rock reaction on pore structure, without containing artificial influences from the testing process itself. The absolute values of mesopore PV change rates under MICP testing at 1000 m and 2000 m simulated depths relative to the unreacted state were calculated. Notably, the average mesopore PV change magnitude of W and L samples under MICP testing (39.2%) is significantly smaller than Q1 and Q2 samples (87.3%), with more pronounced changes at 2000 m simulated depth. This change is closely linked to the mineral composition of the samples. W and L samples are siliceous shale, while Q1 and Q2 samples belong to argillaceous shale. Quartz, as a mineral with high mechanical strength, can form more robust pore framework structures [67]. During mercury intrusion, this rigid framework shows stronger compressive resistance, effectively resisting structural deformation and damage caused by high–pressure mercury intrusion. In contrast, argillaceous shale rich in clay minerals, due to the lower mechanical strength of layered silicate minerals, is more prone to plastic deformation or structural damage under high pressure [68,69]. Overall, the –ScCO2–water system under higher temperature and pressure conditions more severely weakens the mechanical properties of minerals in argillaceous shale Q1 and Q2 samples, which also intensifies the damage to mesopore structures of Q1 and Q2 samples during MICP testing, consequently leading to increased mesopore PV after the ––ScCO2–water–shale reaction.
In summary, although MICP provides valuable information on pore–size distribution, it should be noted that this method tends to overestimate the mesopore pore volume of the investigated shale samples compared with N2GA results. Therefore, MICP results should be interpreted with caution and preferably in conjunction with N2GA and CO2GA analyses to achieve a more accurate and comprehensive pore characterization.

4.3. Influencing Factors of Multifractal Characteristics

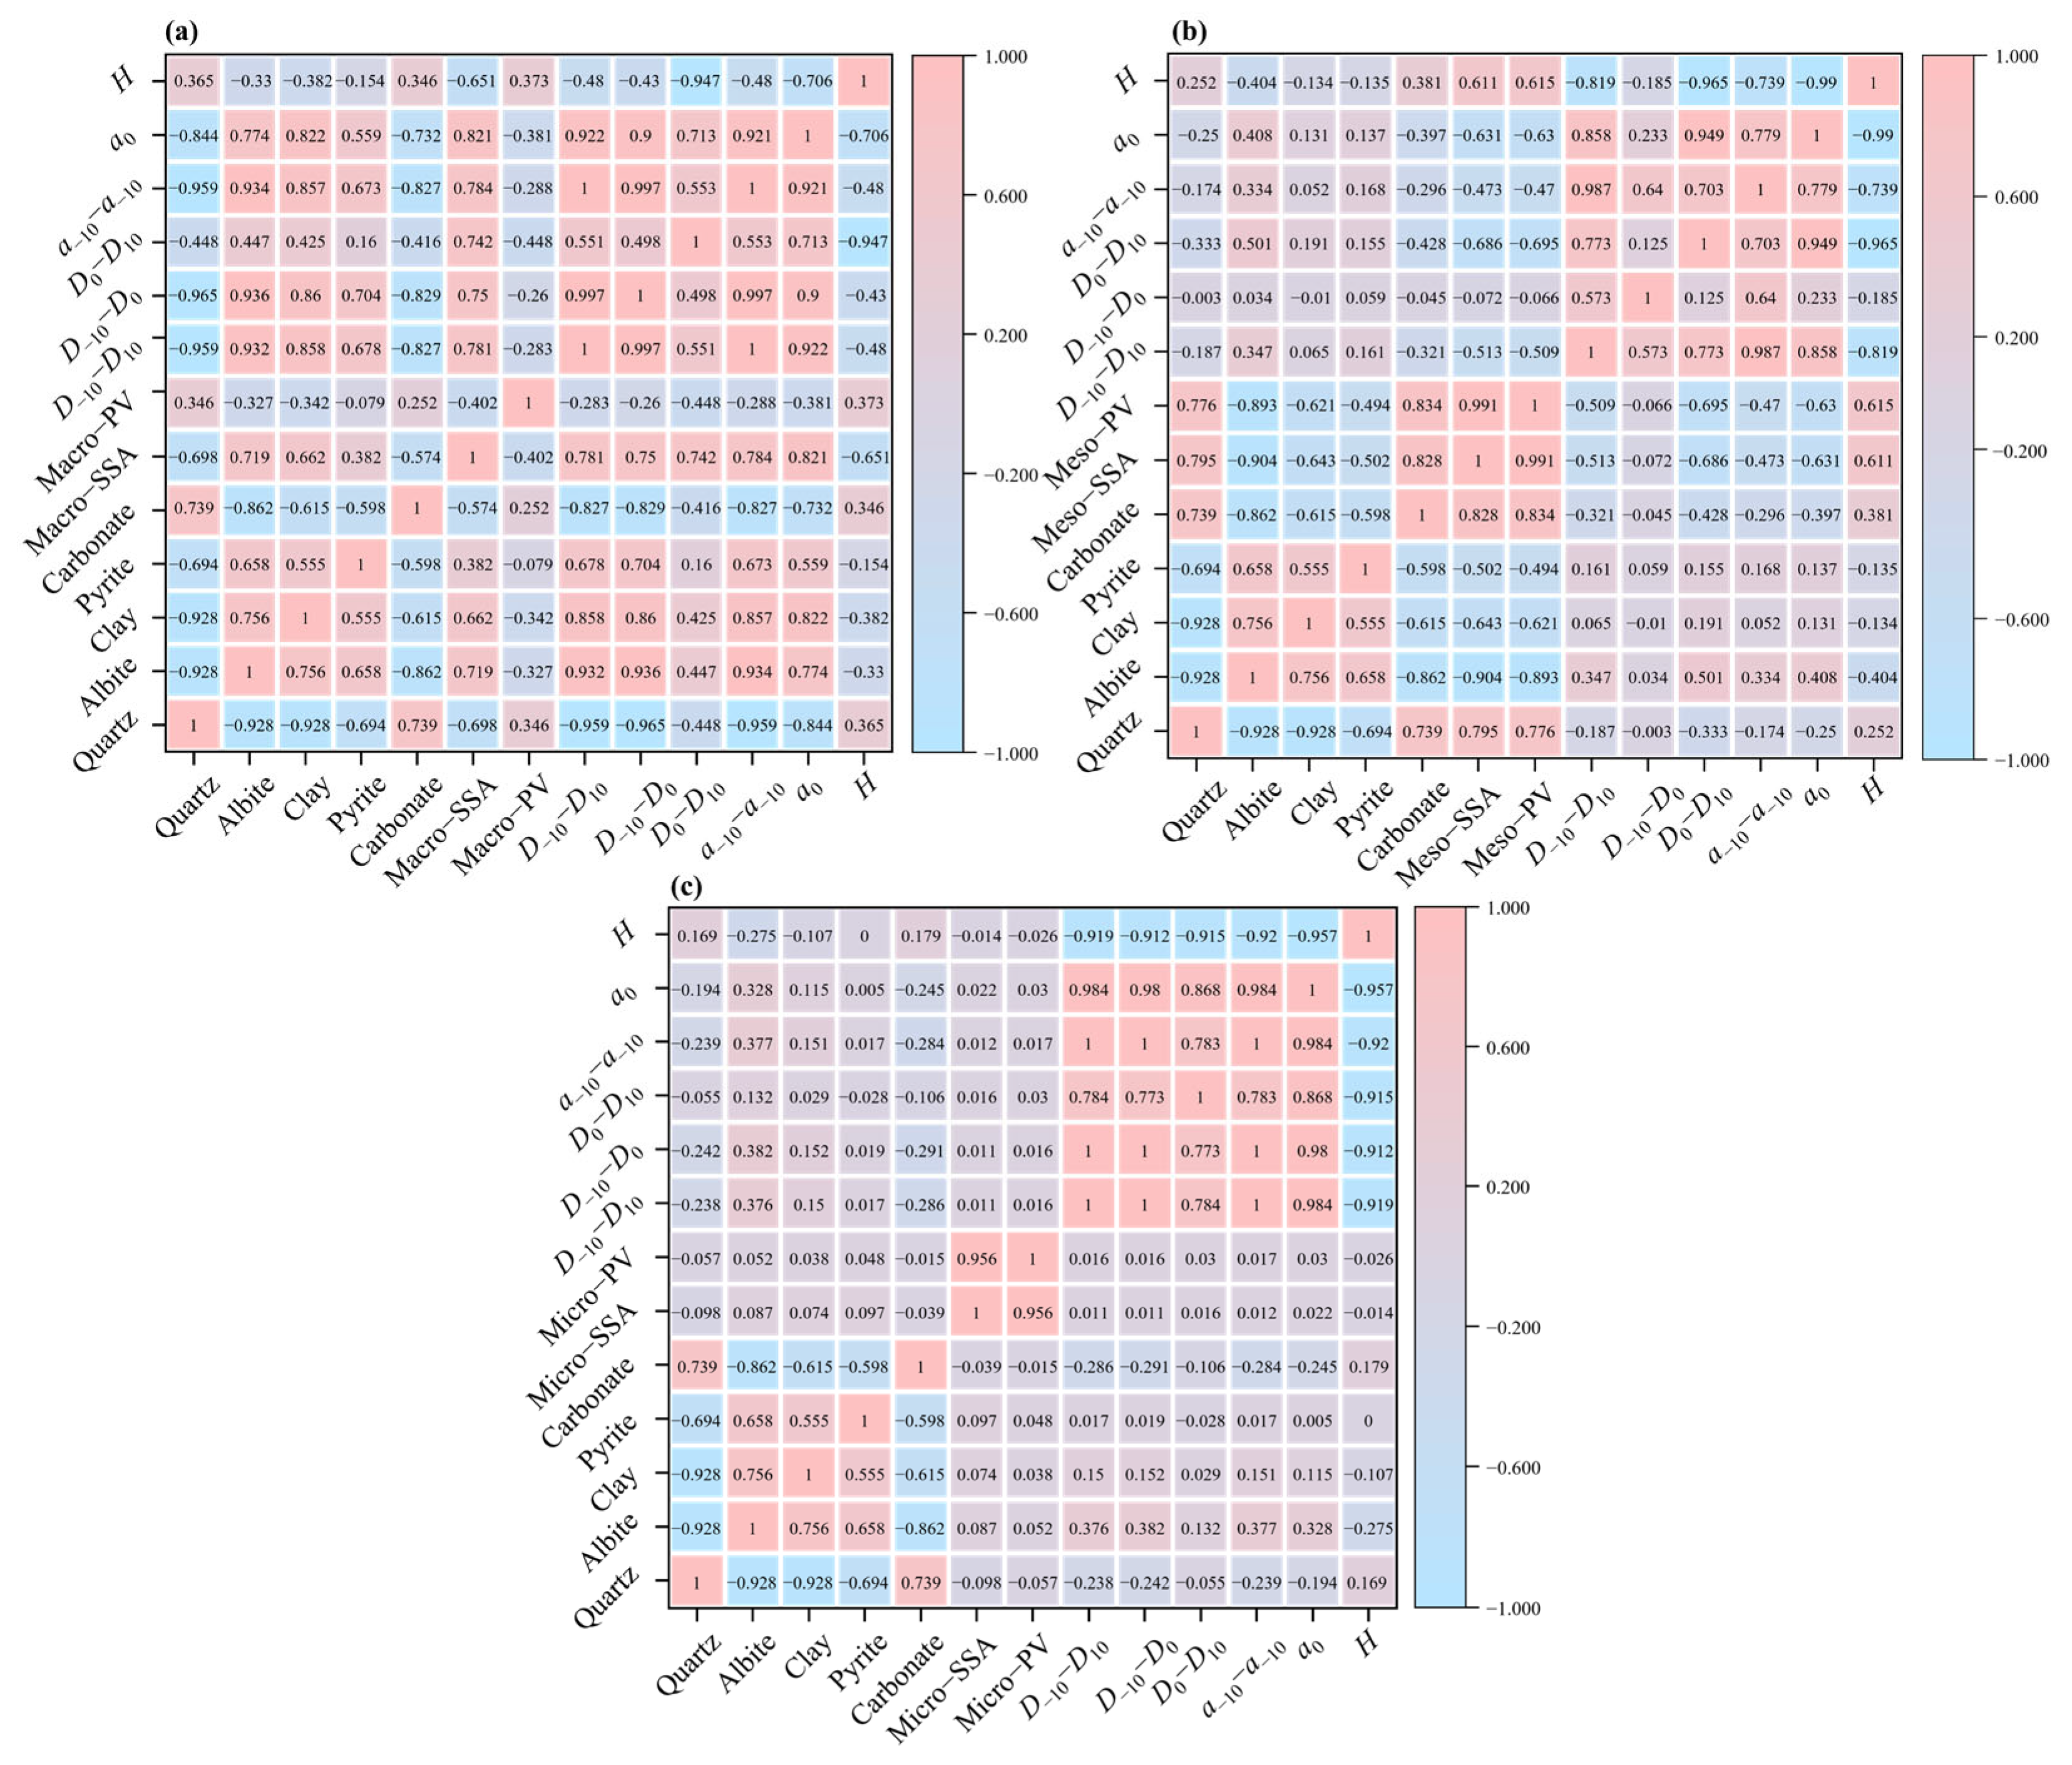
An analysis using multifractals offers an innovative viewpoint for comprehending how the ––ScCO2–water–shale reaction influences the structure of pores within shale. By analyzing the correlations among mineral composition, pore structure parameters, and multifractal parameters (Figure 13), the controlling factors of pore structure evolution can be deeply revealed.
Overall, H and D−10D10 show significant negative correlation in all testing methods. This suggests that as pore connectivity diminishes, the heterogeneity of the pore structure correspondingly increases. This negative correlation reflects that the ––ScCO2–water–shale reaction affects the uniformity of PSD by changing pore connectivity. Secondary mineral precipitation blocks some connected pores, making the originally relatively uniform pore distribution more complex and heterogeneous. Meanwhile, α0 demonstrates a positive relationship with D−10D10, suggesting that higher pore aggregation degree leads to stronger heterogeneity. This result further confirms that pore structure reorganization caused by the ––ScCO2–water–shale reaction not only changes pore connectivity but also promotes pore aggregation at local scales, forming more complex pore distributions.
For macropores and mesopores, mineral composition shows strong correlation with pore structure parameters. Changes in mineral composition affect multifractal parameter changes by influencing pore parameters. This phenomenon indicates that mineral composition is the fundamental factor controlling the multifractal characteristics of macropores and mesopores. Unlike macropores and mesopores, the relationship between the parameters of micropores and multifractal parameters is considerably weaker. This reveals essential differences in the action mechanisms of the ––ScCO2–water–shale reaction on pores of different scales. Changes in micropores mainly manifest as modifications of internal pore morphology rather than significant changes in pore quantity or volume.
Temperature and pressure conditions have important effects on multifractal characteristics by affecting the chemical activity of the –ScCO2–water system and mineral dissolution––precipitation equilibrium. Under 2000 m simulated depth conditions, D−10D10 values of all samples are higher than under 1000 m conditions, indicating that higher temperature and pressure conditions intensify pore structure heterogeneity. In summary, the multifractal characteristics of shale pore structure are comprehensively controlled by mineral composition, initial pore structure, and reaction conditions, while the response mechanisms of pores at different scales show significant differences, providing an important basis for understanding and predicting the impact of ScCO2 injection on shale reservoirs.

4.4. Mechanisms and Implications of Pore-Structure Change

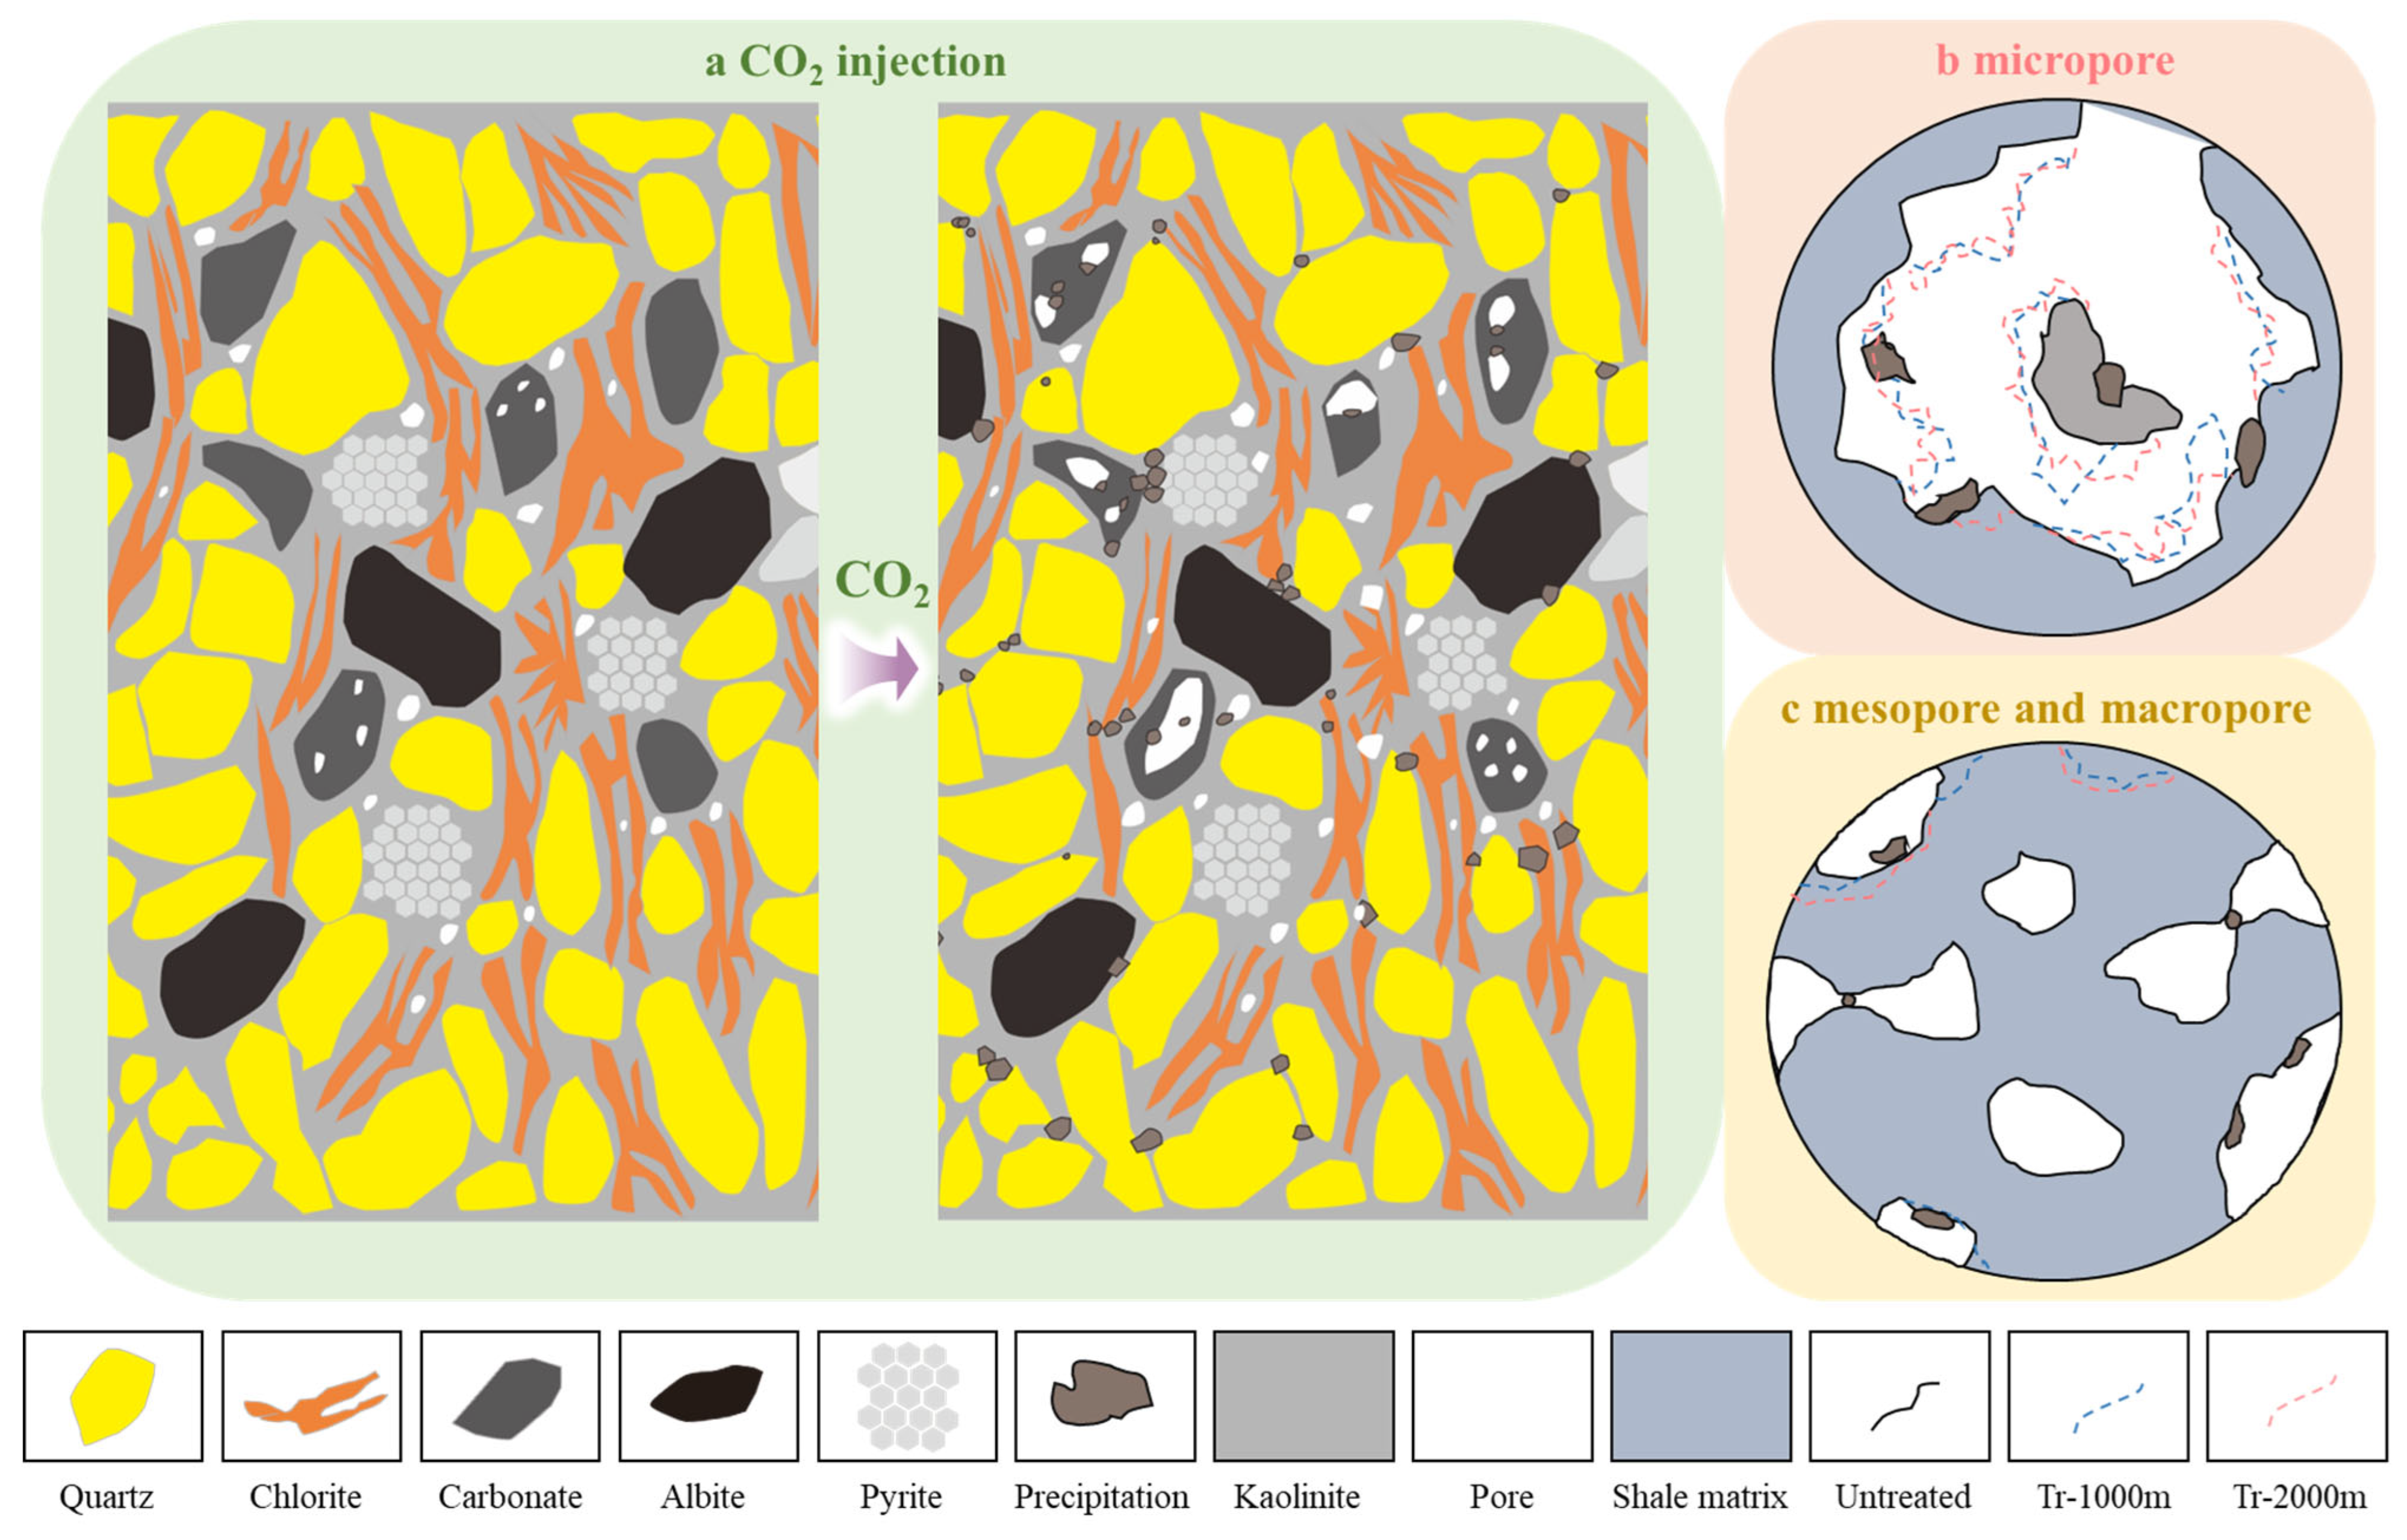
Combining mineral composition, alterations in pore structure, and outcomes from multifractal analysis offers a thorough characterization of the evolution of shale reservoir pore structure both prior to and following the reaction. After injection, CO2 reacts with water to generate carbonic acid (Figure 14a). In weakly acidic environments, minerals in shale (such as clay minerals and carbonate minerals) undergo varying degrees of dissolution, and as the reaction proceeds, ions such as Ca2+, Fe2+ and Mg2+ released by dissolution recombine with CO32− to produce precipitates, which block pores and cause a reduction in PV and SSA. Combined with multifractal results, the specific effects of these actions on pores of different sizes are manifested as follows (Figure 14b,c): (1) secondary mineral precipitation blocks some connected micropores, mesopores, and macropores, causing reduced connectivity, decreasing PV and SSA while enhancing pore heterogeneity. Blocking of some connected pores transforms them into multiple independent pores, which in turn increases the degree of pore aggregation. (2) Dissolution and precipitation actions produced by the ScCO2–water–shale reaction modify internal pore morphology; Q1 sample micropores show small changes in SSA and PV before and after the reaction, but heterogeneity increases significantly after the reaction, indicating that micropore shapes and sizes in the Q1 sample become more diversified after the reaction. Differently, W and L samples show little change in micropore heterogeneity after the reaction; although the ScCO2–water–shale reaction modifies pore morphology, this modification may have equivalent quantitative effects on heterogeneity. (3) Carbonate mineral dissolution causes pore expansion, which also reduces PV and SSA; taking the Q2 sample as an example, the increase in micropore SSA and PV under 2000 m simulation conditions may be attributed to micropore expansion by dissolution during the ScCO2–water–shale reaction, and the enhanced heterogeneity reflects the spatial non-uniformity of the reaction.
In summary, changes in pore structure from the ScCO2–water–shale reaction are caused by the combined action of precipitation and dissolution mechanisms. From the pore structure changes of the four samples, the influence of precipitation during the reaction process is greater than that of dissolution on shale pores. Multifractal results provide a new perspective for analyzing pore structure changes; understanding pore structure changes after ScCO2 injection has important significance for CO2–EOR and CCUS implementation.

5. Conclusions

(1) Mineral Composition Changes: ScCO2–water reactions preferentially dissolve clay and carbonate minerals in shale. Feldspar and pyrite also exhibit some dissolution; their extent is largely influenced by variations in the relative proportions of clay and carbonate. Additionally, abundant secondary mineral precipitation can be observed after the reaction. These changes are controlled by the acidic environment created by CO2–water interactions.
(2) Pore Structure Evolution: The ScCO2–water–shale reaction modifies pore structures through dual dissolution–precipitation mechanisms, with precipitation effects dominating. The reaction minimally alters pore types but significantly affects SSA and PV. Macropore volume decreases while specific surface area increases; mesopore volume and specific surface area both decrease, while micropore changes are not significant. The higher quartz content in siliceous shale provides a mechanically stronger pore framework, making the impact of the ScCO2–water system less than that on argillaceous shale.
(3) Multifractal Characteristics: Multifractal analysis reveals that ScCO2–water–shale reactions reduce pore connectivity and increase pore structure heterogeneity, with these changes occurring across all pore scales. However, the impact on micropores is mainly the modification of their internal pore space, making the internal morphology more complex.
(4) Temperature and Pressure Effects: Higher temperature and pressure conditions (2000 m simulation) intensify mineral reactions and pore structure changes, resulting in greater heterogeneity and more pronounced pore structure modifications compared to 1000 m conditions.
(5) Novelty and Limitations: For the first time, this work combines multifractal theory with multi–scale pore characterization to achieve unified quantification of pore heterogeneity (Δα, D−10D10) and connectivity (H) under reservoir–representative conditions and systematically compares multiple marine shale formations in southern China. This provides new quantitative evidence for understanding the multi–scale effects of ScCO2–water–shale interactions. Nevertheless, the study has limitations: the reaction time was relatively short, making it difficult to capture the long–term mineral dissolution–precipitation processes; in addition, the number of shale samples was limited, which restricted the extent to which some processes could be explored in greater depth. Future work should include longer reaction durations and a larger number of samples to further investigate mineral transformations and pore structure evolution.
(6) Implications for CO2–EOR and CCUS: The research demonstrates that ScCO2 injection into shale formations triggers complex mineral–fluid–rock interactions, leading to reduced pore connectivity and increased heterogeneity. This has significant implications for the efficiency of CO2-enhanced gas recovery in shale reservoirs and the geological sequestration of CO2 in depleted shale gas reservoirs.

Author Contributions

Conceptualization, Y.D.; methodology, C.F., Y.Z. and Z.P.; Validation, G.F.; formal analysis, H.W.; Investigation, G.F. and W.G.; Resources, G.F. and W.G.; Writing–original draft preparation, H.W.; Writing–review and editing, Y.D., Y.Z., J.M., Z.W. and Z.P.; Supervision, Y.D., C.F. and Z.W.; Project administration, J.M.; Funding acquisition, Y.D. and C.F. All authors have read and agreed to the published version of the manuscript.

Funding

This research financing was supported by the National Natural Science Foundation of China (Nos. 42102224, U23A20596, 42372188 and 41902168), the Young Elite Scientists Sponsorship Program by CAST (No. 2023QNRC001), Key Research and Development Program of Shaanxi (No. 2024SF-YBXM-536), the Natural Science Foundation of Shaanxi Provincial Department of Education (No. 23JK0681), and Guizhou Provincial Science and Technology Plan Project (Qiankehe basis–ZK[2024] commonly 687).

Data Availability Statement

Data is contained within the article.

Conflicts of Interest

Author Gaoqiang Fu was employed by China National Petroleum Corporation. The remaining authors declare that the research was conducted in the absence of any commercial or financial relationships that could be construed as a potential conflict of interest.

Abbreviations

The following abbreviations are used in this manuscript:
ScCO2Supercritical CO2
MICPMercury intrusion capillary pressure
N2GALow–pressure N2 gas adsorption
CO2GALow–pressure CO2 adsorption
XRDX–ray diffraction
FE-SEMField emission scanning electron microscopy
PVPore volume
SSASpecific surface area
Untr-Untreated
Tr-Treated
PSDPore size distribution
DFTDensity Functional Theory
BJHBarrette–Joyner–Halenda
BETBrunauer–Emmett–Teller
TOCTotal Organic Carbon

References

  1. Niu, W.; Lu, J.; Sun, Y.; Liu, H.; Cao, X.; Zhan, H.; Zhang, J. A review of the application of data-driven technology in shale gas production evaluation. Energy Rep. 2023, 10, 213–227. [Google Scholar] [CrossRef]
  2. Huang, L.; Liu, C.; Wang, Z.; Zhou, Y.; He, F.; Liu, Y.; Huang, Y. An alternative formation mechanism for strike-slip fault in stable intracratonic basin. J. Struct. Geol. 2025, 191, 105292. [Google Scholar] [CrossRef]
  3. Wang, D.; Zhang, J.; Jiang, X.; Feng, J.; Wu, Y.; Li, B.; Lu, M.; Pan, Z. Optimal packing ratio of proppant monolayer for partially-propped horizontal bedding fractures of shale. Gas Sci. Eng. 2025, 135, 205563. [Google Scholar] [CrossRef]
  4. Wang, D.; Li, S.; Wang, R.; Li, B.; Pan, Z. Evaluating the stability and volumetric flowback rate of proppant packs in hydraulic fractures using the lattice Boltzmann-discrete element coupling method. J. Rock. Mech. Geotech. Eng. 2024, 16, 2052–2063. [Google Scholar] [CrossRef]
  5. Wang, T.; Tian, S.; Li, G.; Sheng, M.; Ren, W.; Liu, Q.; Zhang, S. Molecular Simulation of CO2/CH4 Competitive Adsorption on Shale Kerogen for CO2 Sequestration and Enhanced Gas Recovery. J. Phys. Chem. C 2018, 122, 17009–17018. [Google Scholar] [CrossRef]
  6. Sun, Y.; Li, S.; Sun, R.; Liu, X.; Pu, H.; Zhao, J. Study of CO2 Enhancing Shale Gas Recovery Based on Competitive Adsorption Theory. ACS Omega 2020, 5, 23429–23436. [Google Scholar] [CrossRef] [PubMed]
  7. Liu, X.; Sang, S.; Zhou, X.; Wang, Z. Coupled adsorption-hydro-thermo-mechanical-chemical modeling for CO2 sequestration and well production during CO2-ECBM. Energy 2023, 262, 125306. [Google Scholar] [CrossRef]
  8. Hazra, B.; Vishal, V.; Sethi, C.; Chandra, D. Impact of Supercritical CO2 on Shale Reservoirs and Its Implication for CO2 Sequestration. Energy Fuels 2022, 36, 9882–9903. [Google Scholar] [CrossRef]
  9. Wu, D.; Zhai, W.; Liu, X.; Xiao, X.; Xu, J.; Jia, N.; Miao, F. The permeability of shale exposed to supercritical carbon dioxide. Sci. Rep. 2023, 13, 6734. [Google Scholar] [CrossRef]
  10. Jiang, Y.; Luo, Y.; Lu, Y.; Qin, C.; Liu, H. Effects of supercritical CO2 treatment time, pressure, and temperature on microstructure of shale. Energy 2016, 97, 173–181. [Google Scholar] [CrossRef]
  11. Prasad, S.; Sangwai, J.; Byun, H. A review of the supercritical CO2 fluid applications for improved oil and gas production and associated carbon storage. J. CO2 Util. 2023, 72, 102479. [Google Scholar] [CrossRef]
  12. Lyu, Q.; Tan, J.; Li, L.; Ju, Y.; Busch, A.; Wood, D.A.; Ranjith, P.G.; Middleton, R.; Shu, B.; Hu, C.; et al. The role of supercritical carbon dioxide for recovery of shale gas and sequestration in gas shale reservoirs. Energy Environ. Sci. 2021, 14, 4203–4227. [Google Scholar] [CrossRef]
  13. Sun, Y.-X.; Wang, X.-L.; Meng, Y.-Z.; Tian, J.-L.; Lu, C.-H. Fracture propagation mechanism and application of supercritical CO2 fracturing in shale: A review. Pet. Sci. 2025, 22, 1625–1652. [Google Scholar] [CrossRef]
  14. Wang, L.; Du, Y.; Wu, G.; Fu, X.; Xu, C.; Pan, Z. Application of nuclear magnetic resonance technology in reservoir characterization and CO2 enhanced recovery for shale oil: A review. Mar. Pet. Geol. 2025, 177, 107353. [Google Scholar] [CrossRef]
  15. Murugesu, M.; Joewondo, N.; Prasad, M. Carbon storage capacity of shale formations: Mineral control on CO2 adsorption. Int. J. Greenh. Gas Control 2023, 124, 103833. [Google Scholar] [CrossRef]
  16. Fatah, A.; Bennour, Z.; Ben Mahmud, H.; Gholami, R.; Hossain, M. A Review on the Influence of CO2/Shale Interaction on Shale Properties: Implications of CCS in Shales. Energies 2020, 13, 3200. [Google Scholar] [CrossRef]
  17. Peng, C.; Anabaraonye, B.U.; Crawshaw, J.P.; Maitland, G.C.; Trusler, J.P.M. Kinetics of carbonate mineral dissolution in CO2-acidified brines at storage reservoir conditions. Faraday Discuss. 2016, 192, 545–560. [Google Scholar] [CrossRef] [PubMed]
  18. Zhu, G.; Wei, Z.; Li, W.; Yang, X.; Cao, S.; Wu, X.; Li, Y. Interface dissolution kinetics and porosity formation of calcite and dolomite (110) and (104) planes: An implication to the stability of geologic carbon sequestration. J. Colloid. Interface Sci. 2023, 650, 1003–1012. [Google Scholar] [CrossRef]
  19. Du, Y.; Fu, C.; Pan, Z.; Sang, S.; Wang, W.; Liu, S.; Zhao, Y.; Zhang, J. Geochemistry effects of supercritical CO2 and H2O on the mesopore and macropore structures of high-rank coal from the Qinshui Basin, China. Int. J. Coal Geol. 2020, 223, 103467. [Google Scholar] [CrossRef]
  20. Zhu, H.; Xu, T.; Tian, H.; Feng, G.; Yang, Z.; Zhou, B. Understanding of long-term CO2–brine–rock geochemical reactions using numerical modeling and natural analogue study. Geofluids 2019, 2019, 1426061. [Google Scholar] [CrossRef]
  21. Li, S.; Zhang, S.; Xing, H.; Zou, Y. CO2–brine–rock interactions altering the mineralogical, physical, and mechanical properties of carbonate-rich shale oil reservoirs. Energy 2022, 256, 124608. [Google Scholar] [CrossRef]
  22. Rigby, S.; Alsayah, A.; Seely, R. Impact of Exposure to Supercritical Carbon Dioxide on Reservoir Caprocks and Inter-Layers during Sequestration. Energies 2022, 15, 7538. [Google Scholar] [CrossRef]
  23. Li, S.; Zhang, S.; Zou, Y.; Ma, X.; Ding, Y.; Li, N.; Zhang, X.; Kasperczyk, D. Pore structure alteration induced by CO2–brine–rock interaction during CO2 energetic fracturing in tight oil reservoirs. J. Pet. Sci. Eng. 2020, 191, 107147. [Google Scholar] [CrossRef]
  24. Lu, Y.; Zhou, J.; Li, H.; Chen, X.; Tang, J. Different Effect Mechanisms of Supercritical CO2 on the Shale Microscopic Structure. ACS Omega 2020, 5, 22568–22577. [Google Scholar] [CrossRef] [PubMed]
  25. Zhang, S.; Shen, Z.; He, Y.; Zhu, Z.; Ren, Q.; Zhang, L. Pore Structure Alteration of Shale with Exposure to Different Fluids: The Longmaxi Formation Shale in the Sichuan Basin, China. Minerals 2023, 13, 1387. [Google Scholar] [CrossRef]
  26. Lu, Z.; Wang, L.; Wu, S.; Chu, P.; Xi, C.; Wang, H.; Cheng, Y. Investigation of Pore Structure and Adsorption/Desorption Properties of Coal in the Non-uniform Stress Zone: Implications for Coal and Gas Outburst. Nat. Resour. Res. 2024, 33, 1247–1268. [Google Scholar] [CrossRef]
  27. Fu, C.; Xu, X.; Du, Y.; Kou, X. Experimental study on the influence of pore structure on spontaneous imbibition in marine black shale. Capillarity 2024, 10, 57–72. [Google Scholar] [CrossRef]
  28. Ma, X.; Du, Y.; Fu, C.; Fang, H.; Wei, H.; Pan, Z.; Sang, S.; Zhang, J. Effects of Supercritical CO2 on the Pore Structure Complexity of High-Rank Coal with Water Participation and the Implications for CO2 ECBM. ACS Omega 2023, 8, 18964–18980. [Google Scholar] [CrossRef]
  29. Zheng, S.; Liu, Y.; Huang, F.; Liu, S.; Sang, S.; Dai, X.; Wang, M. Pore Structure Evolution of Coal After Supercritical CO2–Water–Rock Treatment: A Multifractal Analysis. Fractal. Fract. 2025, 9, 144. [Google Scholar] [CrossRef]
  30. Lu, Y.; Liu, J.; Tang, J.; Ao, X.; Li, H.; Zhou, J.; Sun, X. Pore changes of slickwater-containing shale under supercritical CO2 treatment. Fuel 2022, 312, 122775. [Google Scholar] [CrossRef]
  31. Wang, X.; Sun, X.; Guo, X.; Zheng, L.; Luo, P. Study on the Influence of Supercritical CO2 with High Temperature and Pressure on Pore-Throat Structure and Minerals of Shale. ACS Omega 2024, 9, 15259–15270. [Google Scholar] [CrossRef] [PubMed]
  32. Zhou, J.; Yang, K.; Tian, S.; Zhou, L.; Xian, X.; Jiang, Y.; Liu, M.; Cai, J. CO2-water-shale interaction induced shale microstructural alteration. Fuel 2020, 263, 116642. [Google Scholar] [CrossRef]
  33. Jiang, C.; Zheng, X.; Zhu, Y.; Tang, L.; Liu, Y.; Zhao, Z.; Zhang, H. Preparation and Application of CO2-Resistant Latex in Shale Reservoir Cementing. Processes 2024, 12, 945. [Google Scholar] [CrossRef]
  34. Tang, H.; Zhu, J.; Xi, Z.; Di, X.; Wang, J.; Ao, Q. Impact factors of fractal analysis of porous structure. Sci. China Technol. Sci. 2010, 53, 348–351. [Google Scholar] [CrossRef]
  35. Wang, H.; Liu, Y.; Song, Y.; Zhao, Y.; Zhao, J.; Wang, D. Fractal analysis and its impact factors on pore structure of artificial cores based on the images obtained using magnetic resonance imaging. J. Appl. Geophys. 2012, 86, 70–81. [Google Scholar] [CrossRef]
  36. Li, W.; Liu, H.; Song, X. Multifractal analysis of Hg pore size distributions of tectonically deformed coals. Int. J. Coal Geol. 2015, 144, 138–152. [Google Scholar] [CrossRef]
  37. Li, Y.; Lu, G.; Rudolph, V. Compressibility and Fractal Dimension of Fine Coal Particles in Relation to Pore Structure Characterisation Using Mercury Porosimetry. Part. Part. Syst. Charact. 1999, 16, 25–31. [Google Scholar] [CrossRef]
  38. Liu, K.; Ostadhassan, M.; Zou, J.; Gentzis, T.; Rezaee, R.; Bubach, B.; Carvajal-Ortiz, H. Multifractal analysis of gas adsorption isotherms for pore structure characterization of the Bakken Shale. Fuel 2018, 219, 296–311. [Google Scholar] [CrossRef]
  39. Lopes, R.; Betrouni, N. Fractal and multifractal analysis: A review. Med. Image Anal. 2009, 13, 634–649. [Google Scholar] [CrossRef] [PubMed]
  40. Muller, J. Characterization of pore space in chalk by multifractal analysis. J. Hydrol. 1996, 187, 215–222. [Google Scholar] [CrossRef]
  41. Muller, J.; Huseby, O.; Saucier, A. Influence of multifractal scaling of pore geometry on permeabilities of sedimentary rocks. Chaos Solitons Fractals 1995, 5, 1485–1492. [Google Scholar] [CrossRef]
  42. Xie, S.; Cheng, Q.; Ling, Q.; Li, B.; Bao, Z.; Fan, P. Fractal and multifractal analysis of carbonate pore-scale digital images of petroleum reservoirs. Mar. Pet. Geol. 2010, 27, 476–485. [Google Scholar] [CrossRef]
  43. Shi, X.; Liu, J.; Zhu, Y.; Xu, L.; Yang, Y.; Luo, C.; Li, Y.; Zhong, K.; Yang, X.; Wu, Q.; et al. Effects of the Sedimentary Environment on Organic-Rich Shale in the Intracratonic Sag of the Sichuan Basin, China. Appl. Sci. 2024, 14, 8594. [Google Scholar] [CrossRef]
  44. Lu, B.; Hou, D.-J.; Zou, C.-N.; Li, X.-Z.; Gao, R.-S.; Wei, H.-Y.; Qiu, Z. Depositional environment and organic matter enrichment mechanism of the lower cambrian shale in the southern Sichuan Basin. Front. Earth Sci. 2025, 13, 1509332. [Google Scholar] [CrossRef]
  45. SY/T 5163–2018; Analysis Method for Clay Minerals and Ordinary Non-Clay Minerals in Sedimentary Rocks by X-Ray Diffraction. National Energy Administration: Beijing, China, 2018.
  46. SY/T 5124–2012; Method of Determining Microscopically the Reflectance of Vitrinite in Sedimentary. National Energy Administration: Beijing, China, 2012.
  47. GB/T 19145–2003; Determination of Total Origanic Carbon in Sedimentary Rock. Standards Press of China: Beijing, China, 2003.
  48. Fu, C.; Du, Y.; Song, W.; Sang, S. Application of automated mineralogy in petroleum geology and development and CO2 sequestration: A review. Mar. Pet. Geol. 2023, 151, 106206. [Google Scholar] [CrossRef]
  49. Chmitt, M.; Fernandes, C.P.; Neto, J.A.d.C.; Wolf, F.G.; dos Santos, V.S. Characterization of pore systems in seal rocks using Nitrogen Gas Adsorption combined with Mercury Injection Capillary Pressure techniques. Mar. Pet. Geol. 2013, 39, 138–149. [Google Scholar] [CrossRef]
  50. Tong, Z.; Zhang, J.; Li, Z.; Wu, Y.; Wang, D.; Gong, D. Investigation of organic-shale nanopores in the Lower Cambrian Niutitang Formation using low temperature N2 and CO2 adsorption: Multifractality and classification. Microporous Mesoporous Mater. 2022, 337, 111935. [Google Scholar] [CrossRef]
  51. Brunauer, S.; Emmett, P.; Teller, E. Adsorption of Gases in Multimolecular Layers. J. Am. Chem. Soc. 1938, 60, 309–319. [Google Scholar] [CrossRef]
  52. Barrett, E.; Joyner, L.; Halenda, P. The Determination of Pore Volume and Area Distributions in Porous Substances. I. Comput. Nitrogen. Isotherms. J. Am. Chem. Soc. 1951, 73, 373–380. [Google Scholar] [CrossRef]
  53. Liu, K.; Zakharova, N.; Adeyilola, A.; Gentzis, T.; Carvajal-Ortiz, H.; Fowler, H. Understanding the CO2 adsorption hysteresis under low pressure: An example from the Antrim Shale in the Michigan Basin: Preliminary observations. J. Pet. Sci. Eng. 2021, 203, 108693. [Google Scholar] [CrossRef]
  54. Chaudhuri, B.; Sarkar, N. Texture segmentation using fractal dimension. IEEE Trans. Pattern Anal. Mach. Intell. 1995, 17, 72–77.7. [Google Scholar] [CrossRef]
  55. Ferreiro, J.; Wilson, M.; Vázquez, E. Multifractal Description of Nitrogen Adsorption Isotherms. Vadose Zone J. 2009, 8, 209–219. [Google Scholar] [CrossRef]
  56. Halsey, T.C.; Jensen, M.H.; Kadanoff, L.P.; Procaccia, I.; Shraiman, B.I. Fractal measures and their singularities: The characterization of strange sets. Nucl. Phys. B-Proc. Suppl. 1987, 2, 501–511. [Google Scholar] [CrossRef]
  57. Yao, P.; Zhang, J.; Lv, D.; Vandeginste, V.; Chang, X.; Zhang, X.; Wang, D.; Han, S.; Liu, Y. Effect of water occurrence in coal reservoirs on the production capacity of coalbed methane by using NMR simulation technology and production capacity simulation. Geoenergy Sci. Eng. 2024, 243, 213353. [Google Scholar] [CrossRef]
  58. The MathWorks, Inc. MATLAB, Version R2024a. 2024. Available online: https://www.mathworks.com (accessed on 26 August 2025).
  59. Lv, C.; Du, Y.; Fu, C.; Pan, Z.; Wang, Z.; Ma, J.; Gao, Y. Investigating the mechanistic effects of supercritical CO2 on tight sandstone mechanical properties under varying water compositions. Phys. Fluids 2025, 37, 046624. [Google Scholar] [CrossRef]
  60. Guo, J.; Luo, G.; Wang, H.; Zhang, L. Pore Structure and Multifractal Characteristics of the Upper Lianggaoshan Formation in the Northeastern Sichuan Basin, China. Fractal. Fract. 2025, 9, 430. [Google Scholar] [CrossRef]
  61. Wang, S.; Chen, F.; Yue, S.; Hu, J.; Ding, H.; Lu, A. Multifractal Characterization of Pore Structure of Coals Using Gas Adsorption Experiment and Mercury Intrusion Porosimetry (MIP). Fractal. Fract. 2025, 9, 183. [Google Scholar] [CrossRef]
  62. Wu, X.; Gu, Y.; Jiang, Y.; Wang, Z.; Fu, Y. Characterization of Pore Heterogeneity in Lacustrine Shale Based on MIP, LTNA, NMR, and Multifractal Characteristics: A Case Study of the Jurassic Dongyuemiao Member, China. Fractal. Fract. 2025, 9, 265. [Google Scholar] [CrossRef]
  63. Du, Y.; Sang, S.; Pan, Z.; Wang, W.; Liu, S.; Fu, C.; Zhao, Y.; Zhang, J. Experimental study of supercritical CO2-H2O-coal interactions and the effect on coal permeability. Fuel 2019, 253, 369–382. [Google Scholar] [CrossRef]
  64. de Oliveira, C.S.; Kohns, R.; Meyerhöfer, F.; Carstens, S.; Enke, D.; Wehrspohn, R.B. Multi-technique structural characterization of glass foams with complex pore structures obtained through phase separation. Mater. Chem. Front. 2021, 5, 4615–4625. [Google Scholar] [CrossRef]
  65. Yu, Y.; Luo, X.; Wang, Z.; Cheng, M.; Lei, Y.; Zhang, L.; Yin, J. A new correction method for mercury injection capillary pressure (MICP) to characterize the pore structure of shale. J. Nat. Gas Sci. Eng. 2019, 68, 102896. [Google Scholar] [CrossRef]
  66. Clarkson, C.R.; Wood, J.M.; Burgis, S.E.; Aquino, S.D.; Freeman, M.; Birss, V.I. Nanopore Structure Analysis and Permeability Predictions for a Tight Gas/Shale Reservoir Using Low-Pressure Adsorption and Mercury Intrusion Techniques. SPE Am. Unconv. Resour. Conf. 2012, 15, 648–661. [Google Scholar]
  67. Ullah, B.; Cheng, Y.; Wang, L.; Yang, W.; Jiskani, I.M.; Hu, B. Experimental analysis of pore structure and fractal characteristics of soft and hard coals with same coalification. Int. J. Coal Sci. Amp. Technol. 2022, 9, 58. [Google Scholar] [CrossRef]
  68. Ciğeroğlu, Z.; El Messaoudi, N.; Şenol, Z.M.; Başkan, G.; Georgin, J.; Gubernat, S. Clay-based nanomaterials and their adsorptive removal efficiency for dyes and antibiotics: A review. Mater. Today Sustain. 2024, 26, 100735. [Google Scholar] [CrossRef]
  69. Shafei, L.; Adhikari, P.; San, S.; Ching, W.-Y. Electronic Structure and Mechanical Properties of Solvated Montmorillonite Clay Using Large-Scale DFT Method. Crystals 2023, 13, 1120. [Google Scholar] [CrossRef]
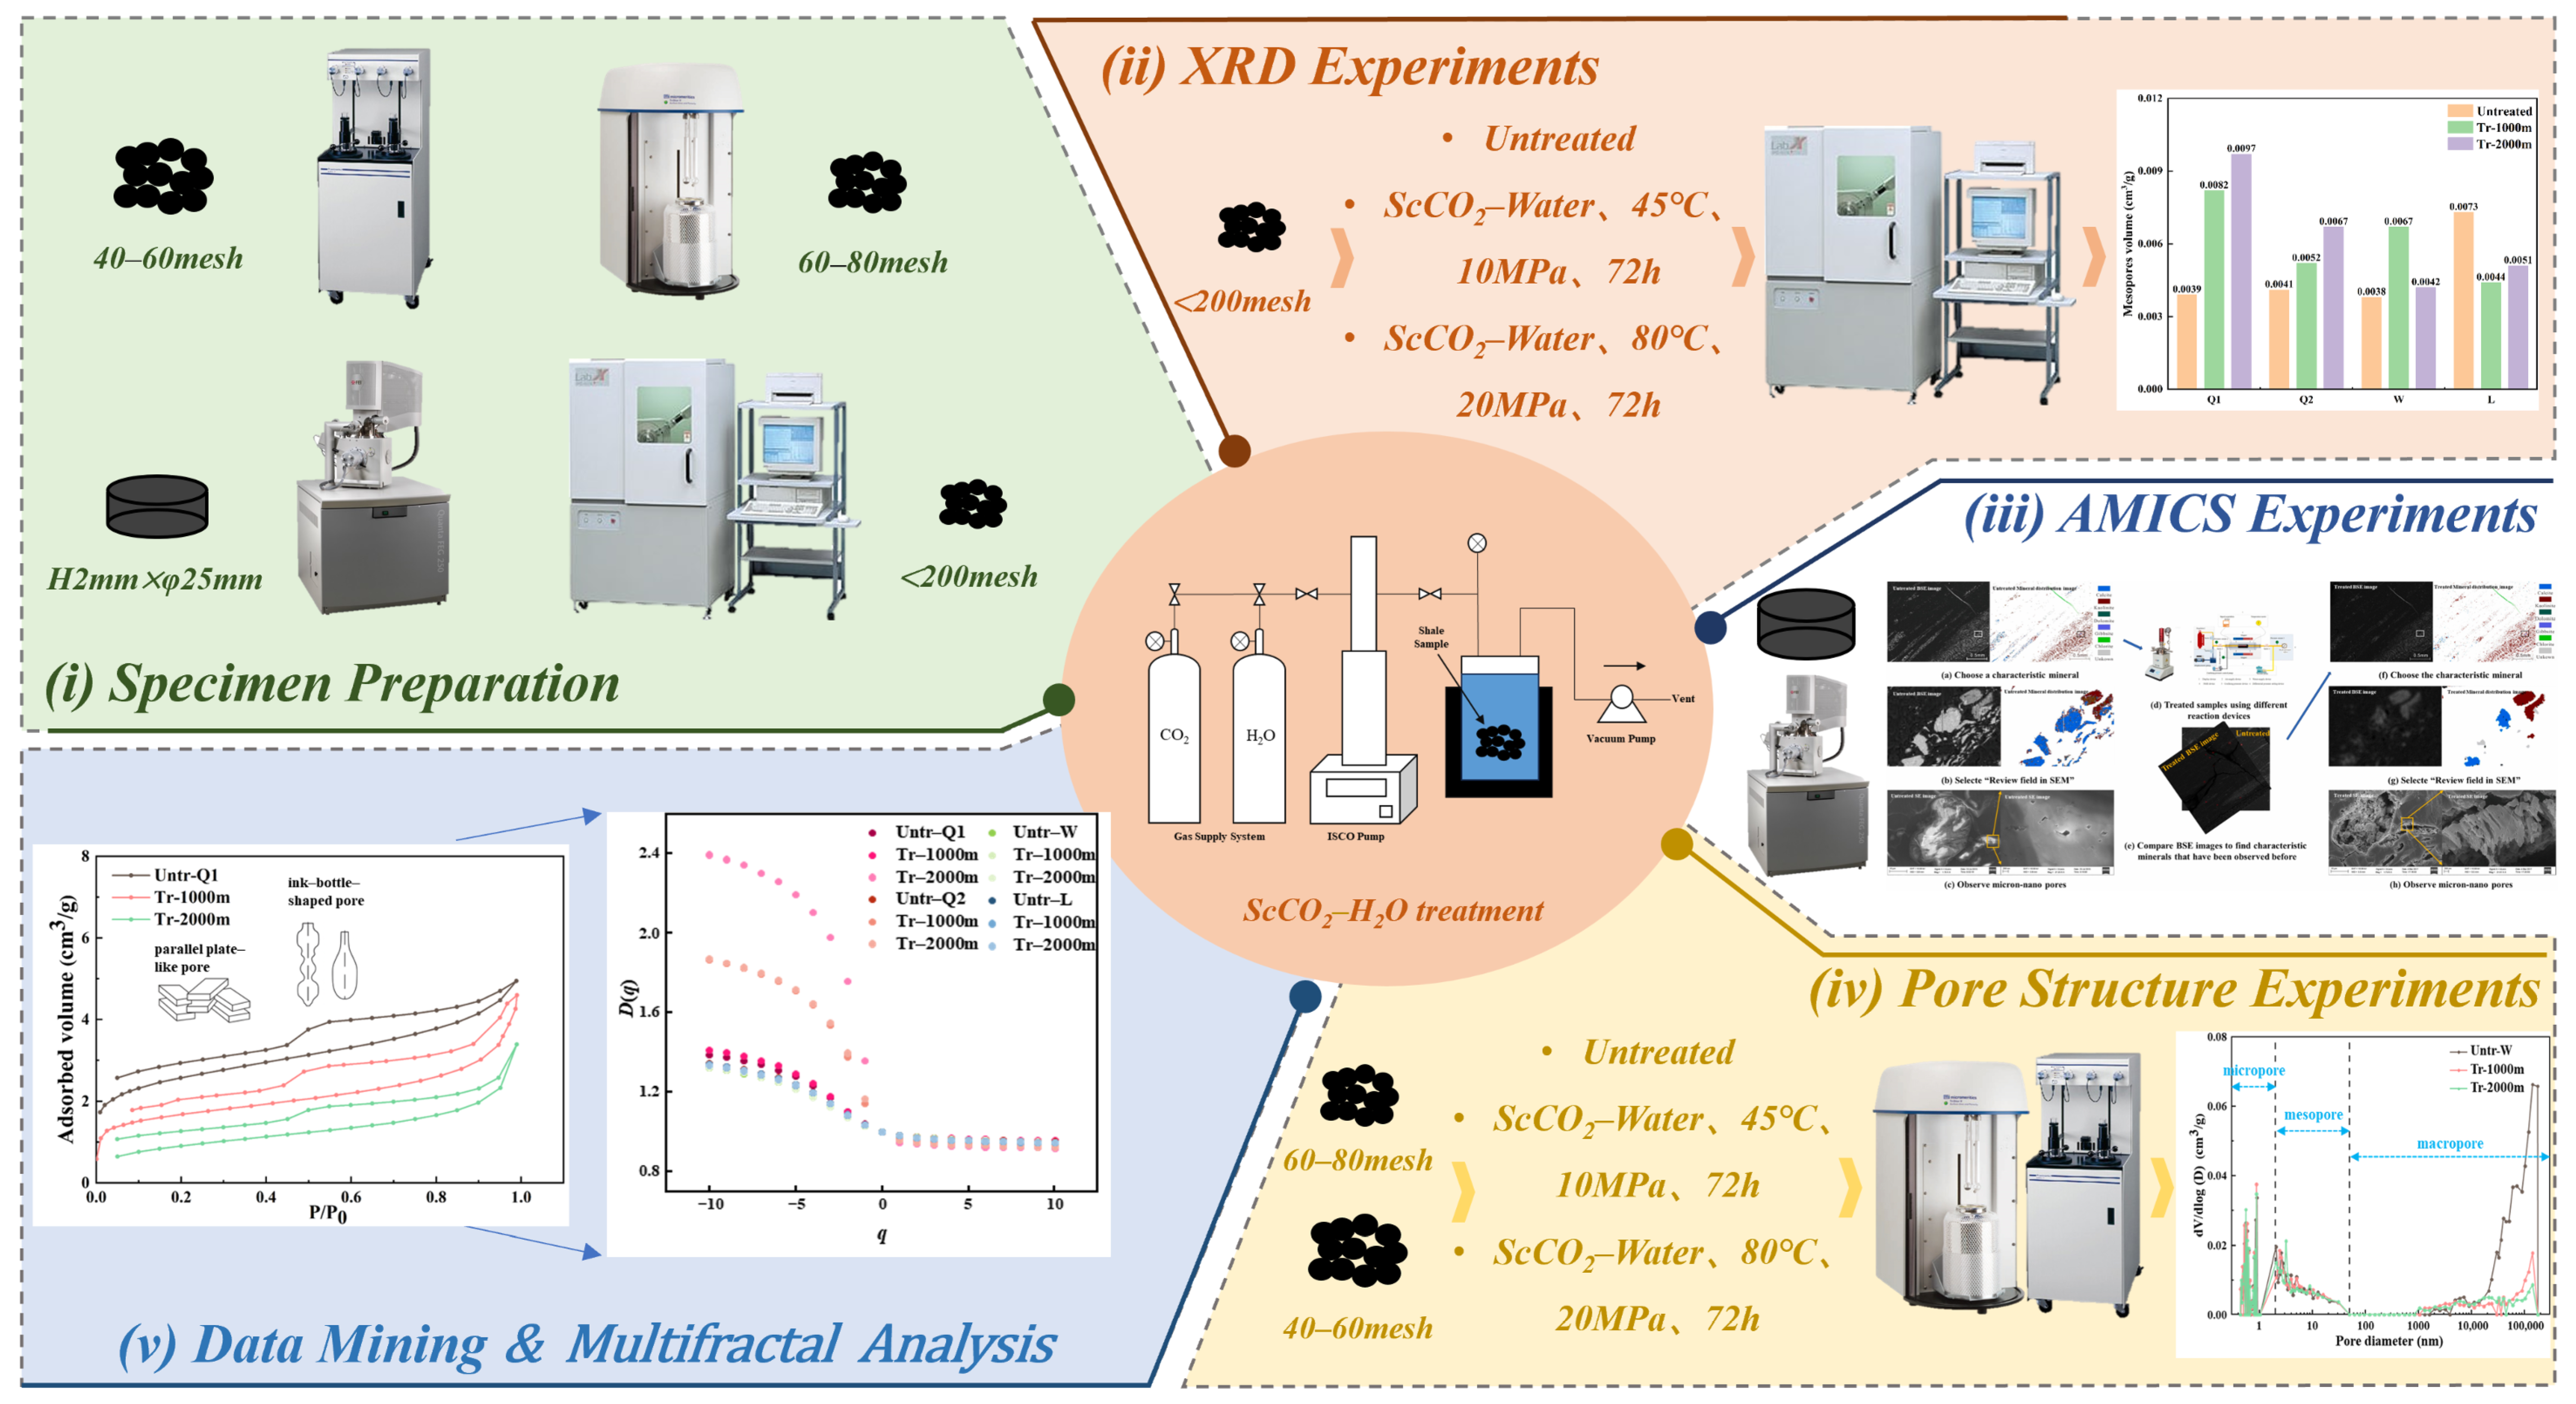
Figure 1. Experimental equipment and workflow.
Fractalfract 09 00582 g001
Figure 2. Schematic diagram of the observation process [48].
Fractalfract 09 00582 g002
Figure 3. Mineral compositions of the untreated and treated shale. (a) Changes in minerals of Q1. (b) Changes in minerals of Q2. (c) Changes in minerals of W. (d) Changes in minerals of L.
Fractalfract 09 00582 g003
Figure 4. Adsorption–desorption curves of the untreated and treated shale based on N2GA. (a) Changes in curves of Q1. (b) Changes in curves of Q2. (c) Changes in curves of W. (d) Changes in curves of L.
Fractalfract 09 00582 g004
Figure 5. PSD of the untreated and treated shale based on MICP. (a) Changes in PSD of Q1. (b) Changes in PSD of Q2. (c) Changes in PSD of W. (d) Changes in PSD of L.
Fractalfract 09 00582 g005
Figure 6. PSD of the untreated and treated shale based on N2GA. (a) Changes in PSD of Q1. (b) Changes in PSD of Q2. (c) Changes in PSD of W. (d) Changes in PSD of L.
Fractalfract 09 00582 g006
Figure 7. Adsorption–desorption curves and PSD of the untreated and treated shale based on CO2GA. (a) Q1. (b) Q2. (c) W. (d) L.
Fractalfract 09 00582 g007
Figure 8. PSD joint characterization of the untreated and treated shale. (a) Changes in PSD joint characterization of the untreated and treated in Q1 sample. (b) Changes in PSD joint characterization of the untreated and treated in Q2 sample. (c) Changes in PSD joint characterization of the untreated and treated in W sample. (d) Changes in PSD joint characterization of the untreated and treated in L sample.
Fractalfract 09 00582 g008
Figure 9. Multifractal parameter plots of the untreated and treated shale. (ac) Multifractal parameter plots based on MICP. (df) Multifractal parameter plots based on N2GA. (gi) Multifractal parameter plots based on CO2GA.
Fractalfract 09 00582 g009
Figure 10. Mineral dissolution phenomenon based on FE–SEM. (ad) Sample Q1. (ej) Sample W. (kp) Sample L.
Fractalfract 09 00582 g010
Figure 11. Mineral precipitation phenomenon based on FE–SEM. (a,b) Sample L. (c,d) Sample W.
Fractalfract 09 00582 g011
Figure 12. Mesopore volume and macropore volume based on MICP and N2GA. (a) Changes in mesopore volume based on MICP. (b) Changes in mesopore volume based on N2GA. (c) Changes in macropore volume based on MICP. (d) Changes in macropore volume based on N2GA.
Fractalfract 09 00582 g012
Figure 13. Heat map of correlation between pore parameters, multifractal parameters and mineral composition. (a) Correlation based on MICP. (b) Correlation based on N2GA. (c) Correlation based on CO2GA.
Fractalfract 09 00582 g013
Figure 14. Schematic diagram of ScCO2–water–shale interaction. (a) Changes in mineral compositions before and after CO2 injection. (b) Changes in micropore. (c) Changes in mesopore and macropore.
Fractalfract 09 00582 g014
Table 1. Shale sample petrophysical information.
SampleMineral Compositions/%TOC/%R0/%
QuartzAlbiteClayPyriteCarbonate
Q12127.245.8603.631.83
Q228.527.2386.303.092.03
W66.55.319.73.554.631.36
L58.97.522.62.98.14.311.43
Table 2. SSA and PV of the untreated and treated shale based on MICP.
Sample No.SSA (m2/g)PV (cm3/g)
MesoporesMacroporesTSSAMesoporesMacroporesTPV
Untr–Q12.4010.0382.4390.00390.00590.0098
Tr–1000 m5.1720.0455.2170.00820.00550.0137
Tr–2000 m5.8270.0615.8880.00970.00450.0142
Untr–Q22.4840.0642.5480.00410.00980.0139
Tr–1000 m3.2350.0653.30.00520.00540.0106
Tr–2000 m4.2640.0434.3070.00670.00440.0111
Untr–W1.8260.0031.8290.00380.03350.0373
Tr–1000 m3.7360.0113.7470.00670.00960.0163
Tr–2000 m2.1620.0072.1690.00420.00830.0125
Untr–L4.8750.0024.8770.00730.02270.03
Tr–1000 m2.1890.0282.2170.00440.00530.0097
Tr–2000 m2.5770.0332.610.00510.00640.0115
Notes: TPV and TSSA, respectively, represent total PV and total SSA.
Table 3. SSA and PV of the untreated and treated shale pores based on N2GA.
Sample No.BET SSA (m2/g)PV (cm3/g)
MicroporesMesoporesMacroporesTPV
Untr–Q19.2700.00560.00140.007
Tr–1000 m6.100.00400.00200.006
Tr–2000 m3.2800.00230.00170.004
Untr–Q25.0900.00390.00110.005
Tr–1000 m3.300.00230.00170.004
Tr–2000 m2.1200.00180.00130.003
Untr–W18.850.00150.01010.00150.013
Tr–1000 m18.390.00170.01070.00270.015
Tr–2000 m14.860.00110.00900.00180.012
Untr–L19.540.00180.01130.00190.015
Tr–1000 m17.850.00150.01100.00240.015
Tr–2000 m15.460.00110.00880.00210.012
Table 4. SSA and PV of the shale pores based on CO2GA.
Sample No.SSAPVSample No.SSAPV
Untr–Q112.0990.004Untr–W8.8970.0028
Tr–1000 m12.1060.004Tr–1000 m8.6310.0028
Tr–2000 m12.2050.004Tr–2000 m8.3960.0026
Untr–Q28.2390.002Untr–L8.5740.0028
Tr–1000 m4.0480.001Tr–1000 m8.9510.0028
Tr–2000 m9.0270.003Tr–2000 m8.450.0027
Table 5. Multifractal parameters from MICP.
Sample No.D−10D10D0D1D2D−10D10D−10D0D0D10a−10a10a0H
Untr–Q11.5700.90110.9720.9570.6690.5700.0990.8591.0410.979
Tr–1000 m1.5040.83410.9600.9300.6700.5040.1660.8571.0490.965
Tr–2000 m1.4970.79110.9410.8940.7060.4970.2090.8901.0650.947
Untr–Q21.5760.92310.9720.9600.6530.5760.0770.8351.0450.980
Tr–1000 m1.5560.84910.9510.9220.7070.5560.1510.8951.0670.961
Tr–2000 m1.5290.83010.9550.9220.6990.5290.1700.8891.0560.961
Untr–W1.5230.98210.9910.9870.5410.5230.0180.7021.0150.993
Tr–1000 m1.6320.87310.9700.9530.7590.6320.1270.9751.0430.988
Tr–2000 m1.6060.87610.9720.9550.7300.6060.1240.9431.0410.983
Untr–L1.5210.98210.9900.9870.5390.5210.0180.6971.0160.994
Tr–1000 m1.4960.92210.9850.9760.5740.4960.0780.7761.0210.976
Tr–2000 m1.6170.91810.9770.9660.7010.6170.0820.9061.0360.977
Table 6. Multifractal parameters from N2GA.
Sample No.D−10D10D0D1D2D−10D10D−10D0D0D10α−10α10α0H
Untr–Q11.0710.95910.9930.9870.1130.0710.0410.1891.0070.994
Tr–1000 m1.1760.91110.9850.9720.2650.1760.0890.4141.0150.986
Tr–2000 m1.1170.89210.9850.9710.2250.1170.1080.3531.0150.986
Untr–Q21.1060.93810.9890.980.1680.1060.0620.2631.0120.990
Tr–1000 m1.1220.88310.9810.9630.2390.1220.1170.3561.0190.981
Tr–2000 m1.1260.84010.9760.9510.2860.1260.1600.4071.0240.976
Untr–W1.0930.9610.9930.9860.1340.0930.0400.2231.0080.993
Tr–1000 m1.1030.95510.9920.9850.1480.1030.0450.2441.0090.992
Tr–2000 m1.1570.94910.9890.9800.2080.1570.0510.3211.0120.990
Untr–L1.0930.96210.9930.9870.1310.0930.0380.2211.0070.994
Tr–1000 m1.1060.95510.9920.9850.1510.1060.0450.2471.0090.992
Tr–2000 m1.1360.95510.9910.9840.1810.1360.0450.2881.0100.992
Table 7. Multifractal parameters from CO2GA.
Sample No.D−10D10D0D1D2D−10D10D−10D0D0D10α−10α10α0H
Untr–Q11.3890.94610.9810.9700.4430.3890.0540.5931.0260.985
Tr–1000 m1.4130.95610.9830.9740.4580.4130.0440.6101.0240.987
Tr–2000 m2.3940.91710.9470.9371.4771.3940.0831.7301.1310.968
Untr–Q21.3420.95010.9830.9730.3920.3420.0500.5351.0230.987
Tr–1000 m1.8660.94110.9670.9570.9250.8660.0591.1191.0640.979
Tr–2000 m1.8680.92310.9570.9450.9460.8680.0771.1451.0840.972
Untr–W1.3360.94510.9820.9710.3910.3360.0550.5331.0240.986
Tr–1000 m1.3490.94410.9810.970.3950.3490.0560.5351.0250.986
Tr–2000 m1.3340.94510.9820.9710.3890.3340.0550.5271.0240.987
Untr–L1.3240.94710.9830.9720.3770.3240.0530.5231.0230.985
Tr–1000 m1.3280.94610.9820.9710.3830.3280.0540.5231.0230.985
Tr–2000 m1.3260.94810.9830.9730.3780.3260.0520.5281.0210.985
Disclaimer/Publisher’s Note: The statements, opinions and data contained in all publications are solely those of the individual author(s) and contributor(s) and not of MDPI and/or the editor(s). MDPI and/or the editor(s) disclaim responsibility for any injury to people or property resulting from any ideas, methods, instructions or products referred to in the content.