

Mechanical Response and Damage Characteristics of Frozen–Thawed Sandstone Across Various Temperature Ranges Under Impact Loads


Abstract
1. Introduction
2. Material Preparation and Experimental Scheme
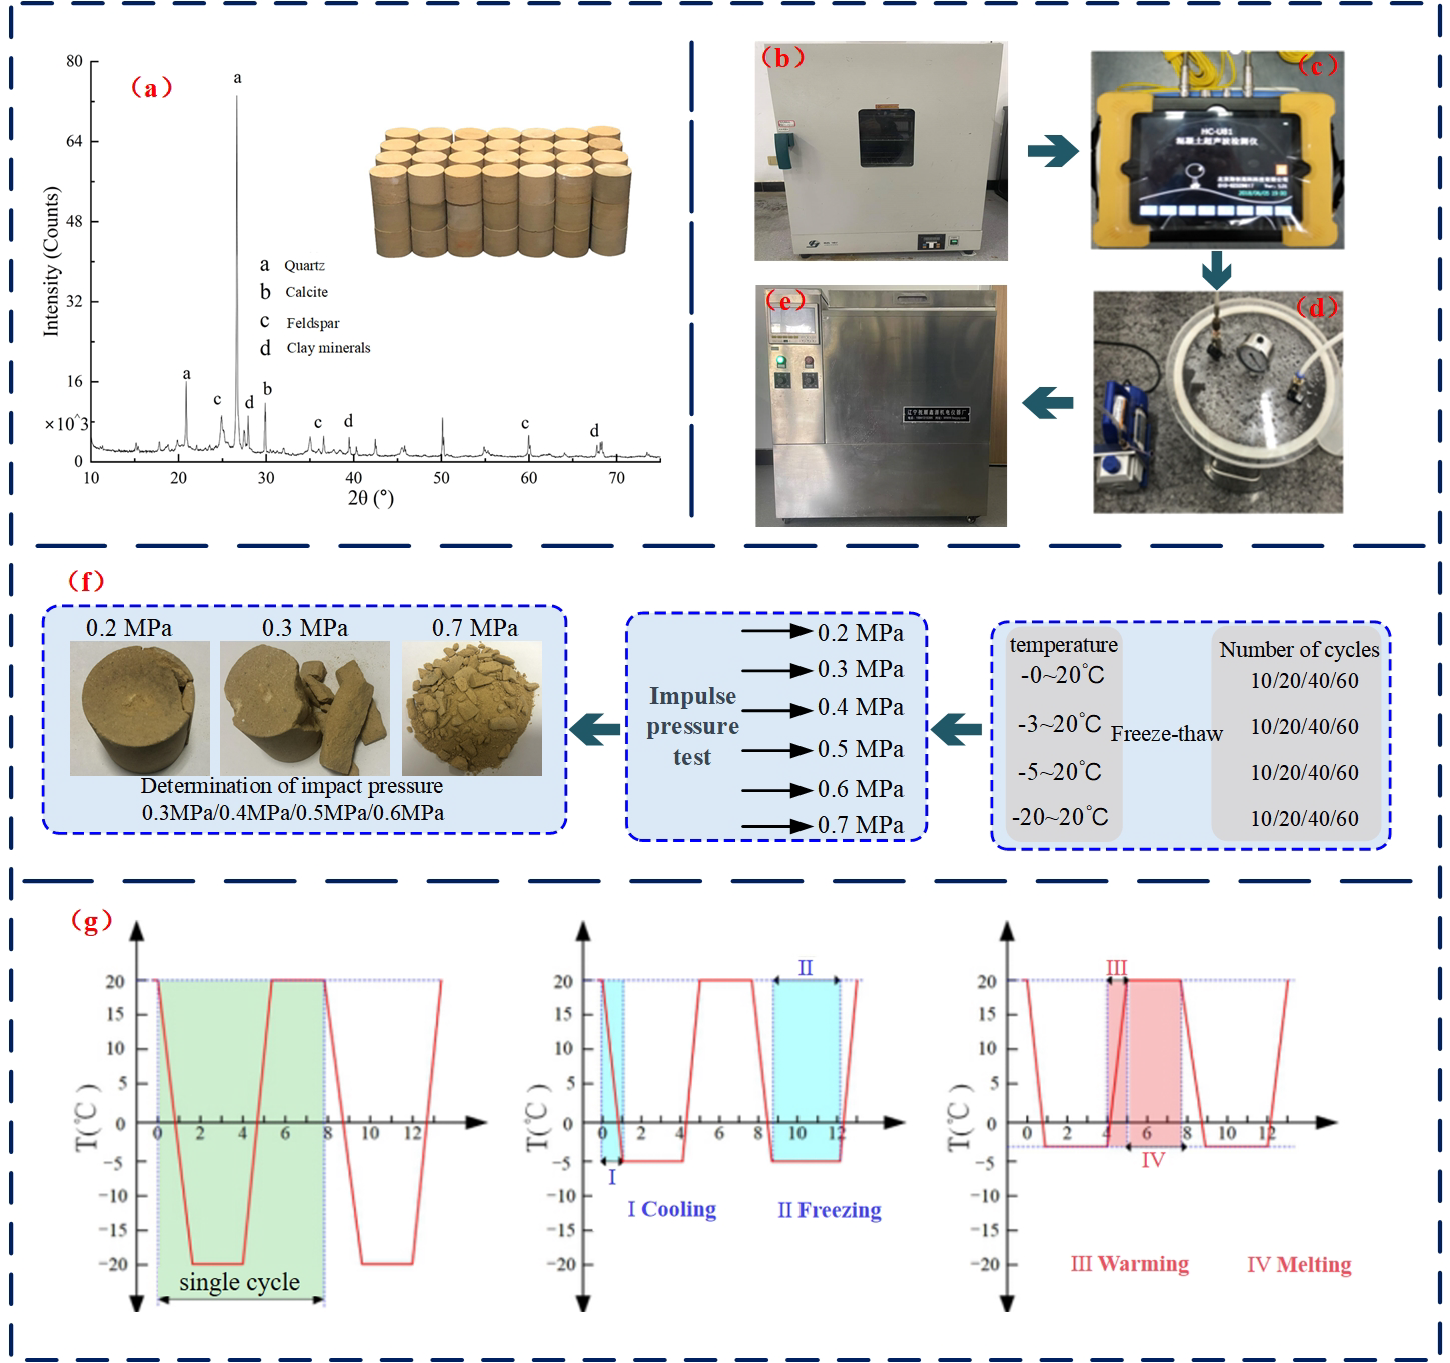
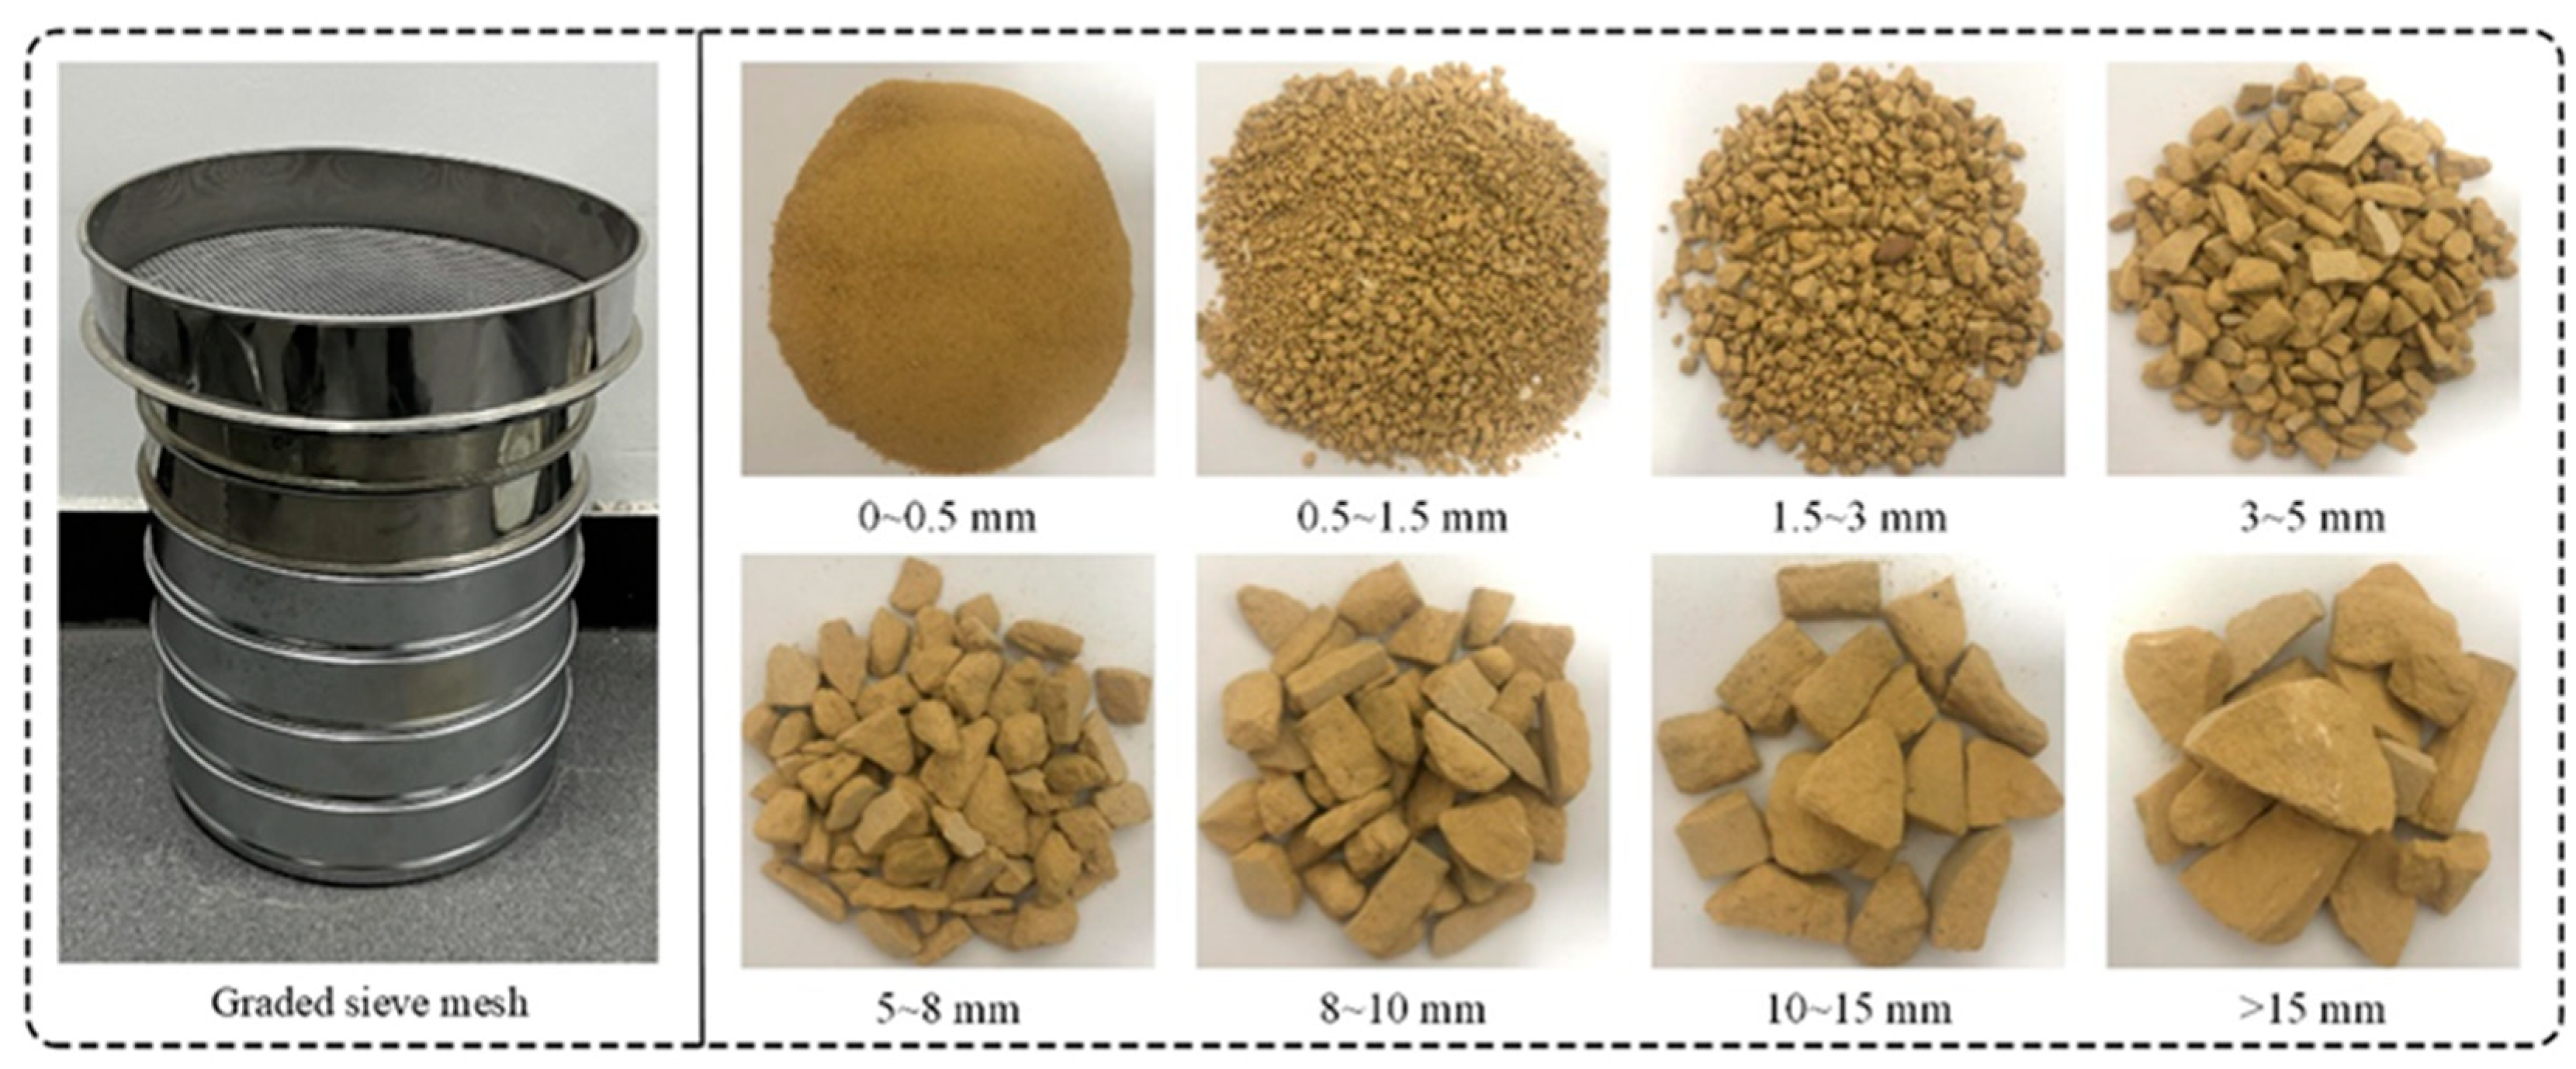
2.1. Material Preparation
2.2. SHPB System and Test Scheme
3. Impact Mechanical Responses of Frozen–Thawed Sandstone
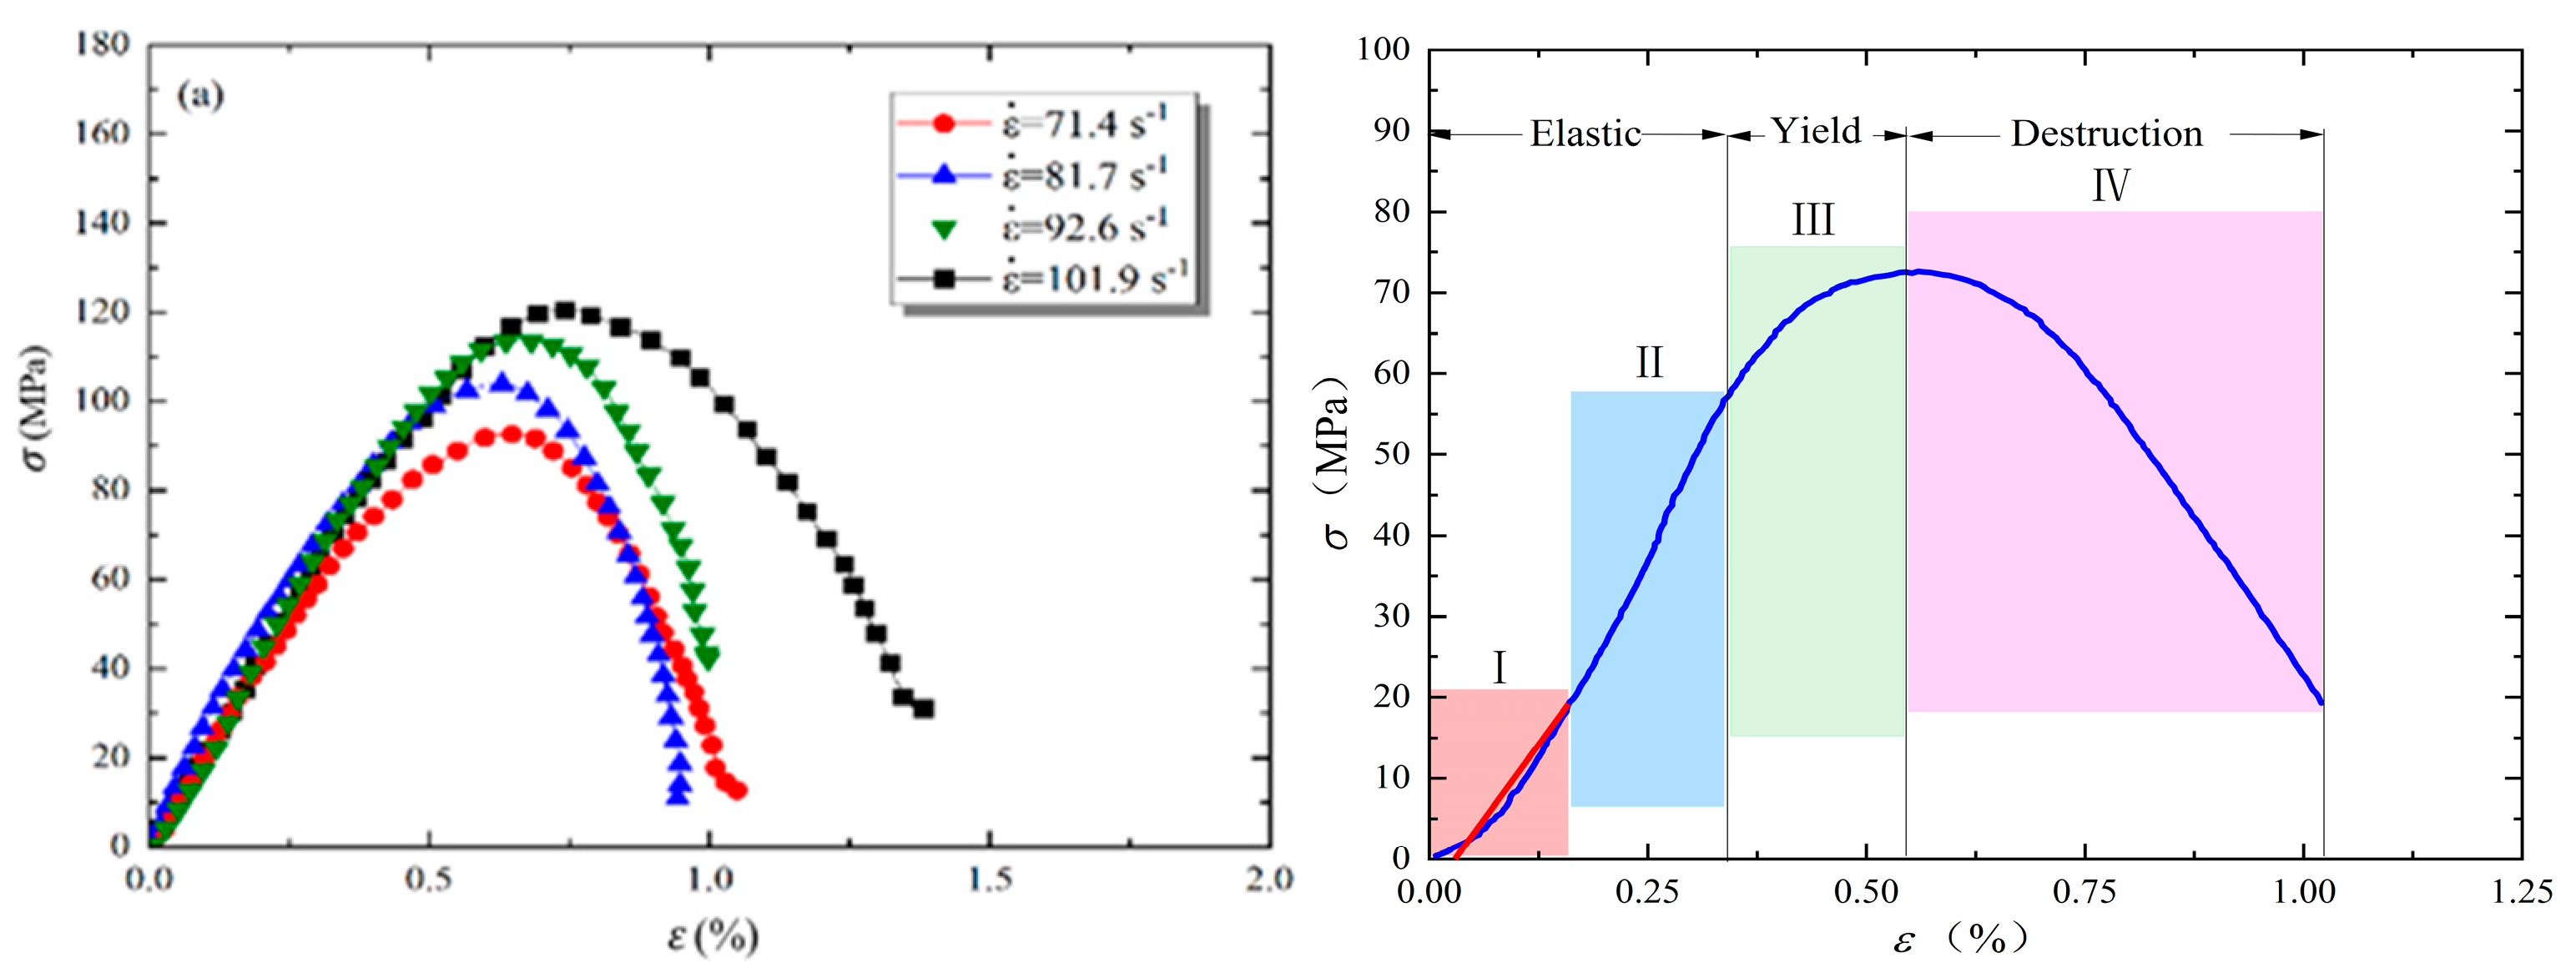
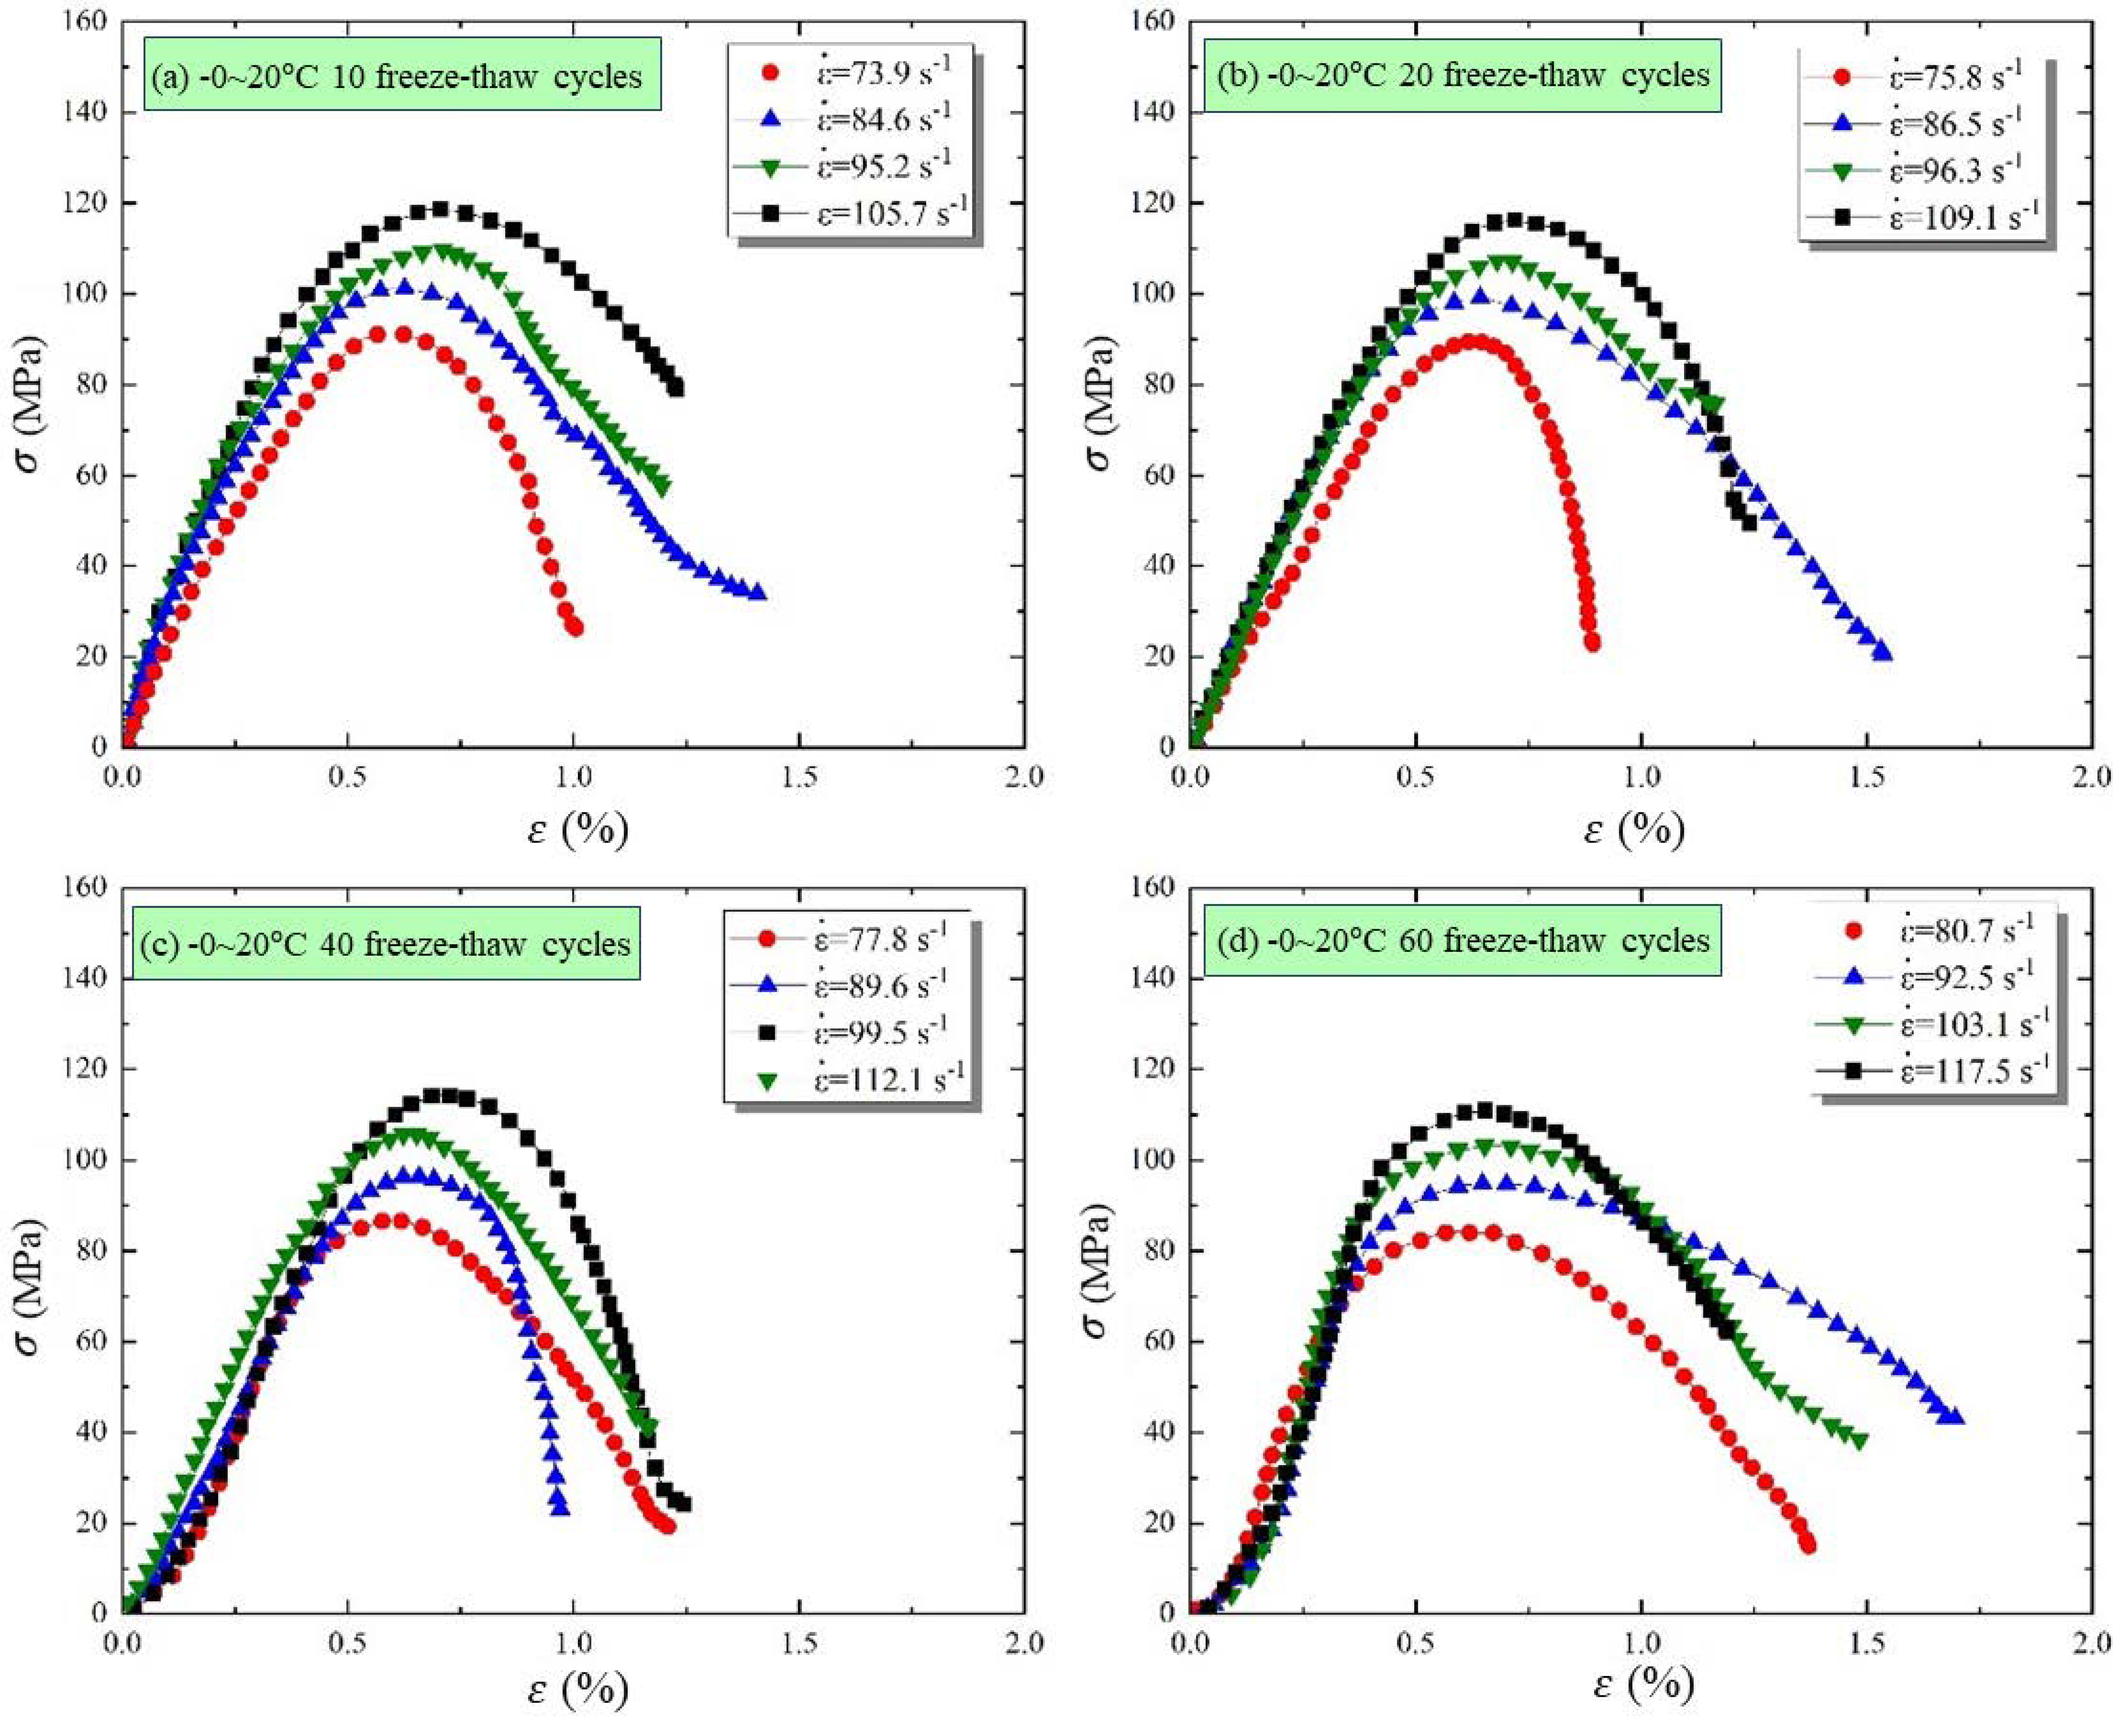
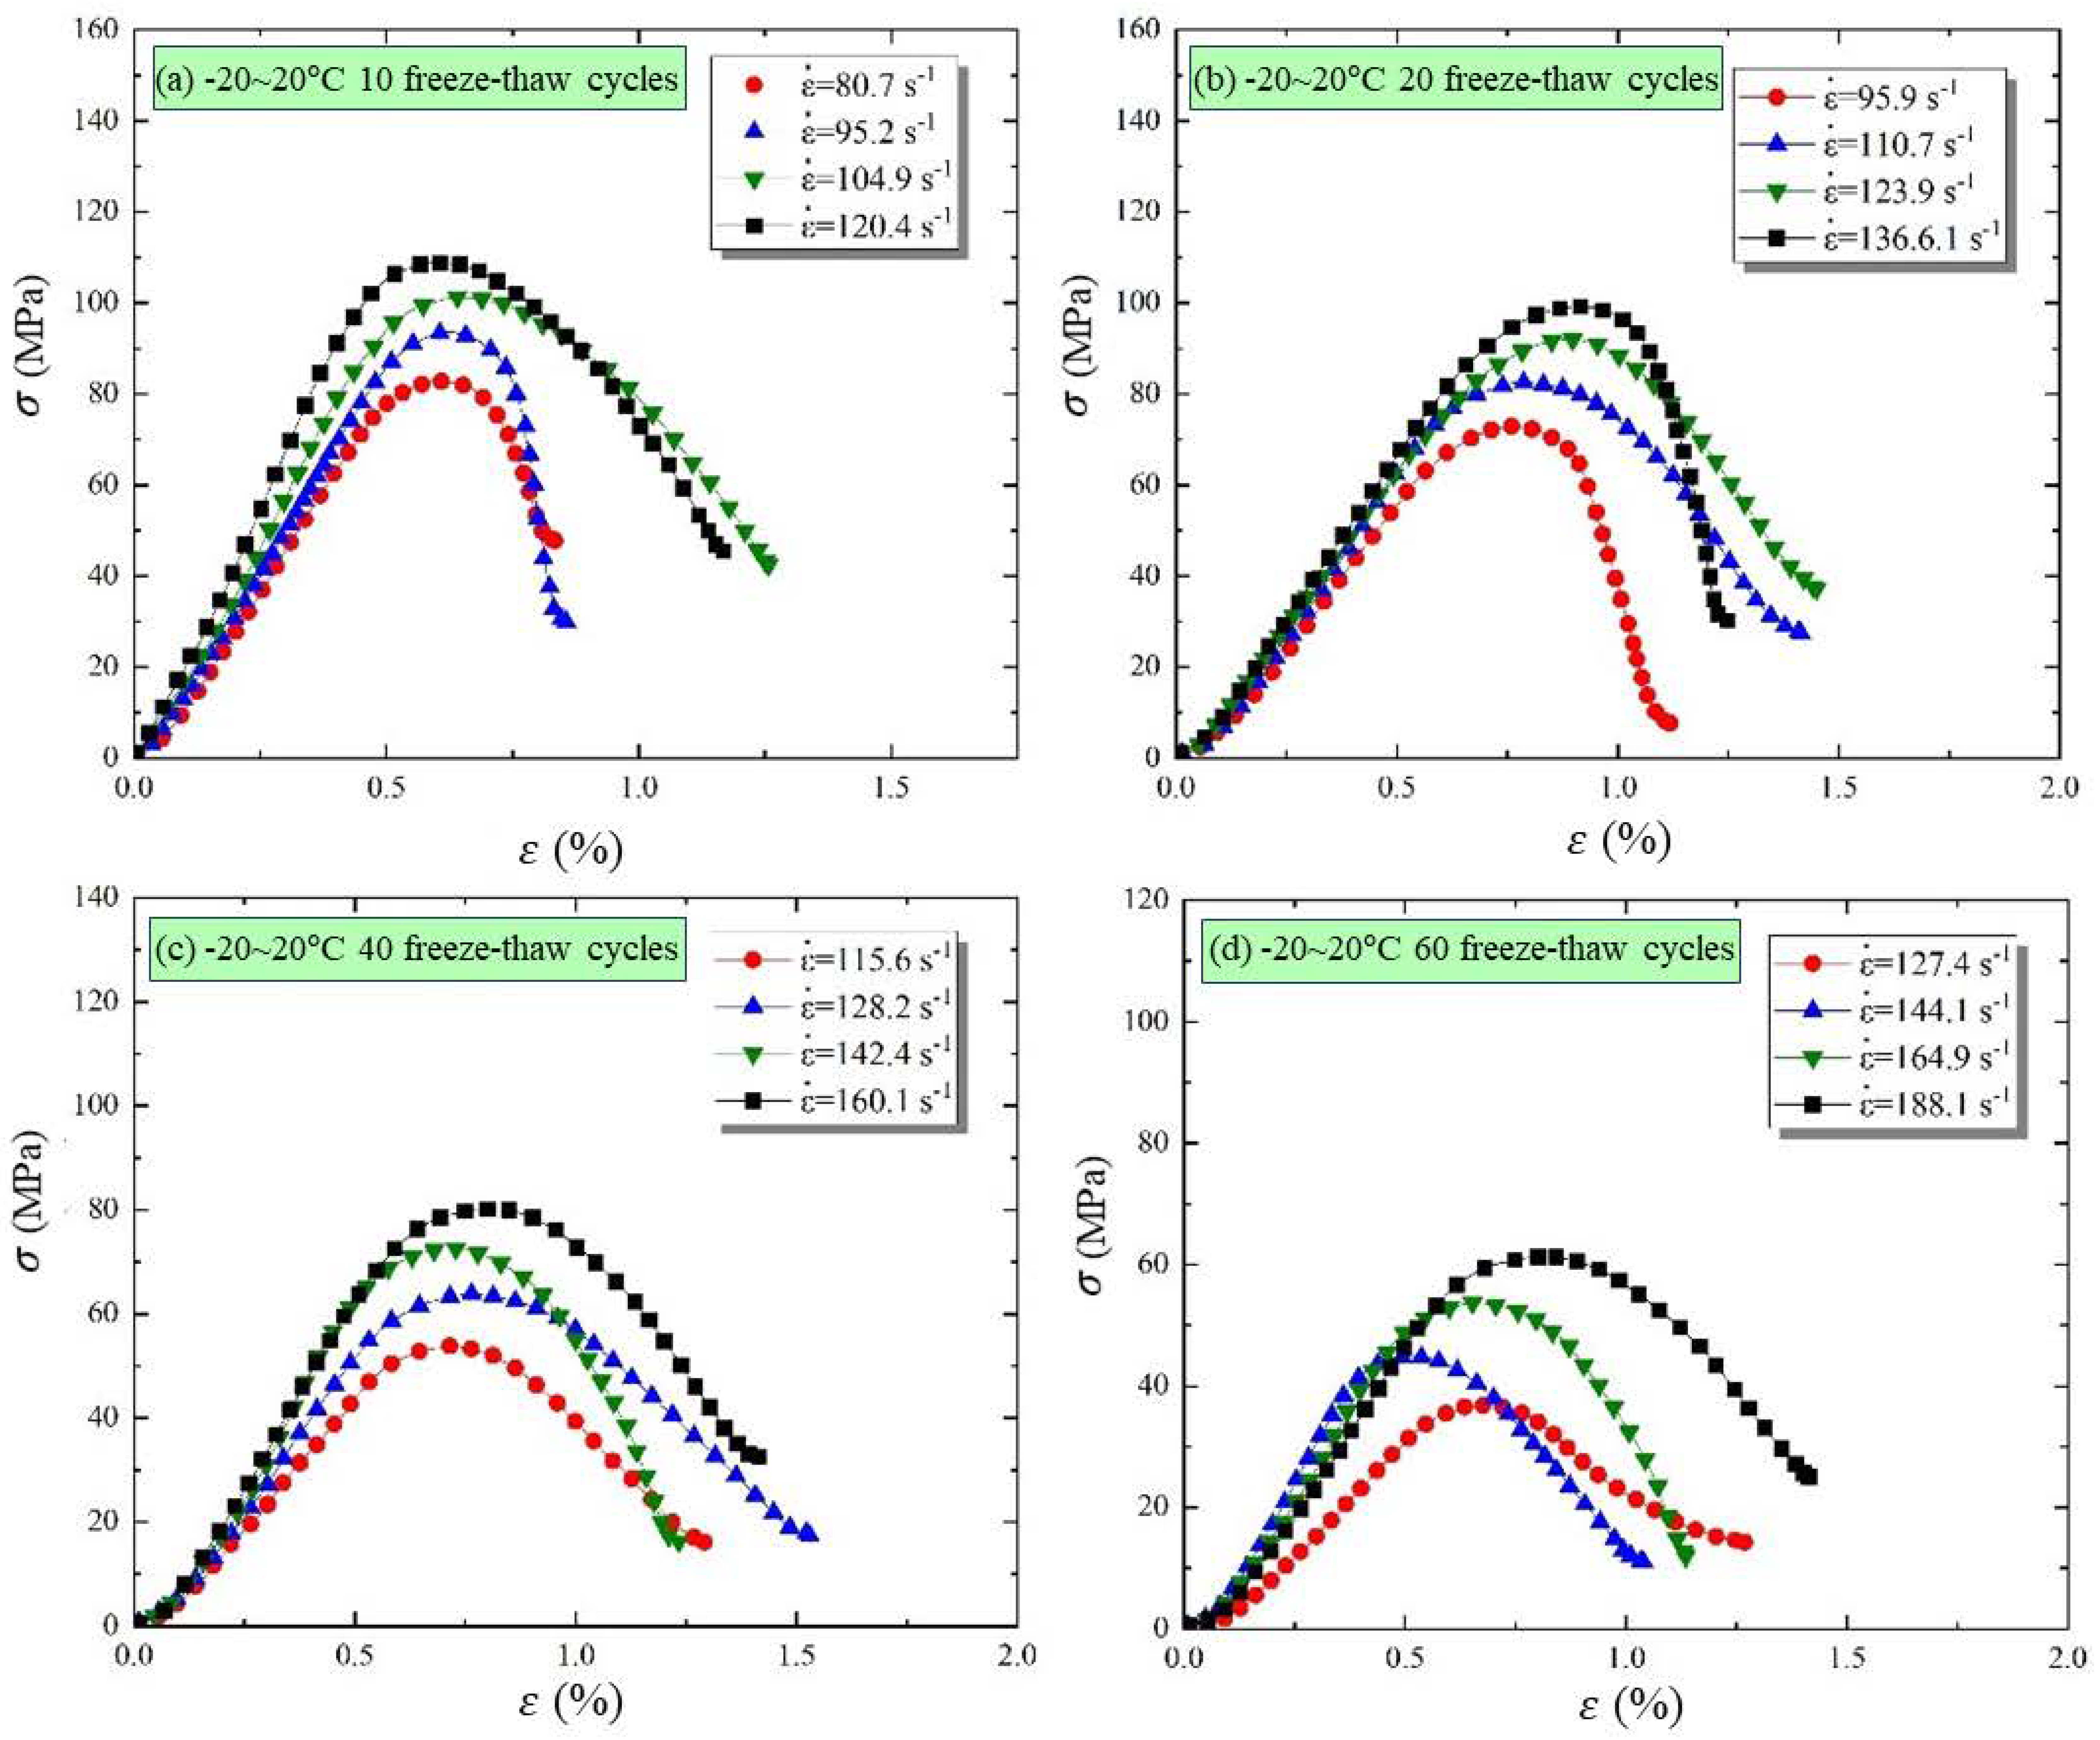
3.1. Characteristics of Dynamic Compressive Stress–Strain Curves
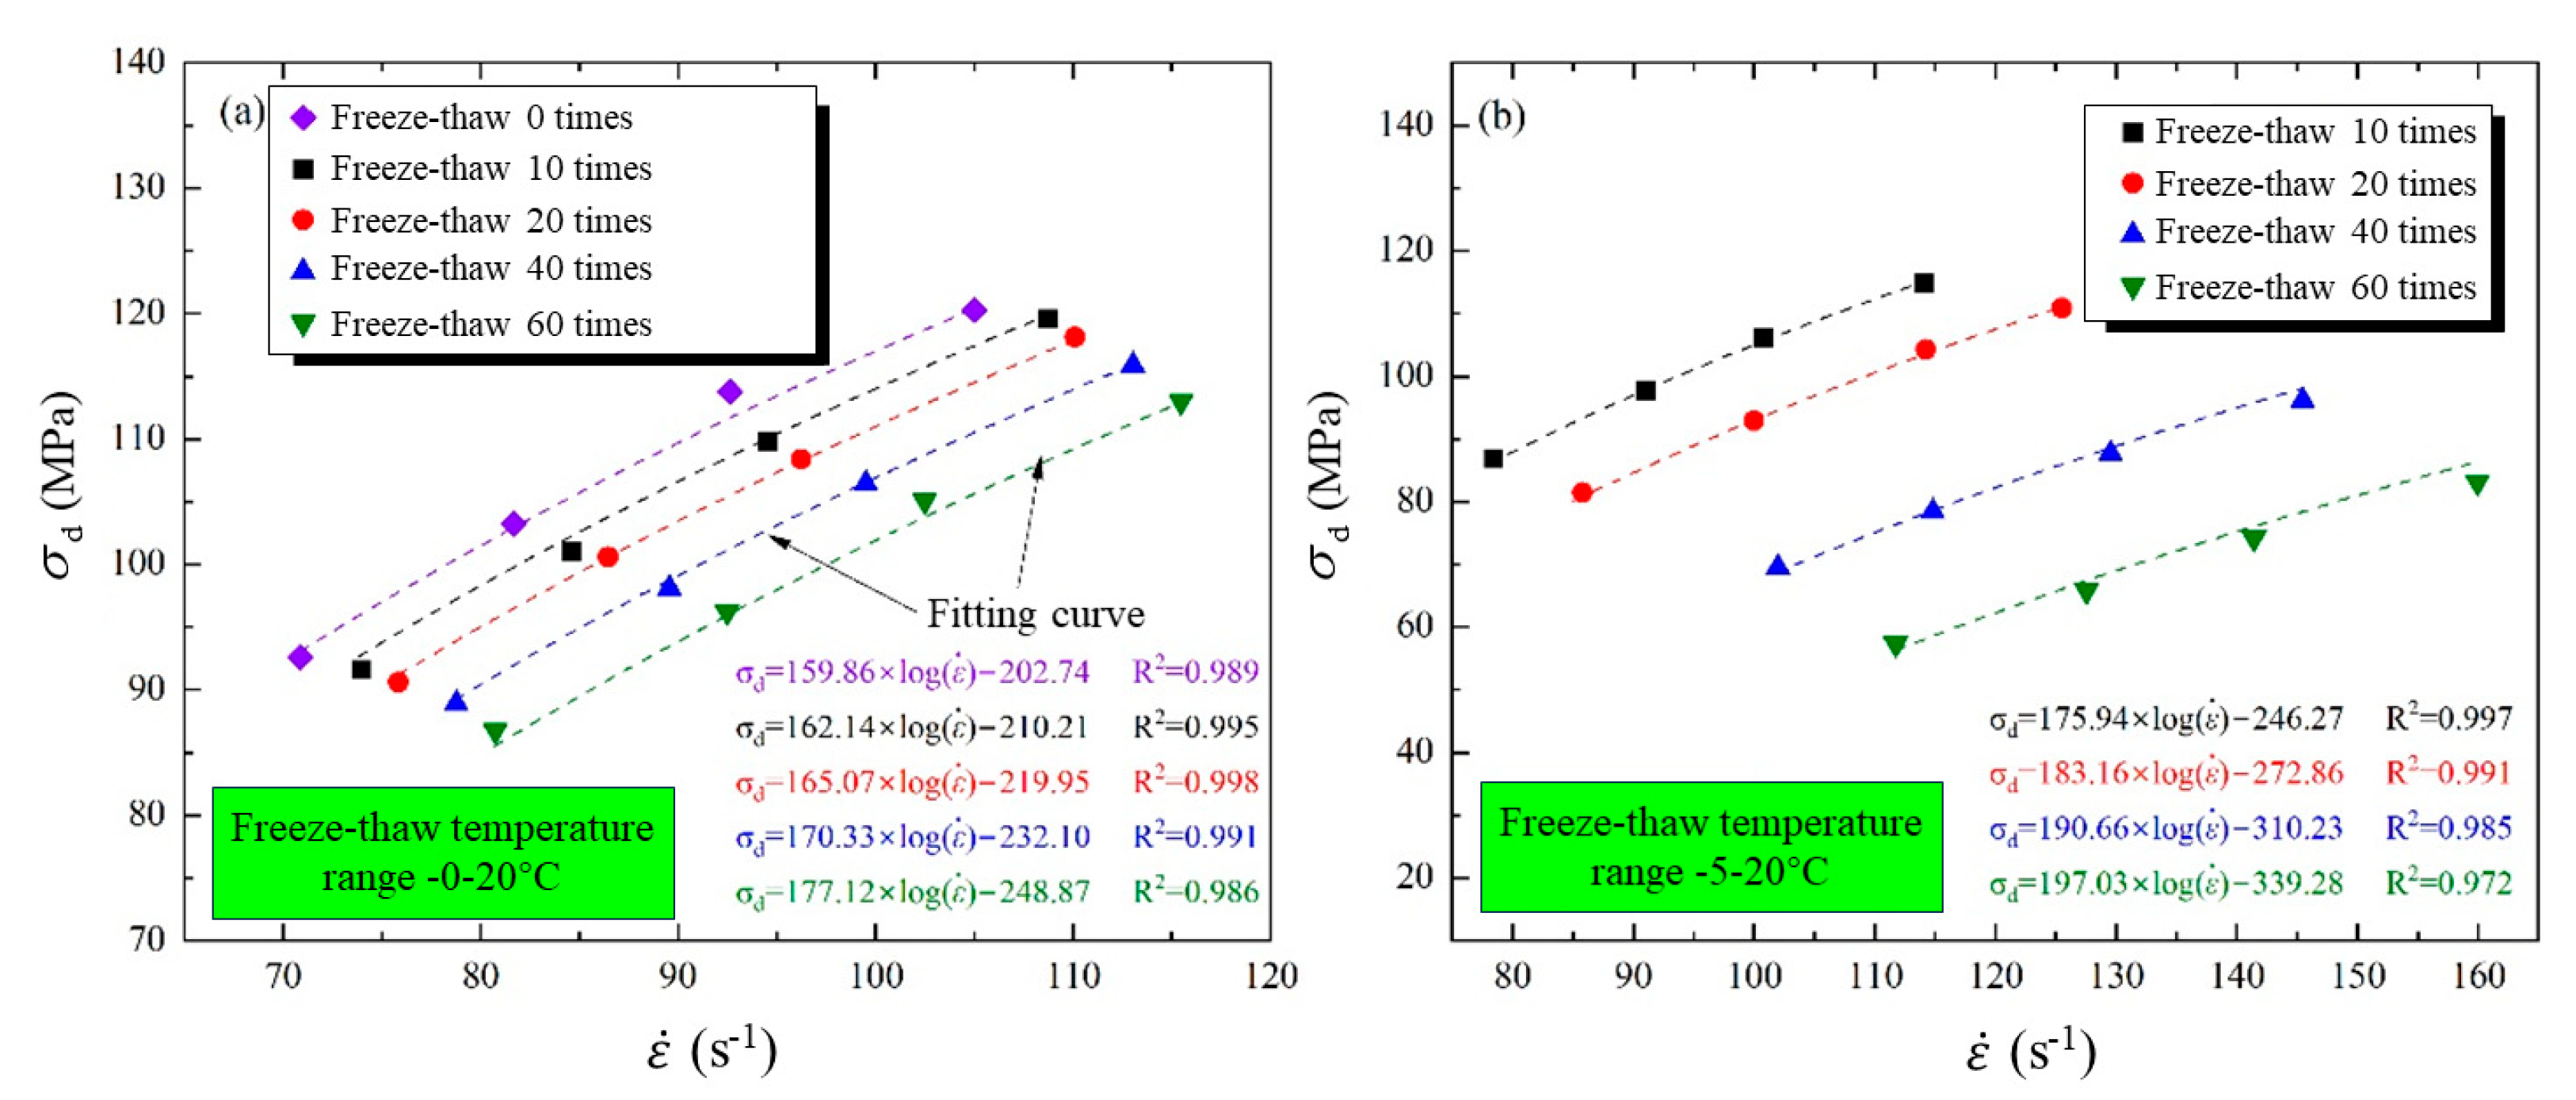
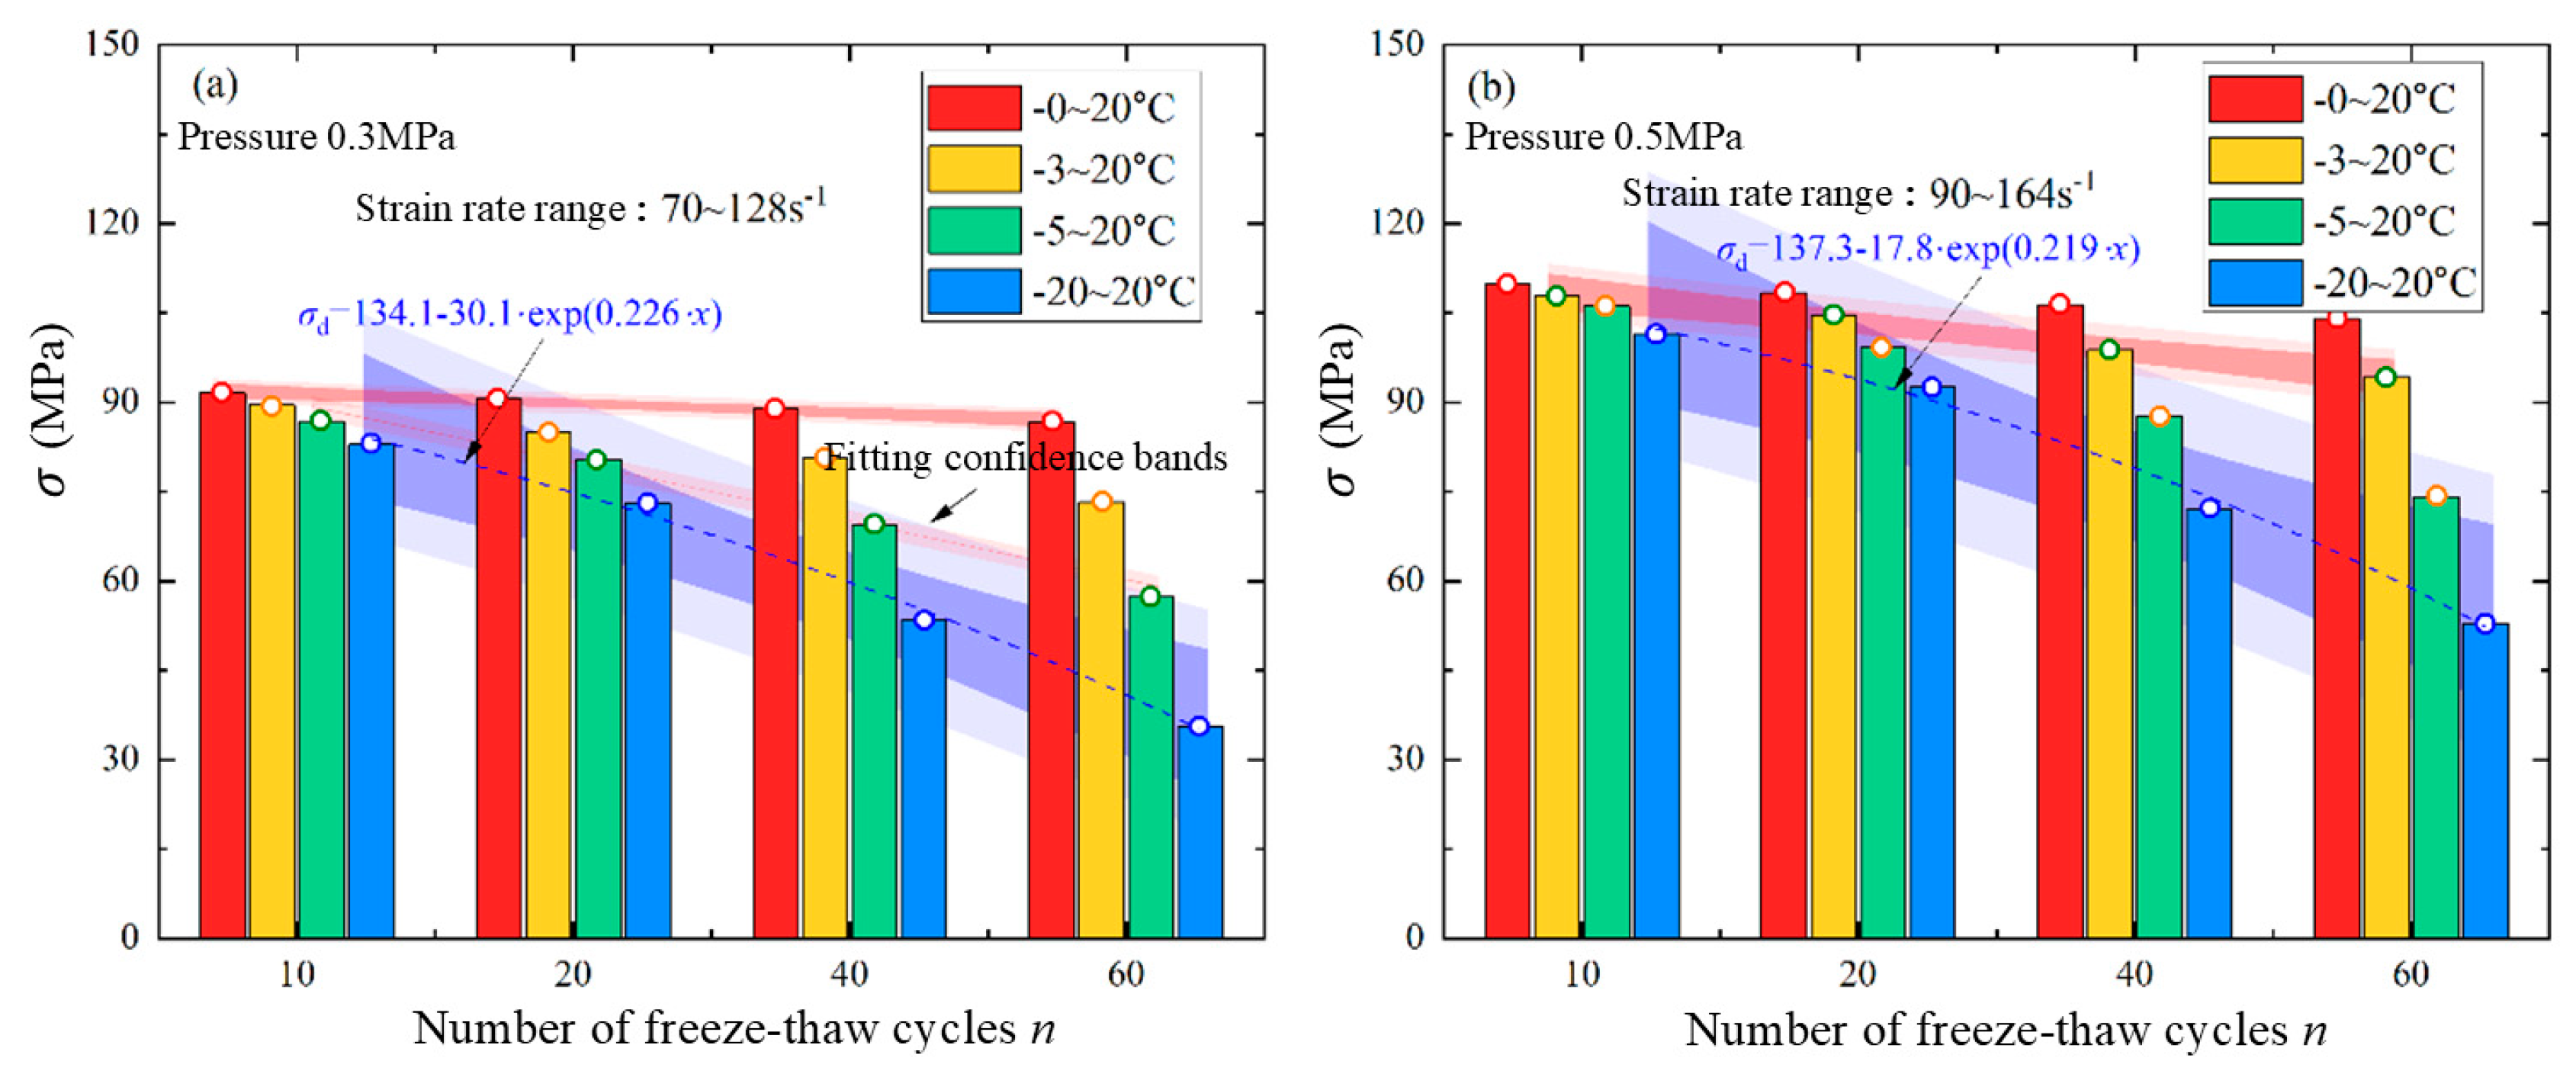
3.2. Evolution Characteristics of Dynamic Peak Strength
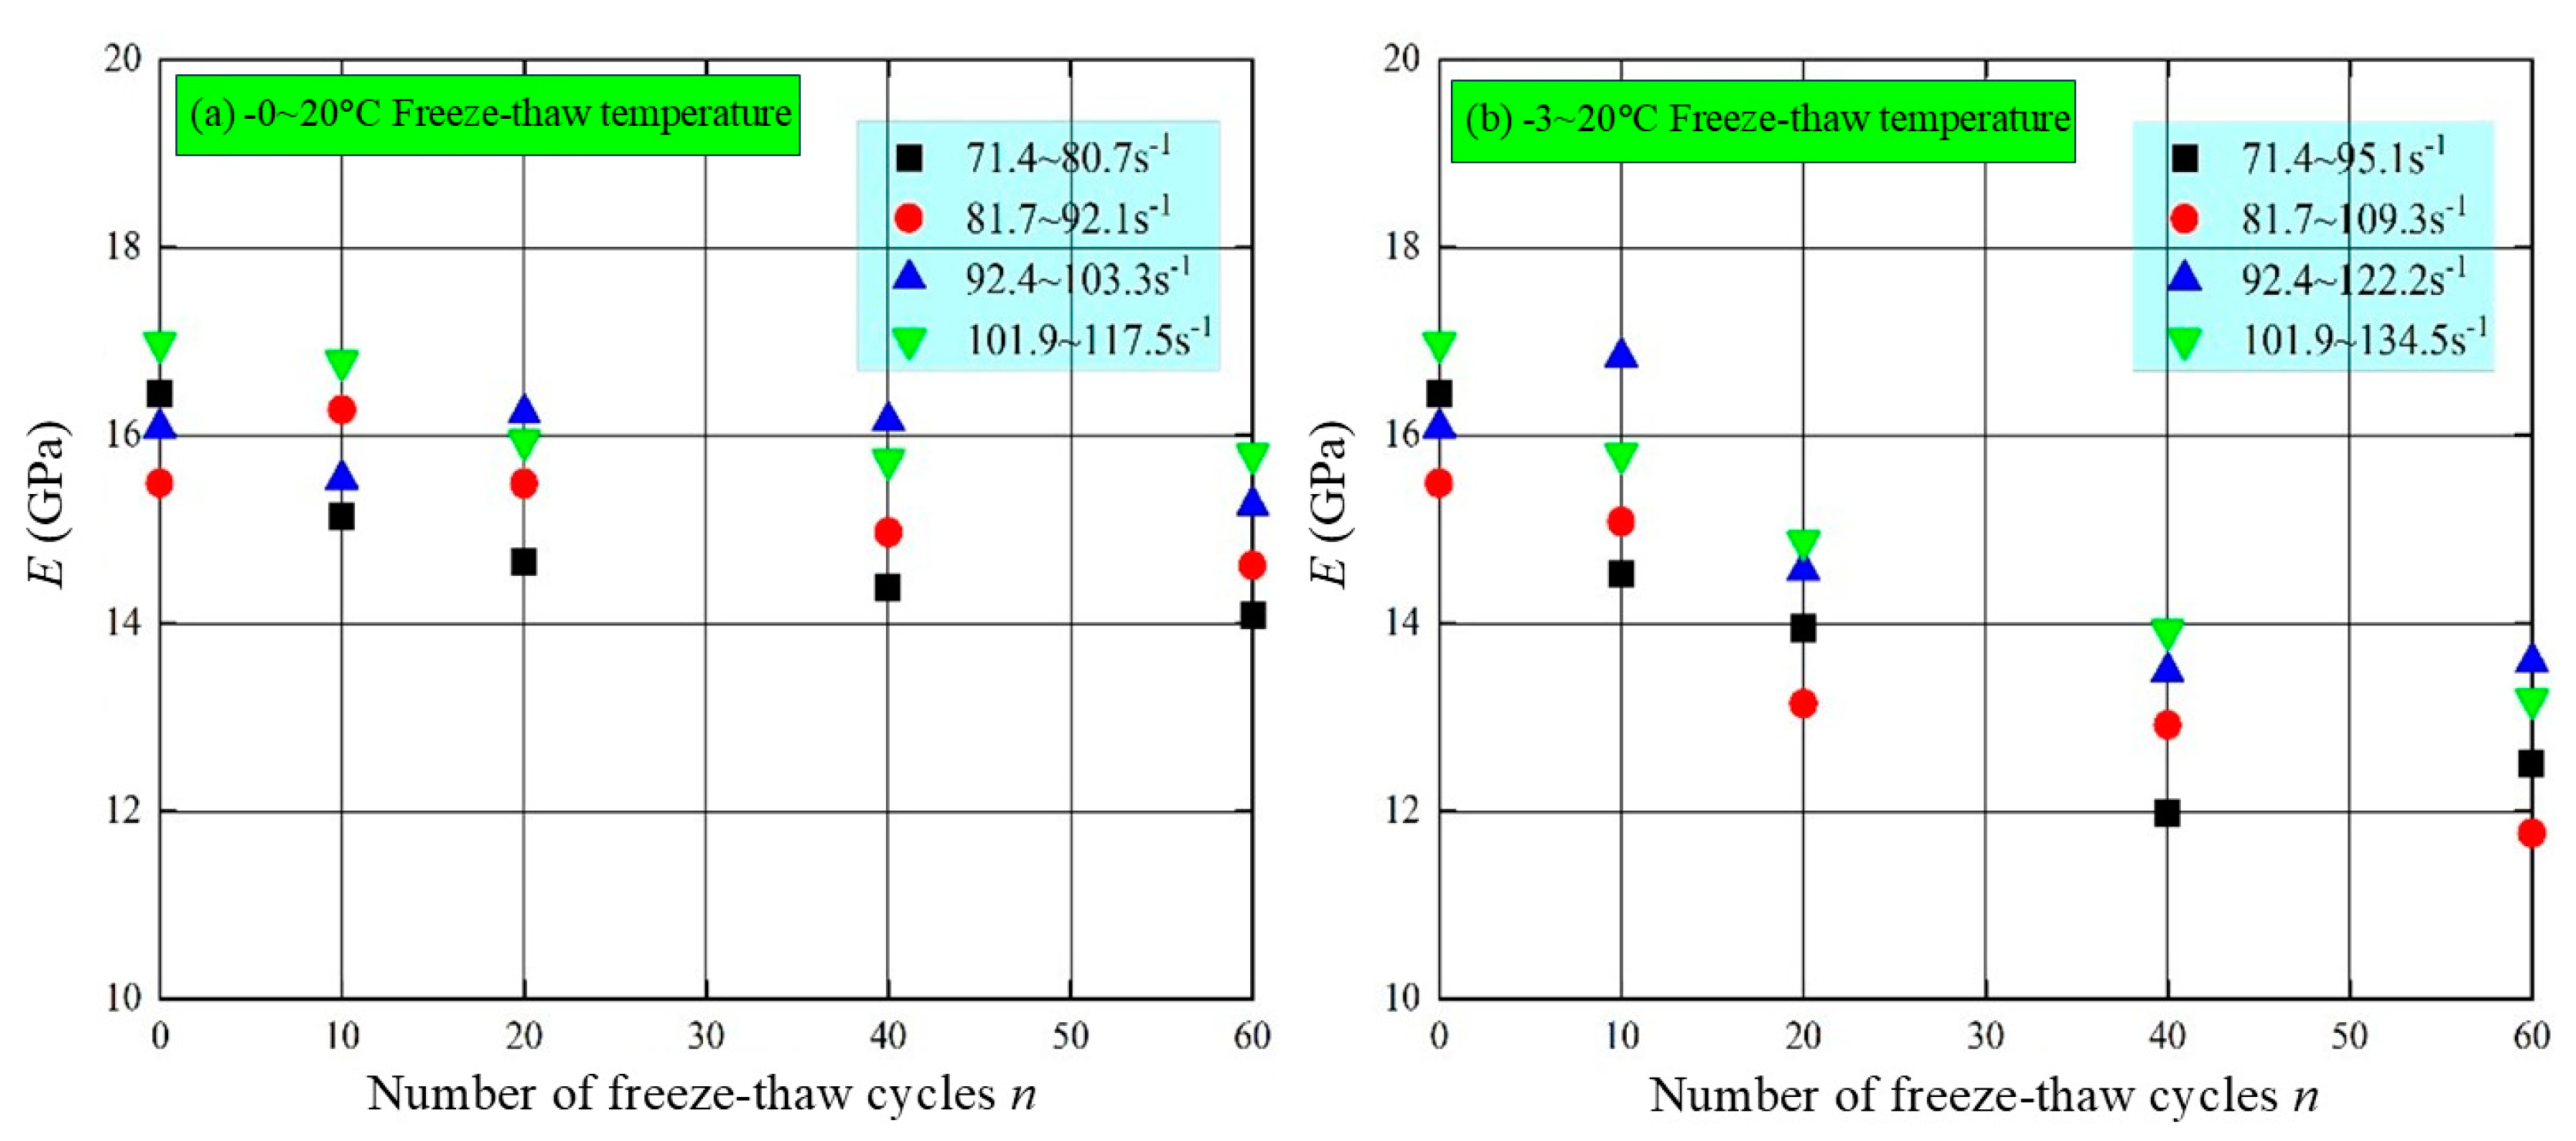
3.3. Evolution Characteristics of Dynamic Deformation Modulus
4. Dynamic Damage Features of Frozen–Thawed Sandstone
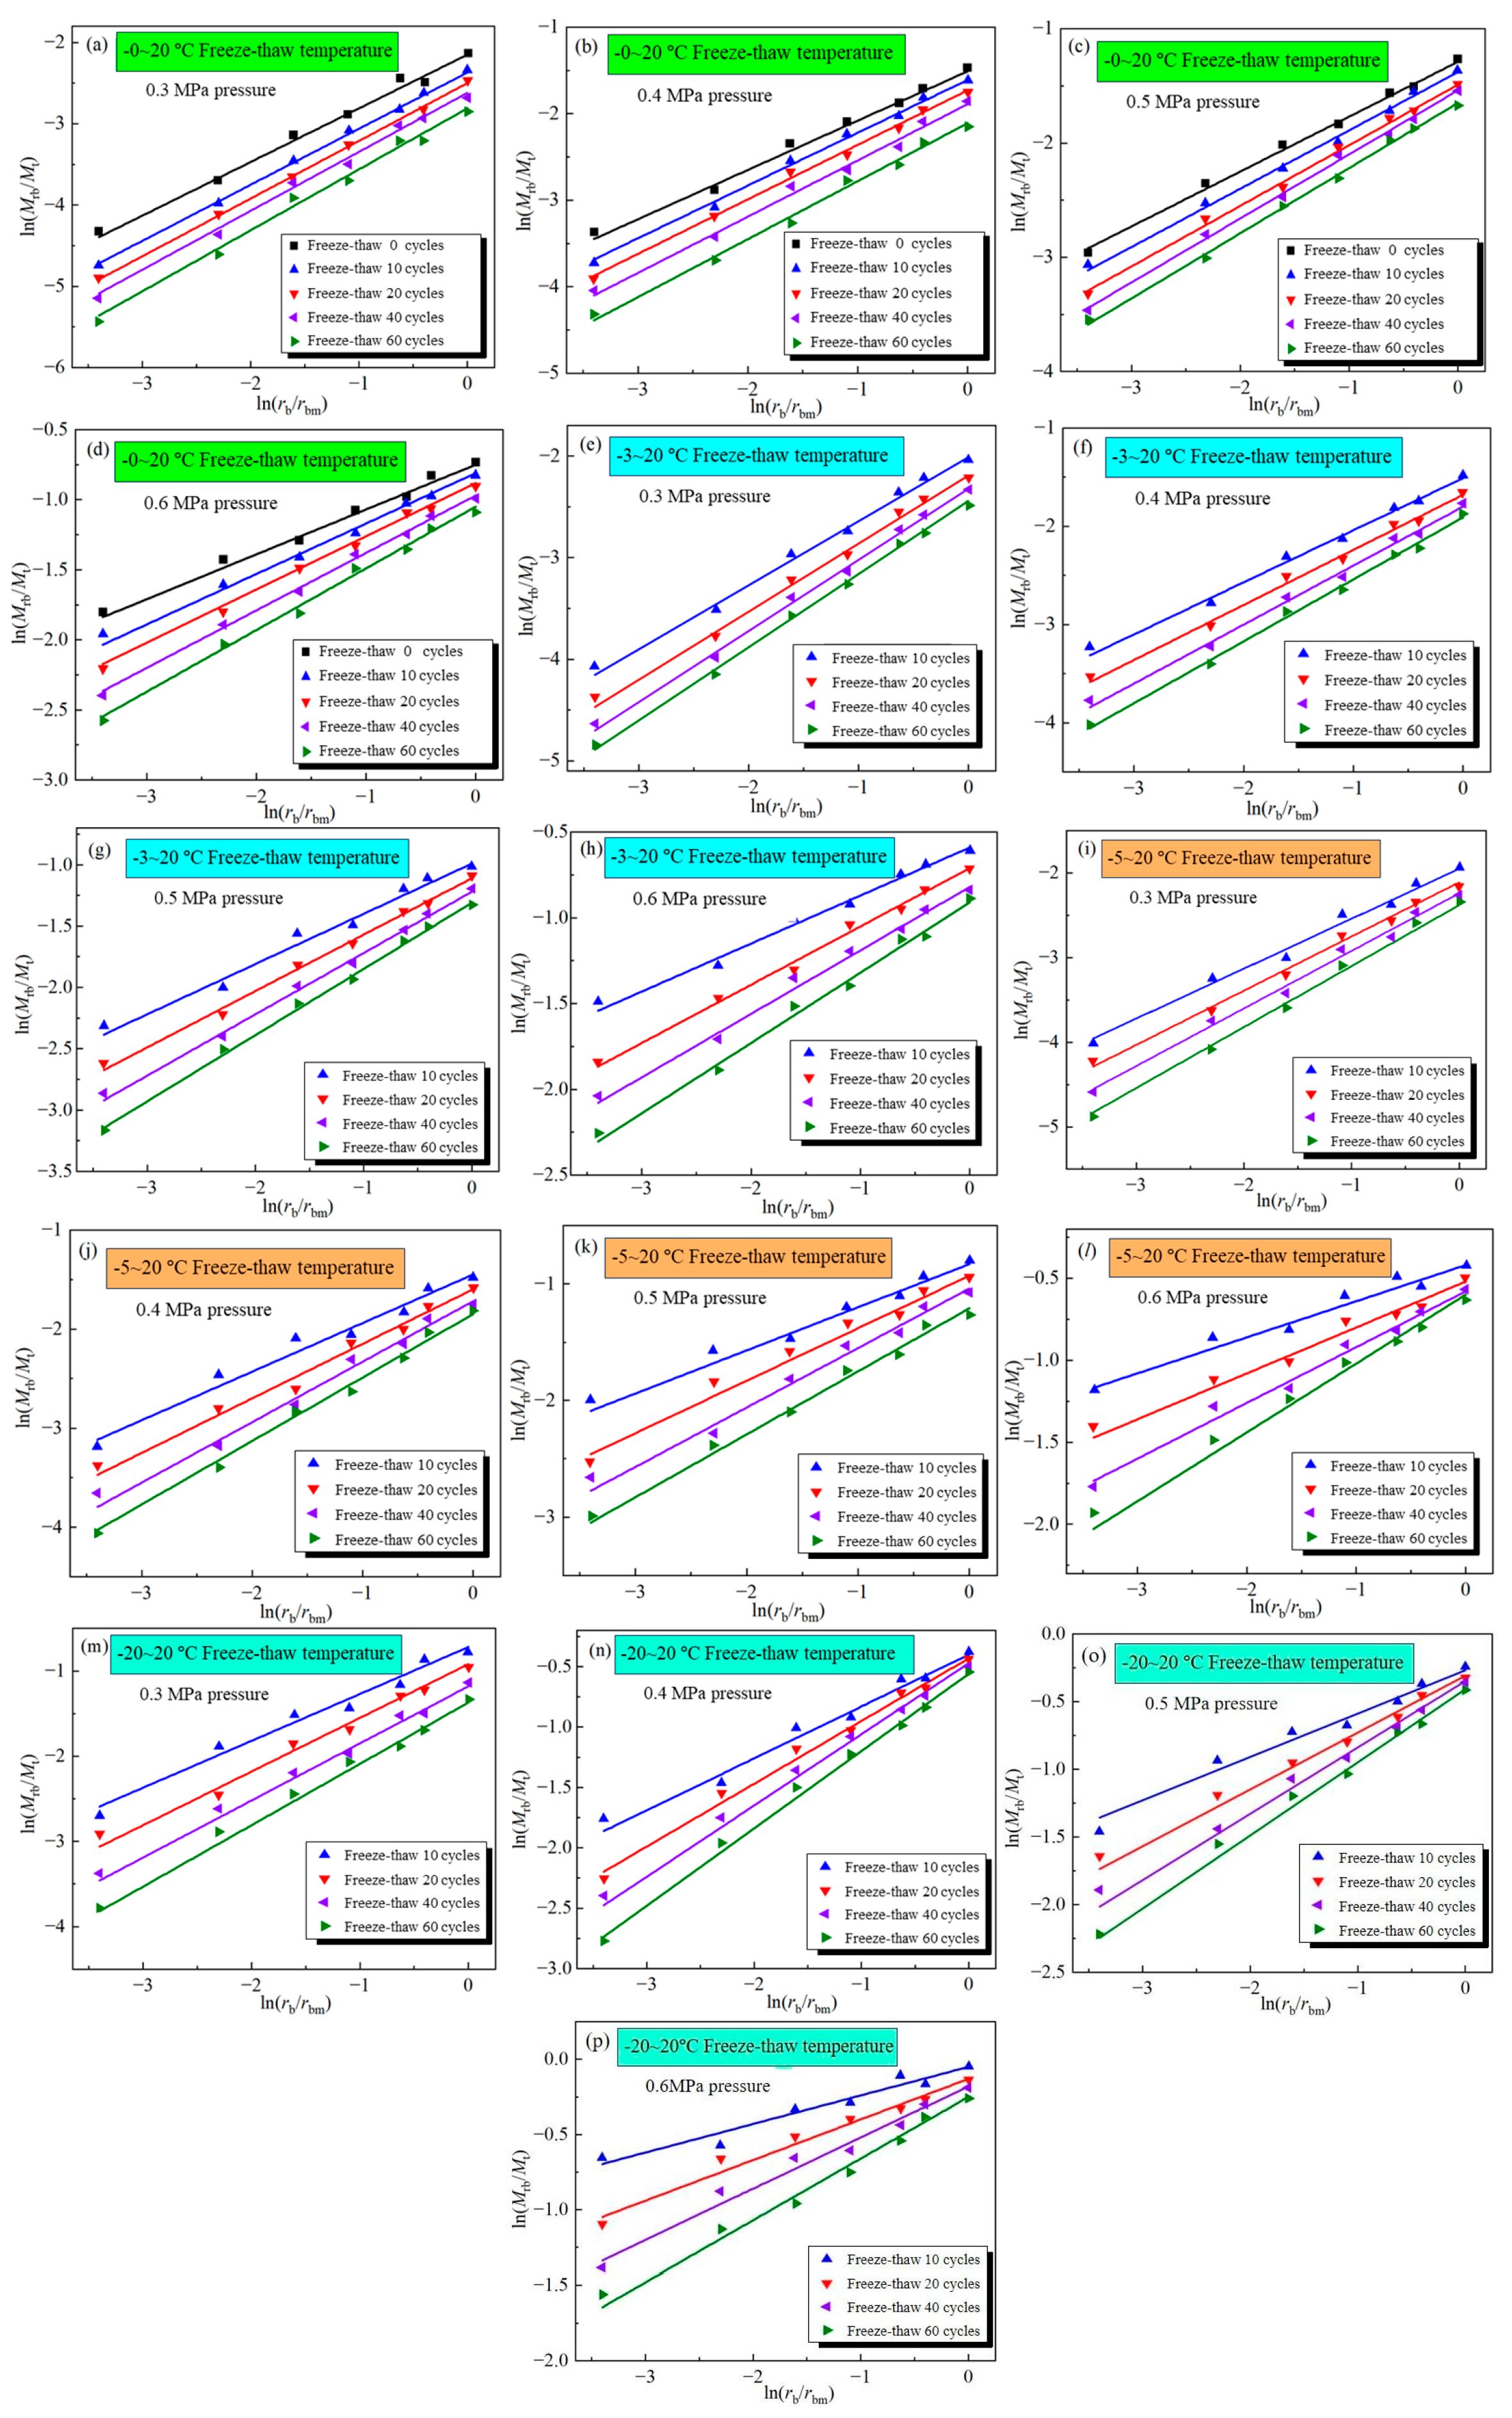
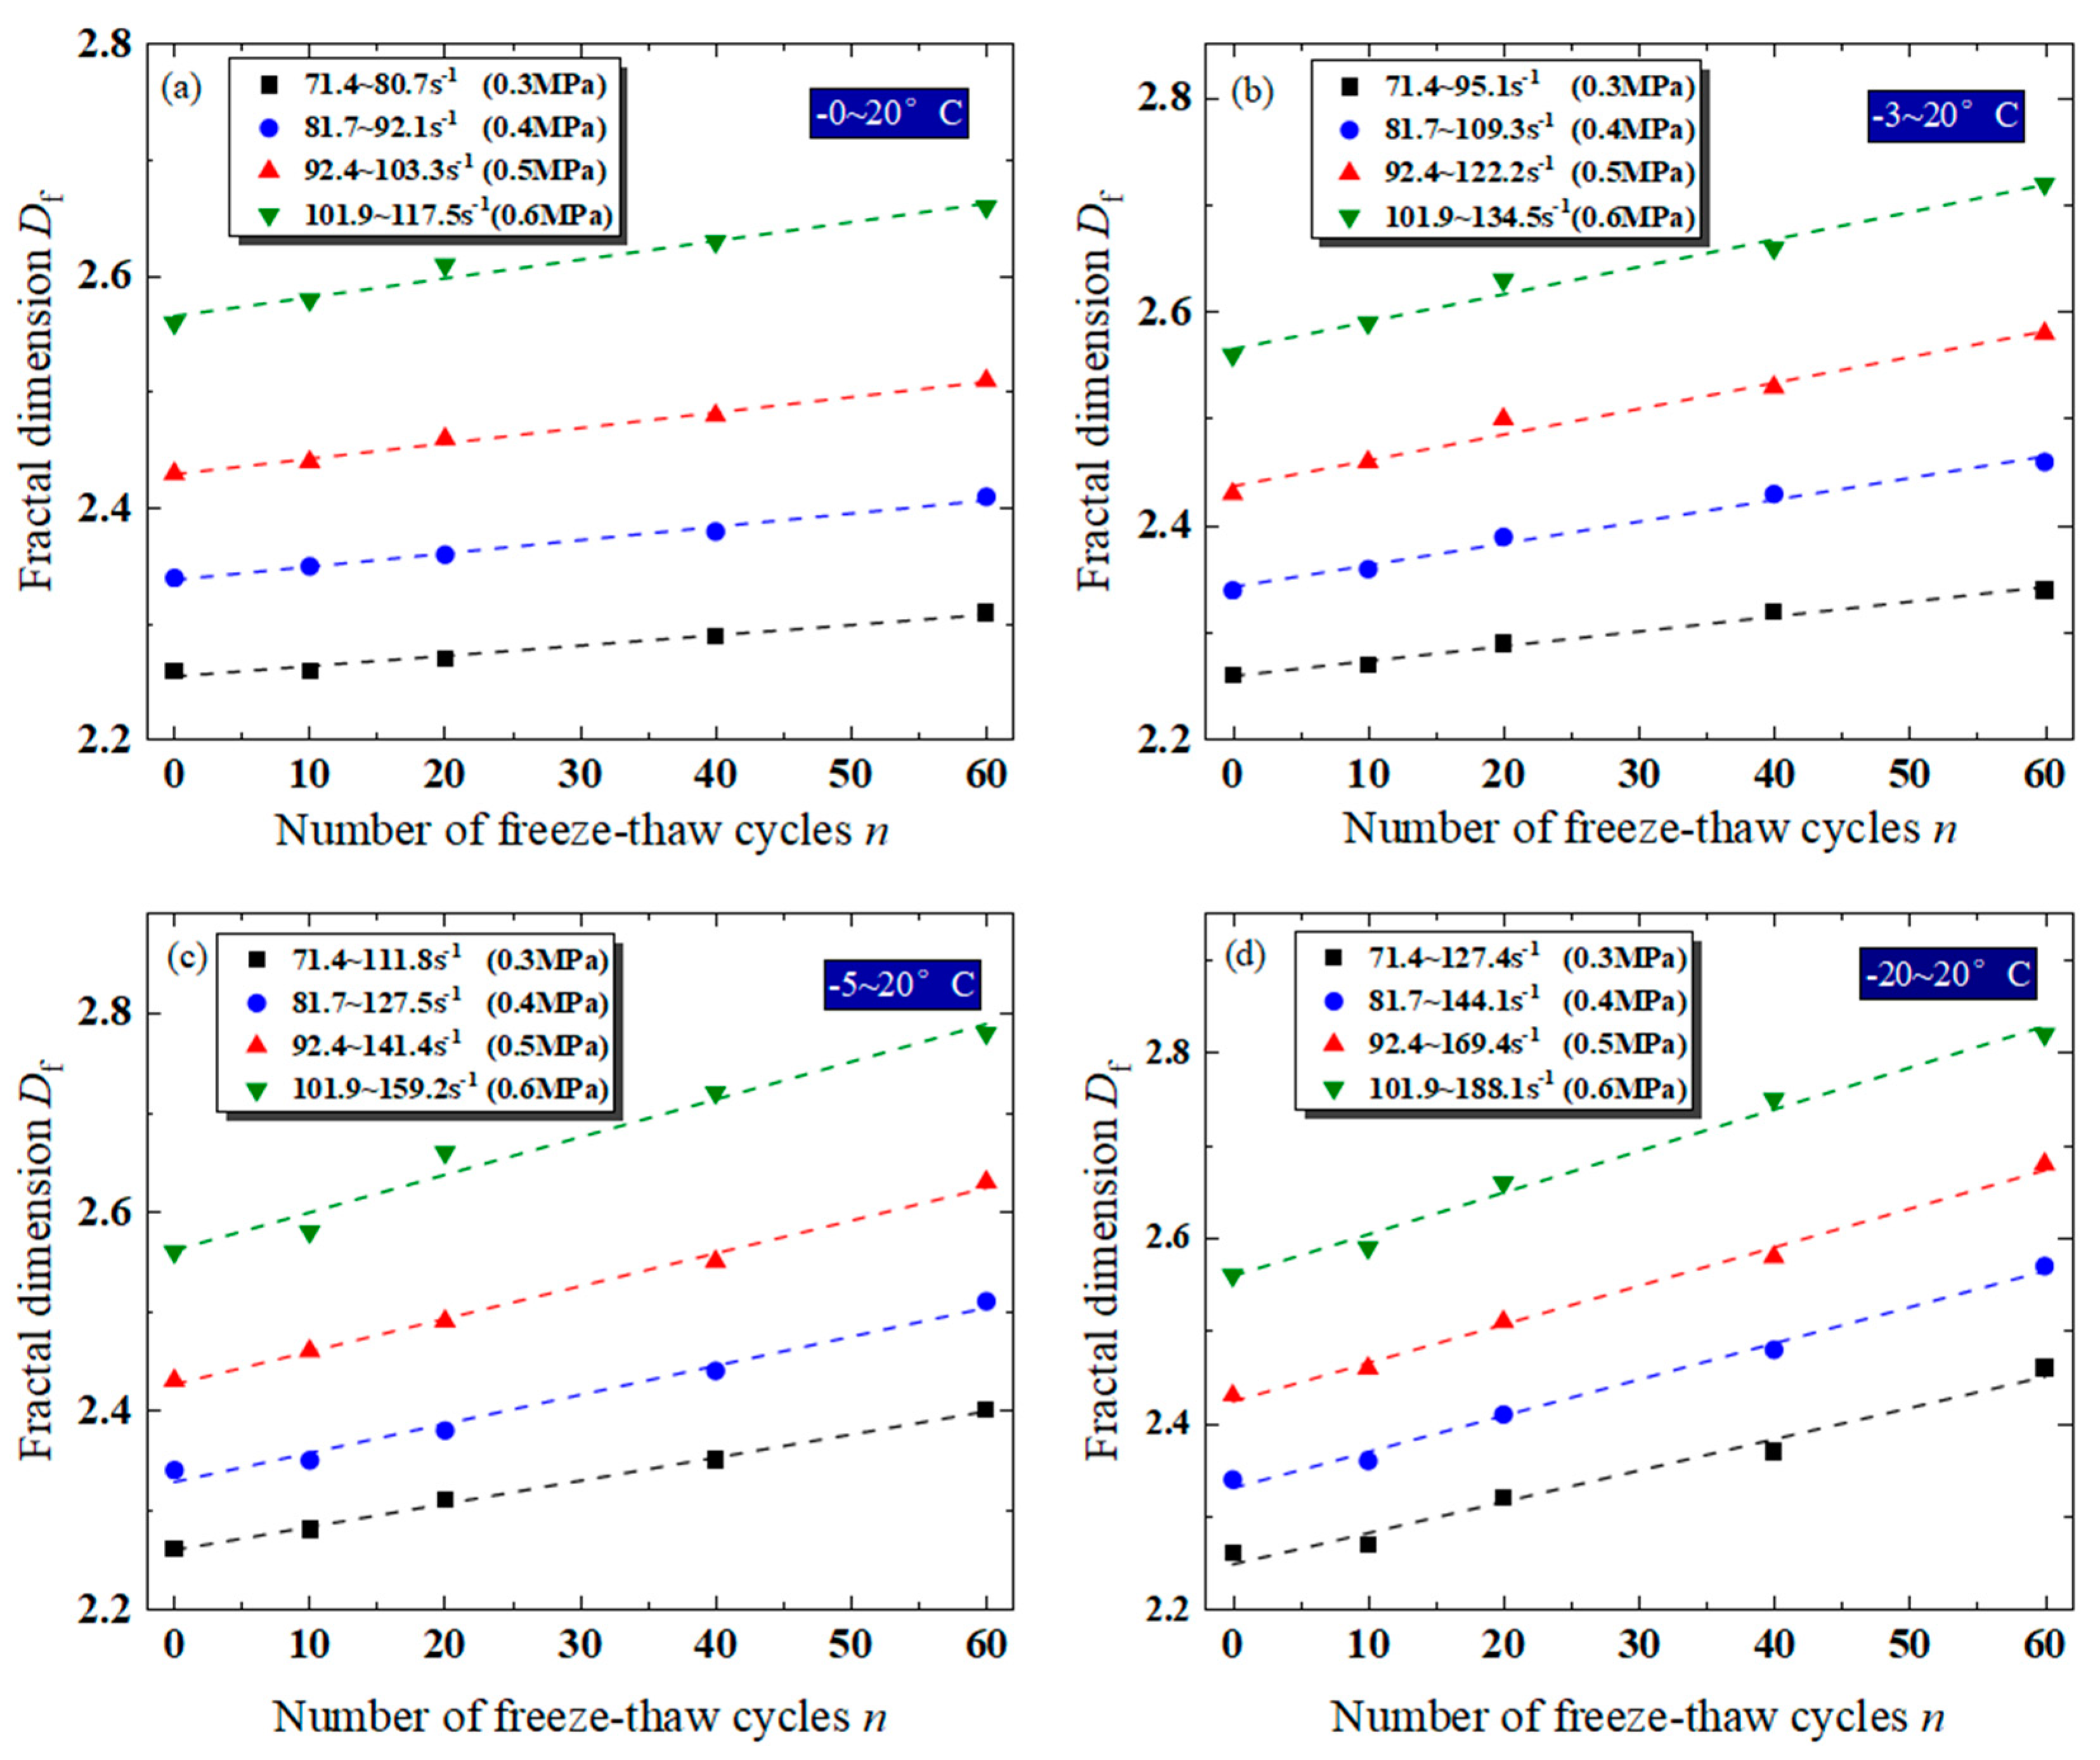
4.1. Dynamic Crushing Characteristics of Frozen–Thawed Sandstone
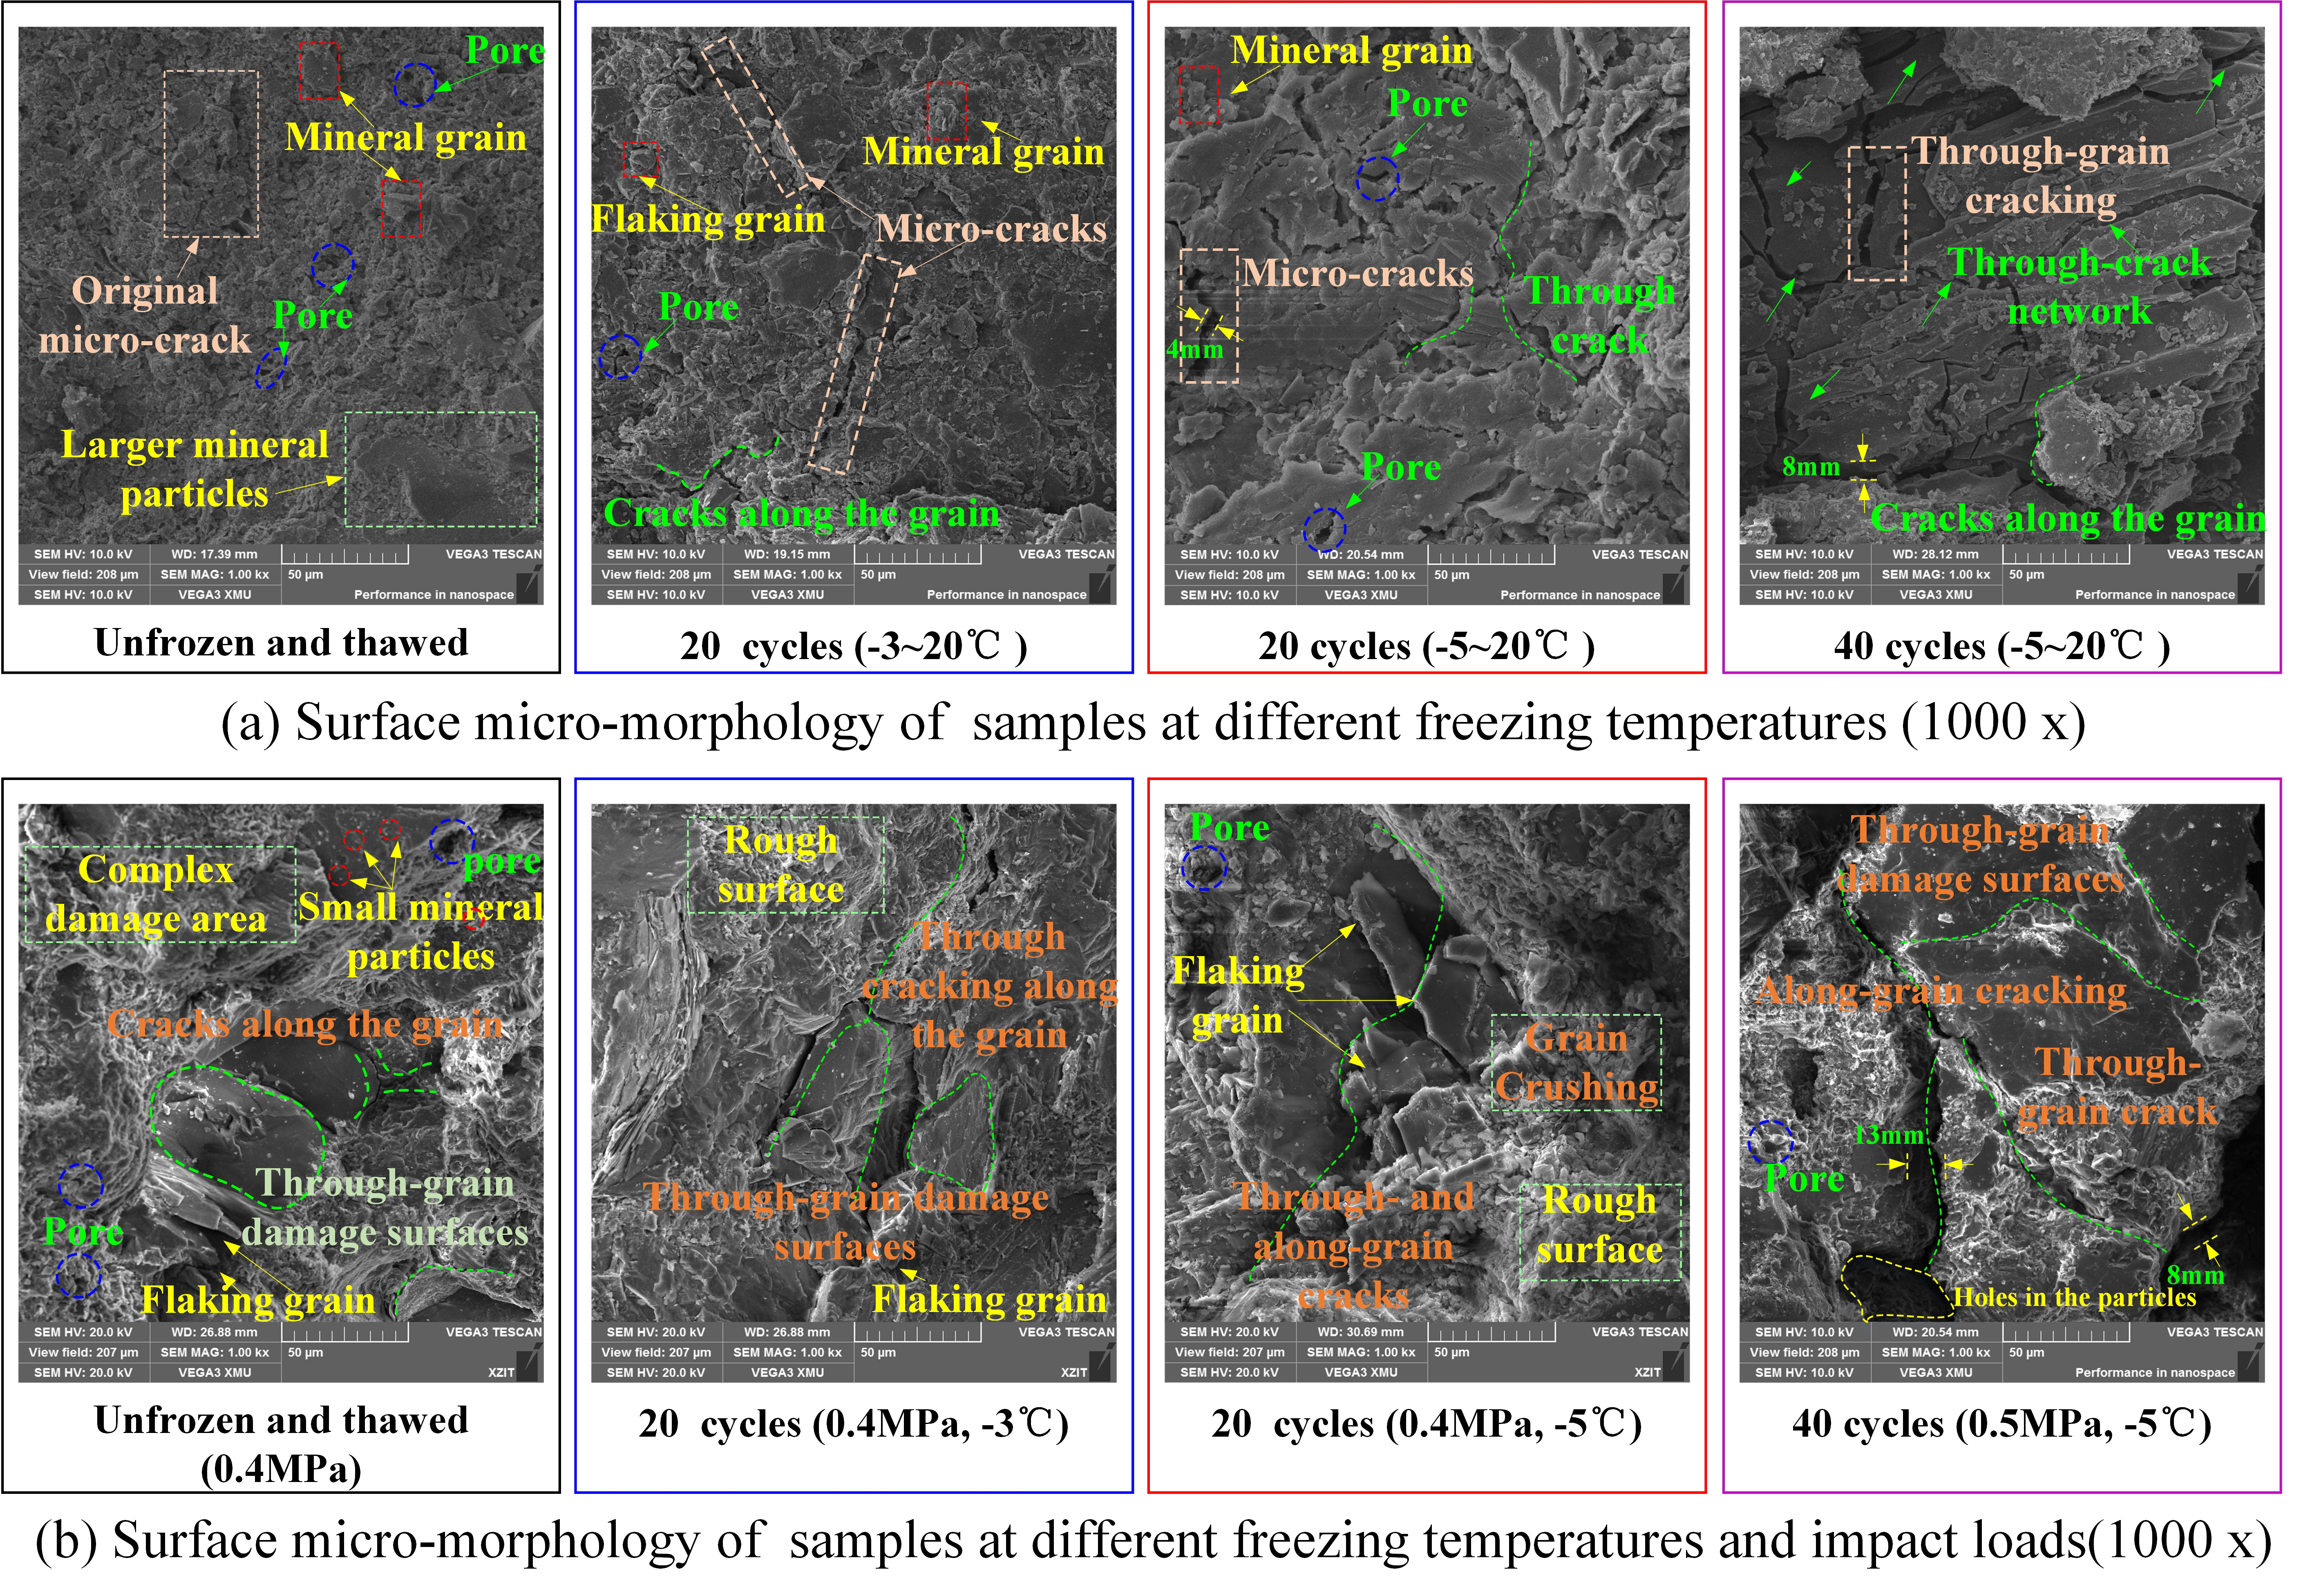
4.2. Microstructure Failure Characteristics
5. Conclusions
- (1)
- As the freezing temperature decreases, the stress–strain curve transitions from three stages to four, characterized by the emergence of an initial compaction stage, a reduction in peak stress, and an increase in the yield stage. The dynamic strength of freeze–thaw sandstone shows a logarithmic relationship with strain rate across different impact gas pressures.
- (2)
- The dynamic deformation modulus of frozen–thawed sandstone exhibits a decreasing trend as the freezing temperature decreases. Additionally, there is no significant relationship between the loading strain rate and the dynamic deformation modulus. The average dynamic deformation modulus across the four air pressures decreases with an increase in freeze–thaw cycles and shifts from a linear decrease to an exponential decrease as the freezing temperature declines.
- (3)
- Macroscopically, the fractal dimension of sandstone fragmentation increases with higher loading strain rates and a greater number of freeze–thaw cycles; the rate of increase in the fractal dimension is faster at lower freezing temperatures.
- (4)
- Microscopically, as the freezing temperature decreases, the influence of freeze–thaw action transitions from pore cracks to cementitious materials, ultimately degrading the strength of mineral particles. This degradation, in turn, affects the macroscopic dynamic failure characteristics.
Author Contributions
Funding
Data Availability Statement
Conflicts of Interest
References
- Gülen, M.; Aslan Fidan, A.; Köşeli, A.S.; Kiliç, H. Effect of Freeze-Thaw on CBR in Soils with Different Gradation and Mineralogy. Turk. J. Civ. Eng. 2024, 35, 27–47. [Google Scholar] [CrossRef]
- Momeni, A.; Abdilor, Y.; Khanlari, G.R.; Heidari, M.; Sepahi, A.A. The effect of freeze-thaw cycles on physical and mechanical properties of granitoid hard rocks. Bull. Eng. Geol. Environ. 2016, 75, 1649–1656. [Google Scholar] [CrossRef]
- Lv, Z.T.; Xia, C.C.; Wang, Y.S.; Lin, Z.L. Frost heave and freezing processes of saturated rock with an open crack under different freezing conditions. Front. Struct. Civ. Eng. 2020, 14, 947–960. [Google Scholar] [CrossRef]
- Park, J.; Hyun, C.U.; Park, H.D. Changes in microstructure and physical properties of rocks caused by artificial freeze-thaw action. Bull. Eng. Geol. Environ. 2015, 74, 555–565. [Google Scholar] [CrossRef]
- Ruedrich, J.; Siegesmund, S. Salt and ice crystallisation in porous sandstones. Environ. Geol. 2007, 52, 343–367. [Google Scholar] [CrossRef]
- Jia, H.L.; Ding, S.; Wang, Y.; Zi, F.; Sun, Q.; Yang, G.S. An NMR-based investigation of pore water freezing process in sandstone. Cold Reg. Sci. Technol. 2019, 168, 102893. [Google Scholar] [CrossRef]
- Tang, L.Y.; Du, Y.; Liu, L.; Jin, L.; Yang, L.J.; Li, G.Y. Effect mechanism of unfrozen water on the frozen soil-structure interface during the freezing-thawing process. Geomech. Eng. 2020, 22, 245–254. [Google Scholar] [CrossRef]
- Ghobadi, M.H.; Babazadeh, R. Experimental Studies on the Effects of Cyclic Freezing-Thawing, Salt Crystallization, and Thermal Shock on the Physical and Mechanical Characteristics of Selected Sandstones. Rock Mech. Rock Eng. 2015, 48, 1001–1016. [Google Scholar] [CrossRef]
- Wang, T.; Sun, Q.; Jia, H.L.; Ren, J.T.; Luo, T. Linking the mechanical properties of frozen sandstone to phase composition of pore water measured by LF-NMR at subzero temperatures. Bull. Eng. Geol. Environ. 2021, 80, 4501–4513. [Google Scholar] [CrossRef]
- Wang, T.; Sun, Q.; Jia, H.L.; Shen, Y.J.; Li, G.Y. Fracture Mechanical Properties of Frozen Sandstone at Different Initial Saturation Degrees. Rock Mech. Rock Eng. 2022, 55, 3235–3252. [Google Scholar] [CrossRef]
- Al-Omari, A.; Beck, K.; Brunetaud, X.; Török, A.; Al-Mukhtar, M. Critical degree of saturation: A control factor of freeze-thaw damage of porous limestones at Castle of Chambord, France. Eng. Geol. 2015, 185, 71–80. [Google Scholar] [CrossRef]
- Liu, Y.Z.; Cai, Y.T.; Huang, S.B.; Guo, Y.L.; Liu, G.F. Effect of water saturation on uniaxial compressive strength and damage degree of clay-bearing sandstone under freeze-thaw. Bull. Eng. Geol. Environ. 2020, 79, 2021–2036. [Google Scholar] [CrossRef]
- Yamabe, T.; Neaupane, K.M. Determination of some thermo-mechanical properties of Sirahama sandstone under subzero temperature condition. Int. J. Rock Mech. Min. Sci. 2001, 38, 1029–1034. [Google Scholar] [CrossRef]
- Chen, T.C.; Yeung, M.R.; Mori, N. Effect of water saturation on deterioration of welded tuff due to freeze-thaw action. Cold Reg. Sci. Technol. 2004, 38, 127–136. [Google Scholar] [CrossRef]
- Chen, L.; Tyler Ley, M.; Ghantous, R.M.; Jason Weiss, W.; Materer, N.F. Measuring damaging Freeze-Thaw cycles in the field. Constr. Build. Mater. 2023, 387, 131660. [Google Scholar] [CrossRef]
- Lv, Z.; Wu, M.; Wang, Z.; Zeng, X. Thermal-mechanical modelling on cumulative freeze-thaw deformation of porous rock in elastoplastic state based on Drucker-Prager criterion considering dilatancy. Int. J. Rock Mech. Min. Sci. 2024, 180, 105815. [Google Scholar] [CrossRef]
- Xiao, Y.; Deng, H.; Tian, G.; Yu, S. Analysis of Microscopic Pore Characteristics and Macroscopic Energy Evolution of Rock Materials under Freeze-Thaw Cycle Conditions. Mathematics 2023, 11, 710. [Google Scholar] [CrossRef]
- Weng, L.; Wu, Z.J.; Liu, Q.S. Dynamic Mechanical Properties of Dry and Water-Saturated Siltstones Under Sub-Zero Temperatures. Rock Mech. Rock Eng. 2020, 53, 4381–4401. [Google Scholar] [CrossRef]
- Çelik, M.Y.; Güven, Ö. Evaluation of the Durability of Untreated and Water-Repellent-Treated Cultural Heritage Stone (Döğer Tuff-Turkey) through Capillary Water Absorption and Freeze-Thaw Tests. Geoheritage 2024, 16, 115. [Google Scholar] [CrossRef]
- Akin, M.; Özsan, A. Evaluation of the long-term durability of yellow travertine using accelerated weathering tests. Bull. Eng. Geol. Environ. 2011, 70, 101–114. [Google Scholar] [CrossRef]
- Kovalskiy, E.R.; Kongar-Syuryun, C.B.; Sirenko, Y.G.; Mironov, N.A. Modeling of rheological deformation processes for room and pillar mining at the Verkhnekamsk potash salt deposit. Sustain. Dev. Mt. Territ. 2024, 16, 1017–1030. [Google Scholar] [CrossRef]
- Ma, Q.Y.; Ma, D.D.; Yao, Z.M. Influence of freeze-thaw cycles on dynamic compressive strength and energy distribution of soft rock specimen. Cold Reg. Sci. Technol. 2018, 153, 10–17. [Google Scholar] [CrossRef]
- Xu, J.C.; Pu, H.; Sha, Z.H. Influence of Microstructure on Dynamic Mechanical Behavior and Damage Evolution of Frozen-Thawed Sandstone Using Computed Tomography. Materials 2023, 16, 119. [Google Scholar] [CrossRef] [PubMed]
- Li, J.L.; Kaunda, R.B.; Zhou, K.P. Experimental investigations on the effects of ambient freeze-thaw cycling on dynamic properties and rock pore structure deterioration of sandstone. Cold Reg. Sci. Technol. 2018, 154, 133–141. [Google Scholar] [CrossRef]
- Liu, C.J.; Deng, H.W.; Zhao, H.T.; Zhang, J. Effects of freeze-thaw treatment on the dynamic tensile strength of granite using the Brazilian test. Cold Reg. Sci. Technol. 2018, 155, 327–332. [Google Scholar] [CrossRef]
- Zhang, J.; Deng, H.W.; Taheri, A.; Ke, B.; Liu, C.J. Deterioration and strain energy development of sandstones under quasi-static and dynamic loading after freeze-thaw cycles. Cold Reg. Sci. Technol. 2019, 160, 252–264. [Google Scholar] [CrossRef]
- Zhao, T.; Yang, G.S.; Wang, L.; Jia, H.L.; Qiao, Y.Z. Dynamic Splitting Behavior and the Constitutive Relationship of Frozen Sandstone Containing a Single Fissure. Shock Vib. 2021, 2021, 6661037. [Google Scholar] [CrossRef]
- Zhou, Z.L.; E, Y.D.; Cai, X.; Zhang, J. Coupled Effects of Water and Low Temperature on Quasistatic and Dynamic Mechanical Behavior of Sandstone. Geofluids 2021, 2021, 9926063. [Google Scholar] [CrossRef]
- Viglianti, A.; Guida, G.; Casini, F. Freezing-thawing response of sand-kaolin mixtures in oedometric conditions. E3S Web Conf. 2024, 544, 15002. [Google Scholar] [CrossRef]
- Naqvi, M.W.; Sadiq, M.F.; Cetin, B.; Uduebor, M.; Daniels, J. Effect of Salt Concentrations on the Freeze–Thaw Behavior of Soils. In Proceedings of the Cold Regions Engineering 2024: Sustainable and Resilient Engineering Solutions for Changing Cold Regions—Proceedings of the 20th International Conference on Cold Regions Engineering, Anchorage, AK, USA, 13–16 May 2024; pp. 239–250. [Google Scholar]
- Kongar-Syuryun, C.B.; Kovalski, E.R. Hardening backfill at potash mines: Promising materials regulating stress-strain behavior of rock mass. Geol. I Geofiz. Yuga Ross. Geol. Geophys. Russ. South 2023, 13, 177–187. [Google Scholar] [CrossRef]
- Ma, L.; Ghorbani, Y.; Kongar-Syuryun, C.B.; Khayrutdinov, M.M.; Klyuev, R.V.; Petenko, A.; Brigida, V. Dynamics of backfill compressive strength obtained from enrichment tails for the circular waste management. Resour. Conserv. Recycl. Adv. 2024, 23, 200–224. [Google Scholar] [CrossRef]
- Mohr, D.; Gary, G.; Lundberg, B. Evaluation of stress-strain curve estimates in dynamic experiments. Int. J. Impact Eng. 2010, 37, 161–169. [Google Scholar] [CrossRef]
- Miao, Y.G. On loading ceramic-like materials using split Hopkinson pressure bar. Acta Mech. 2018, 229, 3437–3452. [Google Scholar] [CrossRef]
- Cheng, Y.; Song, Z.; Jin, J.; Wang, T.; Yang, T. Waveform characterization and energy dissipation of stress wave in sandstone based on modified shpb tests. Geomech. Eng. 2020, 22, 187–196. [Google Scholar] [CrossRef]
- Oparin, V.N.; Usol’Tseva, O.M.; Semenov, V.N.; Tsoi, P.A. Evolution of stress-strain state in structured rock specimens under uniaxial loading. J. Min. Sci. 2013, 49, 677–690. [Google Scholar] [CrossRef]
- Yang, S.; Deng, J.; Li, H.; Chen, F.; Wang, F.; Li, X. A Nonlinear Viscoelastic Model for Wave Propagation in Porous Sandstones Under Uniaxial Loads. Rock Mech. Rock Eng. 2023, 56, 7639–7653. [Google Scholar] [CrossRef]
- Sarici, D.E.; Ozdemir, E. Determining point load strength loss from porosity, Schmidt hardness, and weight of some sedimentary rocks under freeze-thaw conditions. Environ. Earth Sci. 2018, 77, 62. [Google Scholar] [CrossRef]
- Ke, B.; Zhou, K.; Deng, H.; Bin, F. NMR Pore Structure and Dynamic Characteristics of Sandstone Caused by Ambient Freeze-Thaw Action. Shock Vib. 2017, 2017, 9728630. [Google Scholar] [CrossRef]
- Fan, L.; Xu, C.; Wu, Z. Effects of cyclic freezing and thawing on the mechanical behavior of dried and saturated sandstone. Bull. Eng. Geol. Environ. 2020, 79, 755–765. [Google Scholar] [CrossRef]
- Mei, S.H.; Liang, X.L.; Wen, L.; Kou, Z.L. Experimental Study on Mechanical Properties of Freeze-Thaw Damaged Red Sandstone under Combined Dynamic and Static Loading. Shock Vib. 2021, 2021, 9980549. [Google Scholar] [CrossRef]
- Luo, Y.; Qu, D.; Wang, G.; Li, X.; Zhang, G. Degradation model of the dynamic mechanical properties and damage failure law of sandstone under freeze-thaw action. Soil Dyn. Earthq. Eng. 2020, 132, 106094. [Google Scholar] [CrossRef]
- Ke, B.; Zhang, J.; Deng, H.; Yang, X. Dynamic characteristics of sandstone under coupled static-dynamic loads after freeze-thaw cycles. Appl. Sci. 2020, 10, 3351. [Google Scholar] [CrossRef]
- Li, B.; Zhu, Z.; Zhang, F.; Chunyu, Z.; Li, T. Impact mechanical properties of frozen soil after experiencing freeze–thaw cycles: Experimental and numerical study. Cold Reg. Sci. Technol. 2023, 213, 103914. [Google Scholar] [CrossRef]
- Boroojerdi, M.T.; Bailey, E.; Taylor, R. Experimental investigation of rate dependency of freeze bond strength. Cold Reg. Sci. Technol. 2020, 178, 103120. [Google Scholar] [CrossRef]
- Ling, X.; Tian, S.; Tang, L.; Li, S. A damage-softening and dilatancy prediction model of coarse-grained materials considering freeze–thaw effects. Transp. Geotech. 2020, 22, 100307. [Google Scholar] [CrossRef]
- Zhang, H.; Meng, X.; Yang, G. A study on mechanical properties and damage model of rock subjected to freeze-thaw cycles and confining pressure. Cold Reg. Sci. Technol. 2020, 174, 103056. [Google Scholar] [CrossRef]
- Zhang, H.; Yang, G.; Liang, Y. Experimental study on damage deterioration and tensile characteristics of rock under freeze-thaw environment. Adv. Mater. Res. 2012, 518–523, 1749–1752. [Google Scholar] [CrossRef]
- Hao, X.; Ma, W.; Feng, W.; Wen, Z.; Zhang, L.; Chen, S. Investigation on the frost heave-induced pressure and hydro-thermal processes in freezing soil under rigid constraint and hydraulic pressure. Eng. Geol. 2023, 323, 107238. [Google Scholar] [CrossRef]
- Sun, Z.; Scherer, G.W. Effect of air voids on the dilatation of mortar during freezing. In Proceedings of the Poromechanics IV—4th Biot Conference on Poromechanics, New York, NY, USA, 8–10 June 2009; pp. 896–901. [Google Scholar]
- Sha, Z.H.; Pu, H.; Xu, J.C.; Ni, H.Y.; Guo, S.R. Effects of Accumulated Damage on the Dynamic Properties of Coal Measures Sandstone. Minerals 2022, 12, 810. [Google Scholar] [CrossRef]
- Cui, L.; Qin, N.; Wang, S.; Feng, X. Experimental Study on the Mechanical Properties of Sandstone under the Action of Chemical Erosion and Freeze-Thaw Cycles. Adv. Civ. Eng. 2021, 2021, 8884079. [Google Scholar] [CrossRef]
- Song, Y.; Zhang, L.; Yang, H.; Ren, J.; Che, Y. Experimental study on the creep behavior of red sandstone under low temperatures. Adv. Civ. Eng. 2019, 2019, 2328065. [Google Scholar] [CrossRef]
- Xing, H.Z.; Zhang, Q.B.; Ruan, D.; Dehkhoda, S.; Lu, G.X.; Zhao, J. Full-field measurement and fracture characterisations of rocks under dynamic loads using high-speed three-dimensional digital image correlation. Int. J. Impact Eng. 2018, 113, 61–72. [Google Scholar] [CrossRef]
- Yu, Y.; Jiang, Q.; Liu, Q.; Feng, G.; Zeng, J.; Lu, Y. Experimental study on dynamic failure behavior of red sandstone after freeze-thaw cycles. Constr. Build. Mater. 2024, 451, 138582. [Google Scholar] [CrossRef]
- Yu, J.; Chen, X.; Li, H.; Zhou, J.W.; Cai, Y.Y. Effect of freeze-thaw cycles on mechanical properties and permeability of red sandstone under triaxial compression. J. Mt. Sci. 2015, 12, 218–231. [Google Scholar] [CrossRef]
- Liu, C.; Wang, D.; Wang, Z.; Ke, B.; Li, P.; Yu, S. Dynamic splitting tensile test of granite under freeze-thaw weathering. Soil Dyn. Earthq. Eng. 2021, 140, 106411. [Google Scholar] [CrossRef]
- Jiang, H. The relationship between mechanical properties and gradual deterioration of microstructures of rock mass subject to freeze-thaw cycles. Earth Sci. Res. J. 2018, 22, 53–57. [Google Scholar] [CrossRef]
- Lian, S.; Wan, W.; Zhao, Y.; Peng, W.; Du, C.; Hu, H. Study on the damage mechanism and evolution model of preloaded sandstone subjected to freezing-thawing action based on the NMR technology. Rev. Adv. Mater. Sci. 2024, 63, 20240034. [Google Scholar] [CrossRef]
- Wang, F.; Wang, H.; Xu, Y.; Cheng, B.; Wang, Q. Analysis of Energy Dissipation Characteristics of Damaged Sandstone under Impact Load. Shock Vib. 2021, 2021, 4200452. [Google Scholar] [CrossRef]
- He, B.; Xie, M.; Jiang, Z.; Zhang, C.; Zhu, X. Temperature field distribution and microstructure of cement-based materials under cryogenic freeze-thaw cycles. Constr. Build. Mater. 2020, 243, 118256. [Google Scholar] [CrossRef]
- Şahin, Y.; Akkaya, Y.; Taşdemir, M.A. Effects of freezing conditions on the frost resistance and microstructure of concrete. Constr. Build. Mater. 2021, 270, 121458. [Google Scholar] [CrossRef]
- Husain, A.; Nanda, M.N.; Chowdary, M.S.; Sajid, M. Fractals: An Eclectic Survey, Part II. Fractal Fract. 2022, 6, 379. [Google Scholar] [CrossRef]
- Saadatmand Hashemi, A.; Katsabanis, P. The Effect of Stress Wave Interaction and Delay Timing on Blast-Induced Rock Damage and Fragmentation. Rock Mech. Rock Eng. 2020, 53, 2327–2346. [Google Scholar] [CrossRef]
- Florio, B.J.; Fawell, P.D.; Small, M. The use of the perimeter-area method to calculate the fractal dimension of aggregates. Powder Technol. 2019, 343, 551–559. [Google Scholar] [CrossRef]
- Xia, Y.; Cai, J.; Wei, W.; Hu, X.; Wang, X.; Ge, X. A new method for calculating fractal dimensions of porous media based on pore size distribution. Fractals 2018, 26, 1850006. [Google Scholar] [CrossRef]
- Bogdanova, M.; Stanchev, O.; Veltchev, T.V. Study of the fractal dimensions in the molecular cloud rosette by use of dendrogram analysis. In Proceedings of the XII Serbian-Bulgarian Astronomical Conference, SB 2020, Sokobanja, Serbia, 25–29 September 2020; pp. 61–68. [Google Scholar]
- Zhai, J.; Zhang, Z.; Melnikov, A.; Zhang, M.; Yang, L.; Jin, D. Experimental study on the effect of freeze—Thaw cycles on the mineral particle fragmentation and aggregation with different soil types. Minerals 2021, 11, 913. [Google Scholar] [CrossRef]
- Zhang, Z.; Ma, W.; Feng, W.; Xiao, D.; Hou, X. Reconstruction of Soil Particle Composition During Freeze-Thaw Cycling: A Review. Pedosphere 2016, 26, 167–179. [Google Scholar] [CrossRef]


| Parameter | Longitudinal Wave Speed (km/s) | Dry Mass (g/cm3) | Porosity (%) | Saturated Density (g/cm3) | Natural Moisture Content (%) | Saturated Water Content (%) |
|---|---|---|---|---|---|---|
| Value | 2.61 | 2.15 | 17.84 | 2.33 | 4.28 | 8.67 |
| Freeze–Thaw Temperature | Mean Value of Dynamic Deformation Modulus of Samples (GPa) | |||
|---|---|---|---|---|
| 71.4~127.4 s−1 | 81.7~144.1 s−1 | 92.4~164.9 s−1 | 101.9~188.1 s−1 | |
| −0~20 °C | 14.64 | 15.58 | 15.27 | 16.25 |
| −3~20 °C | 13.87 | 13.68 | 14.91 | 14.87 |
| −5~20 °C | 13.09 | 12.96 | 13.83 | 14.19 |
| −20~20 °C | 10.73 | 11.15 | 11.86 | 12.09 |
| Freeze–Thaw Temperature | 77.8~115.6 s−1 | 89.6~128.2 s−1 | 99.5~142.4 s−1 | 112.1~160.1 s−1 |
|---|---|---|---|---|
| non-frozen–thawed | 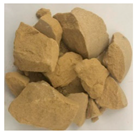 | 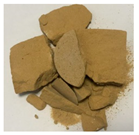 |  | 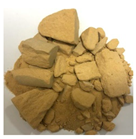 |
| −0~20 °C 40 cycles | 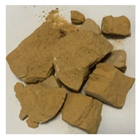 | 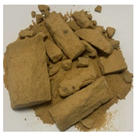 | 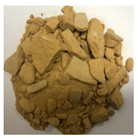 | 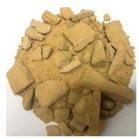 |
| −3~20 °C 40 cycles | 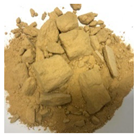 | 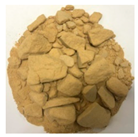 | 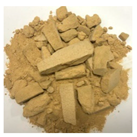 |  |
| −5~20 °C 40 cycles | 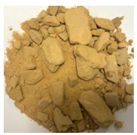 | 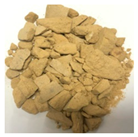 | 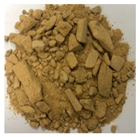 |  |
| −20~20 °C 40 cycles | 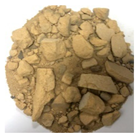 | 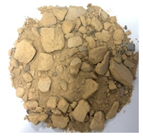 | 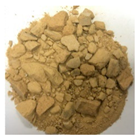 |  |
Disclaimer/Publisher’s Note: The statements, opinions and data contained in all publications are solely those of the individual author(s) and contributor(s) and not of MDPI and/or the editor(s). MDPI and/or the editor(s) disclaim responsibility for any injury to people or property resulting from any ideas, methods, instructions or products referred to in the content. |
© 2025 by the authors. Licensee MDPI, Basel, Switzerland. This article is an open access article distributed under the terms and conditions of the Creative Commons Attribution (CC BY) license (https://creativecommons.org/licenses/by/4.0/).
Share and Cite
Liu, D.; Pu, H.; Xue, K.; Xu, J.; Ni, H. Mechanical Response and Damage Characteristics of Frozen–Thawed Sandstone Across Various Temperature Ranges Under Impact Loads. Fractal Fract. 2025, 9, 128. https://doi.org/10.3390/fractalfract9020128
Liu D, Pu H, Xue K, Xu J, Ni H. Mechanical Response and Damage Characteristics of Frozen–Thawed Sandstone Across Various Temperature Ranges Under Impact Loads. Fractal and Fractional. 2025; 9(2):128. https://doi.org/10.3390/fractalfract9020128
Chicago/Turabian StyleLiu, Dejun, Hai Pu, Kangsheng Xue, Junce Xu, and Hongyang Ni. 2025. "Mechanical Response and Damage Characteristics of Frozen–Thawed Sandstone Across Various Temperature Ranges Under Impact Loads" Fractal and Fractional 9, no. 2: 128. https://doi.org/10.3390/fractalfract9020128
APA StyleLiu, D., Pu, H., Xue, K., Xu, J., & Ni, H. (2025). Mechanical Response and Damage Characteristics of Frozen–Thawed Sandstone Across Various Temperature Ranges Under Impact Loads. Fractal and Fractional, 9(2), 128. https://doi.org/10.3390/fractalfract9020128