Article

Permeability Prediction Model of Fractal Rough Fractures Under Coupled Shear and Normal Stress

1
State Key Laboratory of Mountain Bridge and Tunnel Engineering, Chongqing Jiaotong University, Chongqing 400074, China
2
School of Urban Construction Engineering, Chongqing Technology and Business Institute, Chongqing 400052, China
3
State Key Laboratory of Coal Mine Disaster Dynamics and Control, Chongqing University, Chongqing 400044, China
*
Author to whom correspondence should be addressed.
Fractal Fract. 2025, 9(11), 739; https://doi.org/10.3390/fractalfract9110739 (registering DOI)
Submission received: 5 September 2025 / Revised: 19 October 2025 / Accepted: 7 November 2025 / Published: 15 November 2025
(This article belongs to the Special Issue Applications of Fractal Dimensions in Rock Mechanics and Geomechanics)

Abstract

The hydro-mechanical coupling in fractures plays a significant role in fluid transport through fracture networks. However, current studies still exhibit certain limitations in the multi-parameter characterization of fracture permeability under stress conditions. To address this, a hydro-mechanical coupling model was developed to investigate the coupled hydro-mechanical behavior of fractures under different stress states and shear displacements. The results show that fluid flow patterns within fractures exhibit notable heterogeneity and anisotropy, influenced by aperture distribution and the connectivity of preferential flow paths. High normal stress significantly reduces the mechanical aperture while enhancing its anisotropy, as the normal stress increased from 2 MPa to 8 MPa, the average mechanical aperture of the fractures decreased by 61% to 65%. With increasing shear displacement, both the mechanical aperture and its standard deviation increase, and the aperture distribution shifts from a sharply peaked pattern to a more flattened one, the maximum aperture increased by 23–38%, reflecting enhanced variability in fracture structure. Increased surface roughness amplifies the effect of shear displacement on the evolution of fracture architecture. Under low normal stress conditions, the mechanical aperture increases gradually with higher roughness, the mechanical aperture decreased more significantly in high-roughness (JRC = 17.94) fractures (28–31% greater reduction) compared to low-roughness ones (JRC = 2.01). To assess fracture permeability, a predictive model was developed and validated against further data, confirming its effectiveness in evaluating permeability. This study highlights the mechanisms by which shear displacement and normal stress influence fracture permeability.

1. Introduction

In contrast to intact or compact rock masses, the mechanical behavior and seepage characteristics of fractured rock masses are predominantly governed by the existence, distribution, and interconnectivity of fractures. These fractures are not randomly distributed, but often form intricate discrete fracture networks (DFNs), which serve as the primary pathways for fluid flow and stress transmission within the rock mass [1,2]. The complexity of these networks introduces significant heterogeneity and anisotropy into the hydraulic properties of the rock mass, making accurate prediction of flow behavior a considerable challenge [3]. At the fundamental level, individual fractures constitute the essential structural units of the DFN [4]. Therefore, gaining a comprehensive understanding of the hydraulic behavior of single-phase fluid flow within a single fracture is crucial as a foundational step. It not only provides critical insights into the basic transport mechanisms but also forms the basis for upscaling to network-scale flow models [5]. Specifically, the geometry, surface roughness, aperture distribution, and mechanical deformation characteristics of a single fracture exert direct influence on its permeability and flow regime [6,7,8]. Consequently, investigating fluid flow through a single fracture under coupled hydraulic-mechanical (HM) conditions can significantly improve our ability to characterize and predict the hydraulic behavior of fractured rock masses in various geological and engineering contexts, such as groundwater movement, oil and gas extraction, geothermal energy development, and geological disposal of nuclear waste.
In recent years, the exploration and development of deep underground space have attracted growing interest across the fields of geoengineering and geosciences [9,10,11,12]. This heightened attention reflects the increasing demand for underground resources and the complexity of subsurface environments encountered in large-scale engineering applications. Key research themes encompass rock mass instability, excavation-induced disturbances, deep resource recovery, subsurface waste isolation and disposal, and fluid-driven geological hazards [13,14]. These issues are intricately associated with the safety, durability, and environmental compatibility of underground engineering systems, posing challenges not only to structural stability but also to sustainable resource utilization and ecological preservation [15]. Among the various influencing factors, fluid flow through fractured rock masses plays a pivotal role, as it can initiate a range of coupled physical and chemical processes, such as softening, mineral dissolution, crack propagation, and structural weakening, which may eventually lead to serious geohazards including landslides, rock bursts, collapses, and surface subsidence [16,17,18]. The fractured geological media commonly encountered in deep strata are composed of interlocking mineral matrices with pervasive natural fractures [19]. These fractures generate voids and highly irregular contact surfaces, resulting in pronounced heterogeneity and anisotropy in both mechanical and hydraulic behavior [20]. Unlike intact or compact rocks, the strength and permeability of fractured rock masses are largely dictated by the presence, orientation, aperture, and connectivity of fractures. When these fractures interlink, they constitute discrete fracture networks (DFNs), which dominate the overall hydraulic conductivity and mechanical response of the rock mass [21]. Understanding the behavior of these systems begins at the scale of the individual fracture, which serves as the basic structural and functional unit of the DFN. Detailed investigations into single-phase fluid flow within individual fractures are therefore essential to elucidate the fundamental mechanisms of subsurface transport phenomena, including groundwater migration, thermal conduction, solute dispersion, and contaminant migration [22]. Moreover, characterizing fluid flow in single fractures under coupled hydro-mechanical or hydro-chemical conditions contributes to the development of accurate numerical models and risk evaluation frameworks for subsurface engineering [23]. Reservoir recovery efficiency is also dictated by fluid properties, including modifications via nanofluids and temperature shifts, the complex interplay of these influencing factors under varying reservoir conditions results in dramatically different production performances [24]. Such insights are crucial for guiding the design, monitoring, and safety assessment of underground structures in high-stress, fluid-active environments—especially in the context of energy extraction, geological storage, and urban underground infrastructure [25]. Consequently, research on single-fracture flow not only holds theoretical significance in fracture mechanics and porous media hydrodynamics but also has practical value in enhancing the efficiency and reliability of deep underground space utilization.
Fluid flow and mass transport in rock fractures is governed by a complex interplay between fluid properties, hydraulic gradients, and the geometric as well as spatial characteristics of the fracture network [26,27]. Among these, the inherent irregularities in fracture morphology and the three-dimensional geometry of void spaces are particularly influential in determining the intrinsic permeability of fractured media [28]. These geometric complexities pose significant analytical challenges, especially under varying mechanical loading conditions, such as normal compression and shear displacement, which dynamically alter the aperture field and the internal structure of fracture voids [29]. To facilitate analytical treatment, the widely adopted smooth parallel plate model simplifies the fracture as two idealized, flat surfaces and applies the classical cubic law, wherein the volumetric flow rate is proportional to the cube of the fracture aperture [30,31]. Although this model offers a straightforward approach, it fails to reflect the irregular, heterogeneous nature of natural fractures formed through long-term geological processes. In situ fractures typically exhibit spatially variable aperture distributions due to tectonic stresses, mineral deposition, and mechanical damage, resulting in anisotropy and heterogeneity at multiple scales [32]. To more accurately characterize the flow-conducting geometry, researchers have introduced a range of morphological descriptors, including average aperture, tortuosity, surface roughness, joint matching index, and contact area [33]. Moreover, experimental and numerical investigations consistently demonstrate that increased tortuosity, enhanced surface roughness, and enlarged contact regions reduce hydraulic conductivity by elongating flow paths and increasing flow resistance [34]. Despite these advances, characterizing fracture permeability using a single geometric parameter often proves inadequate, as it overlooks the multifactorial nature of fracture flow, especially under coupled stress conditions [35]. Previous studies have frequently treated geometric parameters and mechanical loading as isolated variables, neglecting their interdependence in real subsurface environments. In particular, stress-induced changes in fracture morphology—such as asperity damage, dilation, or closure—can significantly modulate flow channels and permeability [36]. To overcome these limitations, it is essential to establish an integrated framework that simultaneously considers multiple geometric descriptors in conjunction with the prevailing stress conditions. Such a comprehensive approach would enable more realistic and accurate predictions of fracture-scale permeability evolution, forming a robust basis for modeling large-scale subsurface flow processes, including groundwater migration, contaminant transport, and energy extraction in fractured media.
Although substantial progress has been made through field observations and laboratory experiments in understanding and quantifying fluid flow behavior in natural rock fractures, obtaining reliable and sufficient raw data continues to be a major challenge [16,37]. This difficulty largely arises from the inherent complexity of fracture networks, low repeatability of tests, and limited ability to directly visualize localized flow pathways, particularly under realistic geological conditions [17,38]. To address these constraints, fractal theory has emerged as a valuable tool for replicating the irregular morphology of fracture surfaces [39]. By generating self-affine surface geometries characterized by specified joint roughness coefficients (JRC), fractal-based models offer a means to realistically simulate fracture walls with varying surface asperities and roughness levels [40]. These synthetic rough profiles can then serve as input for numerical simulations aimed at investigating the detailed hydromechanical responses of fractures with controlled geometrical complexity. In this study, we employ a MATLAB 2022b-based algorithm, built upon an improved successive random additions method [21,41], to generate fracture profiles with JRC values ranging from 2 to 18 at increments of 2. This systematic variation enables a comprehensive analysis of the influence of surface roughness on flow characteristics. To mimic realistic subsurface environments, these numerical fracture models are subjected to both normal stress and shear displacement, allowing the aperture field to evolve in an anisotropic and stress-dependent manner. Following mechanical loading, we analyze the changes in mechanical aperture distribution and assess their corresponding impact on fluid transport properties. This coupled hydro-mechanical approach provides valuable insights into how stress-induced deformation affects permeability. To quantitatively capture this relationship, we apply multiple regression analysis to derive empirical models that describe fracture permeability as a function of mechanical aperture metrics. These models are subsequently validated against laboratory experiments designed under controlled conditions, ensuring the credibility and predictive capability of the proposed formulations.

2. Rough Fracture Numerical Model Generation

2.1. Rock Fracture Model Construction

Fracture aperture variability plays a critical role in controlling fluid flow pathways and determining the hydraulic conductivity of fractured media. As such, accurately capturing the geometric features of fracture surfaces is essential for simulating realistic seepage behavior and improving predictive models of subsurface fluid transport. A growing number of research has indicted that natural fracture surfaces exhibit self-affine fractal characteristics, which can be effectively reproduced using mathematical constructs such as fractal Brownian motion (FBM). To replicate this fractal roughness, a variety of numerical techniques have been developed, including the successive random additions (SRA) method, the Weierstrass–Mandelbrot (W-M) fractal function, and approaches based on the Fourier transform. Among these, the modified SRA algorithm introduced by Liu et al. (2004) [42] has become one of the most widely used due to its computational efficiency, ease of implementation, and ability to produce realistic surface profiles [34]. In the two-dimensional SRA framework, a fracture surface is typically represented as a single-valued, continuous function describing asperity heights across a grid. These height values generally follow a Gaussian (normal) distribution with a mean of zero and a variance that scales with spatial frequency. The generated profiles conform to self-affine scaling laws, meaning that the statistical properties of the surface remain invariant under anisotropic scaling transformations. This behavior is described by fractal geometric equations, in which the roughness of the surface is characterized by parameters such as the Hurst exponent (H), fractal dimension (D), and root-mean-square (RMS) height deviation. These parameters enable quantification of the surface irregularity and provide a mathematical basis for linking surface morphology to flow behavior. The SRA-generated fracture profiles can be further adjusted to reflect different levels of joint roughness coefficient (JRC), allowing for the construction of a wide range of rough-walled geometries. These synthetic surfaces serve as the foundation for hydro-mechanical simulations, wherein the relationship between surface geometry, aperture distribution, and permeability can be systematically evaluated under various loading conditions:
δ x + γ Δ x , y + γ Δ y δ x , y = 0
σ 2 r = r 2 H σ 2 1
Here, denotes the mathematical expectation, δ is the convexity height of the fracture surface, γ is a constant, σ 2 represents the variance, and H is the Hurst exponent, which ranges between 0 and 1 and is related to the fractal dimension Df by H = 3 − Df. A series of synthetic rough fracture surfaces were generated using a MATLAB program developed by the authors based on the improved successive random additions (SRA) algorithm. As illustrated in Figure 1, nine representative fracture surfaces (labeled S1 to S9) were produced, each with a size of 256 mm × 256 mm and a resolution of 1024 × 1024, yielding an element size of 0.25 mm. Analysis of asperity height distributions reveals that surface roughness increases as the Hurst exponent decreases. In other words, a higher H value results in smoother surfaces with greater spatial correlation, while lower H values yield more irregular and rough topographies.
The Joint Roughness Coefficient (JRC), initially introduced by Barton (1977) [43], serves as a quantitative indicator for evaluating the surface roughness of rock joints. It captures the irregularity and waviness of joint profiles. An empirical formula proposed by Tse (1979) [44] is commonly employed to estimate JRC values based on measurable surface characteristics:
J R C = 32.2 + 32.47 log 10 ( Z 2 )
Z 2 = 1 N t i = 1 i = N t δ i + 1 δ i x i + 1 x i 2 1 / 2
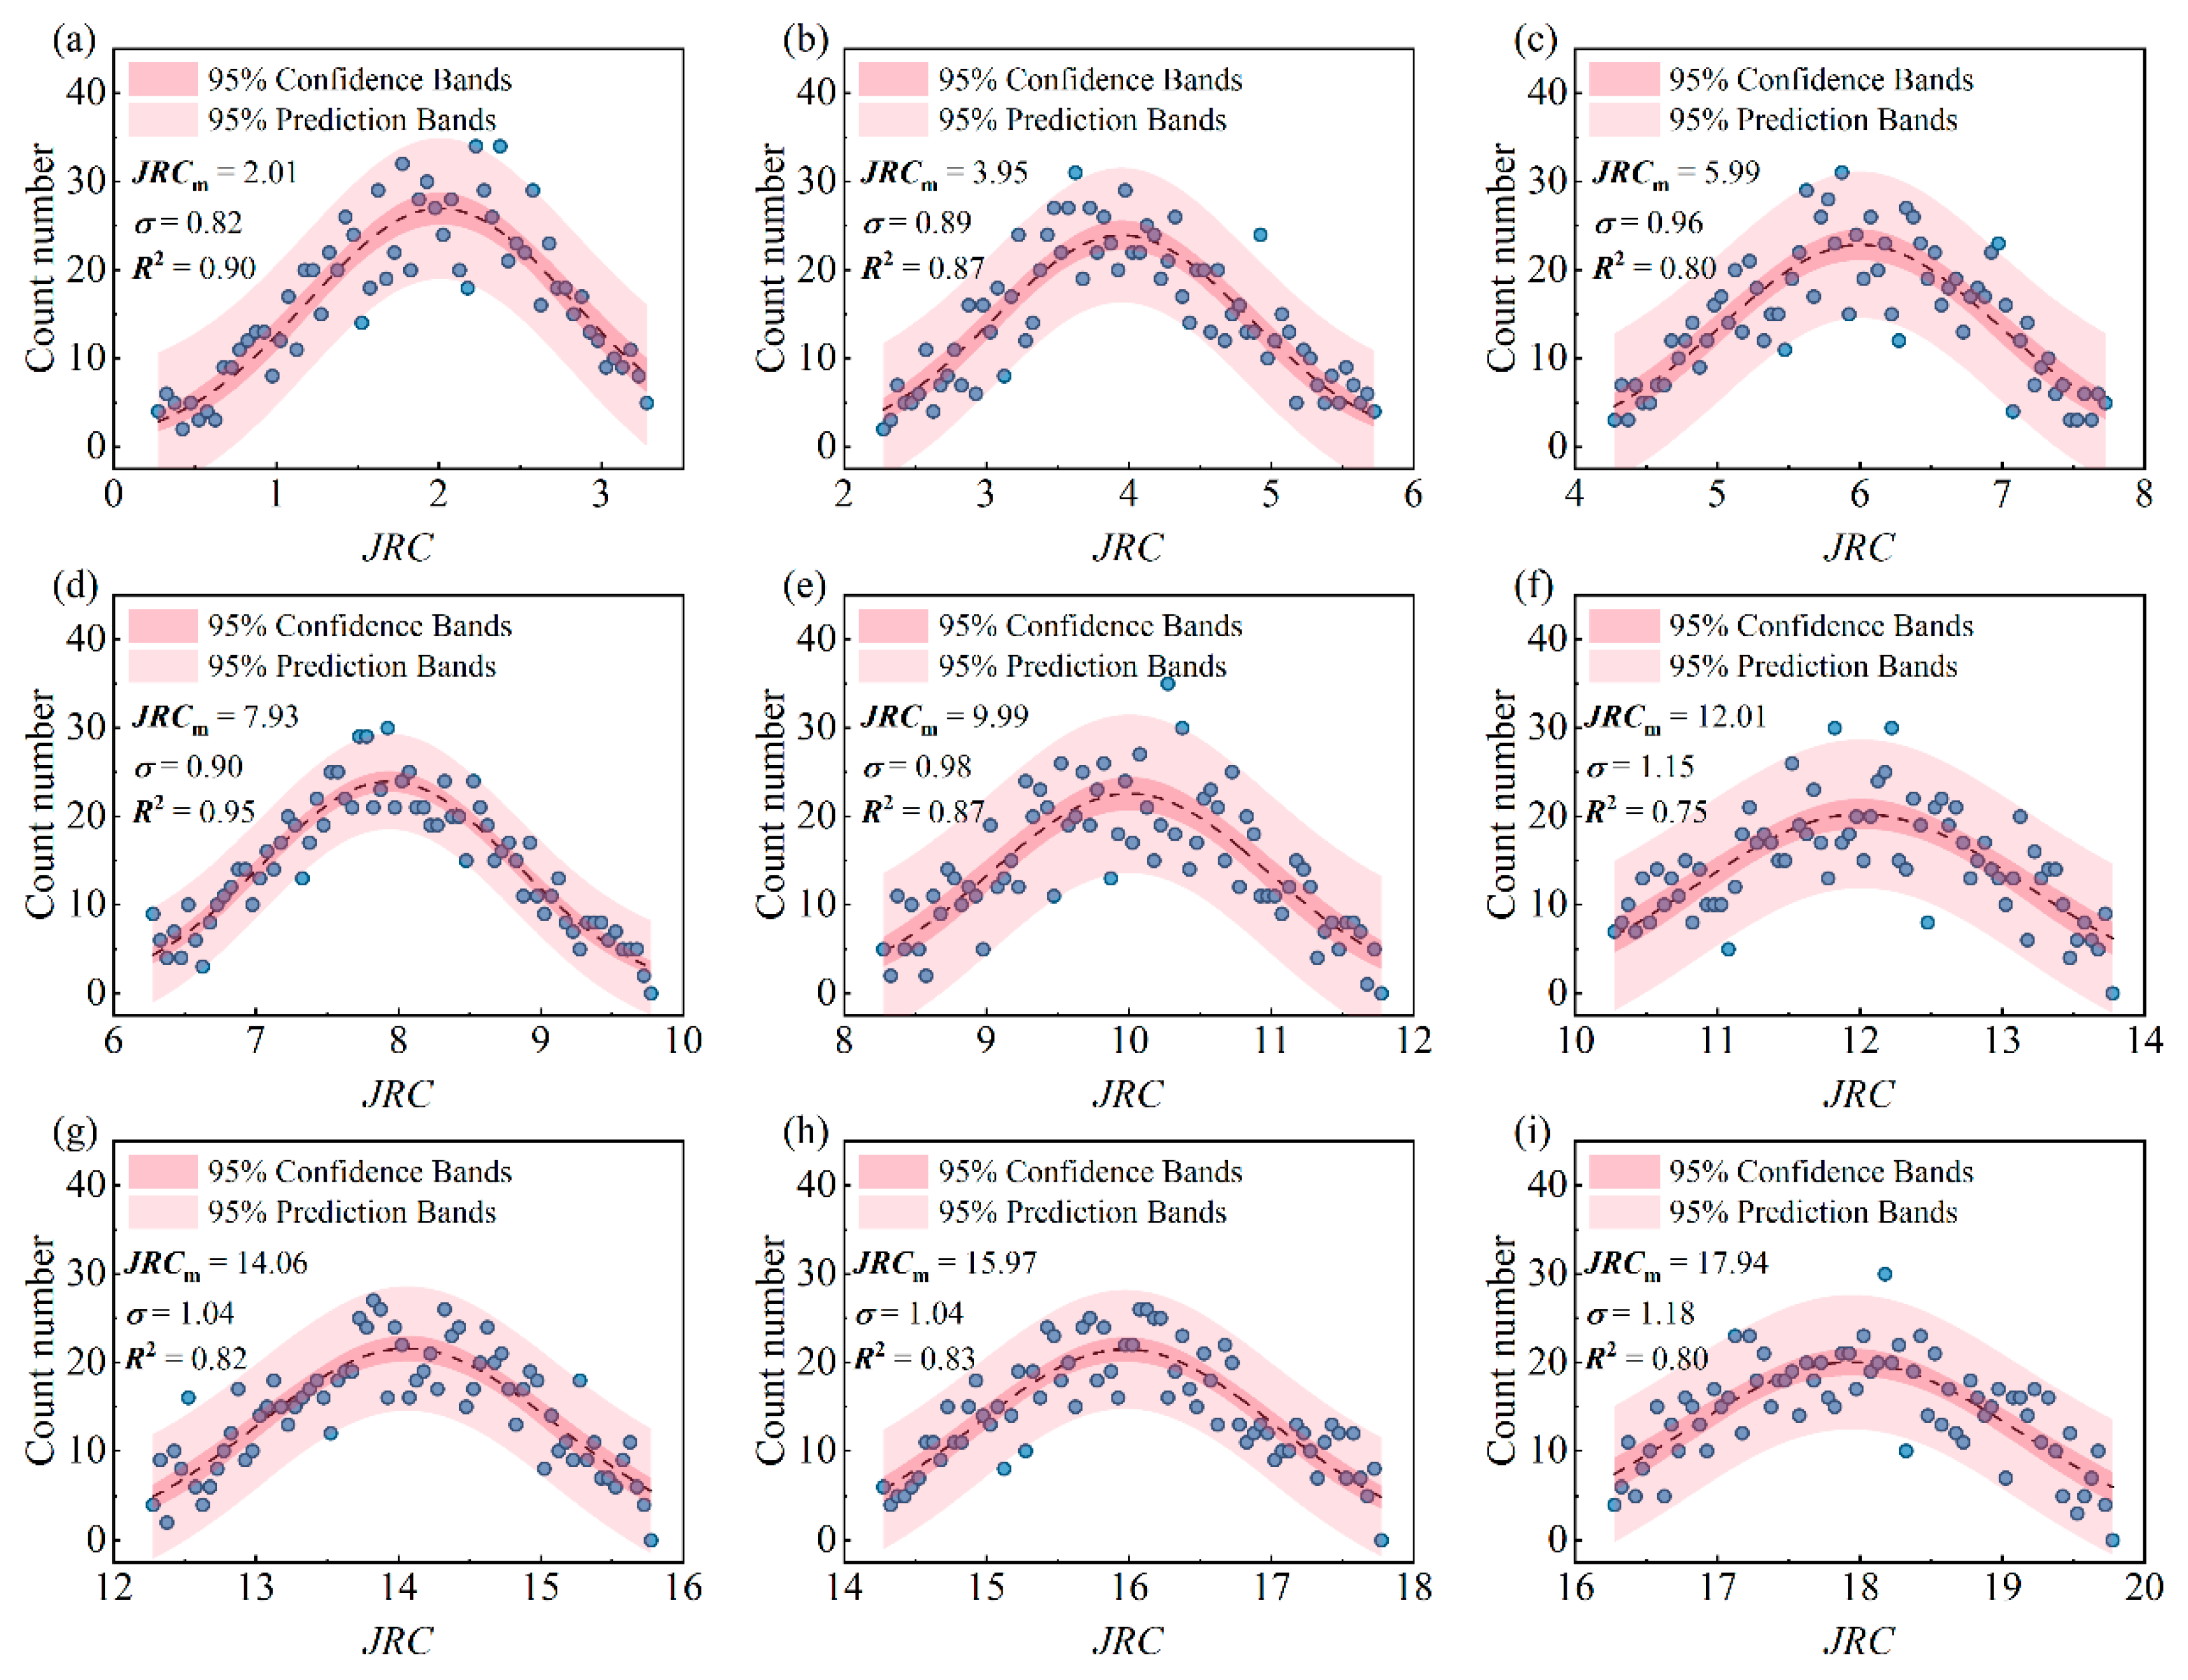
where Z2 denotes the root mean square of the first derivative of the profile, x i and δ i represent the x coordinates and the convexity height of the i-th sampling point, and Nt is the total number of sampling intervals. Since the JRC is applicable only for characterizing the roughness of two-dimensional joint profiles, a total of 1025 profiles oriented parallel to the fluid flow direction were extracted from each fracture surface. The JRC values of these profiles were computed using Equation (4), and their frequency distribution is illustrated in Figure 2. The discrete data shown in Figure 2 can be well approximated by a Gaussian distribution function of the following form:
f = 1 κ 2 π e J R C J R C m 2 2 κ 2
where f denotes the frequency of fracture aperture, and J R C m and κ represent the mean and standard deviation of the overall distribution illustrated in Figure 2. The coefficient of determination (R2) for the Gaussian fits in each subfigure of Figure 2 exceeds 0.80, demonstrating that the use of the mean JRC value as a representative measure of surface roughness is both justified and reliable.
In this study, the fracture is initially represented by a pair of self-affine rough surfaces separated by a uniform initial aperture. These surfaces are subsequently subjected to mechanical loading—such as normal compression and shear displacement—to simulate in situ stress-induced deformation. This approach enables the dynamic evolution of the fracture aperture field and provides a basis for analyzing stress-dependent hydraulic behavior. Thus, the mechanical aperture of the rock fracture, b m , can be expressed as:
b m =   b 0 Δ b n + Δ b s
where b 0 denotes the initial mechanical aperture under a given stress state, while Δ b n and Δ b s represent the aperture variations induced by normal and shear stresses, respectively. The initial aperture b 0 can be determined through laboratory cyclic loading–unloading tests, which capture the mechanical response of fracture closure and dilation. Alternatively, it can be estimated indirectly by back-calculating from permeability measurements using the Darcy equation under laminar flow conditions. In the present study, to maintain methodological consistency and effectively observe changes in hydraulic conductivity are unequivocally attributable to the imposed mechanical loading, rather than to confounding variables arising from an arbitrary initial contact geometry, the initial separation distance introduced during the numerical construction of the fracture geometry is adopted as the initial mechanical aperture b 0 :
  b 0 ( i , j ) = Z u p p e r ( i , j ) Z l o w e r ( i , j )

2.2. Fluid Dynamics Computation

In fractured rock media, the steady-state flow of incompressible viscous fluids is governed by the Navier–Stokes (NS) equations, which incorporate both viscous and inertial effects. Owing to the intricate geometrical features of rough fracture surfaces, numerical methods are typically employed to solve these equations, enabling detailed analysis of the velocity field and pressure distribution within the fracture domain. The NS equations serve as a theoretical foundation for investigating the influence of fracture surface roughness and aperture heterogeneity on fluid flow characteristics and overall permeability [45]:
ρ U t + U U = P + μ 2 U + ρ f
where ρ denote the fluid density, U represents the fluid velocity vector, P is the hydraulic pressure, μ is the dynamic viscosity, and f denotes the body force per unit volume. However, directly solving the full Navier–Stokes equations across a large number of discrete mesh nodes is computationally intensive, especially when dealing with highly irregular fracture geometries. To improve computational efficiency while retaining sufficient accuracy, the Reynolds equation is commonly employed as a reduced form of the Navier–Stokes equations. This approximation is valid under conditions of low flow velocity, negligible inertial forces, and small aspect ratios typical of narrow fracture apertures. The Reynolds equation offers a simplified yet effective framework for describing laminar fluid flow in rough-walled fractures and is mathematically expressed as follows:
b m 3 12 μ P = Q
To conduct fluid flow simulations within rock fractures using the Reynolds equation, the fracture domain must first be discretized into a mesh of fine elements that approximate locally parallel plates. This discretization is essential, as the validity of the Reynolds equation is based on the assumption of locally parallel flow between opposing fracture surfaces. At each node or sampling point, the fracture aperture is calculated using Equation (7) and incorporated into the model to capture the inherent geological anisotropy of the fracture structure. Subsequently, fluid flow is evaluated on an element-by-element basis, resulting in a spatially heterogeneous velocity field across the domain. The numerical solution of the Reynolds equation is implemented using COMSOL Multiphysics 6.0, a commercial finite element analysis platform. The aperture field is discretized into sufficiently small square elements to ensure local flow assumptions are satisfied and numerical convergence is achieved. Following completion of the simulation, the effective permeability K of the fracture is determined by back-calculating from the simulated flow field using Darcy’s law, expressed as:
K = μ L Q A Δ P
where A is cross-sectional area, L is the fracture length.
To simulate fluid flow through the fracture, a constant hydraulic pressure was applied at the inlet boundary, while the outlet was set to a pressure-free condition (P = 0). The fracture walls were modeled as no-slip boundaries, and the lateral boundaries were assumed to be impermeable, as depicted in Figure 3. This boundary setup ensures that the flow is driven solely by the imposed pressure gradient and is confined within the fracture domain. Previous studies have indicated that nonlinear flow behavior tends to emerge in the early stage of the pressure–discharge curve, particularly in cases where fracture surfaces exhibit high roughness or where the fracture aperture is relatively large. In the present study, the fracture model characterized by an aperture of 0.4 mm and a Joint Roughness Coefficient (JRC) of 18.0 showed the highest tendency to develop nonlinear flow characteristics. To capture the transition from linear (laminar) to nonlinear or potentially turbulent flow regimes, a wide spectrum of hydraulic gradients (J) ranging from 10−4 to 104 was applied. This approach enables the identification of a critical threshold beyond which deviations from Darcy’s law become significant, thereby providing insights into the onset of nonlinear flow behavior in rough-walled rock fractures.
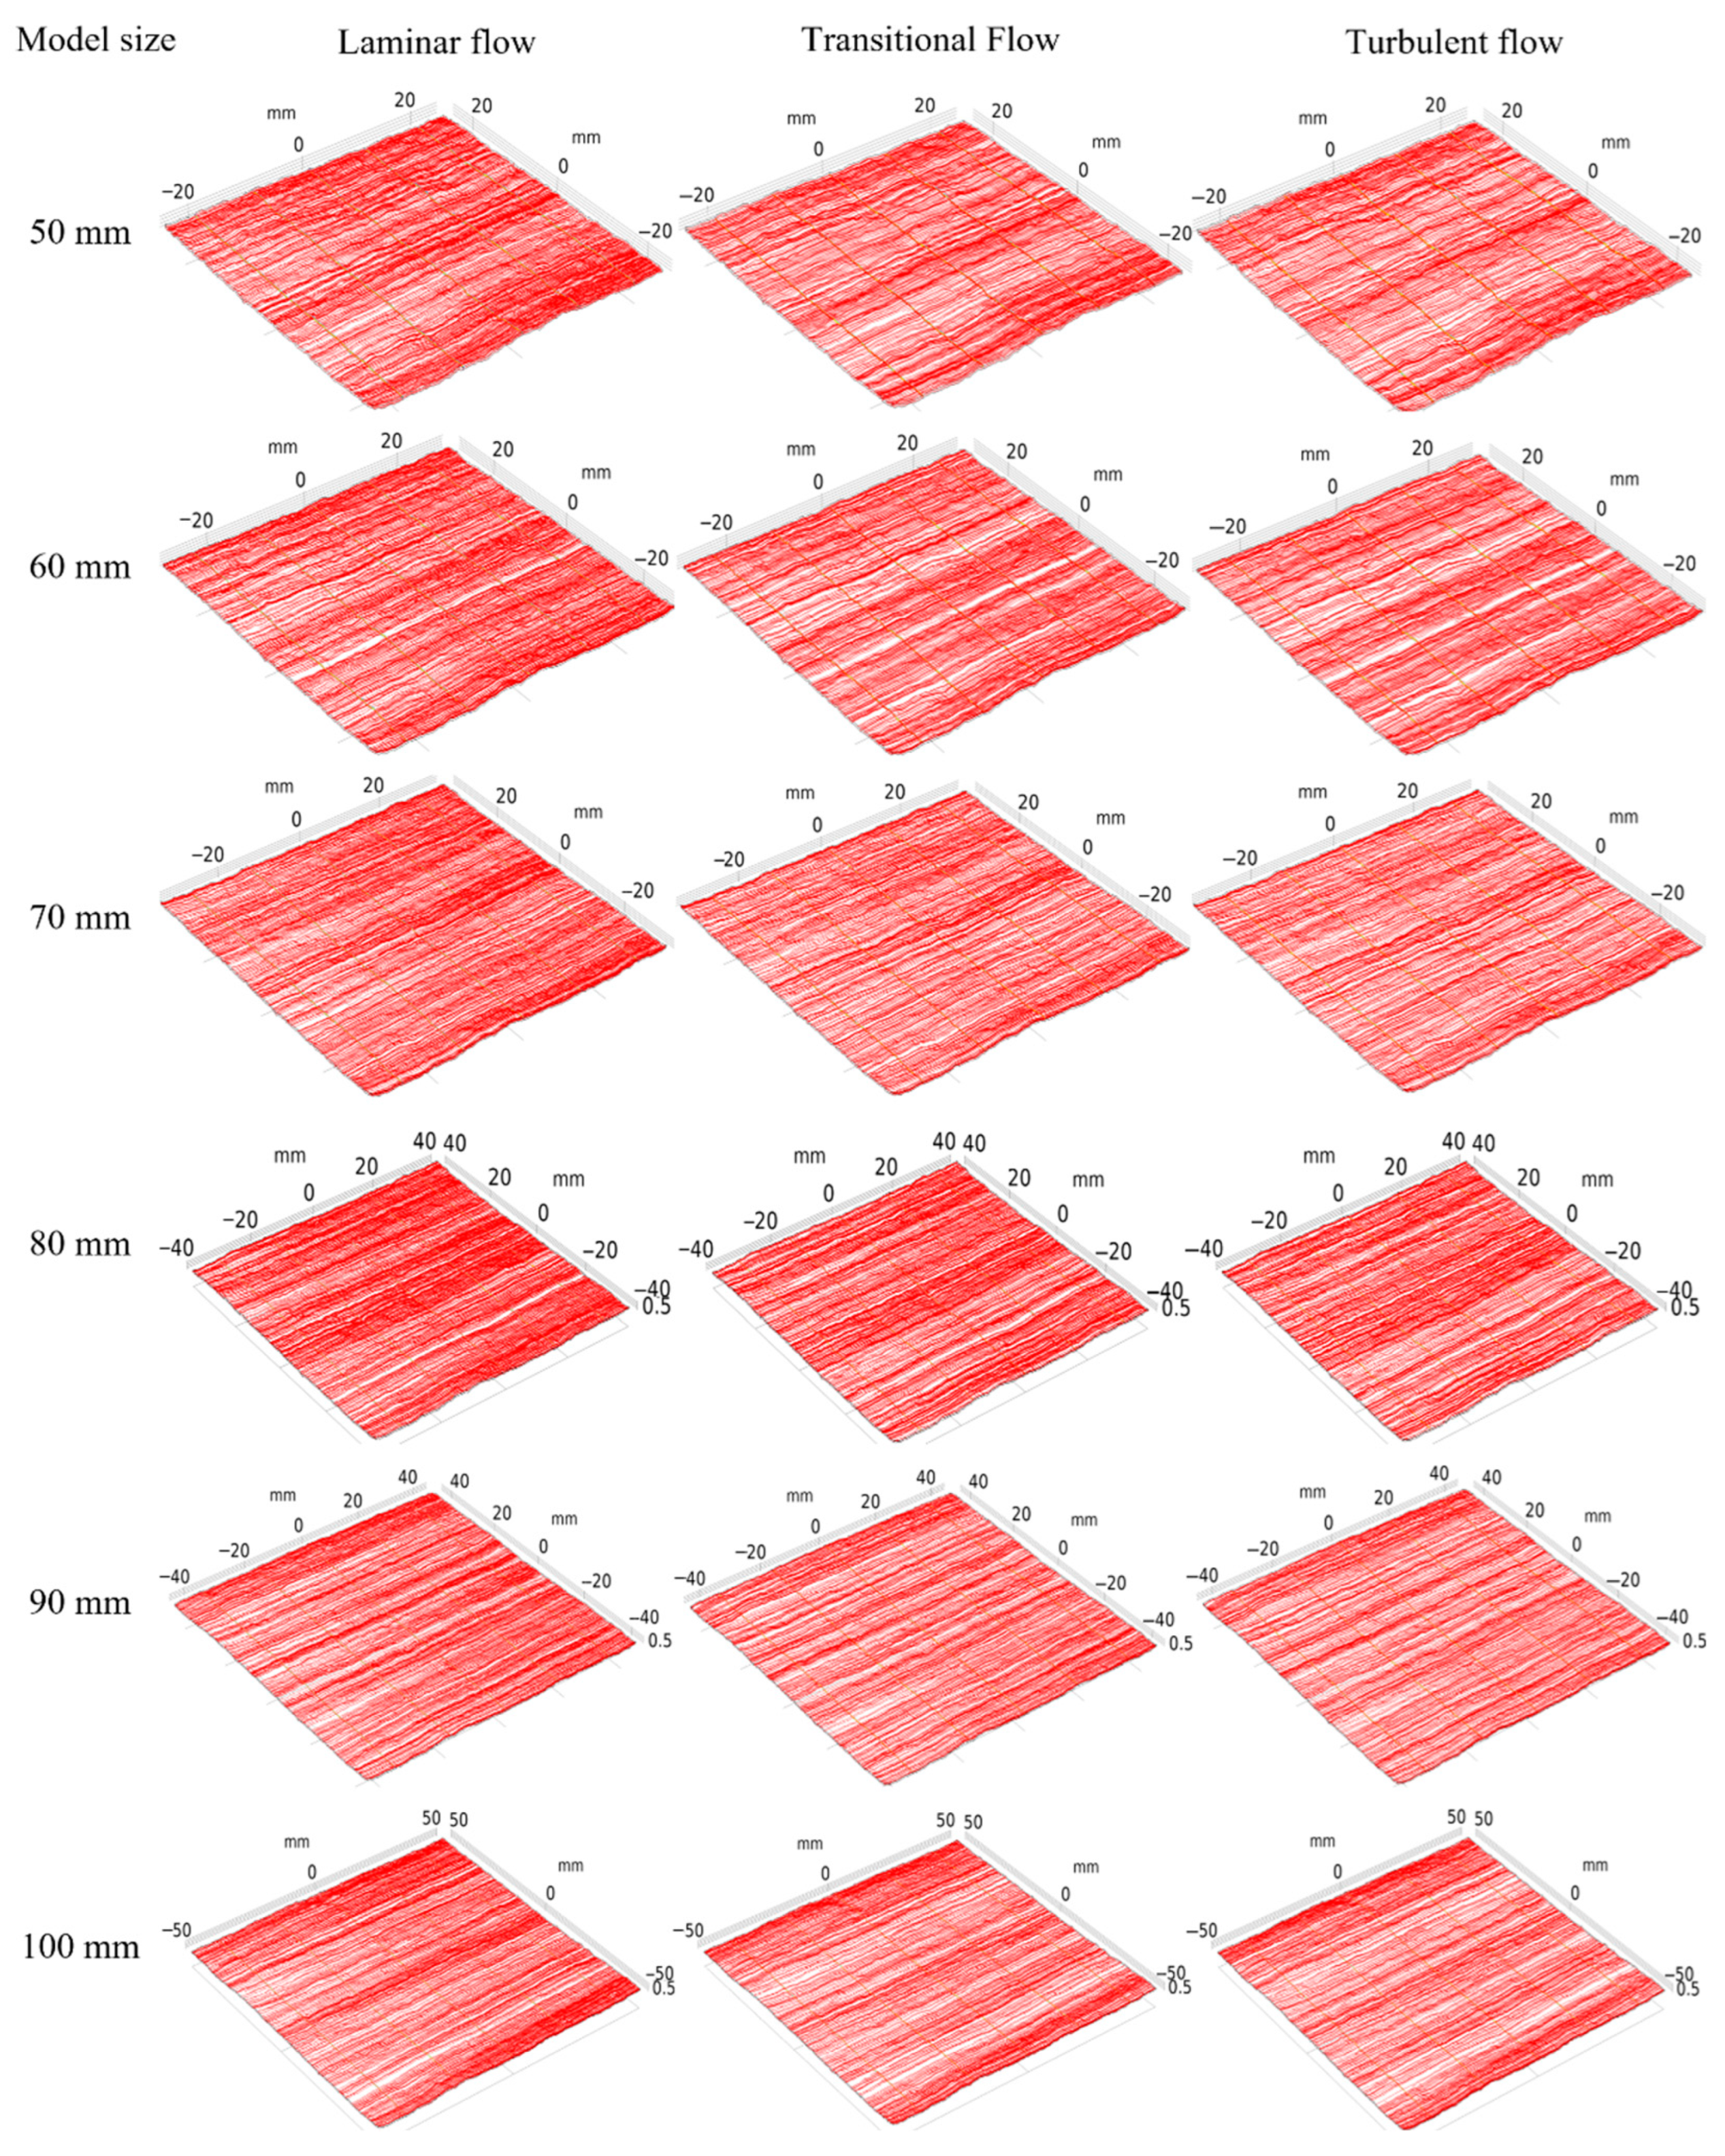
The morphology of fracture surfaces and their corresponding hydraulic properties are inherently scale-dependent. A key concept in addressing this scale effect is the Representative Elementary Volume (REV), defined as the smallest volume over which a calculated property—such as permeability—can be considered statistically invariant with respect to further increases in sample size. Accurate determination of the REV is essential for ensuring that both experimental measurements and numerical simulation outcomes are representative of field-scale behavior. To evaluate the impact of model size on fracture permeability, a series of subdomains with varying lengths—from 20 mm to 100 mm—were systematically extracted from the central region of the full-scale fracture model, as illustrated in Figure 3. This multi-scale analysis enables assessment of whether the computed permeability stabilizes beyond a certain domain size, thereby validating the appropriateness of the REV and supporting the generalizability of the permeability prediction model developed in this study.
Figure 4 presents the streamline patterns of fluid flow through a rock fracture under varying hydraulic gradients. At low gradient conditions, the streamlines remain nearly parallel, indicating that inertial effects are minimal and the flow adheres to the linear laminar regime. As the hydraulic gradient increases, however, the streamlines begin to curve and deviate from parallel alignment. This behavior marks the onset of nonlinear flow, where inertial forces become increasingly influential. Such deviations indicate a departure from the assumptions underlying linear laminar flow, resulting in a flow regime that cannot be accurately described by Darcy’s law alone. Consequently, the observed (apparent) permeability begins to diverge from the intrinsic permeability of the fracture. This distinction underscores the importance of accounting for flow regime transitions when evaluating the hydraulic properties of rough-walled fractures, particularly under high-gradient or high-velocity conditions.
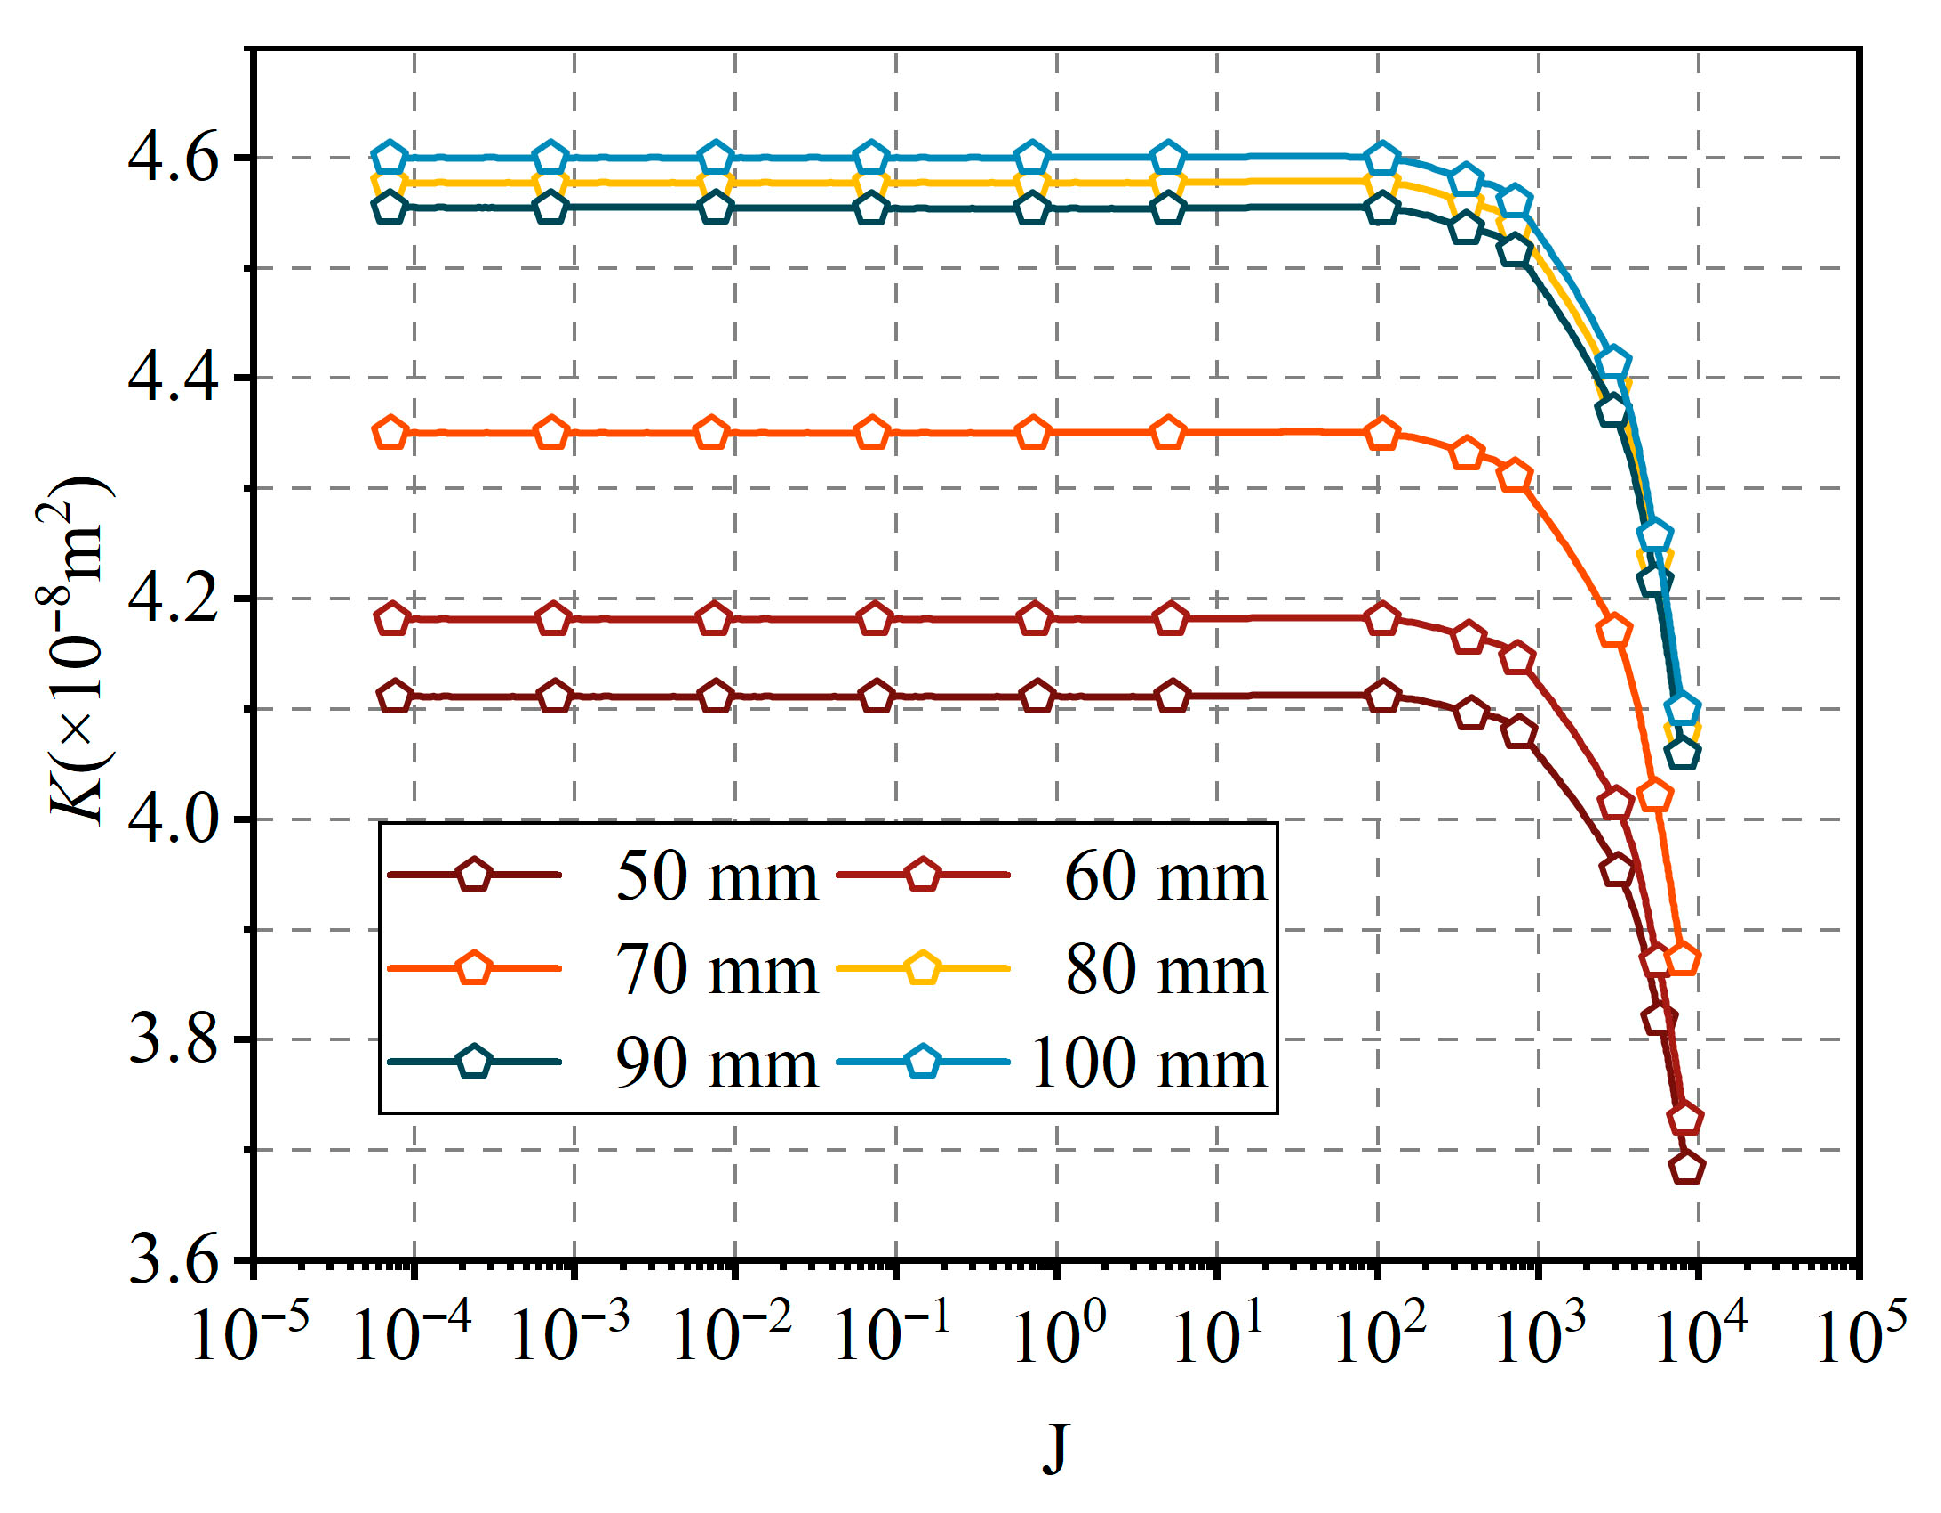
To identify the critical hydraulic gradient at which fluid flow transitions from linear to nonlinear behavior and to evaluate the scale dependence of intrinsic fracture permeability, Figure 5 illustrates the variation in permeability as a function of hydraulic gradient. As shown, when the hydraulic gradient is below 10, the permeability remains essentially constant, indicating that the flow remains within the linear laminar regime. In this range, the flow rate (Q) maintains a linear relationship with the pressure difference (ΔP) across the fracture, independent of the magnitude of ΔP. However, once the hydraulic gradient exceeds 10, a gradual reduction in permeability is observed, followed by a more pronounced decline as the gradient approaches 500. This trend signifies the emergence of nonlinear flow behavior, where inertial effects begin to dominate and Darcy’s law no longer holds. In addition, the permeability curves reveal a noticeable size effect. As the model length increases from 20 mm to 100 mm, the calculated permeability values vary accordingly, the calculated permeability values varied by less than 1% for domain sizes larger than 100 mm, eventually converging when the model size exceeds 100 mm. This observation suggests that a domain larger than 100 mm is necessary to achieve a Representative Elementary Volume (REV), ensuring that the model captures the essential geometric and hydraulic characteristics of natural fractures. To ensure linear flow conditions in this study, a conservative upper limit for the hydraulic gradient was set at 10. Under this constraint, the inertial term in the Navier–Stokes equations can be neglected, allowing the use of the simplified Stokes equations to describe the flow behavior. Furthermore, a model size of 200 mm was selected to exceed the REV threshold, thereby ensuring that the simulated fracture domain provides a statistically representative and geometrically realistic basis for permeability analysis.

3. Stress-Induced Mechanical Behavior and Fracture Aperture Evolution

Roughness and aperture are two fundamental geometric characteristics that govern fluid flow through natural rock fractures. Numerous studies have shown that fracture surface roughness alone does not directly determine the aperture. Instead, aperture should be regarded as a distinct geometric descriptor that reflects the spatial correlation between the asperity profiles of the opposing fracture walls. To accurately characterize the evolution of aperture and its impact on fluid flow under normal and/or shear stress conditions, it is essential to define the initial aperture distribution and the mechanical properties of the fracture. When additional stress is applied, the fracture may lose stability, making surface roughness a critical factor influencing the subsequent evolution of the aperture distribution. Therefore, to understand the hydraulic behavior of fractures, it is necessary to analyze the evolution of aperture closure under normal stress and dilation during shear displacement.

3.1. Normal Stress-Induced Fracture Closure Model

Understanding the deformation behavior of rock fractures is essential for assessing the long-term stability of fractured rock masses [46]. Under the influence of geological stresses and tectonic forces, fractures are subjected to normal compression, which leads to changes in their geometry and directly affects the seepage behavior of subsurface fluids. Consequently, a quantitative evaluation of fracture deformation in response to normal stress is of great importance in both geoscientific research and geoengineering applications. A considerable body of research has focused on characterizing the relationship between normal stress and fracture aperture, resulting in a variety of experimental and theoretical models for predicting fracture closure. Among these, the model developed by Brown and Scholz (1985) [47] is particularly noteworthy, as it incorporates the geometric contributions of both the upper and lower fracture surfaces. Their approach introduced the concept of composite topography, which combines the roughness profiles of the opposing walls into a unified representation of the contact geometry.
Based on this framework, the normal closure behavior in the present study is evaluated using the Brown–Scholz model, which is mathematically expressed as:
  σ n = 4 3 η ψ E R 1 / 2 d 0 Δ e n Z * d 0 + Δ e n     φ Z * d Z *
where
  • Z * denotes the height of a local maximum on the composite topography;
  • η represents the number density of local maxima per unit area;
  • ψ is the average tangential stress correction factor;
  • E denotes the effective elastic modulus (or the mean value of the elastic constants);
  • R refers to the average curvature of the contact points;
  • Δ e n is the normal closure (i.e., the reduction in fracture aperture under compression);
  • d 0 indicates the initial separation between the reference planes (undeformed fracture surfaces);
  • σ n denotes the applied normal stress;
  • φ Z * is the probability density function describing the statistical distribution of local maxima heights in the composite surface profile.

3.2. Shear-Induced Fracture Dilation Model

Compared with the relatively straightforward influence of normal stress, the mechanical and hydraulic responses to shear stress are more complex and less predictable. The dynamic evolution of asperity geometry under shear can lead to significant redistribution of flow pathways and may induce the formation and expansion of eddy zones during the transition from laminar to turbulent flow, even under the same hydraulic gradient [1]. Shear-induced variations in fracture aperture have a notable impact on hydraulic conductivity, attracting increasing attention in fracture hydromechanics research. To regulate the evolution of aperture distribution during shear dilation, the dilation model proposed by Barton (1977) [43] is adopted. This model describes the shear-induced aperture increment through the following incremental form:
Δ e s = δ s tan 1 M J R C m o b log J C S / σ n
where Δ e s denotes the aperture variation resulting from the applied shear displacement δ s ; M is the damage coefficient associated with the imposed normal stress; J R C m o b represents the mobilized joint roughness coefficient under shear conditions; and J C S corresponds to the compressive strength of the material forming the fracture walls.

4. Hydraulic Behavior of Rock Fracture

Normal stress uniformly reduces the fracture aperture, whereas shear displacement induces anisotropy in the spatial distribution of aperture. To elucidate the influence of fracture surface geometry and internal cavity structure on permeability, this study constructed nine distinct fracture models subjected to four levels of normal stress and six levels of shear displacement. In this study, the rock sample used was medium-grained sandstone with a density of 2.32 g/cm3, porosity of 6.8%, and uniaxial compressive strength (UCS) of 64.5 MPa. These fundamental mechanical properties were used to determine the stress limits applied in the tests. The fracture roughness was characterized by the Joint Roughness Coefficient (JRC) ranging from 2.01 to 17.94, corresponding to Hurst exponents between 0.2396 and 0.1652, representing different surface morphologies. The parameters employed to characterize permeability evolution in relation to geometric variation are detailed in Table 1. In total, 216 fracture scenarios were examined (i.e., 4 normal stress levels × 6 shear displacement levels × 9 surface roughness types). For the purpose of result analysis and discussion, the applied normal stress levels are categorized as follows: low (2 MPa), medium (4–6 MPa), and high (8 MPa). Similarly, the shear displacements are classified as: small (2–4 mm), medium (6–8 mm), and high (10–12 mm).
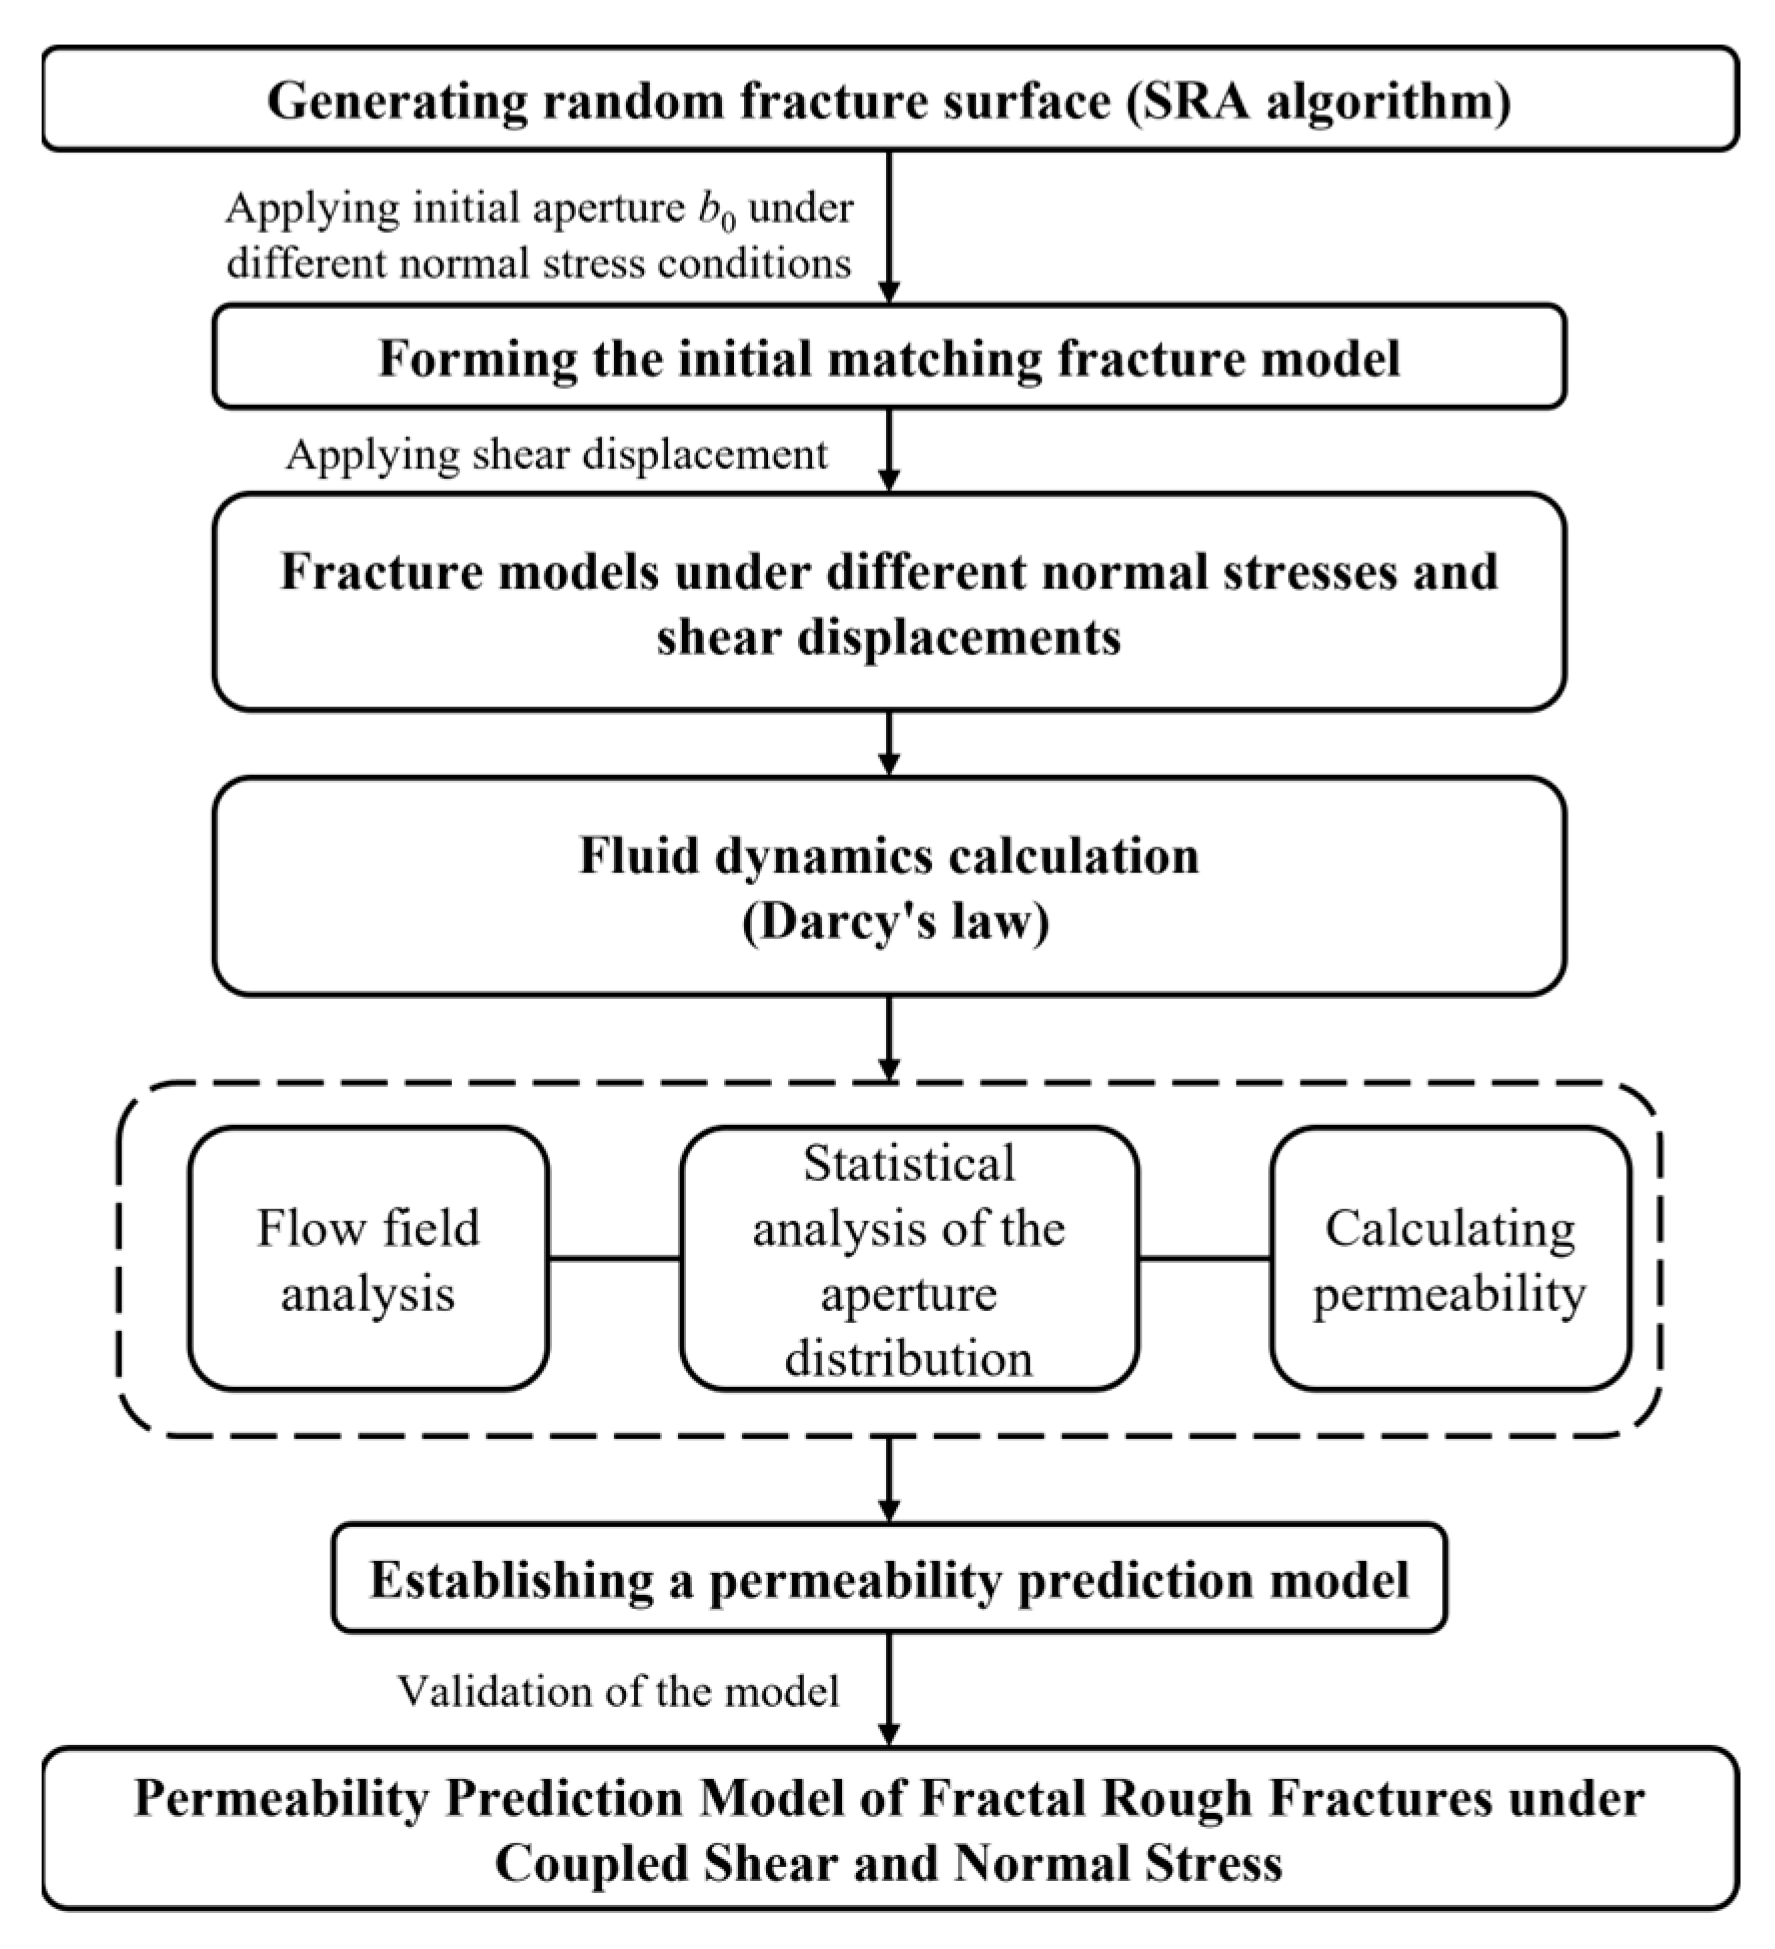
The workflow begins with generating synthetic rough fracture surfaces using a modified SRA algorithm to form an initial matched model. This model is then mechanically deformed under various normal stresses and shear displacements. Fluid flow simulations based on Darcy’s law are performed on the deformed geometry to determine the effective permeability. Finally, the data are integrated to establish a permeability prediction model for rough fractures under coupled stress conditions. The entire process is shown in Figure 6.

4.1. Flow Flied Distribution

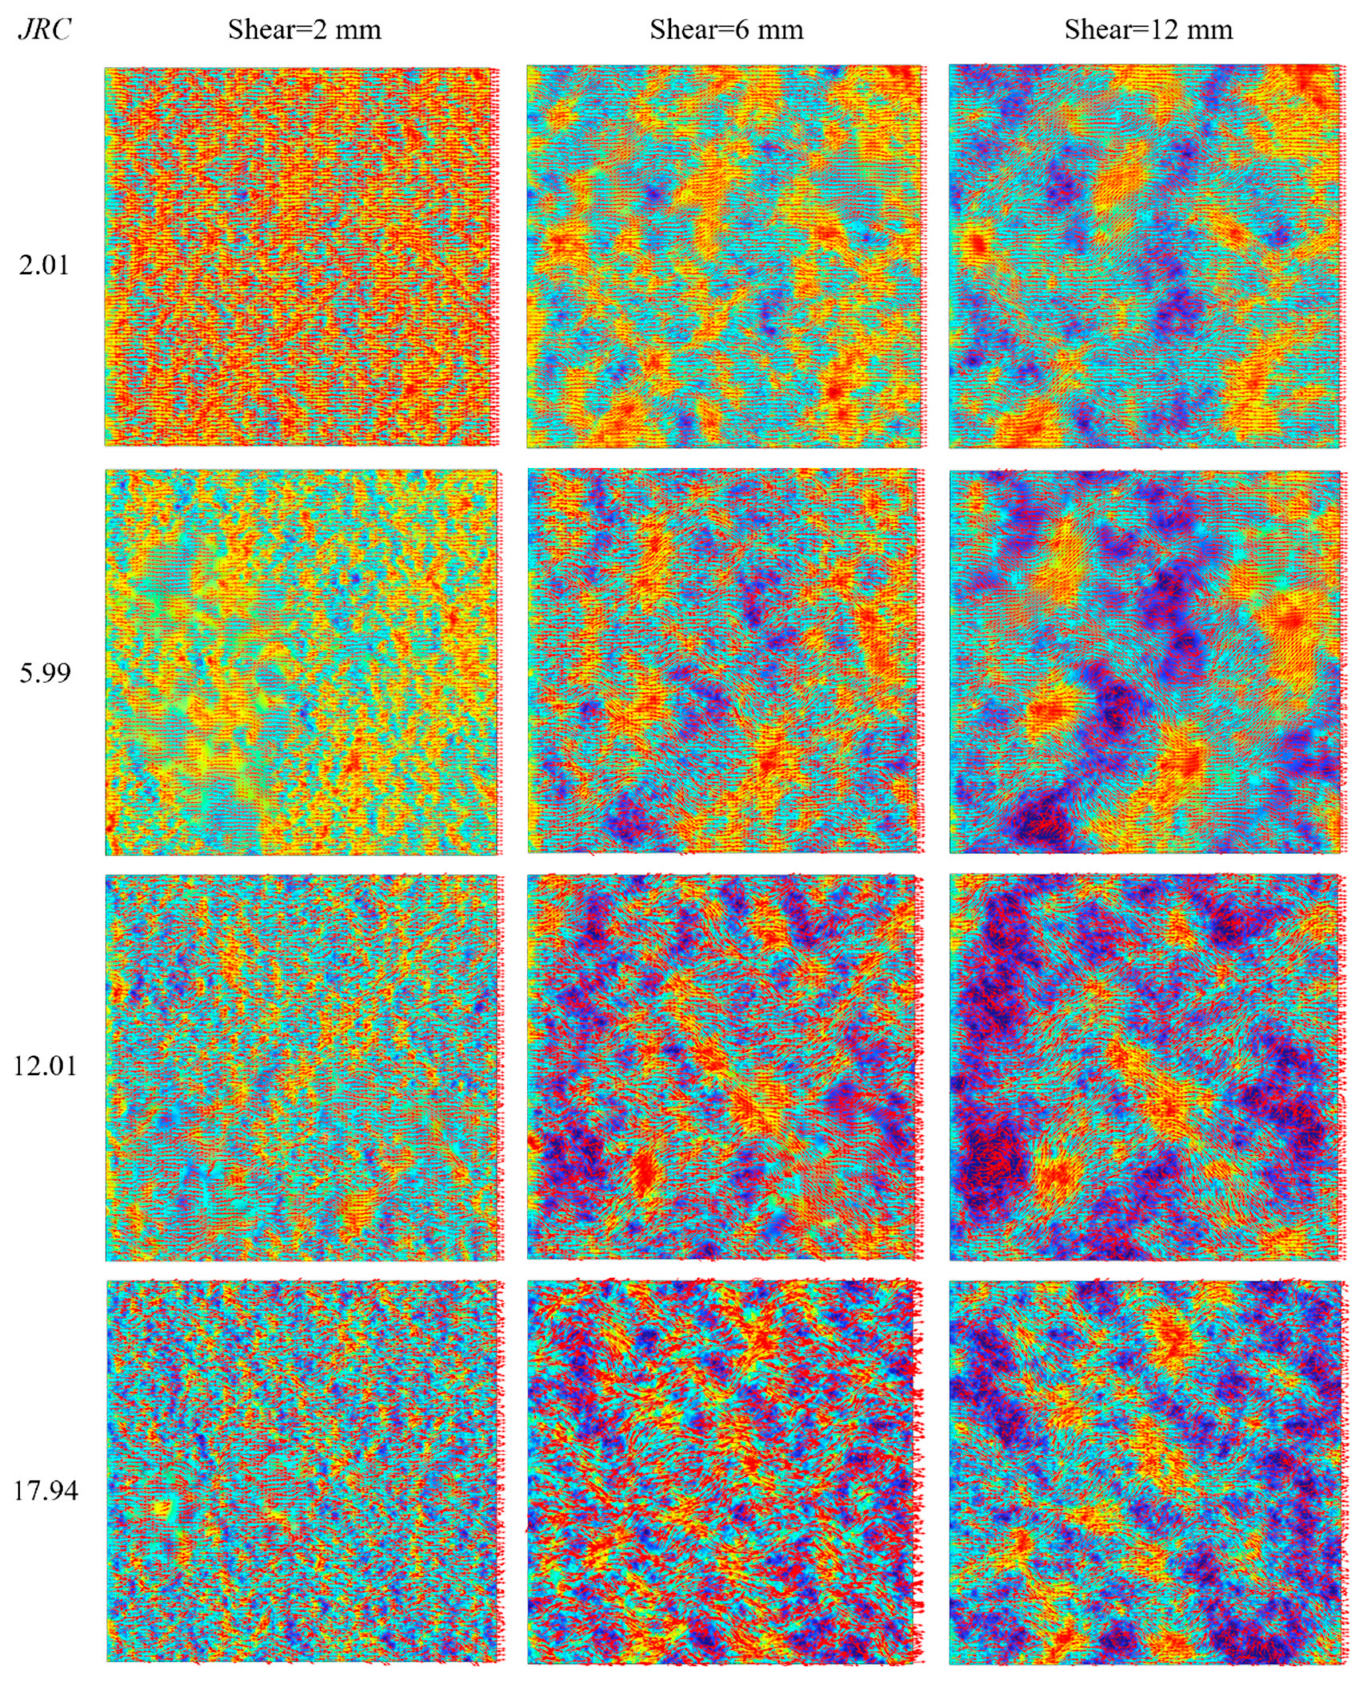
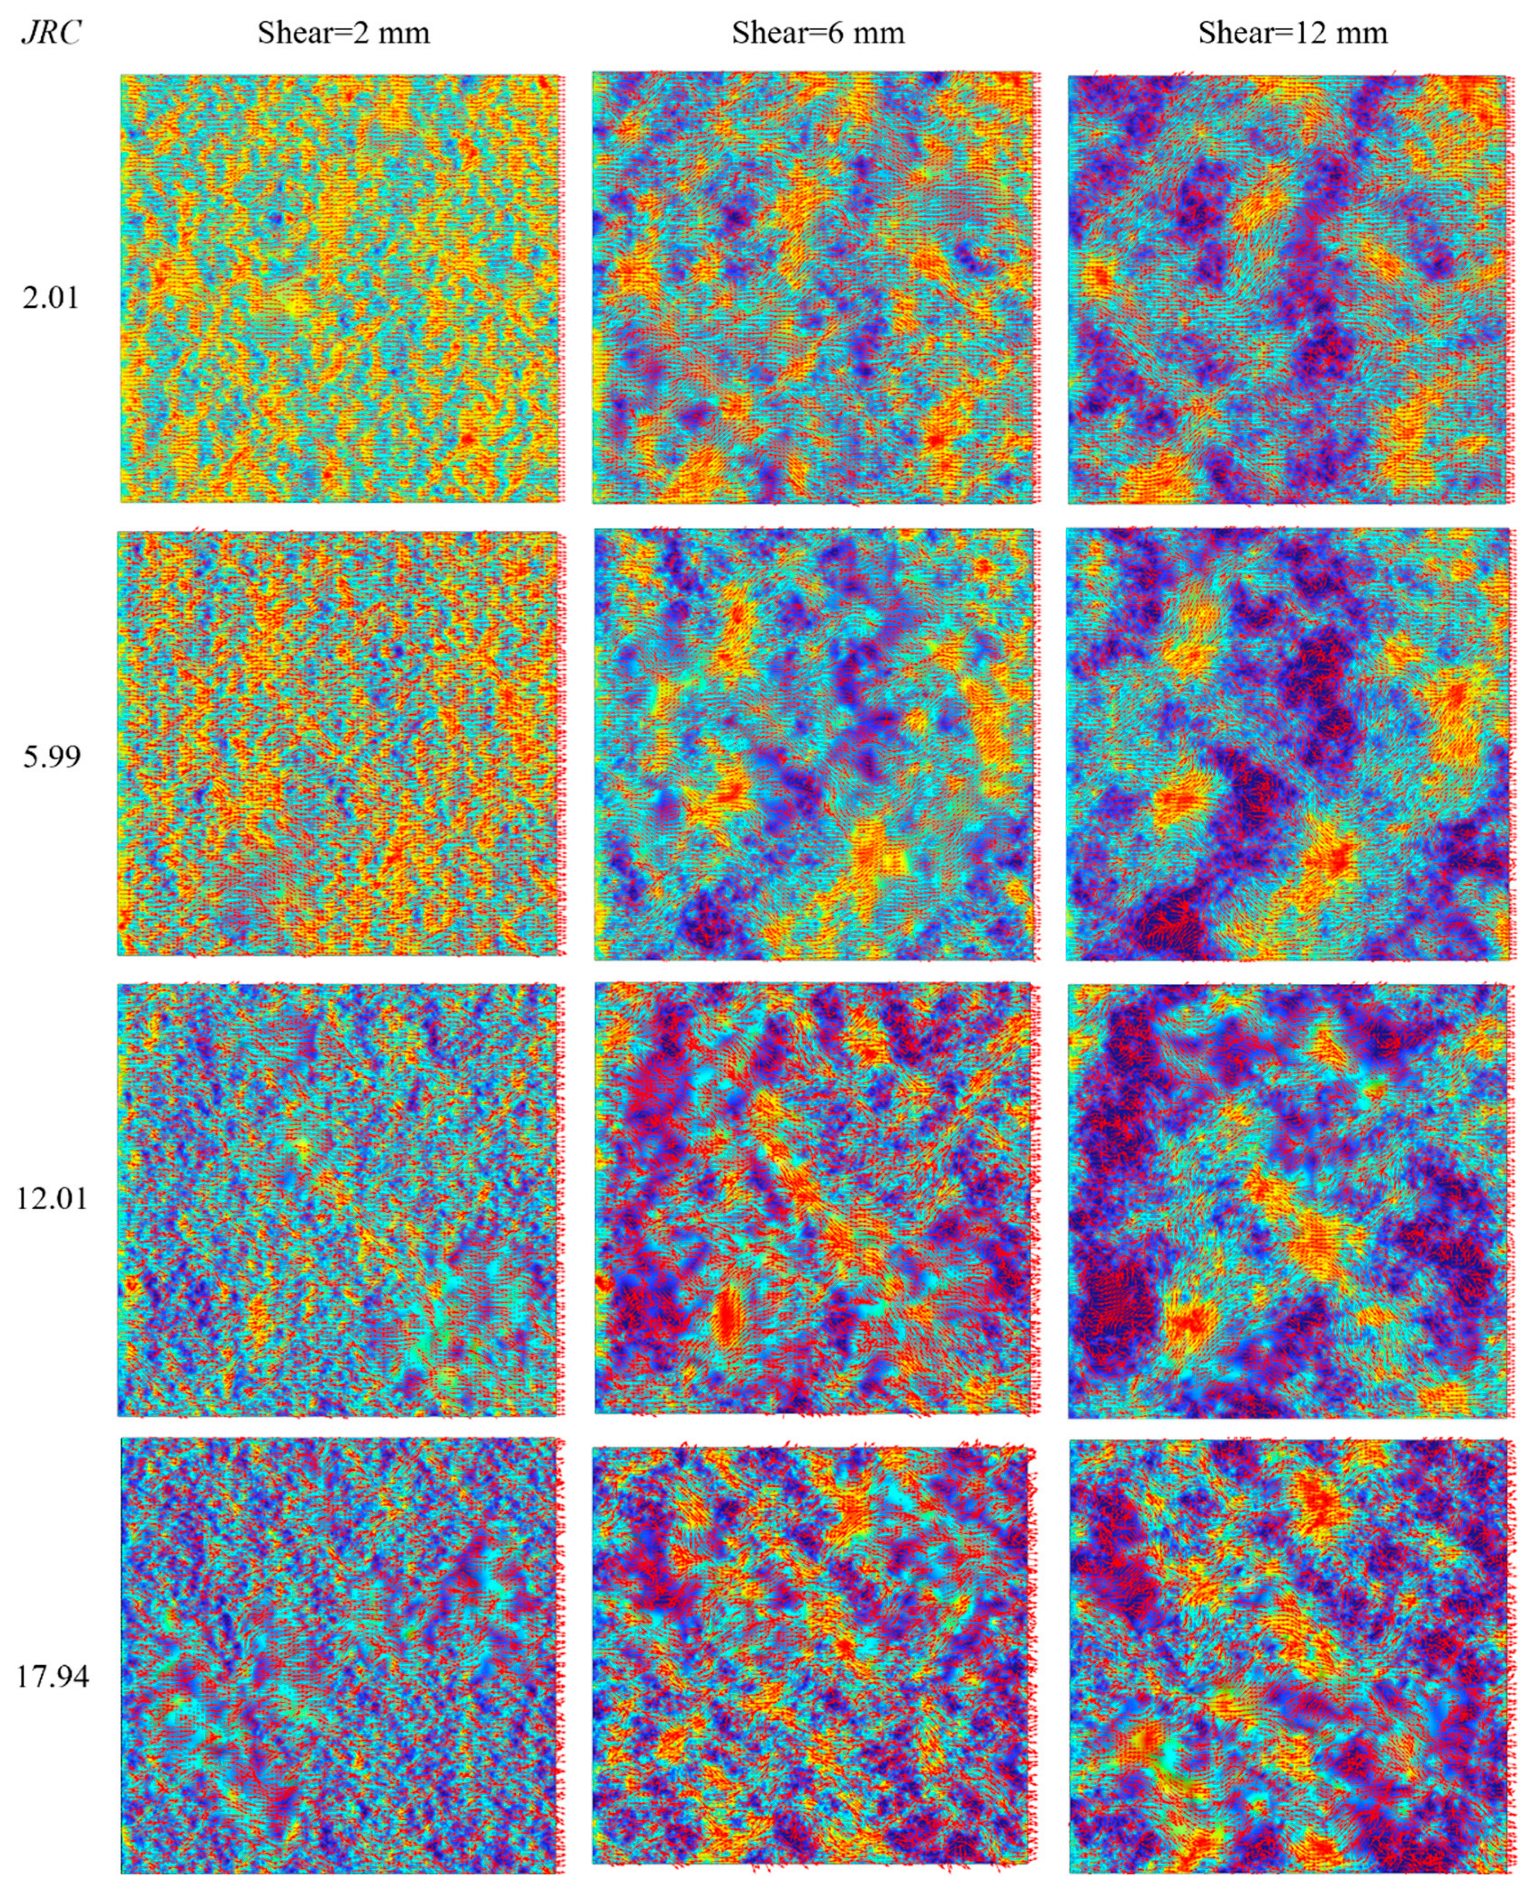
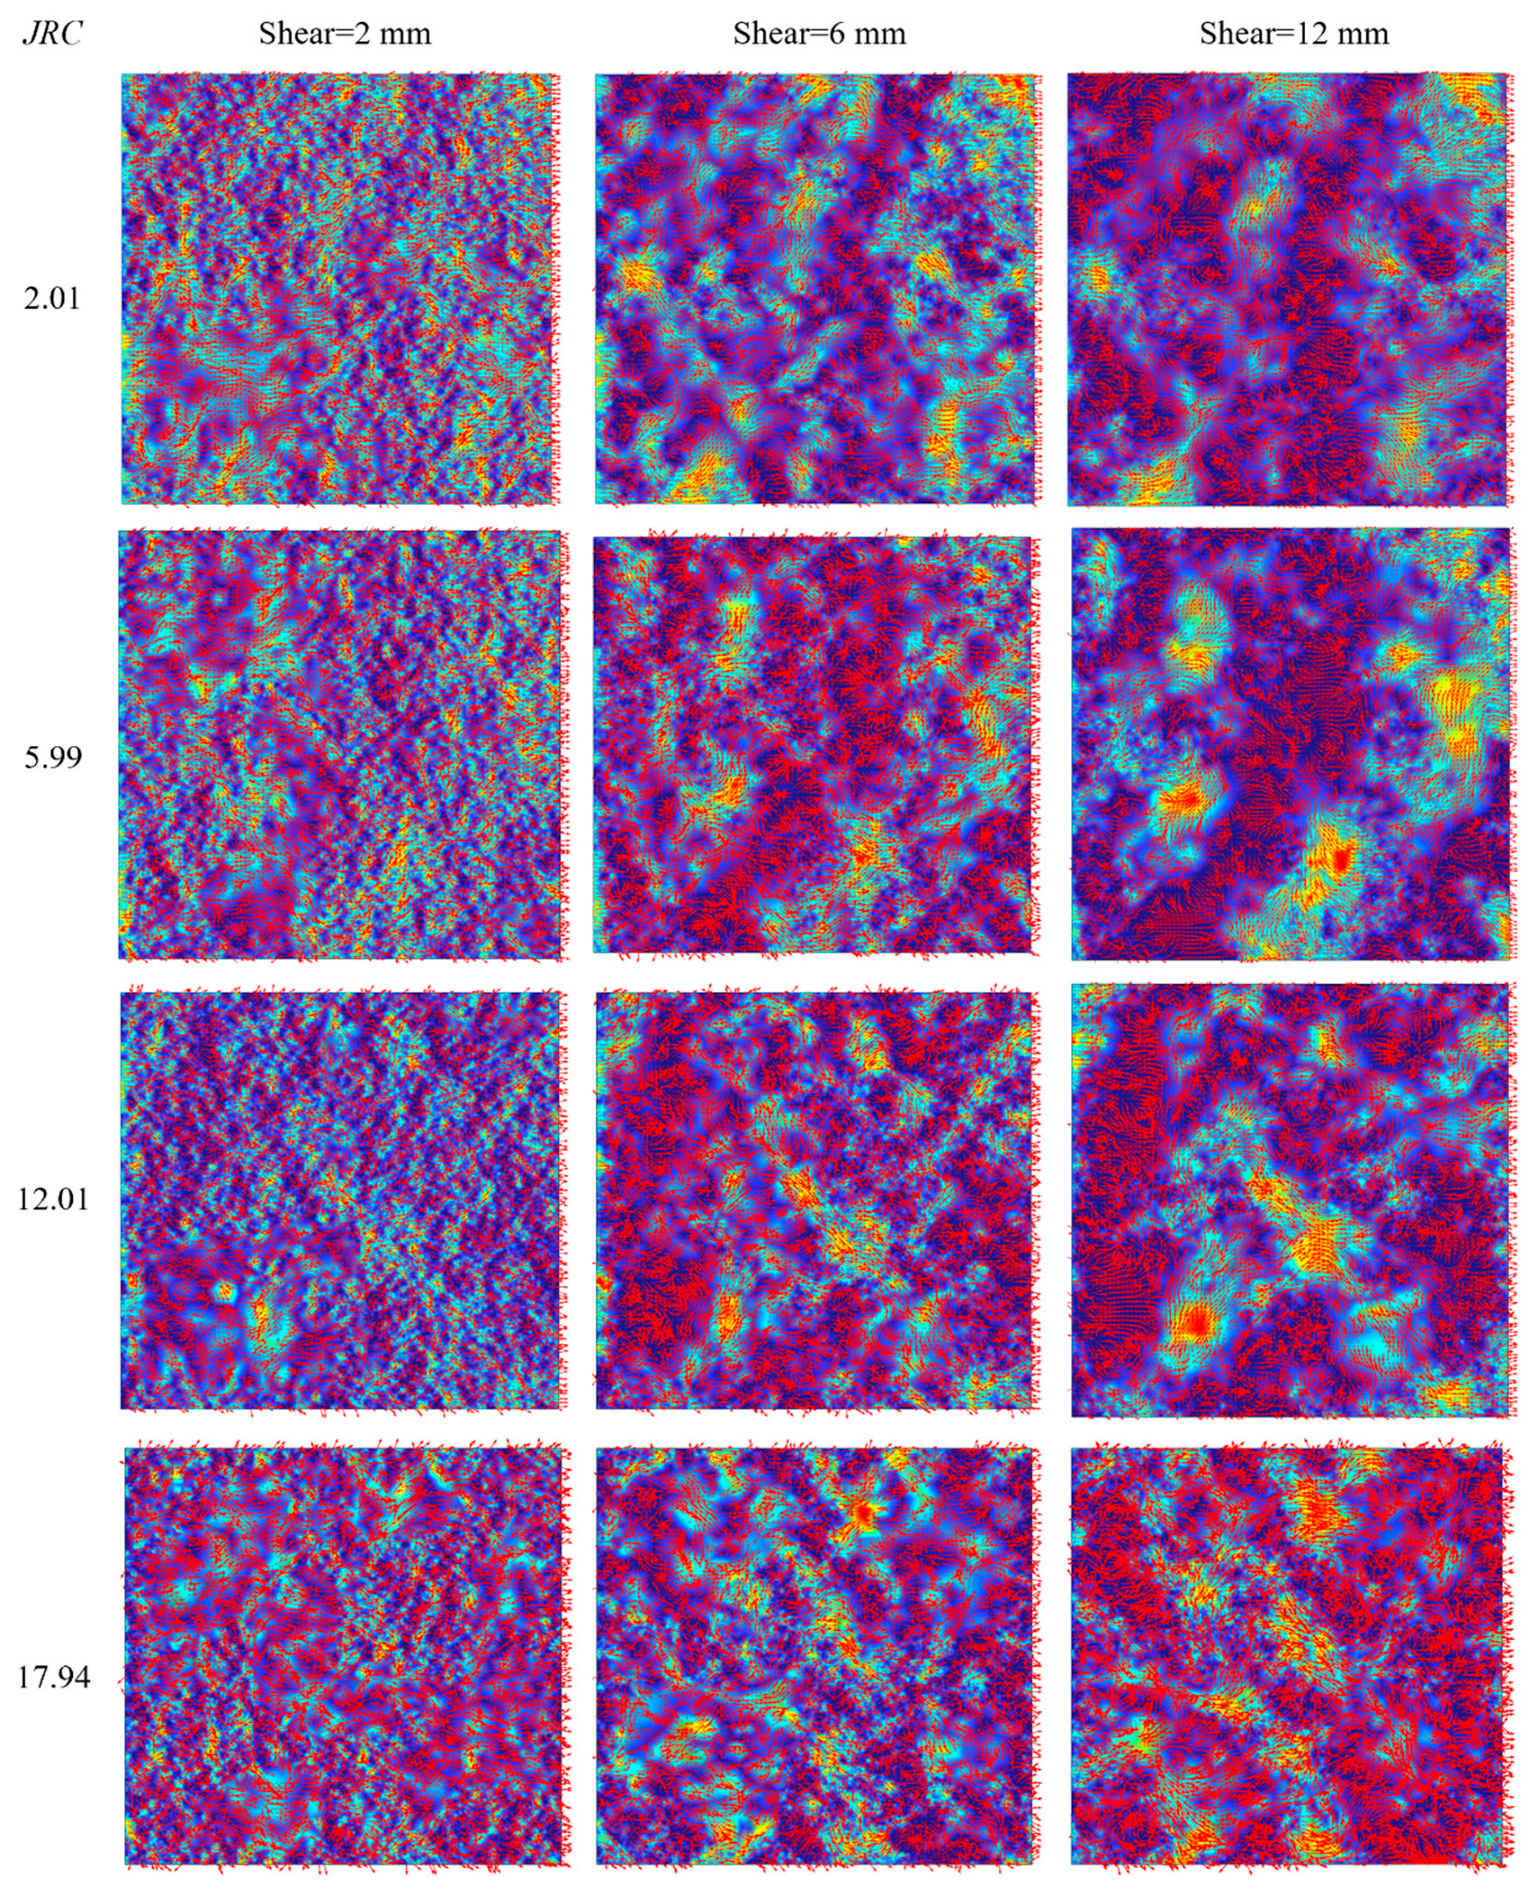
Figure 7, Figure 8, Figure 9 and Figure 10 illustrate the spatial distribution of flow fields in rock fractures with varying surface roughness under different combinations of normal stress and shear displacement. Overall, the flow patterns exhibit strong heterogeneity and anisotropy, primarily controlled by the aperture distribution and the connectivity of preferential flow channels.
Under a low normal stress condition (e.g., 2 MPa), fractures retain relatively large apertures and a greater proportion of open void space. The main flow channels are wide and continuous, enabling most of the fluid to concentrate in several dominant pathways with high velocity magnitudes. In these cases, the influence of surface roughness on the global flow pattern is relatively minor, although rougher fractures tend to show more dispersed streamlines and localized eddy zones. As the normal stress increases to 4 MPa and 6 MPa, the reduction in mechanical aperture leads to narrower and more tortuous flow channels. High-velocity zones become fragmented, and fluid is forced to bypass closed or semi-closed regions, increasing the sinuosity of flow paths. Under these stress levels, surface roughness exerts a stronger control on the flow field: fractures with higher Joint Roughness Coefficient (JRC) values exhibit more pronounced flow separation and localized stagnation zones, which reduce the overall hydraulic efficiency. When the normal stress reaches 8 MPa, the flow channels are substantially constricted, and the continuity of high-velocity pathways is significantly disrupted. In smoother fractures, flow is still concentrated in a limited number of preferential channels, whereas in rougher fractures, the flow field becomes highly scattered, with numerous small-scale vortices and low-velocity pockets. These localized zones of reduced velocity can markedly increase hydraulic resistance, leading to a further decline in permeability.
Shear displacement also plays a critical role in shaping the flow field. At small displacements, the flow structure largely follows the initial aperture distribution determined by the contact geometry of the fracture surfaces. As shear displacement increases, mismatches between the opposing fracture walls generate new void spaces and alter the connectivity of existing channels. In smoother fractures, shear tends to promote the expansion of a few dominant channels, enhancing overall flow capacity. In contrast, in rougher fractures, shear-induced dilation creates a more complex network of secondary channels, dispersing the flow and increasing spatial variability in velocity distribution.
These observations indicate that the hydraulic behavior of rough fractures is the result of coupled effects from normal stress, shear displacement, and surface roughness. Low normal stress and moderate shear promote the formation of continuous high-velocity channels, whereas high normal stress and high roughness tend to produce fragmented and tortuous flow paths. The heterogeneity observed in the flow field distribution is intrinsically linked to the underlying fracture aperture structure. Variations in aperture not only dictate the width and connectivity of preferential flow channels but also control the degree of flow concentration and dispersion within the fracture. Therefore, to further clarify the mechanisms behind the observed hydraulic responses, the next section focuses on the statistical evolution of aperture distribution under different combinations of normal stress, shear displacement, and surface roughness. By examining how these factors reshape the aperture frequency curves, we can better explain the flow field patterns presented in Figure 7, Figure 8, Figure 9 and Figure 10 and quantify their impact on permeability.

4.2. Evolution of Fracture Aperture Distribution

Fracture aperture is a key parameter governing fluid transport in fractured rock masses. Larger apertures generally correspond to lower flow resistance and thus higher permeability, whereas smaller or irregular apertures may lead to localized stagnation or turbulence, thereby reducing overall permeability. A well-established power-law relationship exists between fracture permeability and aperture, reflecting the nonlinear nature of this dependence—permeability increases disproportionately with increasing aperture. Natural fracture apertures often exhibit considerable heterogeneity, and their spatial distribution critically influences fluid flow behavior. Fluids tend to migrate more rapidly through wider openings, while narrower zones may impede flow or induce localized retention, resulting in pronounced spatial variability in permeability. The evolution of fracture aperture is governed by both normal and shear stresses. While normal stress primarily alters the mechanical aperture by compressing the fracture uniformly, shear stress not only affects the mechanical aperture but also modifies its spatial distribution due to mismatched fracture surface profiles induced by shear displacement.
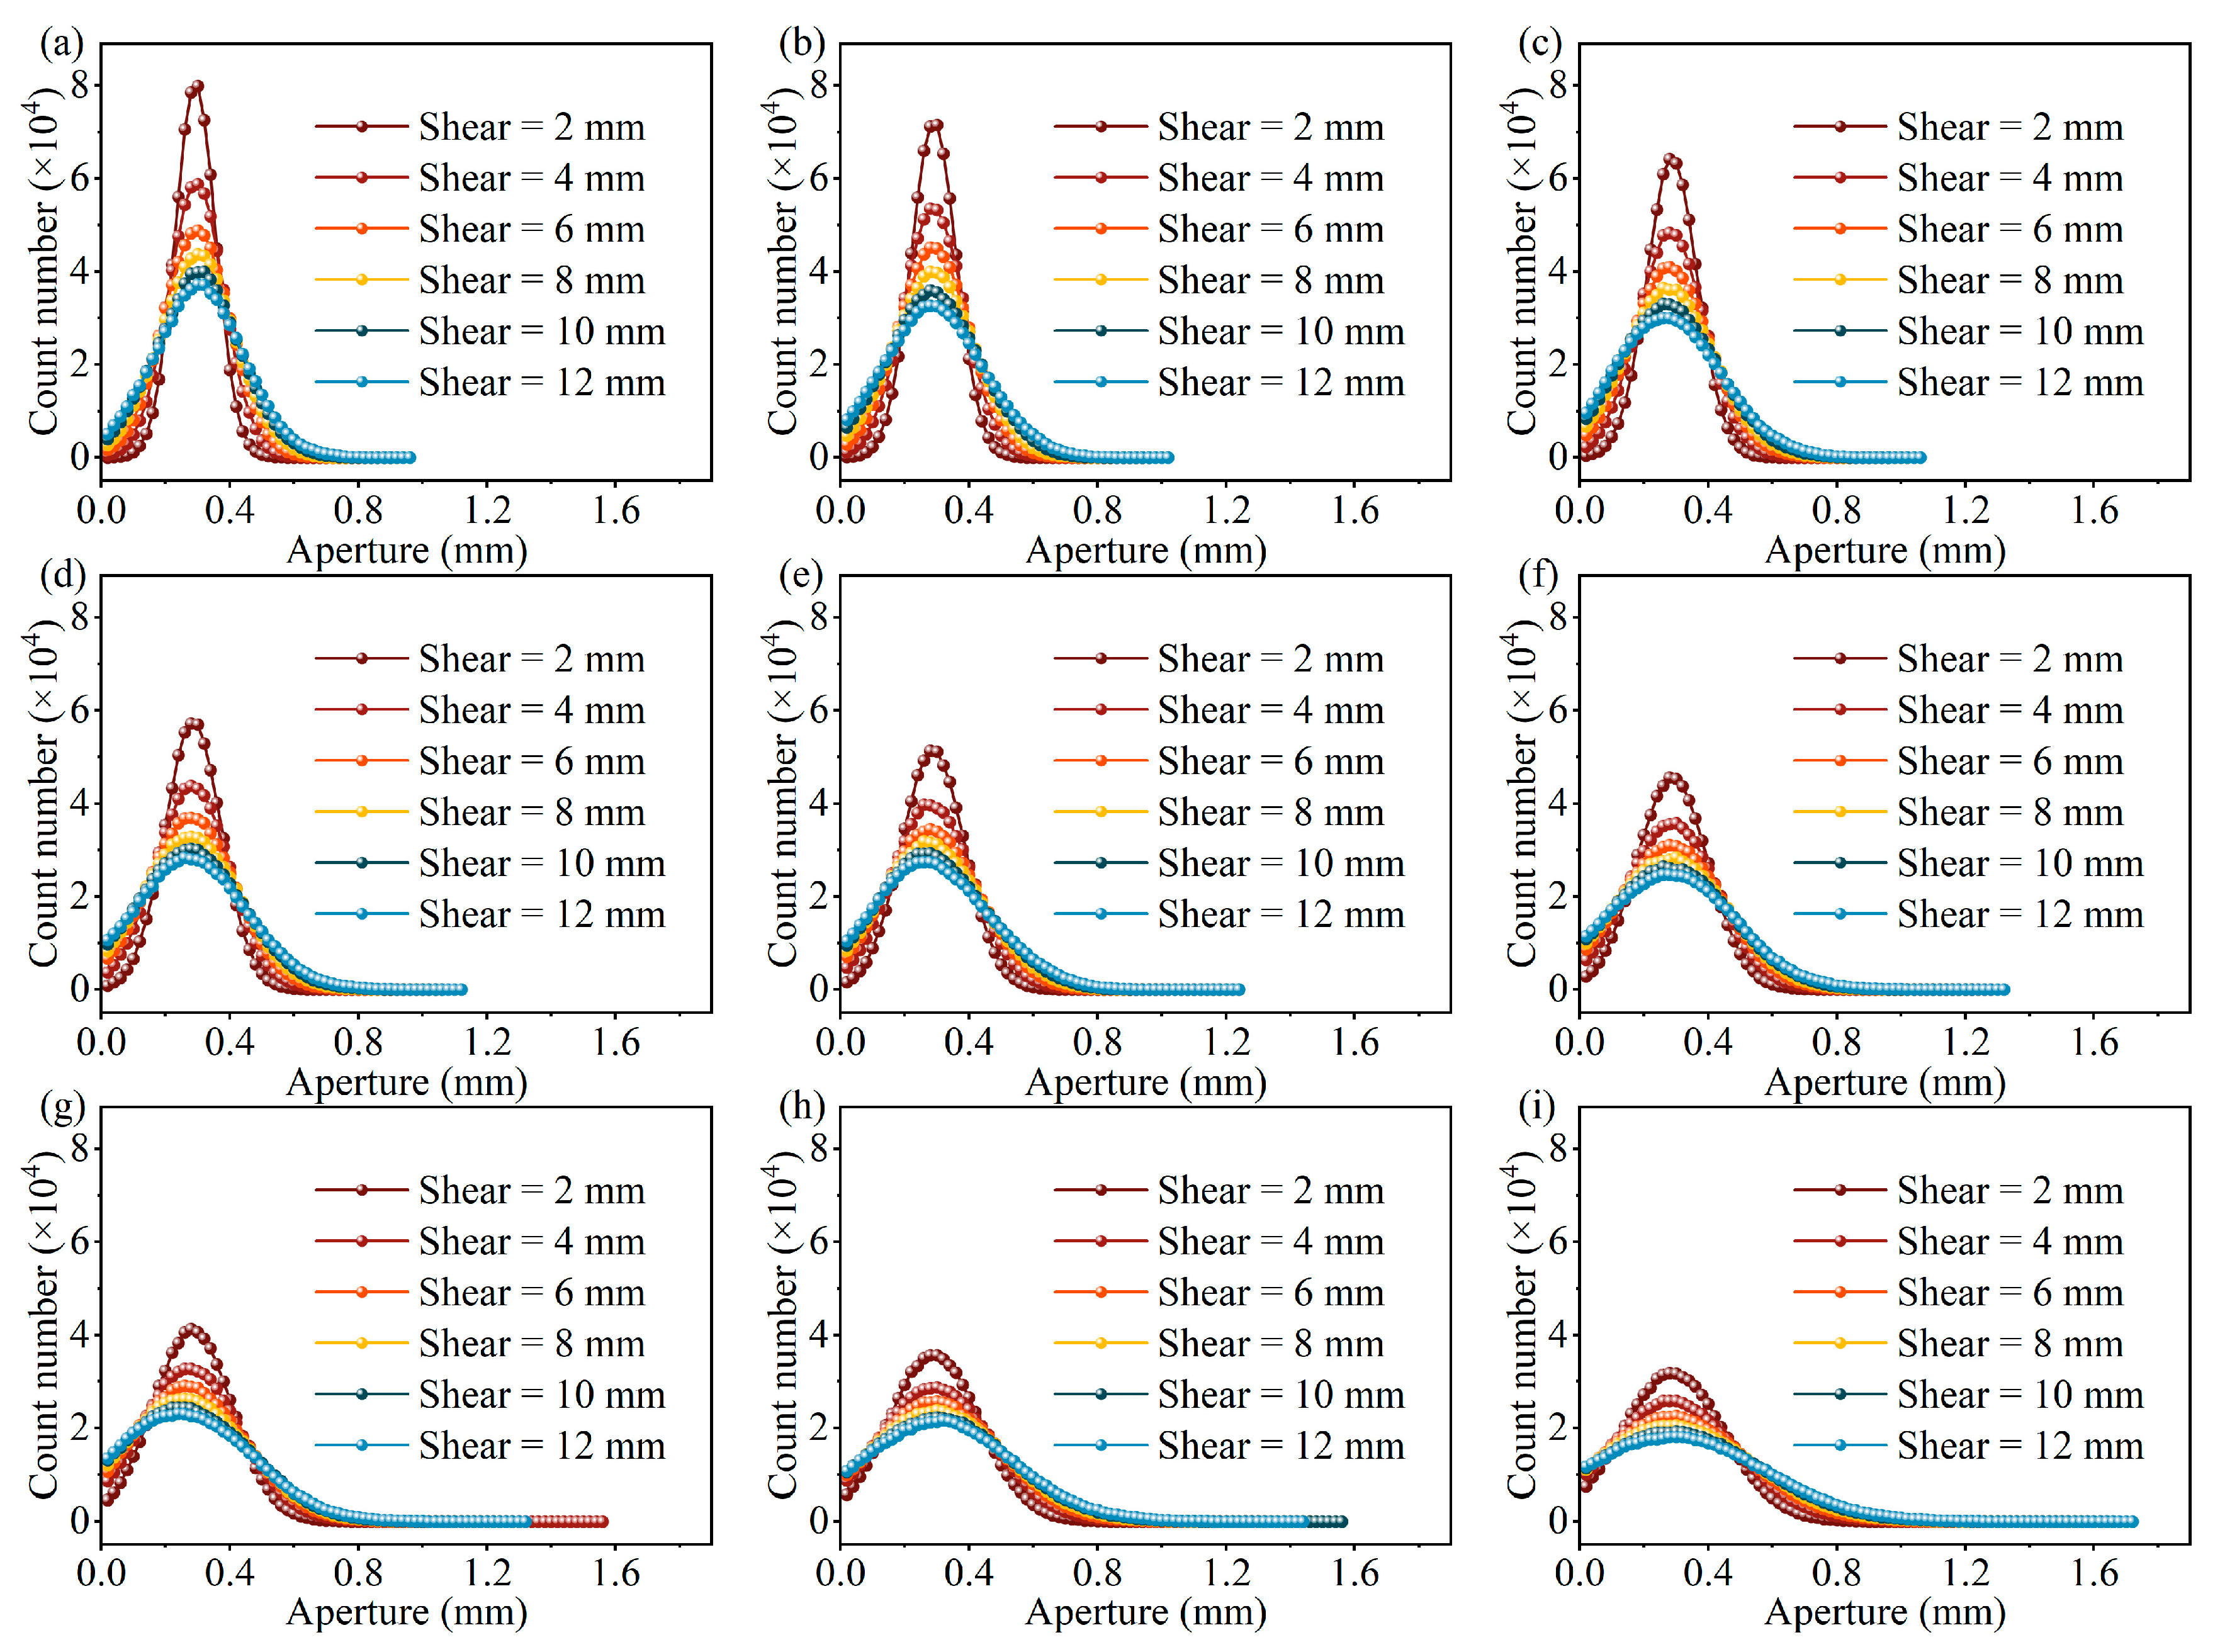
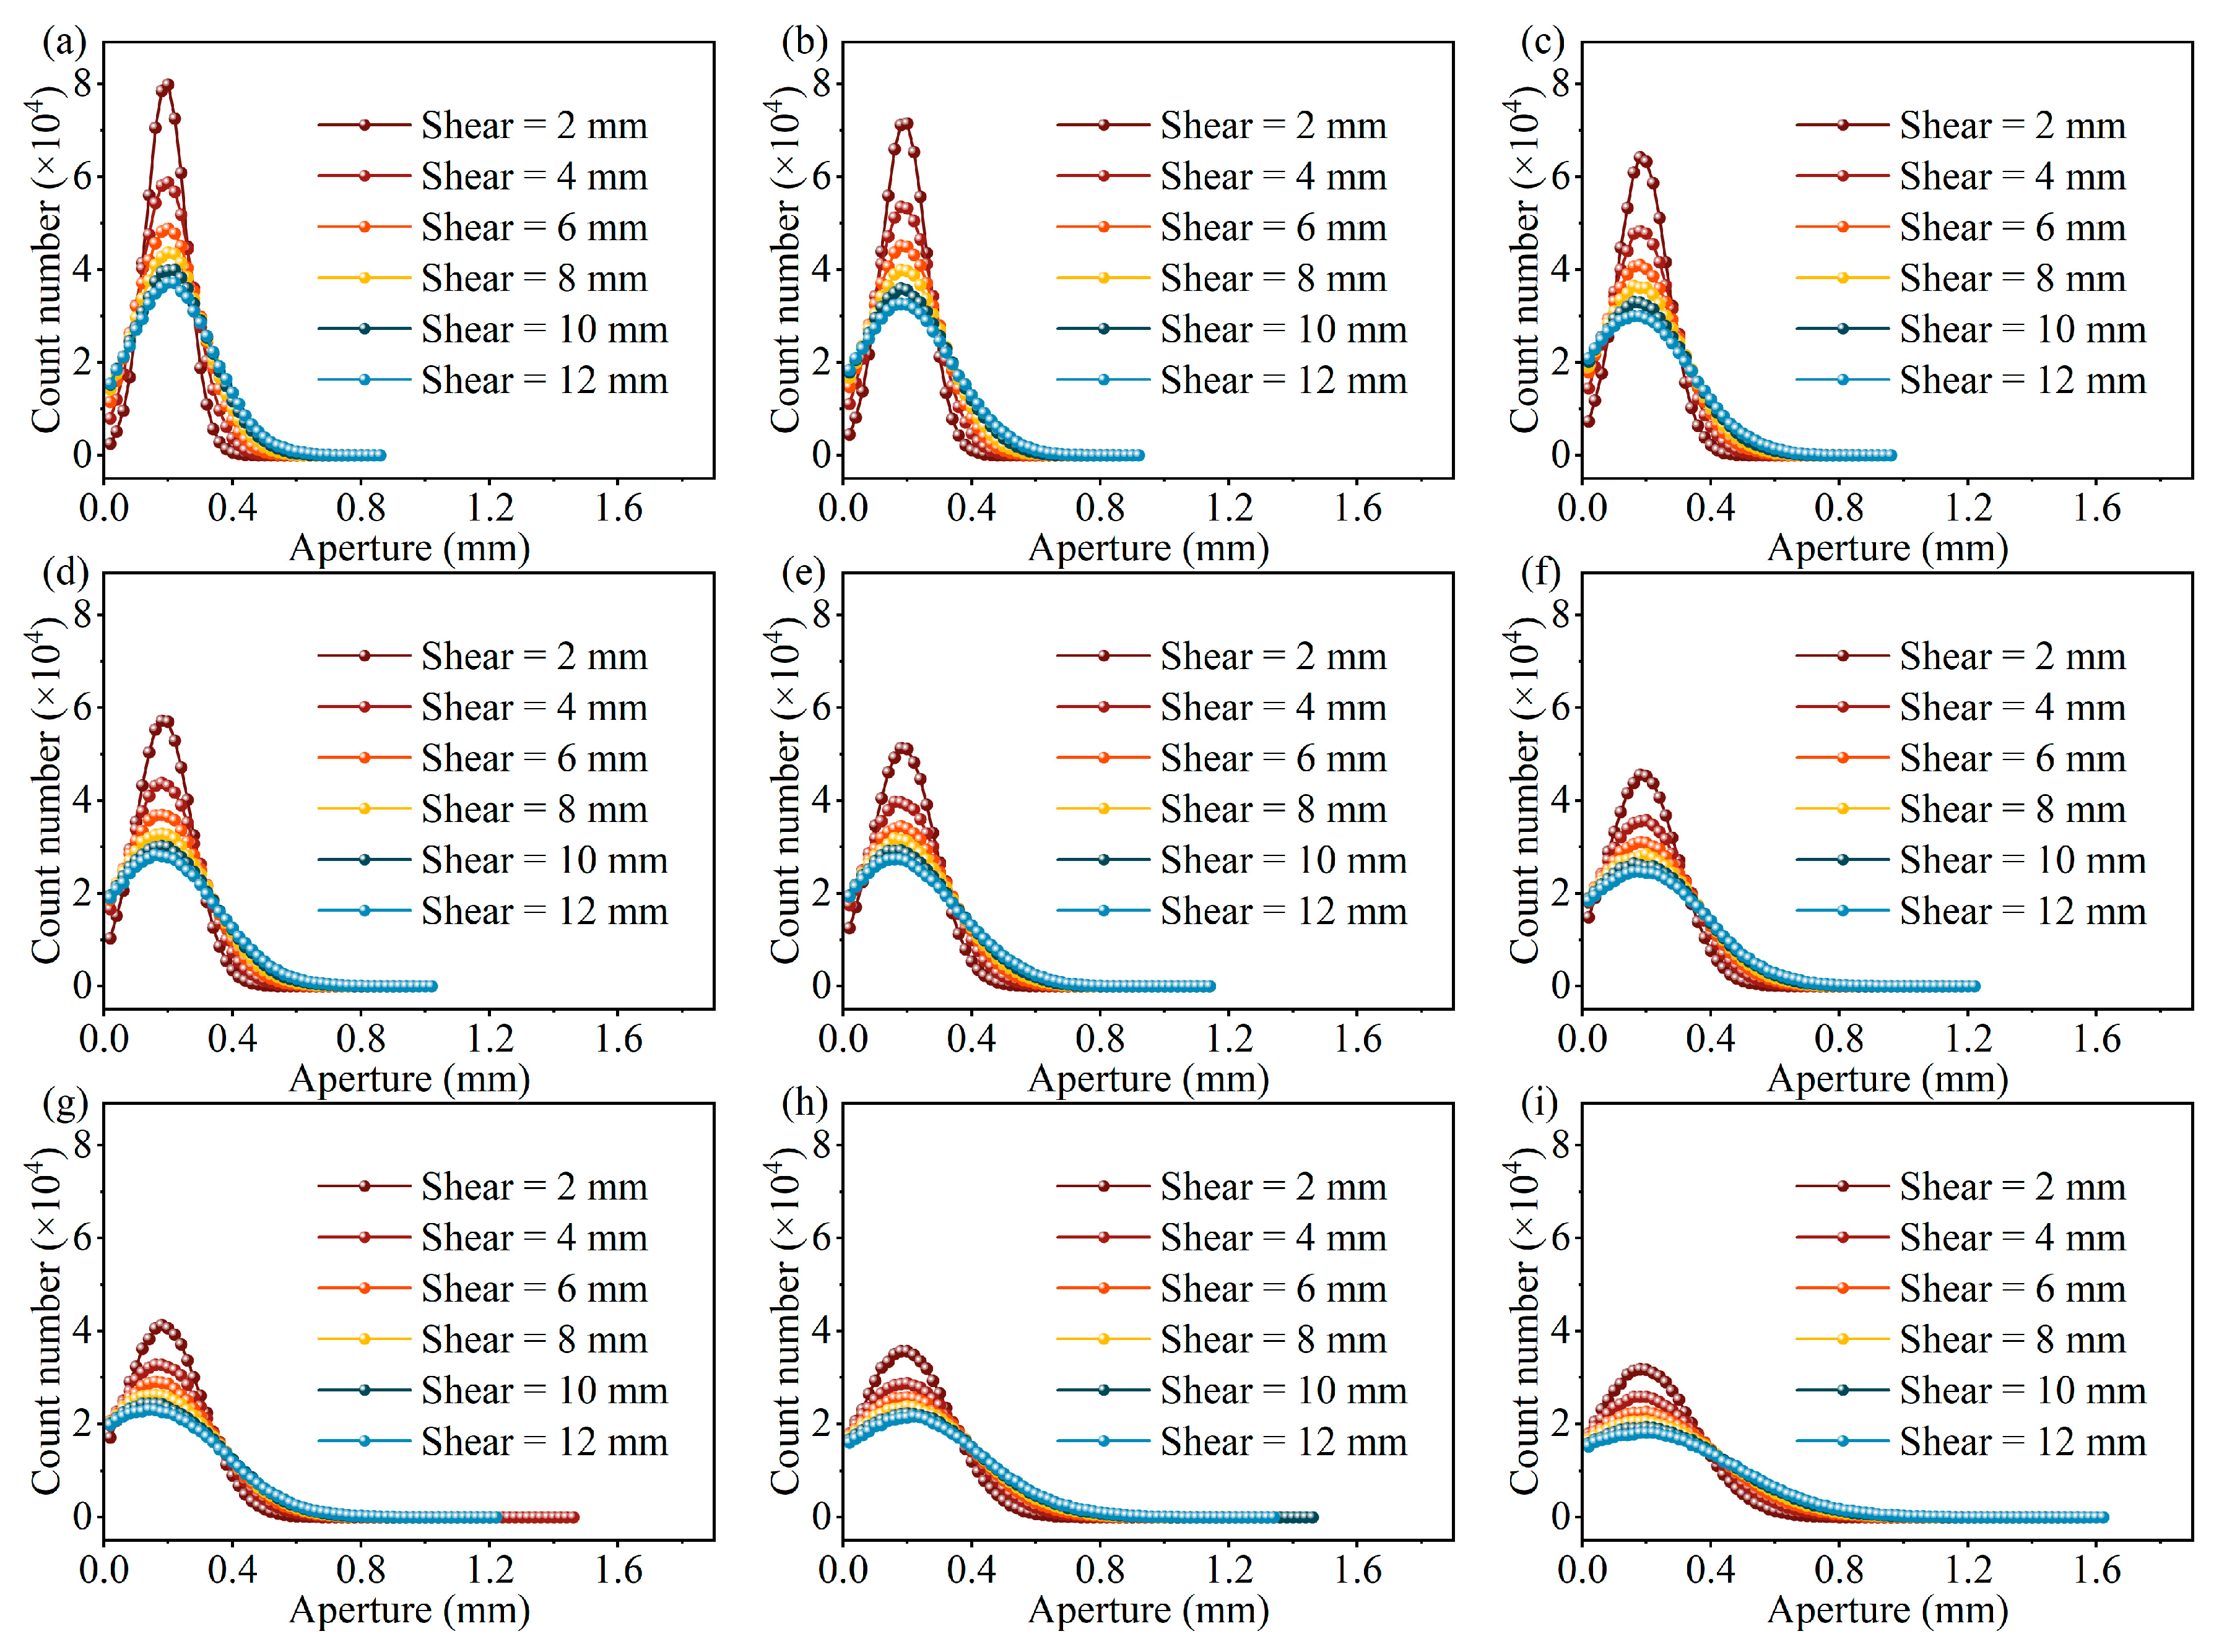
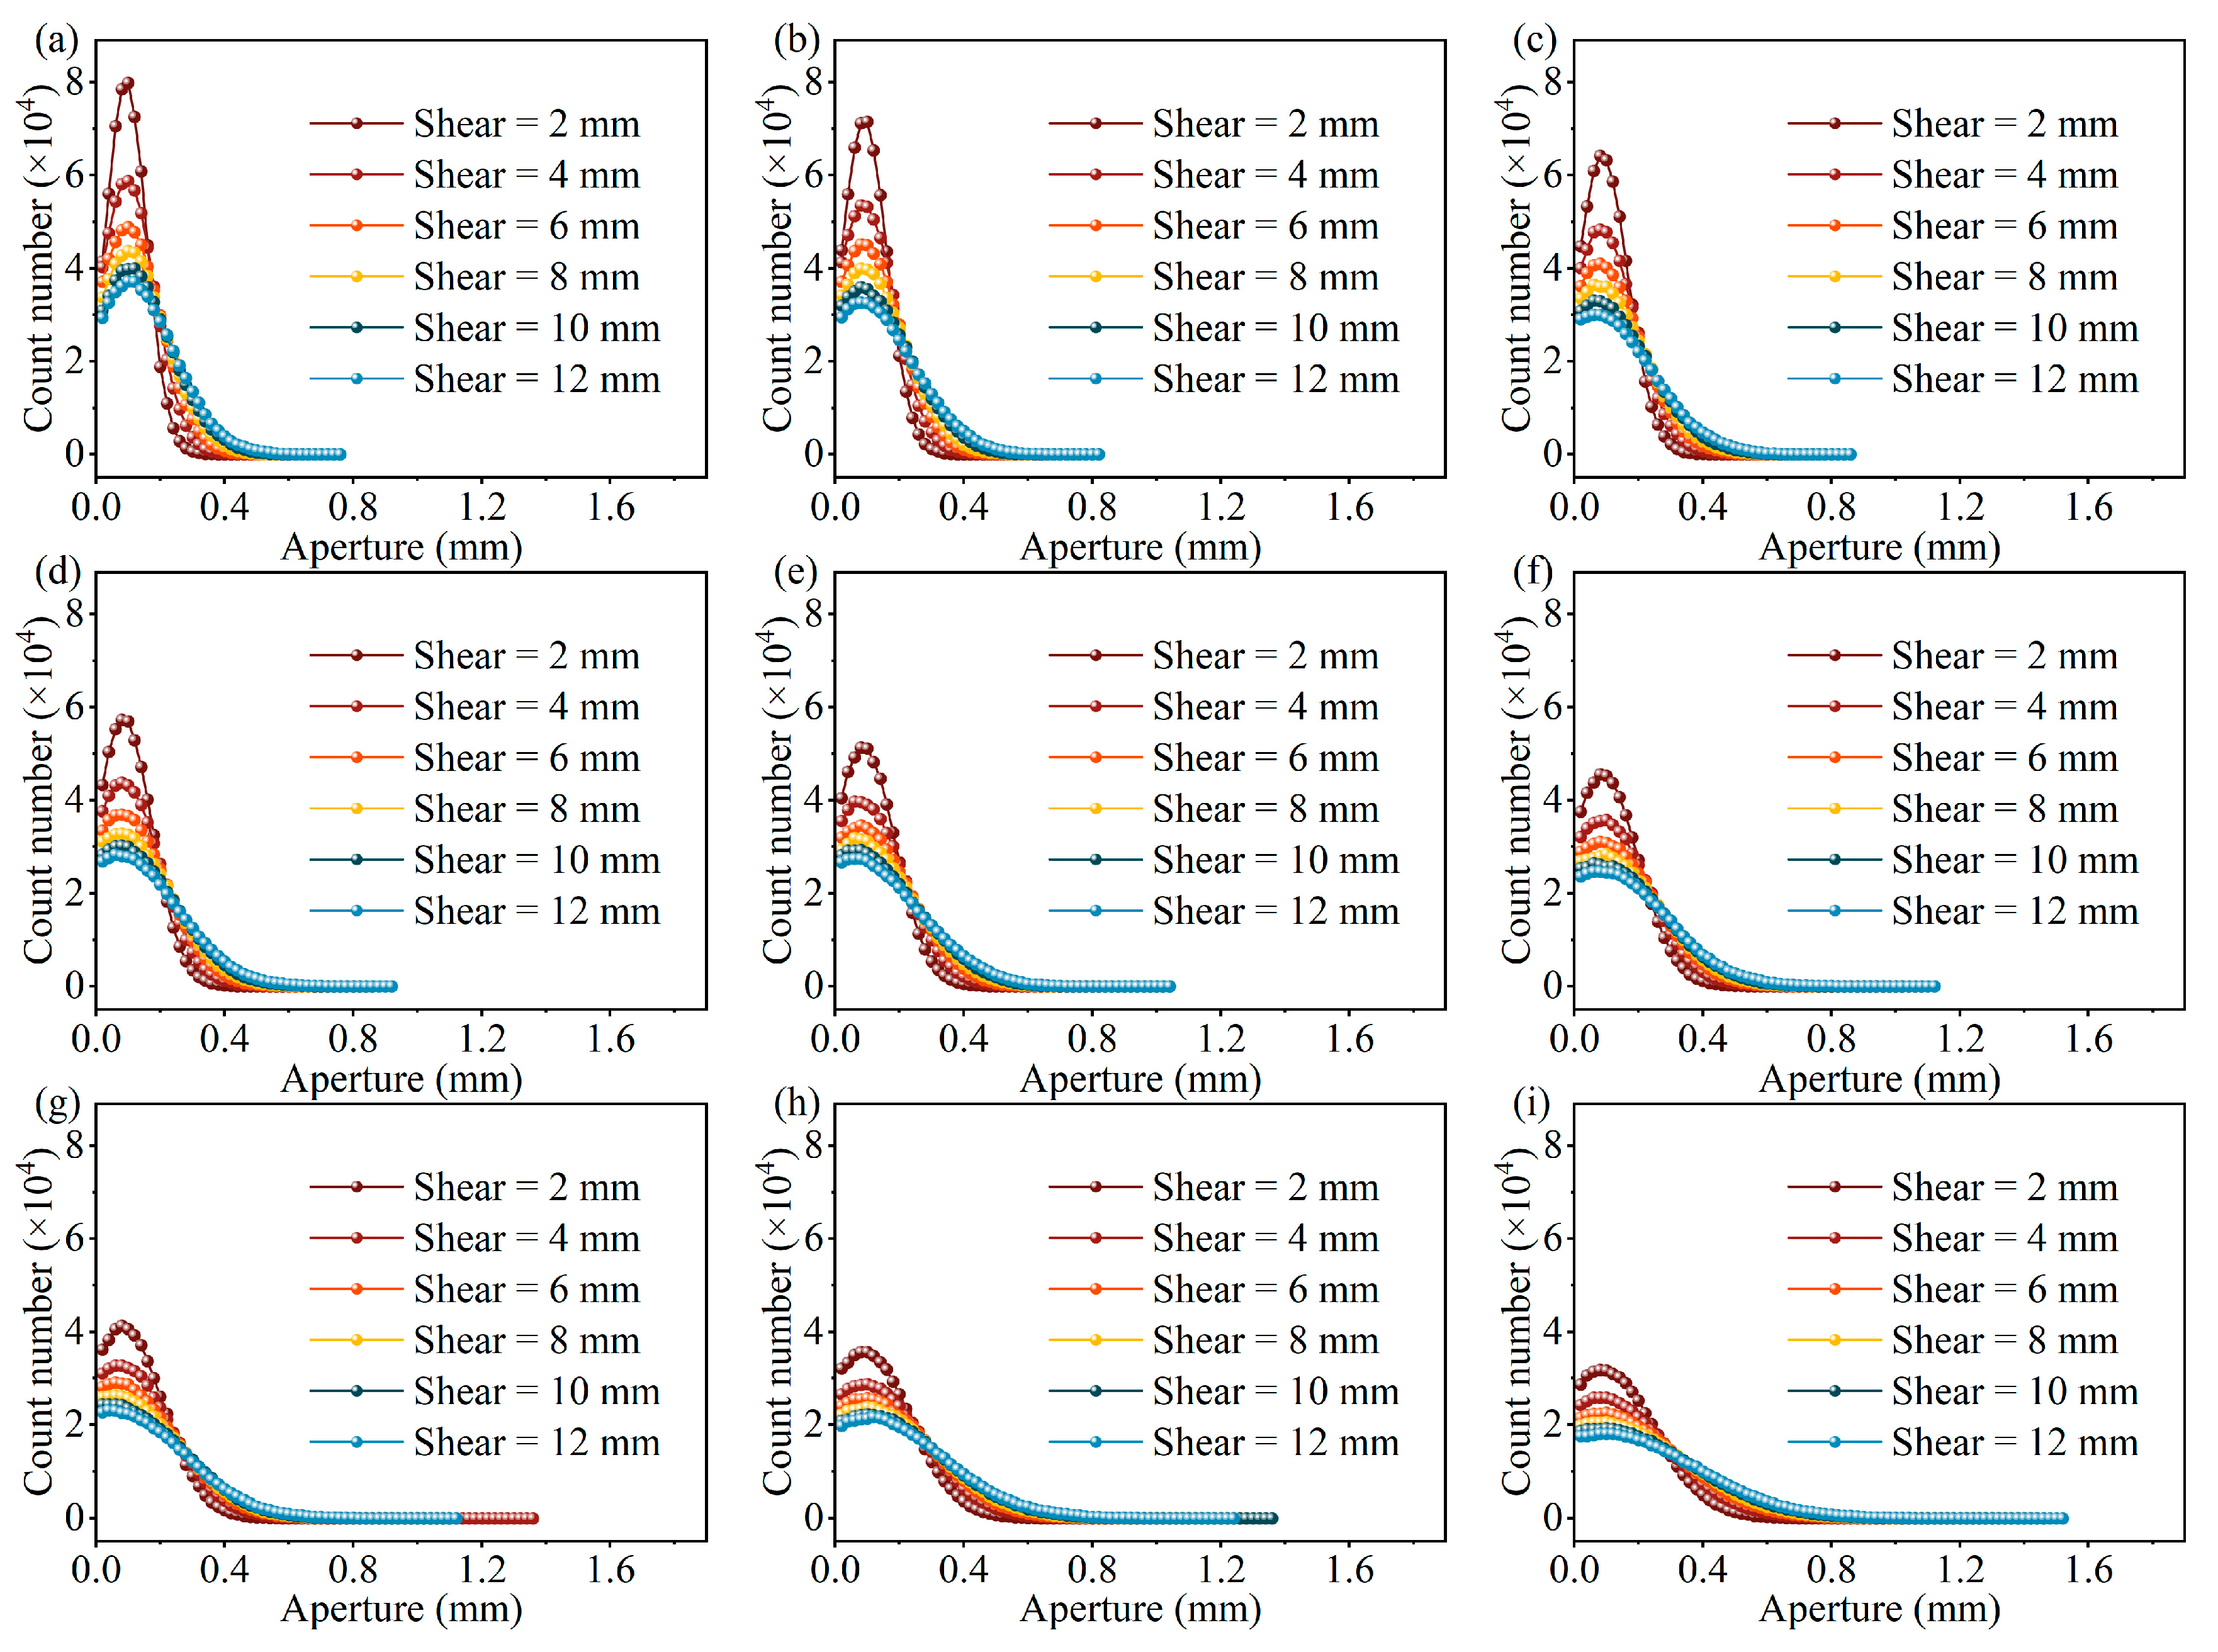
Figure 11, Figure 12, Figure 13 and Figure 14 illustrate the evolutionary trends in fracture aperture distribution under varying normal stress, shear displacement, and surface roughness conditions. The aperture–frequency curves corresponding to the same Joint Roughness Coefficient (JRC), as shown in these figures, exhibit similar overall shapes. However, both the peak frequency and the range of fracture apertures decrease with increasing normal stress, indicating that higher normal stress leads to a more anisotropic distribution of apertures, While the peak values of surface asperities remain relatively constant under varying normal stress levels, the mechanical aperture decreases significantly with increasing normal stress. Consequently, the ratio between asperity height and mechanical aperture becomes more pronounced, thereby enhancing the anisotropy in the aperture distribution. As shown in Figure 7, Figure 8 and Figure 9, the increase in normal stress induces a more anisotropic aperture distribution, a lower peak frequency, and a reduced aperture range. These changes, in turn, constrict the primary flow channels and thereby manifest as more tortuous streamlines within the fracture. Moreover, across all fracture models, the aperture distribution transitions from a sharp, peaked shape to a flatter profile as shear displacement increases. This shift is accompanied by increases in both mechanical aperture and standard deviation, reflecting enhanced variability and dilation of the fracture under shear loading. This mechanical evolution directly influences the fluid flow, as evidenced in Figure 7, Figure 8 and Figure 9, by significantly altering the connectivity of flow channels and increasing the complexity of streamlines.
A comparison of the sub-figures in Figure 11, Figure 12, Figure 13 and Figure 14—each representing fractures with different surface roughness but subjected to the same normal stress and shear displacement—reveals that fracture surface roughness has minimal influence on the effect of normal stress on aperture distribution. However, increased surface roughness does reduce the concentration of aperture distribution and elevates the mean aperture. In other words, the rougher the fracture surface, the more pronounced the effect of shear displacement on aperture evolution. For instance, as illustrated in Figure 11, all sub-figures (a–i) correspond to a constant normal stress of 7 MPa and an initial aperture of 0.1 mm. When shear displacement is applied, notable differences emerge. In the case of a relatively smooth fracture (JRC = 2.01, Figure 11a), over half of the apertures fall within the range of 2.5 mm to 4.5 mm. In contrast, for a rougher fracture (JRC = 17.93, Figure 11i), more than half of the apertures are distributed within a broader range of 2.0 mm to 5.0 mm. This suggests that greater surface roughness leads to wider aperture distribution under shear displacement, thereby enhancing shear-induced dilation. As shown in Figure 7, Figure 8 and Figure 9, surface roughness amplifies the shear-induced reorganization of flow channels. The resulting redistribution of streamlines and flow velocities is therefore significantly more pronounced in fractures with higher roughness.

4.3. Evolution of Mechanical Aperture

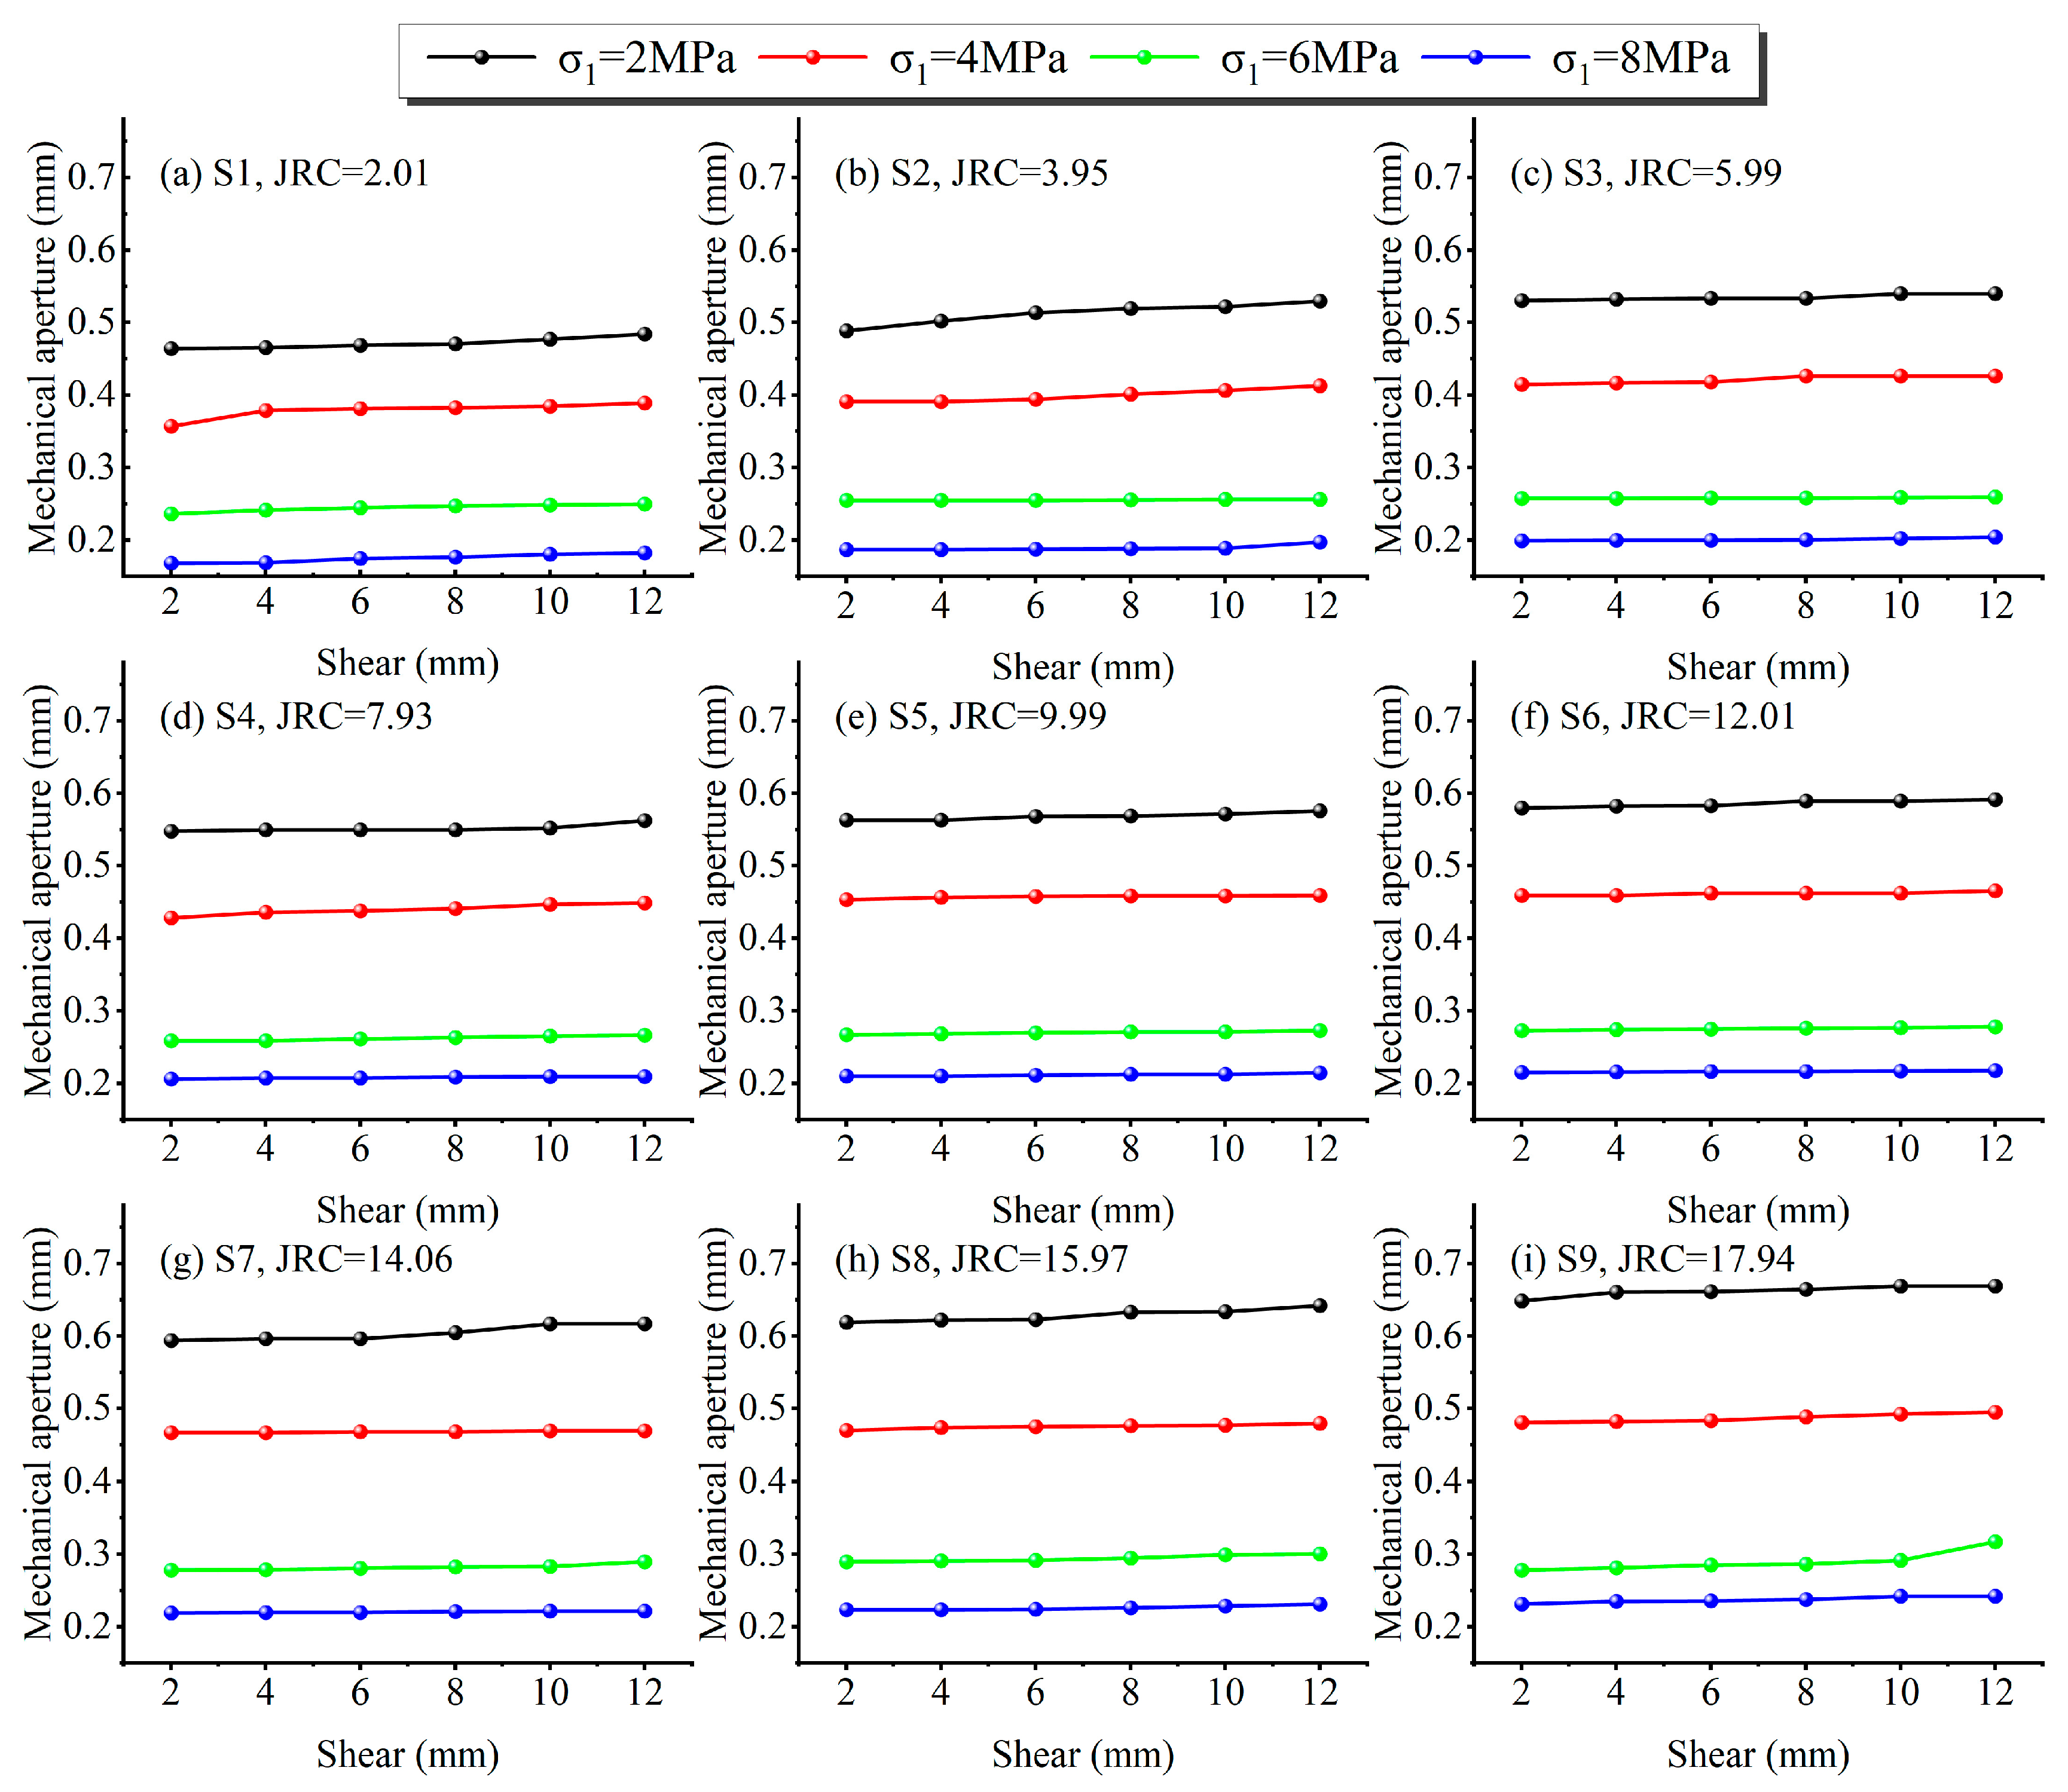
Figure 15 illustrates the evolution of mechanical aperture with shear displacement under varying surface roughness and normal stress conditions. As shear displacement increases, the mechanical aperture expands variably across fractures with different roughness characteristics. Under low normal stress conditions, the aperture gradually increases with greater surface roughness. Conversely, elevated normal stress leads to a notable reduction in mechanical aperture, particularly in highly rough fractures, thereby diminishing the discrepancy in aperture among fractures with differing roughness levels. These findings indicate that while shear displacement enhances mechanical aperture dilation, this effect is progressively attenuated under increasing normal stress.

5. Predict Model for Fracture Permeability Estimate

In this study, a total of six sets of shear-classified experimental data were obtained. Among them, four sets (shear = 4, 6, 8, 10 mm) were used to establish the predictive model, while the remaining two sets (shear = 2, 12 mm)) were reserved to validate the model’s predictive accuracy and reliability. This approach ensures that the model fitting is based on representative shear conditions, while also enabling the assessment of its generalization capability and applicability to unseen shear scenarios.

5.1. Predict Model Construction

Generally, a larger JRCm, lower normal stress, and greater shear displacement tend to result in a higher bm, thereby leading to a larger K. The effects of JRCm, normal stress, and shear displacement on K can be quantitatively reflected through the variation of bm. Based on the above analysis and fitting results, the following empirical expression is proposed to predict K:
K = 7.917 × 10 8 b 2.007 exp ( 0.0049 J R C m )
As shown in Figure 16, the corresponding fitting equation and correlation coefficient indicate that the selected mathematical model is suitable for capturing the influence of contact ratio on fracture permeability.

5.2. Predict Model Validation

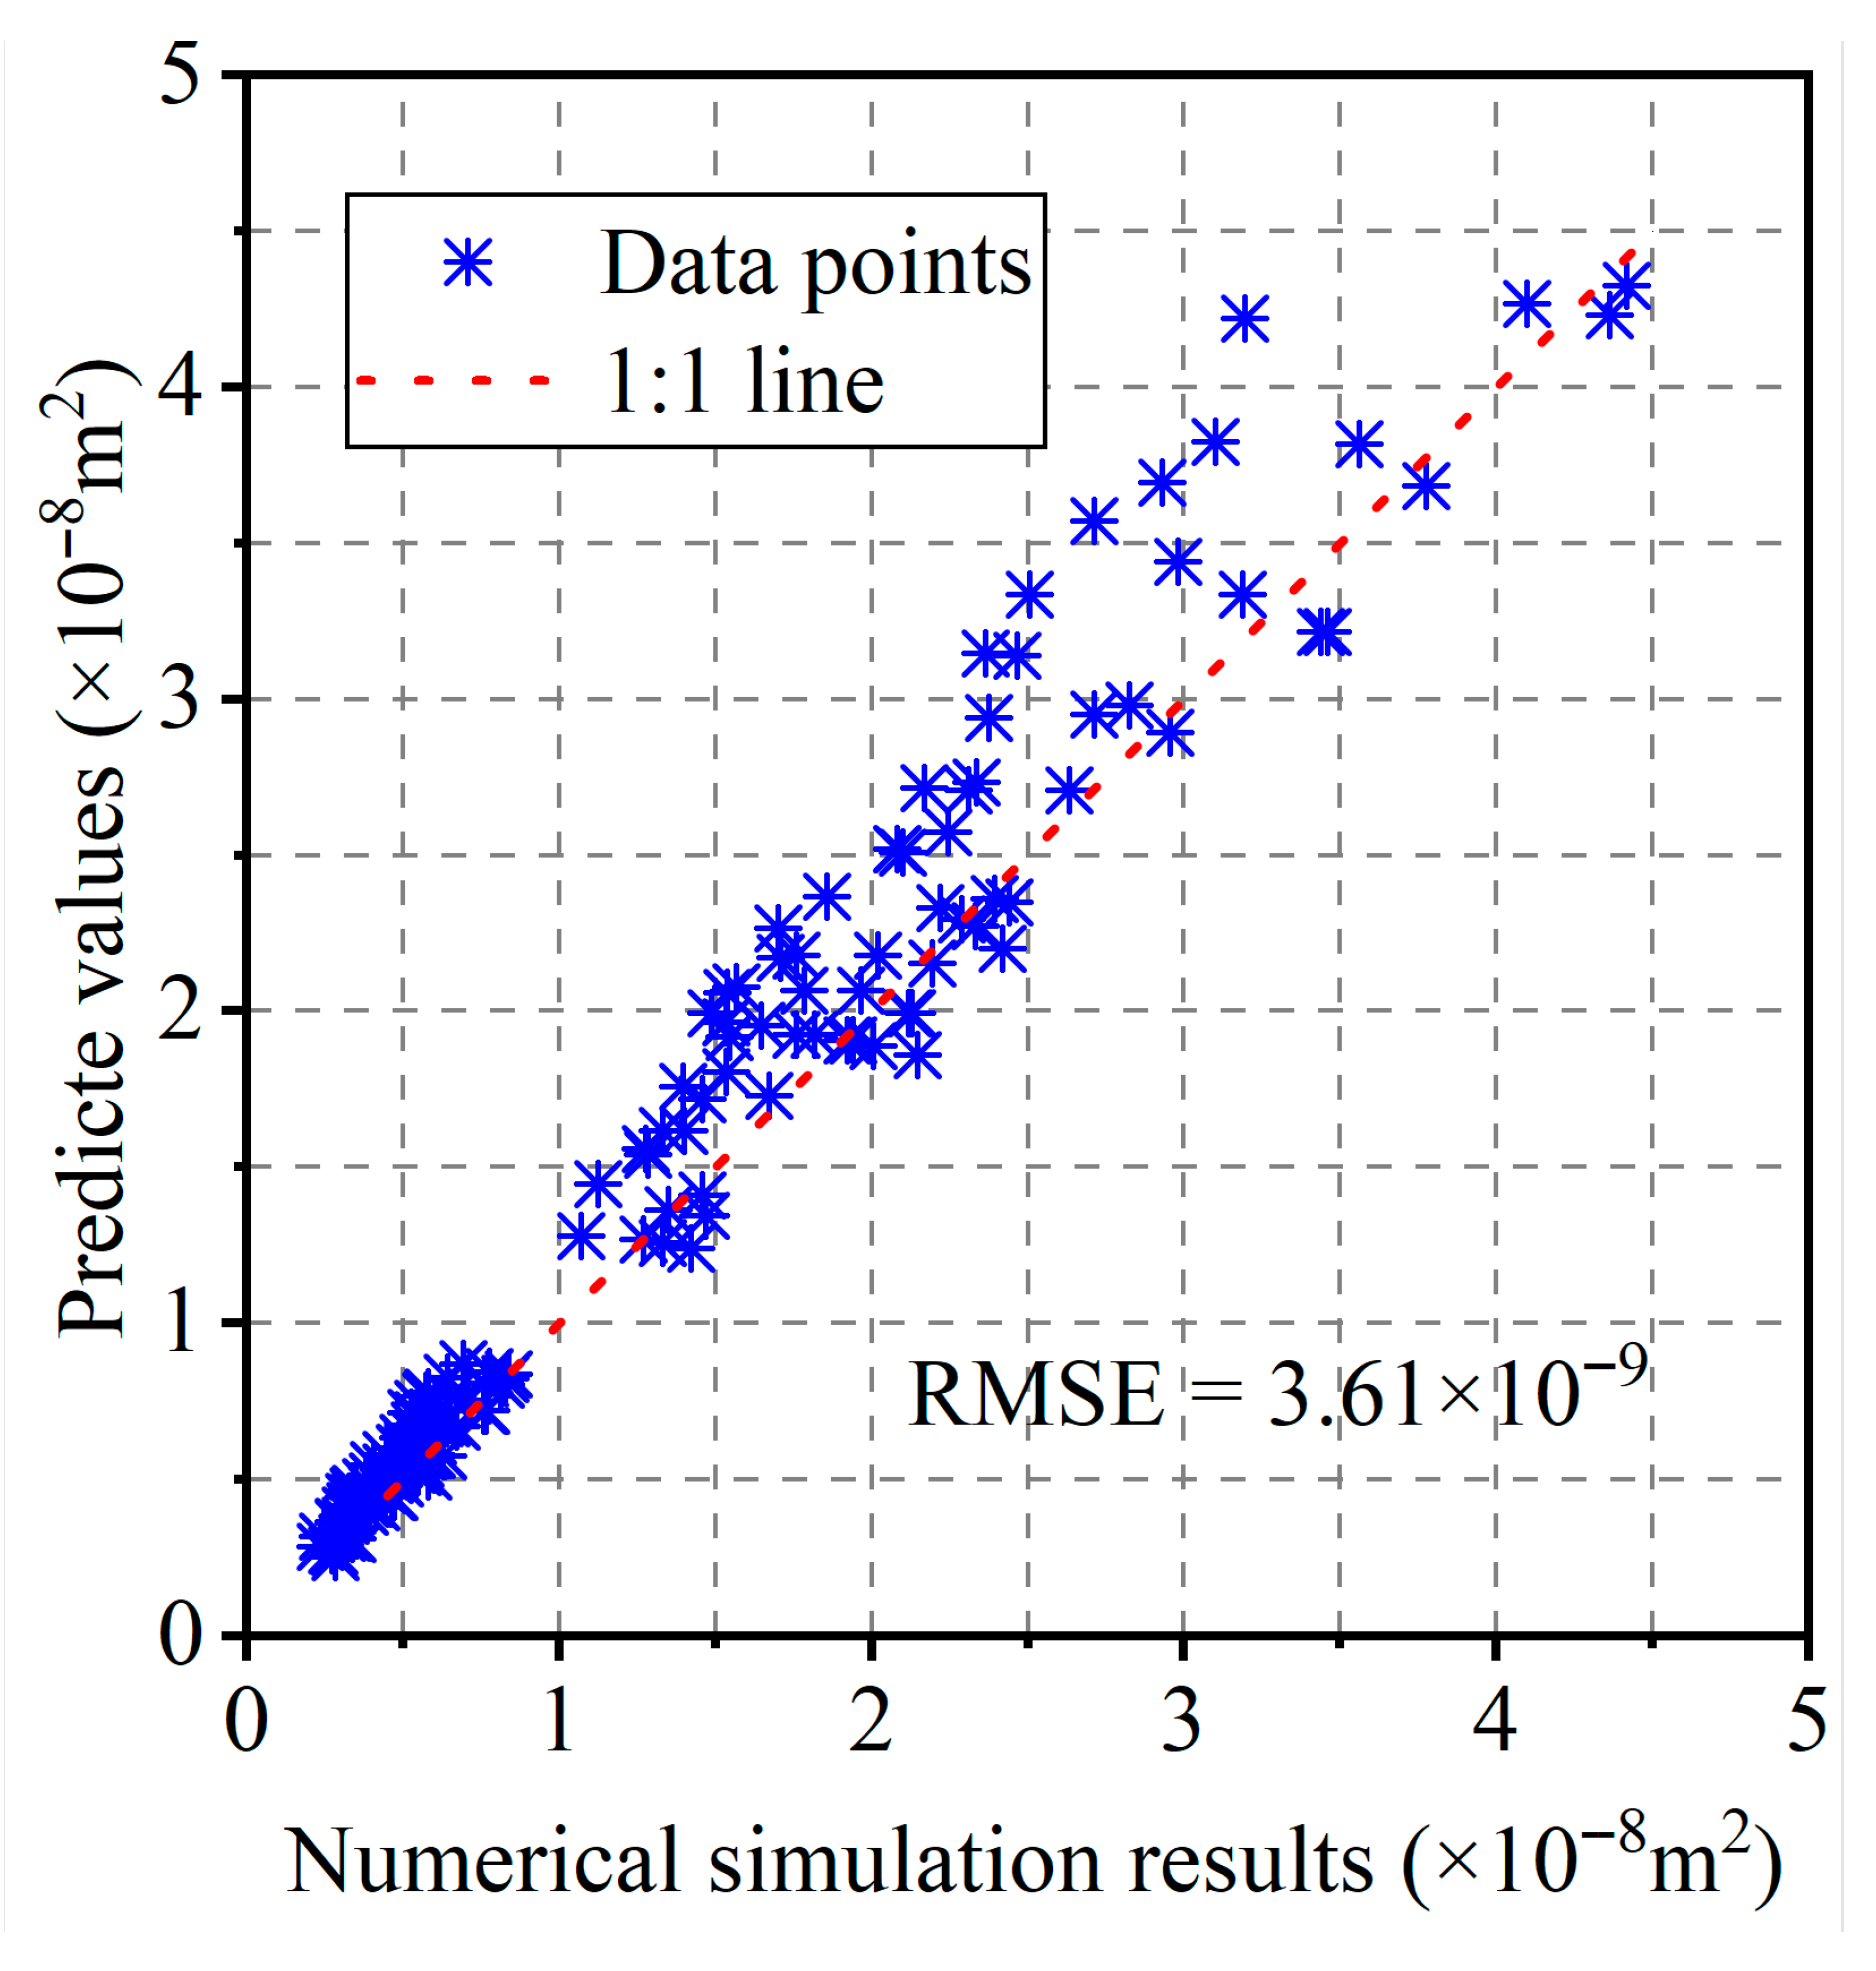
Four model sets (shear = 4, 6, 8, and 10 mm) were used to establish the predictive model, while the remaining two sets (shear = 2 mm and 12 mm) were employed to validate its predictive accuracy and reliability. Figure 17 compares the permeability of the fracture model obtained by numerical simulation and the predicted model. The consistency of the discrete point and fitting curved surface indicate that the mathematical equation can predict the permeability reasonably well. The correlation coefficient R2 = 0.9 verifies this as well.
Based on the plotted scatter plot results, the observed and predicted values exhibit a strong overall linear correlation, with the majority of data points distributed near the 1:1 reference line. This indicates that the formula used provides high predictive accuracy for permeability. The calculated root means square error (RMSE) of 2.13 × 10⁻⁹ is relatively small, further confirming that the discrepancy between the model’s predictions and the actual measured values is minimal. These results demonstrate the model’s strong applicability and reliability.

6. Conclusions

A series of hydro-mechanical fluid dynamics simulations were conducted to investigate fluid flow behavior in fractures under the influence of shear displacement and normal stress. A new permeability prediction model was developed that accounts for fracture aperture heterogeneity and surface roughness. The main findings are as follows:
(1) The hydraulic behavior of rough fractures is the result of coupled effects from normal stress, shear displacement, and surface roughness. Low normal stress and moderate shear promote the formation of continuous high-velocity channels, whereas high normal stress and high roughness tend to produce fragmented and tortuous flow paths.
(2) Both the frequency and range of larger fracture apertures decrease with increasing normal stress. While the height distribution of surface asperities remains relatively constant under varying normal stress, the mechanical aperture decreases significantly; as the normal stress increased from 2 MPa to 8 MPa, the average mechanical aperture of the fractures decreased by 61% to 65%. Furthermore, the aperture distribution transitions from a sharp, peaked profile to a broader, flatter one as shear displacement increases. Greater surface roughness results in a wider aperture distribution under shear, enhancing shear-induced dilation; as the shear displacement increased from 2 mm to 12 mm, the maximum aperture increased by 23–35% under low-roughness conditions (JRC = 2.01) and by 30–38% under high-roughness conditions (JRC = 17.94), respectively.
(3) Under low normal stress conditions (2 MPa), the mechanical aperture increases gradually with greater surface roughness. High-roughness fractures (JRC = 17.94) exhibited a 31% greater average mechanical aperture compared to low-roughness fractures (JRC = 2.01). In contrast, elevated normal stress leads to a notable reduction in mechanical aperture, particularly in highly rough fractures; high-roughness fractures (JRC = 17.94) demonstrated a 28% to 31% greater reduction in mechanical aperture compared to low-roughness fractures (JRC = 2.01), thereby reducing differences in aperture between fractures with different roughness levels.
(4) The proposed fracture permeability model shows good agreement with measured data, demonstrating strong predictive capability, applicability, and reliability.
The proposed permeability prediction model holds direct practical value for key subsurface challenges: predicting water inflow and fracture-related instability in deep excavations; optimizing reservoir stimulation in enhanced geothermal systems by forecasting shear-induced permeability enhancement; and quantifying contaminant migration in fractured aquifers for improved risk assessment and remediation design.

Author Contributions

Conceptualization, X.H. (Xiaotian Hao) and L.W.; methodology, X.H. (Xiaotian Hao) and L.W.; software, X.H. (Xiaotian Hao) and J.Y.; validation, X.H. (Xiaotian Hao) and L.W.; formal analysis, X.H. (Xiaotian Hao) and L.W.; investigation, X.H. (Xiaotian Hao) and X.H. (Xingji He); resources, L.W.; data curation, X.H. (Xiaotian Hao) and J.Y.; writing—original draft preparation, X.H. (Xiaotian Hao); writing—review and editing, X.H. (Xiaotian Hao) and J.Y.; visualization, X.H. (Xiaotian Hao) and X.H. (Xingji He); supervision, L.W.; project administration, X.H. (Xiaotian Hao) and J.Y.; funding acquisition, X.H. (Xiaotian Hao) and J.Y. All authors have read and agreed to the published version of the manuscript.

Funding

This research was funded by 2023 Chongqing Open University Chongqing Technology and Business Institute Scientific Research Project-Research on Safety Measures and Engineering Applications of New Tunnels Passing Under Existing Structures (Grant No. NDZD2023-01), Science and Technology Research Program of Chongqing Municipal Education Commission (Grant No. KJQN202404019), and 2024 Chongqing Open University (Chongqing Technology and Business Institute) Scientific Research Project-Research on the Dynamic Response and Mechanical Mechanism of Surrounding Rock in Crossed Heavy-load Tunnels with Small Spacing (Grant No. 2024BSZZ-001).

Data Availability Statement

The original contributions presented in this study are included in the article. Further inquiries can be directed to the corresponding author.

Conflicts of Interest

The authors declare no conflicts of interest.

References

  1. Luo, Y.; Zhang, Z.; Zhang, L.; Xue, K.; Long, K. Influence of fracture roughness and void space morphology on nonlinear fluid flow through rock fractures. Eur. Phys. J. Plus 2022, 137, 1288. [Google Scholar] [CrossRef]
  2. Pu, H.; Xue, K.; Wu, Y.; Zhang, S.; Liu, D.; Xu, J. Estimating the permeability of fractal rough rock fractures with variable apertures under normal and shear stresses. Phys. Fluids 2025, 37, 036635. [Google Scholar] [CrossRef]
  3. Xue, K.; Pu, H.; Li, M.; Luo, P.; Liu, D.; Yi, Q. Fractal-based analysis of stress-induced dynamic evolution in geometry and permeability of porous media. Phys. Fluids 2025, 37, 036630. [Google Scholar] [CrossRef]
  4. Tóth, E.; Hrabovszki, E.; Schubert, F.; Tóth, T.M. Discrete fracture network (DFN) modelling of a high-level radioactive waste repository host rock and the effects on its hydrogeological behaviour. J. Struct. Geol. 2022, 156, 104556. [Google Scholar] [CrossRef]
  5. Zhang, X.; Ma, F.; Yin, S.; Wallace, C.D.; Soltanian, M.R.; Dai, Z.; Ritzi, R.W.; Ma, Z.; Zhan, C.; Lü, X. Application of upscaling methods for fluid flow and mass transport in multi-scale heterogeneous media: A critical review. Appl. Energy 2021, 303, 117603. [Google Scholar] [CrossRef]
  6. Cardona, A.; Finkbeiner, T.; Santamarina, J.C. Natural Rock Fractures: From Aperture to Fluid Flow. Rock Mech. Rock Eng. 2021, 54, 5827–5844. [Google Scholar] [CrossRef]
  7. Liu, E. Effects of fracture aperture and roughness on hydraulic and mechanical properties of rocks: Implication of seismic characterization of fractured reservoirs. J. Geophys. Eng. 2005, 2, 38–47. [Google Scholar] [CrossRef]
  8. He, X.; Zhang, Z.; Wang, Y.; Liu, X.; Hao, S. Modeling the relative permeability of gas and water flow in rock fractures with surface morphology parameters. Phys. Fluids 2024, 36, 123305. [Google Scholar] [CrossRef]
  9. Ghorbani, Y.; Nwaila, G.T.; Zhang, S.E.; Bourdeau, J.E.; Cánovas, M.; Arzua, J.; Nikadat, N. Moving towards deep underground mineral resources: Drivers, challenges and potential solutions. Resour. Policy 2023, 80, 103222. [Google Scholar] [CrossRef]
  10. Peng, F.-L.; Dong, Y.-H.; Wang, W.-X.; Ma, C.-X. The next frontier: Data-driven urban underground space planning orienting multiple development concepts. Smart Constr. Sustain. Cities 2023, 1, 3. [Google Scholar] [CrossRef]
  11. Zhang, W.; Gu, X.; Tang, L.; Yin, Y.; Liu, D.; Zhang, Y. Application of machine learning, deep learning and optimization algorithms in geoengineering and geoscience: Comprehensive review and future challenge. Gondwana Res. 2022, 109, 1–17. [Google Scholar] [CrossRef]
  12. Wang, J.; Leung, C. Progress in feature research topics in deep underground. Deep. Undergr. Sci. Eng. 2025, 4, 339–340. [Google Scholar] [CrossRef]
  13. Feng, X.-T.; Yang, C.-X.; Kong, R.; Zhao, J.; Zhou, Y.; Yao, Z.; Hu, L. Excavation-induced deep hard rock fracturing: Methodology and applications. J. Rock Mech. Geotech. Eng. 2022, 14, 1–34. [Google Scholar] [CrossRef]
  14. Li, P.; Xu, Q.; Fang, Q. Deep Rock Mass Engineering: Excavation, Monitoring, and Control. Appl. Sci. 2022, 12, 11721. [Google Scholar] [CrossRef]
  15. Gui, Y.; Yin, Z.; Du, K. Editorial: Deep rock mass engineering: Excavation, monitoring, and control. Front. Earth Sci. 2022, 10, 1047612. [Google Scholar] [CrossRef]
  16. Viswanathan, H.S.; Ajo-Franklin, J.; Birkholzer, J.T.; Carey, J.W.; Guglielmi, Y.; Hyman, J.D.; Karra, S.; Pyrak-Nolte, L.J.; Rajaram, H.; Srinivasan, G.; et al. From Fluid Flow to Coupled Processes in Fractured Rock: Recent Advances and New Frontiers. Rev. Geophys. 2022, 60, e2021RG000744. [Google Scholar] [CrossRef]
  17. Zhou, C.-B.; Chen, Y.-F.; Hu, R.; Yang, Z. Groundwater flow through fractured rocks and seepage control in geotechnical engineering: Theories and practices. J. Rock Mech. Geotech. Eng. 2023, 15, 1–36. [Google Scholar] [CrossRef]
  18. Yu, L.; Liu, R.; Jiang, Y. A Review of Critical Conditions for the Onset of Nonlinear Fluid Flow in Rock Fractures. Geofluids 2017, 2017, 2176932. [Google Scholar] [CrossRef]
  19. Berkowitz, B. Characterizing flow and transport in fractured geological media: A review. Adv. Water Resour. 2002, 25, 861–884. [Google Scholar] [CrossRef]
  20. Liu, J.; Xie, H.; Li, C.; Hu, J.; Luo, Y.; Liu, B.; Wang, Z. Effect of complex void structures on flow channeling and heterogeneous heat transfer in fractured rocks. J. Hydrol. 2024, 639, 131654. [Google Scholar] [CrossRef]
  21. Xue, K.; Zhang, Z.; Zhong, C.; Jiang, Y.; Geng, X. A fast numerical method and optimization of 3D discrete fracture network considering fracture aperture heterogeneity. Adv. Water Resour. 2022, 162, 104164. [Google Scholar] [CrossRef]
  22. Develi, K.; Babadagli, T. Experimental and visual analysis of single-phase flow through rough fracture replicas. Int. J. Rock Mech. Min. Sci. 2015, 73, 139–155. [Google Scholar] [CrossRef]
  23. Gudala, M.; Govindarajan, S.K. Numerical modelling of coupled single-phase fluid flow and geomechanics in a fractured porous media. J. Pet. Sci. Eng. 2020, 191, 107215. [Google Scholar] [CrossRef]
  24. Al-Yaari, A.; Ching, D.L.C.; Sakidin, H.; Muthuvalu, M.S.; Zafar, M.; Haruna, A.; Merican, Z.M.A.; Yunus, R.B.; Al-dhawi, B.N.S.; Jagaba, A.H. The effects of nanofluid thermophysical properties on enhanced oil recovery in a heterogenous porous media. Case Stud. Chem. Environ. Eng. 2024, 9, 100556. [Google Scholar] [CrossRef]
  25. Xu, C.; Dong, S.; Wang, H.; Wang, Z.; Xiong, F.; Jiang, Q.; Zeng, L.; Faulkner, L.; Tian, Z.F.; Dowd, P. Modelling of Coupled Hydro-Thermo-Chemical Fluid Flow through Rock Fracture Networks and Its Applications. Geosciences 2021, 11, 153. [Google Scholar] [CrossRef]
  26. Liu, X.; Chen, D.; Li, M.; Li, Y.; Yang, X. Characteristics of Fluid Flow and Solute Transport in Multicrossed Rough Rock Fractures Based on Three-Dimensional Simulation. IOP Conf. Ser. Earth Environ. Sci. 2021, 861, 072095. [Google Scholar] [CrossRef]
  27. Huang, N.; Wang, X.; Jiang, Y.; Zhang, Y.; Zhuang, Y. Experimental and numerical studies on fluid flow through fractured rock masses based on an enhanced three-dimensional discrete fracture network model. J. Contam. Hydrol. 2025, 273, 104582. [Google Scholar] [CrossRef]
  28. Gao, M.; Zhang, C.; Oh, J. Assessments of the effects of various fracture surface morphology on single fracture flow: A review. Int. J. Min. Sci. Technol. 2023, 33, 1–29. [Google Scholar] [CrossRef]
  29. Zou, Q.; Luo, G. Geometric Modeling for Microstructure Design and Manufacturing: A Review of Representations and Modeling Algorithms. Comput.-Aided Des. 2025, 180, 103834. [Google Scholar] [CrossRef]
  30. He, X.; Sinan, M.; Kwak, H.; Hoteit, H. A corrected cubic law for single-phase laminar flow through rough-walled fractures. Adv. Water Resour. 2021, 154, 103984. [Google Scholar] [CrossRef]
  31. Trinchero, P.; Zou, L.; de La Iglesia, M.; Iraola, A.; Bruines, P.; Deissmann, G. Experimental and numerical analysis of flow through a natural rough fracture subject to normal loading. Sci. Rep. 2024, 14, 5587. [Google Scholar] [CrossRef]
  32. Landry, C.J.; Prodanović, M.; Karpyn, Z.; Eichhubl, P. Estimation of Fracture Permeability from Aperture Distributions for Rough and Partially Cemented Fractures. Transp. Porous Med. 2024, 151, 689–717. [Google Scholar] [CrossRef]
  33. Magsipoc, E.; Zhao, Q.; Grasselli, G. 2D and 3D Roughness Characterization. Rock Mech. Rock Eng. 2020, 53, 1495–1519. [Google Scholar] [CrossRef]
  34. Kangsheng, X.; Zhenyu, Z.; Xuefeng, H.; Wenfeng, G. A fractal model for estimating the permeability of tortuous fracture networks with correlated fracture length and aperture. Phys. Fluids 2023, 35, 043615. [Google Scholar] [CrossRef]
  35. Yan, Y.; Ma, L.; Qian, J.; Zhao, G.; Fang, Y.; Ma, H.; Wang, J. Estimating permeability of rock fracture based on geometrical aperture using geoelectrical monitoring. J. Hydrol. 2024, 644, 132067. [Google Scholar] [CrossRef]
  36. Huo, J.; Meguid, M.A. Systematic investigation of stress-induced fracture closure and permeability evolution in Lac du Bonnet granite. Int. J. Rock Mech. Min. Sci. 2025, 191, 106113. [Google Scholar] [CrossRef]
  37. Chen, L.; He, A.; Zhao, J.; Kang, Q.; Li, Z.-Y.; Carmeliet, J.; Shikazono, N.; Tao, W.-Q. Pore-scale modeling of complex transport phenomena in porous media. Prog. Energy Combust. Sci. 2022, 88, 100968. [Google Scholar] [CrossRef]
  38. Makki, S.; Yehya, A.; Maalouf, E. Complex Fracture Networks Prohibit Safe Fracturing Fluid Recovery. Eng. Rep. 2025, 7, e70036. [Google Scholar] [CrossRef]
  39. Gowrisankar, A.; Banerjee, S. Frontiers of fractals for complex systems: Recent advances and future challenges. Eur. Phys. J. Spec. Top. 2021, 230, 3743–3745. [Google Scholar] [CrossRef]
  40. Liu, R.; He, M.; Huang, N.; Jiang, Y.; Yu, L. Three-dimensional double-rough-walled modeling of fluid flow through self-affine shear fractures. J. Rock Mech. Geotech. Eng. 2020, 12, 41–49. [Google Scholar] [CrossRef]
  41. Han, X.; Xue, K.; Zhang, S. The behavior of fluid flow and solute transport in 3D crossed rock fractures. Processes 2024, 13, 67. [Google Scholar] [CrossRef]
  42. Liu, H.-H.; Bodvarsson, G.S.; Lu, S.; Molz, F.J. A Corrected and Generalized Successive Random Additions Algorithm for Simulating Fractional Levy Motions. Math. Geol. 2004, 36, 361–378. [Google Scholar] [CrossRef]
  43. Barton, N.; Choubey, V. The shear strength of rock joints in theory and practice. Rock Mech. Rock Eng. 1977, 92, 54. [Google Scholar] [CrossRef]
  44. Tse, R.; Cruden, D.M. Estimating joint roughness coefficients. Int. J. Rock Mech. Min. Sci. 1979, 16, 5. [Google Scholar] [CrossRef]
  45. Luo, P.; Zhang, Z.; Geng, X.; Xue, K.; Guang, W. Evaluation of ScCO2-water performance on bituminous coal: Insights from experiments and 3D CT image reconstruction. Geomech. Geophys. Geo-Energy Geo-Resour. 2022, 8, 118. [Google Scholar] [CrossRef]
  46. Xue, K.; Liu, X.; Yan, X.; Chi, X.; Teng, B. The Effect of Fracture Surface Roughness and Mechanical Aperture on the Onset of Nonlinear Flow Behaviors in 3D Self-Affine Rough Fractures. Geofluids 2022, 2022, 4837207. [Google Scholar] [CrossRef]
  47. Brown, S.R.; Scholz, C.H. Closure of random elastic surfaces in contact. J. Geophys. Res. Solid Earth 1985, 90, 5531–5545. [Google Scholar] [CrossRef]
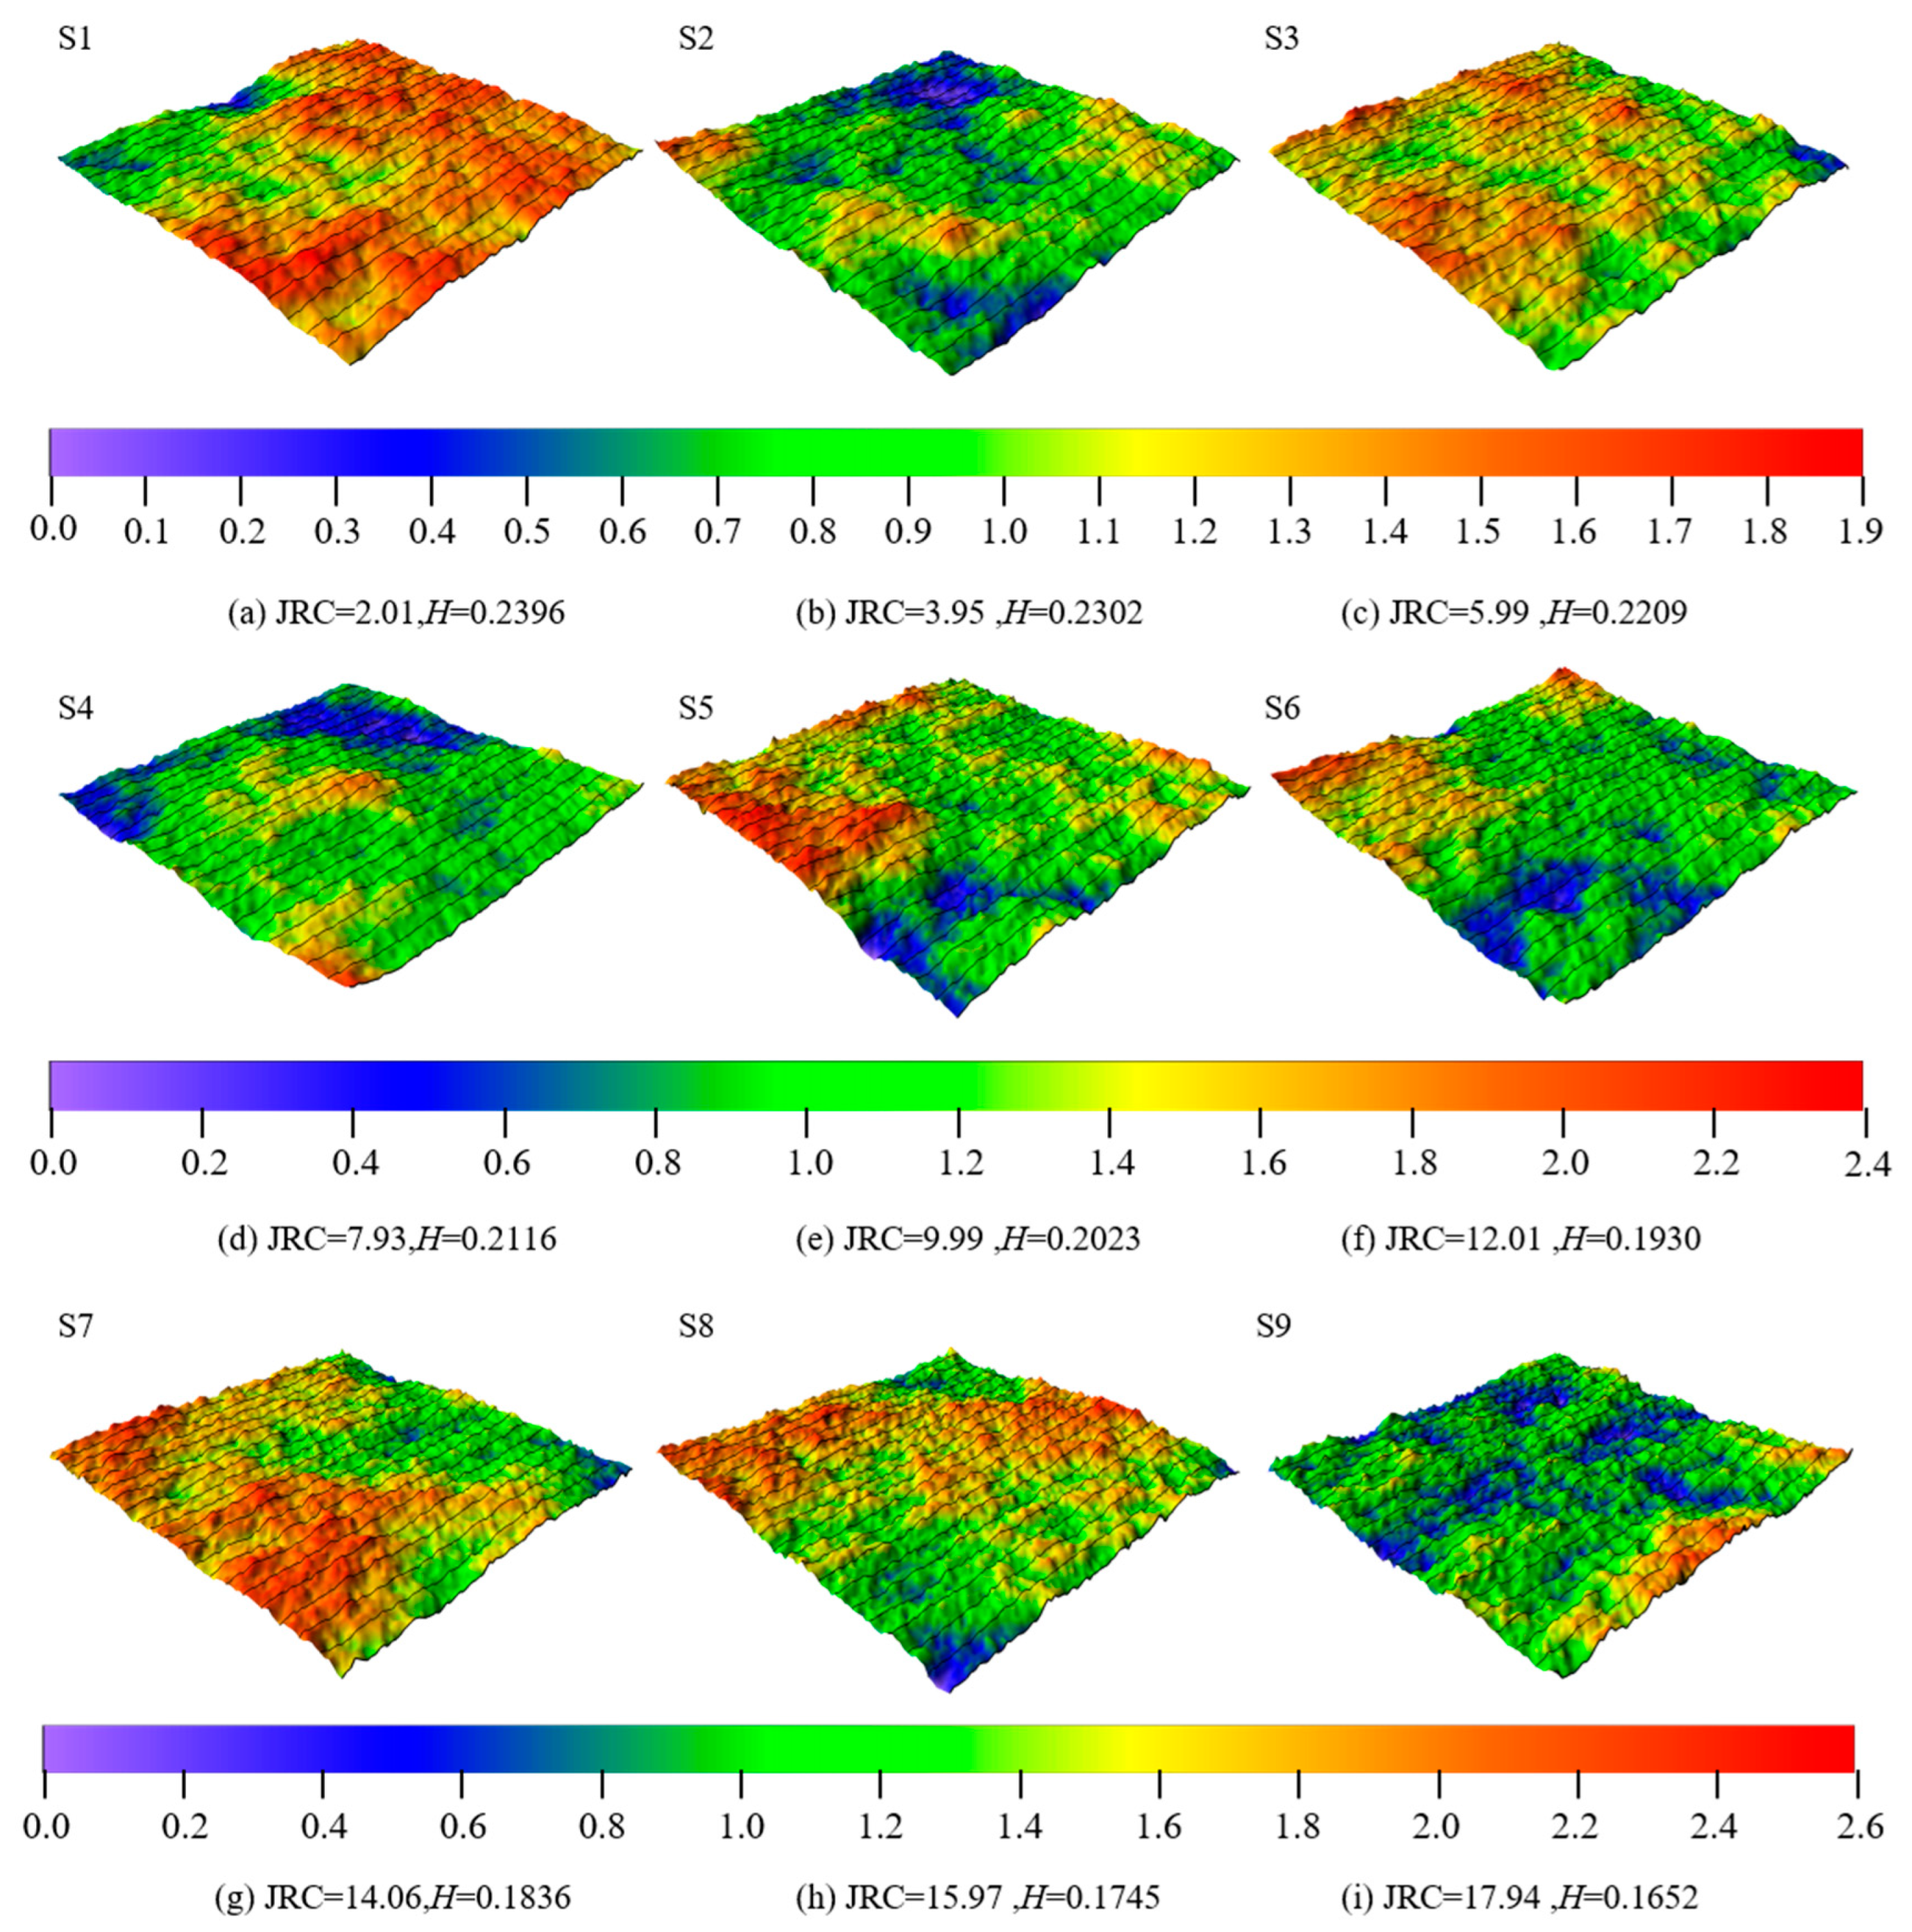
Figure 1. Morphological Characteristics of Nine Fractal Fracture Surfaces Generated Using the Modified SRA Algorithm (256 mm × 256 mm).
Fractalfract 09 00739 g001
Figure 2. Frequency distributions of JRC values for rough fracture surfaces along with their corresponding Gaussian fitting curves: (a) S1; (b) S2; (c) S3; (d) S4; (e) S5; (f) S6; (g) S7; (h) S8; and (i) S9.
Fractalfract 09 00739 g002
Figure 3. Boundary conditions and Study domain extract for fluid dynamics analyze.
Fractalfract 09 00739 g003
Figure 4. The streamline of fluid flow through rock fracture.
Fractalfract 09 00739 g004
Figure 5. The evolution of permeability K in terms of J for different model size.
Fractalfract 09 00739 g005
Figure 6. Flowchart of this study.
Fractalfract 09 00739 g006
Figure 7. Flow field distribution of rock fractures with varying surface roughness under a normal stress of 2 MPa and different shear displacements. Note: The red arrows represent the flow paths, and the background colors indicate the aperture variations.
Fractalfract 09 00739 g007
Figure 8. Flow field distribution of rock fractures with varying surface roughness under a normal stress of 4 MPa and different shear displacements.
Fractalfract 09 00739 g008
Figure 9. Flow field distribution of rock fractures with varying surface roughness under a normal stress of 6 MPa and different shear displacements.
Fractalfract 09 00739 g009
Figure 10. Flow field distribution of rock fractures with varying surface roughness under a normal stress of 8 MPa and different shear displacements.
Fractalfract 09 00739 g010
Figure 11. Aperture distribution of rock fractures with varying surface roughness under a normal stress of 2 MPa and different shear displacements: (a) S1; (b) S2; (c) S3; (d) S4; (e) S5; (f) S6; (g) S7; (h) S8; and (i) S9.
Fractalfract 09 00739 g011
Figure 12. Aperture distribution of rock fractures with varying surface roughness under a normal stress of 4 MPa and different shear displacements: (a) S1; (b) S2; (c) S3; (d) S4; (e) S5; (f) S6; (g) S7; (h) S8; and (i) S9.
Fractalfract 09 00739 g012
Figure 13. Aperture distribution of rock fractures with varying surface roughness under a normal stress of 6 MPa and different shear displacements: (a) S1; (b) S2; (c) S3; (d) S4; (e) S5; (f) S6; (g) S7; (h) S8; and (i) S9.
Fractalfract 09 00739 g013
Figure 14. Aperture distribution of rock fractures with varying surface roughness under a normal stress of 8 MPa and different shear displacements: (a) S1; (b) S2; (c) S3; (d) S4; (e) S5; (f) S6; (g) S7; (h) S8; and (i) S9.
Fractalfract 09 00739 g014
Figure 15. Evolution of mechanical aperture in terms of shear displacement under different normal stress for rock fracture with different surface roughness: (a) S1; (b) S2; (c) S3; (d) S4; (e) S5; (f) S6; (g) S7; (h) S8; and (i) S9.
Fractalfract 09 00739 g015
Figure 16. Comparison of permeability obtain by numerical simulation and predicted model.
Fractalfract 09 00739 g016
Figure 17. Comparison of permeability obtain by numerical simulation and predicted model.
Fractalfract 09 00739 g017
Table 1. Parameters for fluid dynamics analysis in rough surface fracture.
ParametersValue
Normal stressσ1 = 2 MPa, σ1 = 4 MPa, σ1 = 6 MPa, σ1 = 8 MPa
Shear displacement2 mm, 4 mm, 6 mm, 8 mm, 10 mm, 12 mm
Hurst exponent0.2396, 0.2302, 0.2209, 0.2116, 0.2023, 0.1930, 0.1836, 0.1745, 0.1652
JRC of fracture2.01, 3.95, 5.99, 7.93, 9.99, 12.01, 14.06, 15.97, 17.94
Disclaimer/Publisher’s Note: The statements, opinions and data contained in all publications are solely those of the individual author(s) and contributor(s) and not of MDPI and/or the editor(s). MDPI and/or the editor(s) disclaim responsibility for any injury to people or property resulting from any ideas, methods, instructions or products referred to in the content.