Article

Estimation of Fractal Dimension and Segmentation of Body Regions for Deep Learning-Based Gender Recognition

Division of Electronics and Electrical Engineering, Dongguk University, 30 Pildong-ro 1-gil, Jung-gu, Seoul 04620, Republic of Korea
*
Author to whom correspondence should be addressed.
Fractal Fract. 2024, 8(10), 551; https://doi.org/10.3390/fractalfract8100551
Submission received: 29 August 2024 / Revised: 19 September 2024 / Accepted: 19 September 2024 / Published: 24 September 2024

Abstract

:
There are few studies utilizing only IR cameras for long-distance gender recognition, and they have shown low recognition performance due to their lack of color and texture information in IR images with a complex background. Therefore, a rough body segmentation-based gender recognition network (RBSG-Net) is proposed, with enhanced gender recognition performance achieved by emphasizing the silhouette of a person through a body segmentation network. Anthropometric loss for the segmentation network and an adaptive body attention module are also proposed, which effectively integrate the segmentation and classification networks. To enhance the analytic capabilities of the proposed framework, fractal dimension estimation was introduced into the system to gain insights into the complexity and irregularity of the body region, thereby predicting the accuracy of body segmentation. For experiments, near-infrared images from the Sun Yat-sen University multiple modality re-identification version 1 (SYSU-MM01) dataset and thermal images from the Dongguk body-based gender version 2 (DBGender-DB2) database were used. The equal error rates of gender recognition by the proposed model were 4.320% and 8.303% for these two databases, respectively, surpassing state-of-the-art methods.

1. Introduction

With the advancement of technology, image processing has been widely adopted in various fields [1,2,3,4,5,6]. In addition, image-based intelligent surveillance systems have recently been utilized for various purposes such as crime prevention, security, criminal investigation, and suspect search. There is a growing demand for intelligent software in surveillance systems to automate the analysis of large volumes of images captured by closed circuit television (CCTV) cameras. This is particularly crucial for surveillance and security operations. When an image captured by a surveillance system is utilized to search for information on an individual that is stored in a database, gender recognition can enhance the efficiency of locating a person or a group of people of a specific gender. Gender recognition can also be employed to issue an alert regarding access to an area where only a specific gender is permitted [7]. Most previous studies on gender recognition have focused on high-resolution facial images. However, surveillance camera systems capture images from long distances, resulting in low resolution images, and it is often impractical to obtain high-quality facial images due to challenges such as human pose variation, changes in illumination, and occlusion. Consequently, there is a growing necessity for body-based gender recognition utilizing body images of individuals rather than facial images.
Previous studies on body-based gender recognition have primarily utilized images captured by visible light cameras in surveillance environments. With visible light images, high recognition performance can be achieved because of the abundance of information in the data, including color information and body shape details. However, it is essential to ensure the robust application of surveillance systems even during nighttime for tasks such as crime prevention, suspect tracking, and crime alarms. In low illumination environments such as nighttime, visible light camera images pose challenges for gender recognition due to the degradation of image quality caused by insufficient light. Conversely, infrared (IR) light images utilize light in the infrared wavelength band, invisible to the human eye, enabling the clear capture of a person’s shape even in low illumination or nighttime conditions. In particular, leveraging thermal information based on a person’s body temperature can ensure stable gender recognition performance despite environmental variations such as illumination changes, shadows, and foggy or dusty conditions. Therefore, a pressing need for research on gender recognition using IR images exists, but several challenges persist. Firstly, IR images are grayscale, lacking color information crucial for distinguishing gender characteristics like skin, hair, and clothing color. Secondly, the accurate extraction of body features may be hindered if the temperature of a body part closely matches the ambient temperature, potentially impacting gender recognition performance. Against this backdrop, this study proposes a method to enhance gender recognition performance by emphasizing human body regions in IR images through rough body segmentation. This approach aims to address the degradation of recognition performance caused by external environmental factors and the limited color information available in IR images.
The contributions of this study are as follows:
-
To address the lack of color and texture information in IR images used in low illumination environments, a rough body segmentation-based gender recognition network (RBSG-Net) is proposed. In this network, rough body shape information is emphasized through a semantic segmentation network, thereby enhancing gender recognition performance.
-
To mitigate the degradation of body segmentation performance in IR images when the contrast between the human region and the background is low, a novel anthropometric loss based on human anthropometric information is implemented into the semantic segmentation network.
-
An adaptive body attention module (ABAM) is introduced, utilizing a binary rough segmentation map (BRSM) to identify the human body region in the image. The ABAM determines its attention based on anthropometric information to improve gender recognition performance by integrating segmentation and recognition tasks.
-
To analyze the segmentation correctness capability within the proposed framework, the fractal dimension estimation technique is introduced to gain insights into the complexity and irregularity of the body regions. Additionally, the RBSG-Net code is available on the GitHub website [8].
This paper is organized as follows: Section 2 analyzes previous studies on body-based gender recognition. Section 3 describes the method proposed in this work. Section 4 presents and analyzes the experimental results. Section 5 provides the conclusion of this study.

2. Related Work

Previous studies on body-based gender recognition can be categorized into methods based on visible light images, methods combining visible light and IR images, and methods solely using IR images, depending on the type of images employed.

2.1. Using Visible Light Images

There are numerous open datasets available for visible light images [9,10,11], leading to a proliferation of related studies. Ng et al. [12] applied a shallow convolutional neural network (CNN) model comprising two convolutional layers, two subsampling layers, and one fully connected layer to a body-based gender recognition task. Antipov et al. [13] demonstrated that gender recognition performed better with learned features extracted through deep learning model training than with handcrafted features on heterogeneous datasets. Cai et al. [14] proposed an effective method called histogram of oriented gradients (HOG)-assisted deep feature learning (HDFL). It enhances gender recognition performance by integrating handcrafted features, such as the weighted HOG feature, with deep-learned features obtained through model training. However, these studies did not consider noise elements (background or occlusion) present in the images as they relied solely on global features from full-body images. Subsequently, studies utilizing local features have emerged to address performance degradation caused by background noise [15,16,17,18]. Raza et al. [15] proposed a method for gender recognition by parsing pedestrians in an image using a deep decomposition network (DDN) [16], followed by inputting both the full-body and upper-body images into the CNN model. In a subsequent study, Raza et al. [18] enhanced gender recognition performance by employing a stacked sphere autoencoder (SSAE) instead of a CNN for human full-body images obtained using a DDN. These studies aimed to enhance gender recognition by extracting only the human silhouette in an image. However, since human parsing is applied universally to all images, there is a limitation whereby gender recognition performance may be influenced by the results of the parsing model. Liu et al. [11] improved performance by proposing HydraPlus-Net (HP-Net), utilizing an attentive feature network (AF-Net) that applies attention in multiple directions to a multi-scale feature map extracted from a CNN. Tang et al. [19] introduced an attribute localization module (ALM) based on a weakly supervised attention method to enhance recognition performance. This module identifies the most discriminative region for a classification label in an input image. Jia et al. [20] split existing datasets containing identical identities in training and test sets into a zero-shot setting akin to real-world environments. They compared a robust baseline method for training the model with conventional state-of-the-art (SOTA) methods. Roxo and Proença [21] proposed YinYang-Net (YY-Net) to improve performance. It detects the head using key points extracted by AlphaPose [22] to utilize the head part, crucial for gender recognition, and merges each feature extracted from the head and body images into a learnable matrix. Fan et al. [23] introduced a transformer-based multi-task pedestrian attribute recognition network (PARFormer), which is a vision transformer-based method based on the Swin Transformer [24] as its backbone. As described above, many studies on body-based gender recognition tasks have utilized visible light images instead of IR images due to the availability of more data for model training and readily usable color information. However, the drawback is a significant deterioration in recognition performance in environments with insufficient external light (nighttime, dark indoors, dark weather, etc.).

2.2. Using Visible Light and IR Images

As previously discussed, recognizing gender using visible light images in low illumination environments, such as nighttime, presents challenges. Consequently, in areas where nighttime usage is prevalent, such as intelligent surveillance systems, relying solely on visible light images may limit recognition performance. To circumvent this limitation, research has explored the use of IR images, which are well suited for night vision. Nguyen and Park [25] extracted HOG features from visible light and IR images, reduced feature dimensionality using principal component analysis (PCA), and performed gender recognition by fusing the respective scores obtained from a support vector machine (SVM) classifier. In a subsequent study, Nguyen and Park [26] enhanced gender recognition performance by concentrating features more on the foreground area of the image. This was achieved through a method that amplified HOG features extracted from both the visible light and thermal images by weighting the mean and standard deviation of pixels within each patch of the IR image. However, the application of near-infrared (NIR) images is limited due to unclear foreground–background distinctions and differing features compared to long-wave infrared (LWIR) images. Baek et al. [27] augmented the resolution of visible light images using a two-step method involving denoising and super-resolution (SR) models. They then combined scores extracted from IR and visible light images using ResNet-101 [28] to enhance gender recognition performance based on body images. These approaches offer the advantage of improving performance by supplementing degradation elements (such as low illumination, shadows, and clothing types) in visible light images with IR images. However, the simultaneous use of both types of data entails disadvantages, including increased computational complexity in feature extraction and fusion processes, as well as heightened system costs due to the necessity of employing both visible light and IR cameras simultaneously. Consequently, gender recognition studies utilizing only IR images have been pursued to address this challenge.

2.3. Using IR Images

In comparison to gender recognition based on visible light images, gender recognition utilizing IR images has not received extensive attention in prior studies on body-based gender recognition. This is primarily due to the relatively limited availability of data and lower image quality associated with IR images. Nevertheless, there has been a growing demand for research focused on gender recognition using solely IR images, driven by the necessity for robust performance in low-illumination environments and the importance of privacy protection. Previous studies on IR image-based gender recognition can be categorized as either without body segmentation or with body segmentation.

2.3.1. Without Body Segmentation

Previous research [29] curated a dataset comprising images extracted in frame units from video data captured by thermal cameras. Subsequently, they employed a CNN model consisting of 15 layers to extract features for individual images. They then trained the model with gait features, which can be extracted from image sequences using a bidirectional gated recurrent units (BGRUs) layer, for gender recognition. However, their method did not address performance degradation resulting from background presence in the image. Moreover, being an image sequence-based approach, it entails greater computational intensity compared to single image-based methods.

2.3.2. With Body Segmentation

During gender recognition, it becomes imperative to eliminate background elements unrelated to gender, as these elements can significantly impact recognition performance. This issue is particularly pronounced in thermal images, where the contrast between the body and background is minimal when the ambient temperature closely matches that of the body, resulting in diminished recognition accuracy. While open datasets exist for visible light images with annotated human body parts [18,30], there is currently no database providing similar annotations for IR images. Consequently, gender recognition research applying semantic segmentation to IR images is lacking. To address this gap, RBSG-Net is proposed in this study for rough segmentation-based gender recognition of human body regions.

3. Proposed Methodology

3.1. Overall Procedure of the Proposed Method

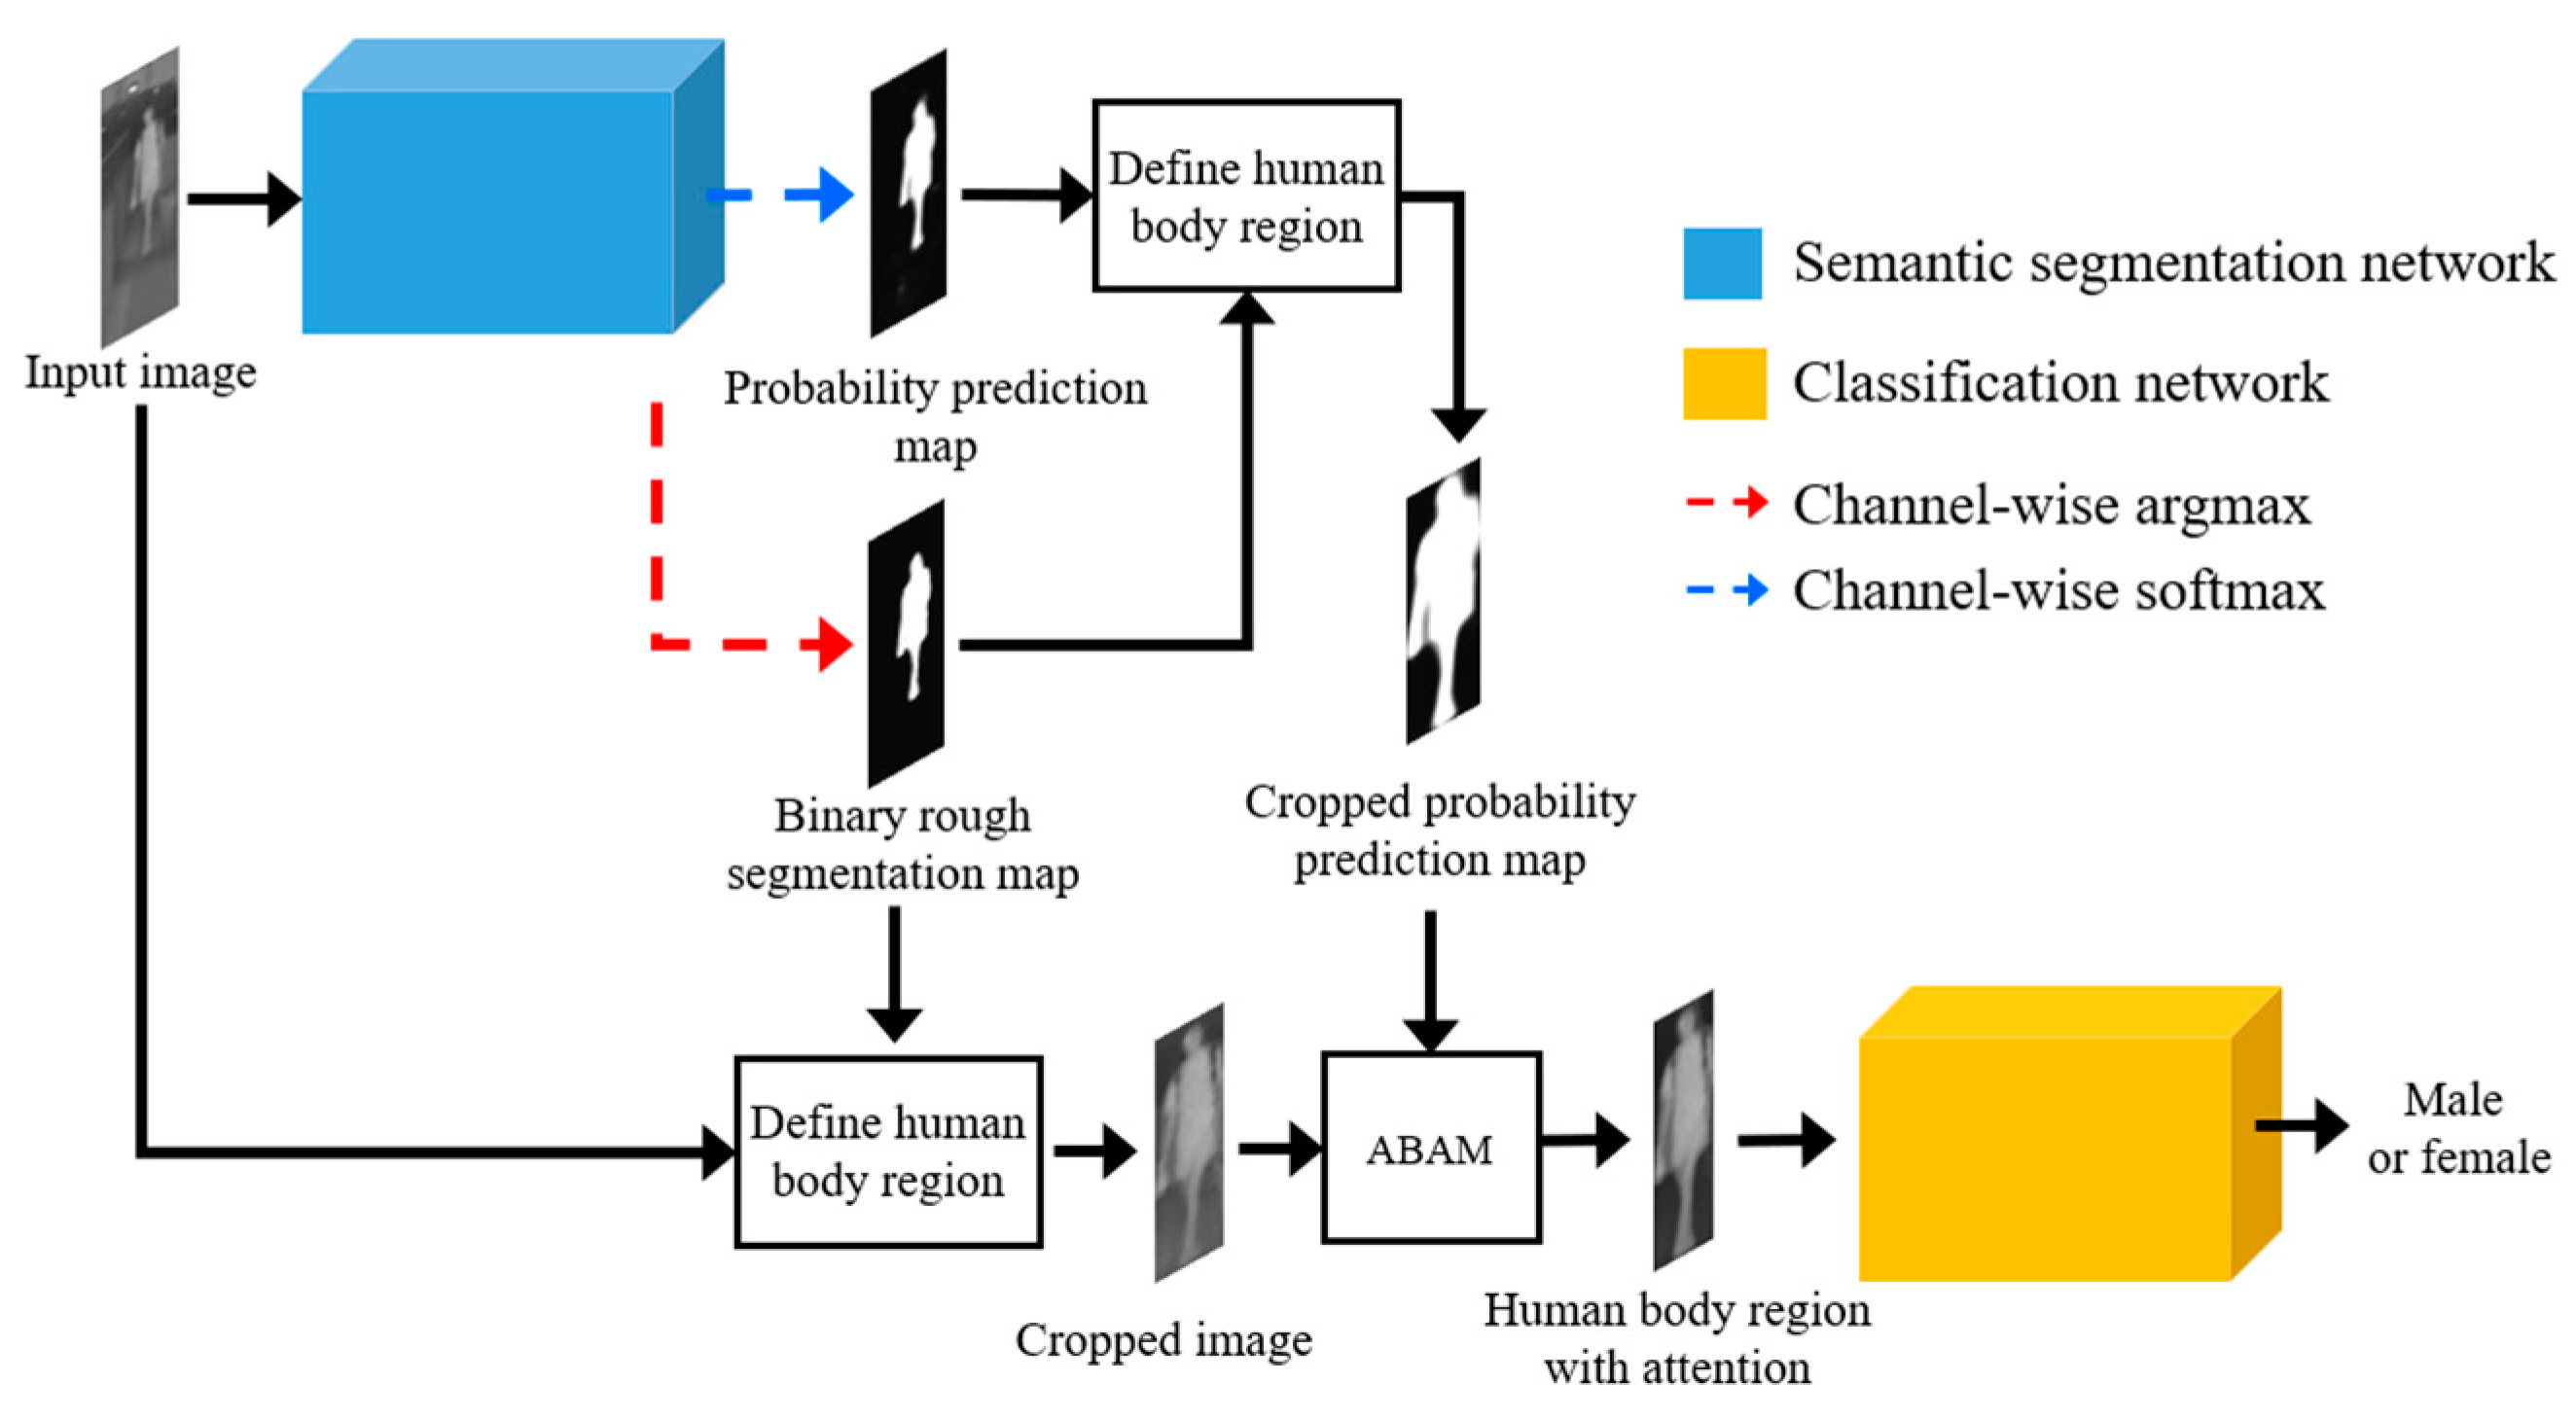
The overall procedure of the proposed RBSG-Net is schematically depicted in Figure 1. Upon input of an IR image, a prediction map in pixel units for the human body region is generated by the pre-trained semantic segmentation network. This prediction map facilitates the extraction of the human body region corresponding to the rough human body region. Subsequently, the ABAM computes the ratio of human anthropometric pixels representing the head, upper body, and lower body parts within the extracted human body region, ensuring each ratio falls within a predefined specific range. If the ratio meets this criterion, the body attention module (BAM) is activated for processing the input image; otherwise, the original input image is directly forwarded to the gender classification network. Ultimately, gender is determined using the gender classification network.

3.2. RBSG-Net

Since IR images lack color information, their extractable features are comparatively limited to those of visible light images. Additionally, noise generated from external environmental factors contributes to the degradation of gender recognition performance. To address these constraints, this study introduces a noise-robust RBSG-Net, which compensates for the absence of color information by enhancing structural features, such as body shape, in the IR image through a semantic segmentation network. Figure 2 shows the structural framework of the RBSG-Net. The RBSG-Net is designed to delineate the human body region based on the prediction map extracted from a pre-trained semantic segmentation network. It subsequently employs adaptive attention via the ABAM before sequentially transmitting the outcome to the gender classification network. Therefore, the performance of the semantic segmentation network significantly impacts the classification network. However, anticipating high segmentation performance is challenging due to the absence of annotations for the body region in IR images. To address this challenge, the ABAM is proposed, which assesses the segmentation result quality based on anthropometric information and selectively applies it to the image instead of employing all segmentation outcomes. Adaptive attention through the ABAM alleviates the decline in gender recognition performance resulting from reduced semantic segmentation network efficacy, while also facilitating the extraction of features emphasizing body shape information by the classification network.

3.2.1. Semantic Segmentation Network

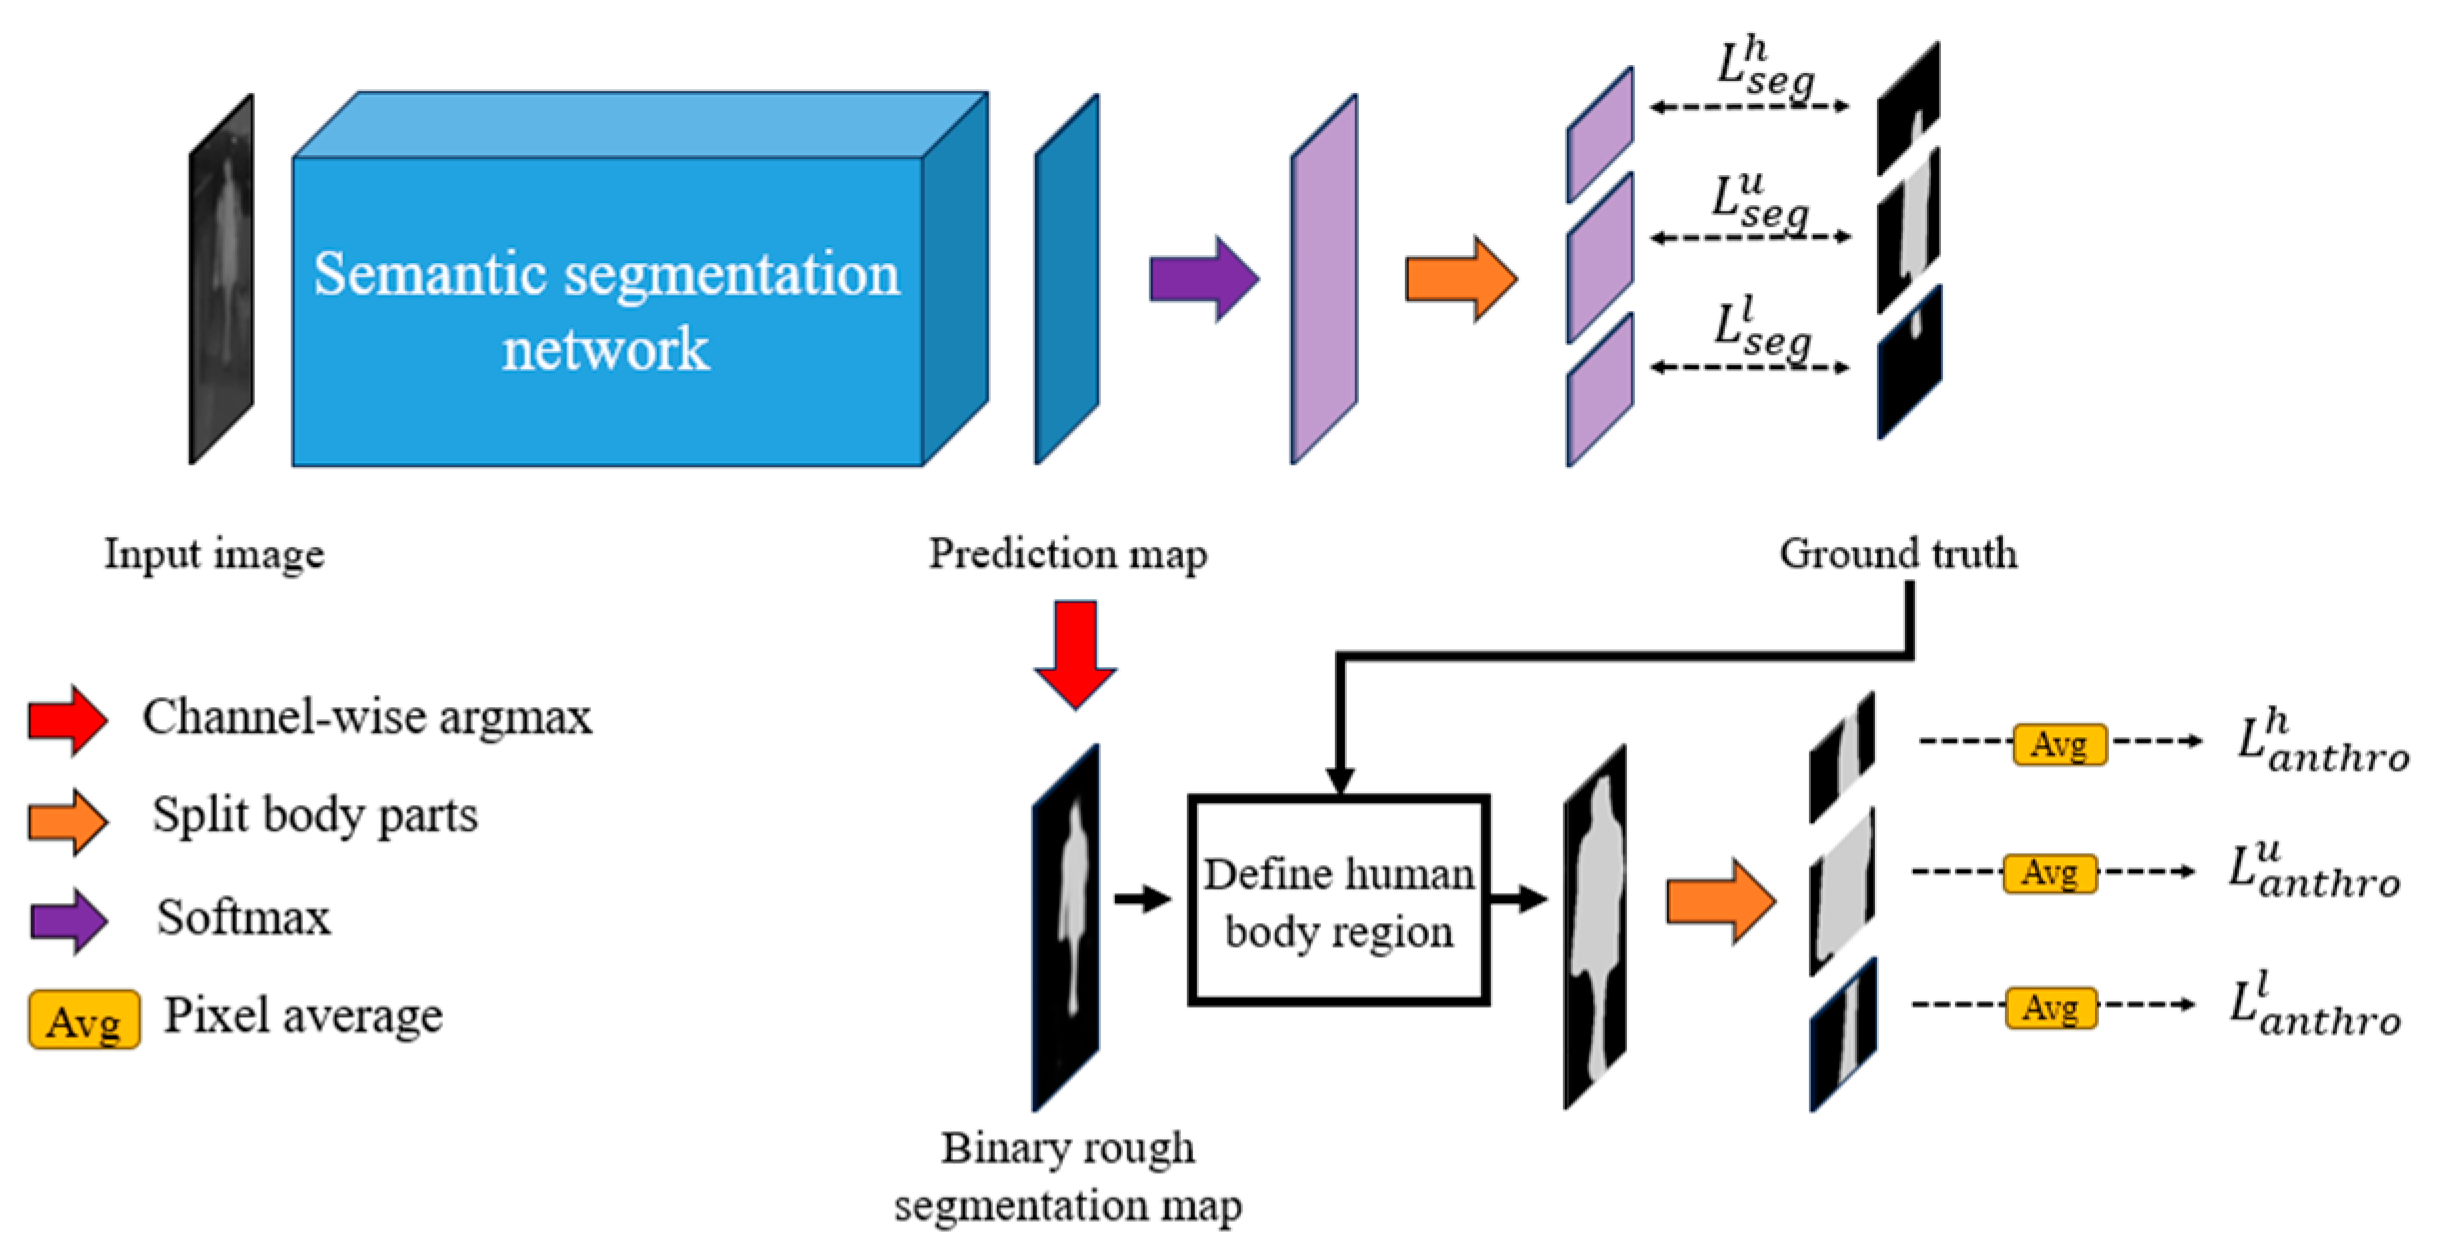
When training the semantic segmentation network to segment the body region, training the data with annotation information for the body region is necessary. However, given the absence of an open dataset containing IR image-based body annotation information, this study addresses the issue by leveraging human anthropometric information as compensation for insufficient training data. Such information, rooted in the ratio of each body part, facilitates rough yet effective segmentation, thereby enhancing gender recognition accuracy. Figure 3 shows the training process of the semantic segmentation network based on human anatomical information for rough body segmentation. The prediction map, extracted from the input image via the semantic segmentation network, is partitioned into the head, upper body, and lower body according to specific ratios for each body part. Subsequently, the divided prediction map generated through this process is utilized to compute segmentation loss and anthropometric loss. This approach aims to complement the limited annotated training data available for human body segmentation by encouraging the segmentation network to consider and recognize the structural characteristics of the body. Detailed explanations of how the model integrates this anthropometric information into the training process are provided in Section 3.2.1.

Model Overview

In this study, a conventional U-Net [31] was employed for binary semantic segmentation, aiming to segment the human full body from the background in an IR image. The primary rationale behind selecting U-Net as the segmentation model lies in its robust performance, even with a limited quantity of annotated training data. This was verified through experiments, details of which are provided in Section 4.4.1 and Section 4.5.1.
Figure 3 elaborates on the comprehensive process of training the semantic segmentation model. Initially, the input image undergoes processing by the encoder and decoder components of U-Net to generate a prediction map corresponding to the human body. Subsequently, the prediction map is transformed into probabilities using the SoftMax function and split based on a predefined ratio. In this study, the original image height is utilized to split the top 15% as the head, the middle 45% as the upper body, and the bottom 40% as the lower body, without overlap. The optimal ratio value was determined by comparing gender recognition performance using the training data. To utilize the ratio of human body parts within an image as anthropometric information, the BRSM for the human body is derived from the prediction map, as represented by Equation (1):
B R S M i , j = arg k max   P i , j , k
where P H × W × C is the prediction map, i and j represent the indices of image height and width, respectively, k denotes the channel of the prediction map, representing the index for background and foreground, and BRSM is a binary map representing the human body at the corresponding pixel (i, j).
Based on the detected BRSM, the human body region is defined, and the ratio of each body part including the head, upper body, and lower body is utilized within the body region as anthropometric information by dividing each proportionally. In detail, for the detected BRSM(x, y), the minimum and maximum coordinates (xmin, ymin, xmax, and ymax) with BRSM(x, y) = 1 denote the four vertices of the body region. Utilizing the obtained human body region excludes the influence of background, facilitating the extraction of features crucial for gender recognition. Subsequently, the human body region is divided into body parts, the head, upper body, and lower body, as depicted in Figure 3, to compute the anthropometric loss, detailed in the following subsection. The effectiveness of the human body region extractor is demonstrated through the ablation study in Section 4.4.1, and examples of extracted human body regions are provided in Figure 4.

Loss Functions for Training the Semantic Segmentation Network

The loss function employed in this study to optimize the semantic segmentation network is defined as follows:
L t o t a l = 1 λ a n t h r o L s e g + λ a n t h r o L a n t h r o
where Lseg and Lanthro are the segmentation and anthropometric losses, respectively, and λanthro is a parameter balancing the anthropometric loss within the overall loss. In this study, it was set to 0.05, representing the optimal parameter for achieving the highest gender recognition accuracy with the training data. Lseg is calculated as the sum of the cross-entropy loss (CE) [32] for each body part after dividing the prediction map (P) and ground truth (G) into [Ph; Pu; Pl], [Gh; Gu; Gl], respectively, as follows:
L s e g = k h , u , l 1 H k W i = 0 H k 1 j = 0 W 1 C E P k i , j , G k i , j
In this case, each body part is delineated according to the specific ratio suggested in Section Model Overview: 15% for the head, 45% for the upper body, and 40% for the lower body, without overlap. Additionally, a novel anthropometric loss is proposed, utilizing anthropometric information to address the challenge of insufficient segmentation annotated training data. The anthropometric loss is computed as the sum of the mean squared errors between predefined values (yh, yu, and yl) based on the method for calculating the proportion of pixels for each body part (head, upper body, and lower body) in the image. Equation (4) shows the calculation of the anthropometric loss:
L a n t h r o = k h , u , l 1 H k W i = 0 H k 1 j = 0 W 1 B R S M k i , j y k 2
Here, BRSMh, BRSMu, and BRSMl represent the BRSM split in ratios corresponding to the head, upper body, and lower body parts, with the human body region defined. In this study, the lower bound (l) and upper bound (u) of the pixel ratio for each body part (head, upper body, and lower body) within the BRSM were set. Specifically, (lh, uh) = (0.3, 0.6), (lu, uu) = (0.6, 0.9), and (ll, ul) = (0.4, 0.6) were assigned, considering various poses. The values of yh, yu, and yl were set to the average of each lower and upper bounds, specifically 0.45, 0.75, and 0.5, respectively. These selections were made as they resulted in the highest gender recognition accuracy with the training data. Consequently, the anthropometric loss guides the model to predict the distribution of body parts more accurately in an image based on the pixel proportion of each body part. This aspect is particularly crucial, given the insufficiency of annotated training data. Through this approach, the model acquires knowledge about the typical range of ratios occupied by various body parts, enhancing the generalization capability of the segmentation network, even with limited data. This contributes to consistent segmentation performance for human images of diverse sizes and poses.

3.2.2. ABAM

The ABAM proposed in this study serves the purpose of accentuating the human body shape in the input image processed by the human body region extractor. After applying the SoftMax function in the channel direction to the prediction map (P) derived from the semantic segmentation network, the BAM for the human body region is generated as demonstrated in the following Equation (5):
B A M i , j = 1 i f   P i , j T 1 T + P i , j o t h e r w i s e
Each pixel value in the prediction map (P) represents the probability for the human region and ranges between 0 and 1. If the value of P is greater than or equal to the threshold (T), it is set to 1; otherwise, the pixel value of the region predicted as the human body is preserved by adding (1 − T) to the existing value. In other cases, the existing pixel value is reduced to enhance the contrast between the human body and the background. In this scenario, the optimal T was set to 0.2, a value determined to yield the highest gender recognition accuracy with the training data. For the BAM generated in this manner, the shape is aligned with the input image by extracting the same human body region as the input image from the human body region extractor. However, since the semantic segmentation network was trained with limited annotation data, achieving high segmentation performance is challenging. To address this, an ABAM is proposed that assesses the quality of a segmentation mask based on anthropometric information and decides whether to selectively apply the BAM to the input image according to the results. To assess the quality, the region obtained by the human body region extractor is extracted from the BRSM generated by the semantic segmentation network. Then, the human full body is divided into three parts (head, upper body, and lower body), and the pixel ratio for each part is calculated as shown in the following equation:
r h = n h H h × W , r u = n u H u × W , r l = n l H l × W
where nh, nu, and nl represent the number of pixels with BRSM = 1 for the divided head, upper body, and lower body parts, respectively, Hh, Hu, and Hl denote the height of each part, and W represents the width of BRSM.
As shown in Equation (7), the value α is defined, which indicates whether the pixel ratio (r) for each part is between the set lower bound (l) and the upper bound (u) presented in Section Loss Functions for Training the Semantic Segmentation Network:
α k = 1 , i f   l k r k u k 0 , o t h e r w i s e ,   k h ,   u ,   l
This value is multiplied for all parts to calculate αfinal, the value for the final decision of attention:
α f i n a l = α h × α u × α l
Suppose the input image is I, then the ABAM-applied image (E) is defined as follows:
E i , j = I i , j B A M i , j i f   α f i n a l = 1 I i , j o t h e r w i s e
where denotes element-wise multiplication.

3.2.3. Gender Recognition Network

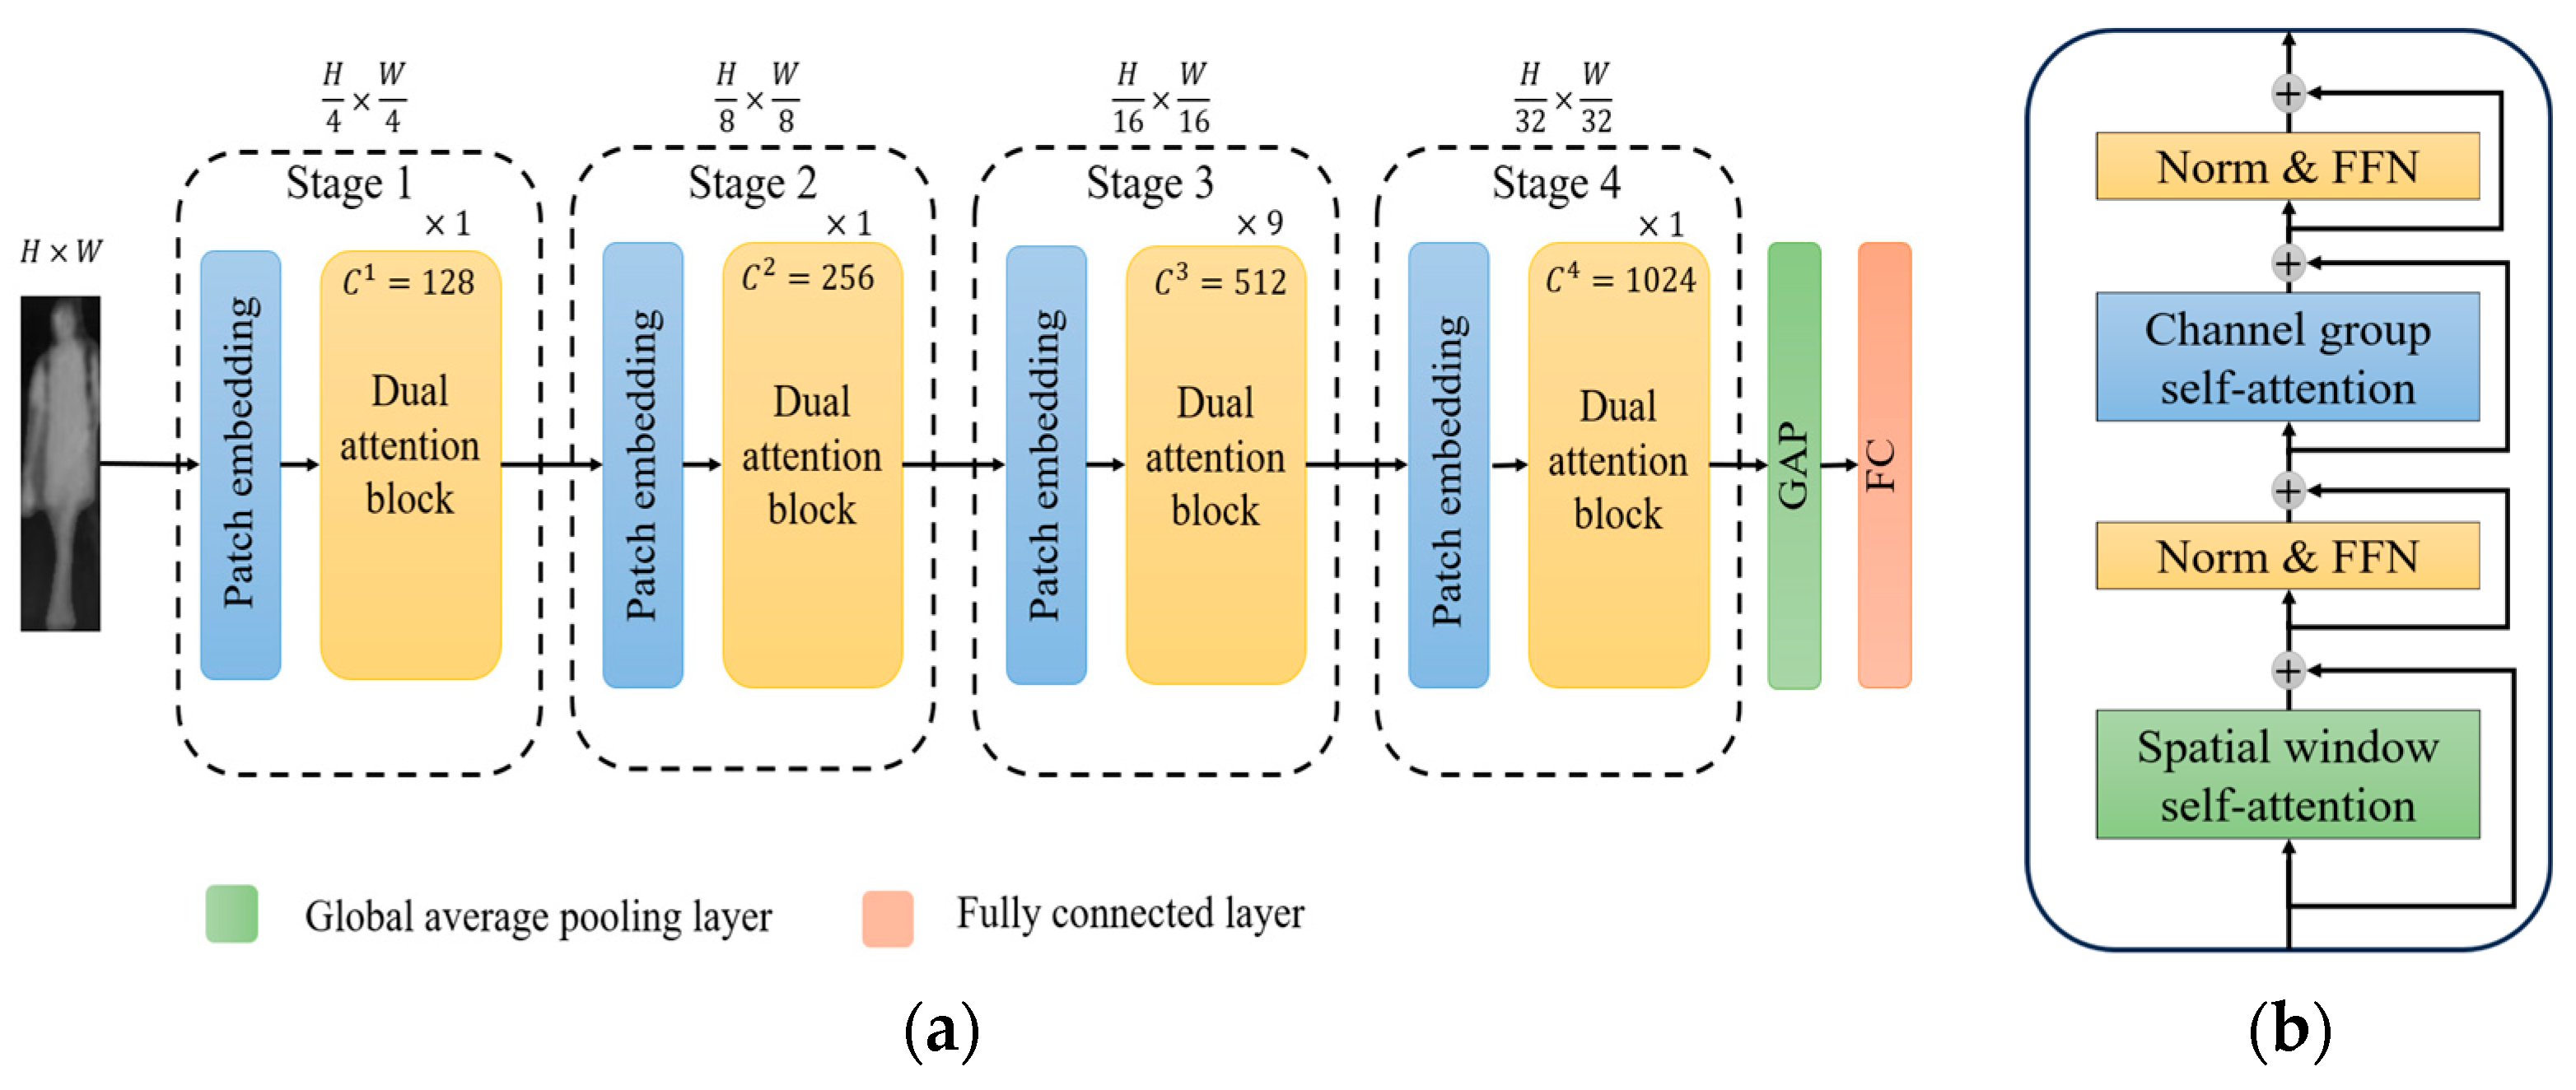
In this study, the semantic segmentation network detects the human body region in the input image, and based on this detection, the emphasized human body region, achieved using the human body region extractor and the ABAM, serves as the input to the gender classification network. The classification network chosen for gender recognition in human full-body images is the dual attention vision transformer (DaViT) [33], depicted in Figure 5.
Figure 5a shows the architecture of DaViT. Like hierarchical vision transformers [24,34], it consists of four stages. Furthermore, each stage consists of a patch embedding layer and a dual attention block [33]. The patch embedding layer splits the image into multiple patches via overlapped convolution and converts them into embedding vectors. Afterward, the spatial window self-attention [24,33] and channel group self-attention [33] operations are sequentially performed in the dual attention block. Spatial window self-attention focuses on local features by computing attention scores between spatial tokens within non-overlapping windows. However, this approach loses the ability to capture global features. To address this issue, channel group self-attention is introduced, which focuses on learning relationships between tokens by dividing the channels into several groups and performing self-attention within each group. Consequently, the resulting feature map attains a size of 1024 × H 32 × W 32 . This feature map is subsequently converted into a feature vector through the global average pooling layer. Finally, the fully connected layer facilitates the classification of each individual as male or female.
Given that this study delves into gender recognition grounded in the human body’s appearance in an IR image, it becomes imperative to incorporate global context information, encompassing data pertaining to the entire body. Transformer series models, exemplified by DaViT, excel in capturing global features more effectively than CNN-based models by leveraging correlations among multiple patches extracted from the input image [35]. The DaViT-Base stands out due to its superior recognition performance compared to alternative models. Comparative experiments involving the classification network are outlined in Section 4.4.1 and Section 4.5.1.

4. Experimental Results

4.1. Experimental Database and Environment

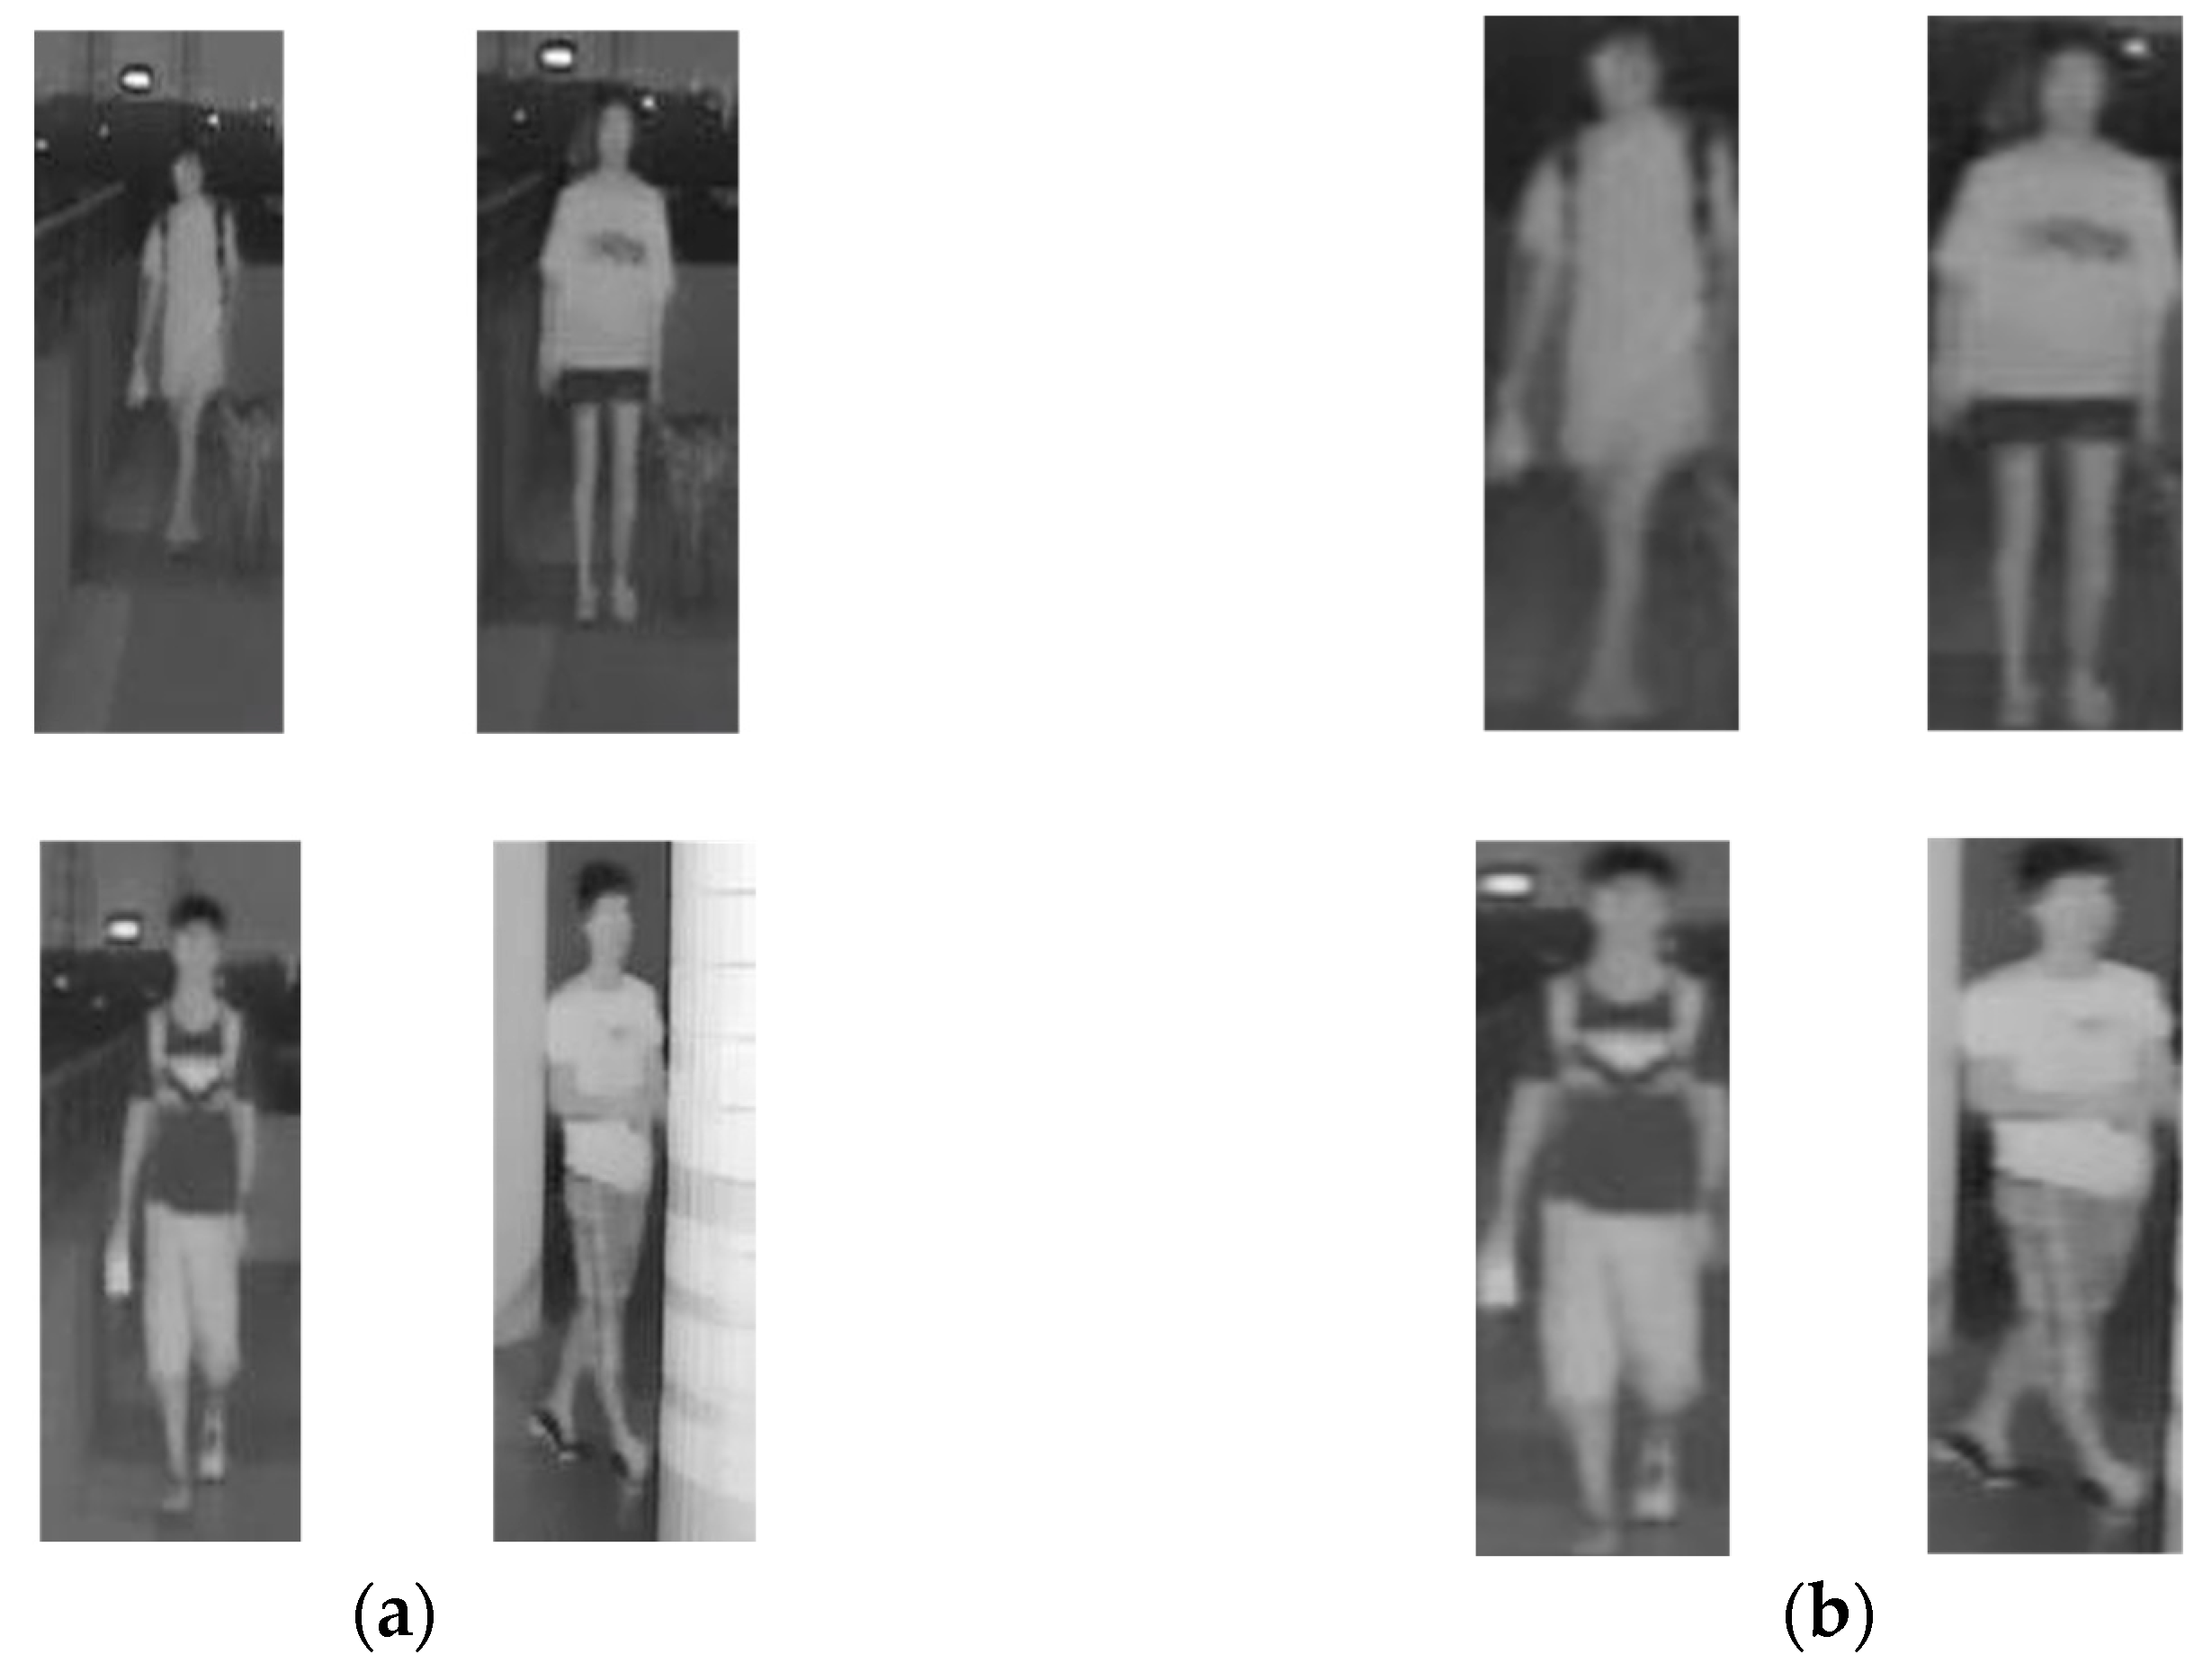
Previous gender recognition studies have predominantly utilized datasets comprising visible light images, rendering them unsuitable for experiments focused on IR image-based gender recognition. Consequently, this study exclusively employed IR images sourced from the Sun Yat-sen University multiple modality re-identification version 1 database (SYSU-MM01) [36], an open-access database offering both visible light and IR images, alongside the Dongguk body-based gender version 2 (DBGender-DB2) [25] dataset. SYSU-MM01 encompasses 15,495 NIR images featuring 490 individuals, comprising 275 males and 215 females. These images were captured utilizing NIR cameras across various settings, including dark indoor environments and cluttered outdoor environments. To assess the effectiveness of the proposed method across different IR image wavelengths, experiments were conducted using DBGender-DB2 as a supplementary experimental dataset. This dataset consists of thermal images captured by a thermal imaging camera [37] utilizing the long-wave infrared (LWIR) range of 7.5 to 13.5 µm. It includes 4120 images obtained from outdoor settings, featuring a total of 412 individuals, comprising 254 males and 158 females. Notably, both the SYSU NIR dataset and the DBGender-DB2 thermal dataset exhibit variations in image sizes due to the extraction of IR images at different distances in human units. To the best of our knowledge, there is no IR image open dataset that provides gender information as ground truth considering various environmental conditions, except for the two experimental databases, SYSU-MM01 and DBGender-DB2. To maintain consistency in model training and validation while preserving the human body’s appearance, the input image size was standardized to 384 × 128 pixels in this study. Figure 6 shows sample images from the datasets utilized in this investigation.
K-fold cross-validation was conducted to validate the experiments. For the SYSU-MM01 NIR dataset, 2-fold cross-validation was utilized due to its sufficiently large size. Conversely, for the relatively small DBGender-DB2 thermal dataset, 5-fold cross-validation was employed. Ensuring the inclusion of individuals with different identities (open-world setting) in both the train and test sets was crucial to enhance the reliability of the experiments and simulate real-world conditions. To create a validation set for model evaluation, images corresponding to 10% of the total individuals were separated from the training set. During training, data augmentation involved applying horizontal flips exclusively to the training set. Table 1 summarizes the dataset composition for the experiments.
The experiments were conducted using PyTorch version 1.13.0 [38], Intel® Core i7-12700F, with 32 GB of memory, and an NVIDIA GeForce RTX 4070 graphics processing unit (GPU) [39]. For segmentation annotation, manual labeling was performed using the Roboflow (version 1.0) software [40].

4.2. Training

The training process of the RBSG-Net proposed in this study comprises two parts: the training of the semantic segmentation network and the training of the classification network. Initially, the semantic segmentation network was trained using an Adam optimizer [41] with a learning rate of 10−4. During training, random brightness contrast and cutout [42] were applied online for additional augmentation to address the limited amount of data. The mini-batch size was set to eight, and training was conducted for a total of 300 epochs.
Upon completion of the training for the semantic segmentation network, its parameters were frozen to prevent further updates. Subsequently, the classification network was fine-tuned by initializing its weights with pre-trained ImageNet-1K weights and using the Adam optimizer. The cosine learning rate decay method [43] was applied to decay the initial learning rate from 10−4 to a minimum of 10−6. The weight decay was set to 10−4, and only horizontal flipping was applied for data augmentation. The mini-batch size remained at eight, with training conducted for 30 epochs on SYSU-MM01 NIR and 60 epochs on DBGender-DB2 thermal. The cross-entropy loss function was employed for training the classification network. Figure 7 shows the graphs of training loss and validation loss for both the semantic segmentation network and the classification network. In all instances, the train loss converged with increasing epochs, indicating sufficient training on the training data for both networks. Furthermore, the validation loss also converged as the epoch count increased, suggesting that neither network was overfitted to the training data.

4.3. Evaluation Metric and Fractal Dimension Estimation

The equal error rate (EER) was employed as the primary metric to assess the performance of the gender recognition model proposed in this study, utilizing the SYSU-MM01 NIR dataset. The EER, commonly utilized in biometrics and applicable to soft biometrics such as gender recognition [25], is derived from Type I and Type II errors. True positive (TP) represents cases where the model recognizes a female as a female, true negative (TN) represents cases where a male is recognized as a male, false negative (FN) represents cases where a female is incorrectly recognized as a male, and false positive (FP) represents cases where a male is incorrectly recognized as a female. Then, the Type I and Type II errors are calculated as follows:
T y p e   I   e r r o r = F P F P + T N
T y p e   I I   e r r o r = F N F N + T P
Thus, the Type I error is the percentage of males misclassified as females, whereas the Type II error is the proportion of females misclassified as males. Typically, these values exhibit a trade-off relationship as the gender recognition threshold adjusts. The EER denotes the error rate where Type I and Type II errors intersect. In this research, the EER served as the principal performance metric for the gender recognition model.
Fractals are intricate forms that exhibit self-similarity and deviate from conventional geometric principles [44]. The fractal dimension (FD) measures the complexity of a shape, showing whether it is concentrated or spread out. In this research, binary masks predicted for human body regions are generated using a semantic segmentation network trained with proposed anthropometric loss, where the FD ranges from one to two, representing varying levels of complexity. Within this interval, the FD spans numerous representations for binary images, with higher values signifying greater shape intricacy. The FD for the human body is determined through the box counting method [45]. Here, N denotes the number of boxes that uniformly divide each body part, and ϵ stands for the scaling factor of the boxes. The FD is computed using the following Equation (12):
FD =   lim ϵ 0 log N ϵ log ϵ  
where FD ∈ [1, 2], and for all ϵ > 0, there exists an N(ϵ). The pseudocode for estimating the FD of the generated human body parts of the U-Net using the box-counting method is provided in Algorithm 1.
Algorithm 1: The Pseudocode for FD Estimation
Input: Img: input is the produced output by U-Net
Output: FD
1:  Determine the largest dimension of box size and adjust it to the nearest power of 2
Max_dim = max(size(Img))
   ϵ = 2^[log2(Max_dim)]
2:  If the size is smaller than ϵ, pad the image to match the dimension of ϵ
   if size(Img) < size(ϵ)
    pad_width = ((0, ϵ - Img.shape [0]), (0, ϵ - Img.shape[1]))
    padded_Img = pad(Img, pad_width, mode=‘constant’, constant_values=0)
   else
    padded_Img = Img
3:   Initialize an array storing the number of boxes for each dimension size
n = zeros(1, ϵ +1)
4:  Compute the number of boxes, ‘N(ϵ)’ containing at least one pixel of body region
n[ϵ + 1] = sum(I[:])
5:    While ϵ > 1:
a. Diminish the size of ϵ: ϵ = ϵ /2
b. Update the number of ‘N(ϵ)’
6:    Compute log(N(ϵ)) and log(ϵ) for each ‘ϵ
7:    Fit line to [(log(ϵ), log(N(ϵ)] using the least squares method
8:    Fractal dimension is determined by the slope of the fitted line
Return FD

4.4. Testing the Proposed Method with the SYSU-MM01 NIR Dataset

4.4.1. Ablation Studies

Ablation studies were conducted to understand the impact of the semantic segmentation network trained with the anthropometric loss (Lanthro) and segmentation loss (Lseg) described in Section Loss Functions for Training the Semantic Segmentation Network on the final gender recognition performance of the RBSG-Net. First, the results of the ablation study according to the loss term used to train the semantic segmentation network are presented in Table 2. When the semantic segmentation network trained with both Lseg and Lanthro was applied to the RBSG-Net, the best EER performance was observed. In addition, Table 3 shows the recognition performance according to the value of λanthro, the weight of the Lanthro term. In this experiment, it was found that the best performance was obtained when the value of λanthro was 0.05. In subsequent experiments, this optimal value was used, based on the results of Table 2 and Table 3.
Next, the results of the ablation study for the human body region extractor and the ABAM, introduced in Section Model Overview and Section 3.2.2, respectively, are presented. Case 1 in Table 4 is the result of using only the classification network without the semantic segmentation network. In case 2, the EER of the ABAM alone is 5.180%, which is 0.23% lower than case 1. Case 3 shows an EER of 4.863% when using only the human body region extractor, which is a 0.547% reduction compared to case 1. Finally, case 4 uses both the human body region extractor and the ABAM, with an EER of 4.320%, suggesting the best improvement in gender recognition performance.
In the following ablation study, the effectiveness of the ABAM was demonstrated by comparing cases of adaptive versus non-adaptive (i.e., uniform across all images) application of the BAM, as presented in Table 5. Specifically, only the adaptivity of BAM application was compared under the conditions of case 4 in Table 4. In Table 5, case 1 represents the results obtained solely with the application of the human body region extractor, while case 2 shows the outcomes of applying BAM in a non-adaptive manner. Comparing case 1 and case 2, the non-adaptive application of the attention map hinders feature extraction due to an image with an unsophisticated attention map, resulting in an increase in the EER compared to an image without the BAM. On the other hand, in case 3, the adaptively applied BAM compensates for this degradation and improves the recognition performance. The results of anthropometric loss and the ABAM can be found in Table 2 and Table 4 in Section 4.4.1. Table 2 presents the results of the ablation study for the anthropometric loss in training the semantic segmentation network and shows the changes in gender recognition performance accordingly. Table 4 presents the results of the ablation study for the ABAM and shows the changes in gender recognition performance. The results in Table 2 and Table 4 indicate that the ABAM gives the main result, and the anthropometric loss gives the secondary result.
The results of comparative experiments are presented in Table 6 and Table 7 to verify the robustness of the proposed RBSG-Net against various semantic segmentation networks and classification networks. First, to demonstrate the robustness of the proposed RBSG-Net to various semantic segmentation networks, comparative experiments were conducted using the CNN-based models of U-Net [31], DeepLabV3Plus [46], HRNet [47], DDRNet [48], and the transformer-based models of SegFormer [49]. The DaViT-Base model, presented in Section 3.2.3, was used as the classification network. As shown in Table 6, in all cases using various semantic segmentation networks, the EER is lower than 5.410%, compared to when only the classification network was used. This indicates that the RBSG-Net ensures robust improvement in gender recognition performance, regardless of the segmentation network type. In particular, the lowest EER of 4.320% was achieved using the U-Net. In the following experiments, the U-Net was adopted as the semantic segmentation network with the best performance and conducted comparative experiments on various classification networks.
Secondly, comparative experiments were conducted to demonstrate the robustness of the proposed RBSG-Net to various classification networks. For a fair comparison, all classification networks were pre-trained with ImageNet-1K. The performance of the RBSG-Net was evaluated on various types of CNN-based models, including InceptionV3 [50], ResNet-101 [28], and ConvNeXt-Base [51], as well as transformer-based models such as Swin-Base [24], DeiT-Large [52], and DaViT-Base [33]. In Table 7, ‘w/o’ is the result of using only classification network in the RBSG-Net, and ‘w/’ is the result of training using both the human body region extractor and the ABAM in the RBSG-Net.
As shown in Table 7, the experimental results show that when both the human body region extractor and the ABAM based on semantic segmentation network were applied, there was a performance improvement in all classification networks of the CNN and the transformer. Among them, DaViT-Base [33] showed the best performance with an EER of 4.320% and was utilized as a classification network in other experiments.

4.4.2. Comparisons of Gender Recognition Accuracy with SOTA Methods

Since this study focused on body-based gender recognition using IR images, it is necessary to compare the performance with distant gender recognition methods that use human full body images instead of faces. However, since there is not much research on gender recognition using only IR images, the proposed method is compared with existing methods using only visible light images, HP-Net [11], ALM [19], Strong Baseline [20], YY-Net [21], and PARFormer [23], and methods using only IR images, 1-ch ResNet-101 [27] and 15-layer CNN [29]. The experiments were performed with 2-fold cross-validation, and the average EER of each method is shown. According to Table 8, the RBSG-Net achieved an EER of 1.747% lower than the second-best model, Strong Baseline [20].
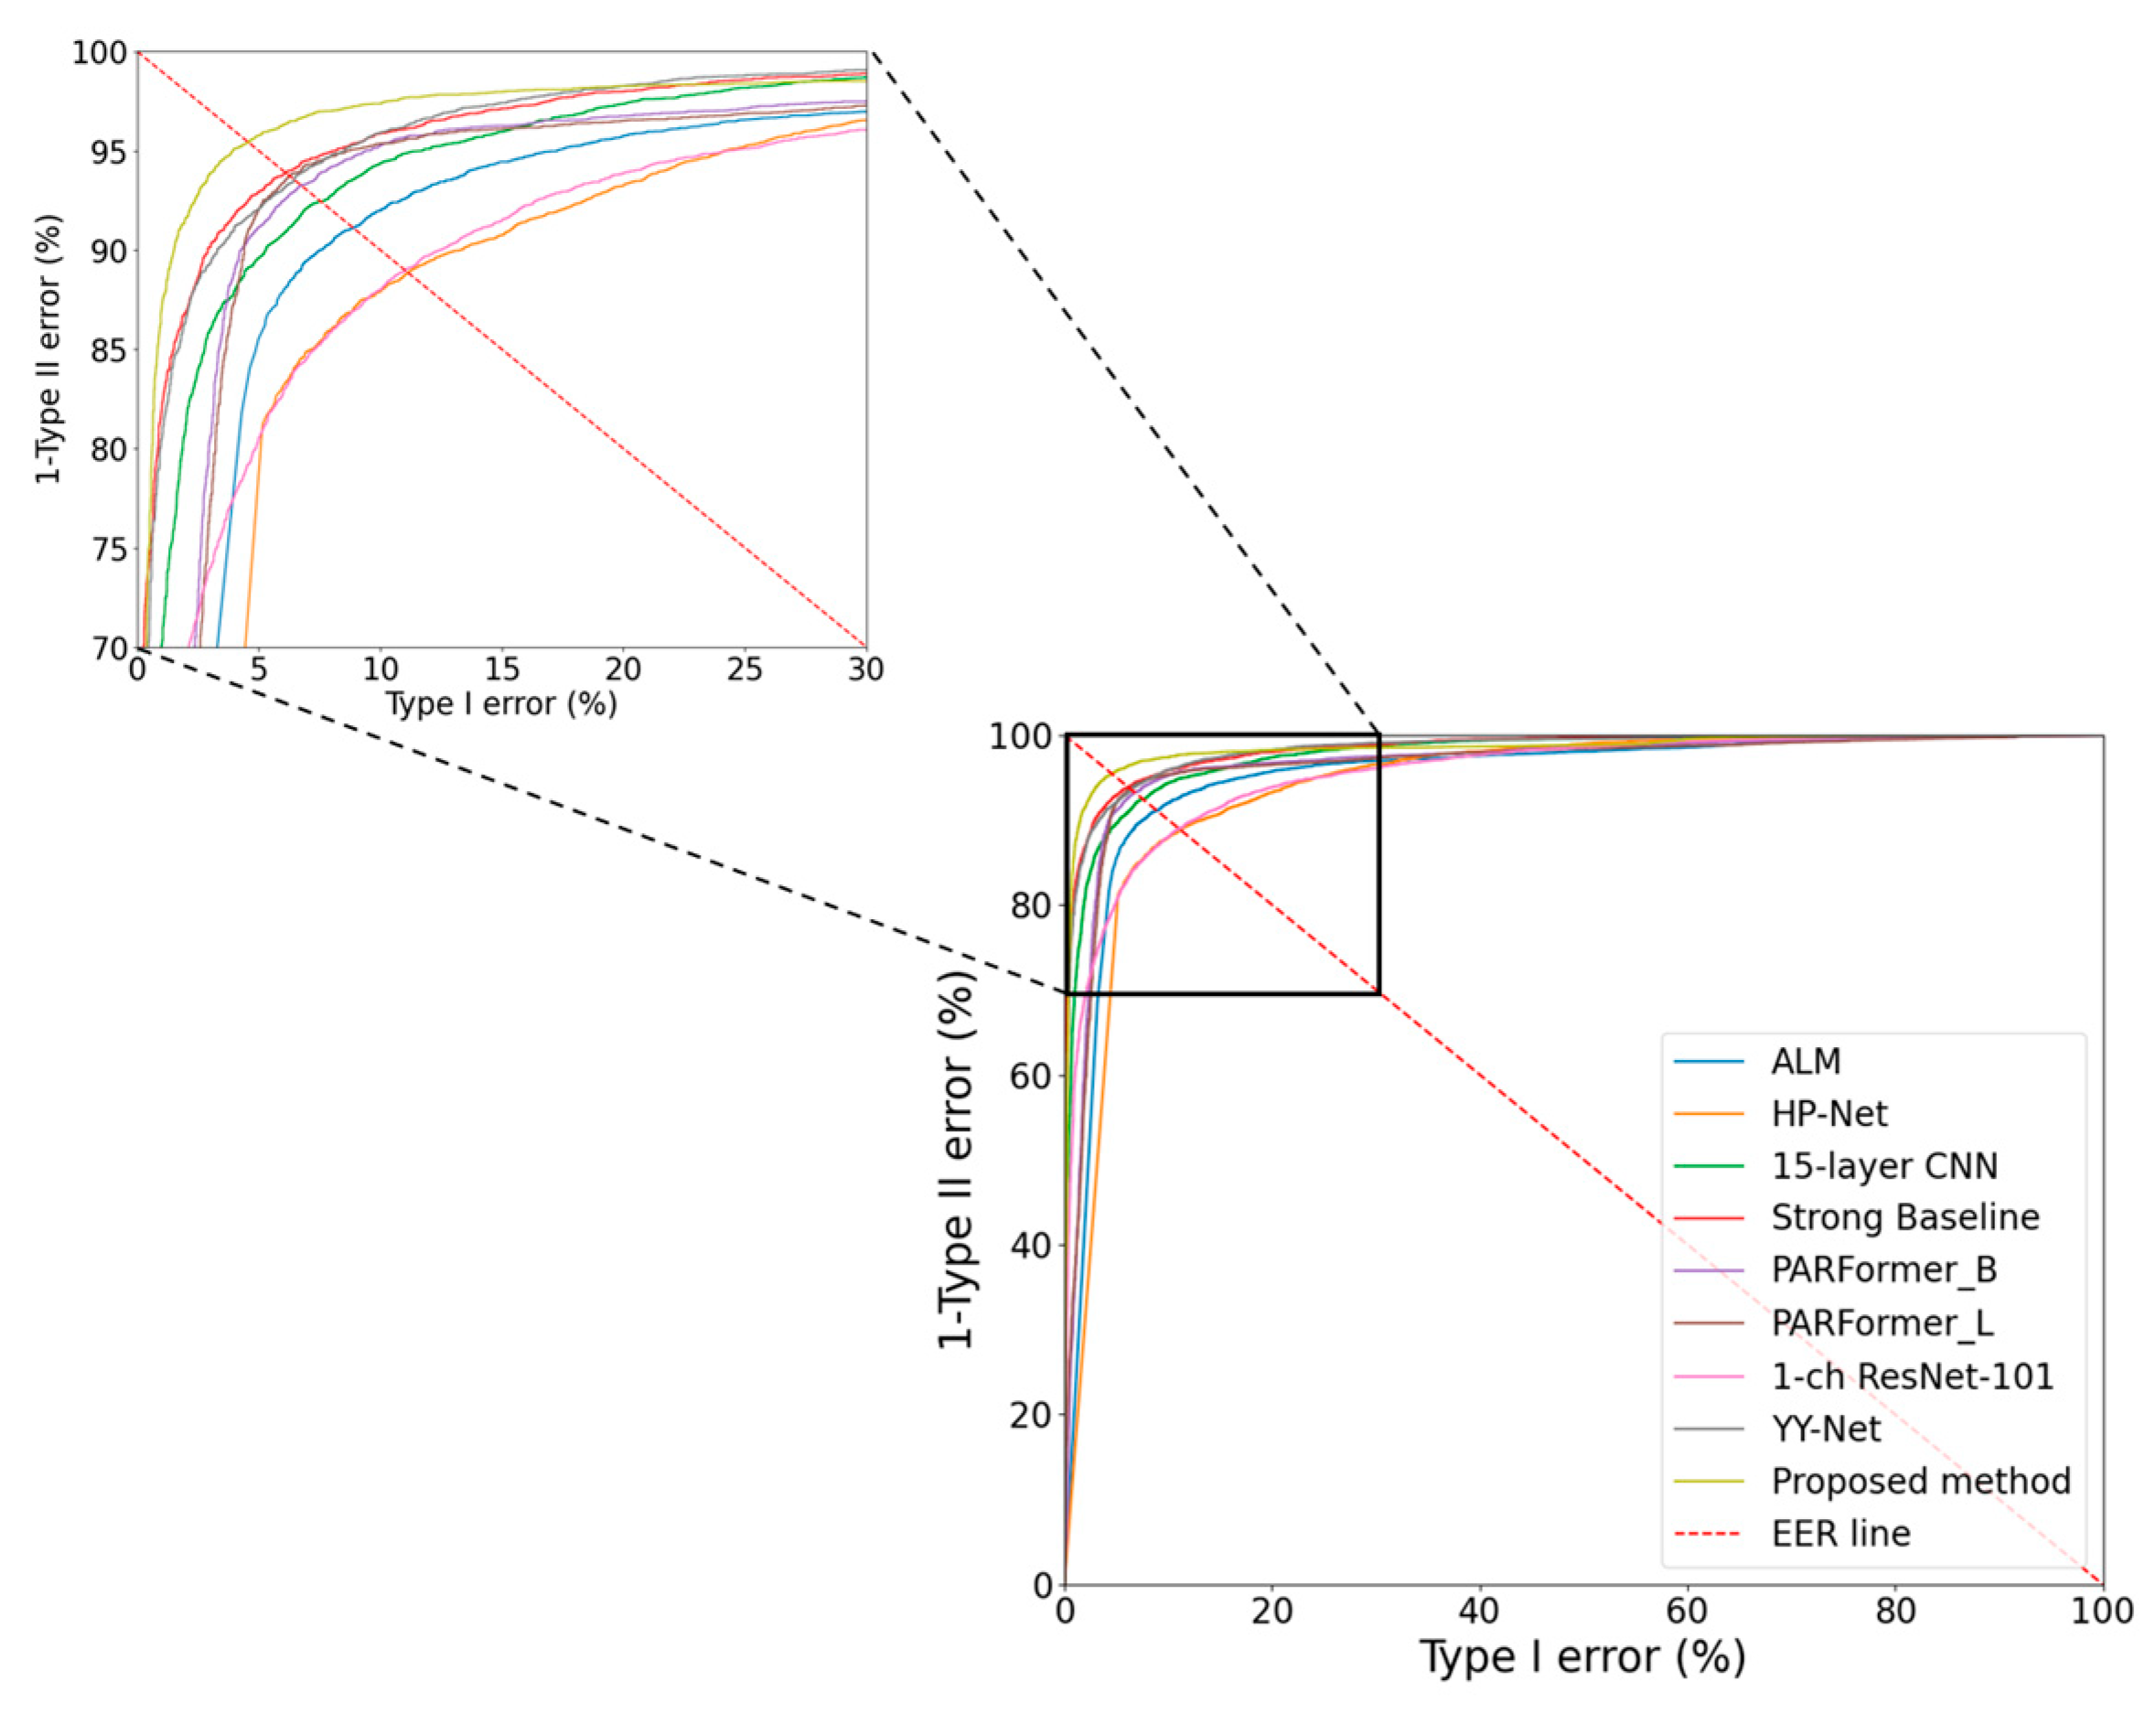
Figure 8 shows the receiver operating characteristic (ROC) curve and the EER line to compare the gender recognition performance of the proposed method and other SOTA models. The intersection points of the ROC curve and the EER line of each model are the points where the Type I error and Type II error are equalized, which represents the EER. As shown in Figure 8, the RBSG-Net proposed in this study has better gender recognition performance than the SOTA methods.

4.4.3. Comparisons of Gender Recognition Accuracy with SOTA Methods: 5-Fold Cross-Validation

The SYSU-MM01 NIR dataset has more images than the DBGender-DB2 thermal dataset, so a 2-fold cross-validation was performed. However, the body-based gender recognition dataset is characterized by low diversity of the training set because it is divided into a training set and a test set based on human identity. Therefore, to further improve the reliability of the generalization performance of the model, 5-fold cross-validation was performed.
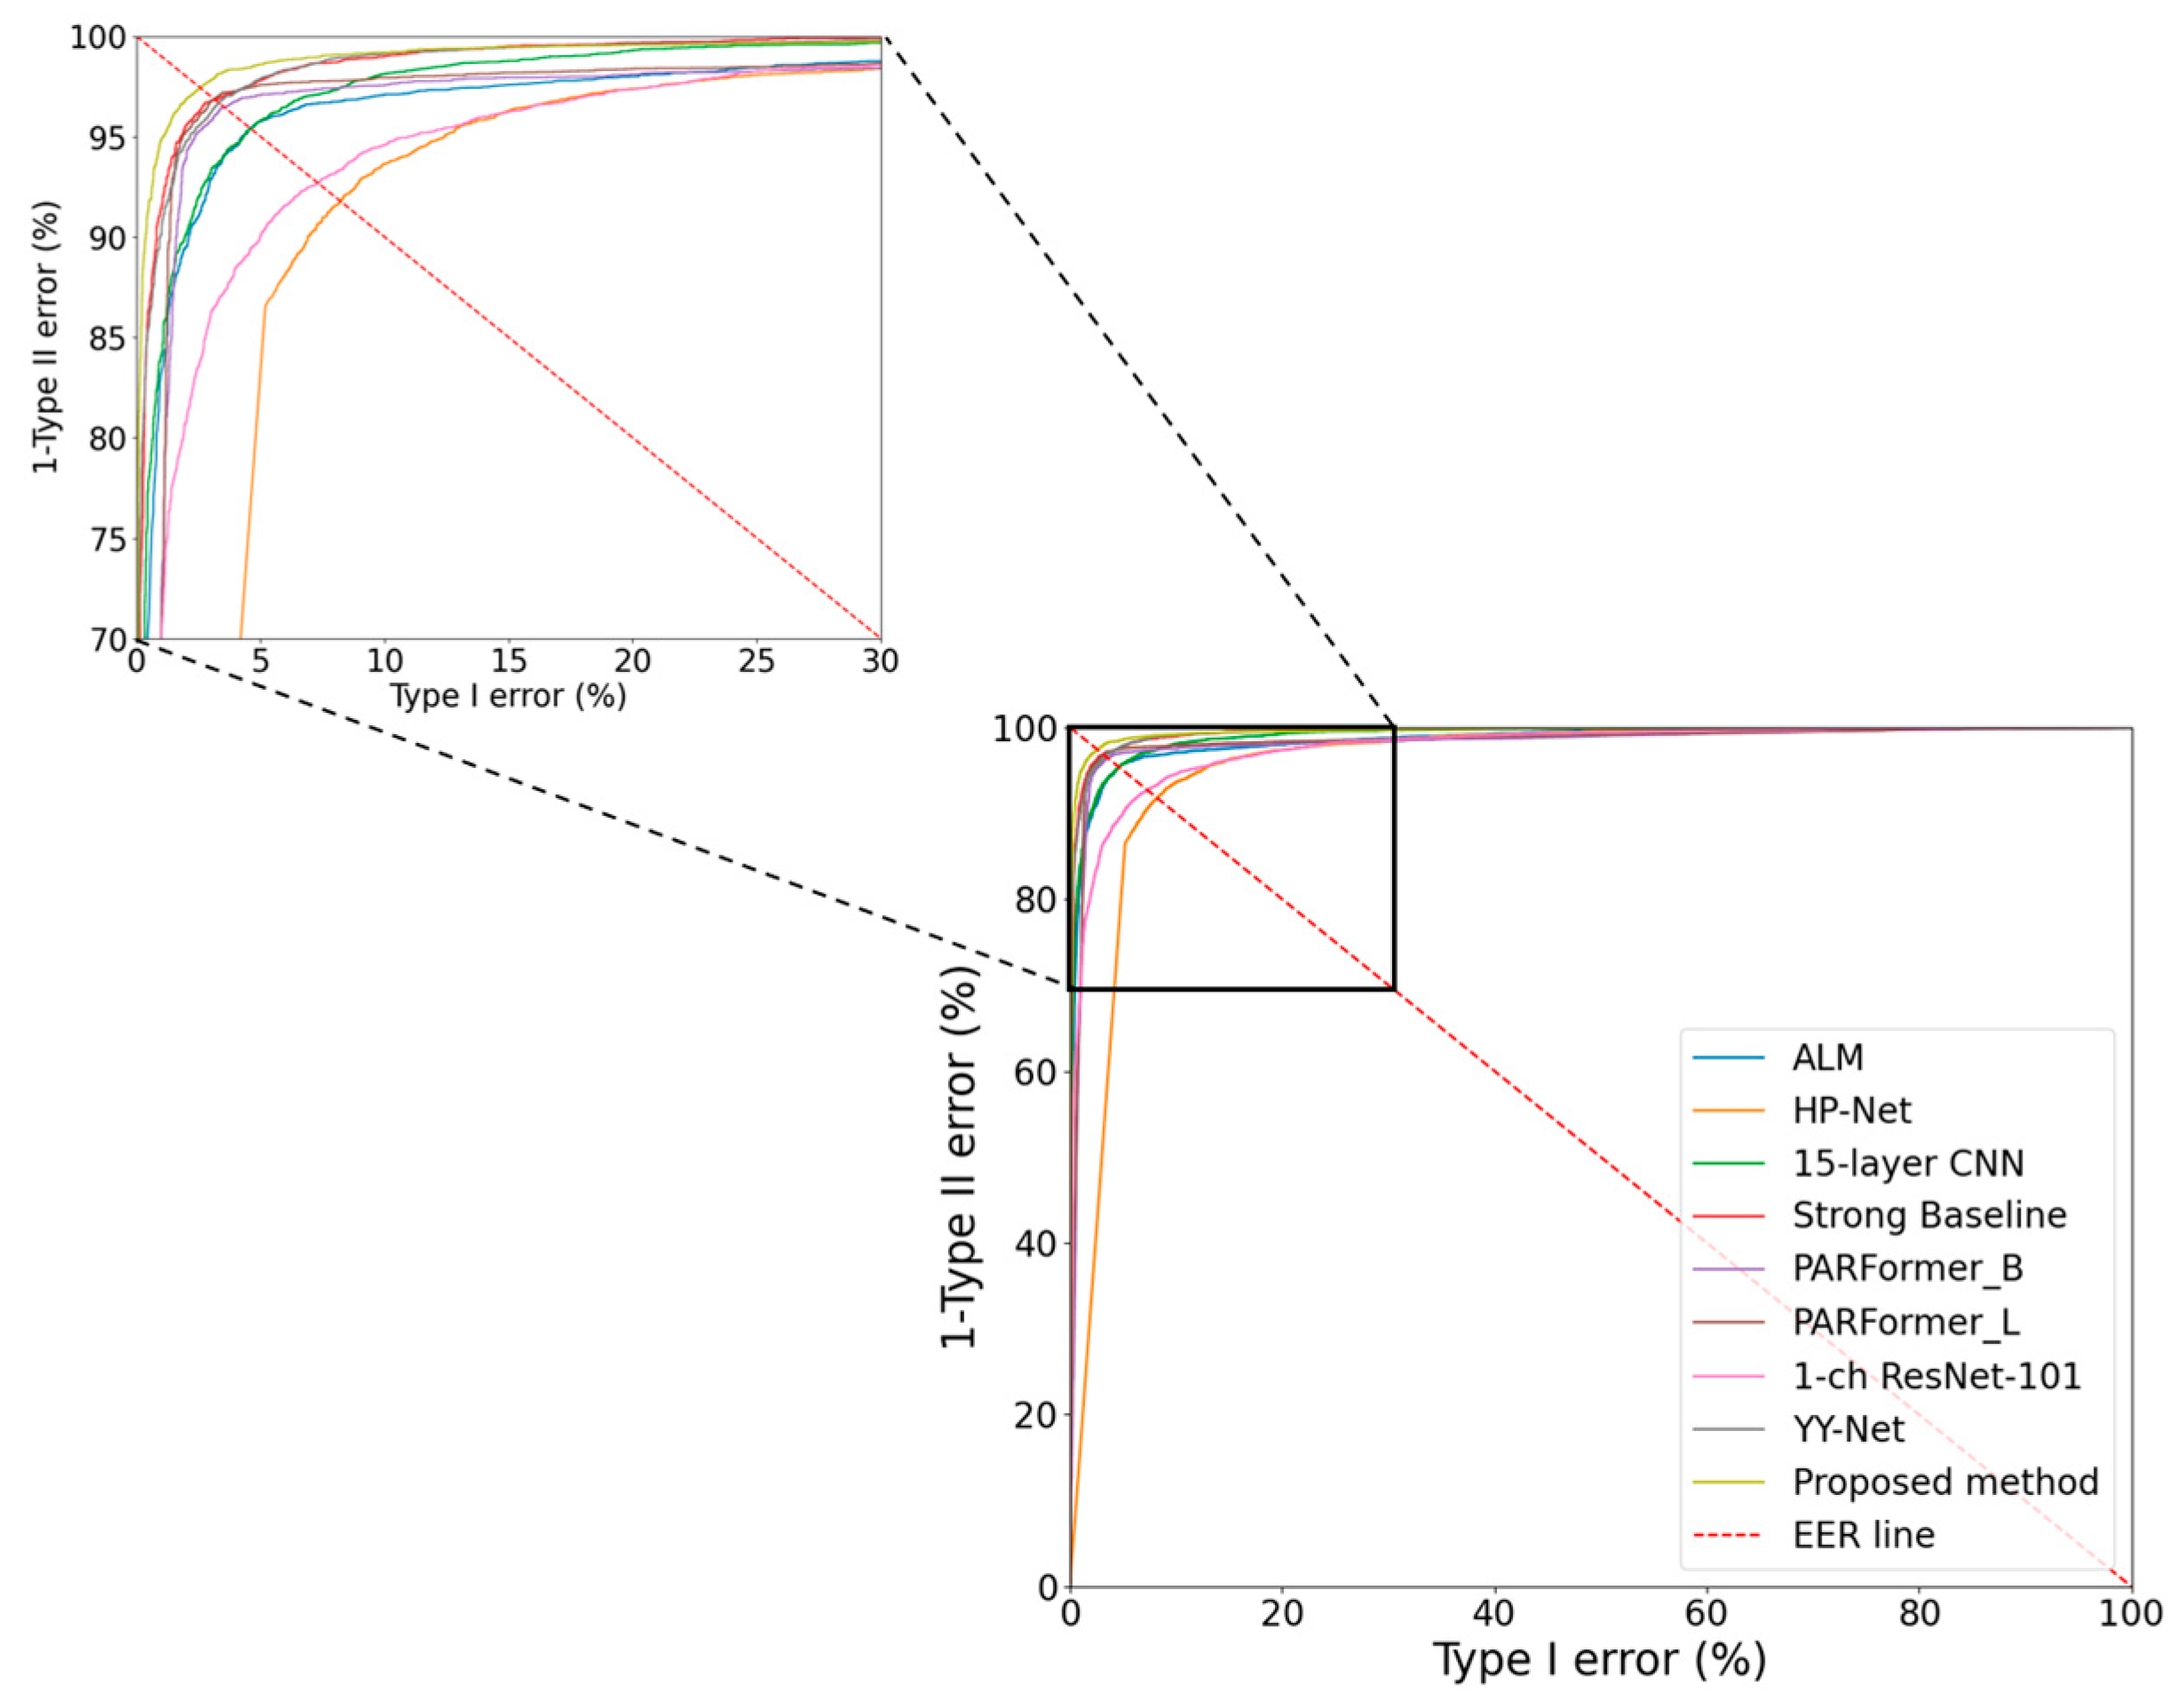
Table 9 shows the average EER obtained by 5-fold cross-validation of the SOTA method in Section 4.4.2. From Table 9, the average EER of the RBSG-Net is 2.429%, which is the lowest compared to SOTA methods. The results in Table 8 and Table 9 demonstrate that the RBSG-Net has a high generalization performance compared to SOTA methods in different experimental settings. Figure 9 shows the ROC curve and the EER line to visually represent the results.

4.5. Testing of Proposed Method with DBGender-DB2 Dataset

NIR images utilize infrared light at wavelengths close to visible light, so they have a higher resolution than LWIR images, which are thermal images. Due to these characteristics, NIR images tend to outperform LWIR images in gender recognition tasks. However, NIR images require an additional illuminator to acquire, and are more difficult to acquire in low light conditions than LWIR images and are more sensitive to changes in the surrounding environment. In contrast, LWIR images are acquired using the heat of the object, so no additional illuminator is required, and images can be acquired even under low illumination conditions, so they have a wider range of applications than NIR images.
In this subsection, to compare the performance of the proposed method for gender recognition in images using infrared light of various wavelengths, the DBGender-DB2 thermal dataset, consisting of LWIR images, is used as the second experimental data.

4.5.1. Ablation Study: Comparative Analysis of RBSG-Net with Various Networks

Ablation studies were conducted to demonstrate the effectiveness of the RBSG-Net on various semantic segmentation and classification networks using the DBGender-DB2 thermal dataset. The experimental setup was the same as the models mentioned in Section 4.3. In Table 10, ‘w/o segmentation’ refers to the gender recognition performance using only the classification network, DaViT-Base, without the semantic segmentation network. As shown in Table 10, the RBSG-Net can use various semantic segmentation networks to improve performance compared to using only a classification network. In particular, the lowest EER of 8.303% was achieved using the U-Net, so the U-Net was adopted as the semantic segmentation network for further experiments.
Table 11 shows the results of the gender recognition performance comparison experiment when various classification networks are used in the RBSG-Net. In Table 11, ‘w/’ refers to the EER performance of the RBSG-Net using segmentation information to perform gender recognition. The experimental results show that performance was improved for all classification networks. Compared to the different models, the DaViT-Base model showed the best performance. These results demonstrate that the RBSG-Net can flexibly utilize various networks in gender recognition tasks for LWIR images.

4.5.2. Comparisons of Gender Recognition Accuracy with SOTA Methods

To compare the performance of body-based gender recognition in this study, a comparative experiment was conducted with the SOTA method. As shown in Table 12, the average EER of the second-best model, PARFormer-L, was 11.668%, and the average EER of the proposed model, the RBSG-Net, was 8.303%, which is a reduction of about 3.365%.
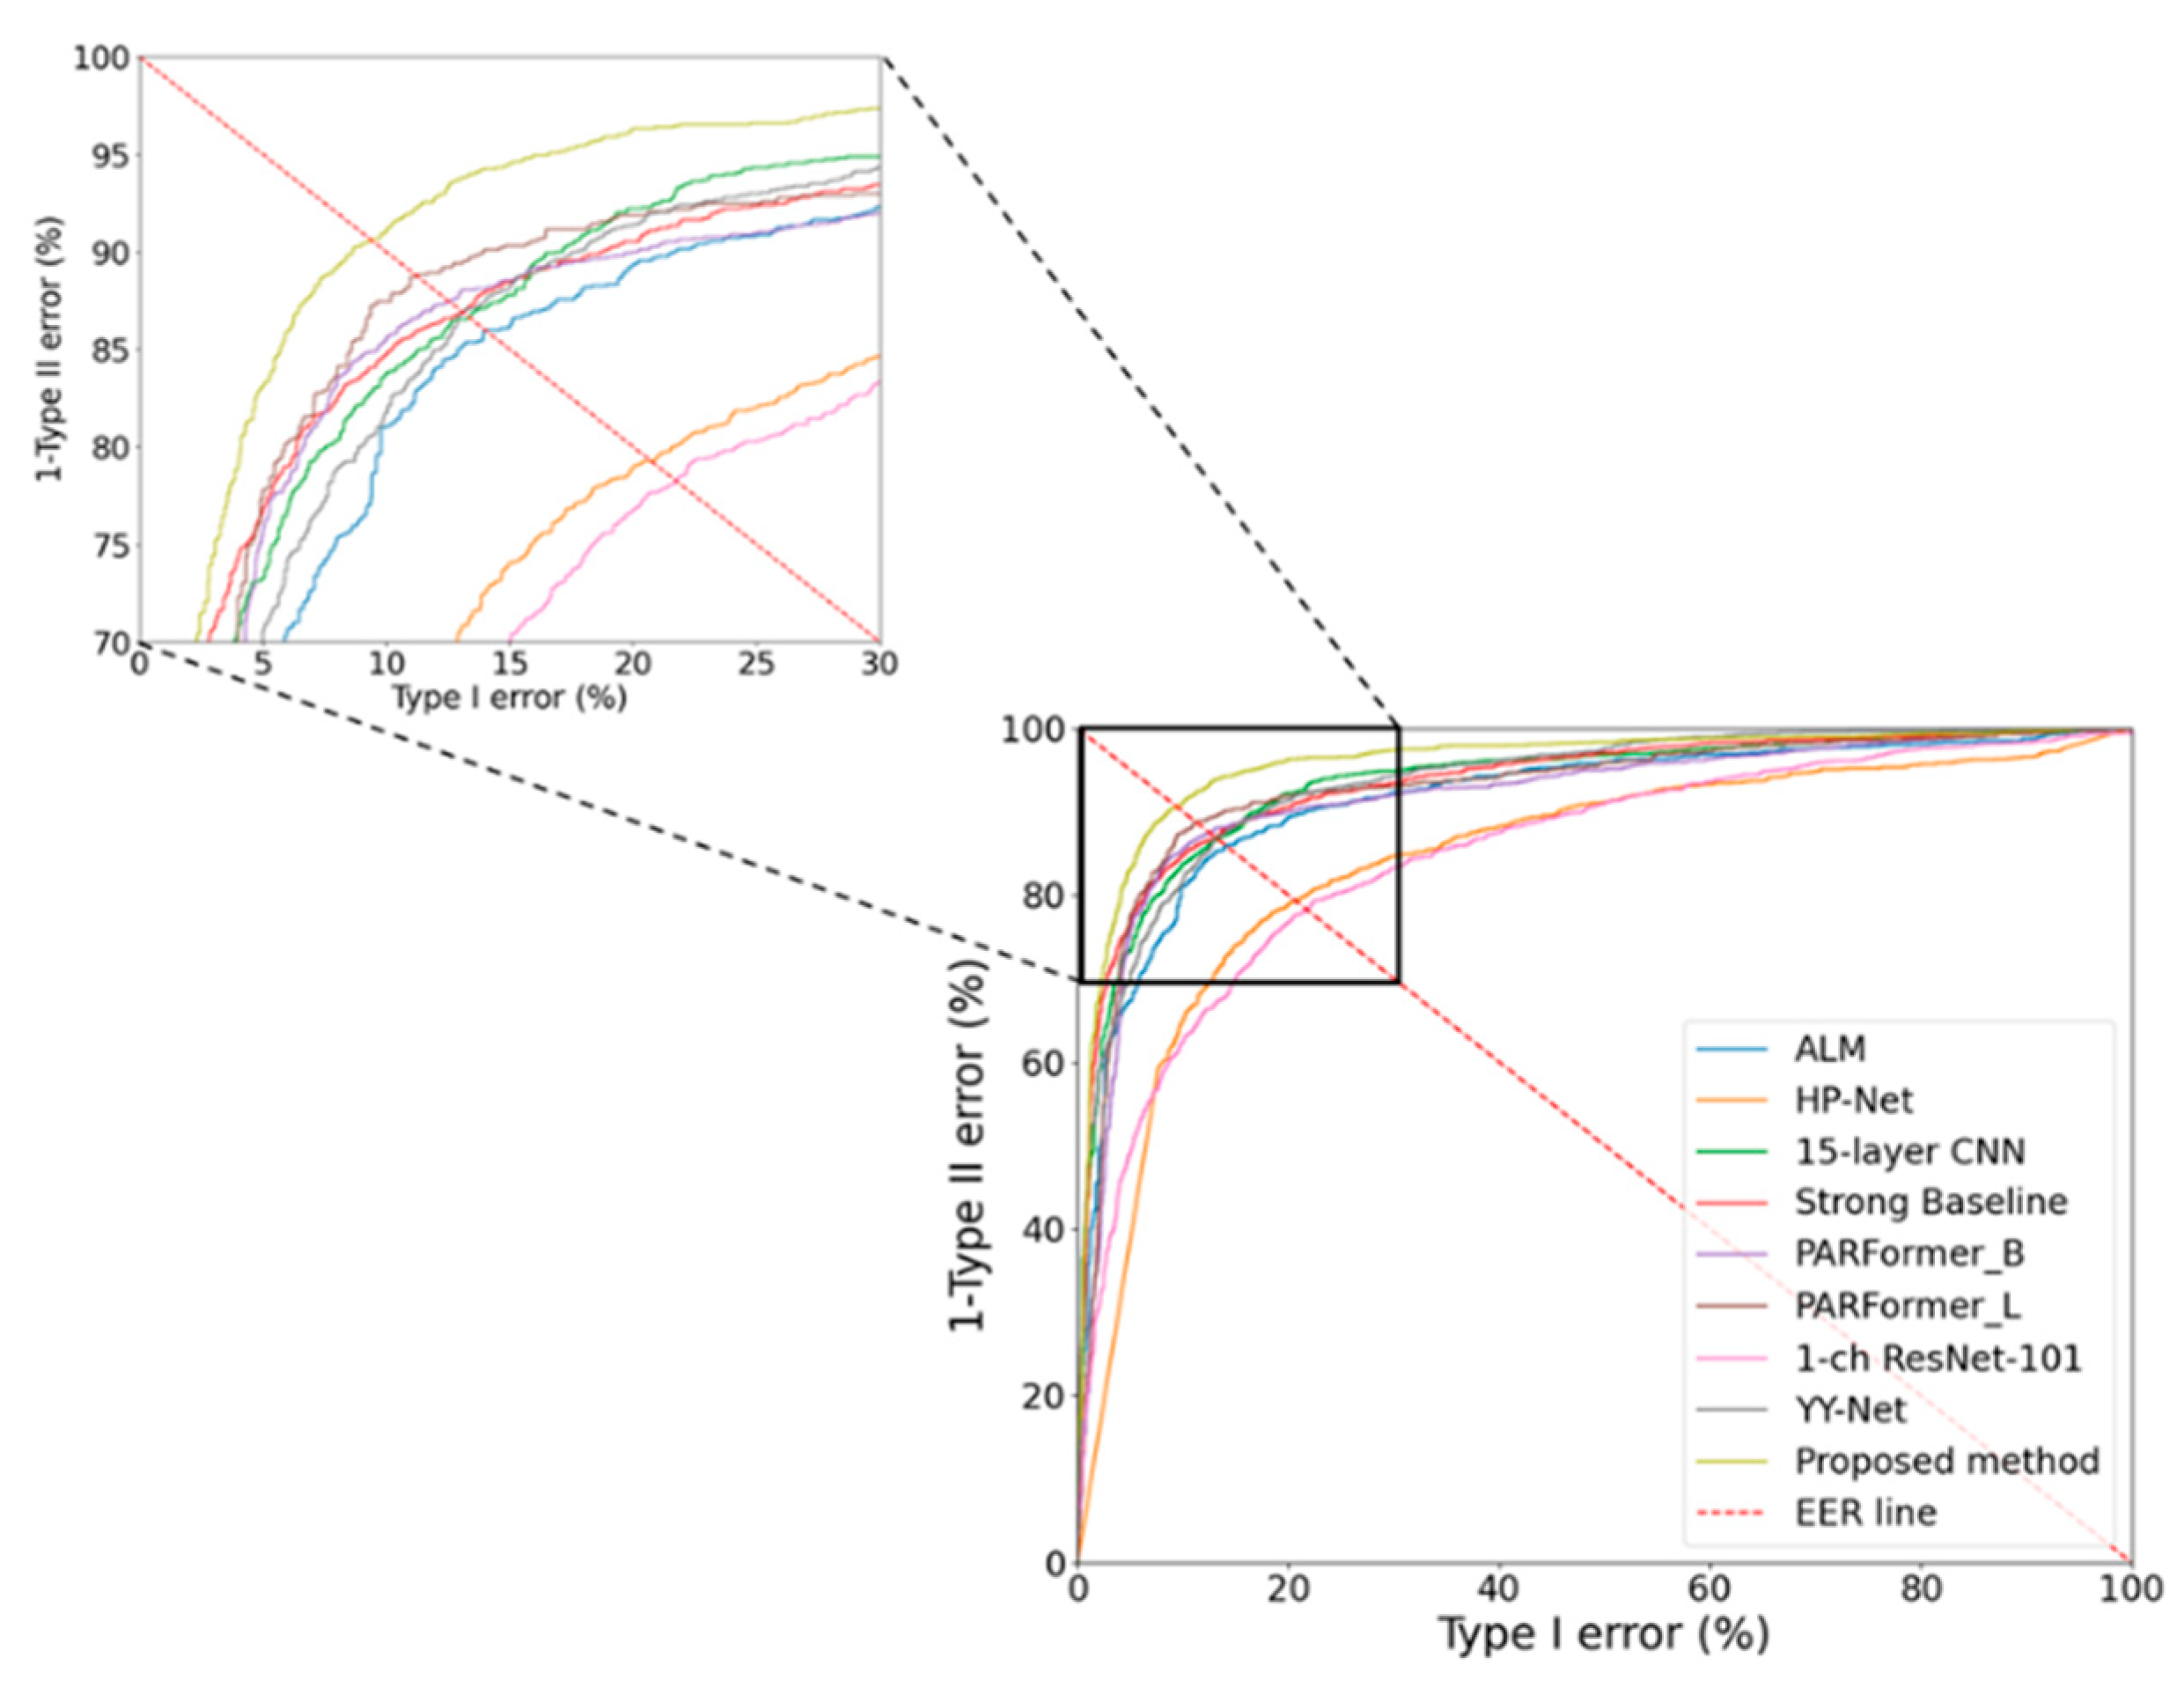
The following Figure 10 shows the ROC curves of the SOTA and proposed methods for gender recognition of the DBGender-DB2 thermal dataset. The intersection of the EER line and the ROC curve represents the EER value, and it is visually shown that the proposed method, the RBSG-Net, has the lowest EER value among the other comparison models.

4.6. Comparison of Gender Recognition Accuracy across Heterogeneous Datasets with SOTA Methods

LWIR and NIR images are acquired using different wavelengths of infrared light, each of which has unique image characteristics. In this subsection, experiments are conducted on a heterogeneous dataset using images of different wavelengths. The results of the experiments are shown in Table 13. Using the SYSU-MM01 NIR dataset as the training set and the DBGender-DB2 thermal dataset as the test set, the EER of the proposed method was measured to be 22.777%. On the other hand, when training with the DBGender-DB2 thermal dataset and testing with the SYSU-MM01 NIR dataset, the EER was found to be 26.728%. Compared with other methods, these results show that the RBSG-Net has a high gender recognition ability despite the domain differences between IR images, indicating that the model has a good generalization performance that can be practically applied in various environmental conditions and IR wavelengths. This has important implications for the use of IR images in different wavelengths in security, surveillance, and workforce management systems.

4.7. Testing of Proposed Method with Visible Light Images

As demonstrated in Section 4.3, Section 4.4 and Section 4.5, the proposed RBSG-Net outperformed existing methods in gender recognition using infrared light images. However, to show that the proposed method also works well for visible light images acquired in a surveillance environment, additional experiments were conducted using the visible light datasets used in previous studies of Table 8.

4.7.1. Visible Light Datasets and Evaluation Metrics

The pedestrian attribute (PETA) [9] dataset, which has been widely used in previous body-based gender recognition studies, was utilized in this study. The PETA dataset consists of 19,000 pedestrian images from visible light surveillance cameras. To compare the proposed method with existing methods, experiments were conducted using two protocols. The first protocol follows the method of [21] and divides the dataset into training, validation, and test sets (protocol 1). The second protocol follows the method of [53], excluding the MIT dataset, a subset of the PETA dataset, as the training set and using the MIT dataset as the test set (protocol 2). The details of each training, validation, and test dataset configuration are shown in Table 14, and samples of the PETA dataset and MIT dataset are shown in Figure 11.
For a fair comparison with existing methods, overall accuracy and mean accuracy were used as indicators of gender recognition performance. These two metrics are defined by the following Equations (13) and (14).
O v e r a l l   a c c u r a c y = T P + T N T P + T N + F P + F N
M e a n   a c c u r a c y = 1 2 ×   T P T P + F N + T N T N + F P  

4.7.2. Comparisons of Gender Recognition Accuracy with SOTA Methods

In the proposed method, the RBSG-Net, which was the U-Net, was used for the semantic segmentation network, and DeiT-Large [52] was used for the classification network. The U-Net was trained using the Pedestrian Parsing Surveillance Scene (PPSS) dataset [16], and the classification network was pretrained on the ImageNet-1K dataset as described in Section 4.2. Table 15 compares the gender recognition performance measured in the protocol 1 setting. In the protocol 1 setting, the mean accuracy of RBSG-Net is 95.10%, which is about 0.19% higher than the second-best method, DeiT-Large [52]. Also, in the protocol 2 setting, as shown in Table 16, the overall accuracy and mean accuracy of the RBSG-Net are 92.7% and 91.2%, respectively, which are 1% and 0.6% higher than the second-best method, ViT-PGC [53]. This shows that the proposed RBSG-Net works well for visible light images and shows higher recognition performance than the SOTA methods.

5. Discussion

5.1. Comparisons of Algorithm Computational Complexity

In this subsection, the computational complexity between the proposed method is compared with other SOTA methods. The input image size was 384 × 128 pixels. The average processing time per image was measured in both the desktop computer environment, as presented in Section 4.1, and the embedded environment. For the embedded environment, the NVIDIA Jetson TX2 [59] board, shown in Figure 12, was used, which can be used in surveillance systems. The NVIDIA Jetson TX2 consists of an NVIDIA Pascal™ architecture GPU (256 CUDA cores) with 1.33 trillion floating point operations per second (TFLOPS) and 8 GB of memory.
Table 17 compares the computational complexity of the RBSG-Net and SOTA methods in terms of the number of parameters in the model, Giga floating point operations (GFLOPs), and memory usage. Among the SOTA methods, the ALM [19], Strong Baseline [20], and the 15-layer CNN [29] are the lightweight real-time models used in surveillance environments. The RBSG-Net is a sequential structure that extracts prediction maps for human body regions through a semantic segmentation network, followed by feature extraction in a classification network, so it requires more parameters and computation than other models. This means that it is not the best in terms of computational complexity. However, in a desktop environment, the image processing speed is about 58.9 (1000/16.98) frames per second (fps), which can be processed in real time, so it can be used for video surveillance like other models except the HP-Net [11].
In addition, as shown in Table 8, Table 9, Table 12, Table 13, Table 15 and Table 16, and Figure 8, Figure 9 and Figure 10, the RBSG-Net performs the best in terms of gender recognition accuracy compared to other models. RBSG-Net outperforms the other models on the heterogeneous dataset shown in Table 13, showing high performance in terms of gender recognition accuracy and infrared spectrum generalization. Although there may be some challenging issues in terms of processing time, the proposed model is better than others in terms of gender recognition accuracy, which is the main purpose of this research.

5.2. Analysis with Grad-CAM

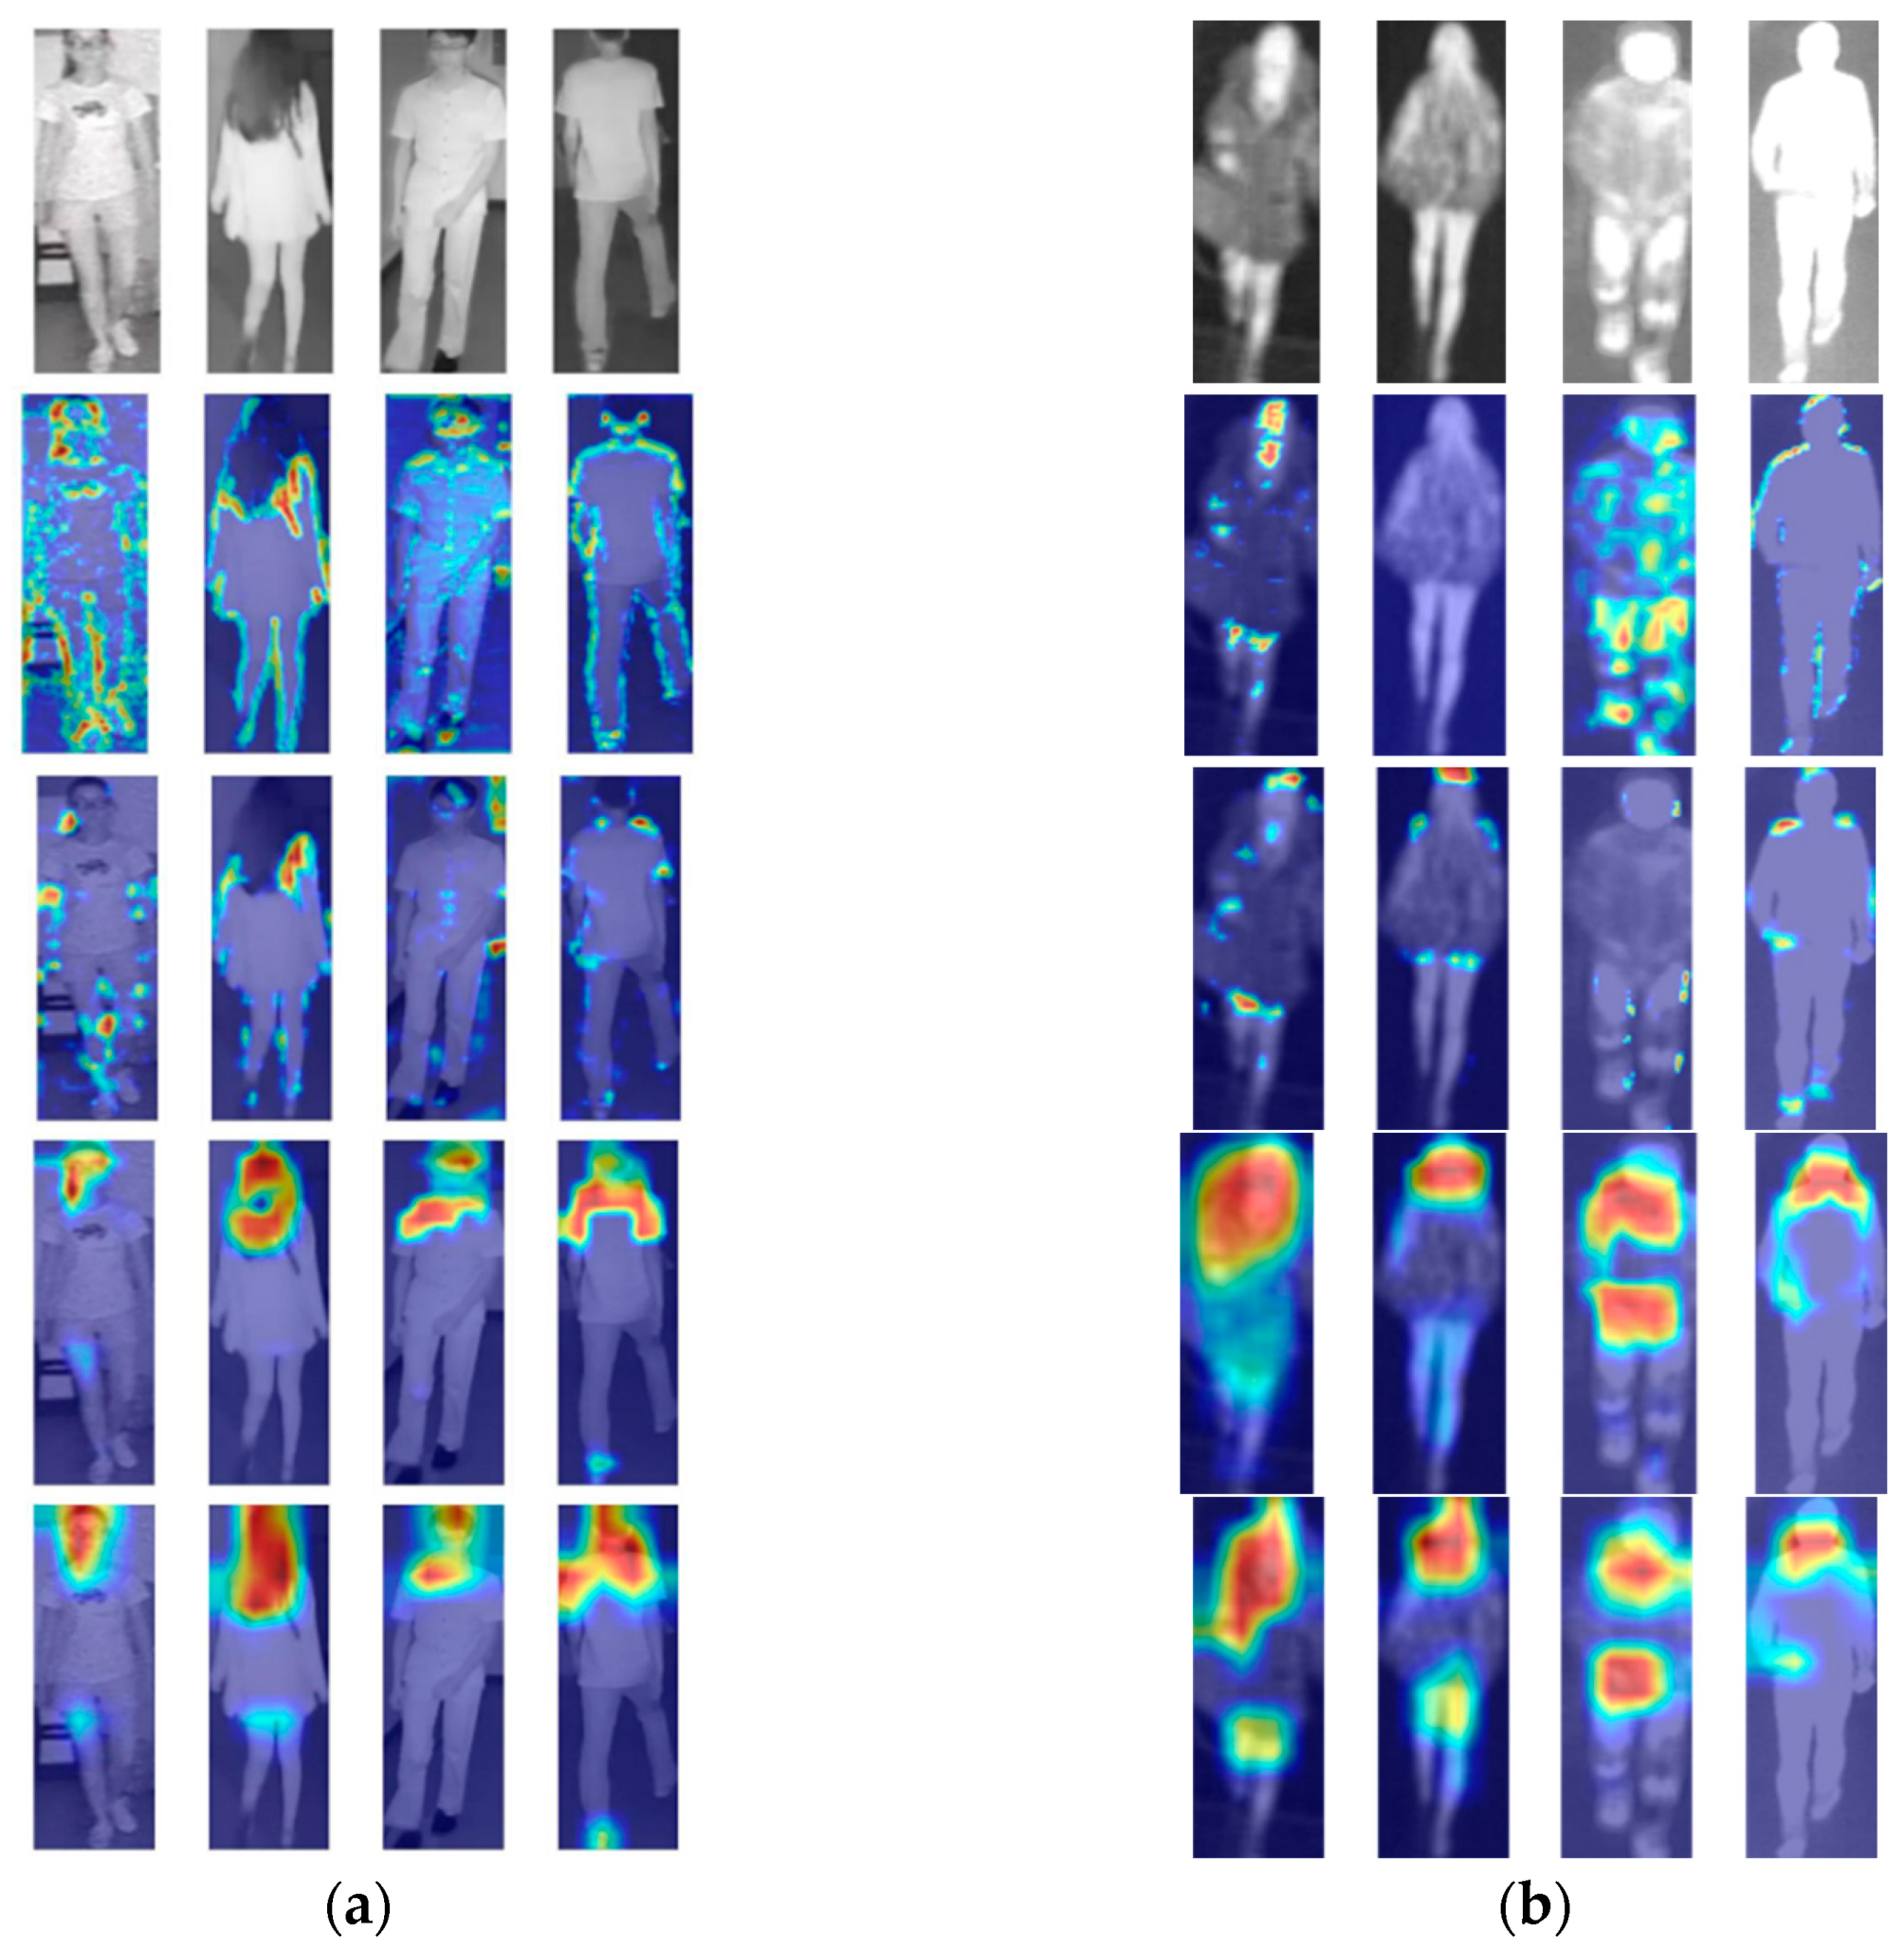
It is a challenging task to analyze the reasons for the inference results of deep learning-based gender recognition models. In this subsection, gradient-weighted class activation mapping (GradCAM) [60] was used to analyze the reasons for the inference results of the RBSG-Net. GradCAM provides the interpretability of the trained model by mapping the feature regions in the input image that have the most influence on the inference results. Figure 13a,b show the GradCAMs obtained at each stage of the DaViT-Base [33] model for the front and back view of a female and male image from the SYSU-MM01 NIR and DBGender-DB2 thermal datasets. The GradCAM shown in Figure 13 is an indicator of the degree of activation of the feature values for model prediction, with regions colored in red indicating strong activation and regions colored in blue indicating weak activation.
As can be seen in Figure 13, the deep stage, or deep layer, captures semantic features, while the shallow stage focuses on primitive features. Since the proposed RBSG-Net in this study focuses on the human body regions extracted from the semantic segmentation network, it focuses on the primitive features such as texture and edges within the human body regions for all the images in the shallow layer. This shows that feature extraction was performed by focusing on the features present within the human body region, which is the foreground region for gender recognition. The features extracted in stage 4 are the semantic features used for gender recognition, which are also features captured within the human body region. These features are the key features that allow the model to distinguish between females and males.
For females, the focus is on the facial area in the front image and the hairstyle in the back image. Also, unlike males, females are often dressed in short shorts or skirts, so you can see that the focus is also on the exposed legs, which is a female feature. On the other hand, the male focuses on the face and shoulders in the front view and the head and shoulders in the back view. In this way, there is a visual difference in the areas the model focuses on when recognizing gender.

5.3. Statistical Analysis

In this subsection, the statistical significance between the proposed method and the second-best model is analyzed. Figure 14 shows the t-test result [61] between the second-best model, YY-Net [21], and the proposed method in Table 9, which compares the gender recognition performance on the SYSU-MM01 NIR dataset. The t-test resulted in a p-value of 0.45 × 10⁻¹, which means that there is a statistically significant difference at the 95% confidence interval. In addition, the Cohen’s d-value [62] is used to verify the effect size of the proposed method. If the Cohen’s d-value is close to 0.2, it indicates a small effect size; if it is close to 0.5, it indicates a medium effect size; and if it is close to 0.8, it indicates a large effect size. The Cohen’s d-value of the proposed RBSG-Net in this study is 1.641, which indicates a large effect size. This confirms that the proposed method is statistically and significantly more accurate than the second-best model, YY-Net.
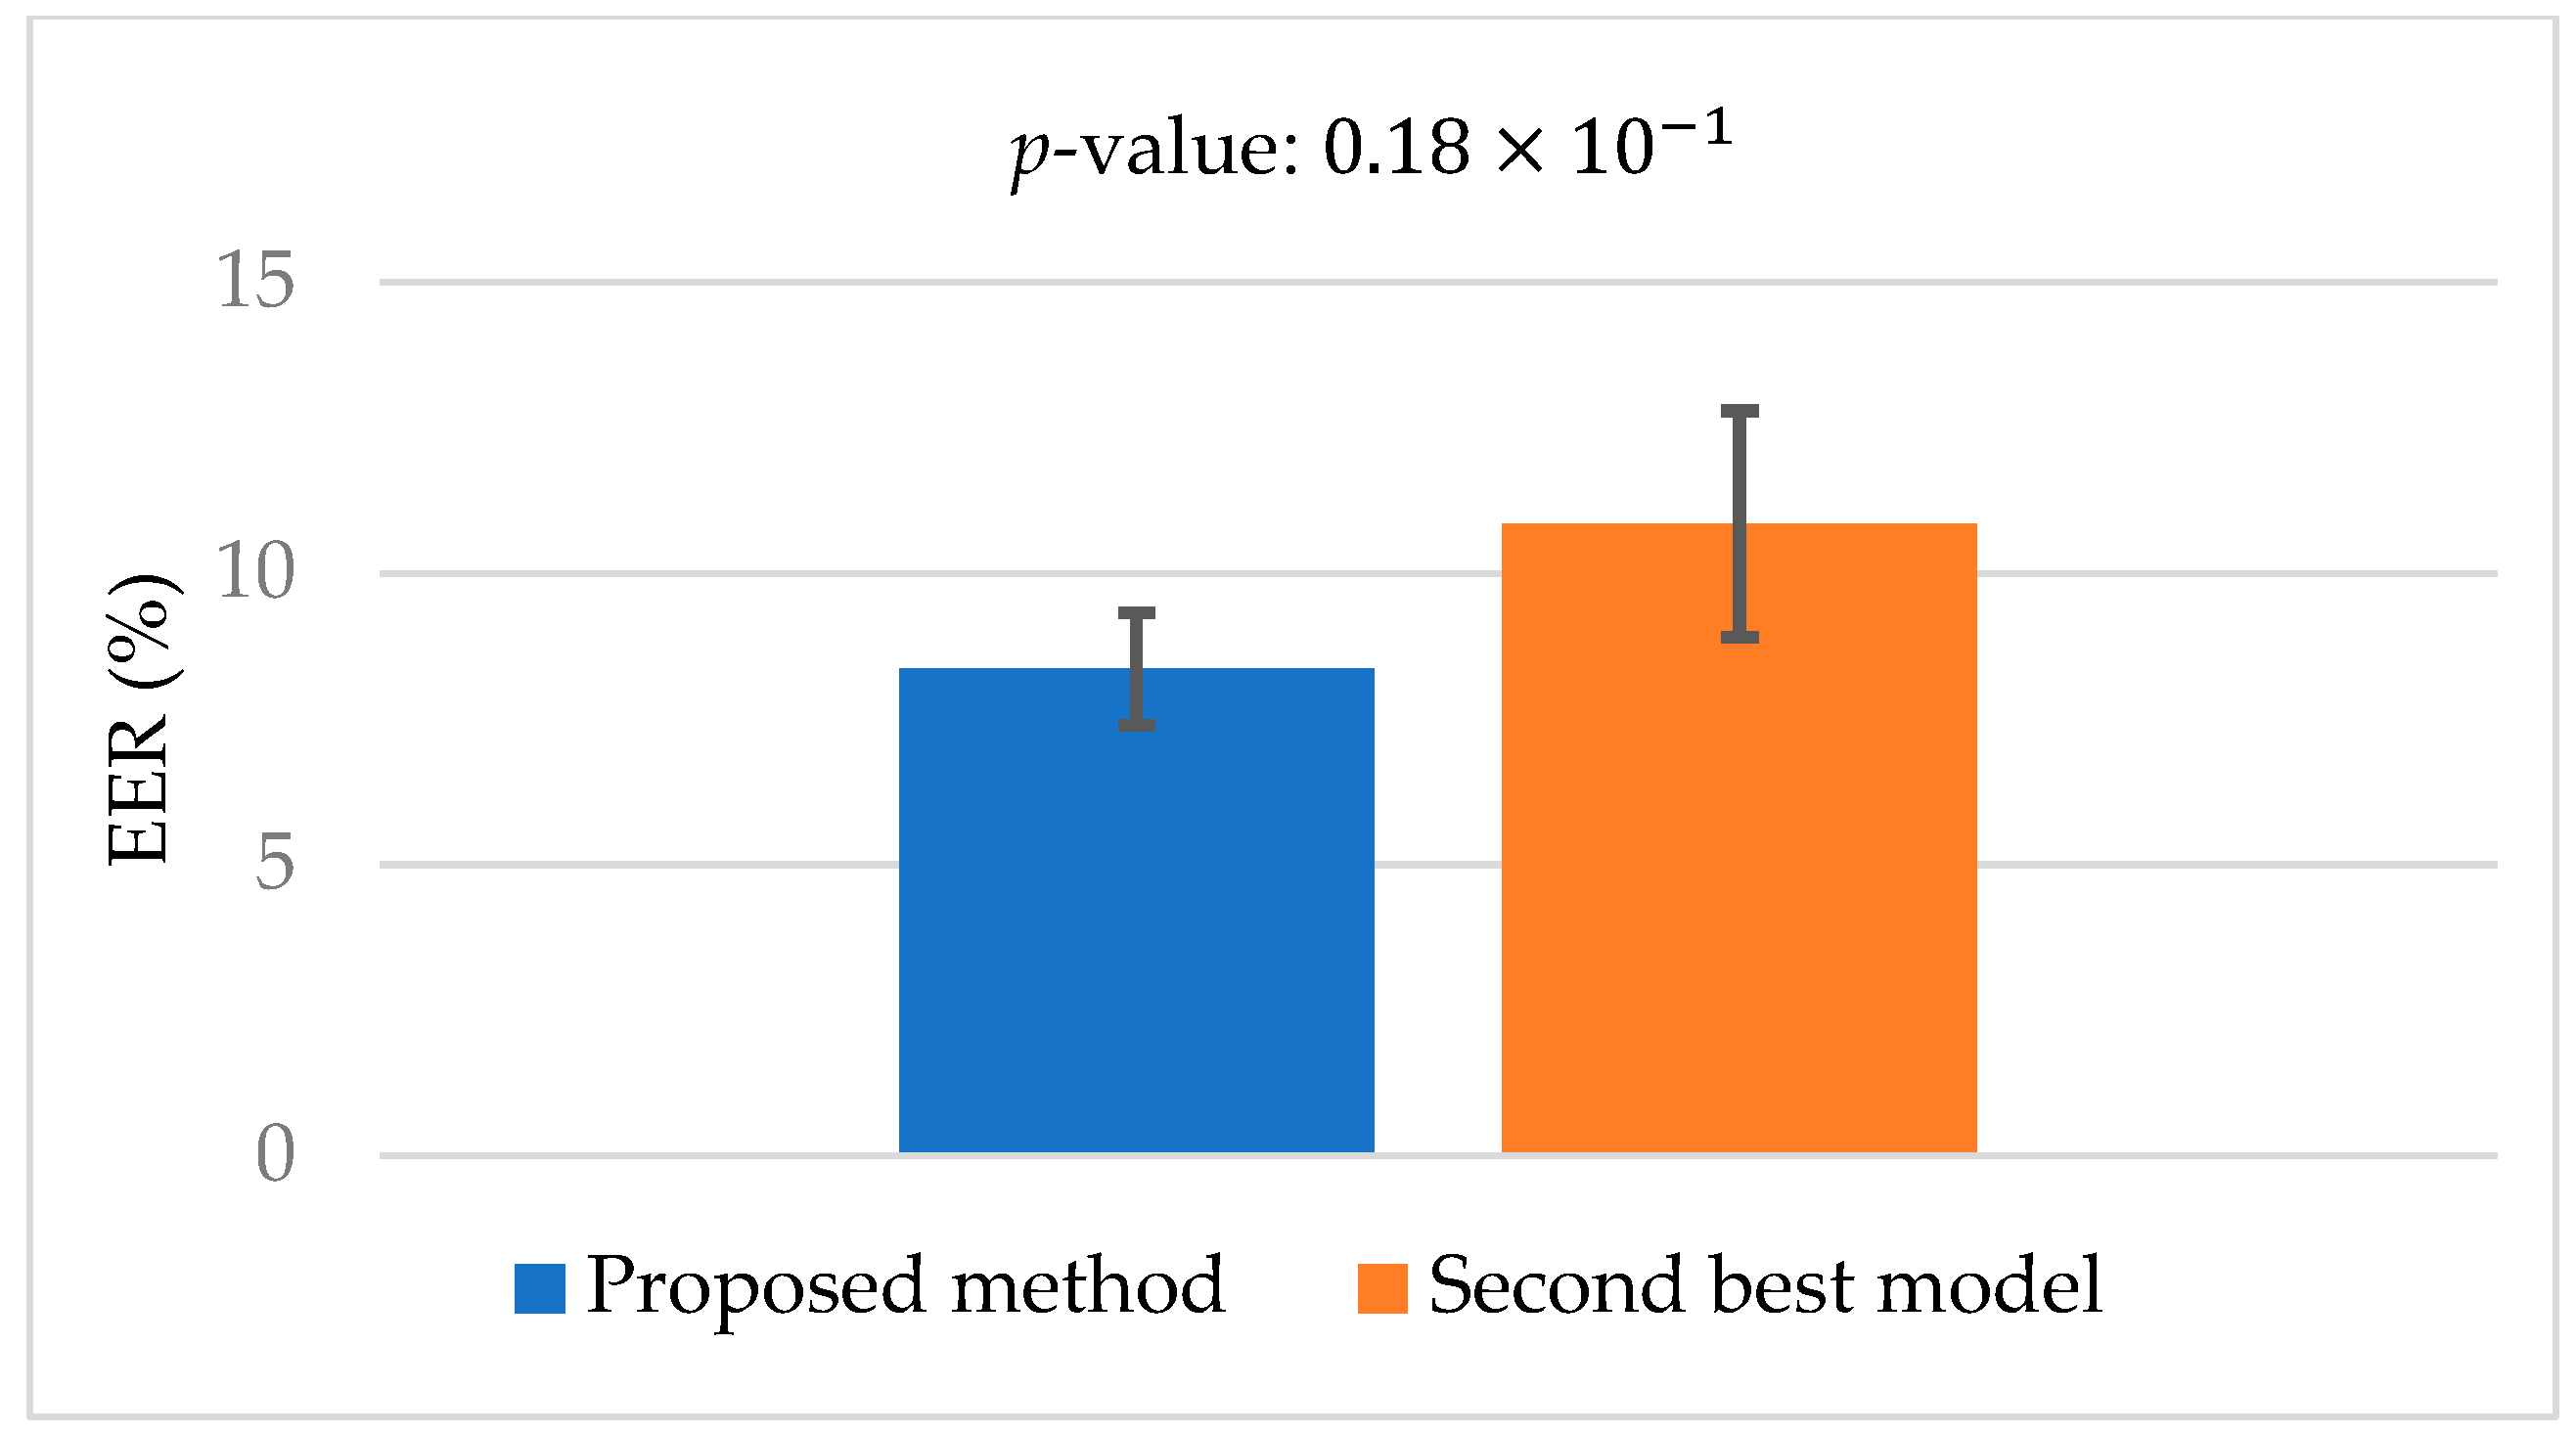
Figure 15 shows the t-test result between the second-best model, PARFormer-L [23], and the proposed method in Table 12, which compares the gender recognition performance on the DBGender-DB2 dataset. The t-test result shows that the p-value is 0.18 × 10⁻¹, which means that there is a statistically significant difference at the 95% confidence interval. Also, the Cohen’s d-value is 0.961, indicating a large effect size. These analyses show that the proposed method has high accuracy on both DBGender-DB2 thermal and SYSU-MM01 NIR datasets with statistical significance compared to the second-best model.

5.4. Analysis about Correct and Incorrect Cases

In this subsection, the correct and incorrect recognition cases where the RBSG-Net performed gender recognition are analyzed. To understand the areas that caused the RBSG-Net to recognize gender correctly or incorrectly, only the GradCAM obtained from stage 4 of the classification network DaViT-Base was visualized. Figure 16a,b shows an example image and the GradCAM of a case with correct classification of a female and a male, respectively. Even when some body parts are occluded by objects, as shown on the right side of Figure 16a and on the left side of Figure 16b, the features required for gender recognition within the human body region are well located. It can also be seen that accurate gender recognition is performed even with images taken in a dark environment.
Figure 17 shows an incorrect case of the RBSG-Net. In Figure 17a, a female with a short hairstyle is misclassified as male by focusing on the hairstyle as shown in the GradCAM image because it is difficult to distinguish the gender of the female based on the back view alone, while in the image on the left in Figure 17b, a male is misclassified as female based on the hairstyle. The image on the right in Figure 17b is misclassified as female because of the exposed leg area, which is an important female feature. This shows that when the RBSG-Net recognizes gender in cases where it is difficult to see the face from the back, hairstyle or body parts can affect the recognition performance.

5.5. FD Estimation for Human Body Segmentation

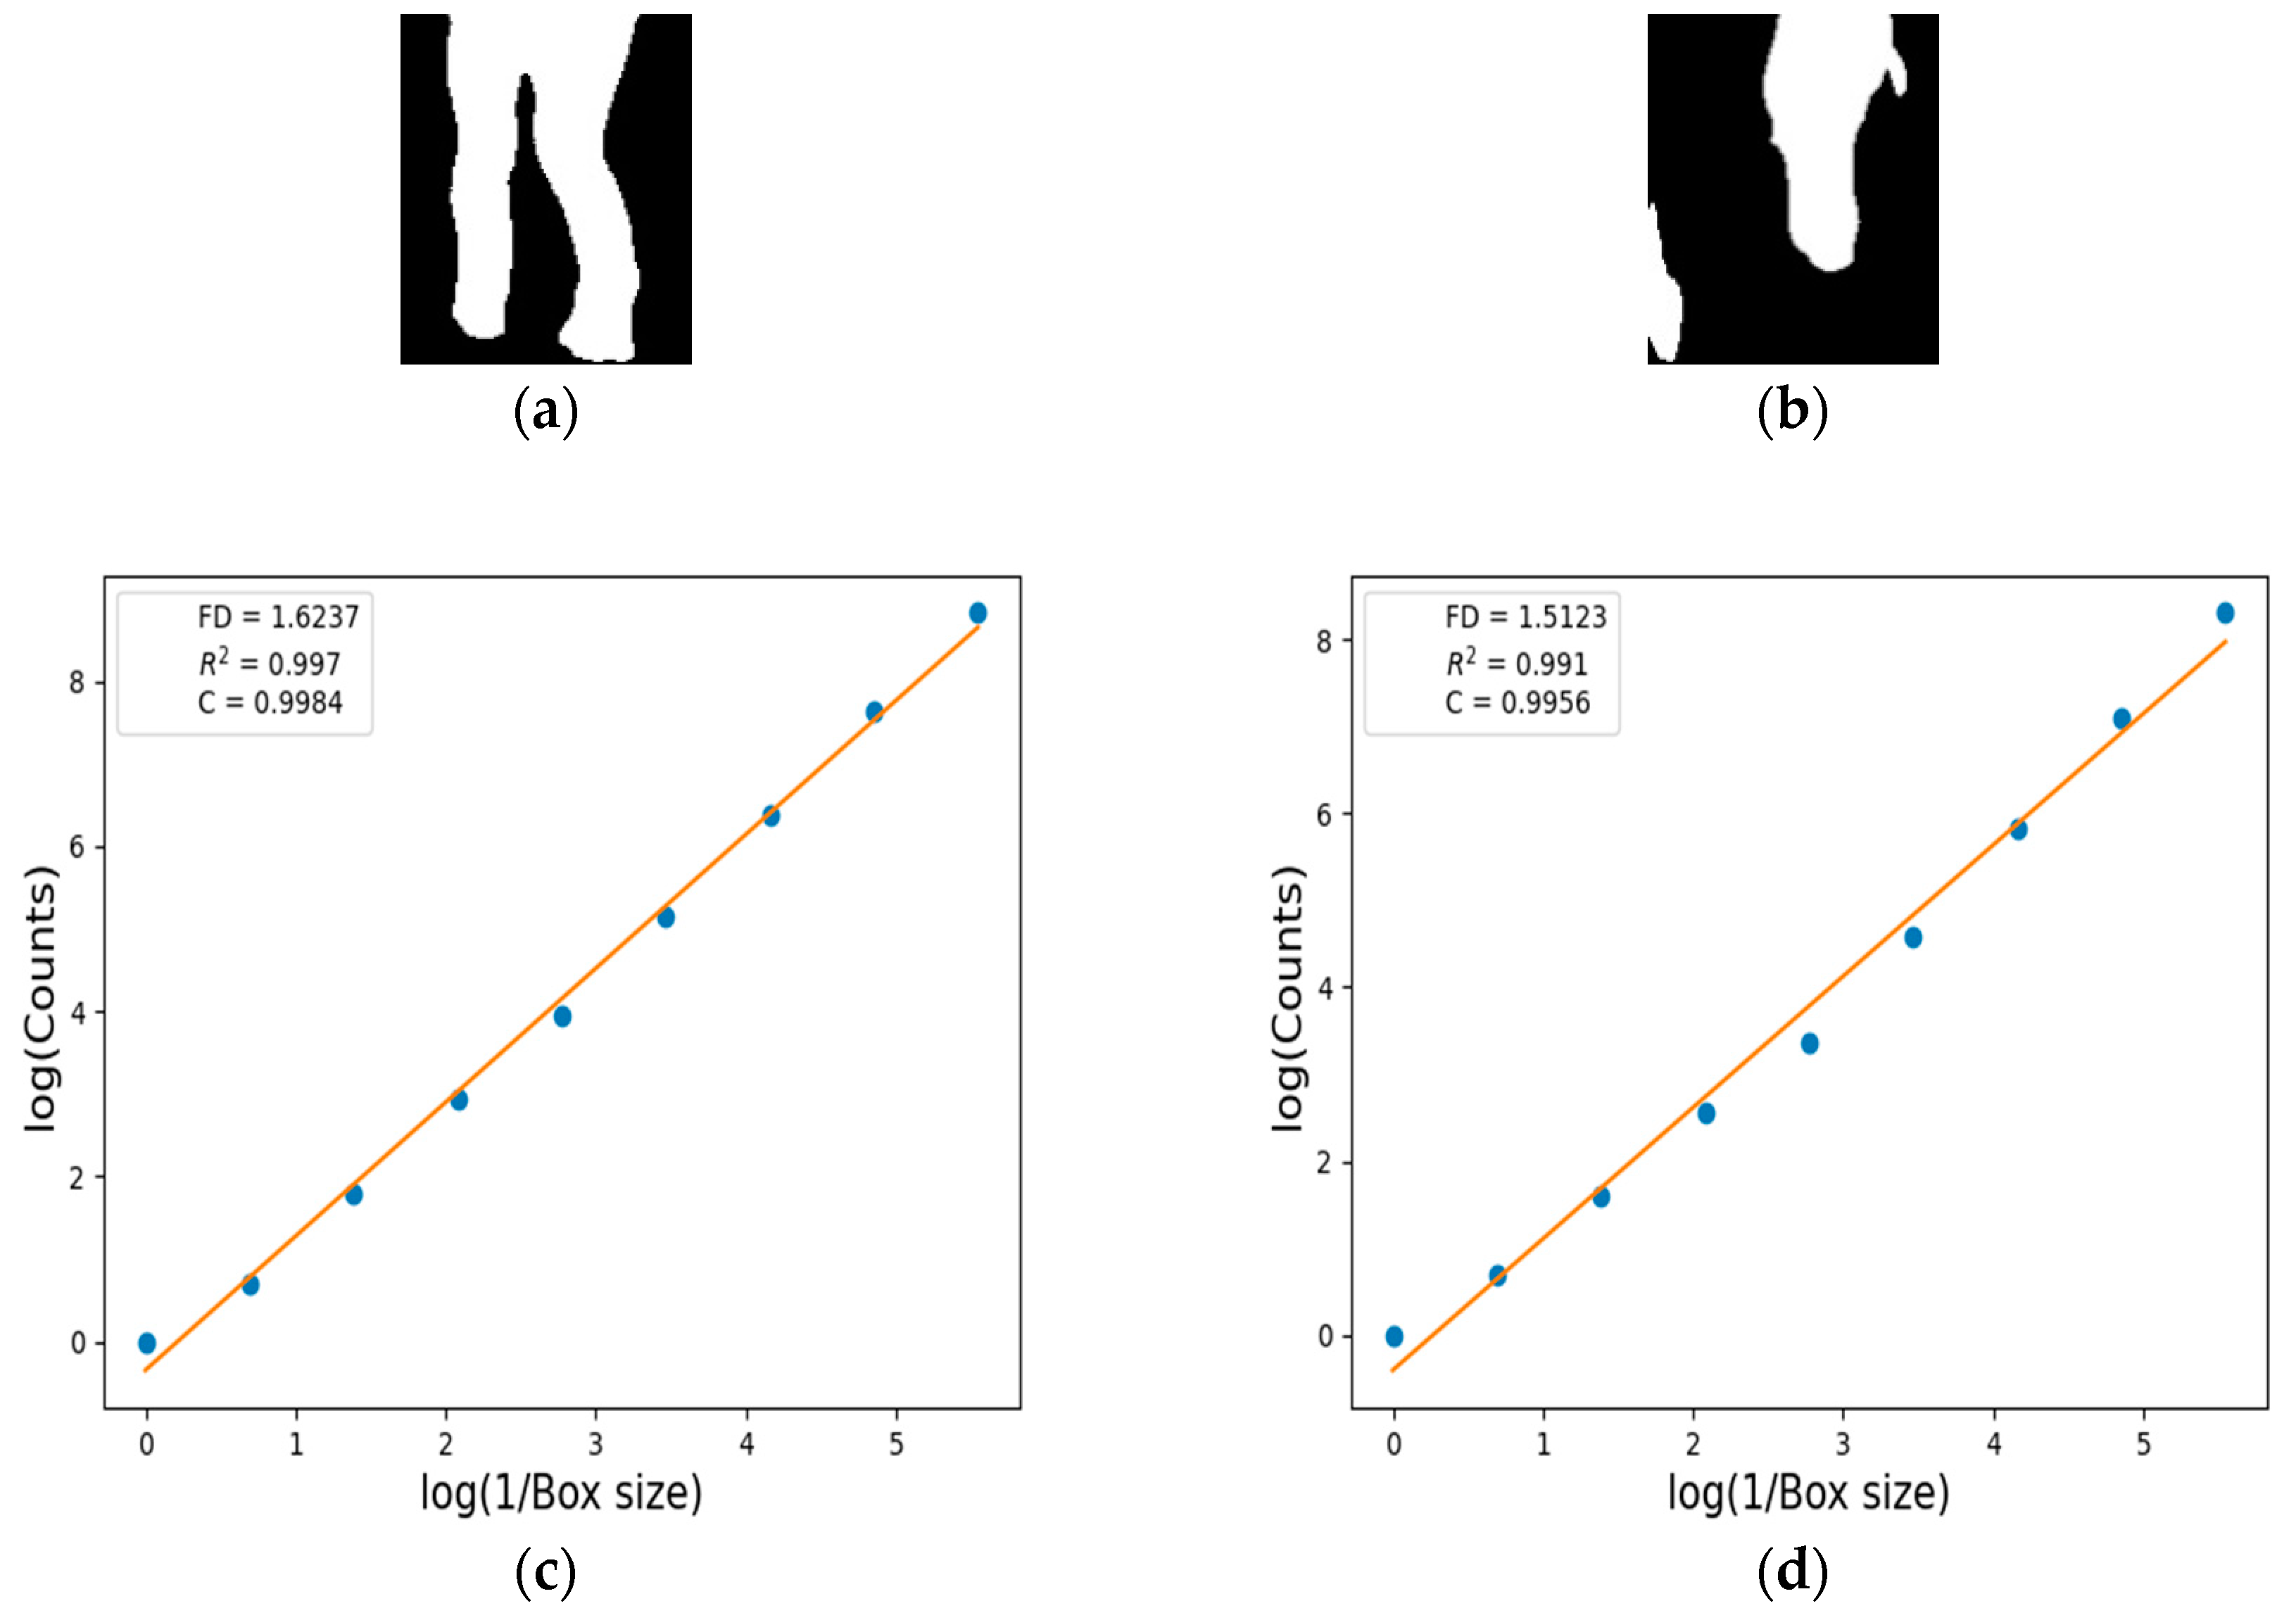
The FD analysis was conducted on the segmented human regions within the input images for the task of gender recognition. To calculate the FD score, the box-counting method was applied as outlined in Algorithm 1 of Section 4.3, and subsequently computed the correlation coefficient (C) between the box size (ϵ) and the corresponding number of boxes N(ϵ), as well as the coefficient of determination (R2) for the regression line.
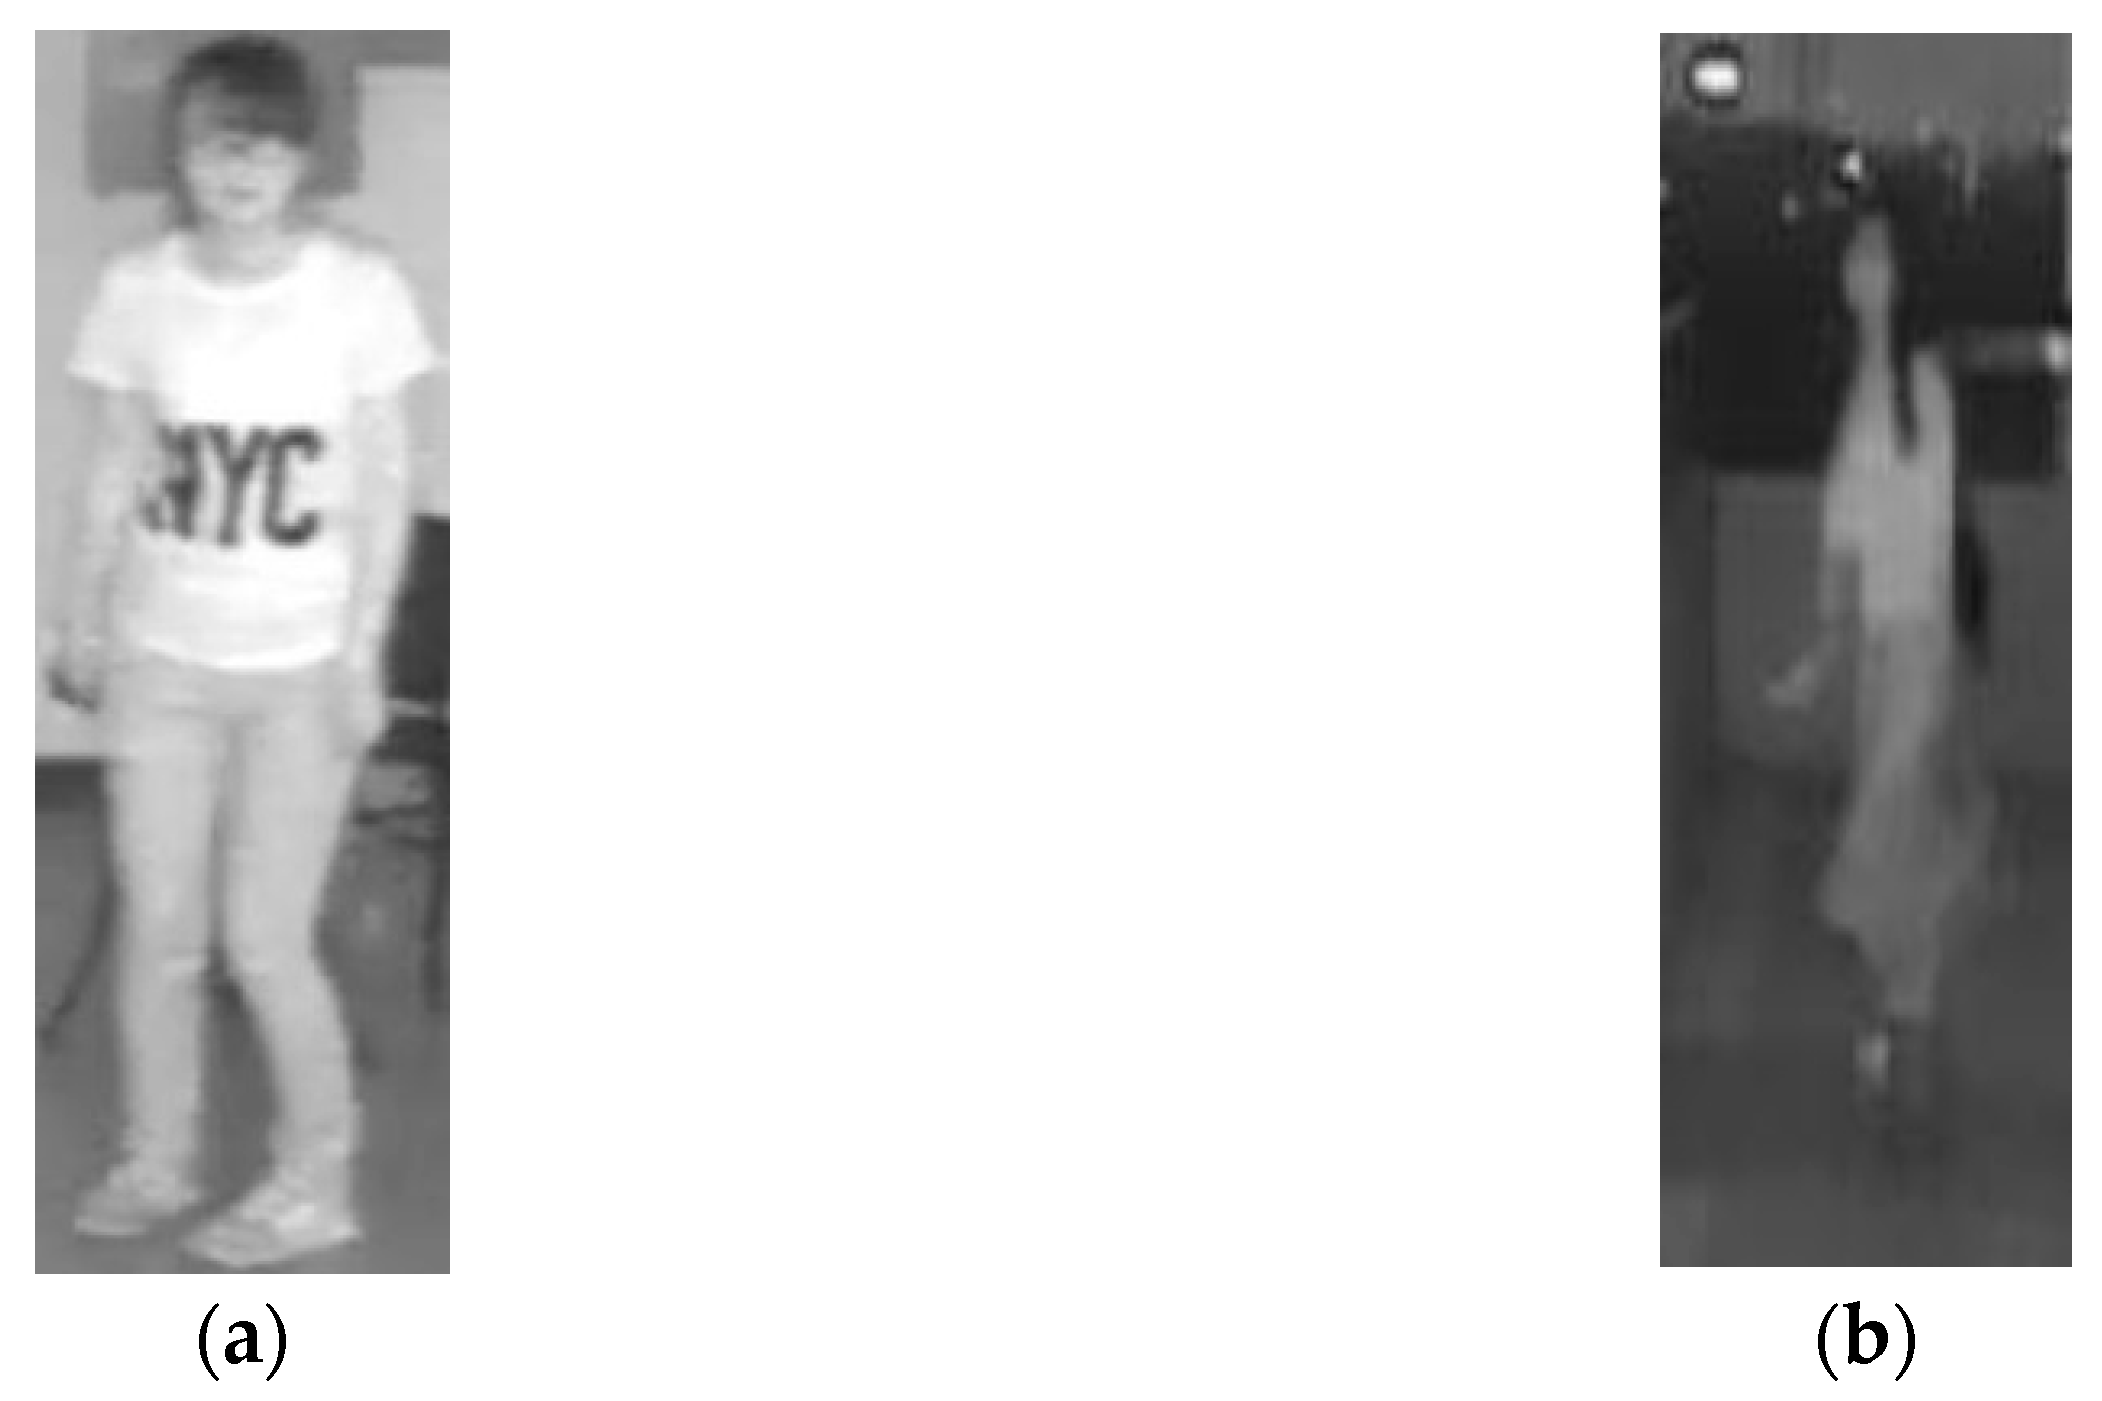
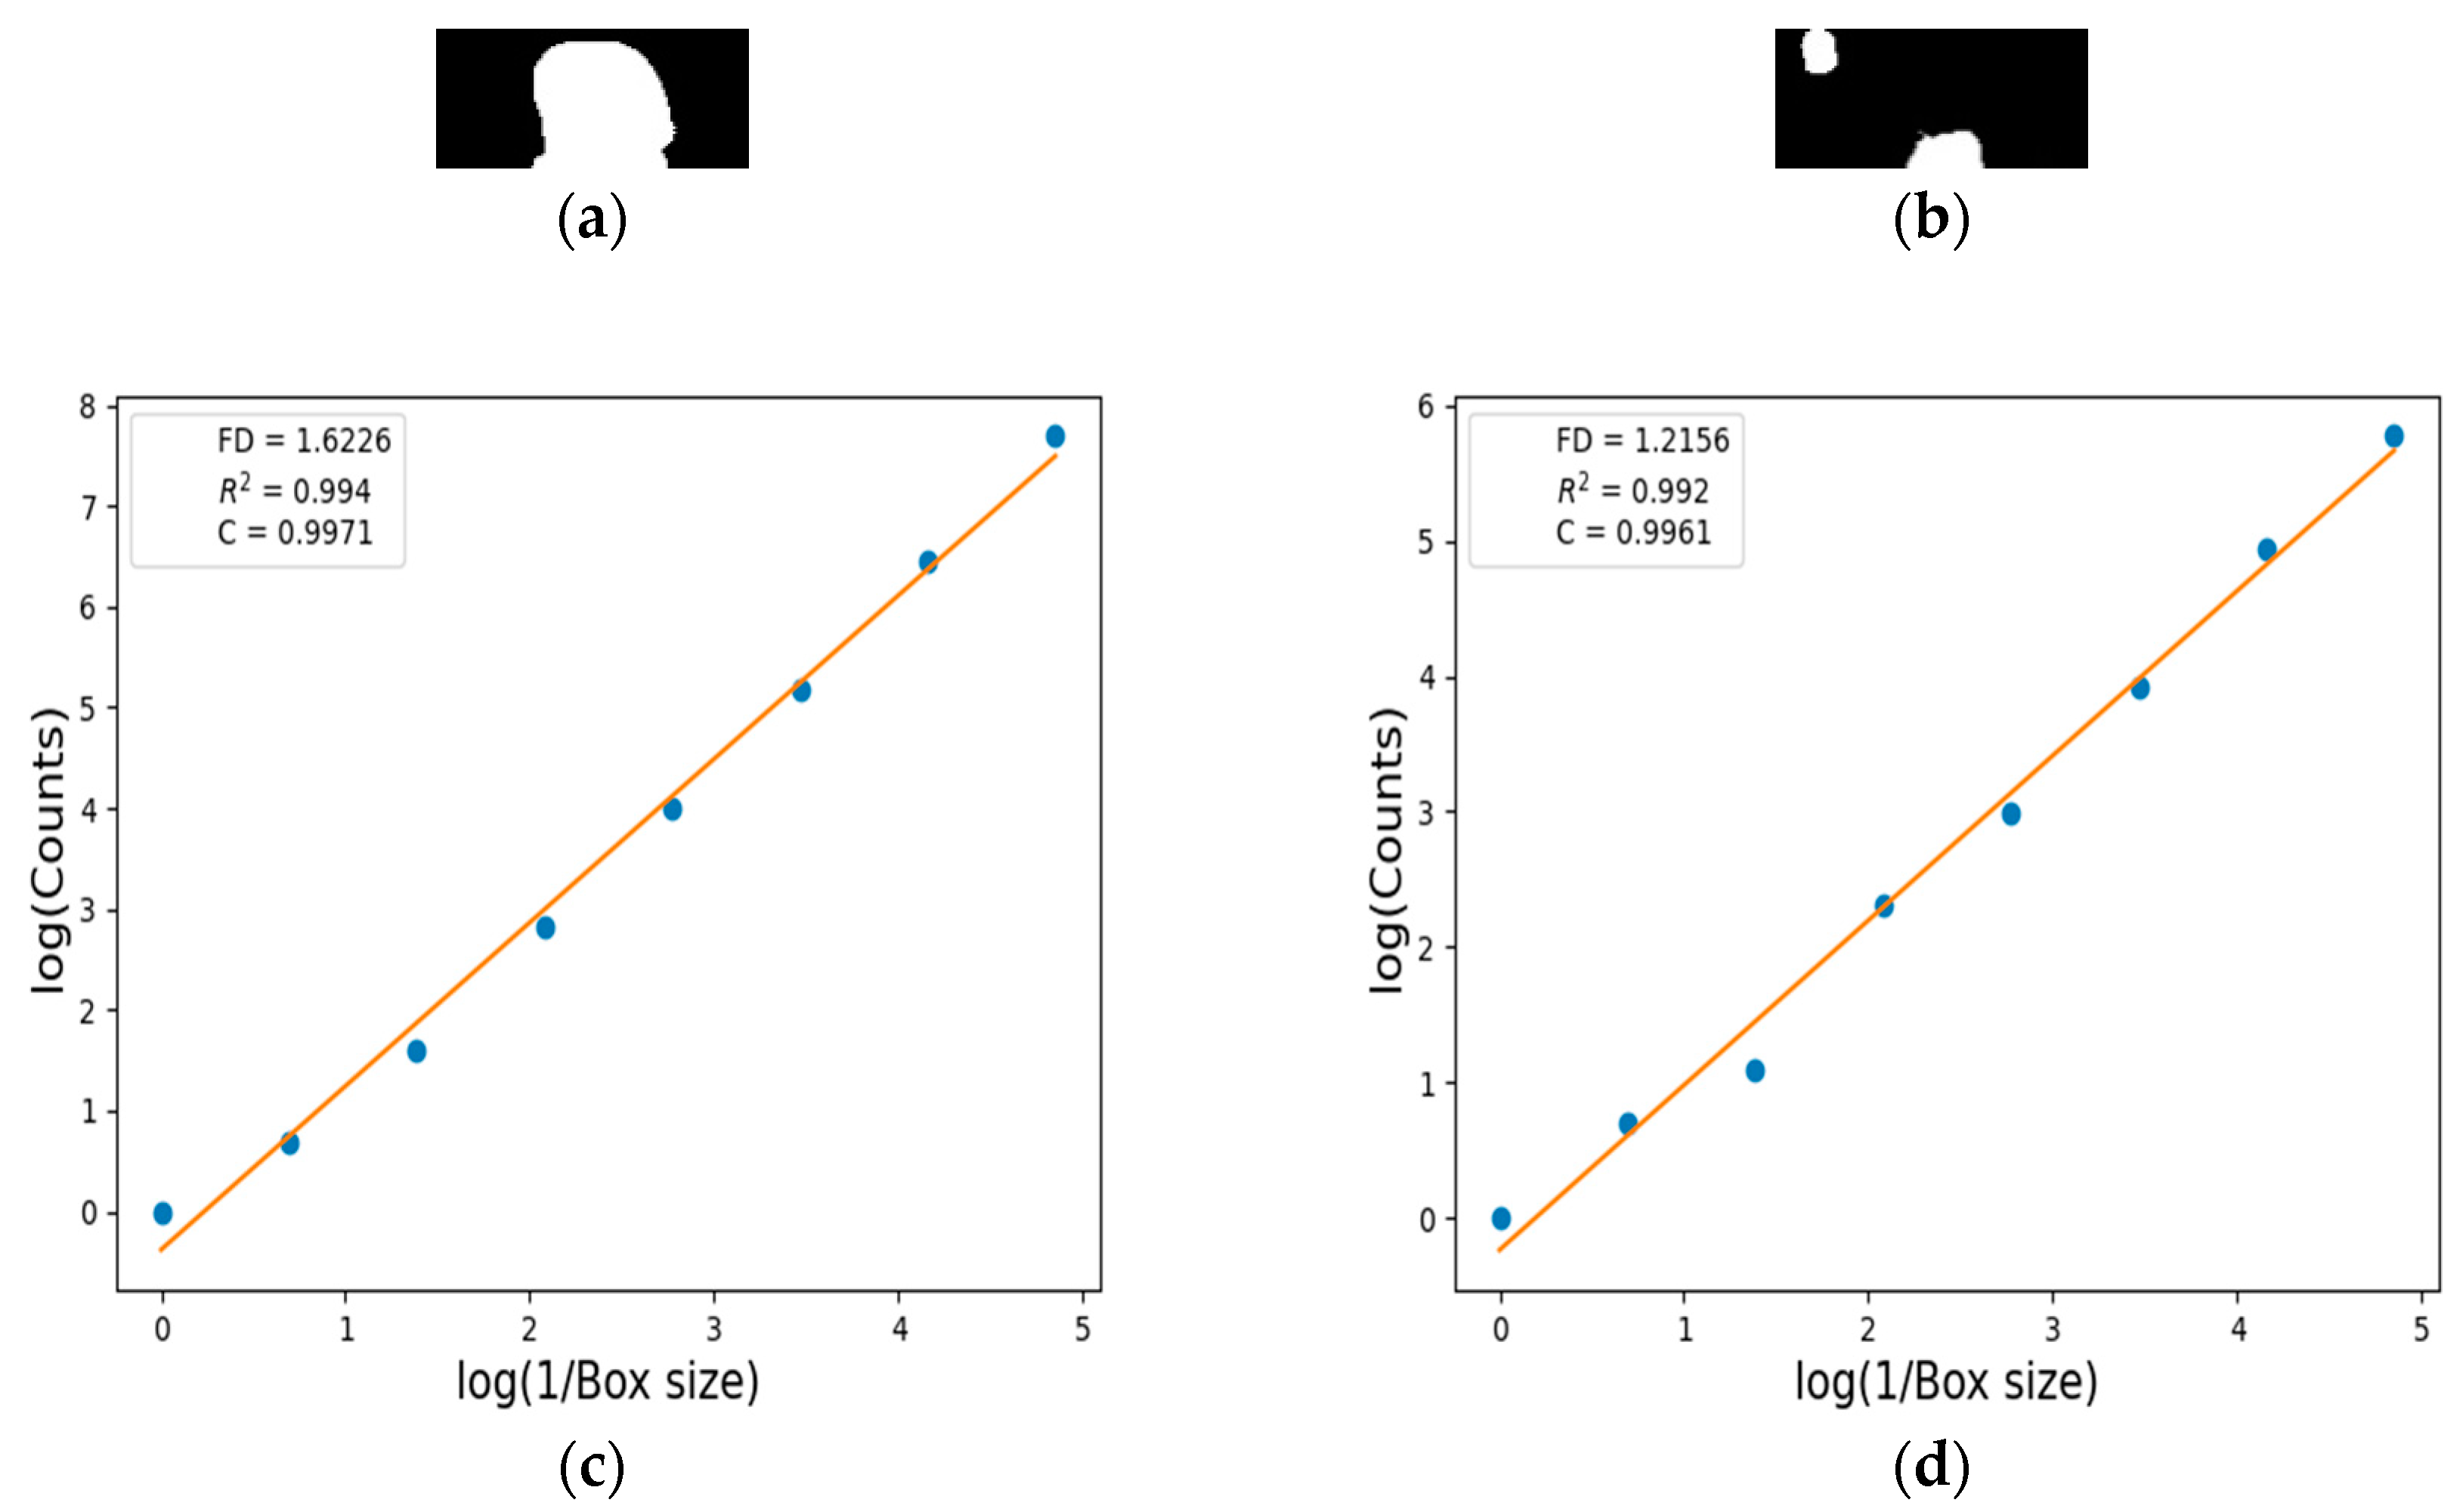
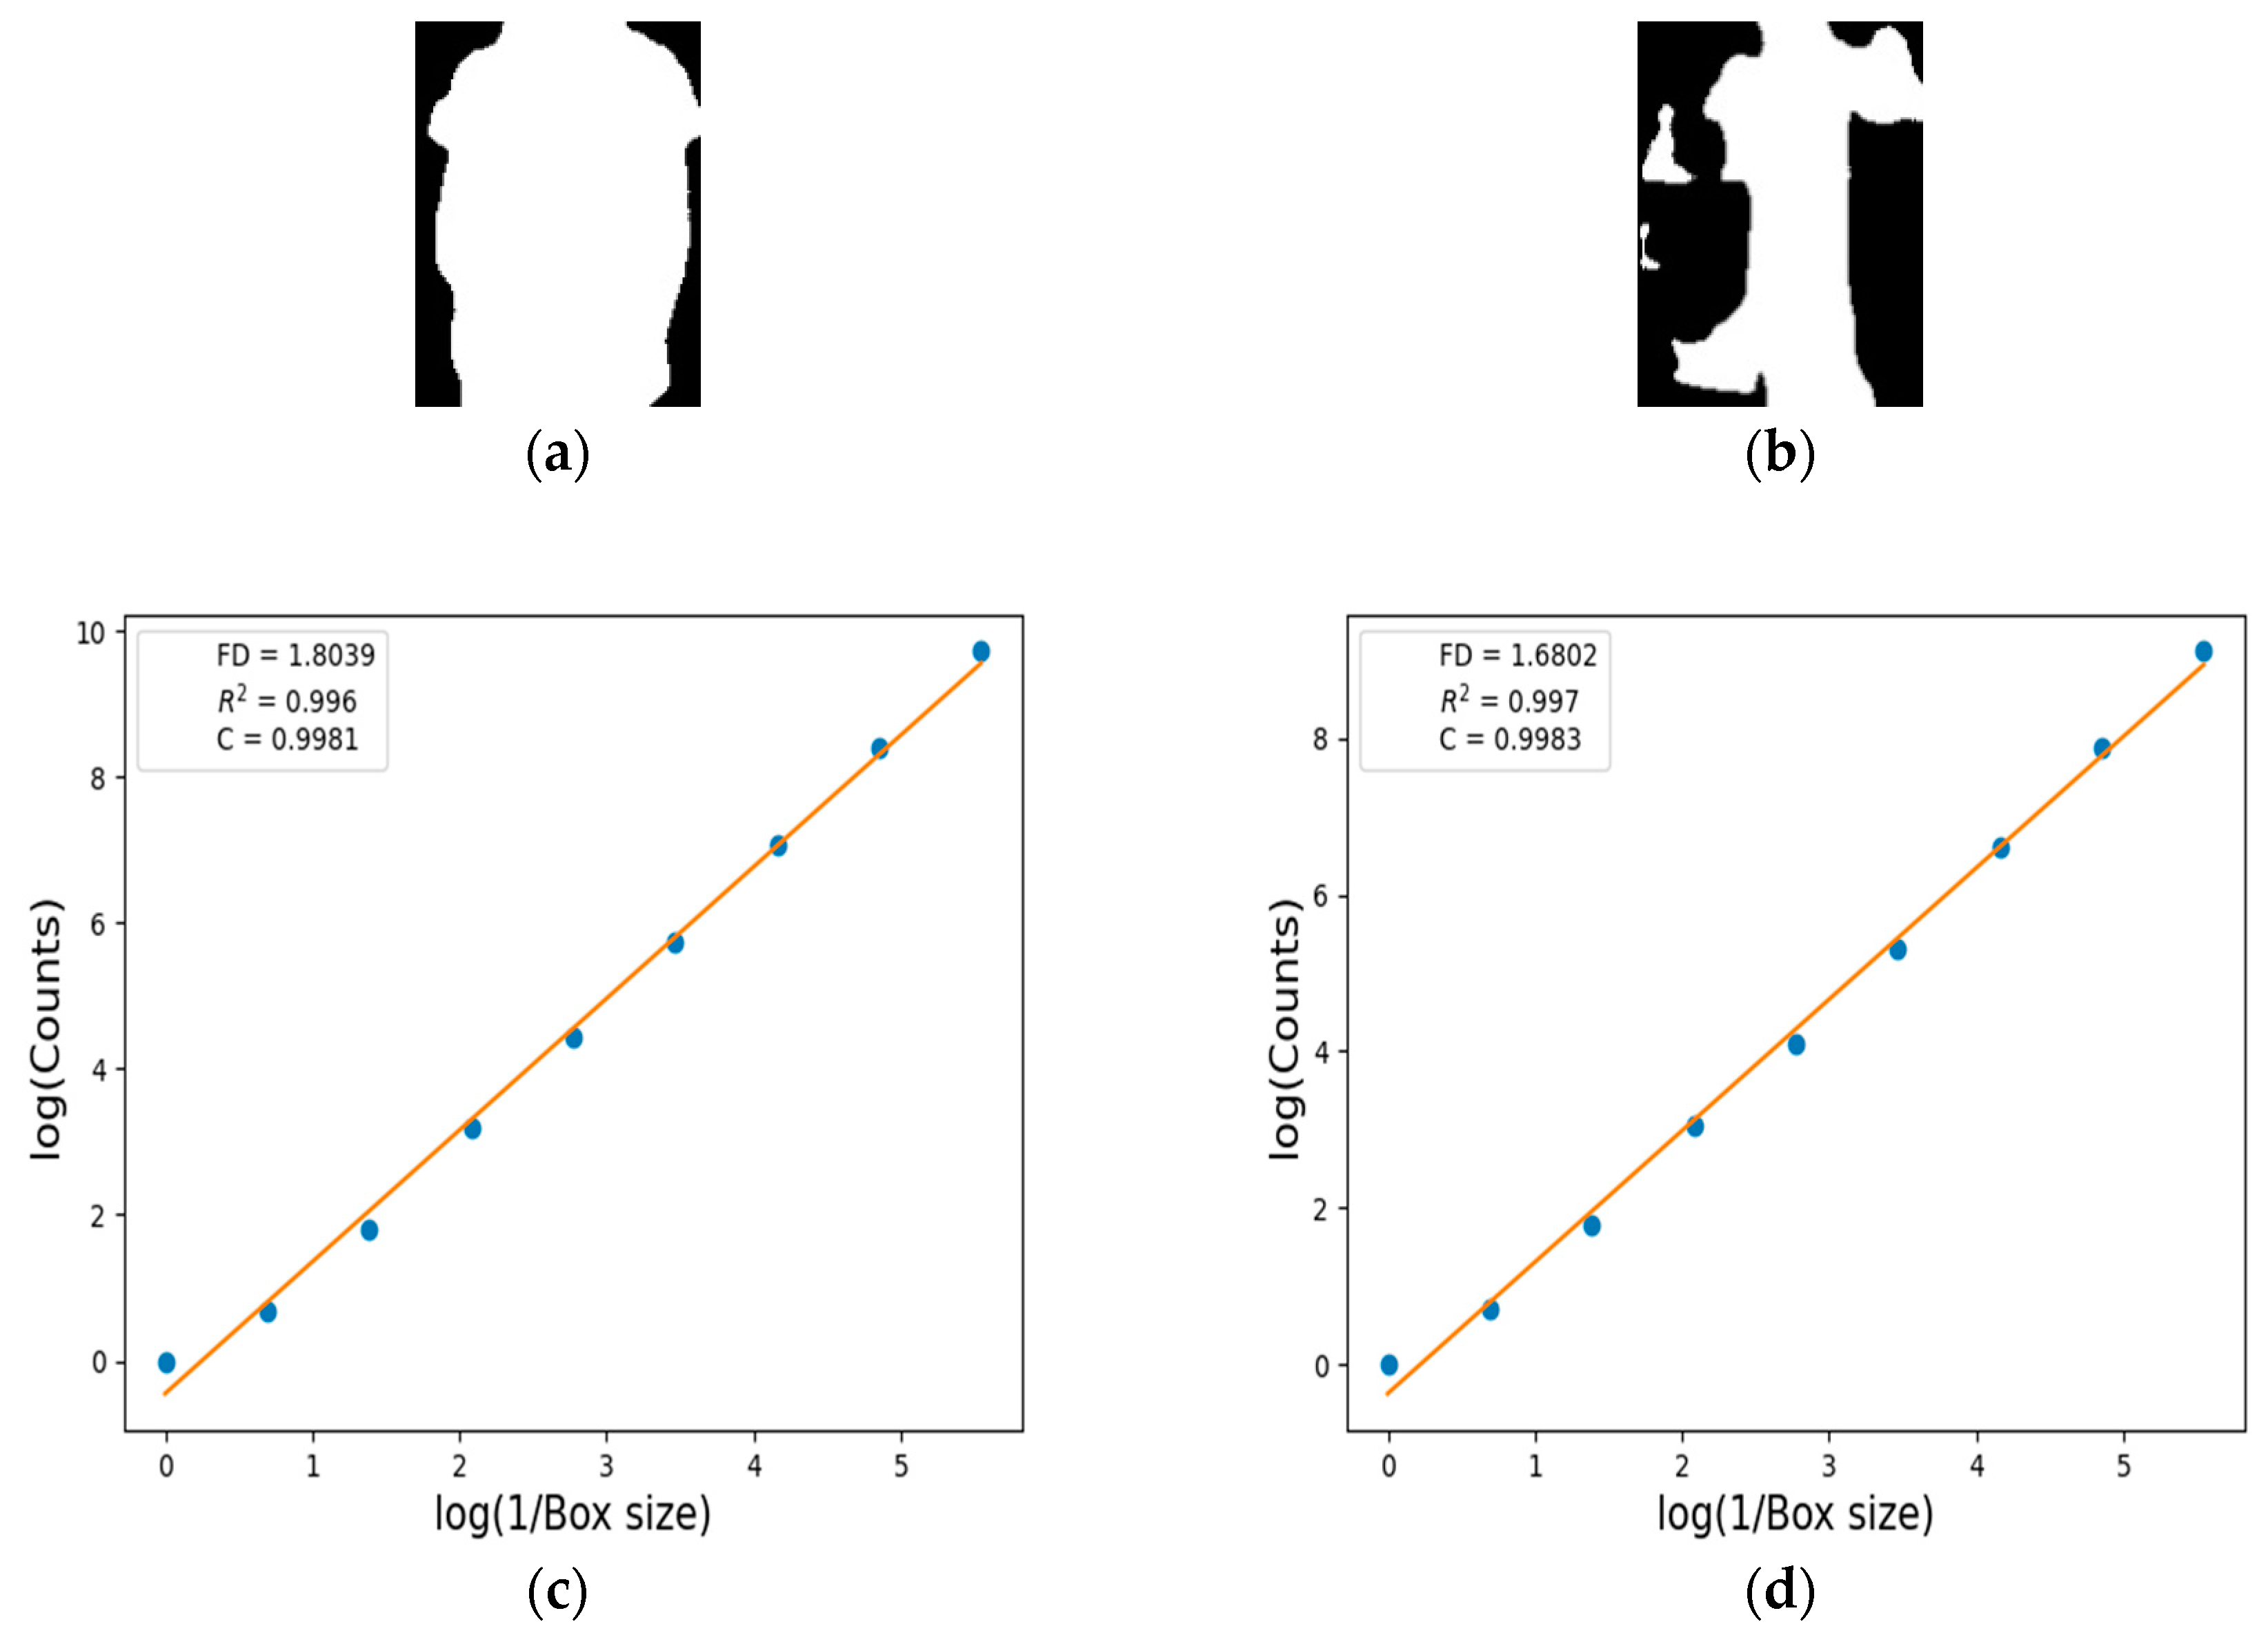
Figure 18a presents images where attention was determined by the proposed ABAM method, whereas Figure 18b shows those where it was not determined for different body parts of the head, upper body, and lower body. Figure 19, Figure 20 and Figure 21 depict the human body masks generated by the U-Net and the corresponding FD values for each body part, as presented in Figure 18. The first row in Figure 19, Figure 20 and Figure 21 shows the human body masks generated by the U-Net, where the pixels corresponding to the human body are represented in white. The second row displays the log–log plots for each mask, including the FD score, the correlation coefficient (C), and the coefficient of determination (R2) calculated by Algorithm 1. The FD value serves as an indicator of the complexity of shapes or patterns within the mask. A higher FD value indicates more complex structures within the image. As shown in Figure 19c,d, the FD score for Figure 19a (1.6226) is higher than that for Figure 19b (1.2156), indicating that the mask where attention was determined by the ABAM exhibits greater complexity. The FD score represents the slope of the regression line in the log–log plots presented in Figure 19, Figure 20 and Figure 21c,d. The reliability of the FD value increases with the strength of the correlation between the number of boxes N(ϵ) and the box size (ϵ) during the regression process. In this context, the correlation coefficients for the two samples in Figure 19 are 0.9971 and 0.9961, respectively, indicating a strong positive correlation. Additionally, the R2 values of 0.994 and 0.992 for both samples suggest that the regression line provides an excellent fit to the data. The same phenomena can be observed in Figure 20 and Figure 21.
A higher FD value indicates more complex structures and patterns within the image, thereby reflecting the complexity of the segmentation mask. Table 18 presents the FD, R2, and C values for each of the masks shown in Figure 19, Figure 20 and Figure 21. Across all body parts, the samples of Figure 19, Figure 20 and Figure 21a with ABAM-determined attention demonstrate higher FD values compared to the samples of Figure 19, Figure 20 and Figure 21b without ABAM attention. This observation suggests that the masks selected by the ABAM for gender recognition are indeed reliable, as the ABAM selectively passes only those results that satisfy the reliability criteria based on the percentage of pixel presence in the segmentation mask.
In a broader context, the FD serves as a critical measure of irregularity, with higher FD values typically indicating more complex and irregular shapes [63]. This makes FD analysis particularly valuable in predicting human body silhouettes in infrared images, thereby improving not only gender recognition but also pedestrian attribute recognition and identity recognition in surveillance environments by addressing gaps in information. Moreover, the FD enables researchers to assess and compare the complexity of shapes both within and across datasets, thereby playing a crucial role in the understanding and analysis of human identity and behavior.

6. Conclusions

In this study, a new gender recognition method using only infrared images was proposed for use in night and low-light environments. To solve the problems of infrared images such as a lack of color information, background clutter, and a lack of training data annotated with body segmentation, a new loss function considering human body proportions was introduced to enable the semantic segmentation network to perform approximate segmentation. The RBSG-Net was proposed to improve gender recognition performance by defining human body regions using human body region prediction maps and removing unnecessary background elements.
The performance of the proposed method was evaluated using two IR image open databases and two visible light open databases. Four experimental databases, SYSU-MM01, DBGender-DB2, PETA, and MIT, cover a variety of environments (e.g., urban surveillance and different climates). The experimental results show that the RBSG-Net achieves the highest gender recognition performance compared to other SOTA methods in the four datasets, and the proposed method extracts features important for gender classification within the human body region by using GradCAM to interpret the model. Furthermore, the t-test and Cohen’s d-value between the proposed model and the second-best model confirm that the proposed method has a statistically, significantly higher accuracy than the second-best model. It is meaningful that the RBSG-Net using human body segmentation maps can pay more specific and detailed attention than other attention-based methods, which can increase the reliability of classification results. To analyze the segmentation correctness capability within the proposed framework, the fractal dimension estimation technique was introduced to gain insights into the complexity and irregularity of the body regions. However, the experimental results showed that in cases where it is difficult to see the face from the back, hairstyle or body parts can affect the recognition performance, as shown in Figure 17.
In future work, the method considering face observation for gender recognition should be studied. In addition, performance enhancement of the segmentation model should be researched by applying an unsupervised segmentation methodology that includes anthropometric information to compensate for the small amount of human body segmentation annotation. Furthermore, a light model method that combines segmentation and classification in an end-to-end form should be explored to solve the computation and processing time problems of the RBSG-Net, while also applying knowledge distillation techniques to further improve its computational efficiency.

Author Contributions

Methodology, Writing—original draft, D.C.L.; Conceptualization, M.S.J.; Data curation, S.I.J.; Investigation, S.Y.J.; Supervision, Writing—review and editing, K.R.P. All authors have read and agreed to the published version of the manuscript.

Funding

This research was supported by the Ministry of Science and ICT (MSIT), Korea, under the Information Technology Research Center (ITRC) support program (IITP-2024-2020-0-01789) supervised by the Institute for Information and Communications Technology Planning and Evaluation (IITP).

Data Availability Statement

The proposed RBSG-Net models are publicly available via the Github site (https://github.com/DongChan2/RBSG-Net.git, accessed on 14 February 2024).

Conflicts of Interest

The authors declare no conflicts of interest.

References

  1. Jiao, Q.; Liu, M.; Ning, B.; Zhao, F.; Dong, L.; Kong, L.; Hui, M.; Zhao, Y. Image Dehazing Based on Local and Non-Local Features. Fractal Fract. 2022, 6, 262. [Google Scholar] [CrossRef]
  2. Zhang, Y.; Yang, L.; Li, Y. A Novel Adaptive Fractional Differential Active Contour Image Segmentation Method. Fractal Fract. 2022, 6, 579. [Google Scholar] [CrossRef]
  3. Zhang, Y.; Liu, T.; Yang, F.; Yang, Q. A Study of Adaptive Fractional-Order Total Variational Medical Image Denoising. Fractal Fract. 2022, 6, 508. [Google Scholar] [CrossRef]
  4. Zhang, X.; Dai, L. Image Enhancement Based on Rough Set and Fractional Order Differentiator. Fractal Fract. 2022, 6, 214. [Google Scholar] [CrossRef]
  5. Zhang, X.; Liu, R.; Ren, J.; Gui, Q. Adaptive Fractional Image Enhancement Algorithm Based on Rough Set and Particle Swarm Optimization. Fractal Fract. 2022, 6, 100. [Google Scholar] [CrossRef]
  6. Bai, X.; Zhang, D.; Shi, S.; Yao, W.; Guo, Z.; Sun, J. A Fractional-Order Telegraph Diffusion Model for Restoring Texture Images with Multiplicative Noise. Fractal Fract. 2023, 7, 64. [Google Scholar] [CrossRef]
  7. Ng, C.B.; Tay, Y.H.; Goi, B.M. Vision-based human gender recognition: A survey. arXiv 2012, arXiv:1204.1611. [Google Scholar] [CrossRef]
  8. RBSG-Net. Available online: https://github.com/DongChan2/RBSG-Net.git (accessed on 14 February 2024).
  9. Deng, Y.; Luo, P.; Loy, C.C.; Tang, X. Pedestrian attribute recognition at far distance. In Proceedings of the 22nd ACM International Conference on Multimedia, Orlando, FL, USA, 3–7 November 2014; pp. 789–792. [Google Scholar] [CrossRef]
  10. Li, D.; Zhang, Z.; Chen, X.; Ling, H.; Huang, K. A richly annotated dataset for pedestrian attribute recognition. arXiv 2016, arXiv:1603.07054. [Google Scholar] [CrossRef]
  11. Liu, X.; Zhao, H.; Tian, M.; Sheng, L.; Shao, J.; Yi, S.; Yan, J.; Wang, X. HydraPlus-Net: Attentive deep features for pedestrian analysis. In Proceedings of the IEEE International Conference on Computer Vision (ICCV), Venice, Italy, 22–29 October 2017; pp. 350–359. [Google Scholar] [CrossRef]
  12. Ng, C.-B.; Tay, Y.-H.; Goi, B.-M. A convolutional neural network for pedestrian gender recognition. In Advances in Neural Networks—ISNN 2013, Lecture Notes in Computer Science; Springer: Berlin/Heidelberg, Germany, 2013; Volume 7951, pp. 558–564. [Google Scholar] [CrossRef]
  13. Antipov, G.; Berrani, S.-A.; Ruchaud, N.; Dugelay, J.-L. Learned vs. handcrafted features for pedestrian gender recognition. In Proceedings of the 23rd ACM International Conference on Multimedia, Brisbane, QLD, Australia, 26–30 October 2015; pp. 1263–1266. [Google Scholar] [CrossRef]
  14. Cai, L.; Zhu, J.; Zeng, H.; Chen, J.; Cai, C.; Ma, K.-K. HOG-assisted deep feature learning for pedestrian gender recognition. J. Frankl. Inst. 2018, 355, 1991–2008. [Google Scholar] [CrossRef]
  15. Raza, M.; Zonghai, C.; Rehman, S.U.; Zhenhua, G.; Jikai, W.; Peng, B. Part-wise pedestrian gender recognition via deep convolutional neural networks. In Proceedings of the 2nd IET International Conference on Biomedical Image and Signal Processing (ICBISP), Wuhan, China, 13–14 May 2017; pp. 1–6. [Google Scholar] [CrossRef]
  16. Luo, P.; Wang, X.; Tang, X. Pedestrian parsing via deep decompositional network. In Proceedings of the IEEE International Conference on Computer Vision (ICCV), Sydney, NSW, Australia, 3–6 December 2013; pp. 2648–2655. [Google Scholar] [CrossRef]
  17. Ng, C.B.; Tay, Y.-H.; Goi, B.-M. Pedestrian gender classification using combined global and local parts-based convolutional neural networks. Pattern Anal. Appl. 2018, 22, 1469–1480. [Google Scholar] [CrossRef]
  18. Raza, M.; Sharif, M.; Yasmin, M.; Khan, M.A.; Saba, T.; Fernandes, S.L. Appearance based pedestrians’ gender recognition by employing stacked auto encoders in deep learning. Future Gener. Comput. Syst. 2018, 88, 28–39. [Google Scholar] [CrossRef]
  19. Tang, C.; Sheng, L.; Zhang, Z.; Hu, X. Improving pedestrian attribute recognition with weakly-supervised multi-scale attribute-specific localization. In Proceedings of the IEEE/CVF International Conference on Computer Vision (ICCV), Seoul, Republic of Korea, 27 October–2 November 2019; pp. 4997–5006. [Google Scholar] [CrossRef]
  20. Jia, J.; Huang, H.; Yang, W.; Chen, X.; Huang, K. Rethinking of pedestrian attribute recognition: Realistic datasets with efficient method. arXiv 2020, arXiv:2005.11909. [Google Scholar] [CrossRef]
  21. Roxo, T.; Proença, H. YinYang-Net: Complementing face and body information for wild gender recognition. IEEE Access 2022, 10, 28122–28132. [Google Scholar] [CrossRef]
  22. Fang, H.-S.; Li, J.; Tang, H.; Xu, C.; Zhu, H.; Xiu, Y.; Li, Y.-L.; Lu, C. AlphaPose: Whole-body regional multi-person pose estimation and tracking in real-time. IEEE Trans. Pattern Anal. Mach. Intell. 2022, 45, 7157–7173. [Google Scholar] [CrossRef] [PubMed]
  23. Fan, X.; Zhang, Y.; Lu, Y.; Wang, H. PARFormer: Transformer-based multi-task network for pedestrian attribute recognition. IEEE Trans. Circuits Syst. Video Technol. 2023, 34, 411–423. [Google Scholar] [CrossRef]
  24. Liu, Z.; Lin, Y.; Cao, Y.; Hu, H.; Wei, Y.; Zhang, Z.; Lin, S.; Guo, B. Swin Transformer: Hierarchical vision Transformer using shifted windows. In Proceedings of the IEEE/CVF International Conference on Computer Vision (ICCV), Montreal, QC, Canada, 10–17 October 2021; pp. 9992–10002. [Google Scholar] [CrossRef]
  25. Nguyen, D.T.; Park, K.R. Body-based gender recognition using images from visible and thermal cameras. Sensors 2016, 16, 156. [Google Scholar] [CrossRef]
  26. Nguyen, D.T.; Park, K.R. Enhanced gender recognition system using an improved Histogram of Oriented Gradient (HOG) feature from quality assessment of visible light and thermal images of the human body. Sensors 2016, 16, 1134. [Google Scholar] [CrossRef] [PubMed]
  27. Baek, N.R.; Cho, S.W.; Koo, J.H.; Truong, N.Q.; Park, K.R. Multimodal camera-based gender recognition using human-body image with two-step reconstruction network. IEEE Access 2019, 7, 104025–104044. [Google Scholar] [CrossRef]
  28. He, K.; Zhang, X.; Ren, S.; Sun, J. Deep residual learning for image recognition. In Proceedings of the IEEE Conference on Computer Vision and Pattern Recognition, Las Vegas, NV, USA, 27–30 June 2016; pp. 770–778. [Google Scholar] [CrossRef]
  29. Baghezza, R.; Bouchard, K.; Gouin-Vallerand, C. Recognizing the age, gender, and mobility of pedestrians in smart cities using a CNN-BGRU on thermal images. In Proceedings of the ACM Conference on Information Technology for Social Good, Limassol, Cyprus, 7–9 September 2022; pp. 48–54. [Google Scholar] [CrossRef]
  30. Wang, L.; Shi, J.; Song, G.; Shen, I. Object detection combining recognition and segmentation. In Proceedings of the 8th Asian Conference on Computer Vision (ACCV), Tokyo, Japan, 18–22 November 2007; pp. 189–199. [Google Scholar] [CrossRef]
  31. Ronneberger, O.; Fischer, P.; Brox, T. U-Net: Convolutional networks for biomedical image segmentation. In Proceedings of the Medical Image Computing and Computer Assisted Intervention (MICCAI), Munich, Germany, 5–9 October 2015; pp. 234–241. [Google Scholar] [CrossRef]
  32. Gordon-Rodriguez, E.; Loaiza-Ganem, G.; Pleiss, G.; Cunningham, J.P. Uses and abuses of the cross-entropy loss: Case studies in modern deep learning. arXiv 2020, arXiv:2011.05231. [Google Scholar] [CrossRef]
  33. Ding, M.; Xiao, B.; Codella, N.; Luo, P.; Wang, J.; Yuan, L. DaViT: Dual attention vision Transformers. In Proceedings of the European Conference on Computer Vision (ECCV), Tel Aviv, Israel, 23–27 October 2022; pp. 74–92. [Google Scholar] [CrossRef]
  34. Yang, J.; Li, C.; Zhang, P.; Dai, X.; Xiao, B.; Yuan, L.; Gao, J. Focal self-attention for local-global interactions in vision Transformers. arXiv 2021, arXiv:2107.00641. [Google Scholar] [CrossRef]
  35. Dosovitskiy, A.; Beyer, L.; Kolesnikov, A.; Weissenborn, D.; Zhai, X.; Unterthiner, T.; Dehghani, M.; Minderer, M.; Heigold, G.; Gelly, S.; et al. An image is worth 16×16 words: Transformers for image recognition at scale. arXiv 2021, arXiv:2010.11929. [Google Scholar] [CrossRef]
  36. Wu, A.; Zheng, W.-S.; Yu, H.-X.; Gong, S.; Lai, J. RGB-infrared cross-modality person re-identification. In Proceedings of the IEEE International Conference on Computer Vision (ICCV), Venice, Italy, 22–29 October 2017; pp. 5390–5399. [Google Scholar]
  37. FLIR Tau2. Available online: https://www.flir.com/products/tau-2/?vertical=lwir&segment=oem (accessed on 10 January 2024).
  38. Paszke, A.; Gross, S.; Massa, F.; Lerer, A.; Bradbury, J.; Chanan, G.; Killeen, T.; Lin, Z.; Gimelshein, N.; Antiga, L. Pytorch: An imperative style, high-performance deep learning library. arXiv 2019, arXiv:1912.01703. [Google Scholar] [CrossRef]
  39. GeForce RTX 4070 Family. Available online: https://www.nvidia.com/en-us/geforce/graphics-cards/40-series/rtx-4070-family (accessed on 15 January 2024).
  40. Dwyer, B.; Nelson, J.; Solawetz, J. Roboflow (Version 1.0) [Software]. 2022. Available online: https://roboflow.com (accessed on 14 February 2024).
  41. Zhang, Y.; Chen, C.; Shi, N.; Sun, R.; Luo, Z.-Q. Adam can converge without any modification on update rules. In Proceedings of the 36th Conference on Neural Information Processing Systems, New Orleans, LA, USA, 28 November–9 December 2022; Volume 35, pp. 28386–28399. [Google Scholar] [CrossRef]
  42. DeVries, T.; Taylor, G.W. Improved regularization of convolutional neural networks with cutout. arXiv 2017, arXiv:1708.04552. [Google Scholar] [CrossRef]
  43. Lewkowycz, A. How to decay your learning rate. arXiv 2021, arXiv:2103.12682. [Google Scholar] [CrossRef]
  44. Brouty, X.; Garcin, M. Fractal properties; information theory, and market efficiency. Chaos Solitons Fractals 2024, 180, 114543. [Google Scholar] [CrossRef]
  45. Yin, J. Dynamical fractal: Theory and case study. Chaos Solitons Fractals 2023, 176, 114190. [Google Scholar] [CrossRef]
  46. Chen, L.-C.; Zhu, Y.; Papandreou, G.; Schroff, F.; Adam, H. Encoder-decoder with atrous separable convolution for semantic image segmentation. In Proceedings of the European Conference on Computer Vision (ECCV), Munich, Germany, 8–14 September 2018; pp. 801–818. [Google Scholar] [CrossRef]
  47. Sun, K.; Xiao, B.; Liu, D.; Wang, J. Deep high-resolution representation learning for human pose estimation. In Proceedings of the IEEE/CVF Conference on Computer Vision and Pattern Recognition (CVPR), Long Beach, CA, USA, 15–20 June 2019; pp. 5686–5696. [Google Scholar] [CrossRef]
  48. Hong, Y.; Pan, H.; Sun, W.; Jia, Y. Deep dual-resolution networks for real-time and accurate semantic segmentation of road scenes. arXiv 2021, arXiv:2101.06085. [Google Scholar] [CrossRef]
  49. Xie, E.; Wang, W.; Yu, Z.; Anandkumar, A.; Alvarez, J.M.; Luo, P. SegFormer: Simple and efficient design for semantic segmentation with Transformers. In Proceedings of the advances in Neural Information Processing Systems (NeurIPS), Virtual, 6–14 December 2021; pp. 12077–12090. [Google Scholar] [CrossRef]
  50. Szegedy, C.; Vanhoucke, V.; Ioffe, S.; Shlens, J.; Wojna, Z. Rethinking the inception architecture for computer vision. In Proceedings of the IEEE Conference on Computer Vision and Pattern Recognition (CVPR), Las Vegas, NV, USA, 27–30 June 2016; pp. 2818–2826. [Google Scholar]
  51. Liu, Z.; Mao, H.; Wu, C.-Y.; Feichtenhofer, C.; Darrell, T.; Xie, S. A convnet for the 2020s. In Proceedings of the IEEE/CVF Conference on Computer Vision and Pattern Recognition (CVPR), New Orleans, LA, USA, 21–24 June 2022; pp. 11966–11976. [Google Scholar] [CrossRef]
  52. Touvron, H.; Cord, M.; Jégou, H. DeiT III: Revenge of the ViT. In Proceedings of the European Conference on Computer Vision (ECCV), Tel Aviv, Israel, 23–27 October 2022; pp. 516–533. [Google Scholar] [CrossRef]
  53. Abbas, F.; Yasmin, M.; Fayyaz, M.; Asim, U. ViT-PGC: Vision Transformer for pedestrian gender classification on small-size dataset. Pattern Anal. Appl. 2023, 26, 1805–1819. [Google Scholar] [CrossRef]
  54. Li, D.; Chen, X.; Huang, K. Multi-attribute learning for pedestrian attribute recognition in surveillance scenarios. In Proceedings of the Asian Conference on Pattern Recognition (ACPR), Kuala Lumpur, Malaysia, 3–6 November 2015; pp. 111–115. [Google Scholar] [CrossRef]
  55. Lin, Y.; Zheng, L.; Zheng, Z.; Wu, Y.; Hu, Z.; Yan, C.; Yang, Y. Improving person re-identification by attribute and identity learning. Pattern Recognit. 2019, 95, 151–161. [Google Scholar] [CrossRef]
  56. Guo, H.; Zheng, K.; Fan, X.; Yu, H.; Wang, S. Visual Attention Consistency Under Image Transforms for Multi-Label Image Classification. In Proceedings of the 2019 IEEE/CVF Conference on Computer Vision and Pattern Recognition (CVPR), Long Beach, CA, USA, 15–20 June 2019; pp. 729–739. [Google Scholar] [CrossRef]
  57. Fayyaz, M.; Yasmin, M.; Sharif, M.; Raza, M. J-LDFR: Joint low-level and deep neural network feature representations for pedestrian gender classification. Neural Comput. Appl. 2021, 33, 361–391. [Google Scholar] [CrossRef]
  58. Cai, L.; Zeng, H.; Zhu, J.; Cao, J.; Wang, Y.; Ma, K.-K. Cascading scene and viewpoint feature learning for pedestrian gender recognition. IEEE Internet Things J. 2021, 8, 3014–3026. [Google Scholar] [CrossRef]
  59. Jetson TX2 Module. Available online: https://developer.nvidia.com/embedded/jetson-tx2 (accessed on 1 February 2024).
  60. Selvaraju, R.R.; Cogswell, M.; Das, A.; Vedantam, R.; Parikh, D.; Batra, D. Grad-CAM: Visual explanations from deep networks via gradient-based localization. Int. J. Comput. Vis. 2020, 128, 336–359. [Google Scholar] [CrossRef]
  61. Student’s t-test. Available online: https://en.wikipedia.org/wiki/Student%27s_t-test (accessed on 21 February 2024).
  62. Cohen, J. A power primer. Psychol. Bull. 1992, 112, 1155–1159. [Google Scholar] [CrossRef] [PubMed]
  63. Mandelbrot, B. How long is the coast of Britain? Statistical self-similarity and fractional dimension. Science 1967, 156, 636–638. [Google Scholar] [CrossRef]
Figure 1. The overall procedure of the proposed method.
Fractalfract 08 00551 g001
Figure 2. The architecture of the proposed RBSG-Net, including the adaptive body attention module (ABAM).
Fractalfract 08 00551 g002
Figure 3. Training of the semantic segmentation network on rough body segmentation based on human anthropometric information.
Fractalfract 08 00551 g003
Figure 4. Examples of extracted human body regions: (a) original and (b) human body regions.
Fractalfract 08 00551 g004
Figure 5. Architecture of DaViT: (a) overall model, and (b) dual attention block.
Fractalfract 08 00551 g005
Figure 6. Example full body images from both experimental datasets, illustrating the front (left image) and back (right image) appearance of a female and a male. Example images from the (a) SYSU-MM01 NIR and (b) DBGender-DB2 thermal datasets.
Fractalfract 08 00551 g006
Figure 7. Learning curves (loss and accuracy) of the proposed model: (a) the semantic segmentation network and (b) the classification network.
Fractalfract 08 00551 g007
Figure 8. ROC curves for comparing gender recognition accuracies across SOTA and proposed methods using the SYSU-MM01 NIR dataset.
Fractalfract 08 00551 g008
Figure 9. ROC curves for comparing 5-fold cross-validation performance across SOTA and proposed methods using the SYSU-MM01 NIR dataset.
Fractalfract 08 00551 g009
Figure 10. ROC curves for comparing gender recognition accuracy across the SOTA and proposed methods using the DBGender-DB2 thermal dataset.
Fractalfract 08 00551 g010
Figure 11. Example images of visible light datasets: (a) the PETA dataset, (b) the MIT dataset, with a mixed view of a female and male from left to right.
Fractalfract 08 00551 g011
Figure 12. Jetson TX2 board.
Fractalfract 08 00551 g012
Figure 13. GradCAMs of the proposed method at four different network stages: the first row represents the input image and the second to fifth rows represent the GradCAM images extracted from stages 1 to 4 of DaViT-Base, respectively. Each row consists of females on the left and males on the right. (a) shows visualizations for female and male inferences on the SYSU-MM01 NIR dataset; (b) and for the DBGender-DB2 thermal dataset.
Fractalfract 08 00551 g013
Figure 14. The t-test result of gender recognition accuracy achieved by the proposed method and the second-best model with the SYSU-MM01 NIR dataset.
Fractalfract 08 00551 g014
Figure 15. The t-test result of gender recognition accuracy achieved by our proposed method and the second-best model with the DBGender-DB2 dataset.
Fractalfract 08 00551 g015
Figure 16. Correct cases of the RBSG-Net: (a) correctly recognizing a female (TP) (b) correctly recognizing a male (TN).
Fractalfract 08 00551 g016
Figure 17. Incorrect cases of the RBSG-Net: (a) incorrectly recognizing a female as a male (FN) (b) incorrectly recognizing a male as a female (FP).
Fractalfract 08 00551 g017
Figure 18. Examples of images with attention determined by the ABAM: (a) is an image where attention has been determined by the ABAM, and (b) is an image where attention was not determined.
Fractalfract 08 00551 g018
Figure 19. FD analysis for head segmentation: The first row presents the head mask generated by U-Net. The second row shows the FD value computed using Equation (12), accompanied by R2 and C values for the head mask. (c,d) are the graphs computed from the images of (a,b), respectively.
Fractalfract 08 00551 g019
Figure 20. FD analysis for upper body segmentation: The first row presents the upper body mask generated by U-Net. The second row shows the FD value computed using Equation (12), accompanied by R2 and C values for the upper body mask. (c,d) are the graphs computed from the images of (a,b), respectively.
Fractalfract 08 00551 g020
Figure 21. FD analysis for lower body segmentation: The first row presents the lower body mask generated by U-Net. The second row shows the FD value computed using Equation (12), accompanied by R2 and C values for the lower body mask. (c,d) are the graphs computed from the images of (a,b), respectively.
Fractalfract 08 00551 g021
Table 1. A summary of the experimental IR datasets: ‘M’ denotes the number of males; ‘F’ denotes the number of females.
DatasetFoldTraining SetValidation SetTest Set
People (M/F)Images (M/F)People
(M/F)
Images (M/F)People
(M/F)
Images
(M/F)
SYSU-MM01 NIR1221
(125/96)
7011 (4018/2993)24
(13/11)
760
(380/380)
245
(137/108)
7724
(4338/3386)
2221
(122/99)
6968 (3862/3106)24
(15/9)
756
(476/280)
245
(138/107)
7771
(4398/3373)
DBGender-DB2 thermal1297
(186/111)
2970 (1860/1110)33
(16/17)
330
(160/170)
82
(52/30)
820
(520/300)
2297
(180/117)
2970 (1800/1170)32
(21/11)
320
(210/110)
83
(53/30)
830
(530/300)
3297
(183/114)
2970 (1830/1140)32
(21/11)
320
(210/110)
83
(50/33)
830
(500/330)
4297
(183/114)
2970 (1830/1140)33
(23/10)
330
(230/100)
82
(48/34)
820
(480/340)
5297
(184/113)
2970 (1840/1130)33
(19/14)
330
(190/140)
82
(51/31)
820
(510/310)
Table 2. Effect of loss term of training semantic segmentation network (unit: %).
LsegLanthroEER
5.395
4.997
5.194
4.320
Table 3. Effect of adjusting λanthro weights on gender recognition performance (unit: %).
λanthroEER
0.014.840
0.14.606
0.054.320
Table 4. An ablation study on the impact of the human body region extractor and the ABAM on gender recognition performance (unit: %).
CaseHuman Body Region ExtractorABAMEER
1 5.410
2 5.180
3 4.863
44.320
Table 5. Comparative analysis of gender recognition performance between adaptive and non-adaptive body attention modules (unit: %).
CaseAdaptive
BAM
Non-Adaptive
BAM
EER
1 4.863
2 5.581
3 4.320
Table 6. Comparisons of different segmentation networks for RBSG-Net on the SYSU-MM01 NIR (unit: %).
MethodEER
DeepLabV3Plus [46]5.347
HRNet [47]4.878
DDRNet [48]5.339
SegFormer [49]5.239
U-Net [31]4.320
w/o segmentation5.410
Table 7. Comparisons of different classification networks for RBSG-Net on the SYSU-MM01 NIR dataset (unit: %).
ModelEER
w/ow/
CNNInceptionV3 [50]5.2845.149
ResNet-101 [28]5.4114.913
ConvNeXt-Base [51]5.1354.777
TransformerSwin-Base [24]6.2575.693
DeiT-Large [52]7.3036.920
DaViT-Base [33]5.4104.320
Table 8. Comparisons of gender recognition accuracies with SOTA methods using the SYSU-MM01 NIR dataset (unit: %).
MethodEER
HP-Net [11]11.404
1-ch ResNet-101 [27]11.312
ALM [19]8.757
Strong Baseline [20]6.067
15-layer CNN [29]7.221
YY-Net [21]6.422
PARFormer-B [23]6.777
PARFormer-L [23]6.319
RBSG-Net (proposed)4.320
Table 9. The 5-fold cross-validation comparisons of gender recognition accuracies with SOTA methods using the SYSU-MM01 NIR dataset (unit: %).
MethodEER
HP-Net [11]7.650
1-ch ResNet-101 [27]7.053
ALM [19]4.530
Strong Baseline [20]2.970
15-layer CNN [29]4.394
YY-Net [21]2.925
PARFormer-B [23]3.489
PARFormer-L [23]2.929
RBSG-Net (proposed)2.429
Table 10. A comparison of different semantic segmentation networks on the DBGender-DB2 thermal dataset (unit: %).
MethodEER
DeepLabV3Plus [46]9.224
HRNet [47]9.361
DDRNet [48]9.055
SegFormer [49]9.307
U-Net [31]8.303
w/o segmentation9.491
Table 11. A comparison of different classification networks on the DBGender-DB2 thermal dataset (unit: %).
MethodEER
w/ow/
CNNInceptionV3 [50]10.2719.776
ResNet-101 [28]13.47612.167
ConvNeXt-Base [51]9.6879.356
TransformerSwin-Base [24]14.15113.870
DeiT-Large [52]10.5619.523
DaViT-Base [33]9.4918.303
Table 12. Comparisons of gender recognition accuracies with SOTA methods using the DBGendr-DB2 thermal dataset (unit: %).
MethodEER
HP-Net [11]20.811
1-ch ResNet-101 [27]21.315
ALM [19]13.348
Strong Baseline [20]12.536
15-layer CNN [29]12.872
YY-Net [21]12.784
PARFormer-B [23]12.743
PARFormer-L [23]11.668
RBSG-Net (proposed)8.303
Table 13. EERs of different methods with heterogeneous datasets: ‘S’ denotes the SYSU-MM01 NIR dataset, and ‘D’ denotes the DBGender-DB2 thermal dataset (unit: %).
ModelsTraining Dataset → Test Dataset
S → DD → S
HP-Net [11]54.32548.706
1-ch ResNet-101 [27]40.01446.809
ALM [19]51.26042.970
Strong Baseline [20]41.09833.904
15-layer CNN [29]43.07140.735
YY-Net [21]37.98332.989
PARFormer-B [23]33.77730.199
PARFormer-L [23]30.83828.337
RBSG-Net (proposed)22.77726.728
Table 14. A summary of the visible light image dataset: protocol 1 is same setting as described in [21], and protocol 2 is same setting as described in [53] ‘M’ denotes the number of males and ‘F’ denotes the number of females.
ProtocolTraining Set
(M/F)
Validation Set
(M/F)
Test Set
(M/F)
19500
(5240/4260)
1900
(1034/866)
7600
(4147/3453)
213,555
(6778/6777)
3389
(1694/1695)
888
(600/288)
Table 15. Performance comparisons with SOTA methods using protocol 1 setting (unit: %).
MethodMean Accuracy
ALM [19]92.28
DeepMar [54]92.33
APR [55]92.84
VAC [56]92.85
Strong Baseline [20]93.13
YY-Net [21]93.39
DaViT-Base [33]93.74
DeiT-Large [52]94.91
RBSG-Net (proposed)95.10
Table 16. Performance comparisons with SOTA methods using protocol 2 setting (unit: %).
MethodOverall AccuracyMean Accuracy
Upper body (CNN) [15]82.881.4
Full body (CNN) [15]82.080.7
HDFL [14]74.3-
SSAE [18]82.481.6
U+M+L (CNN-3) [17]81.3-
J-LDFR [57]82.077.3
CSVFL [58]85.2-
DaViT-Base [33]86.284.6
DeiT-Large [52]90.990.5
ViT-PGC [53]91.790.7
RBSG-Net (Proposed)92.791.3
Table 17. Comparisons of processing time and computational complexity in the proposed method and SOTA methods (ms, M, and MB represent millisecond, mega, and mega-bytes, respectively).
ModelsProcessing Time per an Image (ms)Number of
Parameters (M)
GFLOPsMemory
Usage (MB)
DesktopJetson TX2
HP-Net [11]89.746922.34520.79910.30680.173
1-ch ResNet-101 [27]6.02673.42542.4987.627162.827
ALM [19]7.05160.05311.0212.11342.793
Strong Baseline [20]3.50141.93423.5104.04789.919
15-layer CNN [29]1.76214.1556.9961.33526.728
YY-Net [21]6.50384.65647.0188.095200.975
PARFormer-B [23]6.961156.66286.68015.169336.421
PARFormer-L [23]9.229296.868194.90034.082747.369
RBSG-Net (proposed)16.980345.798117.91758.168454.951
Table 18. FD, R2, and C values of the head, upper body, lower body from Figure 19, Figure 20 and Figure 21.
ResultsHeadUpper BodyLower Body
Figure 19aFigure 19bFigure 20aFigure 20bFigure 21aFigure 21b
FD1.62261.21561.80391.68021.62371.5123
R20.9940.9920.9960.9970.9970.991
C0.99710.99610.99810.99830.99840.9956
Disclaimer/Publisher’s Note: The statements, opinions and data contained in all publications are solely those of the individual author(s) and contributor(s) and not of MDPI and/or the editor(s). MDPI and/or the editor(s) disclaim responsibility for any injury to people or property resulting from any ideas, methods, instructions or products referred to in the content.