Article

A Binary Medium Constitutive Model for Frozen Solidified Saline Soil in Cold Regions and Its Fractal Characteristics Analysis

1
College of Civil and Hydraulic Engineering, Ningxia University, Yinchuan 750021, China
2
Engineering Research Center for Efficient Utilization of Water Resources in Modern Agriculture in Arid Regions, Yinchuan 750021, China
3
Ningxia Research Center of Technology on Water-Saving Irrigation and Water Resources Regulation, Yinchuan 750021, China
*
Author to whom correspondence should be addressed.
Fractal Fract. 2024, 8(1), 33; https://doi.org/10.3390/fractalfract8010033
Submission received: 3 November 2023 / Revised: 21 December 2023 / Accepted: 26 December 2023 / Published: 2 January 2024
(This article belongs to the Special Issue Fractal Analysis and Its Applications in Rock Engineering)

Abstract

:
In addressing the issue of strength degradation in saline soil foundations under the salt-freeze coupling effects, a binary medium constitutive model suitable for un-solidified and solidified frozen saline soil is proposed considering both bonding and friction effects. To verify the validity of the constitutive model, freezing triaxial tests are carried out under different negative temperatures, confining pressures, and water contents. The pore structure and fractal characteristics of saline soil are analyzed using mercury intrusion porosimetry (MIP) and the fractal dimension D qualitatively and quantitatively, which shed light on the strength enhancement mechanism during the solidification of frozen saline soils. The results show that the constitutive model for frozen solidified saline soil based on binary medium theory aptly captures the stress–strain relationship before and after the solidification of frozen saline soil. The stress–strain relationship of frozen saline soil before and after solidification can be delineated into linear elasticity, elastoplasticity, and strain-hardening or -softening phases. Each of these phases can be coherently interpreted through the binary medium constitutive model. The un-solidified and solidified frozen both show pronounced fractal characteristics in fractal analysis. Notably, the fractal dimension D of the solidified saline soil exhibits a significant increase compared to that of un-solidified ones. In Regions I and III, the values of D for solidified saline soil are lower than those for untreated saline soil, which is attributed to the filling effect of hydration products and un-hydrated solidifying agent particles. In Region II, the fractal dimensions DMII and DNII of the solidified saline soil exhibit a “non-physical state”, which is mainly caused by the formation of a significant number of inkpot-type pores due to the binding of soil particles by hydration products.

1. Introduction

Frozen soil regions globally cover an estimated 3.58 × 10⁷ km2, comprising approximately 24% of the Earth’s terrestrial expanse [1]. Within China, territories characterized by frozen soil could potentially span up to 70% of its total landmass. Of this, about 48% is seasonally frozen land, mainly in the vast area from Helan Mountain to the west of Ailao Mountain in western China [2]. Meanwhile, saline soil, as a particular soil, is widespread in northwest and northern China, covering an area of 9.91 × 10⁵ km2. As only 0.68% of the total land area of the Ningxia region, it is located in the seasonal frozen soil area, and the saline soil covers an area of 10% of the country [3], which shows that the problem of soil salinization in the Ningxia region is very serious. With the deepening of Western development policies, many linear infrastructures will inevitably have to cross frozen saline soils, resulting in different degrees of disease in linear infrastructure. Taking the channels in the Ningxia region as an example, the total length of the channels that are damaged due to diseases can reach 803.84 km, accounting for about 22% of the total length of channels in the irrigation area [4], and the problems of channel diseases in the Ningxia region are shown in Figure 1. Therefore, it is urgent to study the deformation properties of saline frozen soil and the solidifying mechanism of saline soil before and after solidification, so as to provide references for engineering construction in saline soil areas.
Frozen saline soil is a unique geotechnical material consisting of solid mineral particles, ice crystals, salt crystals, and unfrozen water [5]. Compared with conventional soils, the mechanical properties of frozen saline soil are susceptible to temperature changes because the rise and fall of ambient temperature break the equilibrium between the ice and water phases in frozen saline soils [6]. Studying the constitutive model for frozen saline soils is an essential part of particular geotechnical engineering research, and the constitutive model can accurately describe the deformation characteristics of the soil and provide a theoretical reference for the subsequent study of mechanical properties [7]. Current research of scholars on frozen saline soils is mainly based on experimental data to improve the classical theory. Zhu et al. [8] proposed nine types of stress–strain behavior of frozen soil and the corresponding uniaxial compression constitutive relationships through many tests. Lai et al. [9,10] proposed a stochastic damage model for tempered clays that considers tiny defects within the clay based on continuous damage theory, mathematics, and statistical theory. Chamberlain et al. [11,12] found that the precipitation of ice and salt crystals during the freezing of frozen saline soils affected the structural properties of the soils. They proposed a meso–macroscopic ontological model to describe frozen saline soils. Lai et al. [13] established an elastic–plastic constitutive model for frozen sandy soils based on the critical-state geomechanics theory. In their experiments, they observed that high confining pressure can cause pressure melting in frozen soil. They also proposed a double-yield surface constitutive model that can describe the volume expansion characteristics of saline frozen sandy soils [14]. Wang et al. [15,16] proposed an elastoplastic constitutive model for frozen soil through cyclic loading tests. Zhang et al. [17,18] proposed a model based on homogenization theory combined with frozen triaxial tests and performed predictive analysis.
In the soil shear process, cohesion plays a role in the initial stage of soil deformation, while friction can only play a full role after sufficient soil deformation [19], which corresponds to the bonded element and frictional element in the binary medium theory. The binary medium theory is derived from the geotechnical fracture mechanics theory proposed by Z.J. Shen, which is based on the assumption of a quasi-continuous medium [20,21]. The theory abstracts structural geotechnical materials into a binary medium consisting of firmly cemented structural bodies and weakly cemented zones [22]; both bear the load together, and the structure gradually breaks down and transforms into a soft zone in the process of soil deformation. At present, many scholars have successfully applied the binary medium model to a variety of geotechnical materials, including rockfill [23], rock [24,25,26], fissure loess [27,28,29,30,31,32], structural soil [33], tailings [34], etc. The binary medium model can better simulate the deformation characteristics of the above geotechnical materials. Although the theory of binary medium is widely used in various geotechnical materials, there needs to be more research on the binary medium constitutive model of frozen saline soil.
The strength of frozen solidified saline soil is mainly derived from the interaction between hydration products, soil particles and salt crystals, pore ice strength, soil skeleton strength, and hydration product strength. Moreover, the pore distribution characteristics of soil directly affect the frost resistance of soil, so it is significant to study the fractal characteristics of frozen solidified saline soil. Pedarla et al. [35] introduced the pore structure details of expansive soil by mercury intrusion porosimetry (MIP). Zhang et al. [36] proposed a fractal model based on the Menger sponge model with pore size distribution as a control index; Sun et al. [37] explored the relationship between factors such as pore size, dry and wet cycles, and fractal dimension through three fractal models. Chen et al. [38] predicted the permeability of fly-ash-modified granite by fractal dimension. Gao et al. [39] found that the multifractal system can better characterize the cement slurry with size-dependent and local singularities. Yu et al. [40] used the Menger sponge model to study the fractal characteristics of cement slurry and found that there was a negative correlation between compressive strength and pore fractal dimension. The research results of Wei et al. [41] show that the compressive strength of concrete is positively correlated with the fractal dimension, which is contrary to the research results of Yu. Therefore, it is effective to use the fractal theory and the concept of fractal dimensions to study the pore structure of materials. However, the theory is still in the development stage, and a large amount of experimental data are needed to ensure the accuracy of the conclusion. At present, there are few reports on the fractal dimension research on saline soil and solidified saline soil.
This paper presents a binary medium constitutive model suitable for both frozen saline soil and frozen solidified saline soil. The reliability of the model is validated through triaxial test results. Additionally, the influence of water content, temperature, and confining pressure on frozen saline soil is considered to examine the variations in shear strength and deformation characteristics. Furthermore, the pore structure characteristics of saline soil and solidified saline soil were analyzed through MIP tests. Utilizing the thermodynamic model, Menger sponge model, and Neimark model, the fractal dimensions of saline soil before and after solidification were computed, providing a quantitative representation of the solidification effect on saline soil. The aim is to provide a reference and theoretical basis for the research and engineering construction of frozen saline soil foundations.

2. Introduction to the Test

2.1. Physical and Chemical Indicators of Test Materials

The saline soil for the test was taken from the foundation soil of an irrigation area in Pingluo County, Ningxia. The degree of salinization [42] and the locations of saline soil samples in the Yinchuan Plain of Ningxia are shown in Figure 2. To clarify the particle size distribution of saline soil, particle analysis was conducted on saline soil with particle sizes ranging from 0.075 to 2 mm using the sieving method [43]. The results are presented in Table 1. Liaoning Dandong Biotek BT-2003 laser particle size analyzer in Dandong, China was used to analyze the particle size of soil samples below 0.075 mm, and the particle gradation is shown in Figure 3. The ion composition and salt content of the saline soil are shown in Table 2. According to the Code for Geotechnical Engineering Investigation [44] and the analysis method of the soluble salt test [43], a digital display multi-purpose speed regulation oscillator HY-2A combined with Shanghai Yuanyi flame photometer FP640 and ultraviolet spectrophotometer UV765 in Shanghai, China was used to determine c(Cl)/2c(SO42−) < 0.30. Combined with the salt content, it can be seen that the test soil sample was ultra-saline soil. The preliminary test confirmed that combining fly ash, silica fume, and brick powder with cement to solidify saline soil has a good solidifying effect. The cement was Saima brand P.O. 42.5 cement, the fly ash was taken from Ningxia Yinchuan Xixia Thermal Power Plant, Zhongtong Weiye Company produced the silica fume, and the brick powder was taken from a building solid waste landfill in Ningxia. The compositions of the solidifying agents are shown in Table 3.

2.2. Triaxial Test

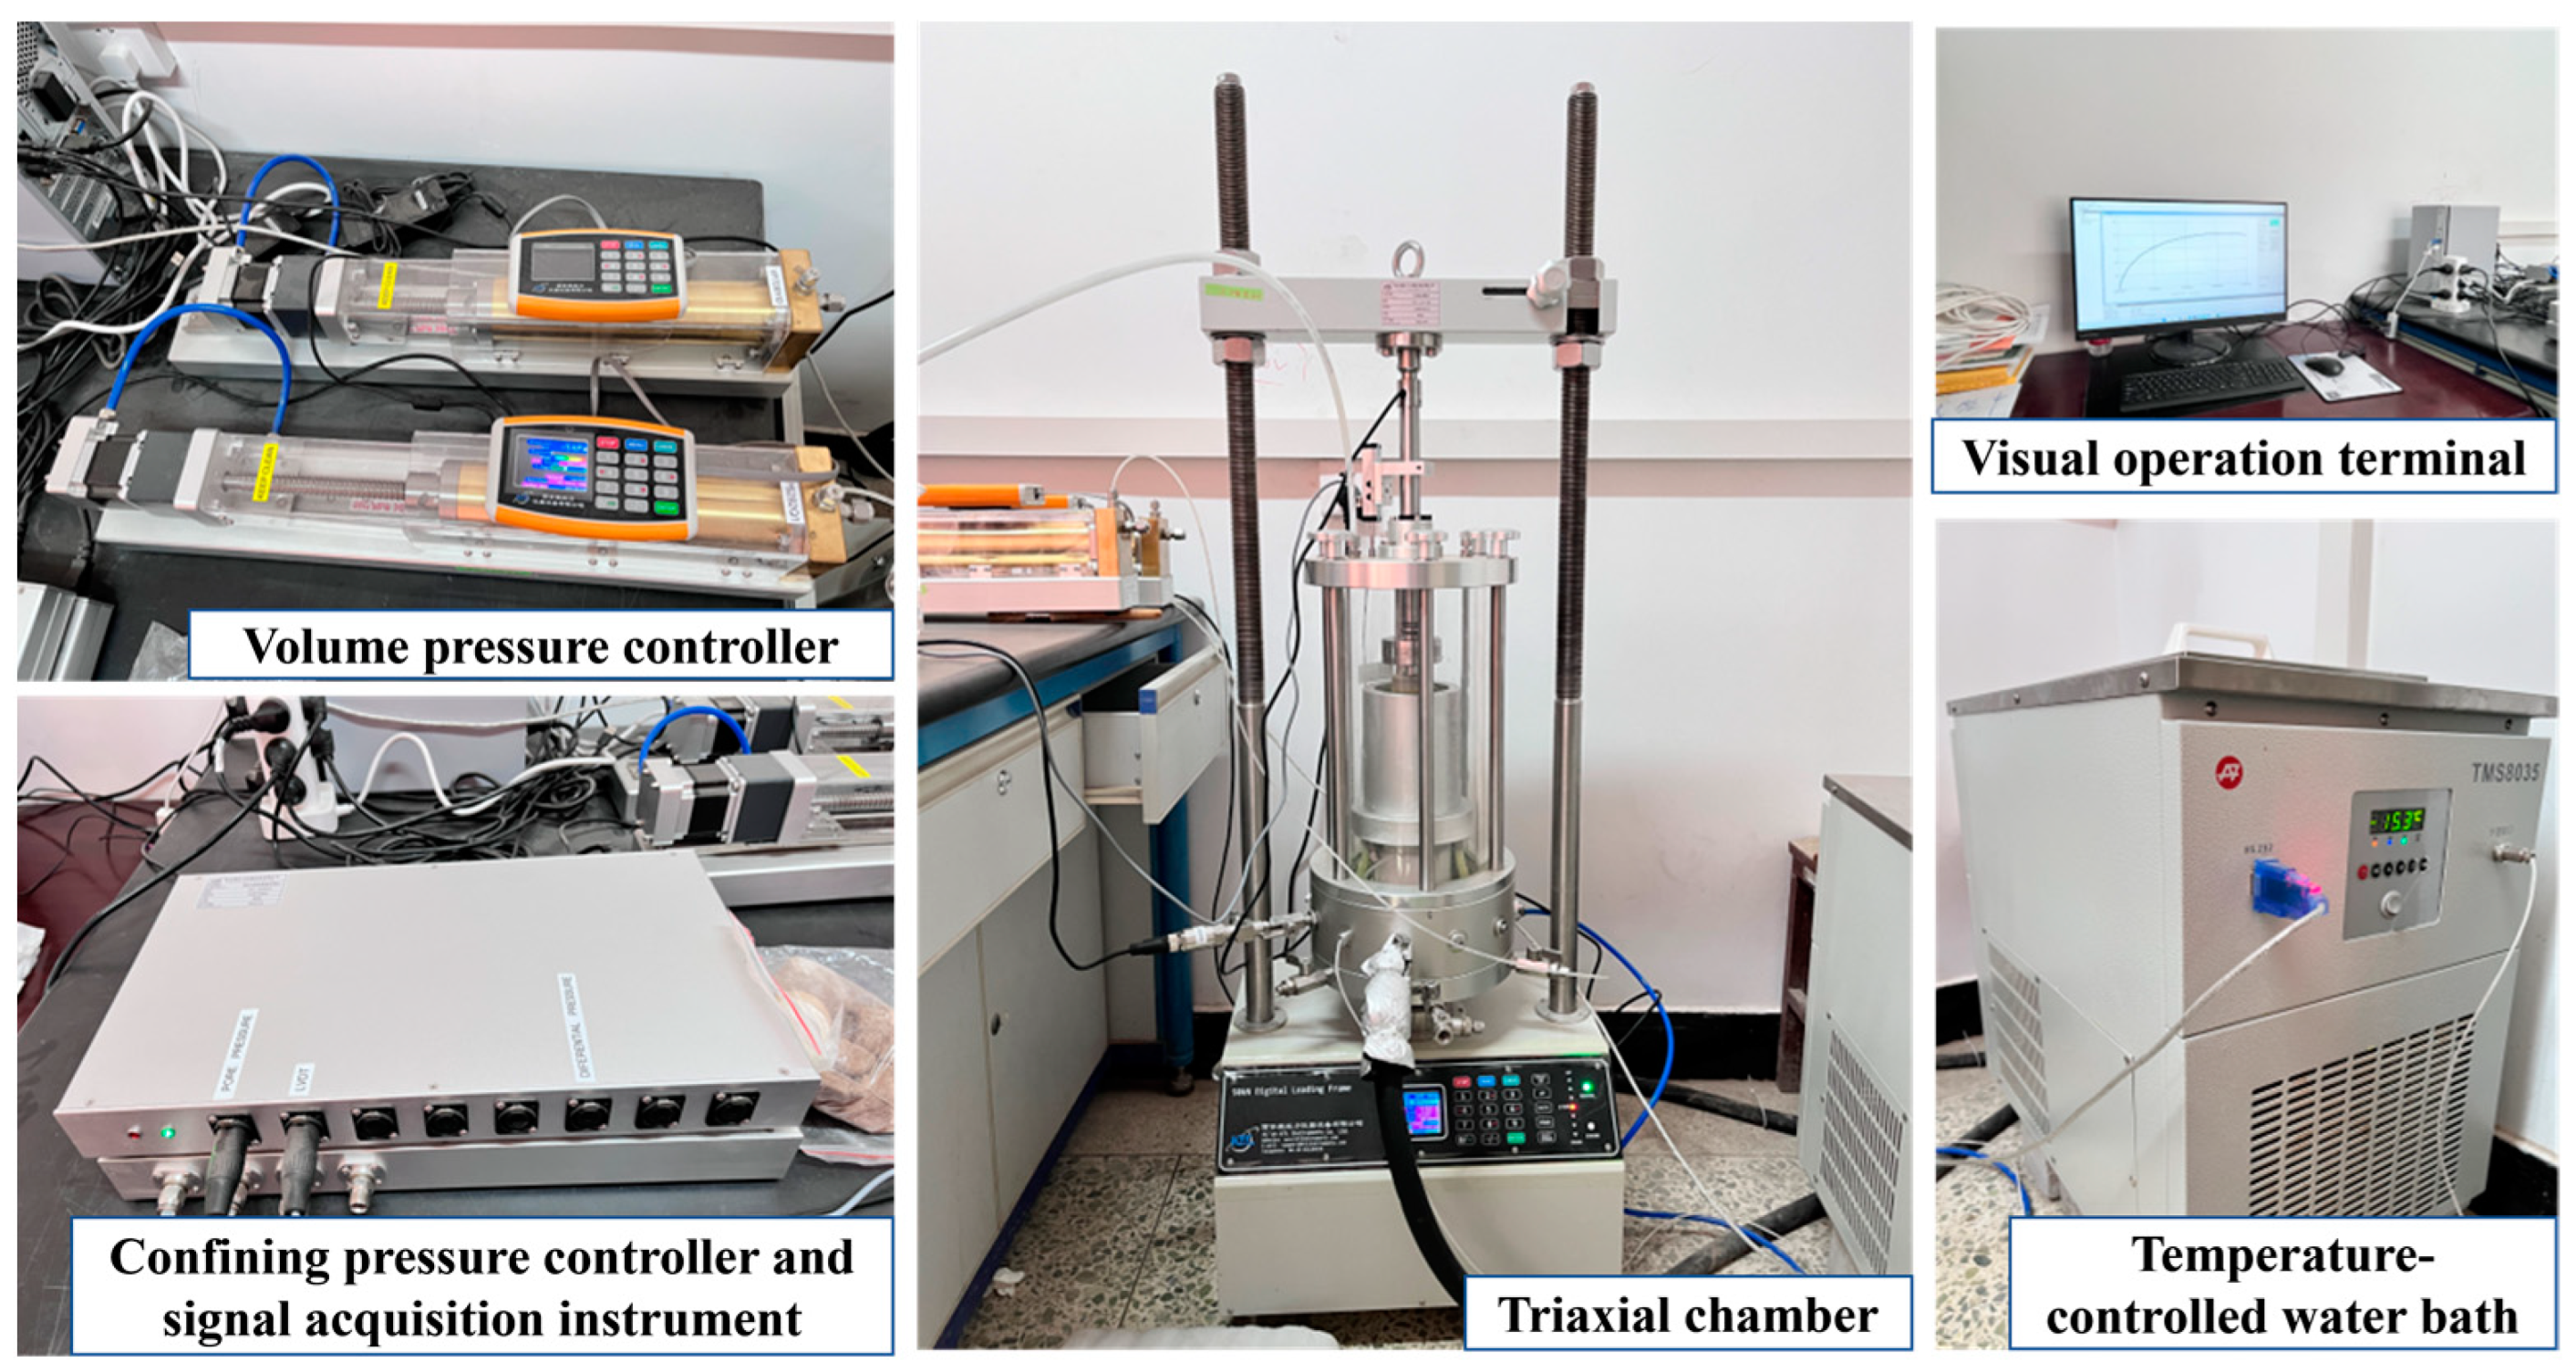
2.2.1. Test Equipment

The test equipment utilizes the temperature-controlled frozen triaxial apparatus developed and produced by Xi’an Kangtuo Li Instrumentation Co., Ltd. in China, which consists of five parts: triaxial chamber, volume pressure controller, confining pressure controller and signal acquisition instrument, temperature-controlled water bath, and visual operation terminal, as shown in Figure 4. The triaxial chamber includes a vertical loading system, confining pressure outer chamber, water bath inner chamber, and sensor. The volume pressure controller is used to monitor the pore pressure and discharge the liquid in the water bath. The confining pressure controller, in tandem with the signal acquisition instrument, regulates the magnitude of the confining pressure and conveys the displacement and temperature readings from the test to the operational interface. The temperature-controlled water bath can adjust the test environment temperature, with a temperature control accuracy of 0.1 °C. The visual operation terminal can comprehensively control the required conditions of the test and observe the relationship curve of each variable in real time.

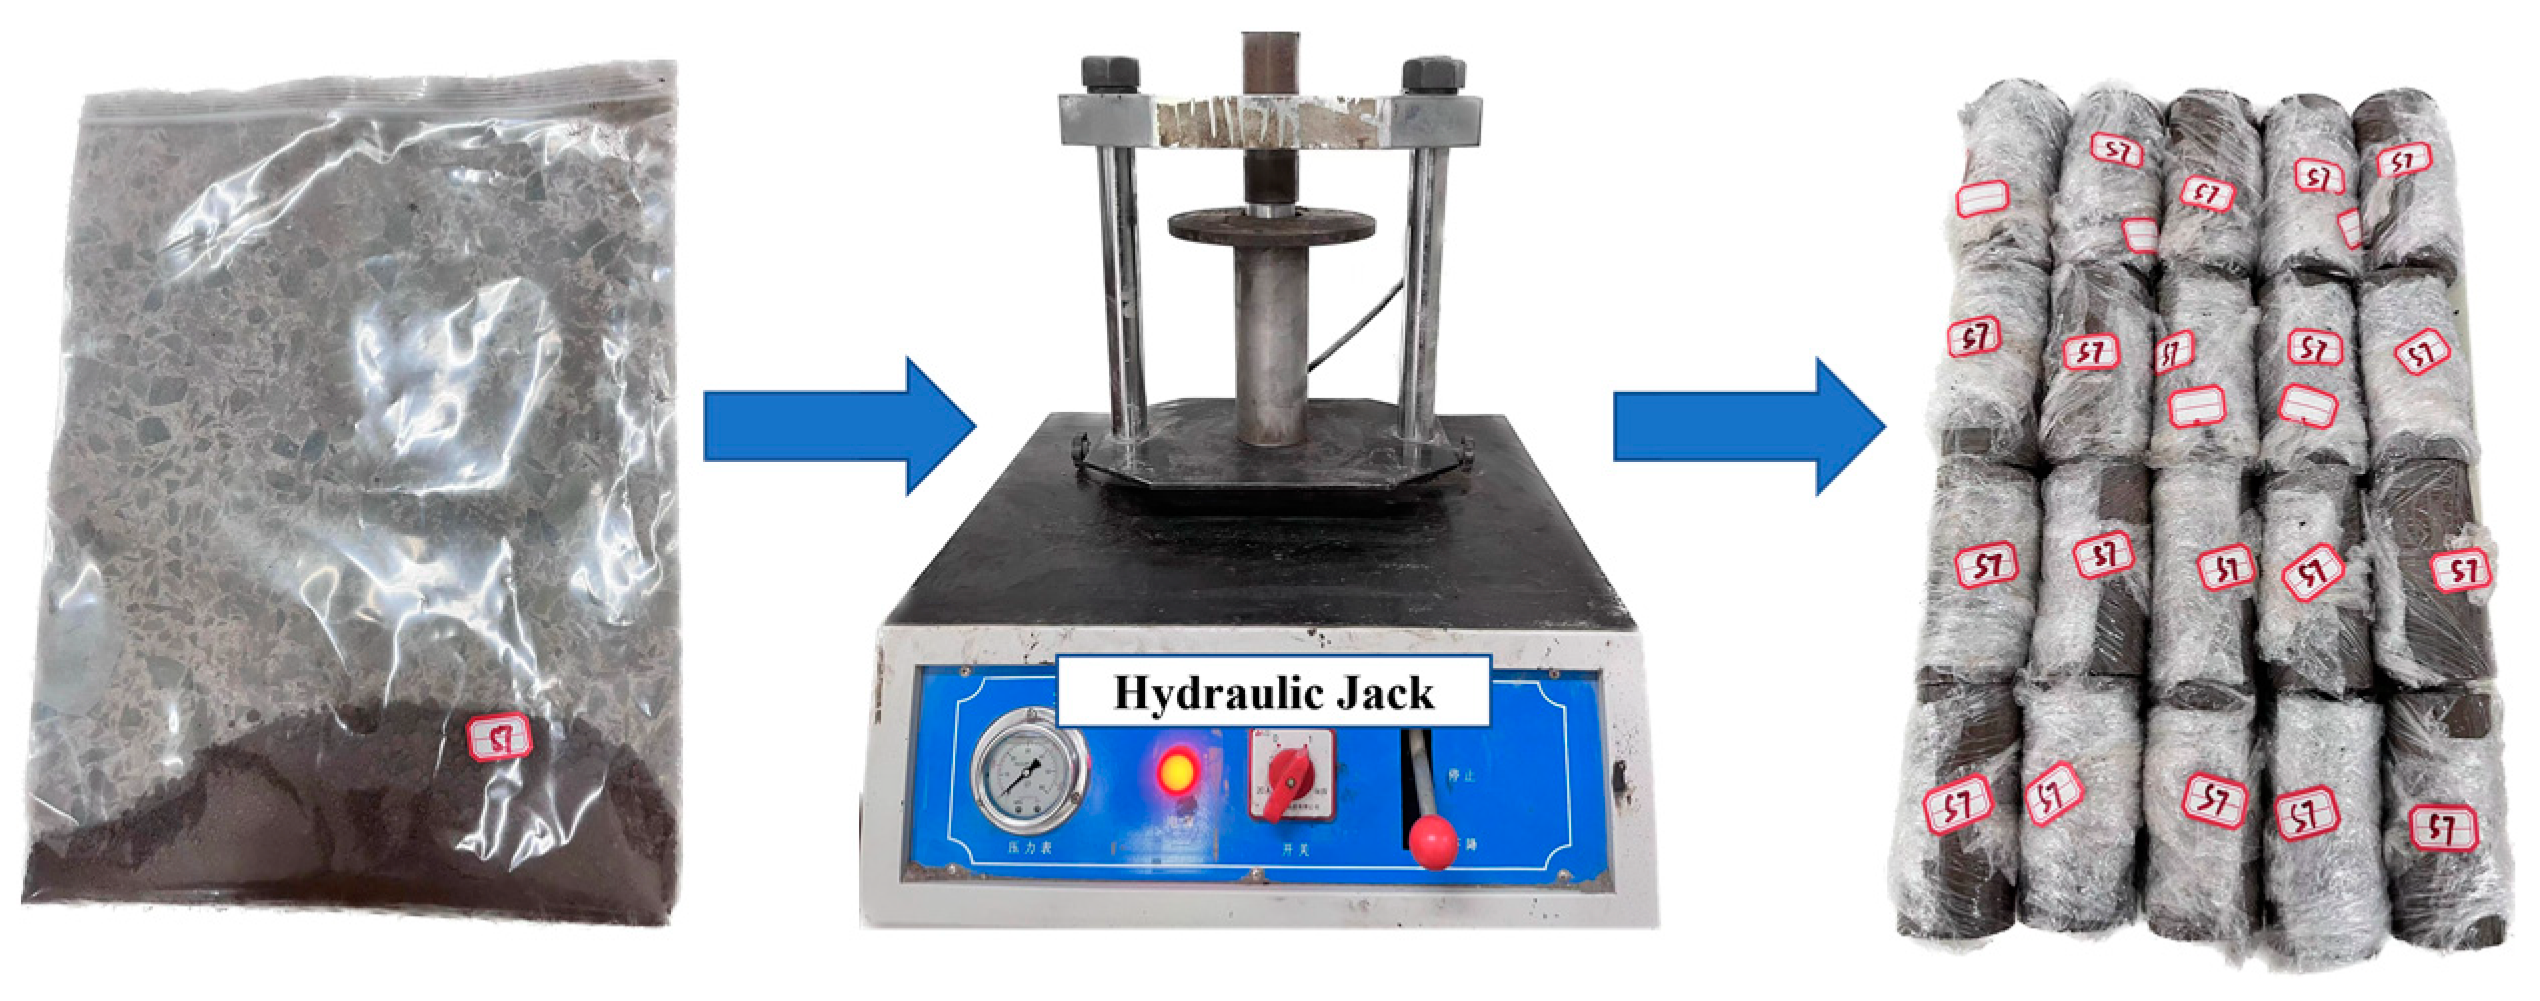
2.2.2. Sample Preparation

The soil sample and solidifying agent were placed in an oven at 105 °C for drying for a duration of 24 h. The saline and solidified saline soil samples were prepared according to the water content required by the test program. The solid particles and water were mixed thoroughly, then sealed with cling film and smothered for 24 h to ensure uniform water distribution in the soil samples. To prevent cement hydration in the solidified saline soil samples during smothering, cement was added and mixed well after smothering was completed, and the water consumed by cement hydration in the preparation of solidified saline soil samples was considered in the conservation process. The consumption was about 20–25% of the cement mass [4], and an intermediate value of 23% was taken in this test.
The sample was formed by static pressure. The sample size was φ 50 mm × h 100 mm cylinder. During sample preparation, Vaseline was evenly applied to the inner wall of the mold, and the soil sample was evenly poured into the mold in five layers. Each layer was pre-compacted, and the surface was thoroughly planned to ensure the overall density of the sample. To prevent the soil sample from sticking to the pad during sample preparation, the pad was pushed into the mold by a hydraulic jack after loading, and the mold was removed after static pressure for 5 min. The soil sample was wrapped in plastic wrap to prevent water evaporation, and the solidified saline soil sample was placed in a constant temperature and humidity box for maintenance. The sample preparation process is shown in Figure 5. After the preparation of samples, the specimens were placed in a freezer for rapid freezing for at least 24 h before conducting the triaxial shear tests. The temperature of the freezer needed to be adjusted in real-time according to the temperature conditions required for the experiment.

2.2.3. Test Program

According to the previous unconfined compressive strength test based on an orthogonal scheme and comprehensive strength and economic factors, the optimal mixing ratio of solidifying agent for the solidified saline soil sample was determined as cement:fly ash:silica fume:brick powder = 3:5:5:6. Given that the nature of saline soil is characterized by a particle size of less than 2 mm, classified as silty clay, the optimal water content of the saline soil was determined through a standard lightweight compaction test with a unit volume compaction energy of approximately 592.2 kJ/m3. The test established the optimal water content for saline soil at 16.20%, with a maximum dry density of 1.90 g·cm−3. For solidified saline soil, the optimal water content was identified as 20.41%, with a maximum dry density of 1.76 g·cm−3. The optimum water content and maximum dry density were used as the control conditions for both salted soil samples and solidified salted soil samples. In the case of saline soil foundations for channels, the compaction coefficient is generally above 0.9 [4]. In order to investigate the stress–strain relationship and pore distribution of saline soil foundations under the most unfavorable conditions, the compaction factor was controlled at 0.9. Unconsolidated and undrained triaxial shear tests were conducted to simulate actual working conditions. The controlled confining pressures at each freezing temperature were 150, 250, 350, and 450 kPa. The controlled shear rate was 1.20 mm/min, and the test termination condition was ε1 = 20.00%. The solidifying age of the solidified saline soil samples was 28 days, and the pre-test found no noticeable difference in deformation characteristics under the gradient of 2% water content. Therefore, a more significant water content change gradient was set to clarify the deformation characteristics of saline soil under different water contents, and the optimal water content was controlled at 16.20 ± 4.00%. The test program is shown in Table 4. To ensure that the temperature of the sample reaches the controlled temperature during the triaxial shear process, it is necessary to initiate the water bath circulation system for cooling pretreatment after the sample installation is completed. The formal triaxial shear test can begin 12 h after the pretreatment period.

2.3. MIP Test

2.3.1. Test Equipment

The AutoPore 9500 mercury intrusion porosimetry by Shanghai MicroActive in China was used to analyze block or powder samples with pore sizes ranging from 0.005 to 800 μm.

2.3.2. Test Program

Based on the unconfined compression strength test of solidified saline soil under the previous orthogonal scheme, three groups of solidified saline soil and unsolidified saline soil with a better ratio were selected for the MIP test, and the best water content of the saline soil and solidified saline soil and the compaction factor of 0.9 were used as control conditions to configure test soil samples. The curing period for solidified saline soil is 28 days. The specific test scheme is shown in Table 5.

3. Binary Medium Model of Frozen Saline Soil

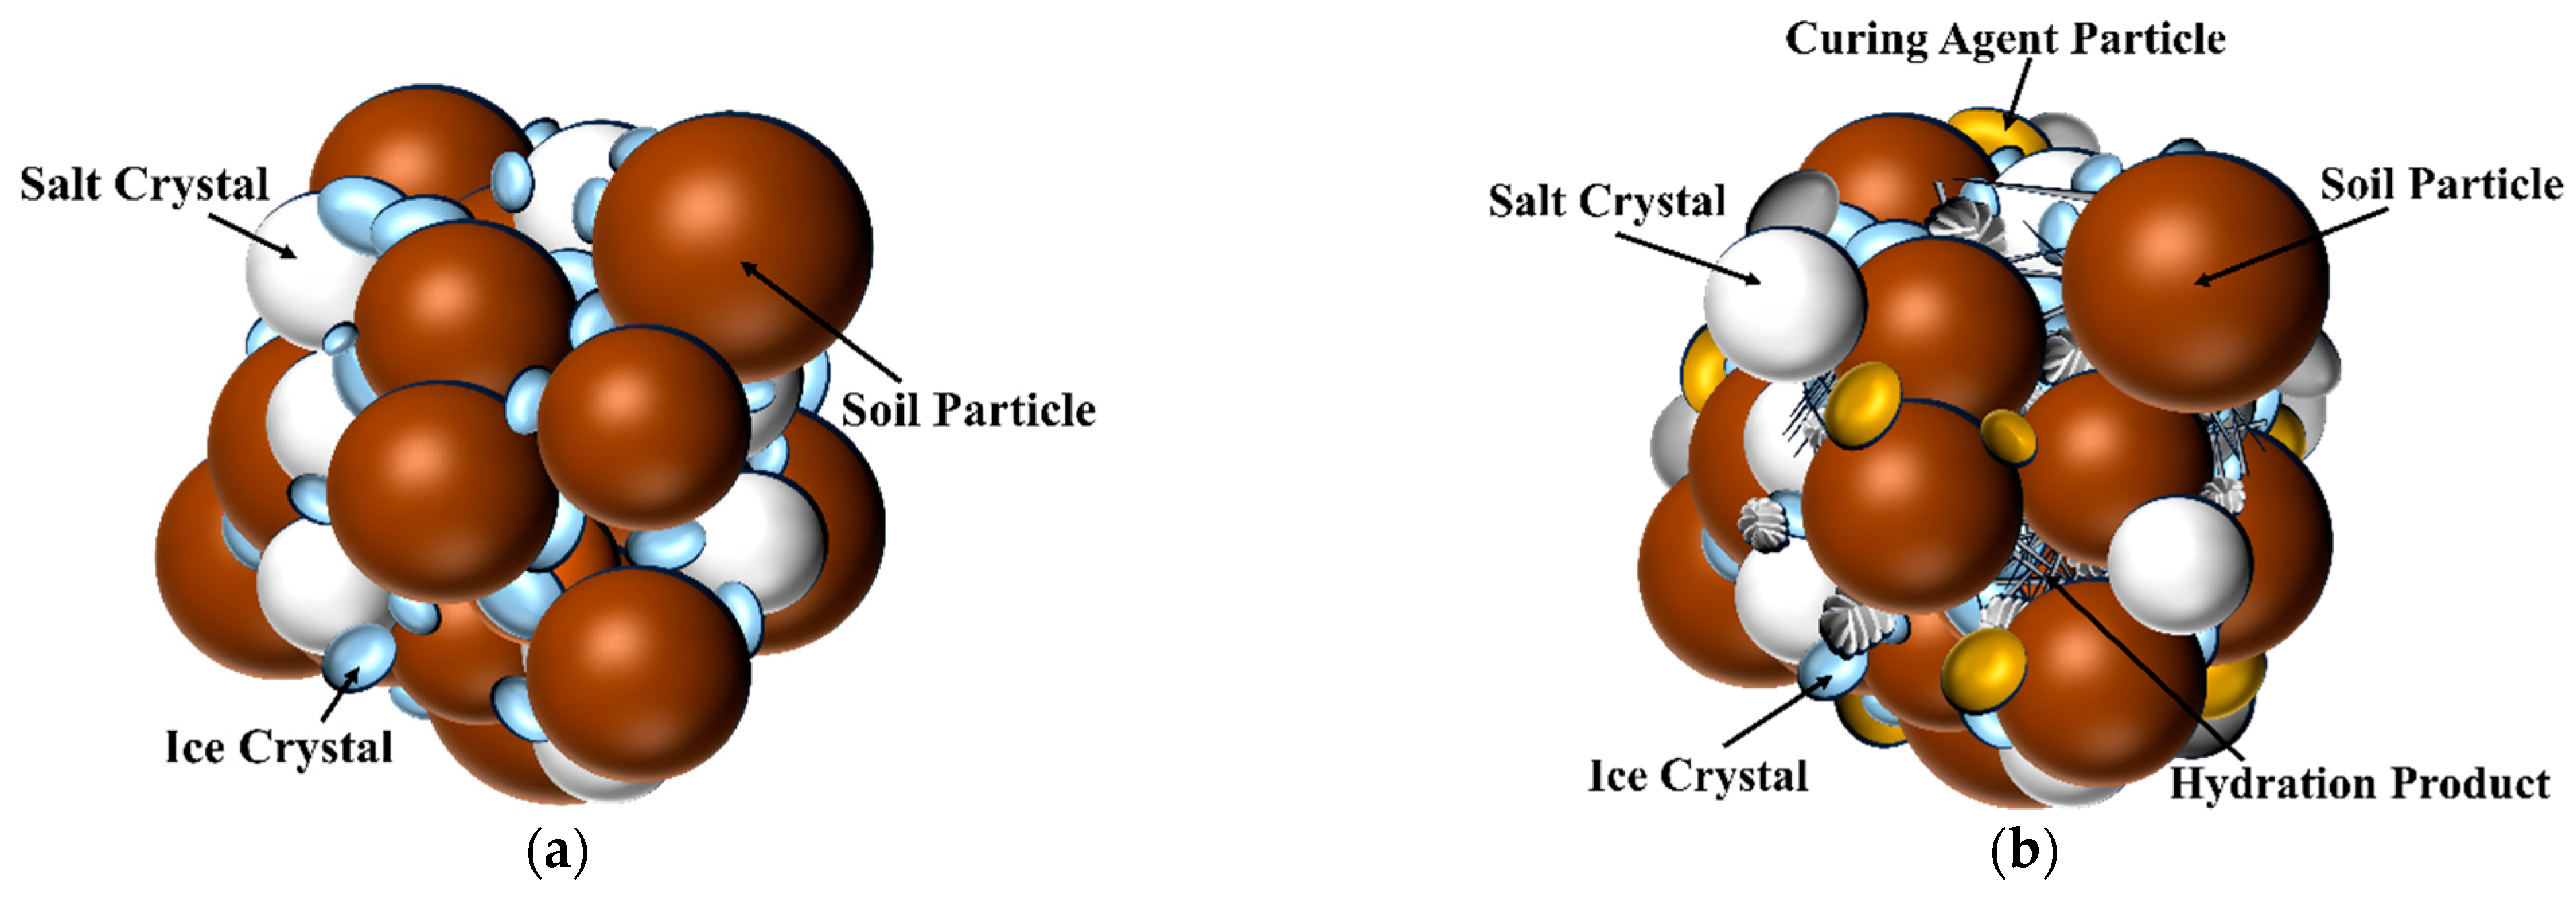
3.1. Structural Model of Frozen Saline Soil

Frozen saline soil and solidified frozen saline soil are both granular reinforced composite materials whose strength is mainly borne by the strength of the soil skeleton, the resilience of the cementing material, and the cementing force between the cementing material, soil particles, and salt crystals. The cementing material includes cemented ice and hydration products formed by the hydration of the solidified cementing material. Due to the influences of temperature and pressure, pore water in the soil is transformed into pore ice, which makes the connection between the internal structure of frozen saline soil and unfrozen soil an obvious difference.
The structural models of frozen saline soil before and after solidification are depicted in Figure 6. In the frozen saline soil, the cementation ice binds soil particles and salt crystals together. In contrast, the solidified saline soil contains not only cementation ice but also hydration products formed from the hydration of cementitious materials as cementing materials. According to the concept of binary medium in rock and soil damage mechanics, the reinforced skeleton of soil particles, salt crystals, and cementing materials is used as the cementing element, which has a large deformation modulus and good integrity. When the external load or external temperature changes, the inside of the bonded element begins to break; the pore ice is crushed and compacted; the soil particles, salt crystals, and hydration products of the cementing material are broken; and the cracks continue to expand due to the stress concentration. Finally, a local shear zone is formed. At this time, the bonded element transforms into the frictional element. The deformation modulus of the frictional element is much lower than that of the bonded element. Under the action of external loads, the micro-cracks and existing local shear zones inside the frictional element further expand, eventually destroying the whole structure. There are a lot of bonded elements and frictional elements in the frozen saline soil system, and they will transform each other under the boundary conditions. The strength of frozen saline soil is related to the quantity of the two elements. The triaxial shear test of frozen saline soil is the process of gradually changing the bonded element into the frictional element in the frozen saline soil system. The bonded element plays a significant role in triaxial shear’s initial linear elastic stage. After entering the elastoplastic stage, the bonded element continuously transforms into the frictional element. With the increase in shear displacement, the role of the bonded element decreases gradually until it is completely transformed into the frictional element.
In the initial linear elastic stage of the triaxial shear test of frozen saline soil, the bonded element plays a significant role. There is no damage in the test piece of soil at this time, and the bonded element can be regarded as an ideal elastic material. Therefore, the bonded element can be expressed by Hooke’s law. Its elastic modulus is called the initial elastic modulus and can be determined by the slope of the stress–strain curve at the initial stage. When the strain of the bonded element is less than the limit strain εb, the deformation curve of the bonded element shows a linear increase. When the strain of the bonded element exceeds the limit strain εb, the bonded element breaks and loses its strength instantly.
With the increasing shear displacement, the bonded element changes to the frictional element, and as the number of frictional elements increases, so does the stress ratio. The constitutive properties of frictional elements are hyperbolic and have elastic–plastic properties. Due to the limitation of different boundary conditions, the constitutive relationship of frozen saline soil will show two changing trends in the elastic–plastic stage: strain-hardening type and strain-softening type. The specimen with strain-hardening type will not have an obvious stress peak point in its constitutive relationship, so the value of ε = 15% deviated stress is taken as the stress peak value of the specimen [45]. In order to better characterize the constitutive relationship of frozen saline soil under different boundary conditions, the Duncan–Chang model and modified Duncan–Chang model are used to describe the constitutive characteristics of frictional elements in frozen saline soil [45], and the strain value εmax corresponding to the peak stress is taken as the control condition, as shown in Equation (1).
σ b = { ε b a + b ε b , ε max = 15 % ε b a + n ε b + l ε b 2 , ε max < 15 %
where σb is the stress borne by the frictional element; εb is the strain of the frictional element; and a, b, n, and l are the material parameters.
The elasticity, plasticity, and brittleness of solids can be represented by spring, slide, and cement rod elements, respectively. The load-sharing mode of the binary medium model is shown in Figure 7 [46]. In Figure 7, E is the stiffness of the spring, Ea and Eb represent the bonded element modulus and frictional element modulus before and after the microelement failure, q is the failure strength, and f is the yield strength. The elastic–brittle bonded element is formed by the spring of the bonded rod in series, and the elastoplastic friction element is formed by the spring and the slide in series. In the triaxial shear process, the elastic–brittle bonded element plays a role in the initial stage and bears the stress. When the bonded rod breaks, the bonded element changes into the frictional element and bears the stress together with other frictional elements.

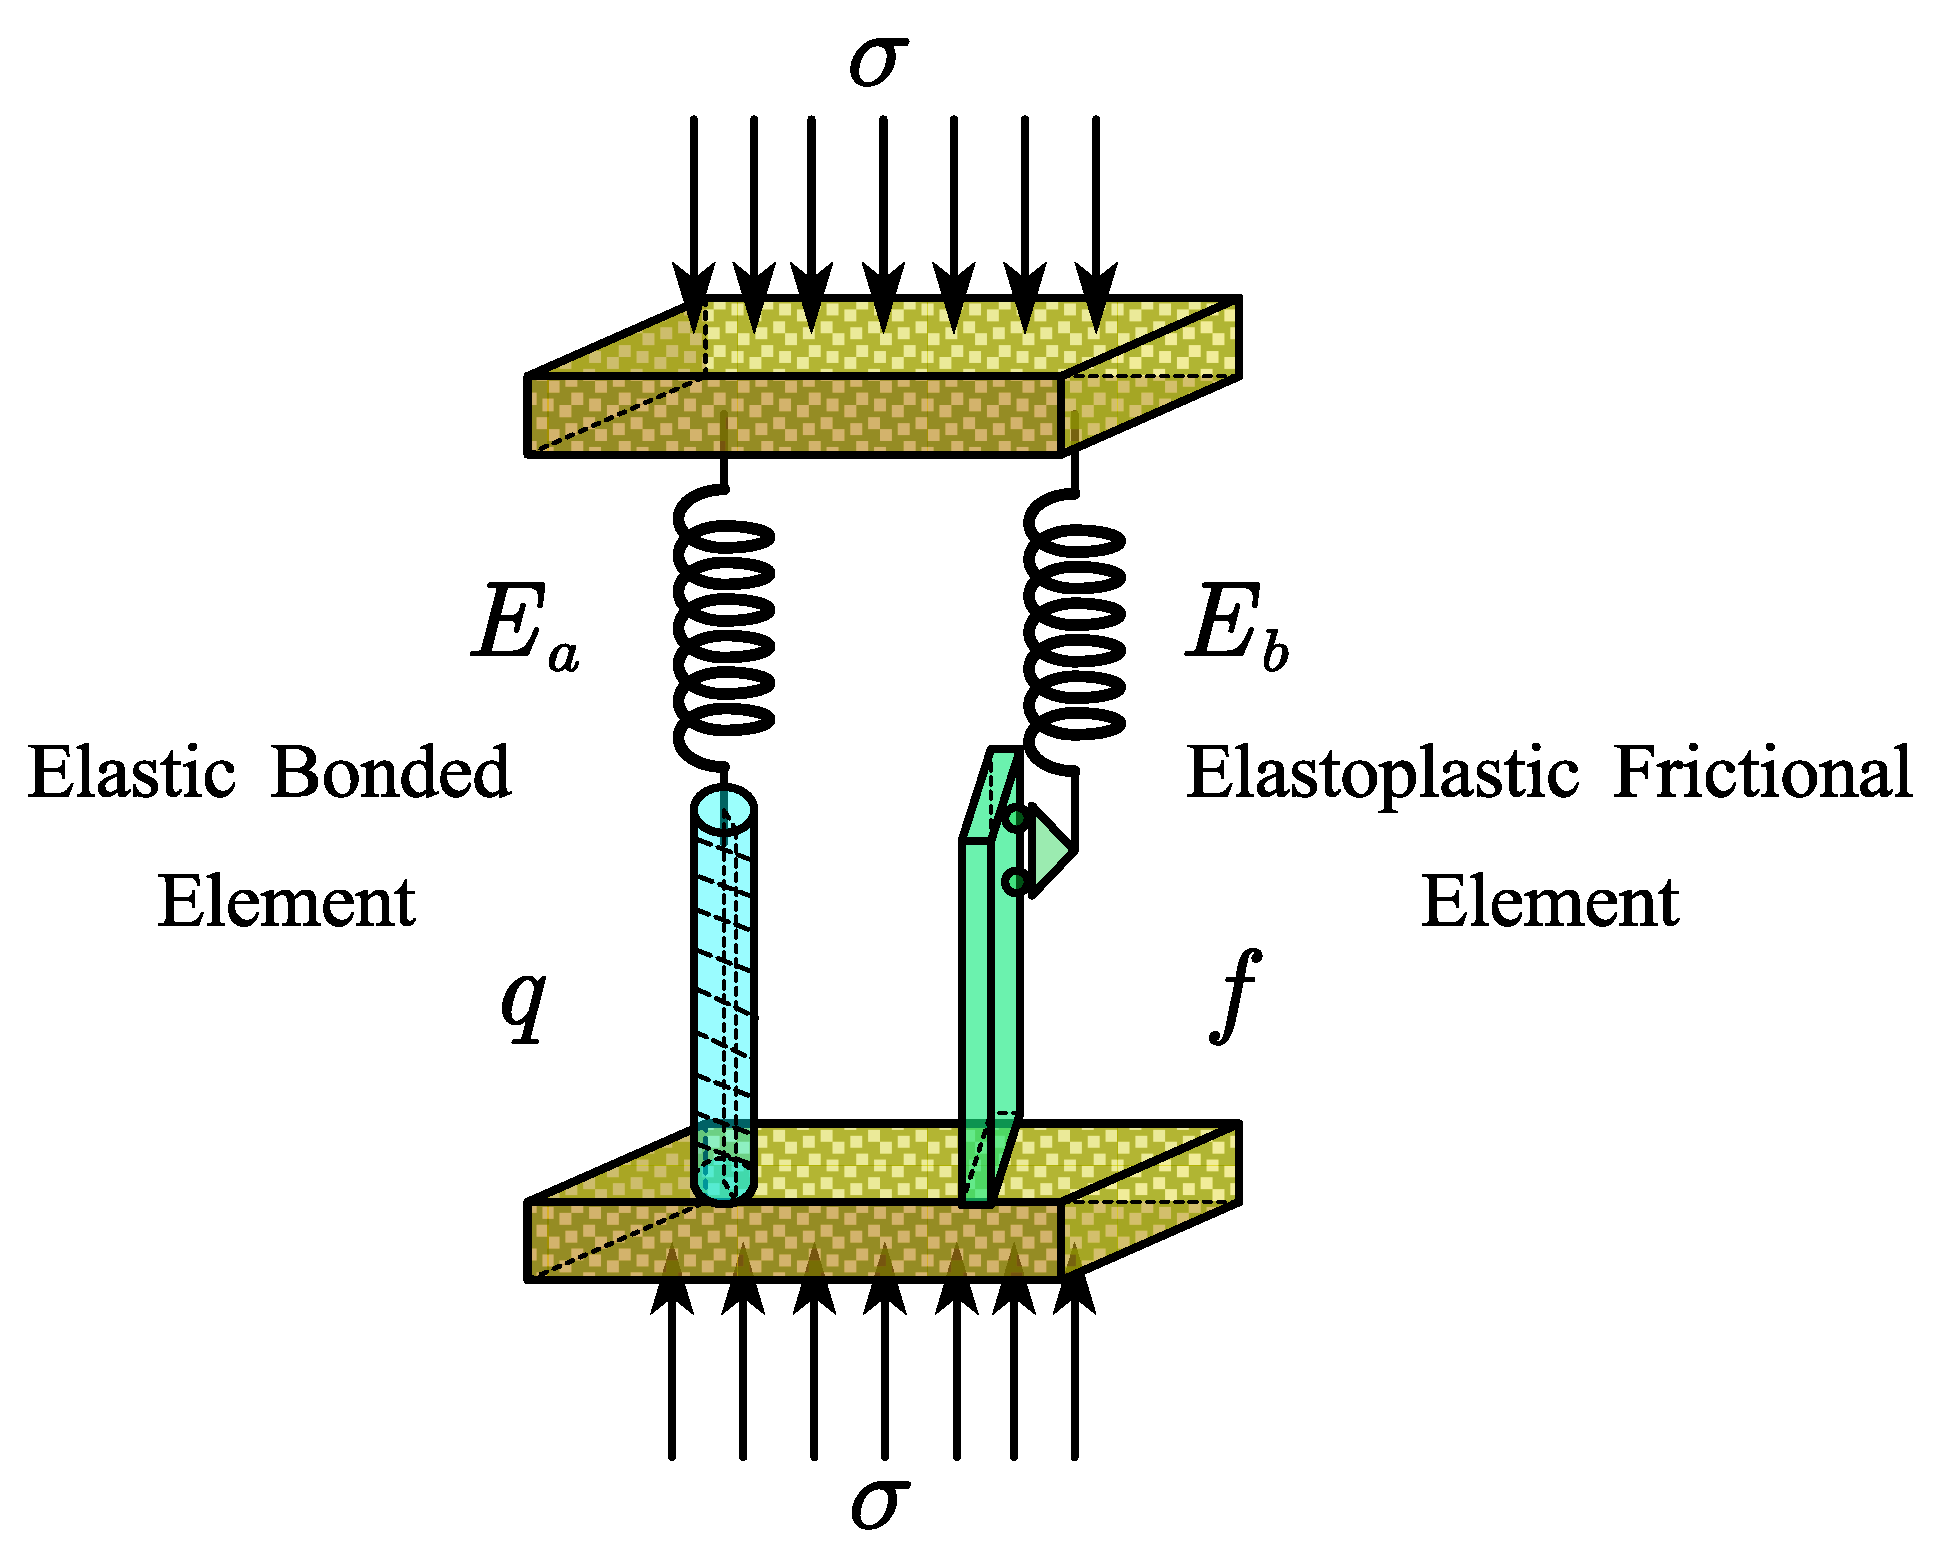
3.2. Binary Medium Modeling of Frozen Saline Soils

The internal bonding force of frozen saline soil is not uniformly distributed in space, so frozen saline soil can be regarded as a non-homogeneous material. Taking a representative unit of frozen saline soil and using the homogenization theory of non-homogeneous composite materials, the average stress and average strain of frozen saline soil can be expressed as Equation (2).
σ z = 1 V σ lim d V = 1 V σ lim d ( V a + V b ) = 1 V σ lim d V a + 1 V σ lim d V b
The frozen saline soil as a whole can be regarded as consisting of two parts, the bonded element and the frictional element. The stress expression is given by Equations (3) and (4).
σ a = 1 V a σ lim d V a
σ b = 1 V b σ lim d V b
By substituting Equations (3) and (4) into Equation (2), Equation (5) is obtained.
σ z = V a V σ a + V b V σ b
Similarly, the strain expression of the bonded and frictional elements is obtained as shown in Equation (6).
ε z = V a V ε a + V b V ε b
The volume failure rate λ is introduced, the expression is shown in Equation (7).
λ = V b V
By substituting Equation (7) into Equations (5) and (6), Equations (8) and (9) are obtained.
σ z = ( 1 λ ) σ a + λ σ b
ε z = ( 1 λ ) ε a + λ ε b
where V represents the unit volume, and Va and Vb are the volumes of bonded elements and frictional elements, respectively. σlim represents the local stress of the element; σz and εz represent the mean stress and mean strain of the unit; σa and σb are the local stresses of the bonded element and the frictional element.
From the structural model analysis of frozen saline soil, it can be seen that the bonded element can be regarded as an ideal elastic material when it is not damaged, and the elastic modulus is determined by the initial slope of the stress–strain curve in the triaxial test. In order to better simulate the constitutive relationship of frozen saline soil under different conditions, the deformation characteristics of the frictional element are controlled by the strain value corresponding to the peak stress. By using the nonlinear Duncan–Chang model and the modified Duncan–Chang model, Equation (8) can be expressed as Equation (10).
σ 1 σ 3 = { ( 1 λ ) E 0 ε a + λ ε b a + b ε b , ε max = 15 % ( 1 λ ) E 0 ε a + λ ε b a + n ε b + l ε b 2 , ε max < 15 %
Considering the deformation non-uniformity of the frictional element and bonded element, the local strain coefficient c is introduced, and the expression is shown in Equation (11).
c = ε b ε
By substituting formula (11) into formula (9), Equation (12) is obtained.
ε a = ( 1 c λ 1 λ ) ε
By substituting Equations (11) and (12) into Equation (10), the constitutive model formula of the binary medium of frozen saline soil can be expressed as Equation (13).
σ 1 σ 3 = { ( 1 c λ ) E 0 ε + λ c ε a + b c ε , ε max = 15 % ( 1 c λ ) E 0 ε + λ c ε a + n c ε + l c ε 2 , ε max < 15 %
where σ1σ3 is the deviating stress; σ1 is the axial stress; σ3 is the confining pressure; E0 is the initial elastic modulus of the bonded element; λ is the volume failure rate; and a, b, m, and l are material parameters.
The damage rate λ can represent the damage degree of the bonded element. After the homogenization assumption, the bonded element has a damage threshold. The frozen saline soil begins to break when the strain reaches the damage threshold. And with the continuous increase in the strain, the damage proportion of the bonded element keeps increasing. The Weibull distribution function can be used to better describe the damage process of the continuous transformation of the bonded element into the frictional element in the frozen saline soil [47]. In order to better characterize the transformation process of solidified frozen saline soil, the solidifying parameter R is introduced, and the expression is shown in Equation (14).
λ = 1 R exp [ α ( ε ε 0 ) m ]
where ε0 is the initial damage strain of the bonded element, and α and m are the material parameters.
By substituting Equation (14) into Equation (13), the constitutive equation of frozen saline soil and solidified frozen saline soil under frozen triaxial shear is shown in Equation (15).
σ 1 σ 3 = { { 1 c + c R exp [ α ( ε ε 0 ) m ] } E 0 ε + { 1 R exp [ α ( ε ε 0 ) m ] } c ε a + b c ε , ε max = 15 % { 1 c + c R exp [ α ( ε ε 0 ) m ] } E 0 ε + { 1 R exp [ α ( ε ε 0 ) m ] } c ε a + n c ε + l c ε 2 , ε max < 15 %

3.3. Parameter Determination

The slope of the stress–strain curve of the bonded element when the strain is 1.0% is the initial elastic modulus E0 of the bonded element. The local strain coefficient c and the related parameters R, α, and n of the damage rate function were determined indirectly through experiments, and the optimal parameters were selected using a hypothesis first and verification later. The fitting calculation values of each parameter are shown in Table 6. In the equation, parameters a, b, n, and l are determined by the modified Duncan–Chang model test parameter calculation method in the triaxial test [48], and the parameter expression can be expressed as Equation (16).
{ a = 1 E 0 b = 1 ( σ 1 σ 3 ) u l t n = 1 ( σ 1 σ 3 ) max 2 ( ε max E 0 ) l = 1 ( E 0 ε max 2 )
where (σ1σ3)ult is the limit deviating stress.

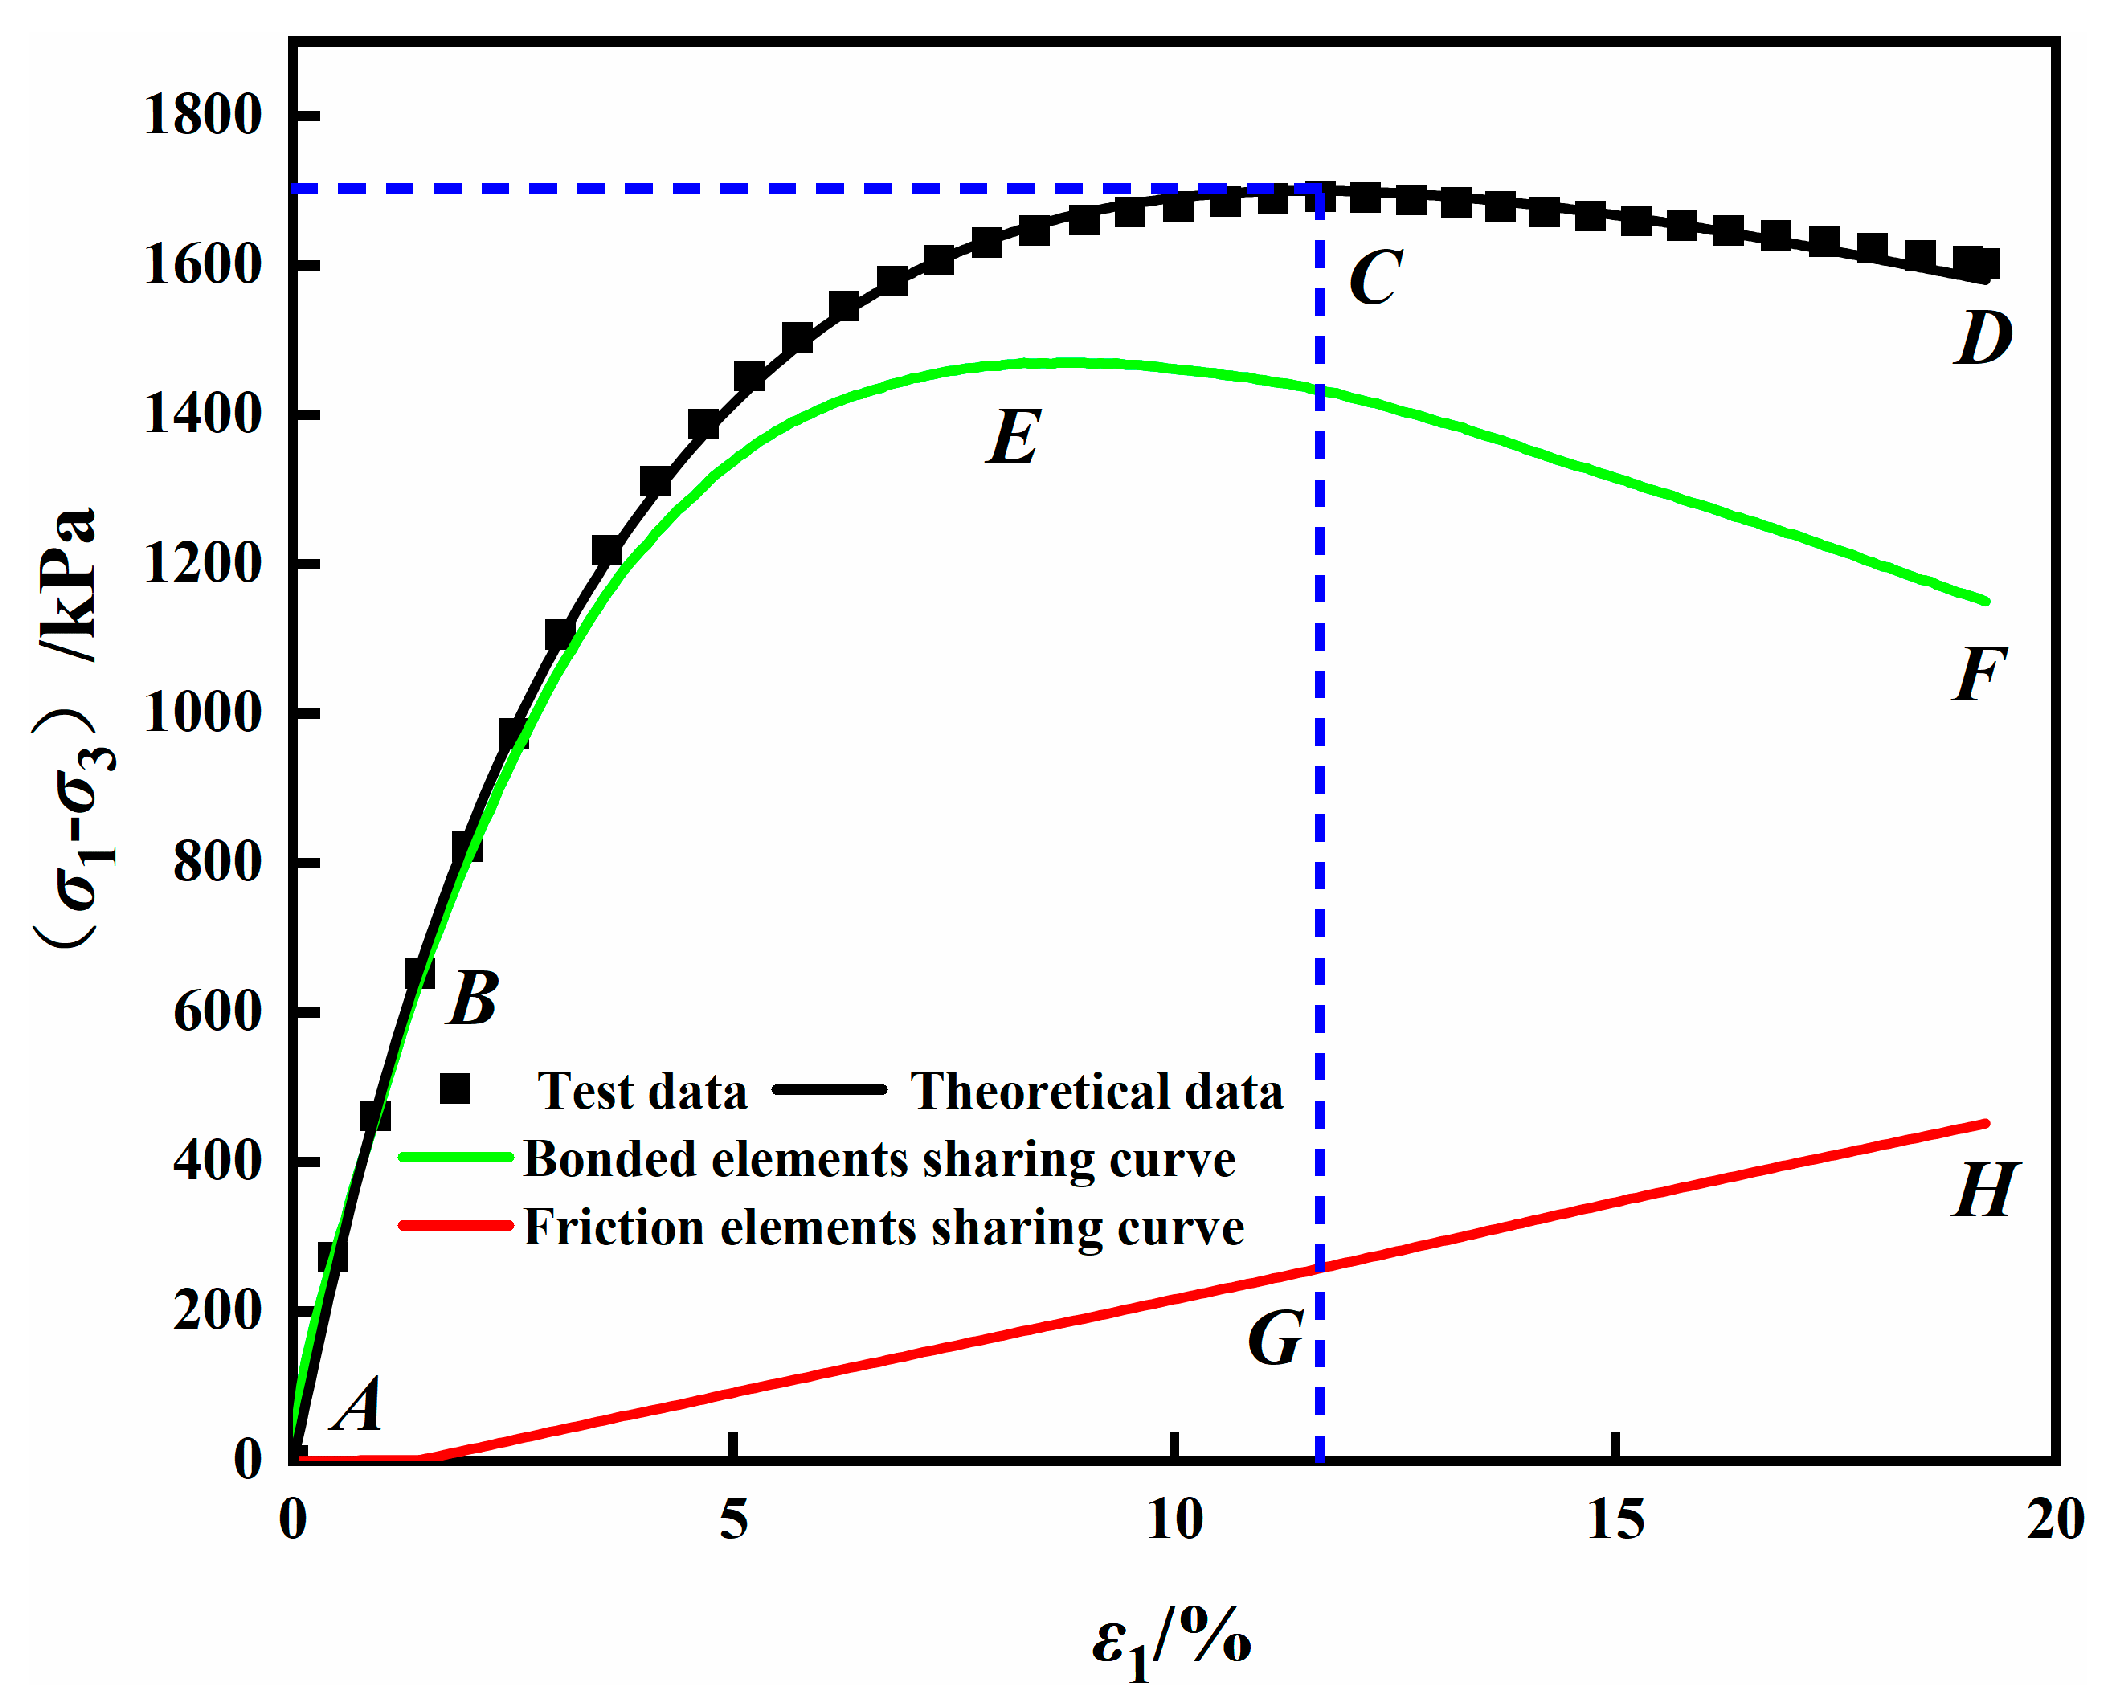
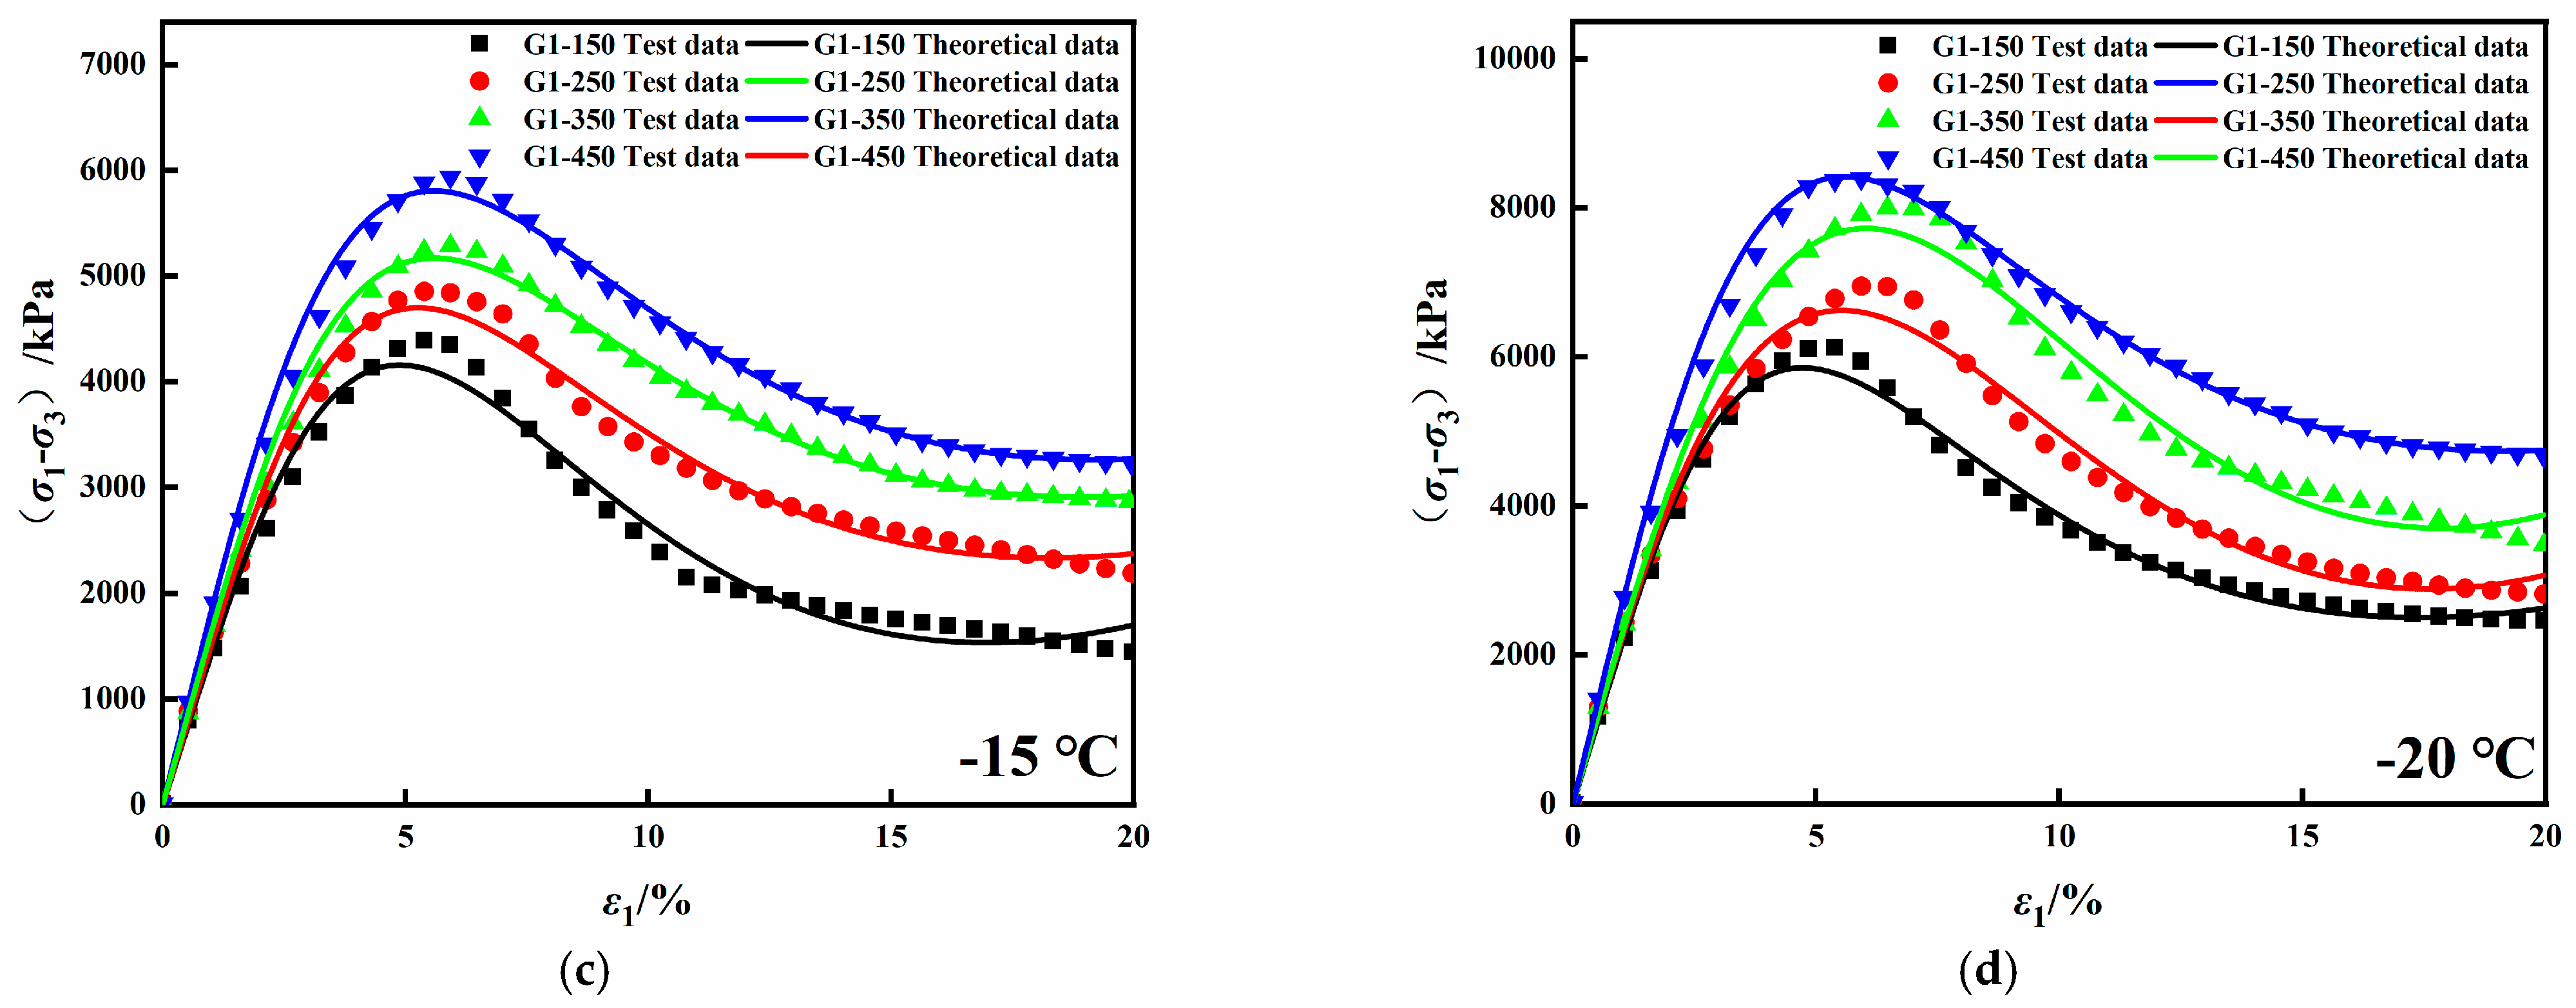
3.4. Model Result Verification

Taking the triaxial shear test of frozen saline soil under −10 °C, 12.20% water content, and 450 kPa confining pressure as an example, the stress sharing curves of the bonded element and frictional element are obtained by Equation (15), as shown in Figure 8. The curve ABCD represents the total stress–strain curve, the curve ABEF represents the bonded element stress–strain sharing curve, and the curve AGH represents the frictional element stress–strain sharing curve. The total stress–strain curve (ABCD) can be formed by the superposition of the bonded element sharing curve (ABEF) and the frictional element sharing curve (AGH). The bonded element sharing curve and the total stress–strain curve are consistent in the online elastic stage. In this case, the stress of the sample is mainly borne by the bonded element, and the sample integrity is good. After the total stress–strain curve entered the elastoplastic stage, the growth rate of the bonded element sharing curve began to slow down. The peak point E of the bonded element sharing curve appeared earlier than the peak point C of the total stress–strain curve. The peak point C of the total stress–strain curve was the maximum value reached after the superposition of the bonded element sharing curve and the frictional element sharing curve.
According to the trend of the stress sharing curve, it can be seen that the bonded element plays a significant role in the early stage of the stress–strain curve. With the arrival of the elastoplastic stage, the internal damage of the bonded element continues to occur, the stress shared by the frictional element begins to increase, and the bonded element changes to the frictional element continuously. After entering the strain softening stage, the decline rate of the bonded element sharing curve further increased, and the frictional element sharing curve continued to increase. The shear failure occurred in the samples at this stage, and different failure forms, such as lateral swelling failure and oblique shear failure, began to appear according to other conditions. Some samples were also accompanied by the formation of local shear bands and through shear bands.
To verify the applicability of the binary medium constitutive model of frozen saline soil, the theoretical data of the model proposed in the paper were compared with the experimental data of the triaxial shear test of frozen saline soil and solidified frozen saline soil. The specific comparison results are shown in Figure 9 and Figure 10. It can be seen from Figure 9 and Figure 10 that the theoretical and experimental data are close to each other under different temperatures and confining pressure conditions; the fit R2 were all in the ranges of 0.9085–0.9996. The model can better simulate the linear elastic stage, the elastic–plastic stage of the stress–strain curve, and the strain softening and strain hardening phenomena of different stress–strain curves according to the control conditions. It was further verified that the model is suitable for the constitutive relationship simulation of frozen saline soil and solidified frozen saline soil.

4. Analysis of Triaxial Test Results

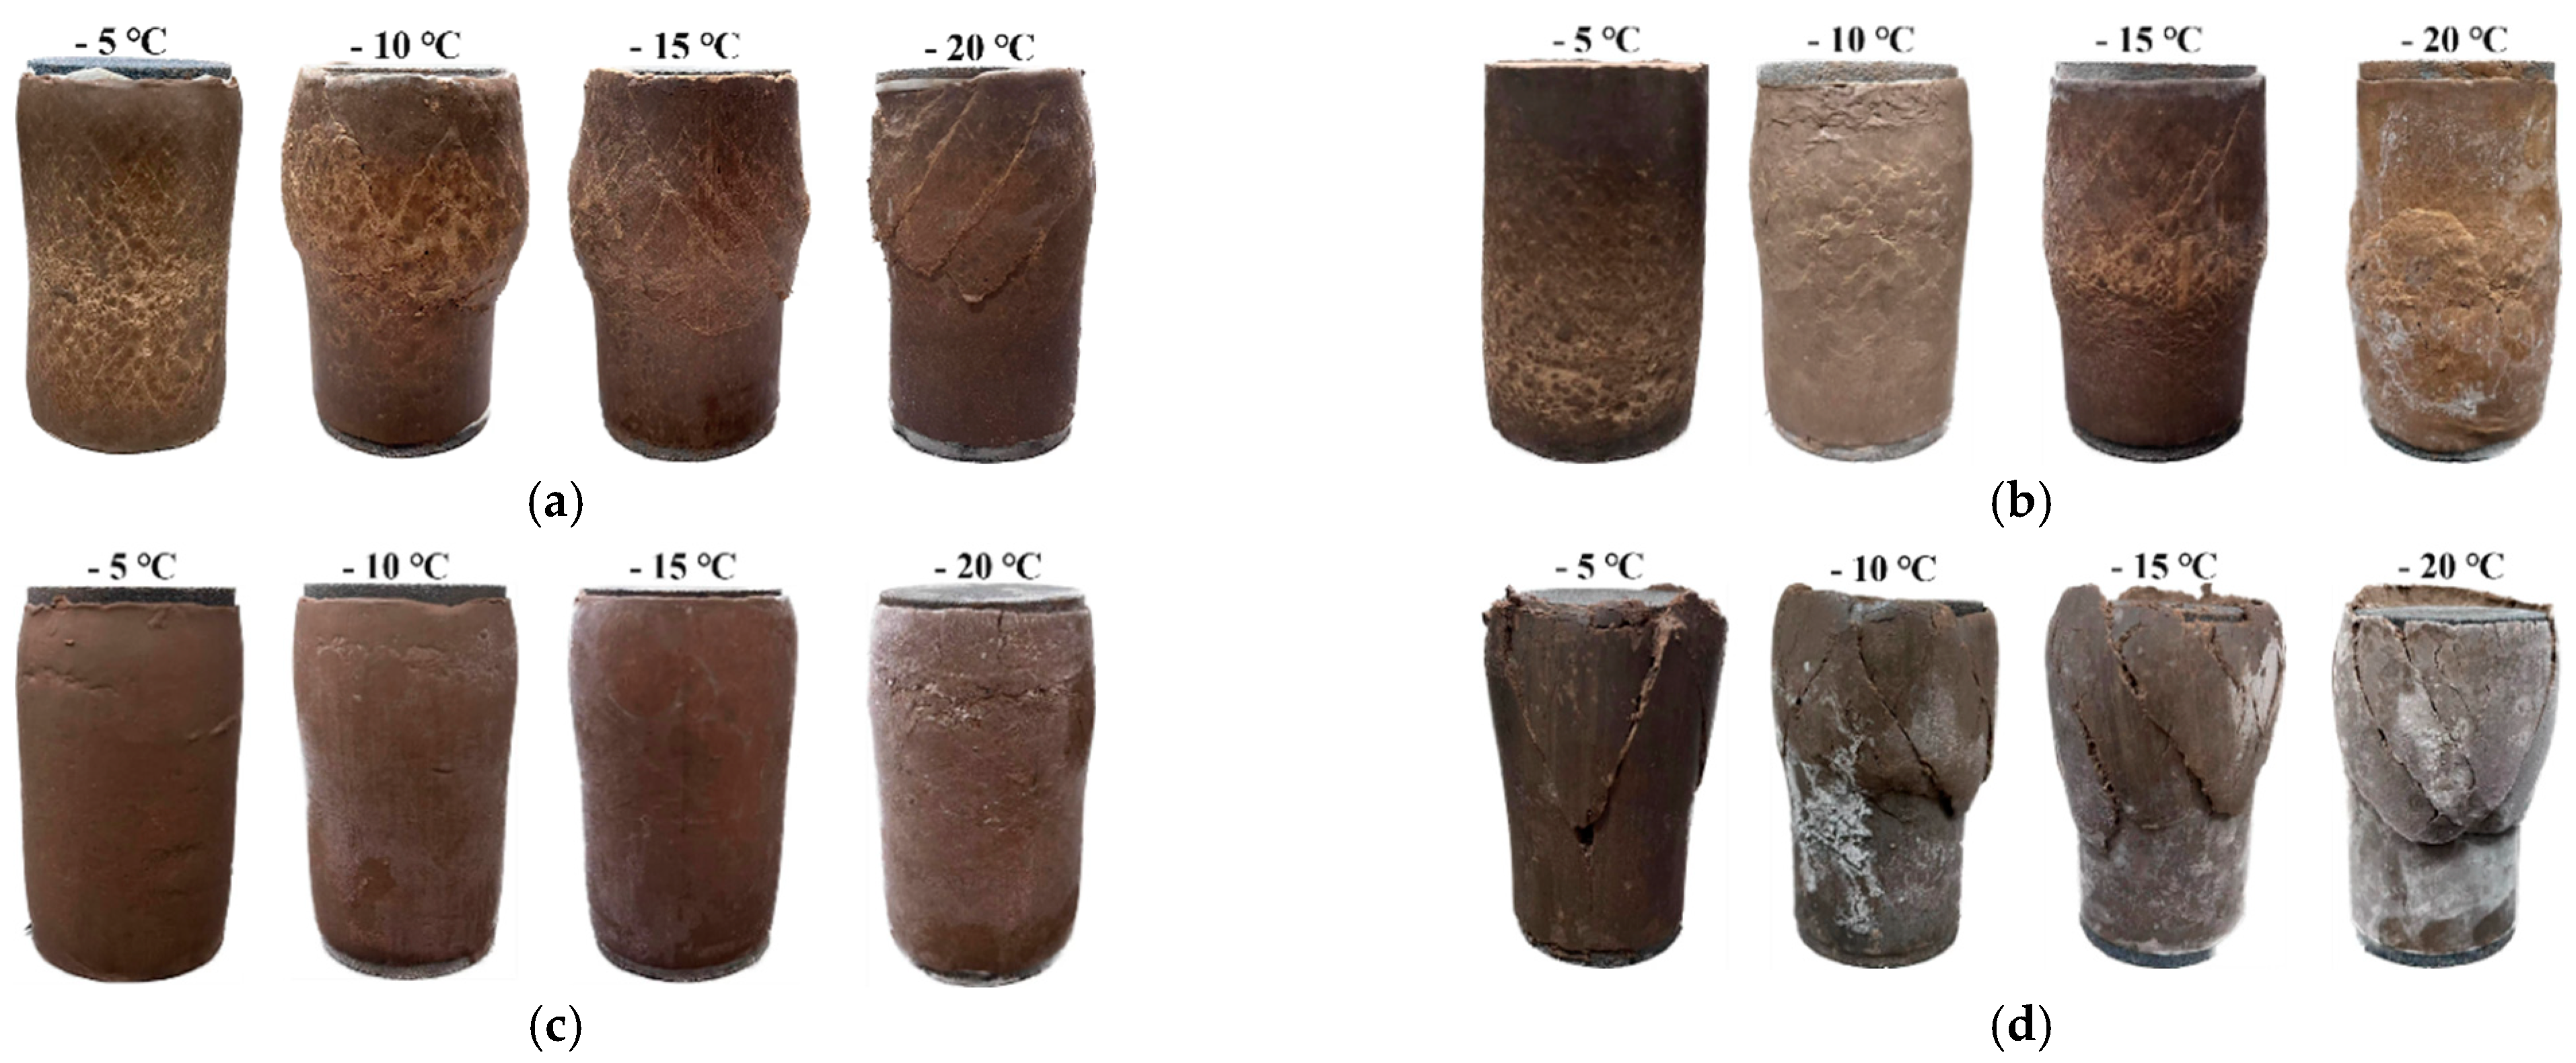
4.1. Failure Mode Analysis

To observe the change of the failure mode of triaxial samples with different water contents under other negative temperature conditions, samples with σ3 = 450 kPa were taken for failure mode analysis, as shown in Figure 11. As can be seen from the figure, the failure mode of frozen saline soil samples presents different forms with the change of water content and temperature. As the temperature of samples with 12.20% water content and 16.20% water content decreases, the surface micro-cracks increase continuously. Many oblique cross-cracks appear, and the angles between cracks and the horizontal plane are mostly between 45 and 60°. The failure mode gradually changed from lateral swelling failure to oblique shear failure. The failure mode of the sample with 20.20% water content was approximately the same under different negative temperature conditions, showing lateral swelling failure, and only a few micro-cracks appeared at −20 °C. The reasons for the above failure modes are as follows: under the negative temperature condition, the water content change affects the ice crystal change. The cementing substances in frozen saline soil samples are ice crystals and salt crystals, and the freezing temperature of frozen saline soil samples decreases under salt. Therefore, when the temperature is −5 °C, the pore water inside the sample is not completely transformed into ice crystals. The samples with three kinds of water content show lateral swelling failure, and the surface micro-cracks of the sample with 12.20% water content are significantly more than that of the sample with 20.20% high water content. However, with a further decrease in temperature, the unfrozen water inside the sample gradually changes into pore ice, and the sample’s integrity is enhanced. Combined with the stress–strain curve in Figure 12, it can be seen that the decrease in temperature will increase the initial elastic modulus of the sample with the same water content, and the soil property changes from elastic–plastic to elastic–brittle. Thus, the failure mode manifests as a change from lateral swelling failure to oblique shear failure.
There is a significant difference in the failure patterns of frozen saline soil samples before and after solidification. Evident oblique cross-shear bands appeared in solidified frozen saline soil samples at −5 °C. With the decrease in temperature, the number of shear bands begins to increase, and the main fracture is one or more oblique cracks that run through the whole sample. This is because there are three kinds of cementing substances in solidified frozen saline soil under negative temperature conditions: cementing substances produced by hydration, ice crystals, and salt crystals. Although there is less ice crystal content in the frozen saline soil sample at −5 °C, the cementing material produced by hydration made the soil properties appear partly elastic–brittle, so the inclined shear fracture surface appeared in the frozen saline soil sample at −5 °C. With a further decrease in temperature, the unfrozen water inside the solidified frozen saline soil sample turned into pore ice, further enhancing the cementation between particles inside the sample. The sample’s distribution of cemented ice and hydrated cemented material was somewhat chaotic. Under deviation stress, the weak surface was damaged by shear, which showed the appearance of multiple micro-cracks and formed multiple oblique prominent cracks through the sample.

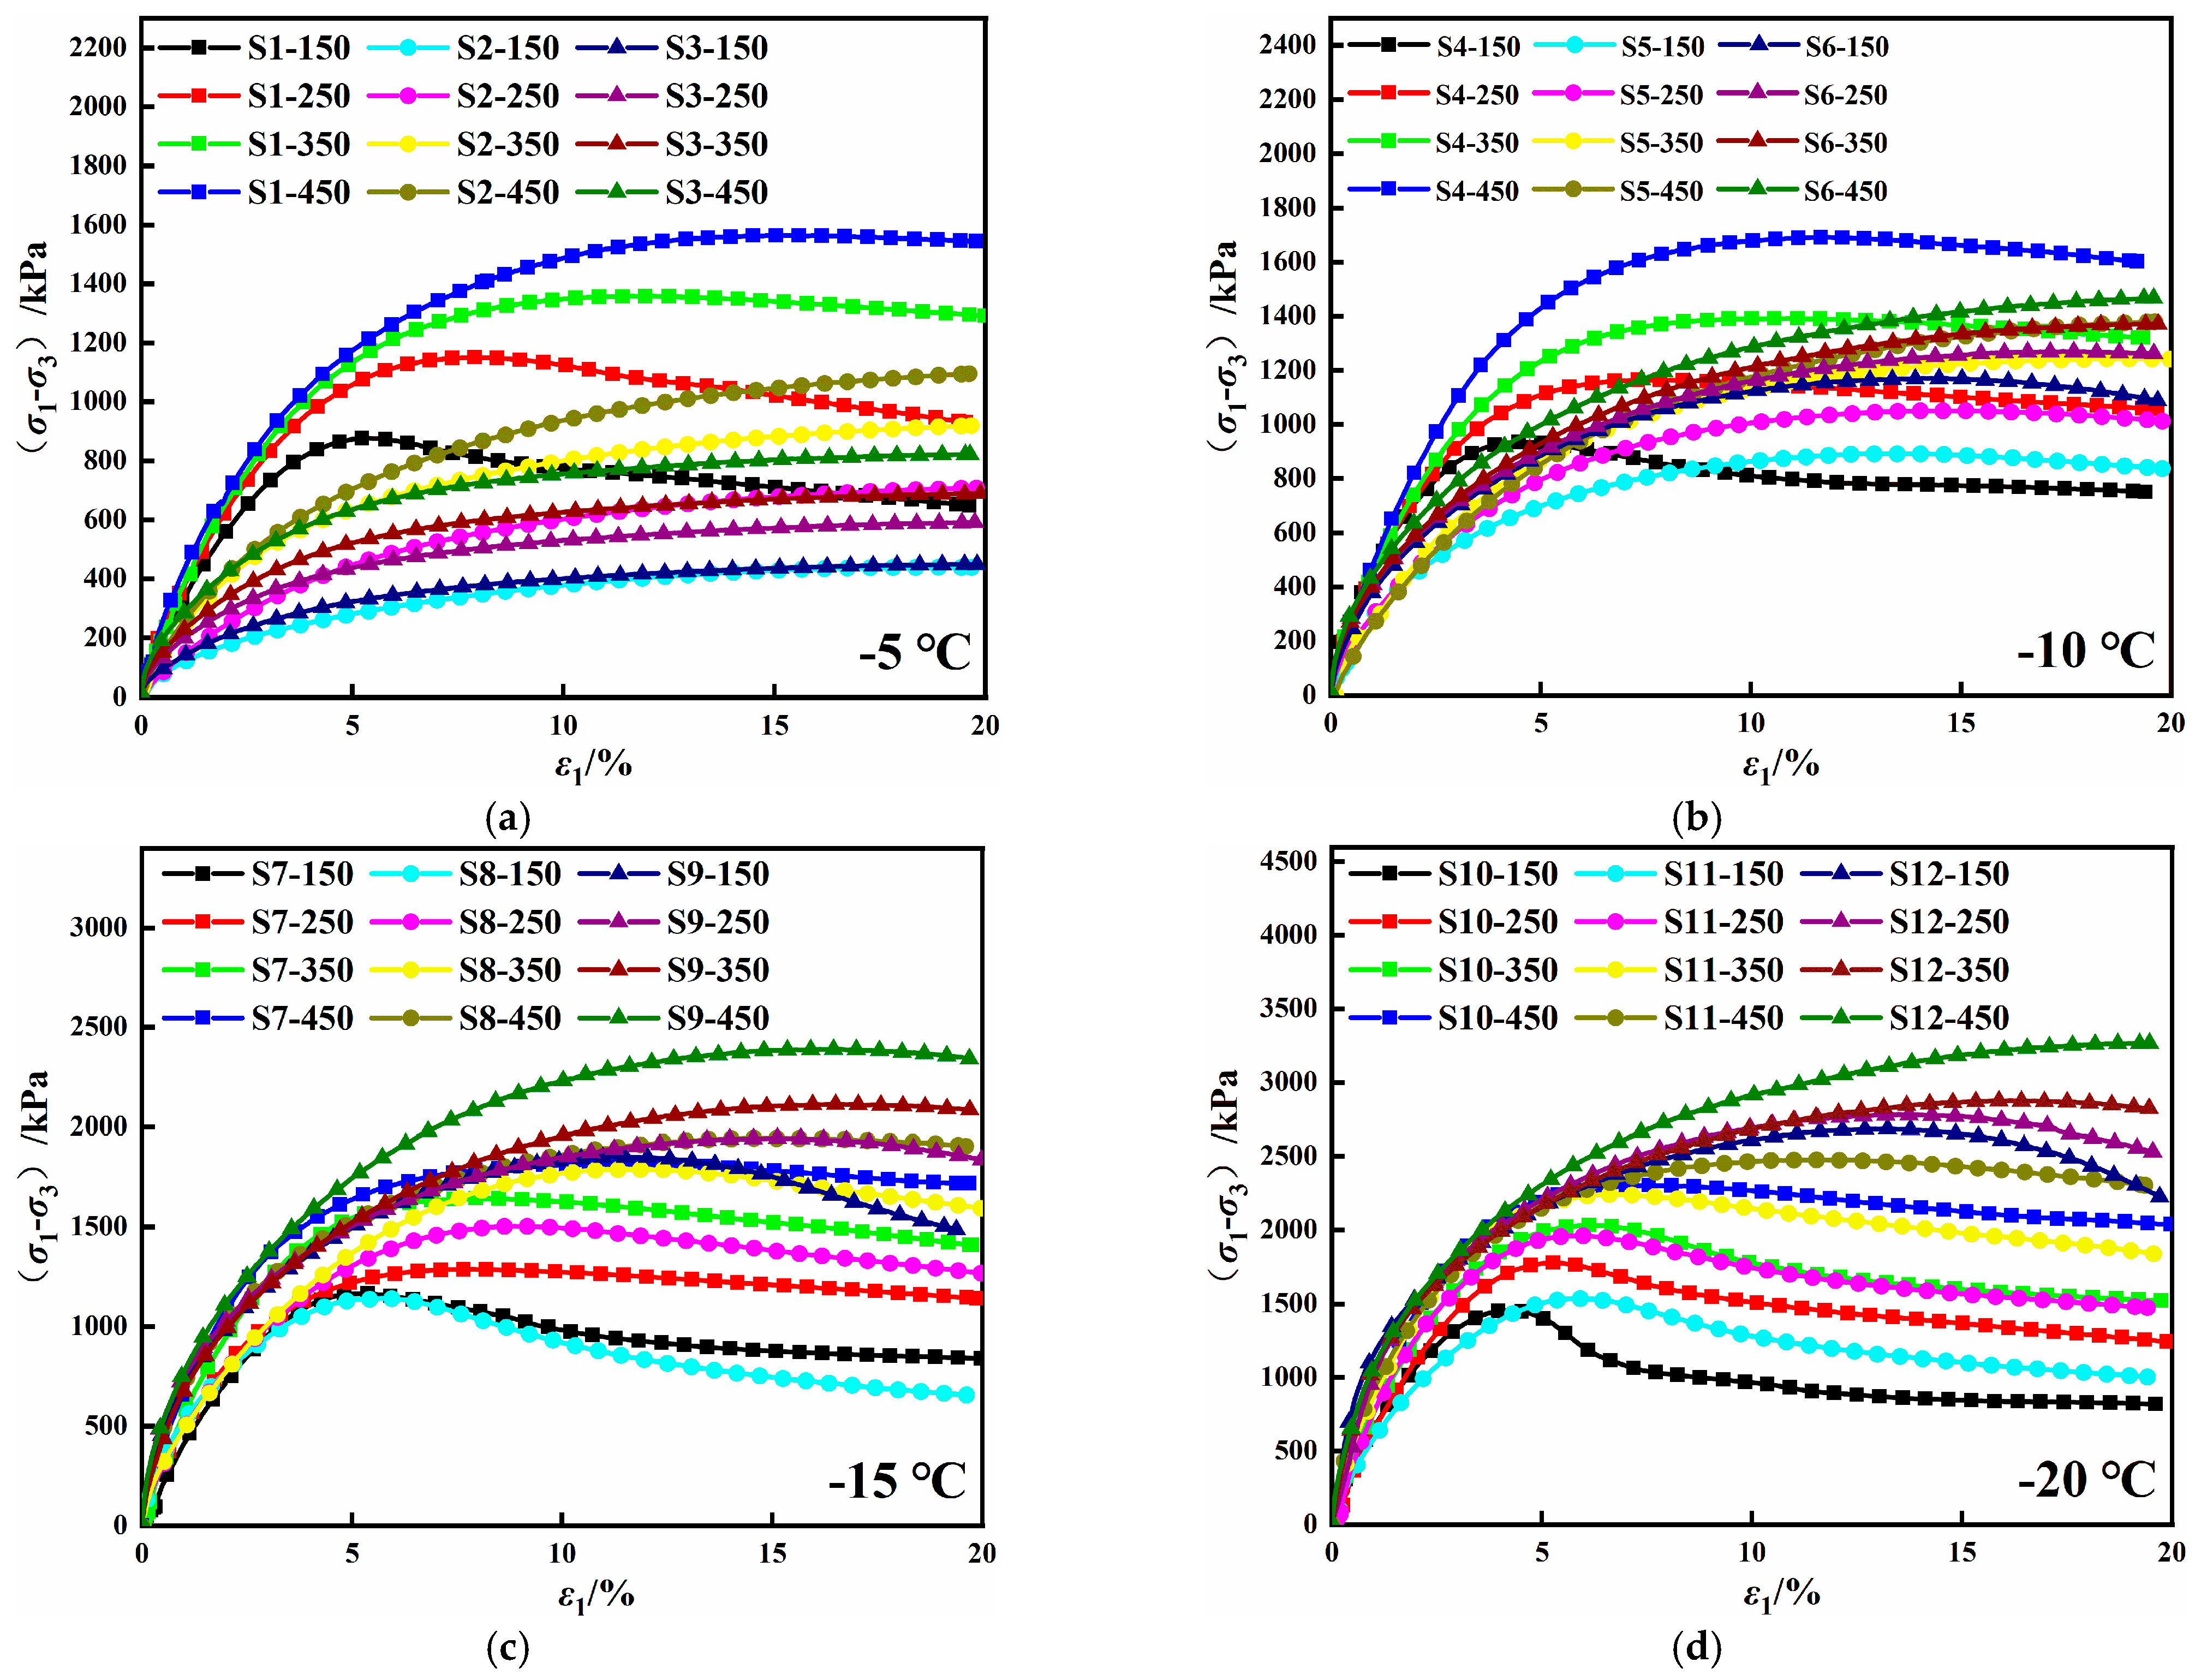
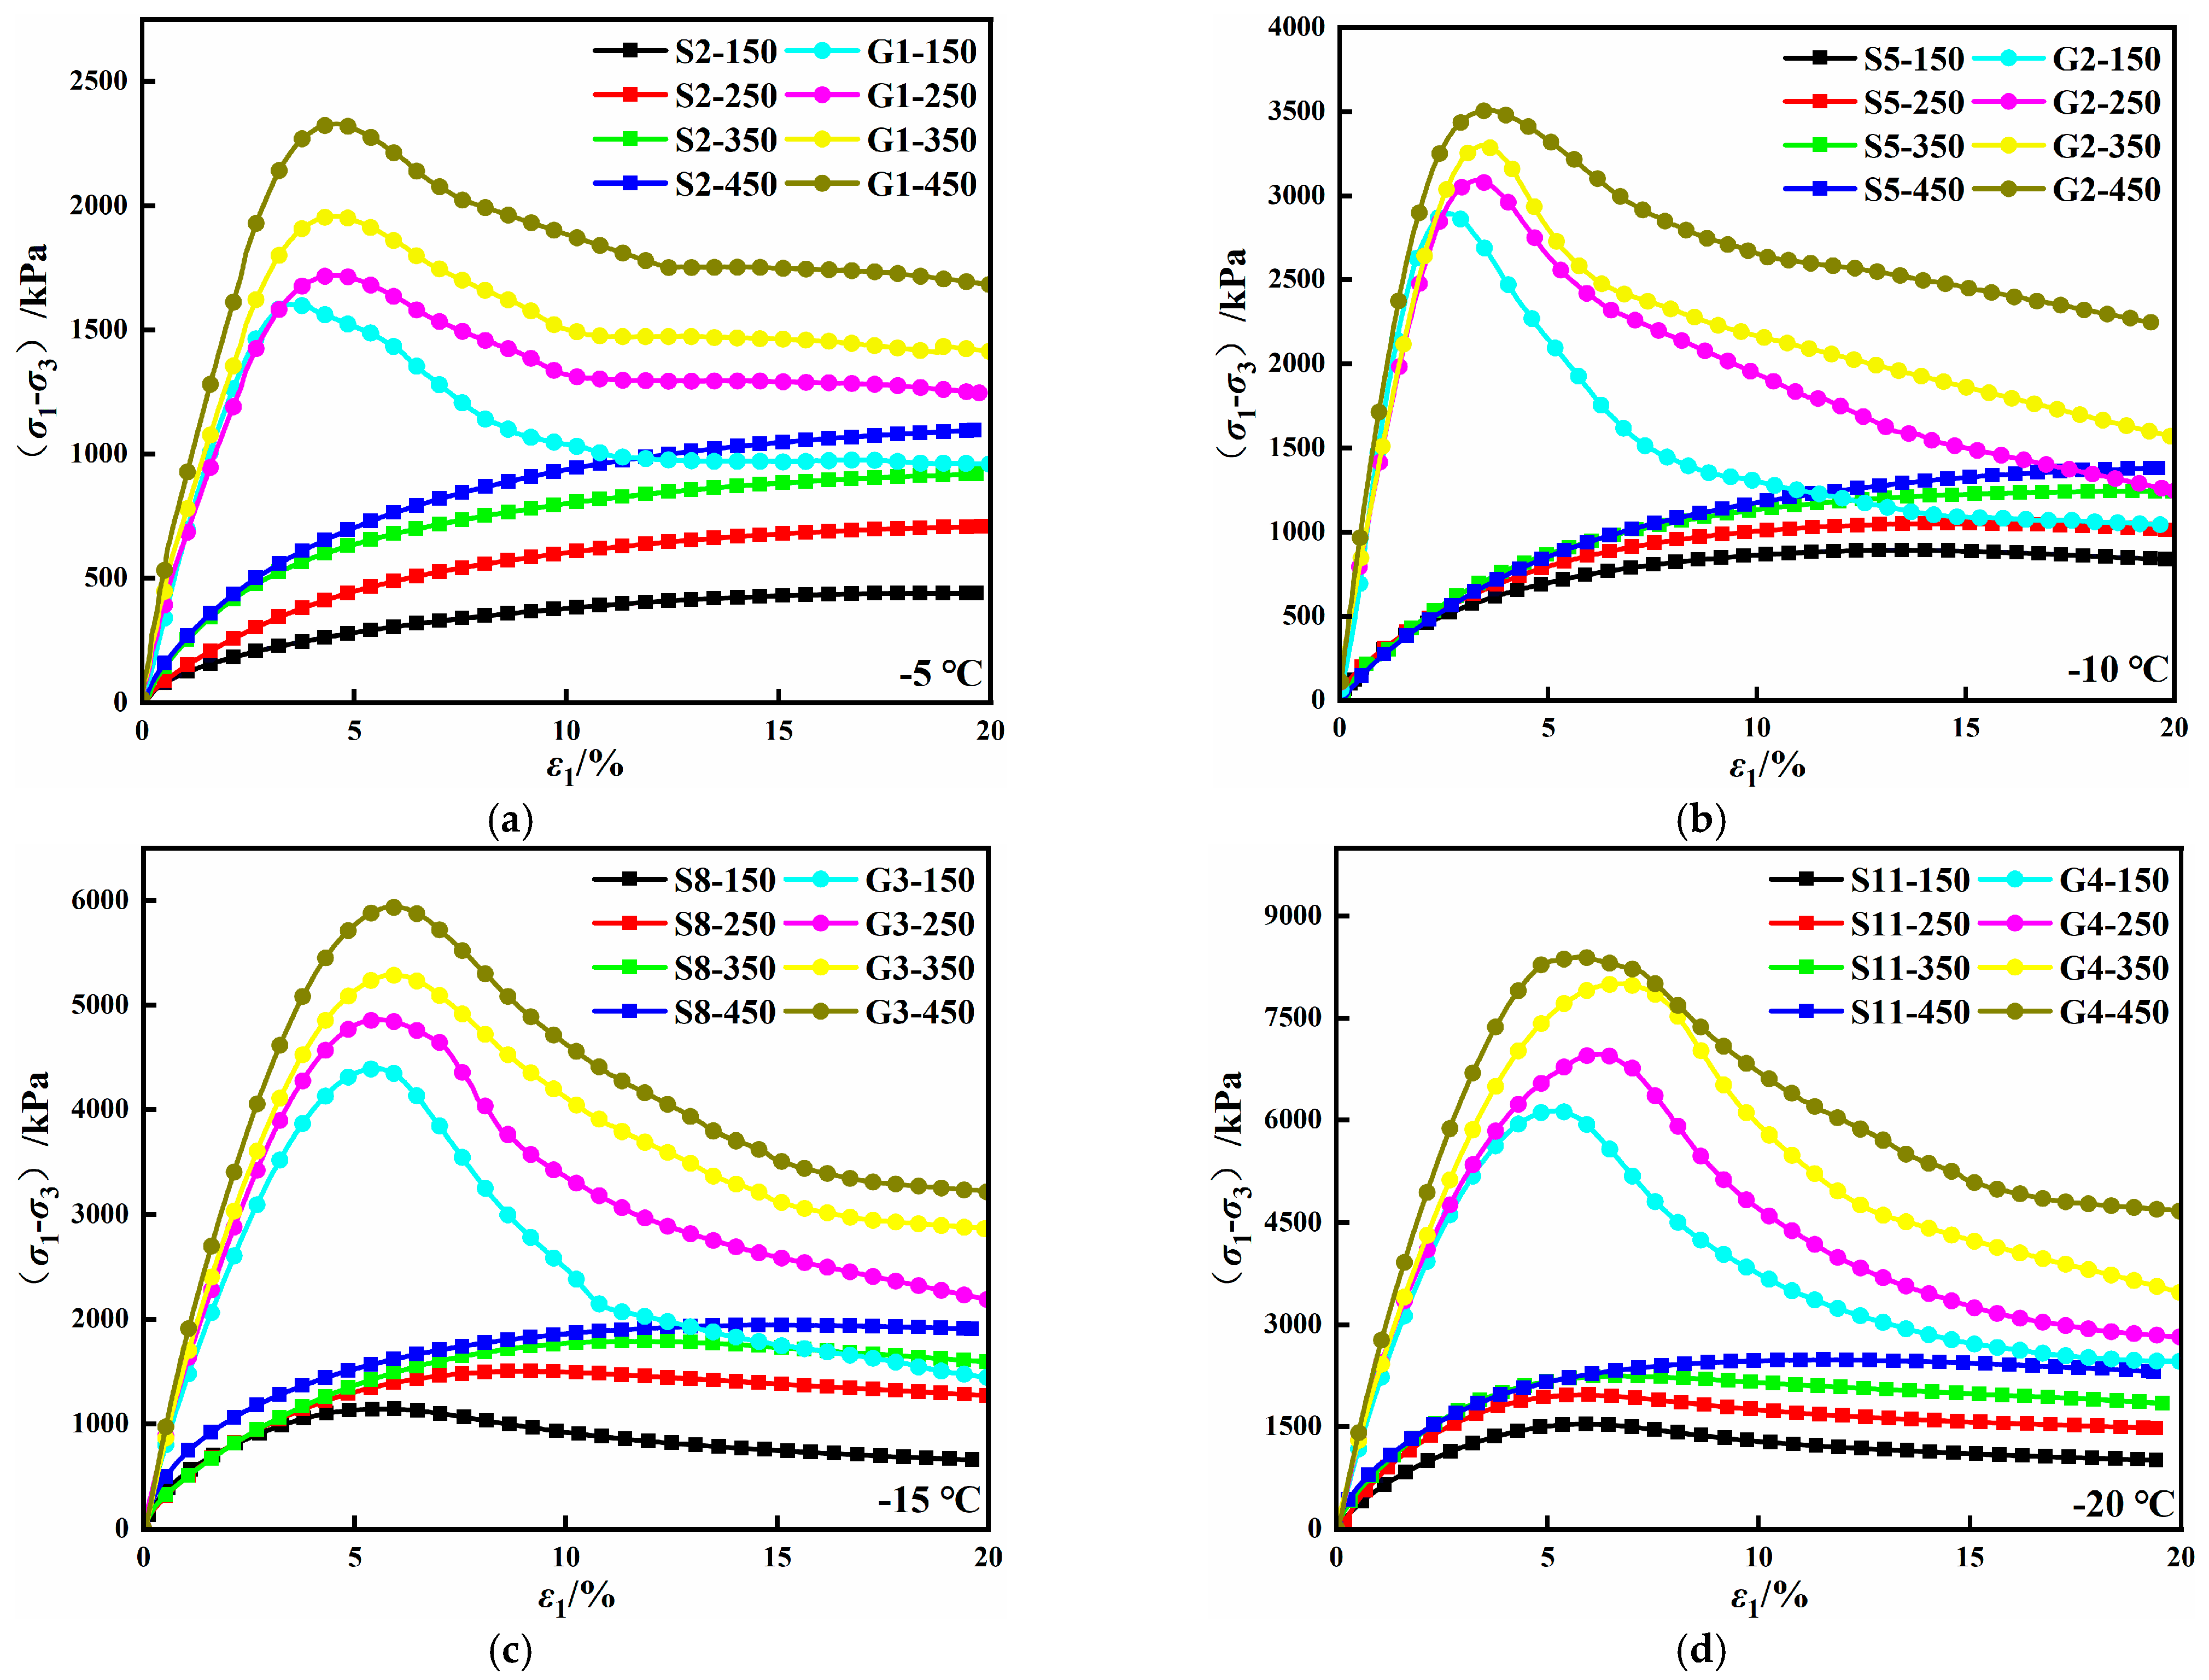
4.2. Stress–Strain Curve Analysis

The stress–strain curves of saline soil at different temperatures are shown in Figure 12. As can be seen from Figure 12, the stress–strain curve of saline soil includes a linear elastic stage, an elastic–plastic stage, and a strain softening (hardening) stage. In the initial linear elastic stage at the initial loading stage, the stress–strain curve is approximately linear, and the initial elastic modulus increases with temperature decrease. The influence of water content on the initial elastic modulus is strongly correlated with the temperature. At −5 °C, the sample with 12.20% water content had the most significant initial elastic modulus. However, as the temperature decreased, the initial elastic modulus of the sample with high water content increased much faster than that of the sample with low water content. When the temperature reaches −20 °C, the sample’s water content is positively correlated with the initial elastic modulus of the sample. The reasons for the above phenomenon are as follows: the axial strain at the peak stress point of the sample with low water content was much smaller than that of the sample with high water content. When the negative temperature is high, the pore water inside the sample does not completely change into pore ice. Ice’s cementation effect is smaller than the friction effect between soil particles inside the sample. Therefore, the initial elastic modulus of the sample with low water content was greater than that of the sample with high water content. When the negative temperature decreased gradually, the ice crystals inside the sample with high water content increased progressively, and the cemented ice was greater than the friction between soil particles inside the sample. Therefore, the initial elastic modulus of the sample with high water content was greater than that of the sample with low water content.
With the increasing shear displacement, the sample entered the elastoplastic stage, the stress growth rate gradually slowed, and plastic deformation appeared. When the shear removal increased further, the stress–strain curve of the saline soil with 12.20% water content showed the strain-softening type, the stress–strain curve of the saline soil with 16.20% water content changed from strain-hardening type to strain-softening type with the decrease in temperature, and the stress–strain curve of the saline soil with 20.20% water content showed the strain-hardening type. The stress–strain curves of the three saline soils with different water contents are consistent with their failure modes.
To explore the solidifying effect of solidified saline soil, the stress–strain curves of solidified saline soil and saline soil at different temperatures are shown in Figure 13, with the optimum water content as the control condition. As shown in Figure 13, the stress–strain curves of solidified saline soil under different negative temperature conditions all showed strain-softening type, and the softening rate will gradually increase with the temperature decrease. The peak stress of solidified saline soil at the same temperature and confining pressure increased by 2.22–3.99 times compared with that of saline soil. The peak stress increases in the solidified saline soil at −5 °C, −10 °C, −15 °C, and −20 °C were 2.22–3.73 times, 2.64–3.24 times, 2.95–3.84 times, and 3.47–3.99 times, respectively, compared with the saline soil under the same confining pressure. The main cause of the differences in the range of peak stress increase under various temperatures is that the optimal water content of saline soil is less than that of solidified saline soil. Under negative temperature conditions, a greater amount of unfrozen water within the solidified saline soil transitions into ice crystals, thereby providing stronger cementation strength.
The stress–strain curves of solidified saline soil under different negative temperature conditions show strain-softening type, and the softening rate increases gradually with the decrease in temperature. Still, the shear strength increases obviously under other confining pressures. In addition to the cementing material produced by hydration, the cementing effect of ice in solidified saline soil is also very significant.

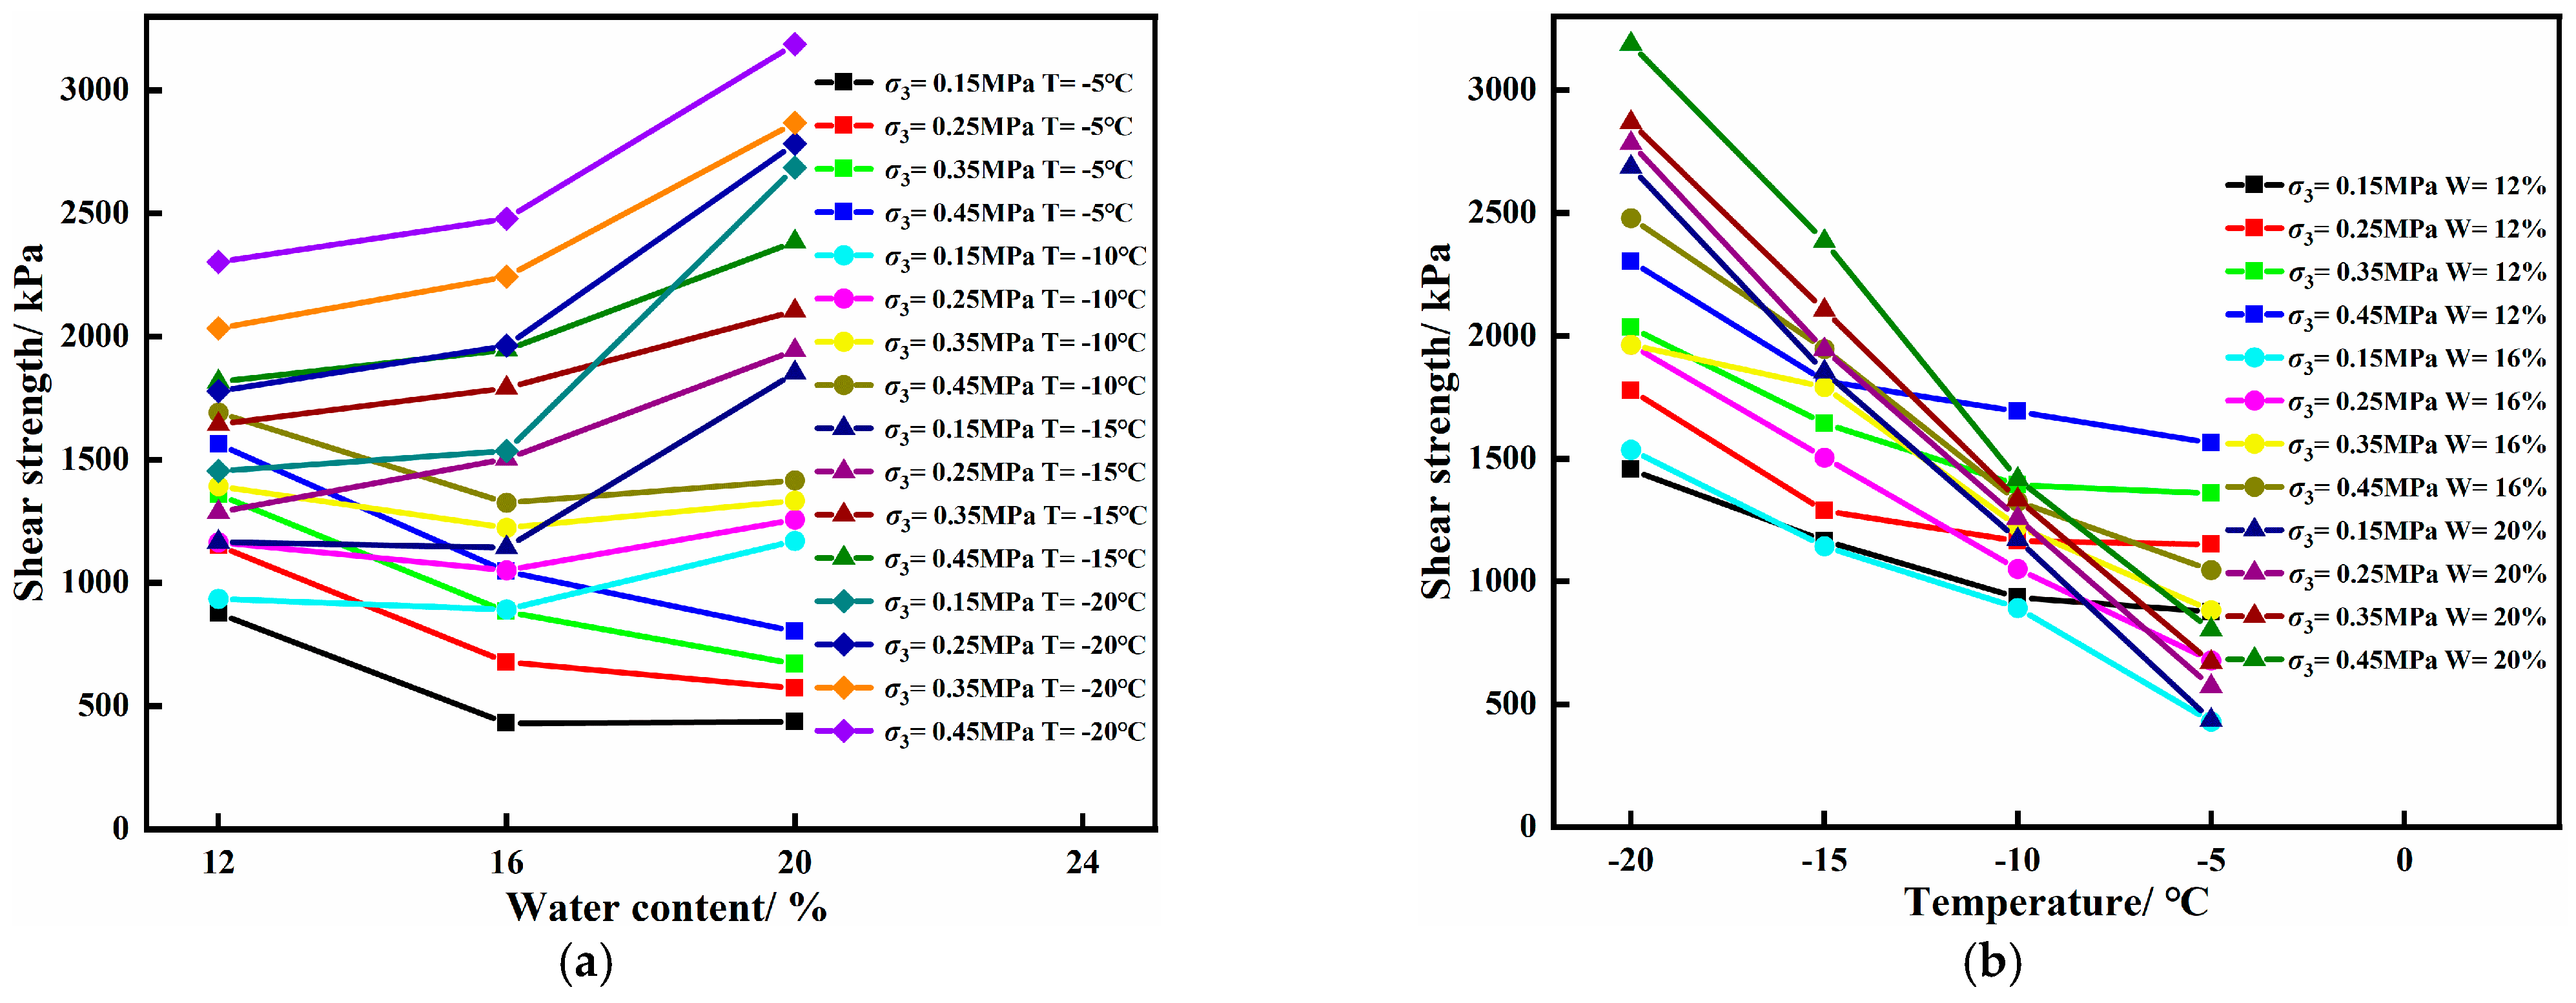
4.3. Shear Strength Index

The shear strength index of the sample is shown in Table 7. By comparing the shear strength indexes of the saline soil and the solidified saline soil under the optimal water content, it can be found that the cohesion of the solidified saline soil is greatly improved compared to that of the saline soil. At the same time, the angle friction only increases significantly under the lower negative temperature condition. Under the same temperature condition, the cohesion increase can reach 11.37 times, and the increase in the internal angle friction can reach 1.43 times. It can be seen that the solidifying effect of solidified saline soil is mainly reflected in increasing the cohesion of the sample, while the influence of the internal angle friction is far less than that of the cohesion. This is because the gelling of the hydration products formed by the hydration of the solidifying agent causes the soil particles to bond and condense, forming a honeycomb structure, enhancing the integrity of the sample itself, and showing a substantial increase in cohesion.
The relationship among temperature, water content, and shear strength in saline soil is shown in Figure 14. As can be seen from Figure 14, when the negative temperature is high, the shear strength of saline soil shows a downward trend with the increase in water content; however, when the negative temperature continues to decrease below −10 °C, the shear strength of saline soil also shows an upward trend with the increase in water content. Therefore, there is a temperature inflection point, so the shear strength of saline soil under the negative temperature condition will show an opposite trend with the water content change. Using the shift in strength with water content as the index, the temperature inflection points under confining pressures of 150, 250, 350 kPa, and 450 kPa can be obtained by the linear interpolation method as −8.26 °C, −9.31 °C, −10.99 °C, and −10.73 °C, respectively, and the average temperature inflection point can be obtained as −9.82 °C. Causes of temperature inflection points: The strength difference of saline soil with the same water content under different temperature conditions is mainly due to the effect of cementing ice. When the negative temperature is high, the pore water inside the soil does not completely change into ice crystals, and the unfrozen water encapsulates the saline soil particles to form a water film, which plays a specific lubricating role and reduces the friction force between soil particles. Thus, the shear strength tends to decrease with increased water content. With the decrease in negative temperature, unfrozen water content gradually decreases, and the formed ice crystals cement the soil particles and soil particles inside the soil. When the cement effect of ice crystals is greater than the lubrication effect of unfrozen water, the saline soil shows a trend of increasing shear strength with the increase in water content, and the negative temperature when the dynamic equilibrium is reached is the temperature inflection point of saline soil.
The shear strength of the three kinds of saline soil with water content increases with the decrease in temperature, but the water content significantly affects the change rate of the shear strength with temperature. The change rate of the shear strength of the saline soil with 20.20% water content is significantly higher than that of the saline soil with 12.20% water content, and the change rate of the shear strength presents a positive correlation trend. The water content directly influences the quantity of cementation ice within saline soil. In saline soil samples with higher water content, a greater amount of unfrozen water undergoes phase transformation to form cementation ice, thereby providing a source of shear strength for the frozen saline soil samples. Consequently, the water content significantly affects the rate of change in shear strength with temperature.

5. Pore Structure Analysis of Solidified Saline Soil

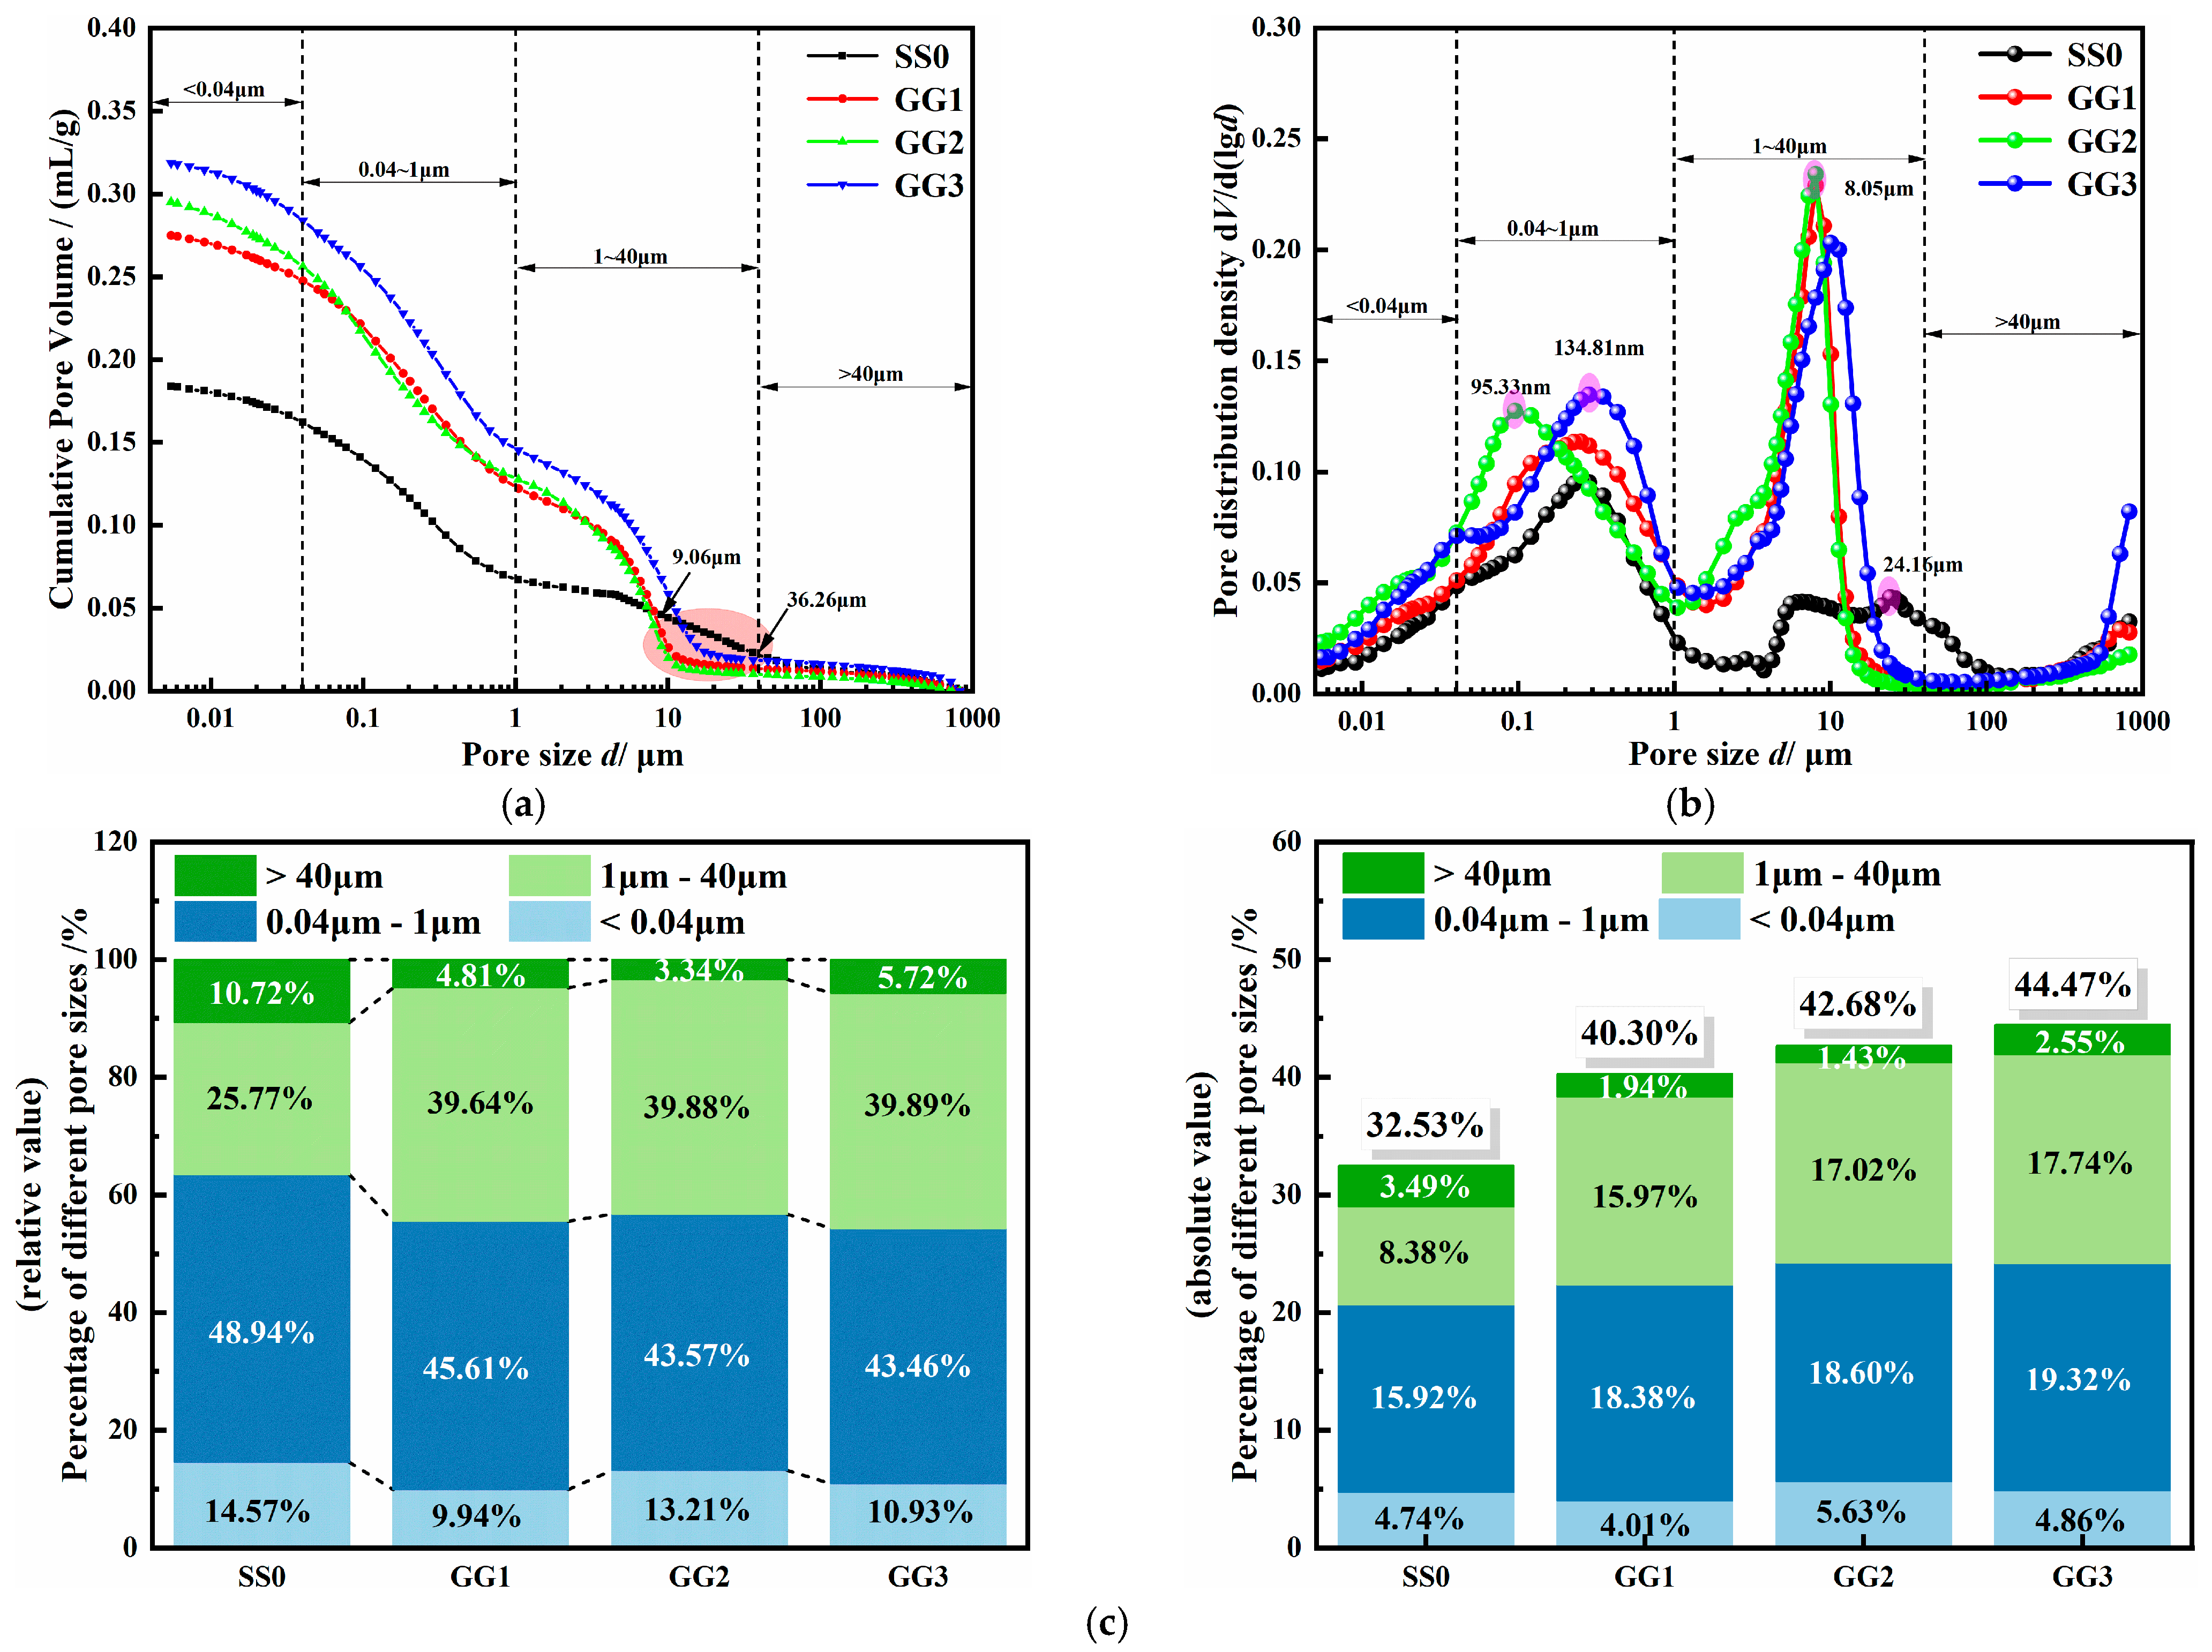
5.1. Distribution of Pore Structure

To investigate the strength enhancement mechanism of solidified saline soil, the MIP test was used to analyze the pore structure of saline soil and solidified saline soil, and the test results are shown in Figure 15. Referring to Shear’s classification method of internal pores in soil mass [49], the regional pores were divided into tiny pores (<0.04 μm), medium pores (0.04–1 μm), large pores (1–40 μm), and super-large pores (>40 μm) according to the cumulative mercury intrusion curve and pore distribution curve. As shown in Figure 15a, the variation law of the pore accumulation curve of the saline soil and the solidified saline soil is similar. It presents multi-stage characteristics, indicating that the pore distribution of the soil is relatively complex and that the pore size is highly uneven. In the pore size range of 9.06–36.26 μm, the cumulative mercury intrusion volume in saline soil exceeds that in solidified saline soil. However, when the pore size exceeds 36.26 μm, the cumulative mercury intrusion volume in saline soil becomes less than that in solidified saline soil. Due to the sequential filling of pores in mercury intrusion testing, larger pores are filled first, followed by smaller ones. Consequently, the addition of the solidifying agent can induce a transformation within the saline soil, causing larger pores to convert into relatively smaller ones. As evident from Figure 15b,c, the porosity of solidified saline soil is observed to be greater than that of saline soil. This is attributed to the fact that both the solidified saline soil and saline soil were compacted under the same control conditions, utilizing the maximum dry density and identical compaction factors. Additionally, the maximum dry density of the three types of solidified saline soil is lower than that of saline soil. Thus, without considering any alteration in soil density induced by the solidifying agent, the porosity of solidified saline soil is inevitably greater than that of saline soil. The pore size distributions of saline soil and solidified saline soil are primarily concentrated within the ranges of 0.04–1 μm and 1–40 μm. In the case of the three types of solidified saline soil samples, the percentage of pores within the 1–40 μm range increased by approximately 53.82% to 54.79% compared to that of the saline soil samples. Conversely, the percentage of pores in the remaining pore size ranges decreased or exhibited insignificant changes. This observation suggests that the hydration products in solidified saline soil facilitate the interlocking of saline soil particles and salt crystals, resulting in the formation of numerous new pores. The newly created pores primarily fall within the size range of 1 μm to 40 μm, while within other pore size ranges, the hydration products and partially unhydrated solidifying agent particles mainly serve as fillers.

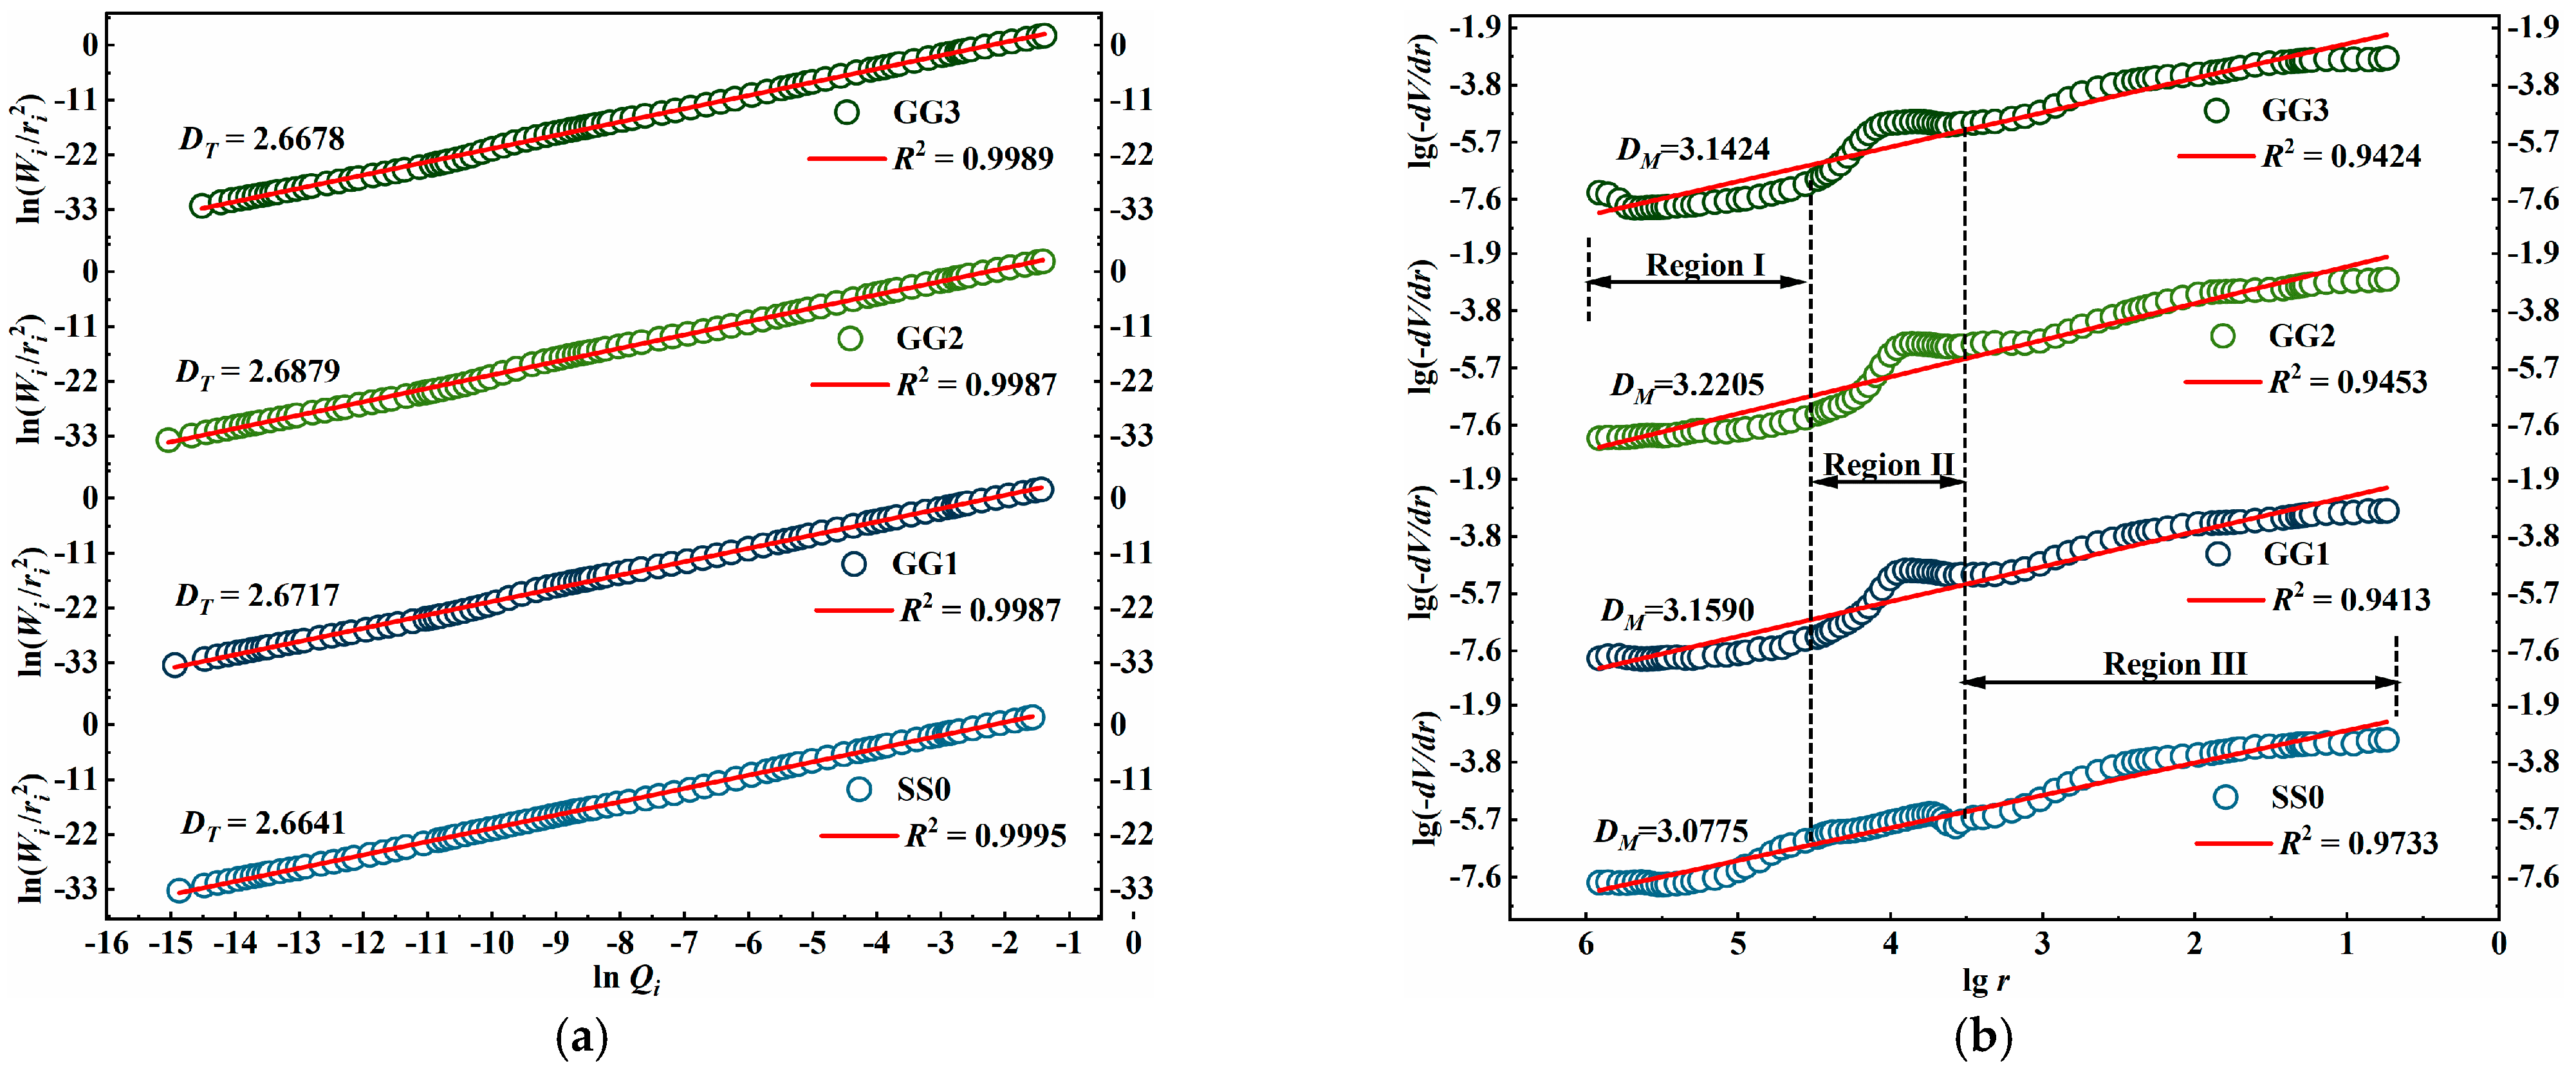
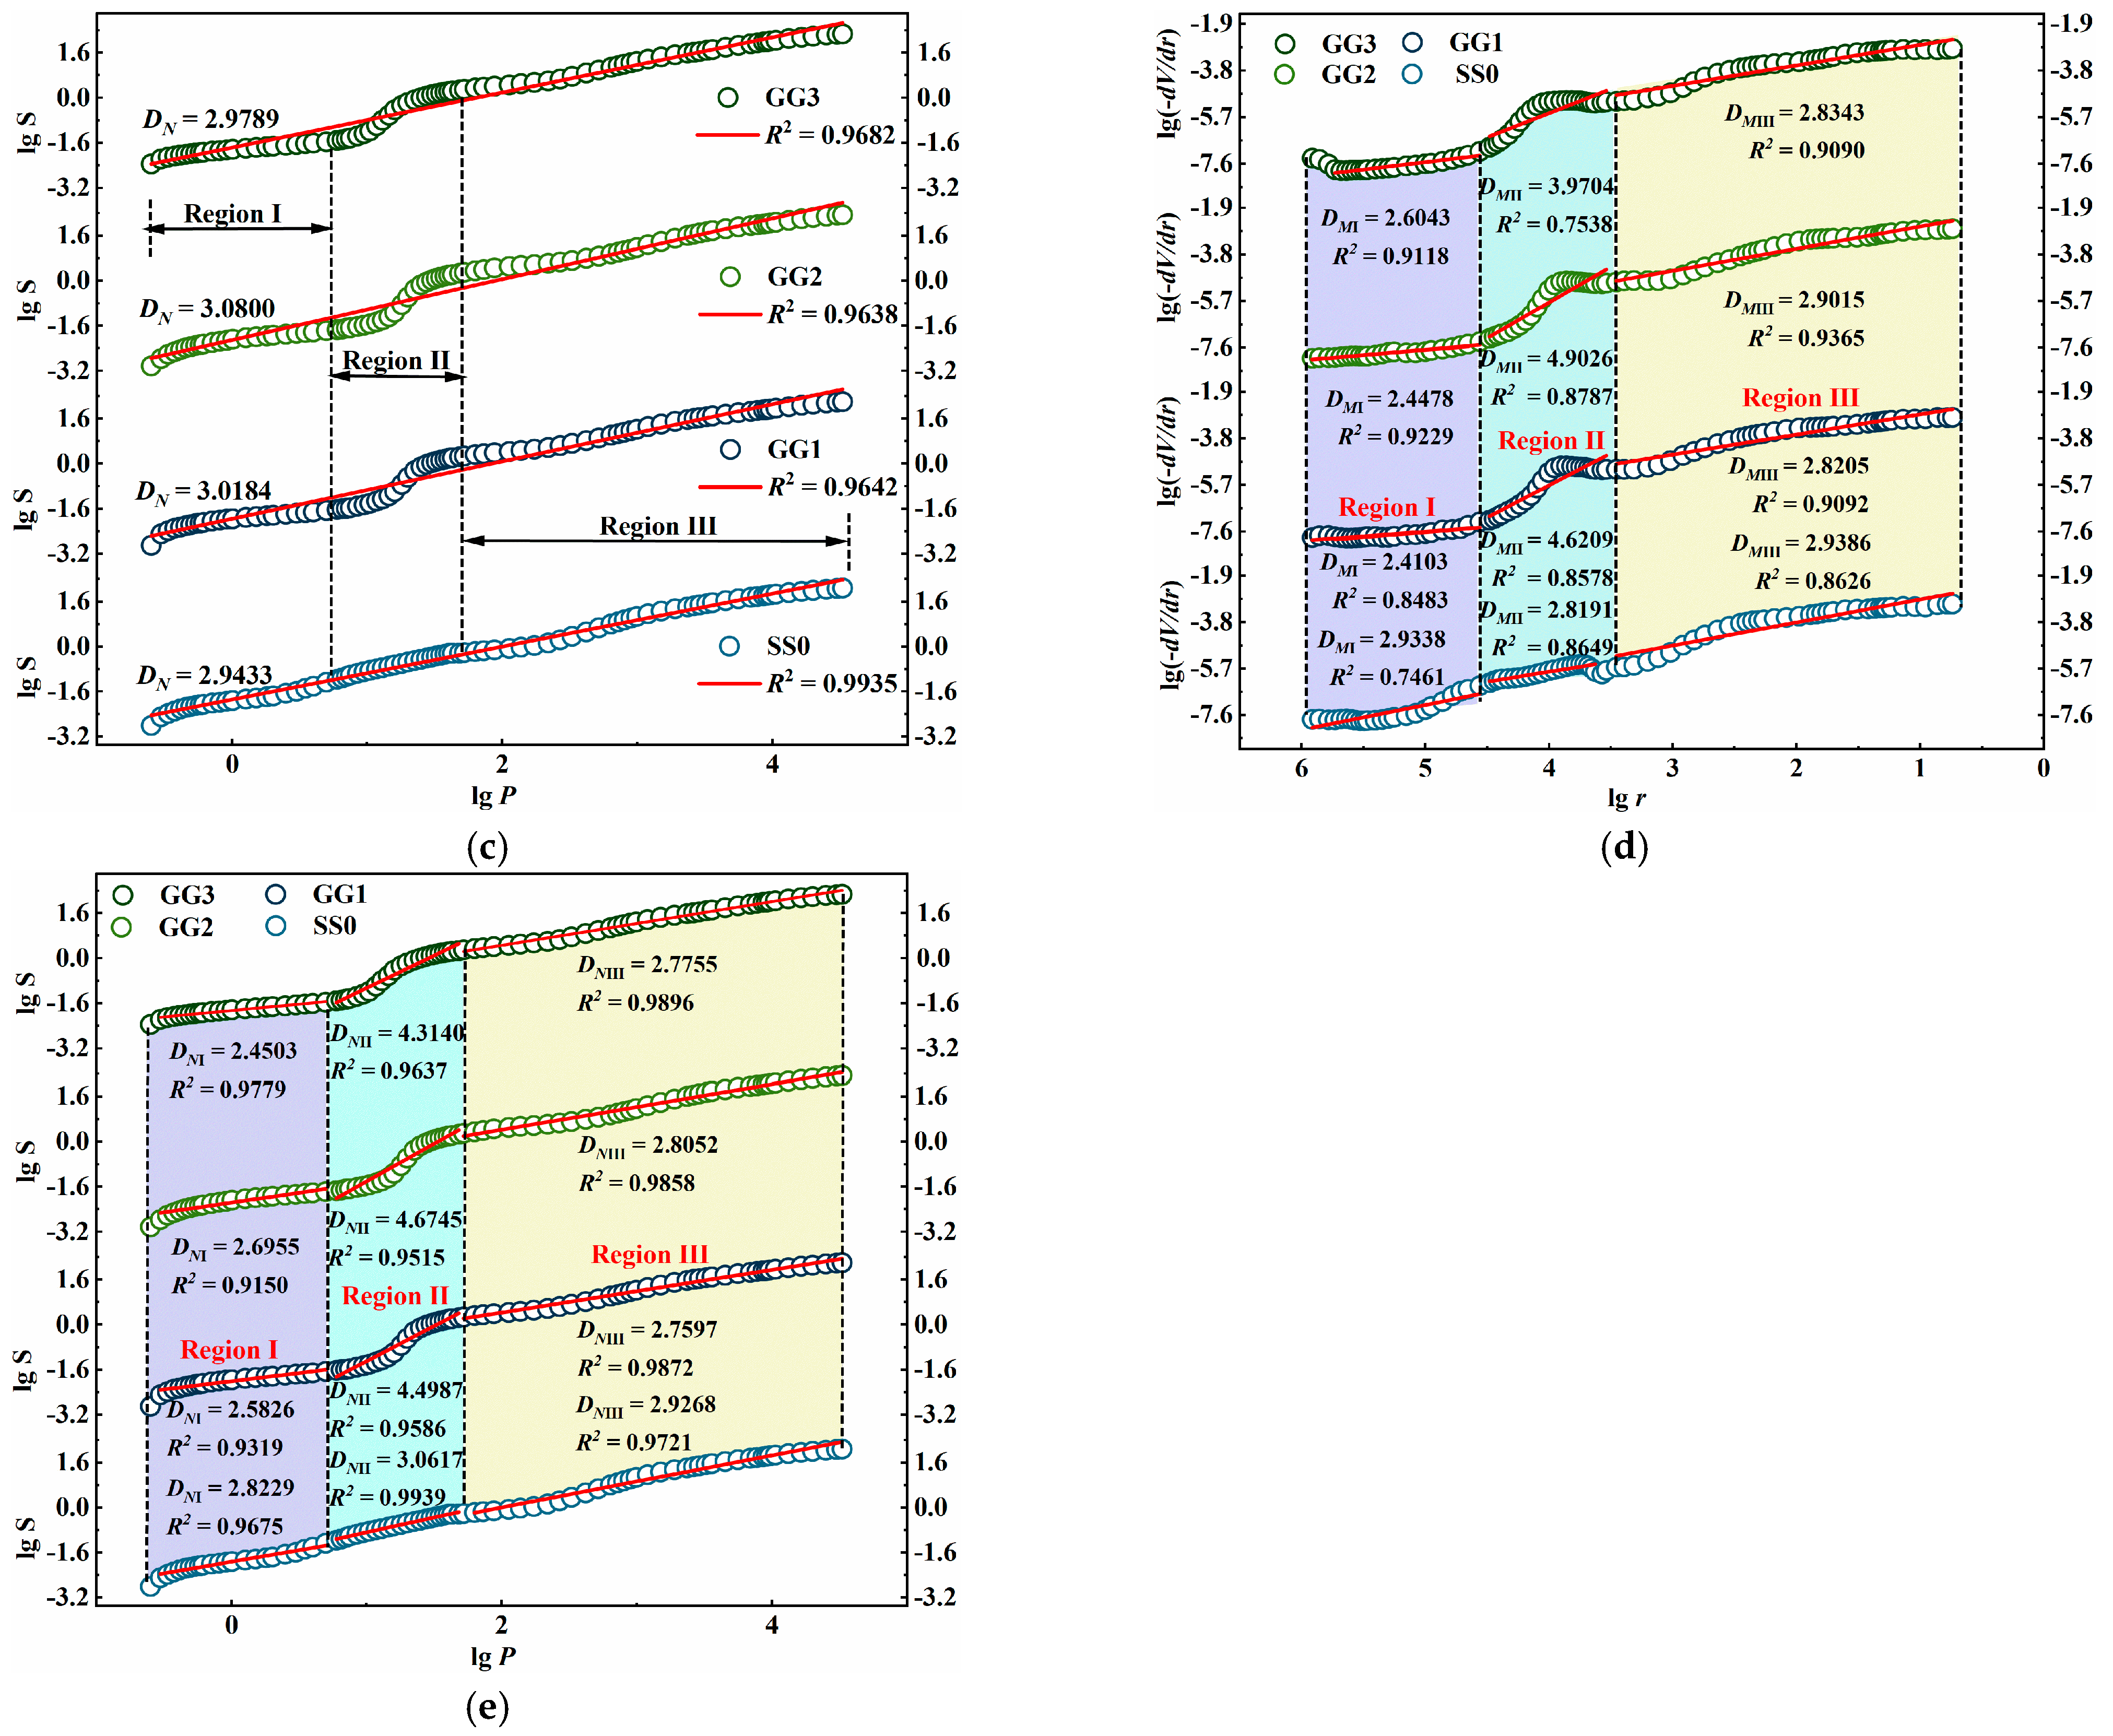
5.2. Analysis of Pore Fractal Characteristics

The fractal dimension D can characterize the complexity of the material’s internal pores, including the pore volume’s irregularity and the pore surface’s roughness. Mature fractal dimension models include the thermodynamic model, Menger sponge model, Neimark model [50], etc. To explore the applicability of the three fractal dimension models of solidified saline soil, the fractal characteristics of saline soil and solidified saline soil were analyzed based on the MIP test.
The thermodynamic model assumes that the work done by the external environment on the mercury is equal to the increase in surface energy of the amount of mercury liquid entering the soil interior. The relationship between pressure P and mercury intrusion V is shown in Equation (17).
0 V P d V = 0 S σ cos θ d S
The internal pore surface area S of the saline soil is associated with the pore size d and the amount of mercury intrusion V, and the fractal dimension DT can be obtained. In the process of mercury intrusion, Equation (17) can be discretized to Equation (18).
i = 1 n P ¯ i Δ V i = k r i 2 ( V i 1 3 / r i ) D T
where Pi is the ith mercury intrusion pressure, ΔVi is the amount of ith mercury intrusion, k is the material parameter, ri is the pore radius corresponding to the ith mercury intrusion pressure, and Vi is the amount of accumulated mercury intrusion at the ith mercury intrusion.
Take the logarithm of Equation (18) to Equation (19).
ln ( W i r i 2 ) = D T ln Q i + C
where Wi = i = 1 n P ¯ i Δ V i , Qi = V i 1 3 / r i .
The Menger sponge model can simulate the pore size of soil particles at all levels, and the whole soil space can be characterized entirely and continuously. Divide the initial element 27 equal to one side of length L, remove the 7 cubes in the middle, and the remaining 20 cubes are used as secondary generating elements to repeat the above operation. After infinite iterations, the Menger sponge model is obtained, and the fractal dimension DM can be expressed as Equation (20).
lg ( d V d r ) ( 2 D M ) lg r
where V is the amount of mercury intrusion, r is the pore diameter, and k is the scale factor.
According to the Neimark model, energy conservation is maintained between the energy required for mercury extension along the wet inner surface and the external work required for mercury intrusion, as shown in Equation (21).
S = 1 γ cos θ 0 V P P d V
where γ is the surface tension of mercury (0.458 N/m), θ is the contact angle between mercury and the pore surface (130°), S is the pore surface area, and V is the amount of mercury intrusion.
The results show that the necessary and sufficient conditions for the fractal properties of the pore’s internal surface are as shown in Equation (22).
d V d r r 2 D N
where r is the pore radius.
The relationship between mercury intrusion pressure P and the minimum pore size that mercury can enter can be established by the Laplace equation. The expression is shown in Equation (23).
P = 2 γ cos θ r
Logarithmic Equations (22) and (23) can establish the relationship between the surface area S of the pores in the soil and the mercury intrusion pressure. The expression is shown in Equation (24).
lg S ( D N 2 ) lg P
Three fractal dimension models of saline soil and solidified saline soil were established, respectively, as shown in Figure 16a–c. As can be seen from the figure, the three models have a strong correlation in the entire aperture range, and R2 is greater than 0.9, indicating that the pore structures of saline soil and solidified saline soil have prominent fractal characteristics. The fractal dimension DT of the thermodynamic model is within a reasonable range of 2–3. The fractal dimensions DM and DN of the Menger sponge model and Neimark model range from 2.94 to 3.23. The fractal dimension D of SS0 of the three models is smaller than the fractal dimension D of GG. Based on the fractal theory, the fractal dimension D > 2 of the element indicates the irregular distribution of the pore surface, which is beyond the scope of Euclidean geometric analysis. As the fractal dimension D increases, the complexity of the pore surface distribution increases. When the fractal dimension D > 3, the pore structure distribution exceeds the scope of Euclidean three-dimensional space, and the shape is complex and disordered, which can only be explained by the fractal dimension. The fractal dimension D strongly correlates with the amount of hydration products in the solidified saline soil. The increase in hydration products and the intensification of hydration will directly affect the distribution of pores among the particles in the soil. The fractal dimension D of GG2 in the three fractal dimension models is the maximum value, indicating that the solidified soil with this ratio has complex pore distribution, better hydration product development, and the most significant solidifying effect. Therefore, GG2 is the optimal solidifying combination among the three optimal ratios. The fractal feature of the thermodynamic fractal model is obvious in the whole domain. The Menger sponge and Neimark models’ fractal features are evident in Regions I and III but not in the transition Region II.
In order to further clarify the multifractal characteristics of the pore structures of saline soil and solidified saline soil based on the Menger sponge model and the Neimark model, the fractal dimensions in different pore size ranges under the two models were calculated, respectively, as shown in Figure 16d,e. In order to explore the fractal characteristics of different proportions of solidified saline soil and saline soil in the same region, the full range of pore size was divided into three regions. The corresponding pore sizes of Region I, Region II, and Region III are 36.26–822.67 μm, 3.44–30.23 μm, and 5.48 nm–2.86 μm, respectively. The fractal dimensions of saline soil and solidified saline soil in different regions based on the Menger sponge model and Neimark model are summarized in Table 8. Combining Figure 15 and Table 8, it can be seen that SS0, GG1, GG2, and GG3 have obvious multifractal characteristics in the entire pore range. Due to the heterogeneity of the pore distribution and the complexity of the pore structure, the size-dependent property of pore fractal characteristics is relatively common [51]. According to the fractal theory, the value of fractal dimension D of the pore surface ranges from 2 to 3. When the fractal dimension D of a certain aperture region is greater than three or less than two, it is considered that the region does not have fractal characteristics, and the value of fractal dimension D is invalid. When the fractal dimension D = 2, the pore surface is completely smooth, and as the fractal dimension D approaches three, the pore surface becomes more and more rough. In the two models, the fractal dimension D of Region I and Region III is between 2 and 3, indicating that the fractal characteristics of pores in Region I and Region III are obvious.
In Regions I and III, the values of DMI, DMIII, DNI, and DNIII for solidified saline soil are all smaller than those for saline soil. The reason behind this phenomenon is as follows: In Region I, the smallest pore diameter is 36.26 μm, and hydration products continuously develop along the walls of the larger pores, leading to interlocking between soil particles and salt crystals. This causes a transformation of some larger pores into relatively smaller ones. Moreover, hydration products exhibit a certain filling effect. As a result, a decrease in the DMI and DNI values in Region I for solidified saline soil is observed. In Region III, the pore sizes are smaller, and hydration products from the solidifying agent fill the pores, reducing their connectivity [52,53]. Additionally, some unhydrated solidifying agent particles also contribute to a certain degree of pore filling. Consequently, a decrease in the DMIII and DNIII values in the small pore size range of Region III for solidified saline soil is observed.
In Region II, the fractal dimension D > 3 indicates that the pore changes in this region are “non-physical” [54]. The primary reason for this phenomenon is the idealized assumption made in the MIP test. The MIP test assumes that all pores in the sample are in an open state. However, in reality, semi-open and closed pores in saline soil and solidified saline soil cannot be detected. Furthermore, the MIP test assumes that all pores have a cylindrical shape, but in reality, the internal pore morphology varies. Among them, the inkpot-type pores are considered the main reason for the non-fractal region. The inkpot-type pores have pore entrances much smaller than their actual inner diameters, causing a lag in mercury intrusion during the MIP process. Consequently, the measured pore sizes are much smaller than the actual pore sizes. The hydration products formed by the solidified saline soil’s hydration process interconnect the soil particles, making it easy to form inkpot-type pores. This results in a significant increase in the DMII and DNII values for solidified saline soil in Region II compared to saline soil’s DMII and DNII values.

6. Conclusions

This paper derived a binary medium constitutive model applicable to frozen saline soil and frozen solidified saline soil. The reliability of the model was validated through triaxial test data, and a brief analysis of the stress–strain curves, failure patterns, and shear strength indicators was conducted. Subsequently, MIP tests were employed to investigate the pore structure characteristics of saline soil and solidified saline soil. Based on thermodynamic models, the Menger sponge model, and the Neimark model, the fractal characteristics of saline soil and solidified saline soil were explored. The main conclusions are as follows.
(1)
The empirical values derived from the binary medium constitutive model align closely with those obtained from triaxial tests under a variety of conditions. This correlation suggests that the model is effective not only in simulating the stress–strain relationship of saline soil under negative temperature conditions but is also capable of modeling the behavior of solidified saline soil with significant bonding. The model demonstrates robust applicability across both the pre-solidification and post-solidification stages of frozen saline soil.
(2)
As the influencing factors vary, the stress–strain curves of both frozen saline soil and frozen solidified saline soil present distinct characteristics. These can be categorized into strain-hardening and strain-softening types, each exhibiting linear elastic, elastoplastic, and corresponding hardening or softening phases. These phases are aptly characterized by the binary medium constitutive relationship theory.
(3)
The shear strength and failure patterns of both frozen saline soil and solidified frozen saline soil are influenced by the temperature, water content, and confining pressure. A critical temperature threshold at −9.82 °C marks a transitional point where the shear strength of saline soil shows divergent trends with temperature variations on either side of this threshold. Water content plays a critical role in determining the shear strength of saline soil under different negative temperature conditions, with a direct correlation between the moisture level and the rate of change in shear strength observed at a constant temperature.
(4)
The pore structures within saline soil and solidified saline soil are characterized by pronounced fractal dimensions. According to the thermodynamic model, Menger sponge model, and Neimark model, the fractal dimension D is consistently higher in solidified saline soil compared to that in non-solidified saline soil. This complexity in pore distribution signals a marked enhancement in soil solidification efficacy.
(5)
Multiple fractal dimensions are evident in both saline and solidified saline soils, with size-dependent variations observed in the context of the Menger sponge and Neimark models. The study therefore segments these soils into subregions. The lower values of DMI, DNI, DMIII, and DNIII in solidified saline soil, compared to those in non-solidified saline soil in Regions I and III, are attributed to the densification effects of hydration products and the presence of unhydrated solidifying agents. Conversely, in Region II, both DMII and DNII of solidified saline soil exhibit a ‘non-physical’ manifestation, a phenomenon largely ascribed to the formation of an extensive network of inkpot-type pores created by the aggregation of soil particles through hydration products.

Author Contributions

Conceptualization, X.K. and H.L.; methodology, G.Z.; software, S.L.; validation, X.K., H.L. and G.Z.; formal analysis, J.Z.; investigation, Z.Z.; resources, H.L.; data curation, L.S.; writing—original draft preparation, X.K.; writing—review and editing, H.L.; visualization, Z.Z.; supervision, H.L.; project administration, H.L.; funding acquisition, H.L. All authors have read and agreed to the published version of the manuscript.

Funding

We gratefully acknowledge the following funds for their support of this study: the National Natural Science Foundation of China (52069025), the National Natural Science Foundation of China (52369020), Key Project of Ningxia Natural Science Foundation (2023AAC02025), Key Project of Ningxia Natural Science Foundation (2023AAC02024), Graduate Innovation Project of Ningxia University (CXXM202341), and First level Discipline (hydraulic engineering discipline) of Ningxia Universities (NXYLXK2021A03).

Data Availability Statement

Data are contained within the article.

Acknowledgments

The authors would like to thank all the anonymous reviewers for their constructive comments and suggestions.

Conflicts of Interest

The authors declare no conflicts of interest.

References

  1. Ma, W.; Wang, D.T. Studies on frozen soil mechanics in China in past 50 years and their prospect. Chin. J. Geotech. Eng. 2012, 34, 625–640. [Google Scholar]
  2. Lai, Y.M.; Zhang, M.Y.; Li, S.Y. Theory and Application of Cold Regions; Science Press: Beijing, China, 2009; pp. 13–23. [Google Scholar]
  3. Li, J.G.; Pu, L.J.; Han, M.F.; Zhu, M.; Zhang, R.S.; Xiang, Y.Z. Soil salinization research in China: Advances and prospects. J. Geogr. Sci. 2014, 24, 943–960. [Google Scholar] [CrossRef]
  4. Li, H.B. Freeze-Thaw Response Mechanism of Integral Channel Lining and Mode Research of Saline Soil Foundation. Ph.D. Thesis, Ningxia University, Yinchuan, China, 2022. [Google Scholar]
  5. Tsytovich, N.A. The Mechanics of Frozen Ground; Science Press: Beijing, China, 2009; pp. 15–20. [Google Scholar]
  6. Chamberlain, E.; Groves, C.; Perham, R. Discussion: The mechanical behaviour of frozen earth materials under high pressure triaxial test conditions. Geotechnique 1973, 23, 136–137. [Google Scholar] [CrossRef]
  7. Wei, Z.H.; Wang, M.S.; Zhang, D.L. A Research on the Full State Function Constitutive Relation Model. Springer Ser. Geomech. Geoeng. 2012, 7, 654–660. [Google Scholar]
  8. Zhu, Y.L.; Zhang, J.Y.; Peng, W.W.; Shen, Z.Y.; Miao, L.N. Constitutive Relations of Frozen Soil in Uniaxial Compression. J. Glaciol. Geocryol. 1992, 34, 210–217. [Google Scholar]
  9. Lai, Y.M.; Li, S.Y.; Qi, J.L.; Gao, Z.H.; Chang, X.X. Strength distributions of warm frozen clay and its stochastic damage constitutive model. Cold Reg. Sci. Technol. 2008, 53, 200–215. [Google Scholar] [CrossRef]
  10. Lai, Y.M.; Li, J.B.; Li, Q.Z. Study on damage statistical constitutive model and stochastic simulation for warm ice-rich frozen silt. Cold Reg. Sci. Technol. 2012, 71, 102–110. [Google Scholar] [CrossRef]
  11. Chamberlain, E.J. Shear strength anisotropy in frozen saline and freshwater soils. In Proceedings of the 4th International Symposium on Grounding Freezing, Sapporo, Japan, 5–7 August 1985; pp. 189–194. [Google Scholar]
  12. Chang, D.; Lai, Y.M.; Zhang, M.Y. A meso-macroscopic constitutive model of frozen saline sandy soil based on homogenization theory. Int. J. Mech. Sci. 2019, 159, 246–259. [Google Scholar] [CrossRef]
  13. Lai, Y.M.; Jin, L.; Chang, X.X. Yield criterion and elasto-plastic damage constitutive model for frozen sandy soil. Int. J. Plast. 2009, 25, 1177–1205. [Google Scholar] [CrossRef]
  14. Lai, Y.M.; Liao, M.K.; Hu, K. A constitutive model of frozen saline sandy soil based on energy dissipation theory. Int. J. Plast. 2016, 78, 84–113. [Google Scholar] [CrossRef]
  15. Wang, P.; Liu, E.L.; Zhang, D.; Liu, X.Y.; Zhang, G.; Song, B.T. An elastoplastic binary medium constitutive model for saturated frozen soils. Cold Reg. Sci. Technol. 2020, 174, 103055. [Google Scholar] [CrossRef]
  16. Wang, D.; Liu, E.L.; Zhang, D.; Yue, P.; Wang, P.; Kang, J.; Yu, Q.H. An elasto-plastic constitutive model for frozen soil subjected to cyclic loading. Cold Reg. Sci. Technol. 2021, 189, 103341. [Google Scholar] [CrossRef]
  17. Zhang, D.; Liu, E.L. Binary-medium-based constitutive model of frozen soils subjected to triaxial loading. Results Phys. 2019, 12, 1999–2008. [Google Scholar] [CrossRef]
  18. Wang, D.; Liu, E.L.; Huang, J. Elastoplastic constitutive model for frozen sands based on framework of homogenization theory. Acta Geotech. 2020, 15, 1831–1845. [Google Scholar]
  19. Zhang, S.M.; Jiang, G.L.; Ye, X.W.; Cai, J.F.; Yuan, S.Y.; Luo, B. A constitutive model for frozen silty sand based on binary medium model simplified by breakage parameter. Rock Soil Mech. 2022, 43, 1854–1864. [Google Scholar]
  20. Shen, Z.J. Breakage mechanics and doublemedium model for geological materials. Hydro-Sci. Eng. 2002, 4, 1–6. [Google Scholar]
  21. Shen, Z.J. Breakage mechanics for geological materials: An ideal brittle-elasticplastic model. Chin. J. Geotech. Eng. 2003, 25, 253–257. [Google Scholar]
  22. Liu, E.L. Research on Breakage Mechanism of Structural Blocks and Binary Medium Model for Geomaterials. Ph.D. Thesis, Tsinghua University, Beijing, China, 2005. [Google Scholar]
  23. Liu, E.L.; Tan, Y.L.; Chen, S.S.; Li, G.Y. Investigation on critical state of rockfill materials. J. Hydraul. Eng. 2012, 43, 505–511+519. [Google Scholar]
  24. Liu, E.L.; Huang, R.Q.; He, S.M. Modeling the deformation properties of rock samples by binary medium model. J. Hydraul. Eng. 2012, 43, 1237–1245. [Google Scholar]
  25. Yu, D.; Liu, E.L.; Sun, P.; Xiang, B.; Zheng, Q.S. Mechanical properties and binary-medium constitutive model for semi-through jointed mudstone samples. Int. J. Rock Mech. Min. 2020, 132, 104376. [Google Scholar] [CrossRef]
  26. Chen, Y.B.; Liu, E.L.; Yu, Y.Y.; Luo, H.H.; Chen, P.S. A binary-medium-based constitutive model for porous rocks. Int. J. Rock Mech. Min. 2023, 164, 105345. [Google Scholar] [CrossRef]
  27. Li, H.R.; Hu, Z.Q.; Feng, F.; Liu, Y. Application of structural loess binary-medium model to localization shear band. Rock Soil Mech. 2012, 33, 2803–2810. [Google Scholar]
  28. Zhang, Y.; Chen, C.H.; Gao, S.F.; Guo, S.Q.; Li, N.; Hu, Z.Q.; Yang, S.S. A novel binary-medium breakage model for loess in an acidic aqueous environment. Bull. Assoc. Int. Geol. Ing. Environ. 2023, 82, 1–13. [Google Scholar] [CrossRef]
  29. Lu, Q.Z.; Peng, J.B.; Wang, S.L.; Zhou, B.; Wang, Y. Double-parameter binary-medium model for fissured loess. Chin. J. Geotech. Eng. 2012, 34, 893–898. [Google Scholar]
  30. Fan, W.; Deng, L.S.; Yuan, W.N. Double parameter binary-medium model of fissured loess. Eng. Geol. 2018, 236, 22–28. [Google Scholar] [CrossRef]
  31. Yan, F.R.; Fan, W.; He, T.Y. Study on Binary-Medium Model of Fissured Loess. Appl. Mech. Mater. 2013, 256, 240–244. [Google Scholar] [CrossRef]
  32. Li, H.R.; Feng, F.; Wang, Q. Application of Structural Loess Binary-Medium Mode in Localization Shear Band. Appl. Mech. Mater. 2012, 204, 825–832. [Google Scholar] [CrossRef]
  33. Wang, D.; Liu, E.L.; Yang, C.S.; Wang, P.; Song, B.T. Micromechanics-based binary-medium constitutive model for frozen soil considering the influence of coarse-grained contents and freeze–thaw cycles. Acta Geotech. 2023, 18, 1–20. [Google Scholar] [CrossRef]
  34. Liu, Y.N.; Liu, E.L.; Li, X.; Chen, Y.B.; Zhang, H.R.; Li, H.M. Binary-medium constitutive model for freeze-thaw tailings subjected to cyclic triaxial loading. Cold Reg. Sci. Technol. 2023, 213, 103927. [Google Scholar] [CrossRef]
  35. Pedarla, A.; Aravind, A.; Hoyos, L.; Chittoori, B. Evaluation of swell behavior of expansive clays from internal specific surface and pore size distribution. J. Geotech. Geoenviron. Eng. 2016, 142, 1943–5605. [Google Scholar] [CrossRef]
  36. Zhang, B.Q.; Li, S.F. Determination of the surface fractal dimension for porous media by mercury porosimetry. Ind. Eng. Chem. Res. 1995, 34, 1383–1386. [Google Scholar] [CrossRef]
  37. Sun, H.Q.; Mašín, D.; Najser, J.; Neděla, V.; Navrátilová, E. Fractal characteristics of pore structure of compacted bentonite studied by ESEM and MIP methods. Acta Geotech. 2019, 15, 1655–1671. [Google Scholar] [CrossRef]
  38. Chen, J.Y.; Zhao, H.; Zhao, M.H.; Peng, W.Z.; Hou, J.C. Prediction of permeability for fully weathered granite amended with fly ash by fractal dimensions. J. Sustain. Cem. Based Mater. 2023, 12, 259–270. [Google Scholar] [CrossRef]
  39. Gao, Y.; Jiang, J.; De Schutter, G.; Ye, G.; Sun, W. Fractal and multifractal analysis on pore structure in cement paste. Constr. Build. Mater. 2014, 69, 253–261. [Google Scholar] [CrossRef]
  40. Yu, L.H.; Ou, H.; Duan, Q.P. Fractal dimension of perlite doped cement stone pores and its relationship with pore structure and strength. J. Mater. Sci. Eng. 2007, 25, 201–205. [Google Scholar]
  41. Wei, J.X.; Yu, Q.J.; Zeng, X.X.; Bai, R.Y. Study of fractal dimension of pore structure in concrete. J. South China Univ. Technol. 2007, 35, 121–124. [Google Scholar]
  42. Zhang, R.Q.; Qiao, Y.X.; Xue, J.N. Spatial Relationship Analysis Between the Soil Salinization and Land Use Intensity in Yinchuan Plain. J. Geo-inf. Sci. 2015, 17, 598–606. [Google Scholar]
  43. GB/T 50123-2019; Standard for Geotechnical Test Methods. Ministry of Water Resources, People’s Republic of China: Beijing, China, 2019.
  44. GB 51144-2015; Code for Geotechnical Engineering Investigation of Coal Industrial Mine Construction. China Coal Construction Association: Beijing, China, 2015.
  45. Li, G.X. Advanced Soil Mechanics; Tsinghua University Press: Beijing, China, 2016; pp. 58–69. [Google Scholar]
  46. Zhang, D.; Liu, E.L.; Liu, X.Y.; Song, B.T. Investigation on binary medium model taking frozen silt soils under −6 °C for example. Chin. J. Geotech. Eng. 2018, 40, 82–90. [Google Scholar]
  47. Shen, Z.J.; Liu, E.L.; Chen, T.L. Generalized stress-strain relationship of binary medium model for geological materials. Chin. J. Geotech. Eng. 2005, 05, 489–494. [Google Scholar]
  48. Lai, Y.M.; Cheng, H.B.; Gao, Z.H.; Zhang, S.J.; Chang, X.X. Stress-strain relationships and nonlinear mohr strength criterion of frozen sand clay. Chin. J. Rock Mech. Eng. 2007, 8, 1612–1617. [Google Scholar]
  49. Shear, D.L.; Olsen, H.W.; Nelson, K.R. Effects of Desiccation on the Hydraulic Conductivity versus Void Ratio Relationship for Natural Clay; National Academy Press: Washington, DC, USA, 1993; pp. 24–40. [Google Scholar]
  50. Zhou, Y.F.; Li, W.W.; Peng, Y.X.; Tang, S.W.; Wang, L.; Shi, Y.; Li, Y.; Wang, Y.; Geng, Z.C.; Wu, K. Hydration and fractal analysis on Low-heat Portland cement pastes by thermodynamic-based methods. Fractal Fract. 2023, 7, 606. [Google Scholar] [CrossRef]
  51. Li, Y.; Zhang, H.; Huang, M.H.; Yin, H.B.; Jiang, K.; Xiao, K.T.; Tang, S.W. Influence of different alkali sulfates on the shrinkage, hydration, pore structure, fractal dimension and microstructure of low-heat Portland cement, medium-heat Portland cement and ordinary Portland cement. Fractal Fract. 2021, 5, 79. [Google Scholar] [CrossRef]
  52. Liao, Y.S.; Yao, J.X.; Deng, F.; Li, H.; Wang, K.J.; Tang, S.W. Hydration behavior and strength development of supersulfated cement prepared by calcined phosphogypsum and slaked lime. J. Build. Eng. 2023, 80, 108075–108090. [Google Scholar] [CrossRef]
  53. Peng, Y.X.; Tang, S.W.; Huang, J.S.; Tang, C.; Wang, L.; Liu, Y.F. Fractal analysis on pore structure and modeling of hydration of magnesium phosphate cement paste. Fractal Fract. 2022, 6, 337. [Google Scholar] [CrossRef]
  54. Hong, G.; Oh, S.; Kim, J.; Chin, W.J.; Kim, Y.J.; Choi, S.; Song, C. Surface-fractal-dimension characteristics of cementitious composites with multi-walled carbon nanotubes dispersed by silica fume. Constr. Build. Mater. 2022, 329, 127182. [Google Scholar] [CrossRef]
Figure 1. Channel disease forms.
Fractalfract 08 00033 g001
Figure 2. Distribution of salinization degree in Yinchuan Plain and sampling locations of saline soils.
Fractalfract 08 00033 g002
Figure 3. Under 0.1 mm saline soil particle grading curve.
Fractalfract 08 00033 g003
Figure 4. Triaxial test equipment.
Fractalfract 08 00033 g004
Figure 5. The sample preparation process.
Fractalfract 08 00033 g005
Figure 6. Structural model of frozen saline soil and solidified frozen saline soil: (a) frozen saline soil, (b) solidified frozen saline soil.
Fractalfract 08 00033 g006
Figure 7. Binary medium model load sharing approach.
Fractalfract 08 00033 g007
Figure 8. Stress sharing curves of bonded elements and frictional elements (S4-450).
Fractalfract 08 00033 g008
Figure 9. Comparison between theoretical data and experimental data of frozen saline soil model: (a) −5 °C, (b) −10 °C, (c) −15 °C, (d) −20 °C.
Fractalfract 08 00033 g009
Figure 10. Comparison between theoretical data and experimental data of solidified frozen saline soil model: (a) −5 °C, (b) −10 °C, (c) −15 °C, (d) −20 °C.
Fractalfract 08 00033 g010aFractalfract 08 00033 g010b
Figure 11. Failure mode: (a) 12.20% water content frozen saline soil, (b) 16.20% water content frozen saline soil, (c) 20.20% water content frozen saline soil, (d) 20.41% water content solidified frozen saline soil.
Fractalfract 08 00033 g011
Figure 12. Stress–strain curves for saline soils at different temperatures: (a) −5 °C, (b) −10 °C, (c) −15 °C, (d) −20 °C.
Fractalfract 08 00033 g012
Figure 13. Comparison curves of stress–strain relationship at different temperatures between solidified saline soil and saline soil: (a) −5 °C, (b) −10 °C, (c) −15 °C, (d) −20 °C.
Fractalfract 08 00033 g013
Figure 14. Relationship between temperature, water content, and shear strength of saline soils: (a) water content–shear strength, (b) temperature–shear strength.
Fractalfract 08 00033 g014
Figure 15. Pore structure distribution of saline soil and solidified saline soil: (a) pore cumulative mercury intrusion curve, (b) pore distribution curve, (c) percentage of different pore sizes.
Fractalfract 08 00033 g015
Figure 16. The porosity fractal characteristics: (a) thermodynamic model, (b) Menger sponge model, (c) Neimark model, (d) multifractal characteristics of Menger sponge model, (e) multifractal characteristics of Neimark model.
Fractalfract 08 00033 g016aFractalfract 08 00033 g016b
Table 1. Distribution of saline soil grading.
Particle size range/mm0.5–20.25–0.50.1–0.250.075–0.1<0.075
Percentage/%23.6724.4824.7610.5616.53
Table 2. Ionic composition and salt content of saline soil.
Ionic Composition/(g·kg−1)Salinity/%PH Value
CO32−HCO32−ClSO42−K+Na+Ca2+Mg2+Water-Soluble Salt Ion
0.0304.7324.060.040.452.280.0731.545.48.9
Table 3. Chemical composition and content of solidifying agent.
IngredientSiO2Al2O3Fe2O3CaOMgOK2ONa2OTiO2SO3
Solidifying Agent
Cement/%22.416.853.8356.921.520.780.29//
Fly ash/%28.5237.9312.912.252.111.631.421.050.58
Silica fume/%89.422.330.770.653.292.90/0.03/
Brick powder/%67.8319.564.650.660.963.430.340.62/
Table 4. Frozen soil triaxial test program.
Serial NumberTemperature/°CWater Content/%Dry Density/g·cm−3
S1−512.201.71
S216.201.71
S320.201.71
G120.411.58
S4−1012.201.71
S516.201.71
S620.201.71
G220.411.58
S7−1512.201.71
S816.201.71
S920.201.71
G320.411.58
S10−2012.201.71
S1116.201.71
S1220.201.71
G420.411.58
S for saline soils, G for solidified saline soils.
Table 5. MIP test program.
Serial NumberCement:Fly Ash:Silica Fume:Brick PowderDry Density/g·cm−3Compaction Factor
SS0-1.710.9
GG12:5:3:91.580.9
GG23:5:5:61.580.9
GG33:10:1:91.580.9
SS for saline soils, GG for solidified saline soils.
Table 6. Parameters of binary medium constitutive model for frozen saline soil.
Serial NumberStrain TypeE0/kPaαmcRabnl
S1-150softening331.130.142112.39650.974110.0030-2.50 × 10−50.000103
S1-250softening371.400.22834.08530.993210.0027-0.0001834.37 × 10−5
S1-350softening379.580.52381.10020.998910.0026-0.0003021.79 × 10−5
S1-450softening422.730.41501.95690.999810.0024-0.0003221.06 × 10−5
S2-150hardening118.931.48000.25070.986110.00840.0023--
S2-250hardening143.410.57560.57230.973810.00700.0015--
S2-350hardening240.020.59690.72020.963910.00420.0011--
S2-450hardening253.650.80370.50890.9722610.00390.0010--
S3-150hardening136.220.84110.60050.975910.00730.0023--
S3-250hardening195.240.80410.64900.976810.00510.0017--
S3-350hardening223.300.72760.65590.979010.00450.0015--
S3-450hardening282.690.74560.65030.981510.00350.0012--
G1-150softening655.243.27 × 10−929.99740.96581.39940.0015-−0.0002300.000118
G1-250softening650.954.65 × 10−43.24780.9565−0.08880.0015-−8.56 × 10−57.24 × 10−5
G1-350softening742.857.20 × 10−43.09870.9565−0.08860.0013-−8.13 × 10−56.51 × 10−5
G1-450softening880.702.21 × 10−21.85020.9545−0.14090.0011-−6.96 × 10−55.48 × 10−5
S4-150softening451.440.16166.74290.969810.0022-0.0001030.000105
S4-250softening443.220.37451.88080.986110.0023-0.0002733.79 × 10−5
S4-350softening447.830.51811.11370.997810.0022-0.0003141.83 × 10−5
S4-450softening478.440.49471.13870.999410.0021-0.0002381.49 × 10−5
S5-150softening291.600.24993.04890.999710.0034-0.0005991.98 × 10−5
S5-250softening294.410.24183.50540.999810.0034-0.0004691.71 × 10−5
S5-350hardening246.500.20830.96210.960610.00410.0008--
S5-450hardening258.360.47100.60670.977010.00390.0008--
S6-150softening375.930.19494.15910.999610.0027-0.0004821.30 × 10−5
S6-250hardening405.911.23250.31820.979610.00250.0008--
S6-350hardening407.581.31870.33130.994710.00250.0007--
S6-450hardening436.181.17810.45990.976710.00230.0007--
G2-150softening1615.121.43962.16660.98733.37200.0006-−0.0001409.54 × 10−5
G2-250softening1456.873.86 × 10−1163.04730.98340.59740.0007-−9.41 × 10−56.35 × 10−5
G2-350softening1470.113.31 × 10−943.04200.97570.93610.0007-−9.22 × 10−55.75 × 10−5
G2-450softening1777.930.99542.49010.96932.77320.0006-−2.42 × 10−54.25 × 10−5
S7-150softening410.250.093624.79540.973510.0024-−6.89 × 10−58.80 × 10−5
S7-250softening500.710.43991.73120.989510.0020-0.0002703.20 × 10−5
S7-350softening556.990.45291.57230.988810.0018-0.0001602.80 × 10−5
S7-450softening672.190.47831.19410.999210.0015-0.0002851.19 × 10−5
S8-150softening514.560.16115.88900.999310.0019-0.0002085.71 × 10−5
S8-250softening485.090.15945.96000.997610.0021-0.0002002.62 × 10−5
S8-350softening483.320.13017.58040.999610.0021-0.0001981.56 × 10−5
S8-450softening715.090.25983.01140.999710.0014-0.0003246.43 × 10−6
S9-150softening692.940.18124.61810.999310.0014-0.0002821.15 × 10−5
S9-250hardening732.151.04160.46360.996810.00140.0005--
S9-350hardening665.691.07070.40850.995410.00150.0005--
S9-450hardening773.351.04190.41720.995610.00130.0004--
G3-150softening1400.350.27510.51800.6810−1.98240.0007-−3.19 × 10−52.35 × 10−5
G3-250softening1478.660.62670.32360.7153−2.25270.0007-−3.57 × 10−52.23 × 10−5
G3-350softening1604.616.01350.06620.69891.03720.0006-−2.54 × 10−51.85 × 10−5
G3-450softening1799.374.39430.08600.71971.30240.0006-−2.29 × 10−51.65 × 10−5
S10-150softening650.780.098521.40750.992810.0015-−4.14 × 10−58.64 × 10−5
S10-250softening640.020.119620.46550.977810.0016-−1.71 × 10−55.37 × 10−5
S10-350softening751.960.15777.58940.988410.0013-5.33 × 10−53.62 × 10−5
S10-450softening894.440.44941.81280.987210.0011-0.0001352.00 × 10−5
S11-150softening582.870.130710.65610.997110.0017-5.86 × 10−55.11 × 10−5
S11-250softening757.550.18384.94520.986310.0013-6.32 × 10−53.77 × 10−5
S11-350softening870.530.23034.59850.984810.0011-0.0001012.59 × 10−5
S11-450softening910.860.66351.10620.999810.0011-0.0002207.68 × 10−6
S12-150softening1155.150.21463.64360.999510.0009-0.0002424.90 × 10−6
S12-250softening1014.030.25422.77430.999710.0010-0.0002135.41 × 10−6
S12-350hardening1059.351.18180.42370.995410.00090.0003--
S12-450hardening1072.201.16900.48480.978910.00090.0003--
G4-150softening2104.340.33960.46140.7668−1.29740.0005-−1.95 × 10−51.75 × 10−5
G4-250softening2307.931.44410.21170.4483−23.05220.0004-4.37 × 10−61.12 × 10−5
G4-350softening2279.740.16480.62880.5232−3.36860.0004-−3.54 × 10−69.40 × 10−6
G4-450softening2609.085.96600.06660.7109−4.87630.0004-−1.58 × 10−51.14 × 10−5
Table 7. Shear strength index of test samples.
Serial Number(σ1σ3)/kPaShear Strength Index
150250350450c/kPaφ/(°)
S1876.381150.991359.111564.32153.0232.18
S2430.06679.20883.141046.9240.2230.52
S3436.53573.03671.08804.39107.9422.06
S4935.461164.991392.831691.77145.6633.77
S5893.001051.511224.361325.60216.1325.14
S61170.731257.381334.731416.69404.8916.83
S71166.121288.041644.501817.30211.0332.72
S81143.571504.681792.001946.59200.0335.33
S91853.381944.512104.582384.79484.1928.30
S101454.571778.472033.422303.77269.1935.73
S111536.311963.572243.682479.06272.9837.69
S122686.382783.232868.153188.01752.6427.13
G11604.841720.521864.052001.54457.2523.59
G22892.813090.373297.423506.97739.2630.41
G34397.614872.265279.855929.48734.1545.71
G46136.536971.108006.128609.51790.1754.08
Table 8. The pore surface’s multifractal dimensions.
Serial NumberModelRegion IRegion IIRegion III
SS0Menger sponge2.93382.81912.9386
GG12.41034.62092.8205
GG22.44784.90262.9015
GG32.60433.97042.8343
SS0Neimark2.82293.06172.9268
GG12.58264.49872.7597
GG22.69554.67452.8052
GG32.45034.31402.7755
Disclaimer/Publisher’s Note: The statements, opinions and data contained in all publications are solely those of the individual author(s) and contributor(s) and not of MDPI and/or the editor(s). MDPI and/or the editor(s) disclaim responsibility for any injury to people or property resulting from any ideas, methods, instructions or products referred to in the content.

