Article

The Impact of Turkish Economic News on the Fractality of Borsa Istanbul: A Multidisciplinary Approach

1
Faculty of Science, Department of Mathematics, Muğla SıtkıKoçman University, Muğla 48000, Turkey
2
Department of Business, Babeş-Bolyai University, 400174 Cluj-Napoca, Romania
3
Faculty of Economics, “1 Decembrie 1918” University of Alba Iulia, 510009 Alba Iulia, Romania
*
Authors to whom correspondence should be addressed.
Fractal Fract. 2024, 8(1), 32; https://doi.org/10.3390/fractalfract8010032
Submission received: 30 November 2023 / Revised: 17 December 2023 / Accepted: 22 December 2023 / Published: 30 December 2023

Abstract

:
This study explores the connection between the fractal dimensions of time series representing sentiments regarding economic news and the fractal dimensions of correlation networks among companies listed in the Borsa Istanbul star section. While there have been many studies on the correlation between different time series, the investigation into the impact of fractal dimensions on correlation networks’ dynamics has been somewhat restricted. This study investigates the correlation networks among companies listed in the Borsa Istanbul Stars segment, employing distance and topological filters. The network fractional dimensions are evaluated using the box counting and information dimension techniques. A convolutional neural network is employed to perform analysis of sentiments regarding on 2020 Turkish economic news. The network is trained on user comments and specifically built to identify fluctuations in news editorials. The Zemberek natural language processing framework is beneficial for data preprocessing. Identical analytical methods are employed to quantify the fractal dimensions of each sentiment time series. Experiments are performed on these measurements using various sliding window widths to ascertain both independence and causality. The findings indicate a substantial correlation between market behavior and the feelings expressed in economic news.

1. Introduction

The concept of the fractal dimension holds great significance within the field of economics, specifically when examining financial markets and their intricate complexities. Originating from the wider domain of fractal geometry, the fractal dimension quantifies the non-uniformity or intricacy of datasets, providing valuable perspectives on patterns that may not be readily apparent via traditional linear models [1]. Financial time series frequently exhibit self-similarity and volatility clustering, which are typical attributes observed in fractal formations within the realm of economics. Through the utilization of the fractal dimension, economists and financial analysts are able to assess the level of roughness or complexity exhibited by price movements, thereby augmenting their comprehension of market dynamics. Furthermore, the quantification of these nonlinear structures facilitates the enhanced forecasting of extreme economic events, such as market crashes, which frequently pose challenges for conventional econometric models [2,3,4]. The incorporation of the fractal dimension into economic analysis offers a comprehensive methodology for understanding the intricate and frequently erratic characteristics of financial systems.
Within the framework of financial systems, the behaviors of individual participants can be effectively captured using time series analysis. However, the intricate interplay among these participants calls for an alternative methodology: correlation networks. The construction of these networks involves the assessment of pairwise correlations among the time series of distinct entities, thereby encapsulating the fundamental nature of their interdependent associations. In the realm of financial assets, it is noteworthy that two such assets exhibiting a propensity to ascend and descend in tandem would possess a considerable degree of positive correlation, thereby establishing a robust interconnectedness within the network [5,6]. In contrast, assets exhibiting inverse movements would imply a negative correlation. The structure and topology of the correlation networks provide valuable insights into the collective behavior of the market, revealing interdependencies and potential contagion pathways that may not be apparent when analyzing individual time series in isolation. Through the utilization of correlation networks, researchers and analysts have the ability to reveal systemic vulnerabilities, patterns of clustered behavior, and emergent phenomena within financial systems [7,8,9]. This approach provides a more comprehensive and interconnected perspective on market dynamics that extends beyond the limitations of individual trajectories.
Fractal dimensions, originating from the domain of fractal geometry, provide a framework for scrutinizing the intricate structures and patterns exhibited by diverse phenomena. Within the realm of finance, the examination of time series data pertaining to individual assets or actors reveals their inherent dynamics. However, it is the intricate interplay among these entities that gives rise to a complex network, which is most effectively depicted through correlation networks. The networks, derived from interdependencies among financial time series, encapsulate the simultaneous fluctuations of assets and market participants. The fractal dimension of these networks serves as an indicator of their intricacy, irregularity, and scaling characteristics. In essence, it provides a quantitative assessment of how the network’s characteristics vary at various levels, thereby providing valuable insights into its hierarchical organization and interconnectedness. In light of the growing interconnectivity of financial markets, it is imperative to grasp the fractal dimensions of financial correlation networks. It functions as a conduit, amalgamating the intricacies of individual asset dynamics with broader systemic interplays, facilitating a more profound understanding of the multifaceted characteristics of financial ecosystems.
Within the extensive literature of financial econometrics research, a multitude of studies have been conducted with the aim of comprehending the interplay between the fractal dimensions of different time series. The primary focus of these studies lies in examining the interdependencies, both linear and nonlinear, that exist between individual time series. Nevertheless, it is worth noting that there is a discernible gap in the existing pool of knowledge pertaining to the dearth of studies exploring the potential influence of fractal dimensions of time series on the dynamics of correlation networks. The networks, which depict interactions among financial entities, play a vital role in deciphering systemic relationships and potential pathways for contagion in markets. Through the analysis of fractal dimensions, researchers have the opportunity to gain a more detailed comprehension of the influence of individual market behaviors on larger market interconnections. Engaging in such studies would provide unique perspectives on the hierarchical and multi-scalar characteristics of financial markets. Moreover, understanding the impact of fractal dimensions on correlation networks has the potential to facilitate the creation of more sophisticated models, which could improve the reliability of financial predictions and the formulation of strategies that consider both the specific behaviors of individual assets and the broader market dynamics. The objective of this study is to conduct a multidisciplinary analysis on the association between the fractal dimensions of time series, specifically pertaining to economic news sentiments, and the fractal dimension of the correlation network among companies in the Borsa Istanbul Stars segment.
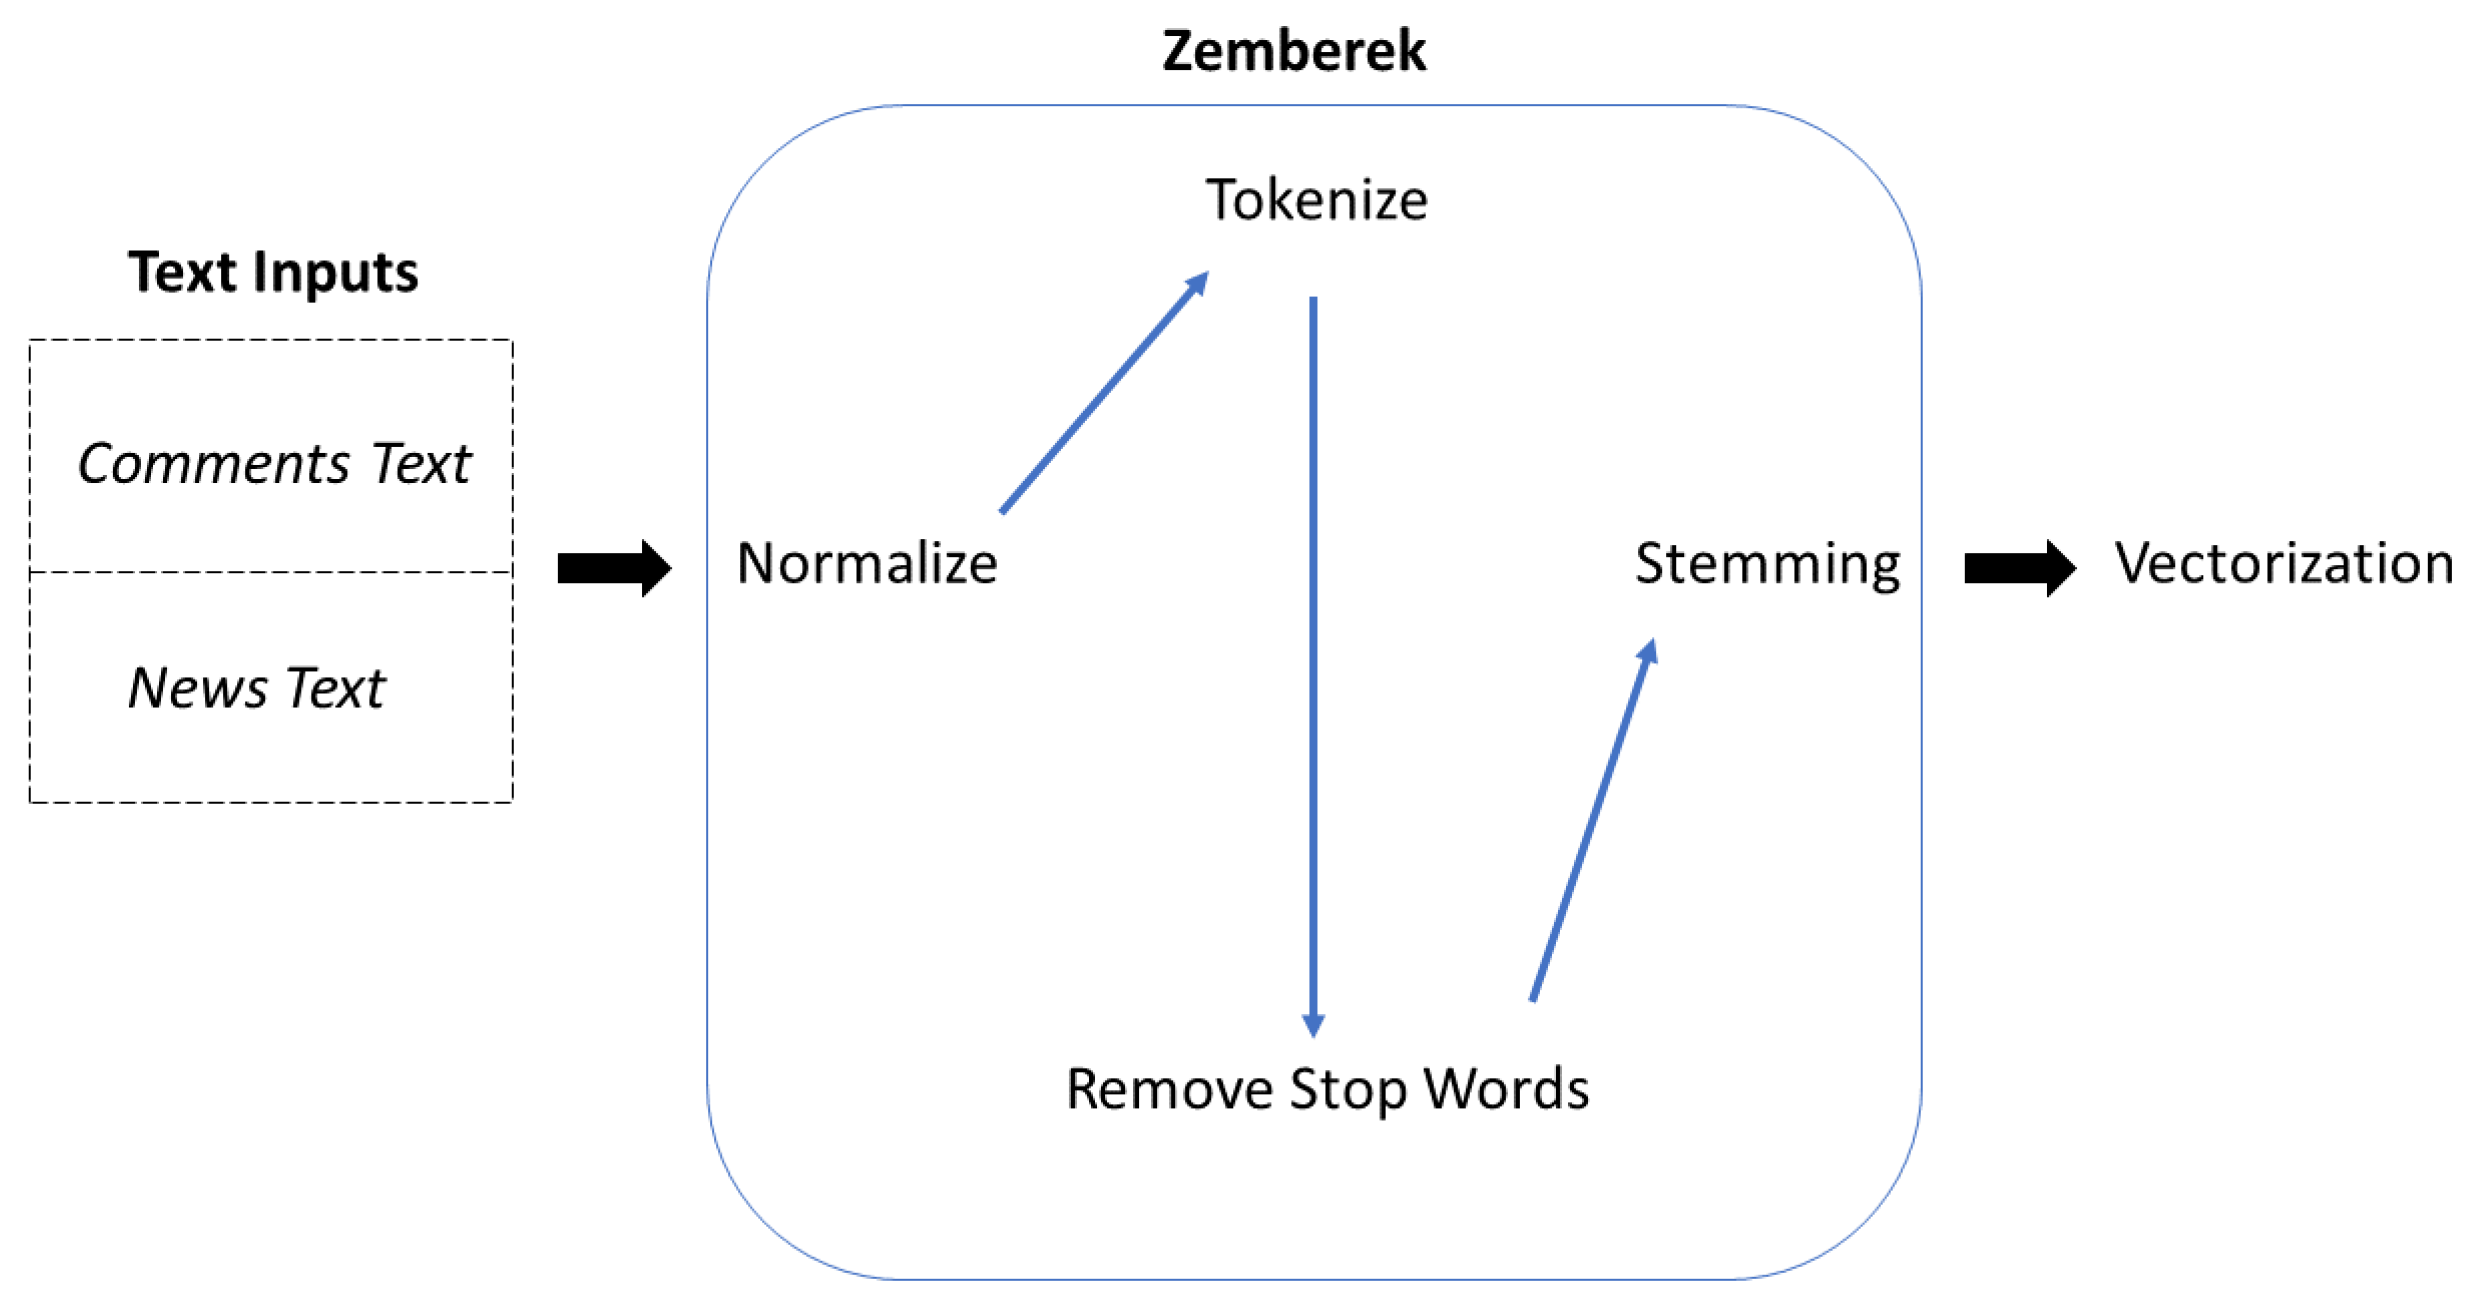
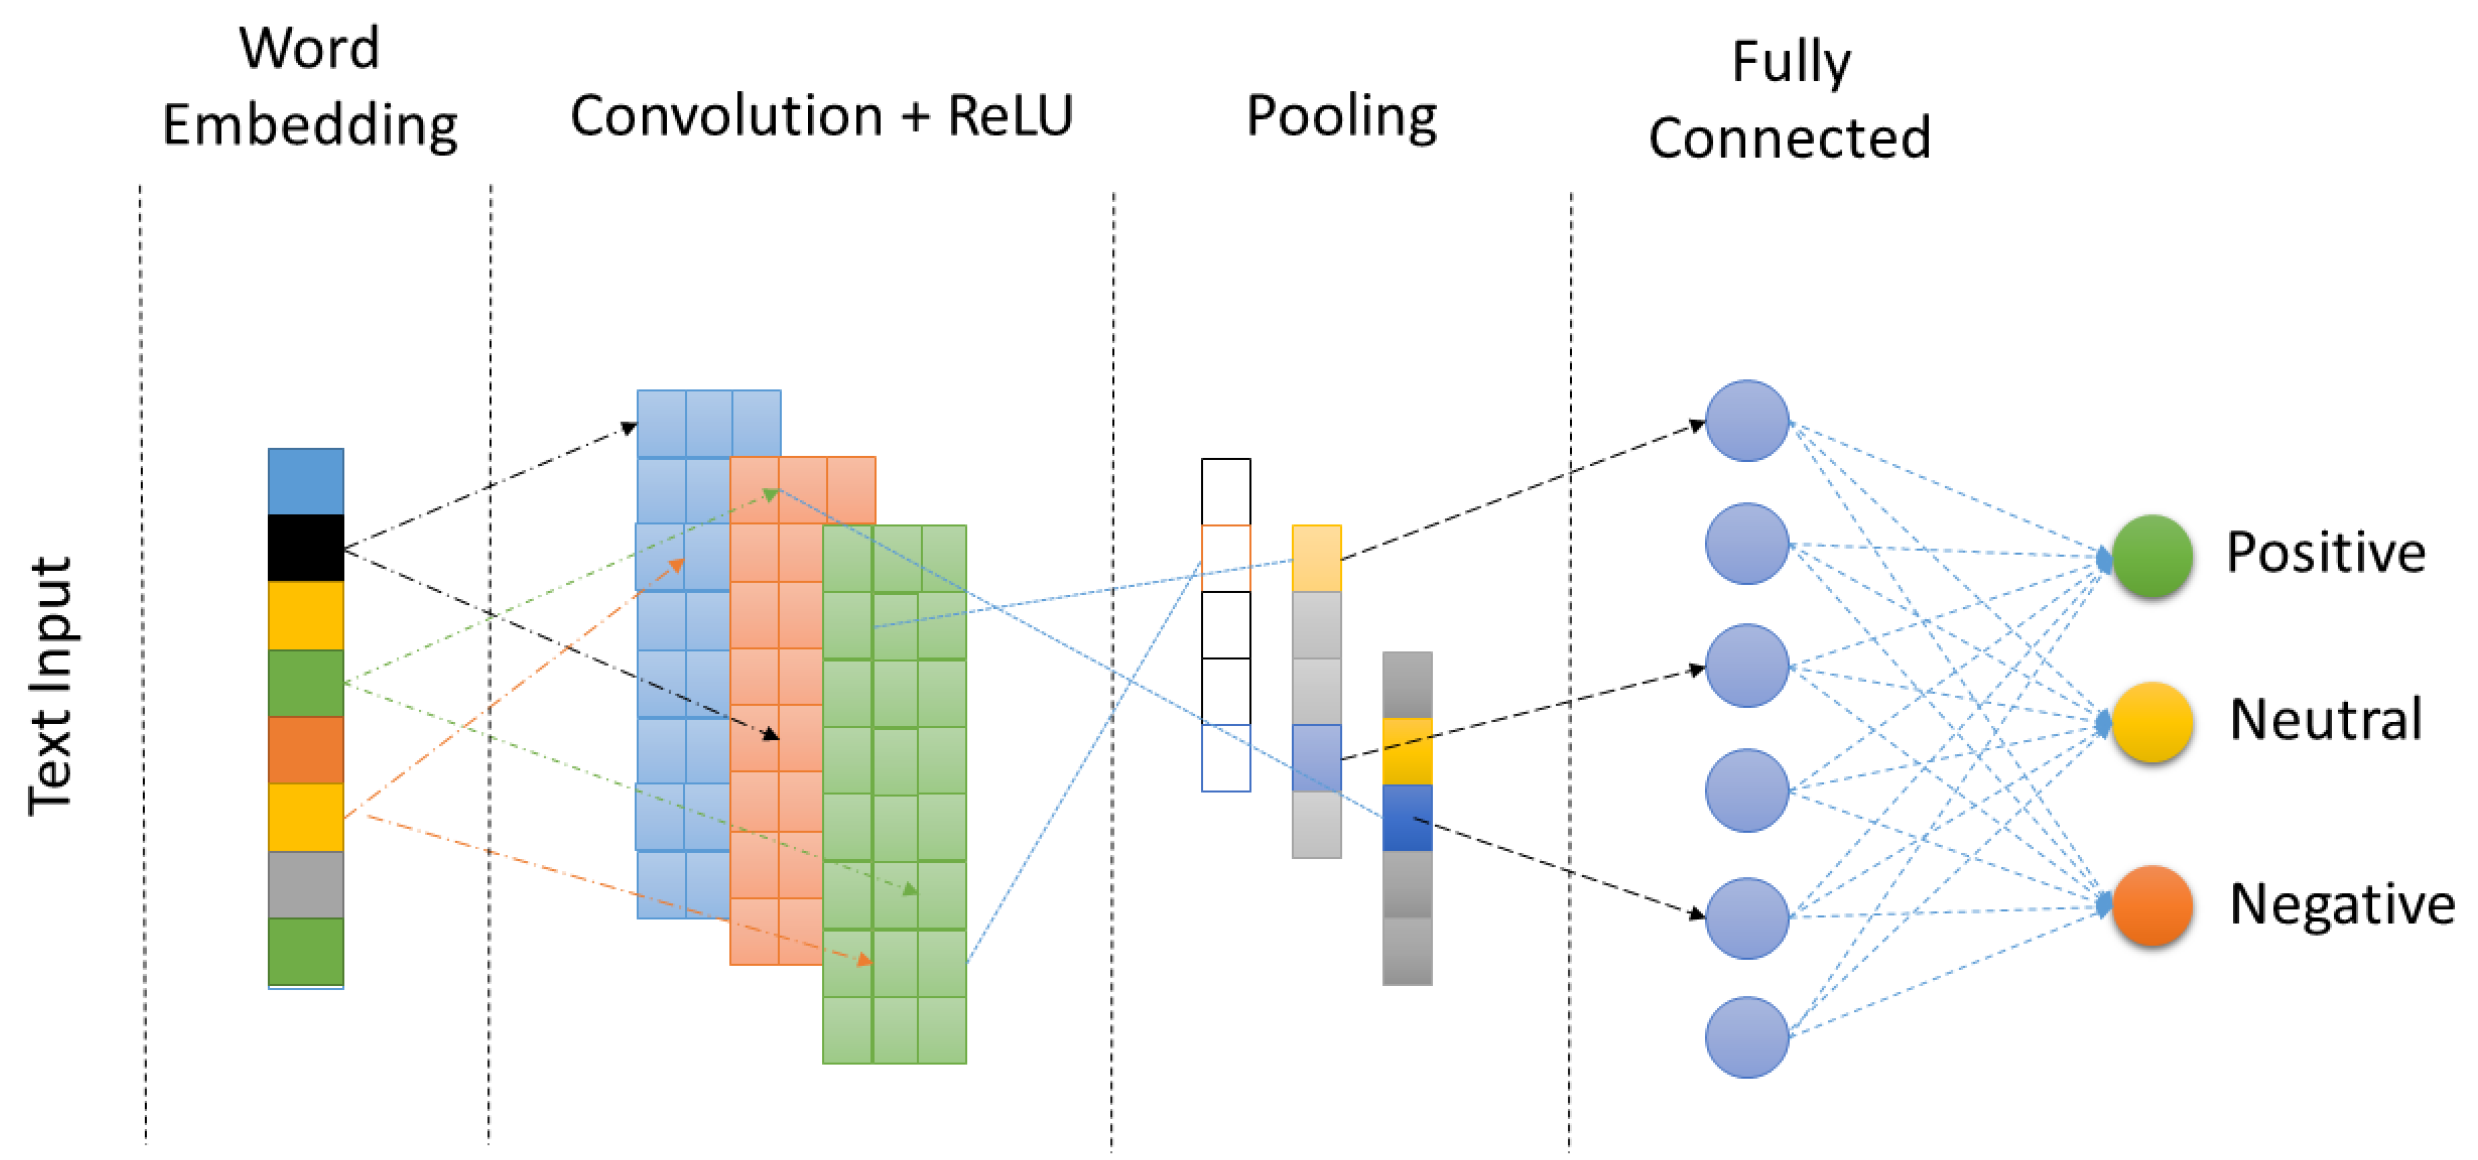
In order to fulfill the objective, we initially acquired correlation distance-based networks and topological filters of the companies that were traded in the BIST Stars segment during the year 2020. The network dynamics resulting from filtering are captured by calculating fractal dimensions using the box counting and information dimension methods. A deep network architecture was devised utilizing convolution neural networks to compute sentiment scores for economic news during the year 2020. Given the potential uncertainty surrounding the sentiment scores of news articles that undergo editorial processes, this deep learning architecture was trained, utilizing user comments on economic news shared on the public network. In the test and train stages, data pre-processing processes are conducted utilizing the Zemberek NLP framework. The fractal dimensions of the time series for the sentiment scores of economic news are computed utilizing the box counting and information dimension methodologies. The fractal dimension time series undergo independence and causality tests using the sub-time series derived from the sliding windows of varying widths.
The article is structured in the following manner: in Section 2, we provide a comprehensive analysis of the fractional dimension approaches and their relevance in financial research. In Section 3, the methodologies for obtaining financial correlation networks are presented, specifically focusing on the utilization of the Pearson correlation distance function. A filtering method is introduced in this context, which aims to decrease the edge weights by considering the greater value of the correlation-based relationship between companies that exhibit greater distance from each other. Next, the presentation focuses on various methodologies utilized for acquiring sentiment scores. The initial section provides an overview of the procedures involved in text pre-processing using the Zemberek framework. Subsequently, details are presented regarding the GloVE embedding method. The section also provides information regarding the deep learning network. The calculation of fractal dimensions for both networks and time series is presented. Section 4 includes an exposition of the outcomes acquired regarding the topological and fractal dimensions of the filtered networks comprising companies traded in the BIST Stars segment during the entirety of the year 2020. The section also includes the sentiment score outcomes. Section 5 extensively examines the detailed discussion surrounding the comparisons of fractal dimensions acquired through the utilization of sliding windows with widths of 5 and 10. Finally, Section 6 presents overarching conclusions. The research findings have significant implications for policy and decision making, benefiting many stakeholders such as investors and financial services regulators.

2. Literature Review

Since the inception of fractal property, scholarly inquiry in this domain has predominantly concentrated on three key dimensions. The primary consideration pertains to the manner in which the network is encompassed, since it serves as the fundamental underpinning of the fractal dimension. Several algorithms have been put forth, such as the greedy coloring algorithm proposed by [10]. However, it is worth noting that this algorithm necessitates multiple experiments due to the random covering sequence, thereby leading to an increased time complexity. To tackle this issue, ref. [11] have put forth an enhanced algorithm that incorporates a predetermined covering sequence derived from the nodes’ degrees. There exists a plethora of alternative algorithms that strike a balance between accuracy and time complexity in order to encompass the network. These include the multi-objective algorithm [12], sampling-based method [13], minimal partition covering method [14], and central-node covering method [15]. The second aspect entails examining the fractal nature through appropriate dimensions when the emphasis of investigation lies on the network or node [16,17]. The concept of the fuzzy fractal dimension [18] is employed to tackle the NP hard problem, specifically the network covering problem, by leveraging the box covering capability. It is worth noting that the network still exhibits a power law relationship between the box-covering capability and the box size. The local dimension [19] exhibits distinctiveness as it unveils the fractal characteristic surrounding the central node as opposed to the entire network. Consequently, the box will solely serve the purpose of encompassing the central node. The other facet pertains to the application of fractal dimension in real-world complex systems [20]. The study will focus on the examination of fractal dimensions in time series. To determine the fractal dimension of the resulting networks and maintain their characterization, the box covering [15] and information dimension [17] methods are employed.
Capital market traders use a sizable amount of textual data that trading systems generate. Investors have access to a wide range of information sources, including official announcements, analysts’ recommendations, financial journals, discussion boards, and news feeds from news wire services [21]. Ref. [22] pioneered the utilization of textual data for the purpose of forecasting stock market trends. The utilization of a domain expert dictionary of terms was employed to allocate weightings to features and generate probabilistic rules for the purpose of predicting the daily price changes of five stock indices. The empirical evidence of a trading strategy grounded in system predictions has revealed the potential for generating favorable returns by leveraging financial news. Ref. [23] created the analyst system, which encompassed language models, leveraged price time series data, and employed classification techniques to analyze incoming news. The authors have demonstrated the potential for generating profits through the implementation of the devised system. Ref. [24] devised an economic framework aimed at forecasting near-term fluctuations in prices. The news articles underwent alignment and were subjected to linear regression analysis in correlation with the NASDAQ index, subsequently receiving categorization as “up", “down”, or “unchanged”. The authors’ conclusion posits a robust correlation between stock behavior and the temporal proximity of a news article, spanning from 20 min prior to its release to 20 min thereafter. In the study conducted by [25], an analysis of monthly returns was undertaken, focusing on the impact of company-specific headlines. The findings revealed that the dissemination of unfavorable news exhibits a robust negative influence on market drift. Ref. [26] conducted a study that centered on the analysis of official company reports, wherein they substantiated the efficacy of such reports in predicting the future performance of the company. In the realm of corporate analysis, it is worth noting that alterations in the written composition of a report may serve as a noteworthy indicator of a substantial shift in the overall productivity of a given company. Ref. [27] conducted an analysis of the correlation between company average returns and their media coverage. The authors’ findings indicate that stocks exhibiting high media coverage registered a notable underperformance relative to the stocks that did not receive media attention. In the study conducted by [28], an examination was made of the correlation between the sentiment expressed in articles published by the New York Times and stock returns. The findings of the study suggest that the news content plays a significant role in predicting stock returns. Moreover, it was observed that the investor sentiments have a notable impact, particularly during periods of economic recession. Ref. [29] conducted an analysis of the relationship between the content of daily articles published by the Wall Street Journal and stock market performance. The empirical evidence suggests that the dissemination of highly pessimistic news exerts downward pressure on market prices, thereby inducing a noticeable surge in trading volume. In their seminal work, ref. [30] conducted a comprehensive analysis of the advantages derived from the categorization of financial news based on industries and sectors with similar characteristics.

3. Methodology

3.1. Correlation Networks

Financial correlation networks offer a sophisticated framework for visualizing and analyzing the intricate interconnections among diverse financial assets. Fundamentally, these networks delineate the interdependencies in price dynamics among asset pairs, elucidating the intricate interplay where the fate of one asset can exert influence upon or exhibit resemblance to another. By comprehending the magnitude and structure of these interdependencies, investors and analysts can enhance their ability to assess the inherent risk within a system, discern plausible channels of contagion amidst financial crises, and construct portfolio strategies that are more resilient and enduring. In the context of a progressively interconnected global financial system, the correlation networks play a pivotal role in elucidating the intricate interconnections and latent vulnerabilities embedded within extensive sets of financial data.
The mathematical foundations of networks, frequently grounded in graph theory, provide profound elucidations into the configuration and dynamics of interrelated systems. In the context of these networks, the nodes can be understood as discrete entities, while the edges symbolize the connections or associations that exist between them. In mathematical terms, a graph can be denoted as a tuple G = ( V , E ) , where V represents the set of nodes and E V ×   V represents the set of edges. In the realm of real-world applications, one can assign weights to edges based on the model’s context using the weight function ω : E R + . Then, the triple ( V , E , ω ) is referred to as a weighted graph. In the domain of financial correlation networks, the representation of each node corresponds to a financial asset, while the weights assigned to the edges quantify the magnitude of the correlation between the returns of paired assets. The computation of these correlations is commonly performed using Pearson correlation coefficients [31], although alternative measures such as partial correlations or mutual information can also be employed [32,33,34]. Once correlation values have been computed, they are converted into a correlation matrix, which can subsequently be subjected to filtering or additional processing in order to construct a network.
Let us examine the logarithmic return, denoted as
C l i ( t ) = log P i ( t ) log P i ( t 1 ) ,
which represents the change in the daily closure price P i ( t ) of stock i at time t. Then, the Pearson correlation coefficient between the stocks i and j can be calculated as follows:
ρ i j = < C l i C l j > < C l i > < C l j > < C l i 2 > < C l i > 2 < C l j 2 > < C l j > 2 ,
where < · > is the temporal average. The Pearson correlation coefficient given in the Equation (2) is a measure of the linear relationship between two financial time series. It quantifies the extent to which the changes in one series can be expressed as a linear function of the changes in the other series. A value in proximity to 1 signifies a strong positive correlation between the two series, wherein their movements are closely aligned. When one series experiences an increase, the other series also tends to exhibit an increase, and conversely, when one series undergoes a decrease, the other series tends to follow suit. A value in proximity to 1 implies an inverse correlation: as one series exhibits growth, the other series tends to exhibit decline. A value in close proximity to zero signifies a minimal or negligible linear correlation between the series.
We shall note here that Equation (1) utilizes log returns, which are commonly embraced in financial research due to their advantageous statistical characteristics. Logarithmic returns provide a balanced approach to analyzing proportional profits and losses, making them well suited for our study, which explores the links between various financial assets. The presence of this symmetry implies that equal percentage increases and decreases are seen to be of equal importance, unlike in the case of simple returns. In addition, log returns can be combined across several time periods, making it easier to calculate the overall returns for multiple periods. Ensuring consistency and comparability in return measurements over time is crucial for our study involving the correlation distance. Furthermore, log returns provide an estimation of the returns generated by assets that are continually compounded, thereby conforming to the theoretical models in financial economics. When analyzing dividends, log returns can be modified to account for the total return, which includes both the increase in price and the income from dividends. The usual method involves re-investing dividends in the asset and modifying the price series accordingly prior to calculating the logarithmic returns. This approach considers both the income portion of an asset’s total return and ensures the accuracy and relevance of the log return computation. However, our current research primarily focuses on the price changes of assets, and thus we did not specifically consider dividend adjustments. The subsequent phases of this study could add dividend reinvestments to offer a more thorough assessment of the overall asset performance.
Thus, in this study, to denote the strength of the relationships, we are assigning weights to the network edges using the correlation distance function
d C ( i , j ) = 2 ( 1 ρ i j 2 ) .
As a preliminary network, we begin by contemplating the complete graph, wherein all nodes are interconnected by an edge and weighted by the correlation distance function. Strong positive–negative correlation values will result in a convergence of the edge weight value towards zero, whereas weak correlation values will lead to the edge weight value approaching 2 . The weight function is determined by the distance, wherein smaller weights indicate more robust relationships. By employing this approach, one can leverage highly efficient filtering techniques.
The hierarchical structure of financial networks is determined through the utilization of minimum spanning trees (MST), as discussed in the seminal paper by [31]. The process of filtering effectively encodes the subdominant ultra-metric structures that exist within financial networks [35,36]. The MST filtration technique is a viable approach for extracting a spanning tree from the correlation distance matrix. In a similar vein, an alternative filtration technique is introduced in [37], which builds upon the correlation distance matrix approach but incorporates a greater number of edges compared to the MST method. The planar maximally filtered graph (PMFG) technique involves the addition of edges to the MST filtration. This is achieved by embedding the graph on a manifold with a specified genus, while ensuring that the filtered topology remains planar. The utilization of PMFG filtration offers a notable advantage in terms of preserving the key information pertaining to the original financial correlation network, while simultaneously excluding less pertinent connections [38,39]. This facilitates a more organized and lucid depiction of the interrelationships among the financial instruments. The enhanced network structure facilitates improved analytical capacities, thereby enabling the discernment of crucial interconnections and potential hierarchical arrangements within the financial network. Additionally, it facilitates the identification of latent patterns and correlations, thereby furnishing valuable insights for the optimization of portfolios and the management of risks. Moreover, the implementation of PMFG filtration yields a planar graph, thereby facilitating the visualization and subsequent analysis of intricate financial networks. This particular characteristic enhances the intuitiveness and accessibility of the fractal dimension analysis; hence, we use PMFG for the filtration of the correlation networks in this study.

3.2. Sentiment Analysis

A financial sentiment classifier was developed in this research by analyzing the affective states of users who were participating in discussions related to news texts. Without employing thresholding, economic news texts obtained from the public network were classified as “Positive”, “Negative”, or “Neutral” within the framework of this classifier, which is represented as a deep learning model. Furthermore, specialists performed the manual sentiment assignment of the text obtained from the public network. Following this, the optimal deep learning architecture was selected. By employing the deep learning approach, sentiment scores were generated for financial news.

3.2.1. Pre-Processing of Text Data

Several variables, including the complexities associated with agglutinative languages, the specific arrangement of Turkish, and potential inaccuracies in spelling, necessitate pre-processing for an accurate evaluation of data when inputting textual data into the deep learning process as vectors. Zemberek [40] stands as the preeminent Turkish library employed in the realm of natural language processing. Text normalization is the process of rectifying erroneous or corrupted words that have been written without adherence to the rules of language in the given text. Zemberek presents a methodology for text normalization that encompasses a fusion of pre-established principles, lookup tables, and rudimentary unigram/bigram probabilistic language models. By applying a comprehensive analysis to the given sentence, it discerns potential words that are prone to alteration. Furthermore, it yields the word sequence with the highest probability by employing the Viterbi decoder algorithm [41,42]. Given that the texts found on news sites typically undergo an editorial process, it is infrequent for them to exhibit issues pertaining to spelling errors. Nevertheless, this assertion does not hold true for individuals who engage in the act of providing a commentary on current events. In this study, it is important to note that both the news data and emotion learning data underwent pre-processing using the Zemberek library, despite the potential presence of an editorial error. In Figure 1, the text pre-processing framework is depicted.

3.2.2. Vectorization

The operational efficiency of machine learning methods is inversely proportional to the magnitude of the dataset when it is sufficiently large. Deep learning methods are employed in scenarios characterized by a substantial volume of data points. By employing this methodology, one can achieve a greater degree of success in obtaining the results. Deep learning, in contrast to machine learning, does not necessitate the process of feature extraction. This assertion posits that the utility of deep learning surpasses that of machine learning. The system employs a framework of artificial neural network architecture that relies on the principles of word embedding. Word embedding is a mathematical process that maps a word or phrase to vectors in the real-number space. Every word is initially represented as a vector with randomly assigned numerical values. The utilization of the GloVe word embedding model is employed in the current investigation. The vector matrices that arise from these models are employed in the embedding layer of the classification model that has been constructed. The global vectors for word representation (GloVe) can be described as an unsupervised mathematical model that aims to represent words by utilizing co-occurrence probabilities. This model was developed by the Stanford NLP group [43]. The measure of the relationship between the words w i and w j can be derived by calculating the ratio of their co-occurrence in relation to a given context word w k . The encoding of such a co-occurrence can be mathematically represented as a matrix X i j . The expected magnitude of the ratio
P w i | w k P w j | w k
is anticipated to be significant when considering the context pertaining to w i but not w j . Conversely, in the contrary scenario, the ratio is expected to be diminutive. Instead of considering probabilities, the model solely relies on the ratio as it provides a more comprehensive understanding of the concept of relatedness. The model under consideration employs a technique known as weighted least-squares regression. The summation of the occurrences of a word w i can be determined by evaluating the matrix X using
X i = k X i k .
Then, for the cut-off variable x m a x , it is possible to define the weighting function with
f ( X i j ) = ( X i j / x m a x ) α , if X i j < x m a x 1 otherwise .
In relation to the linearity of the model, the Euclidean distance metric is the most efficacious in identifying the nearest words.

3.2.3. Deep Learning Classification

Deep learning is a computational approach that involves the hierarchical representation of data through the utilization of multiple layers. The quantification of layers in deep learning serves as a significant criterion for assessing the neural network depth. The utilization of extensive datasets during the training phase, enhancements in hardware capabilities for processing large volumes of data, and advancements in deep learning models collectively contribute to the growing prominence and efficacy of deep learning methodologies. The present study employed convolutional neural networks (CNNs), a deep learning model, to ascertain the sentiment score of news data.
CNN is widely recognized as a pivotal framework within the field of deep learning. It is a sophisticated multilayer feedforward neural network model [44]. CNN employs a spatial principle to extract features from the data. The utilization of two-pixel values in interconnected images has been observed to enhance the classification performance of CNN when applied to image data. The CNN architecture, traditionally employed for image analysis tasks, has recently found application in text classification problems [45,46,47,48].
The CNN architecture primarily comprises three fundamental layers: convolution, pooling, and fully connected layers. In contrast to conventional artificial neural networks, the convolution layer facilitates automated feature extraction while employing the pooling layer to achieve feature reduction. The CNN architecture utilized in this study is depicted in Figure 2, illustrating its overall structure. Within the convolution layer, a diverse array of filters is employed to effectively extract salient features from the input text. The intermediate processing is employed within the convolution layer and pooling layers. The features derived through the utilization of the rectified linear unit (ReLU) activation function exhibit nonlinearity. This feature facilitates the reduction in match sizes within the pooling layer. Consequently, the computational burden is diminished in subsequent layers, leading to a more efficient extraction of textual features. The final layer of the convolutional neural network is implemented as a traditional fully connected artificial neural network. Within this particular layer, the representation of text and target class labels is established through a comprehensive and interconnected structure of artificial neurons. The provided text is utilized as an input for the CNN. Upon completion of training, the CNN provides the predicted class probability [44,49].

3.3. Fractal Dimensions

Fractal dimensions serve as a statistical metric employed to characterize the intricacy of a self-similar geometric entity, effectively quantifying the alteration in the level of intricacy as the scale is modified. Within the domain of time series analysis, fractal dimensions offer valuable insights into the fundamental dynamical processes that give rise to a given time series. This analytical approach provides a distinct perspective for examining and understanding intricate systems such as financial markets, environmental data, and other complex phenomena. Fractal dimensions are utilized in network theory to characterize the structural and connectivity aspects of various networks, encompassing social, biological, and technological networks. They serve to facilitate the comprehension of the intrinsic attributes of networks, thereby assisting in the process of designing and improving network robustness and reliability. Fractal dimensions provide a reliable means of quantifying the intricacy and self-repeating characteristics of objects, networks, and time series data. Multiple techniques are utilized to calculate these dimensions. The box counting method, frequently employed in the field of image and signal analysis, entails superimposing non-overlapping boxes of different sizes onto the object under examination. The aim is to determine the number of boxes required to completely cover the object and to analyze how this count varies with the box size. Furthermore, the utilization of the information dimension extends to various contexts such as signal processing and network analysis. In these domains, the fractal dimension is determined by analyzing the probability distribution of observed data across different scales. The utilization of a range of computational methods offers a comprehensive and multifaceted approach to gaining insights into the fractal characteristics and underlying complexity of diverse systems and phenomena. This aids in conducting thorough analyses and enhancing our understanding of their intricate behaviors.
The box counting method is a well-established mathematical technique utilized for the calculation of the fractal dimension for both time series and networks [20,50,51]. When considering time-series data or networks, the underlying principle remains invariant. Let N ( ε ) denote the cardinality of the set of boxes, each with side length ε , which is required to achieve the complete coverage of the time series plot or network. The box counting dimension, denoted by D b , is subsequently ascertained utilizing the equation:
D b = lim ε 0 log ( N ( ε ) ) log ( 1 / ε ) .
In the realm of time-series analysis, this particular approach entails the act of graphically representing the time series data within a phase space and subsequently overlaying it with boxes of dimension ε . In the realm of networks, the entities known as nodes and edges are encapsulated within boxes that possess identical dimensions. Let ε be a variable that decreases. It is observed that N ( ε ) exhibits scaling a behavior, allowing for the determination of the fractal dimension D b . This computation yields a priceless measure for comprehending the intricacy and scaling attributes of time series and networks, by furnishing a numerical dimension that characterizes their fractal essence.
The information dimension ( D 1 ) is a significant approach for computing fractal dimensions which can be applied to both time series and networks. It is founded upon the examination of the probability distribution of data across various magnitudes. Let us consider p i ( ε ) as the probability function denoting the likelihood of an arbitrary point being contained within the i-th box, characterized by a side length of ε . This particular box is responsible for covering the object under consideration, be it a time series plot or a network. The information dimension D 1 is mathematically defined as follows:
D 1 = lim ε 0 i = 1 N ( ε ) p i ( ε ) log ( p i ( ε ) ) / log ( ε ) .
The object of interest is typically depicted within a phase space. Conversely, in the domain of networks, the object is visually represented through a graphical depiction. The probability p i ( ε ) can be expressed as the quotient of the cardinality of the set of points in the i-th box and the cardinality of the set of all points. D 1 elucidates the scaling properties and intricacy of time series and networks through the investigation of the distribution and density of data across different scales. This facilitates a thorough examination of their fractal attributes and innate properties.
The examination of fractal dimensions pertaining to time series and network data types, through the utilization of the box counting and information dimension techniques, aims to elucidate the intrinsic intricacy and self-replicating characteristics within datasets. Both methods essentially strive to determine the fractal dimension, a crucial parameter that indicates the self-similarity and complexity of the data. The fundamental objective that unifies their collective focus is the investigation of scaling behavior in relation to the box dimension or the level of resolution.
Nevertheless, disparate methodological approaches distinguish these two techniques. The box counting method involves conducting a geometric examination, wherein the given data are partitioned into boxes of side length ε . The objective is to determine the count ( N ( ε ) ) required to completely cover the entire dataset. The method is exemplified by the mathematical expression presented in the Equation (7), which offers a comprehensive geometric understanding of the fractal properties of data by examining the behavior of the space-filling attribute as the variable ε undergoes variation. In contrast, the method of information dimension embarks upon a probabilistic trajectory, with a focus on the probability distribution across diverse boxes and scales. The Equation (8) represents the examination of the information content or entropy in relation to changes in ε .
The dichotomy in the approach bestows distinct data insights. The box counting method provides a thorough comprehension of the geometry, while the information dimension reveals the density and distribution of data, yielding a more intricate and probabilistic understanding, albeit with potentially complex calculations.

4. Results

4.1. Datasets

The selection of the analysis date was predicated upon the year 2020, as it represents the present temporal epoch wherein the entirety of news can be procured. Furthermore, this choice was motivated by the conspicuous presence of fervent news and consequential advancements pertaining to the COVID-19 pandemic, which exerts a substantial influence upon financial markets at both the domestic and international levels.
The BIST Stars segment holds substantial prominence within Borsa Istanbul, which serves as Turkey’s primary stock exchange. The composition of this group consists of firms that strictly adhere to rigorous financial and corporate governance standards, thereby guaranteeing a notable degree of transparency and dependability in their operations and reporting. The primary objective of the BIST Stars segment is to enhance the prominence and ease of access for investors to listed companies by differentiating entities that exhibit a steadfast dedication to sound corporate governance principles. The inclusion of companies in this segment indicates their adherence to the comprehensive principles established by the Capital Markets Board of Turkey. The BIST Stars segment effectively bolsters investor confidence through its implementation of consistent and transparent communication protocols from the listed companies. Consequently, this initiative fosters a heightened sense of stability and dependability within the Turkish financial market, thereby cultivating a more reliable investment environment. It assumes a pivotal function in directing investment choices by providing a distinct platform for companies that demonstrate operational excellence, transparency, and compliance with the regulatory framework, thereby potentially enhancing their appeal as investment alternatives. The analysis considered the daily closing prices of companies listed in the BIST Stars segment during the period from 1 January 2020 to 31 December 2020. The temporal interval in question encompasses a total of 252 business days. Accordingly, a collection of 108 time series comprising 252 data points was acquired. The tabular representation of the statistical summary for the given dataset can be observed in Table A1.
In this study, we opted to utilize comments pertaining to financial news as a dataset for the purpose of sentiment learning. The aforementioned remarks have been gathered from the comment sections of the “finance.mynet.com” website, a platform frequently visited by Turkish users seeking economy-related news. While news data typically lack explicit sentiments such as positivity or negativity, user comments following news articles can be more distinctly categorized as positive, negative, or neutral in online commentary medium. The dataset was utilized during the training phase within the framework of the deep learning process. The classification of emotions in news data was conducted utilizing data characterized by a high degree of precision. While there exists a multitude of sentiment dictionaries available for the Turkish language, it is worth noting that these resources frequently lack the inclusion of economic-related terminology. In the course of the research endeavor, a grand total of 878,345 news comments were amassed, and subsequently classified as either positive (1), neutral (0), or negative ( 1 ). Out of the total comments analyzed, it was found that 5063 comments exhibited a positive sentiment, while 4148 comments were categorized as neutral, and a significant majority of 869,134 comments were identified as negative. The acquired dataset reveals a significant disparity in class distribution, indicating a pronounced issue of class imbalance. This observation indicates a propensity among users to express unfavorable sentiments within the realm of online commentary. It is advisable to consider addressing this trend through various empirical investigations. The re-evaluation of news comment data categorized as negative was undertaken with the objective of rectifying the existing class imbalance. The act of tagging was subjected to re-evaluation by a quartet of finance scholars, wherein it was ascertained that all individuals encompassed within the dataset were assigned the negative tag. Following the aforementioned procedure, a cumulative count of 4988 instances of news comment data classified as negative was acquired. Figure 3 depicts the histogram distribution of the aforementioned labels. Based on the observed histogram distribution, it is evident that the class distribution exhibits a state of equilibrium.
In accordance with the economic section of “Dünya Newspaper”, a publication that specializes in disseminating news pertaining to the economy, an exhaustive compilation of all news articles published on the newspaper’s website between the dates of 1 January 2020 and 31 December 2020 was meticulously undertaken, with each text being diligently documented. In the given temporal span, a cumulative count of 714 news articles was identified. Figure 4 depicts the daily fluctuations in the quantity of economic news articles.

4.2. Results on Correlation Networks

In this study, the application of PMFG filtering follows the creation of correlation networks utilizing time-series data derived from the trading days of companies within the BIST Stars segment throughout the year 2020. The time-series data for each company consist of 252 observations. The application of sliding windows to the time series facilitated the examination of the fluctuation in the fractal dimension of the filtered network. This analysis allowed for the observation of the dynamic interaction model among the actors. The selection of sliding window widths, specifically 5 and 10, was made in order to incorporate both weekly and bi-weekly time intervals. The window sliding step for both cases was chosen to be 1 day. Through the implementation of a 5-day wide sliding window, a total of 247 sub-time series were derived for each company. Similarly, employing a 10-day wide sliding window yielded a total of 242 sub-time series for each company.
This section presents the local and global measurements of the networks in order to observe the structural characteristics of the resulting filtered networks. In the network analysis, the metrics of global efficiency and the mean of the weighted clustering coefficient serve as valuable tools for quantifying the distinct facets of network topology.
Global efficiency ( E f g l ) is a quantitative metric employed for the purpose of evaluating the efficiency of information exchange within a network. The metric is calculated by taking the mean of the reciprocal of the shortest path length between every pair of nodes within the network. In mathematical terms, it is formally defined as:
E f g l = 1 | V | ( | V | 1 ) i j 1 γ i j ,
where γ i j is the shortest path between nodes i and j. Through the utilization of quantitative analysis, it is possible to derive the global efficiency of a financial market network. This measure provides valuable insights into the level of market integration, allowing for an evaluation of the effectiveness with which information or assets are exchanged within the market. A greater level of global efficiency is indicative of a market that is more extensively interconnected, facilitating the unrestricted flow of information between various entities.
The evaluation of the extent to which nodes in a network cluster together, while considering the weights of edges, is accomplished through the utilization of the mean of the weighted clustering coefficient ( C ¯ w ). The computation involves determining the mean value of the weighted clustering coefficient across all nodes within the network with
C ¯ w = 1 | V | C w ( i ) .
The variable C w ( i ) represents the weighted clustering coefficient associated with node i. The calculation of the weighted clustering coefficient for each node involves taking the geometric mean of the subgraph edge weights associated with the neighboring nodes with
C w ( i ) = 1 d i ( d i 1 ) j , k w i j w i h w j h 1 / 3 ,
where d i represents the degree of node i and w i j represents the weight of the edge between nodes i and j.
This metric offers valuable insights pertaining to the localized structure of the financial market network. A network with a high mean weighted clustering coefficient suggests a significant level of interconnectivity, where entities tend to form tightly knit groups. The observed phenomenon may suggest a level of resilience within the market, as it is probable that the entities involved engage in information sharing and exert mutual influence on one another’s actions. The global and local measures for different sliding time windows are presented in Figure 5 and Figure 6.
Table 1 displays the autocorrelation test results for the network topological measures.
Fractal analysis provides a distinct vantage point for investigating intricate networks, emphasizing their hierarchical structure and scaling characteristics. The filtered correlation networks obtained for each sliding window were analyzed to examine the variation in the fractal dimension. Figure 7 illustrates the fractal dimensions of networks that have emerged within windows of width 5, as determined through the utilization of box counting and information dimension methodologies. In a similar vein, Figure 8 showcases the fractal dimensions of networks that emerged within windows of width 10 through the utilization of the same methods.
Table 2 displays the fundamental statistical measures for the network fractal dimensions.

4.3. Results on Sentiment Analysis

The present study utilizes comment texts from chosen financial news articles as data for sentiment learning. The sentiment scores of “Dünya Newspaper” news are determined using a CNN deep learning architecture in conjunction with the GloVE embedding method. In the context of training deep networks, it is worth noting that the distribution of class instances was taken into account. Specifically, 80% of the comment text data were allocated for training purposes, while the remaining 20% were reserved for testing. The confusion matrices acquired for this method are displayed in Figure 9.
A vector family is derived by mapping each word, in the context of a sentence within a news text, onto a d-dimensional Euclidean space following the process of text pre-processing. While each word in a sentence undergoes pre-processing and is embedded in the same dimensional vector space, the vector numbers of the sentences vary due to the differing word counts across sentences. In a similar vein, it should be noted that the distribution of sentences within the entirety of the news text is not uniform. To calculate the sentiment score of the news text, the sentences within the text are initially parsed. Subsequently, the vector expression of each sentence is computed by summing the vector representations of the words present in the sentence. The GloVE+CNN method assigns vector representations of the sentences with values of 1 , 0, or + 1 , corresponding to their negative, neutral, or positive sentiments, respectively. The aggregate of emotional states exhibited in each sentence of the news text yields the cumulative emotion score for said news text. It is observed that the quantity of news texts published on any given day varies, similarly to the variability in the number of sentences within a news text. The daily average of the total scores derived from the sentences of each news item on the day of sentiment analysis should be given due consideration. Furthermore, it is worth noting that the sentiment score assigned to the day in question, during which the news article was not published, was classified as neutral with a score of 0. Figure 10 displays the time-series data representing the average daily sentiment scores of economic news.
The examination of temporal fluctuations in the sentiment scores of economic news articles has the capacity to reveal intricate patterns and correlations, thereby enhancing our comprehension of economic trends and phenomena. In the given context, the primary objective of this paper is to quantitatively determine the fractal dimension of a time series dataset. The dataset in question pertains to sentiment scores associated with economic news. To achieve this, the study employs the methodologies of box counting and information dimensions. The box counting method is a quantitative approach that examines the relationship between the number of occupied boxes and the size of the box. This analysis offers valuable insights into the space-filling properties of the time-series data. In contrast, the dimension of information evaluates the likelihood distribution of data, providing insight into the intricacy and uncertainty of the economic sentiment as it evolves chronologically. The fractal dimension of the given time series is determined using the sliding window approach, which has been previously employed in network analysis. Figure 11 presents the fractal dimensions acquired through the utilization of a sliding window with a width of 5. Conversely, Figure 12 showcases the fractal dimensions obtained by employing a sliding window with a width of 10. Both the box counting and information dimension methods are employed for both cases.
Table 3 displays the fundamental statistical measures for the time-series fractal dimensions.

5. Discussions

The objective of this study was to investigate the complex connections between the sentiments expressed in economic news and the correlation networks among enterprises in the BIST Stars segment. The fluctuation of economic sentiment frequently mirrors larger macro-economic factors and investor views, hence exerting significant impacts on stock market dynamics. Through the utilization of fractal dimensions as a framework of analysis, our objective is to comprehensively grasp the intricacies and diverse characteristics of these relationships. The fractal dimension is a valuable metric for assessing the level of irregularity and complexity. It provides a detailed comprehension of how economic news feelings can propagate and influence the interdependent network of corporate relationships inside the BIST Stars segment. In the following sections, we conduct a more comprehensive analysis of the implications derived from our findings.
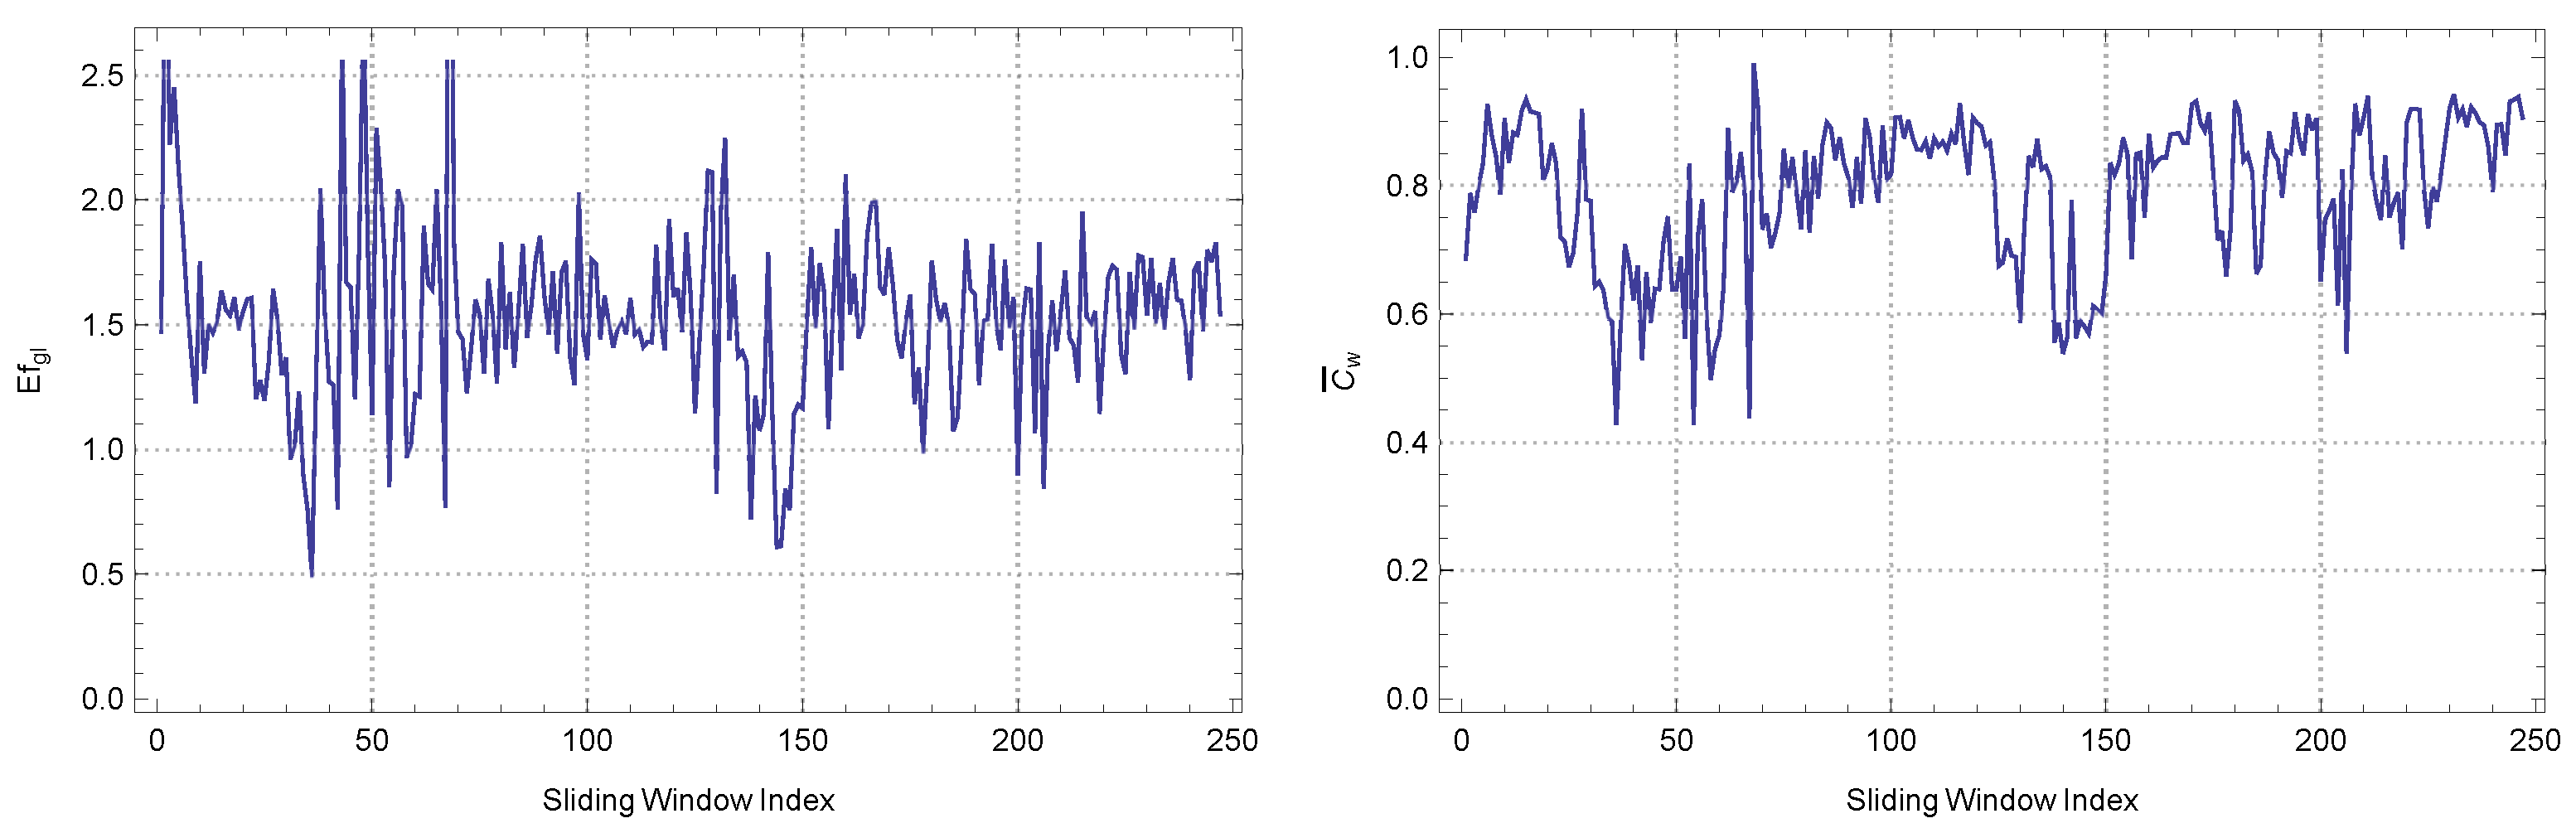
The examination of correlation networks among enterprises within the BIST Stars section for the year 2020, employing sliding windows of widths 5 and 10, yielded significant findings pertaining to the evolving topological configuration of these networks. In Table 1, we present autocorrelation results for the local and global measures concerning different sliding time windows sizes.
The global efficiency measure, which assesses the network’s capacity to efficiently exchange information, exhibited a negligible autocorrelation value of 0.001076 when analyzed using a sliding window of width 5. This finding indicates that the global efficiency of these networks displayed apparent randomness when observed over this shorter time period. In a similar vein, the autocorrelation values of both the global efficiency and the average weighted clustering coefficient for the sliding window of width 10 exhibit values that are close to zero, albeit extremely small. This finding further supports the idea of swift topological transformations occurring across consecutive time frames. It is worth mentioning that the average weighted clustering coefficient has an extremely low autocorrelation for both window widths. This is particularly evident in the case of the 10-width window, where the value of 3.3948 ×   10 110 highlights a remarkably active local clustering structure. This implies that the interconnections and interdependencies among enterprises in the BIST Stars segment had substantial variations over the course of the year, suggesting that the network’s topological structure was not stable over the time periods examined. The observed variability may be indicative of the fundamental economic, political, or sector-specific occurrences that exerted an impact on the interconnections among these corporations over the year 2020.
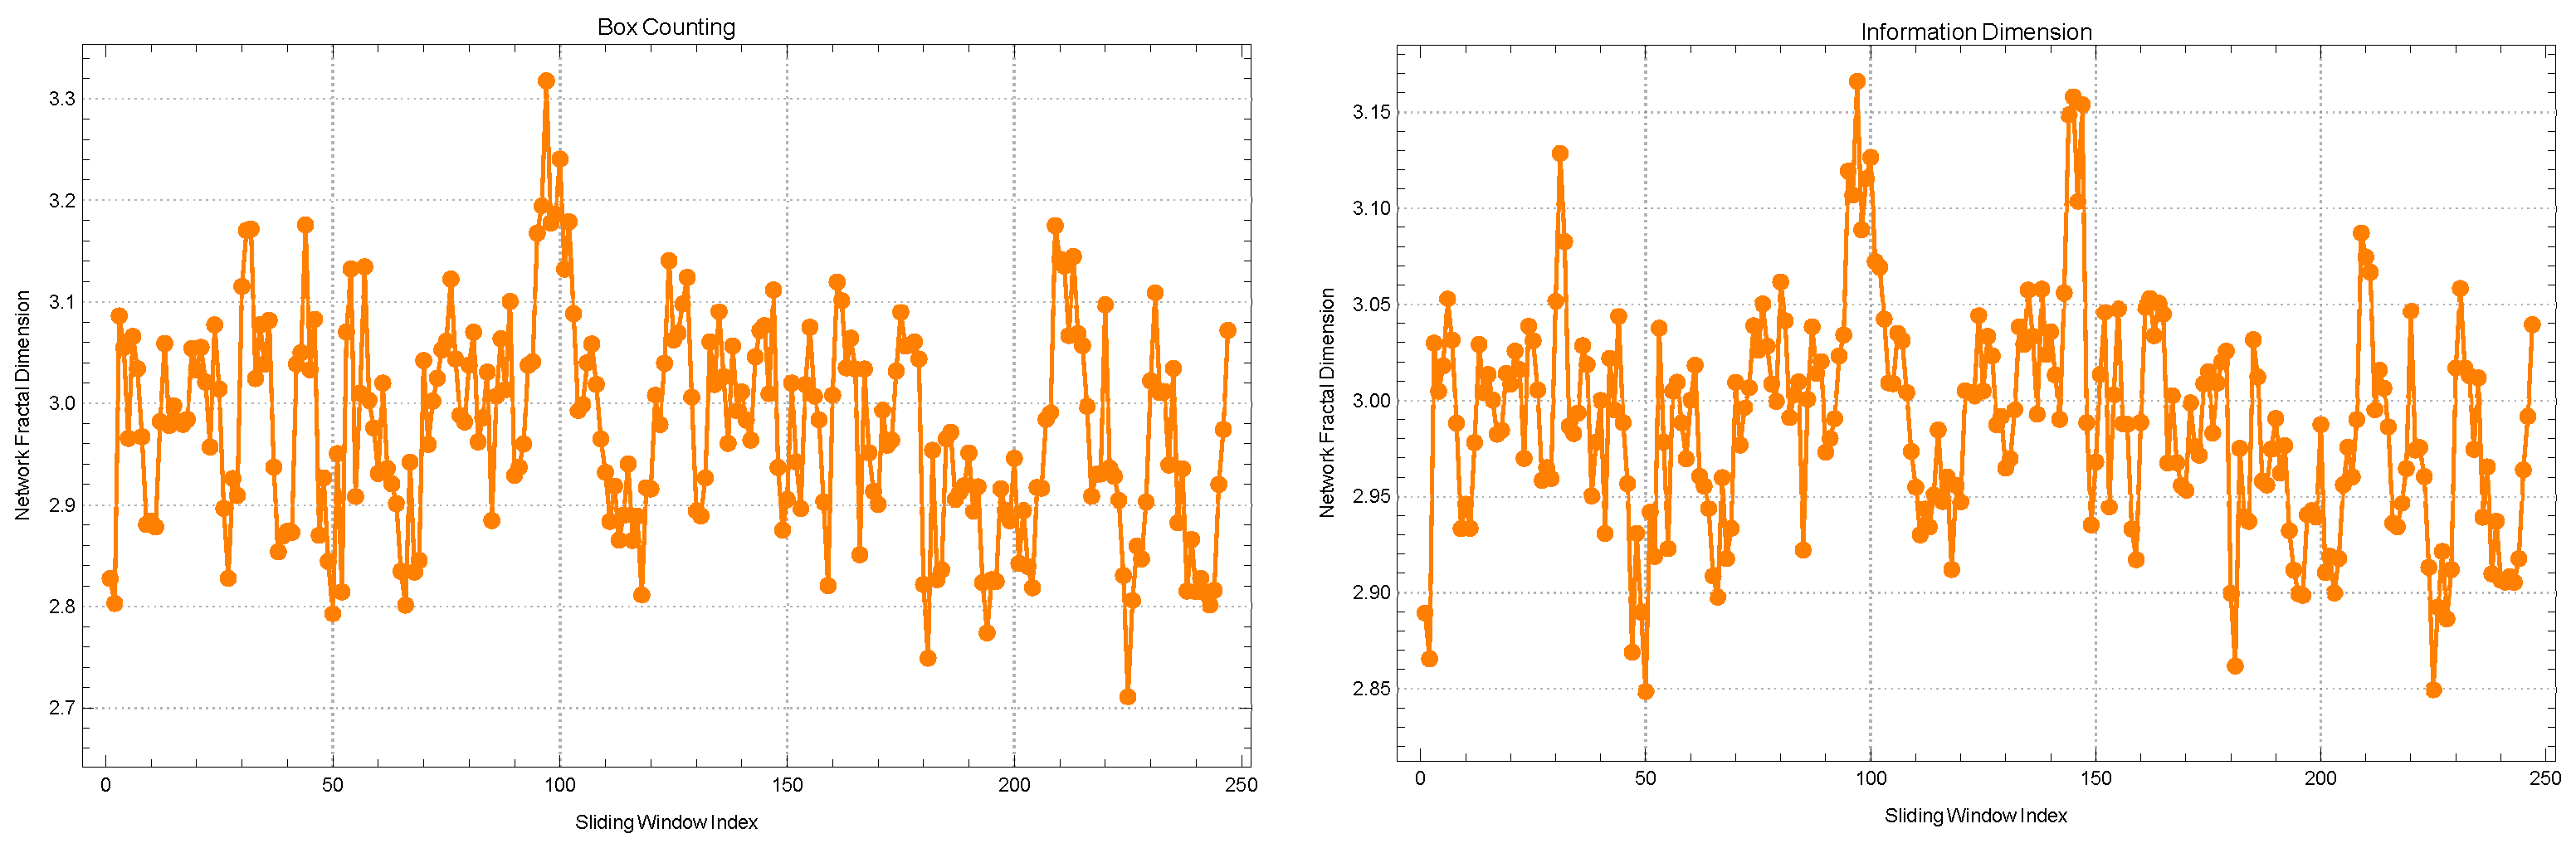
The examination of correlation networks among companies traded in the BIST Stars segment during 2020 involved the utilization of sliding windows with widths of 5 and 10. Notably, distinct observations were made when evaluating the alterations in fractal dimensions through two different methods: the box-counting method and the information dimension method, as outlined in Table 2.
Based on the application of the box-counting method, it has been observed that the average change in fractal dimensions is calculated to be 2.97603 . This value suggests a relatively high level of complexity within the networks under consideration. The observed standard deviation of 0.102647 indicates a moderate level of variability in the complexity observed across various time slices. This variability could potentially be attributed to the changing dynamics of the market. The kurtosis value of 2.73689 and the skewness value of 0.14067 contribute to the overall characterization of this narrative by providing measures of the distribution’s shape and asymmetry. The observed kurtosis value, which is slightly less than 3, indicates that the distribution of these changes demonstrates a lower degree of “tailedness” and “peakiness” compared to a standard normal distribution. The observed positive skewness, although relatively small in magnitude, indicates a subtle tendency of the distribution to lean towards higher values of fractal dimensions. The autocorrelation value of 3.22183 ×   10 38 is remarkably low, indicating a lack of correlation between the fractal dimensions obtained in consecutive time windows. This observation supports the notion of a dynamically changing topological structure within the 5-width window.
Upon transitioning to the information dimension method, it is worth noting that a marginally elevated average fractal dimension of 2.98858 is observed. The incrementally greater value suggests that the information dimension method may potentially capture a slightly more intricate network complexity compared to the box-counting method within this particular context. The observed standard deviation of 0.0565154 indicates a relatively lower level of variability in the fractal dimension values obtained from different windows using the specified methodology. The observed kurtosis value of 3.49575 surpasses that obtained through the box-counting method. This suggests that the distribution in question exhibits a higher degree of “peakiness" or leptokurtosis when compared to a normal distribution. Consequently, there is potential for the presence of more extreme values within this distribution. The positive skewness value of 0.287069 indicates a distribution with a slightly more pronounced right tail. This suggests that there may be a few instances where the fractal dimension was exceptionally high during certain time windows. The autocorrelation coefficient for this particular method exhibits an extremely small value of 2.41392 ×   10 128 , indicating an exceedingly minimal level of temporal correlation between successive windows.
In summary, it can be observed that both methodologies demonstrate a notable fractal dimension, suggesting an intricate interconnectedness among companies within the BIST Stars segment. However, when considering the variance, distribution shape, and autocorrelation, it becomes apparent that the market exhibits swift and intricate changes in its correlation structure throughout the analyzed timeframe of 2020.
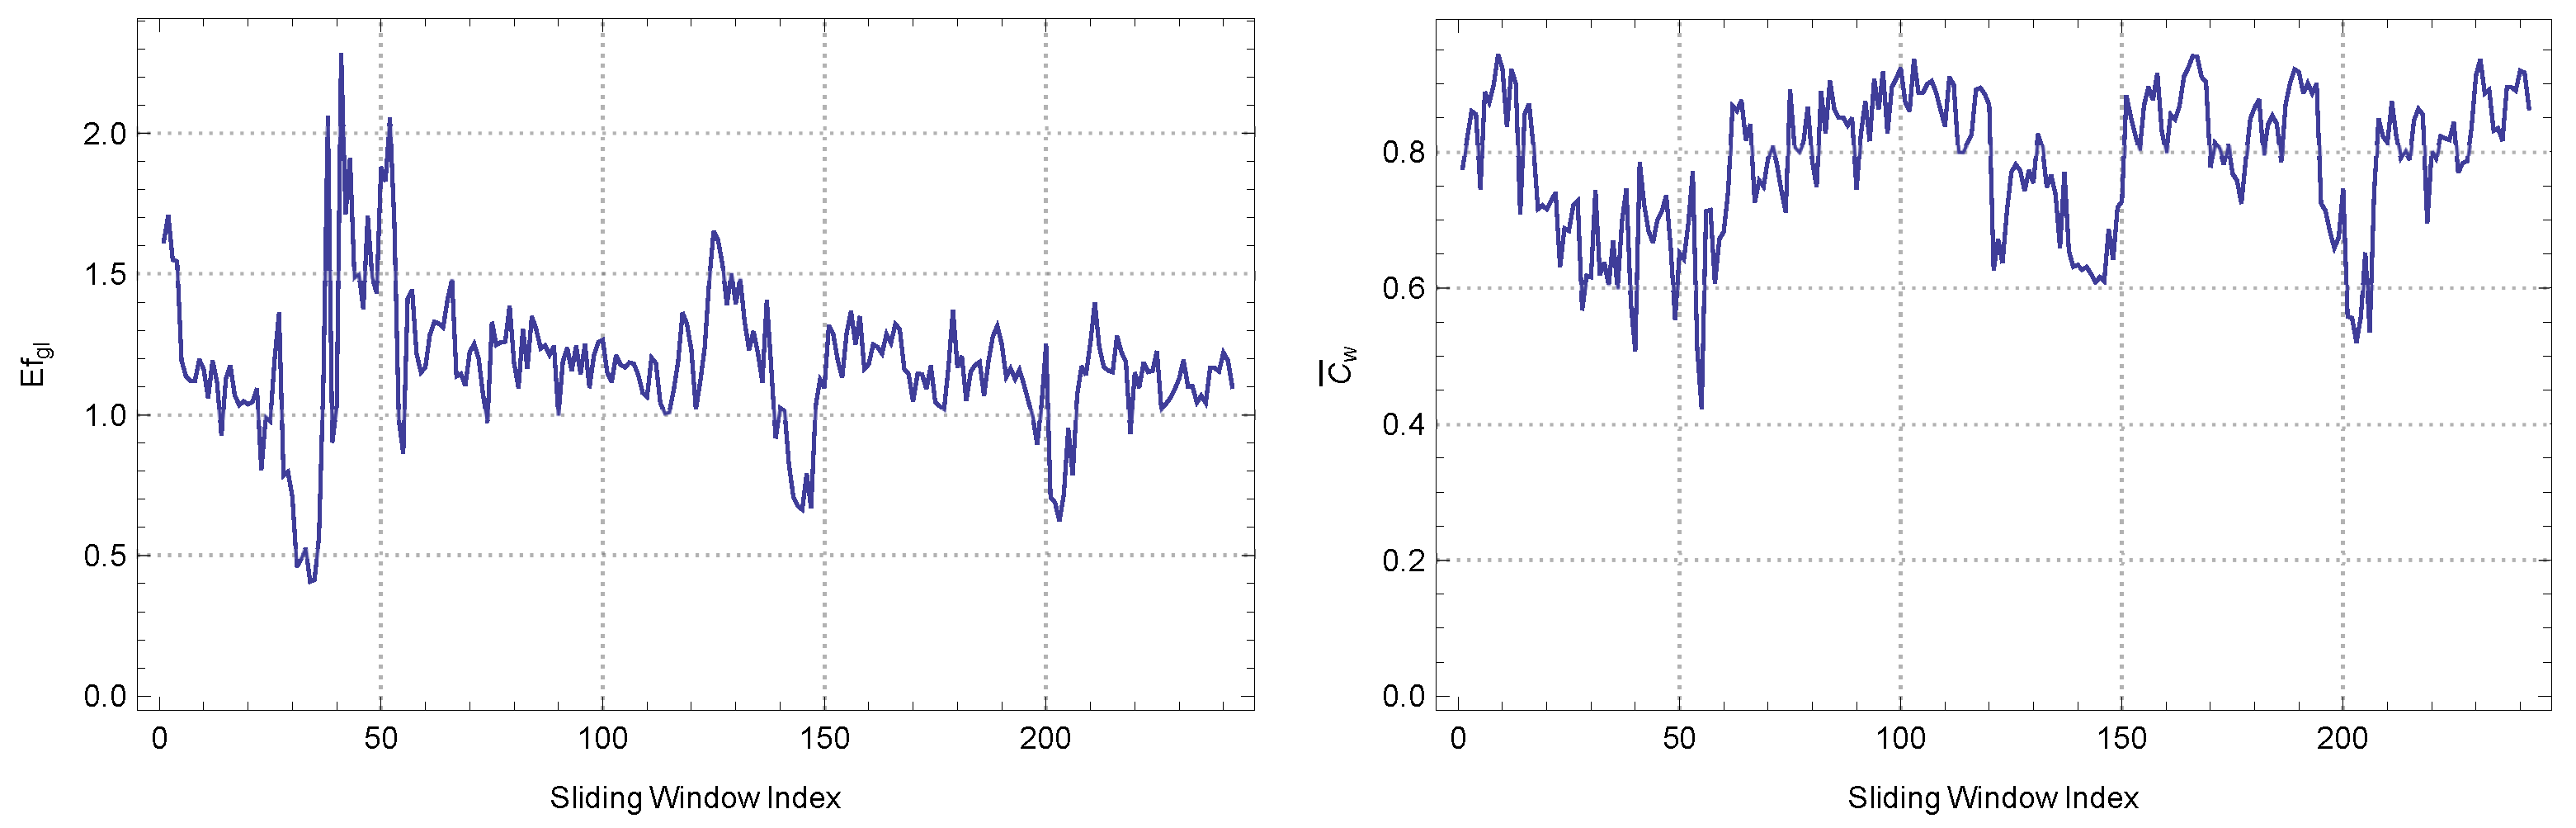
When the analysis is expanded to a sliding window of width 10 for the correlation networks of companies in the BIST Stars segment for the year 2020, certain patterns of continuity and variation become apparent in the fractal dimensions as determined by both the box-counting and information dimension methods.
Utilizing the box-counting method, the computed average fractal dimension is recorded as 2.98239 , exhibiting a slight increase in comparison to the value obtained from the 5-width window. The observed data indicate a persistent and elevated degree of intricacy in the interconnectedness of the companies, even when considering an extended time period. The observed decrease in the standard deviation to 0.077086 , when compared to the 5-width window, suggests a higher level of uniformity in complexity across these wider windows. This could potentially show more consistent market dynamics over these longer time periods. The current kurtosis and skewness values are 3.55735 and 0.476812 , indicating an increase compared to the previous sliding window. The observed increase in kurtosis suggests a distribution that is even more leptokurtic, namely the presence of a few periods characterized by significant deviations from the mean fractal dimension. The observed positive skewness indicates a tendency for the deviations to be more pronounced towards the higher values, suggesting the presence of a few instances characterized by particularly complex correlation networks within certain time frames. The autocorrelation value of 1.13294 ×   10 119 is exceptionally low, aligning with the observation of swift topological alterations detected in the shorter sliding window.
In relation to the information dimension method for the 10-width window, it is observed that the average fractal dimension experiences a slight increase, reaching a value of 2.99146 . The slight increase, similar to the previous set, could potentially be attributed to the method’s ability to detect and capture the subtle intricacies of network complexity. The observed standard deviation of 0.0504829 indicates a high level of consistency in the data, suggesting that the values are tightly clustered around the mean. This level of clustering appears to be even tighter when compared to the shorter sliding window. The kurtosis and skewness values, specifically 3.21884 and 0.471767 , respectively, indicate that the distribution, although slightly affected by the 5-width window, still exhibits a leptokurtic shape with a slight rightward tail. The autocorrelation value registers a negligible variation, of approximately 2.41392 ×   10 128 , highlighting the persistent and evolving characteristics of the market during the extended time period.
Upon synthesizing the aforementioned findings, it can be observed that the utilization of a 10-width sliding window provides insights into the topological structure of the BIST Stars segment in the year 2020. This structure exhibits a level of intricacy and dynamism that is comparable to what is observed when employing a 5-width window. However, the presence of subtle nuances, particularly the persistent fractal dimensions, provides valuable insights into the potential stability of market dynamics over extended periods of time.
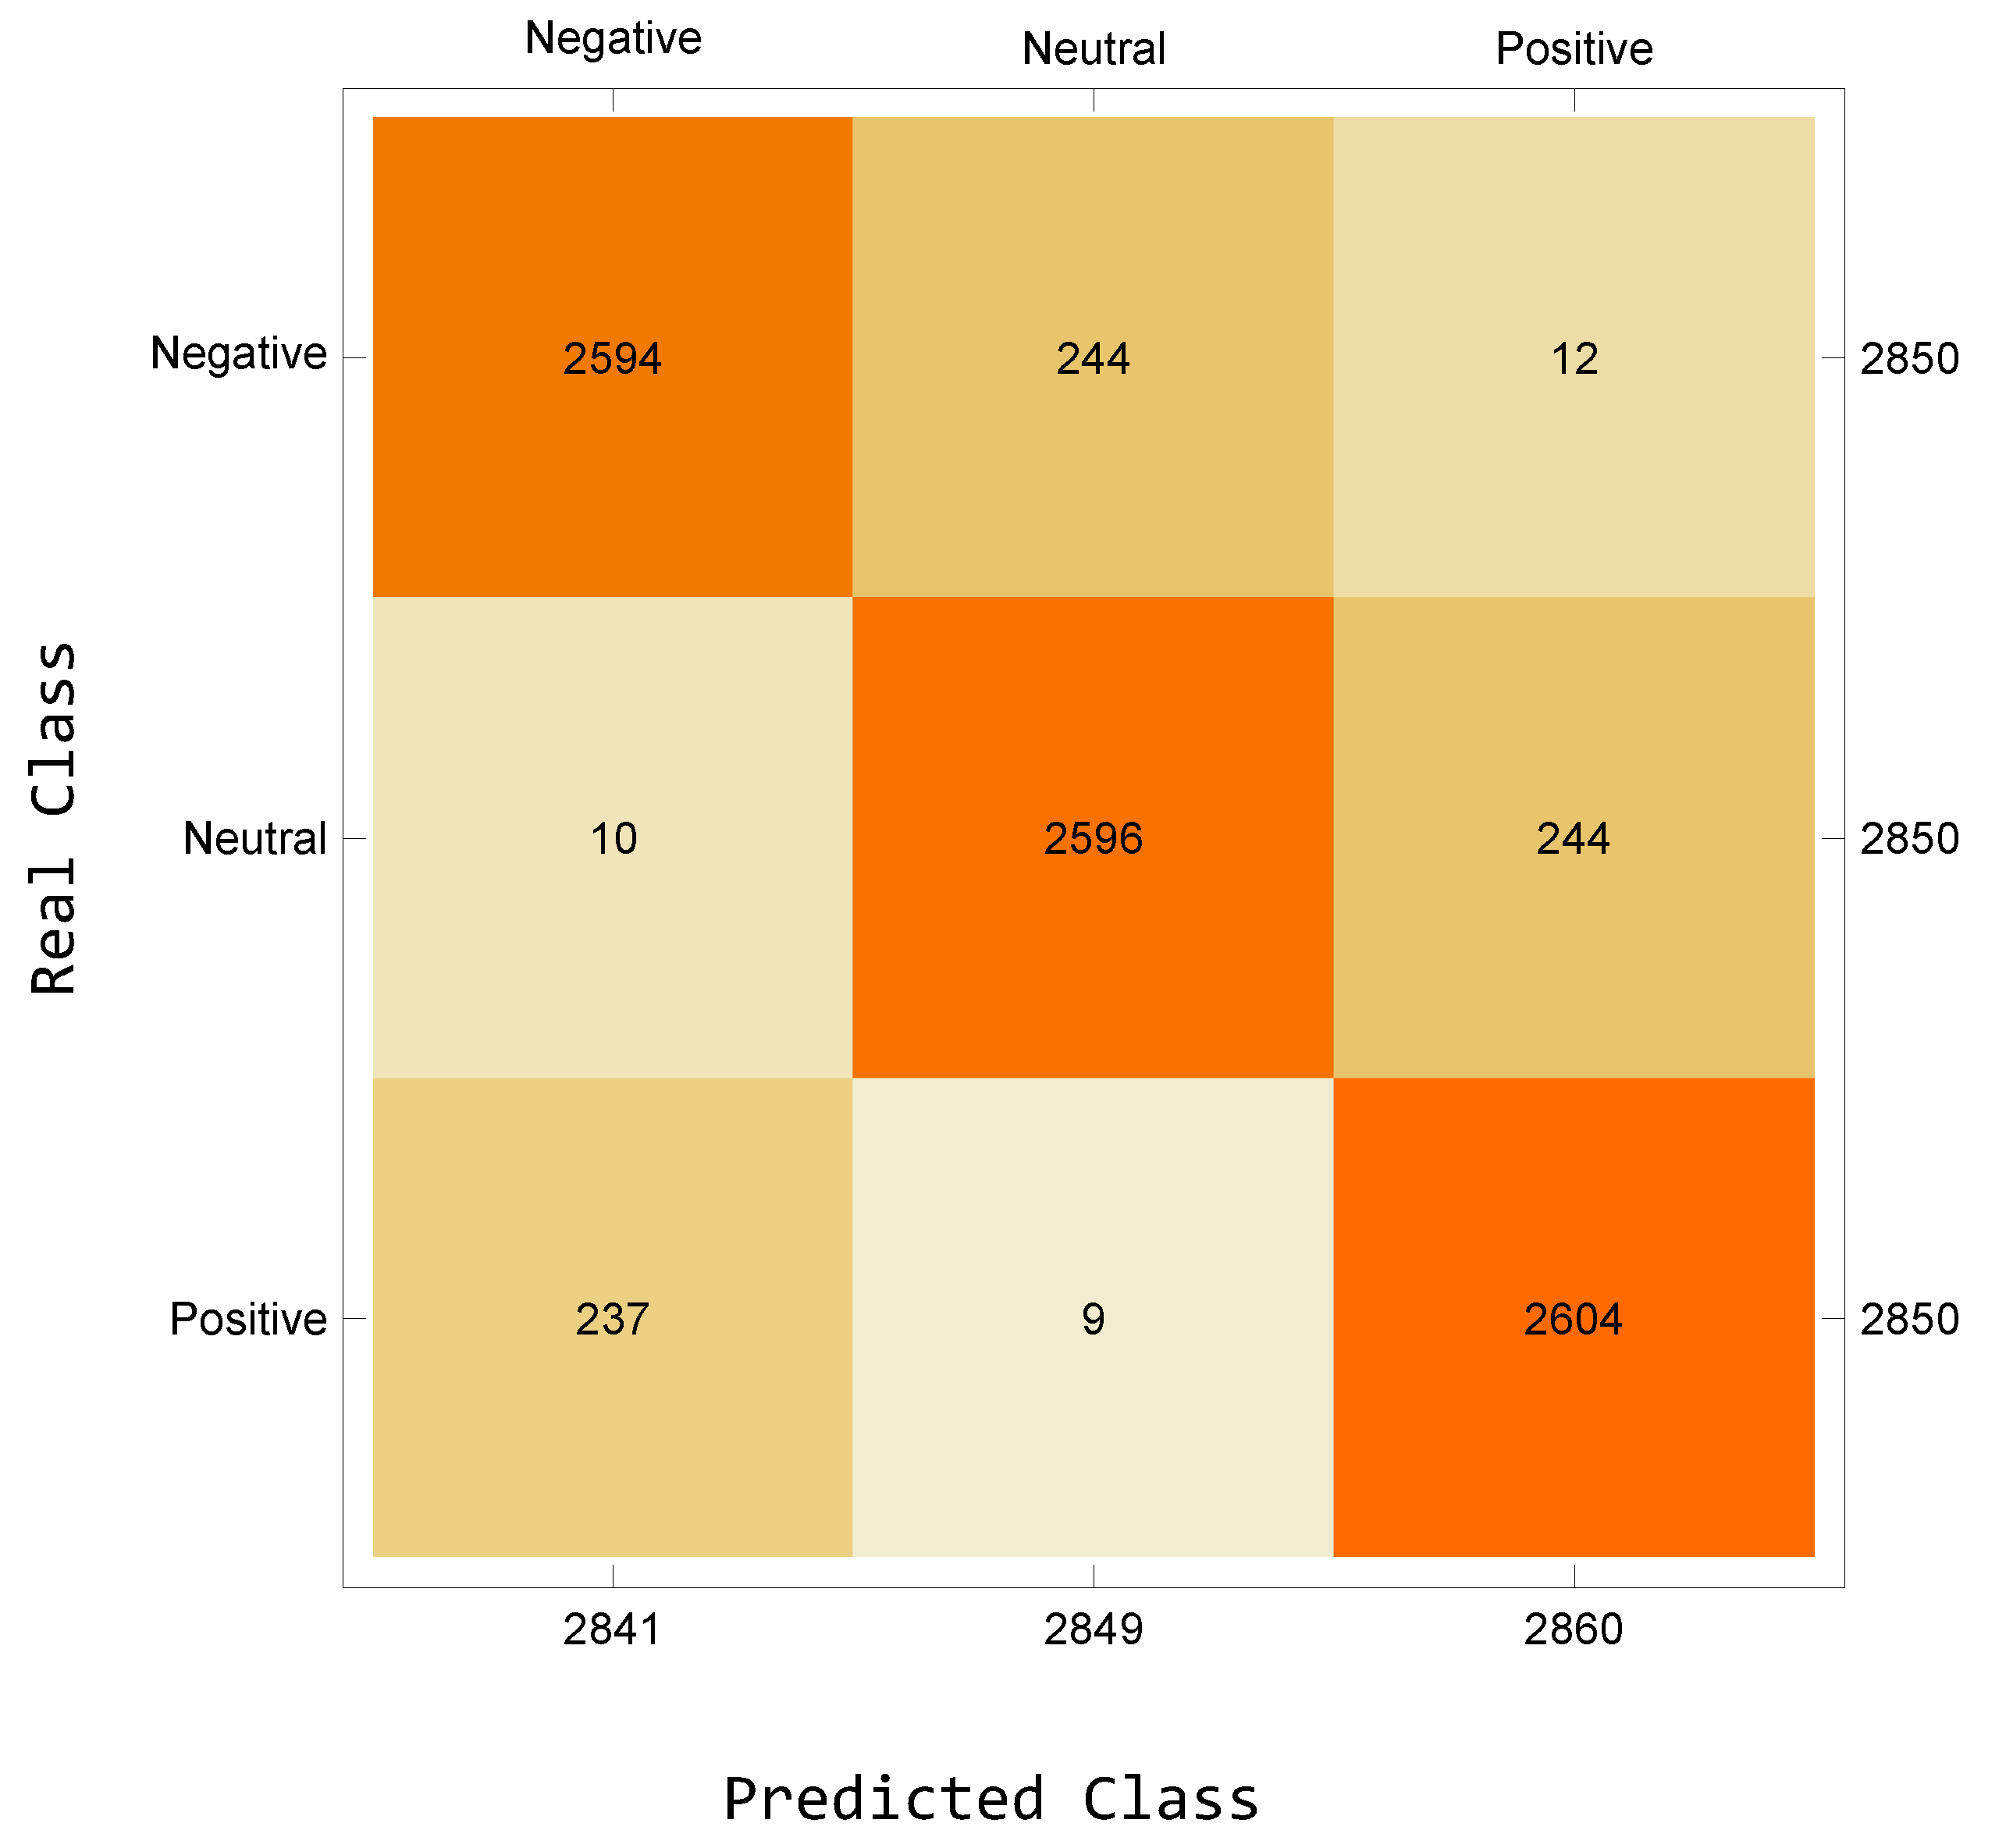
The study involved training a deep learning network to determine sentiment scores by utilizing GloVE embedding and CNN network. The confusion matrix depicted in Figure 9 presents the classification outcomes of the network that underwent training using user comments obtained from the general network. Based on the obtained results, the accuracy of the trained network is determined to be 0.9116 . Additionally, the precision is calculated to be 0.9102 , the recall is measured at 0.8384 , and the F1 score is computed as 0.8728 . The results indicate that the network, once trained, can be utilized with efficacy in the assessment of sentiment scores for news articles.
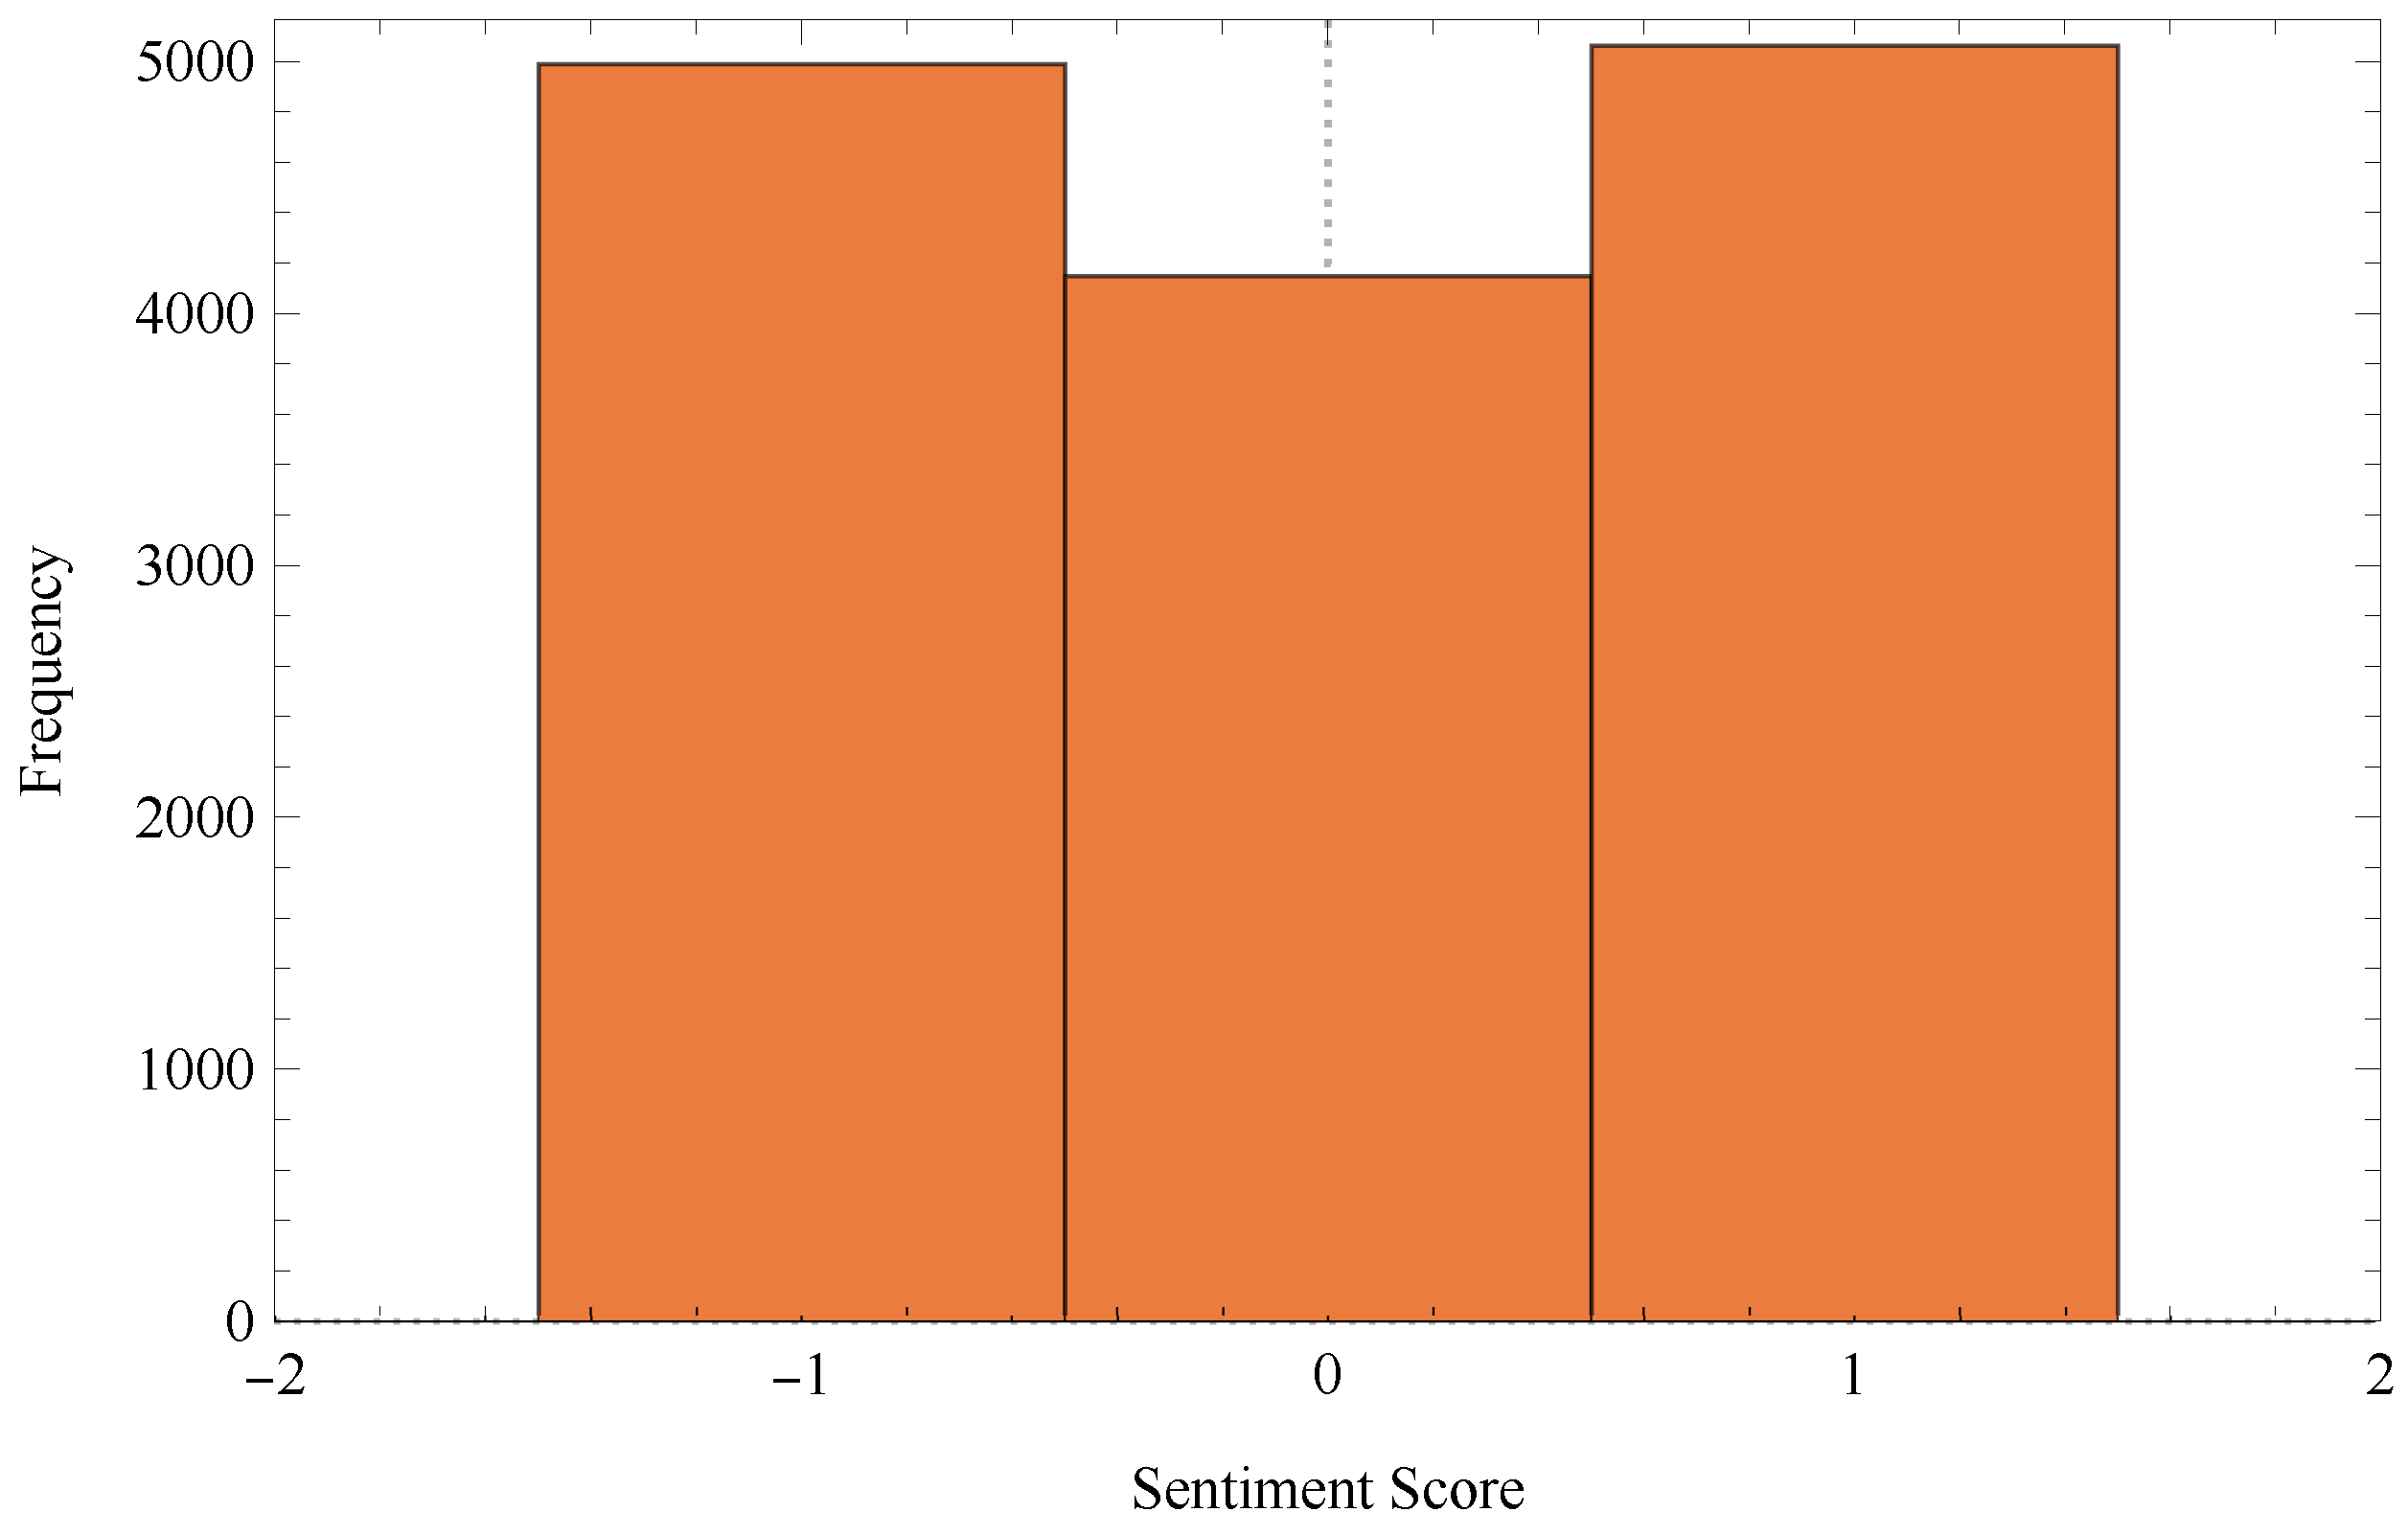
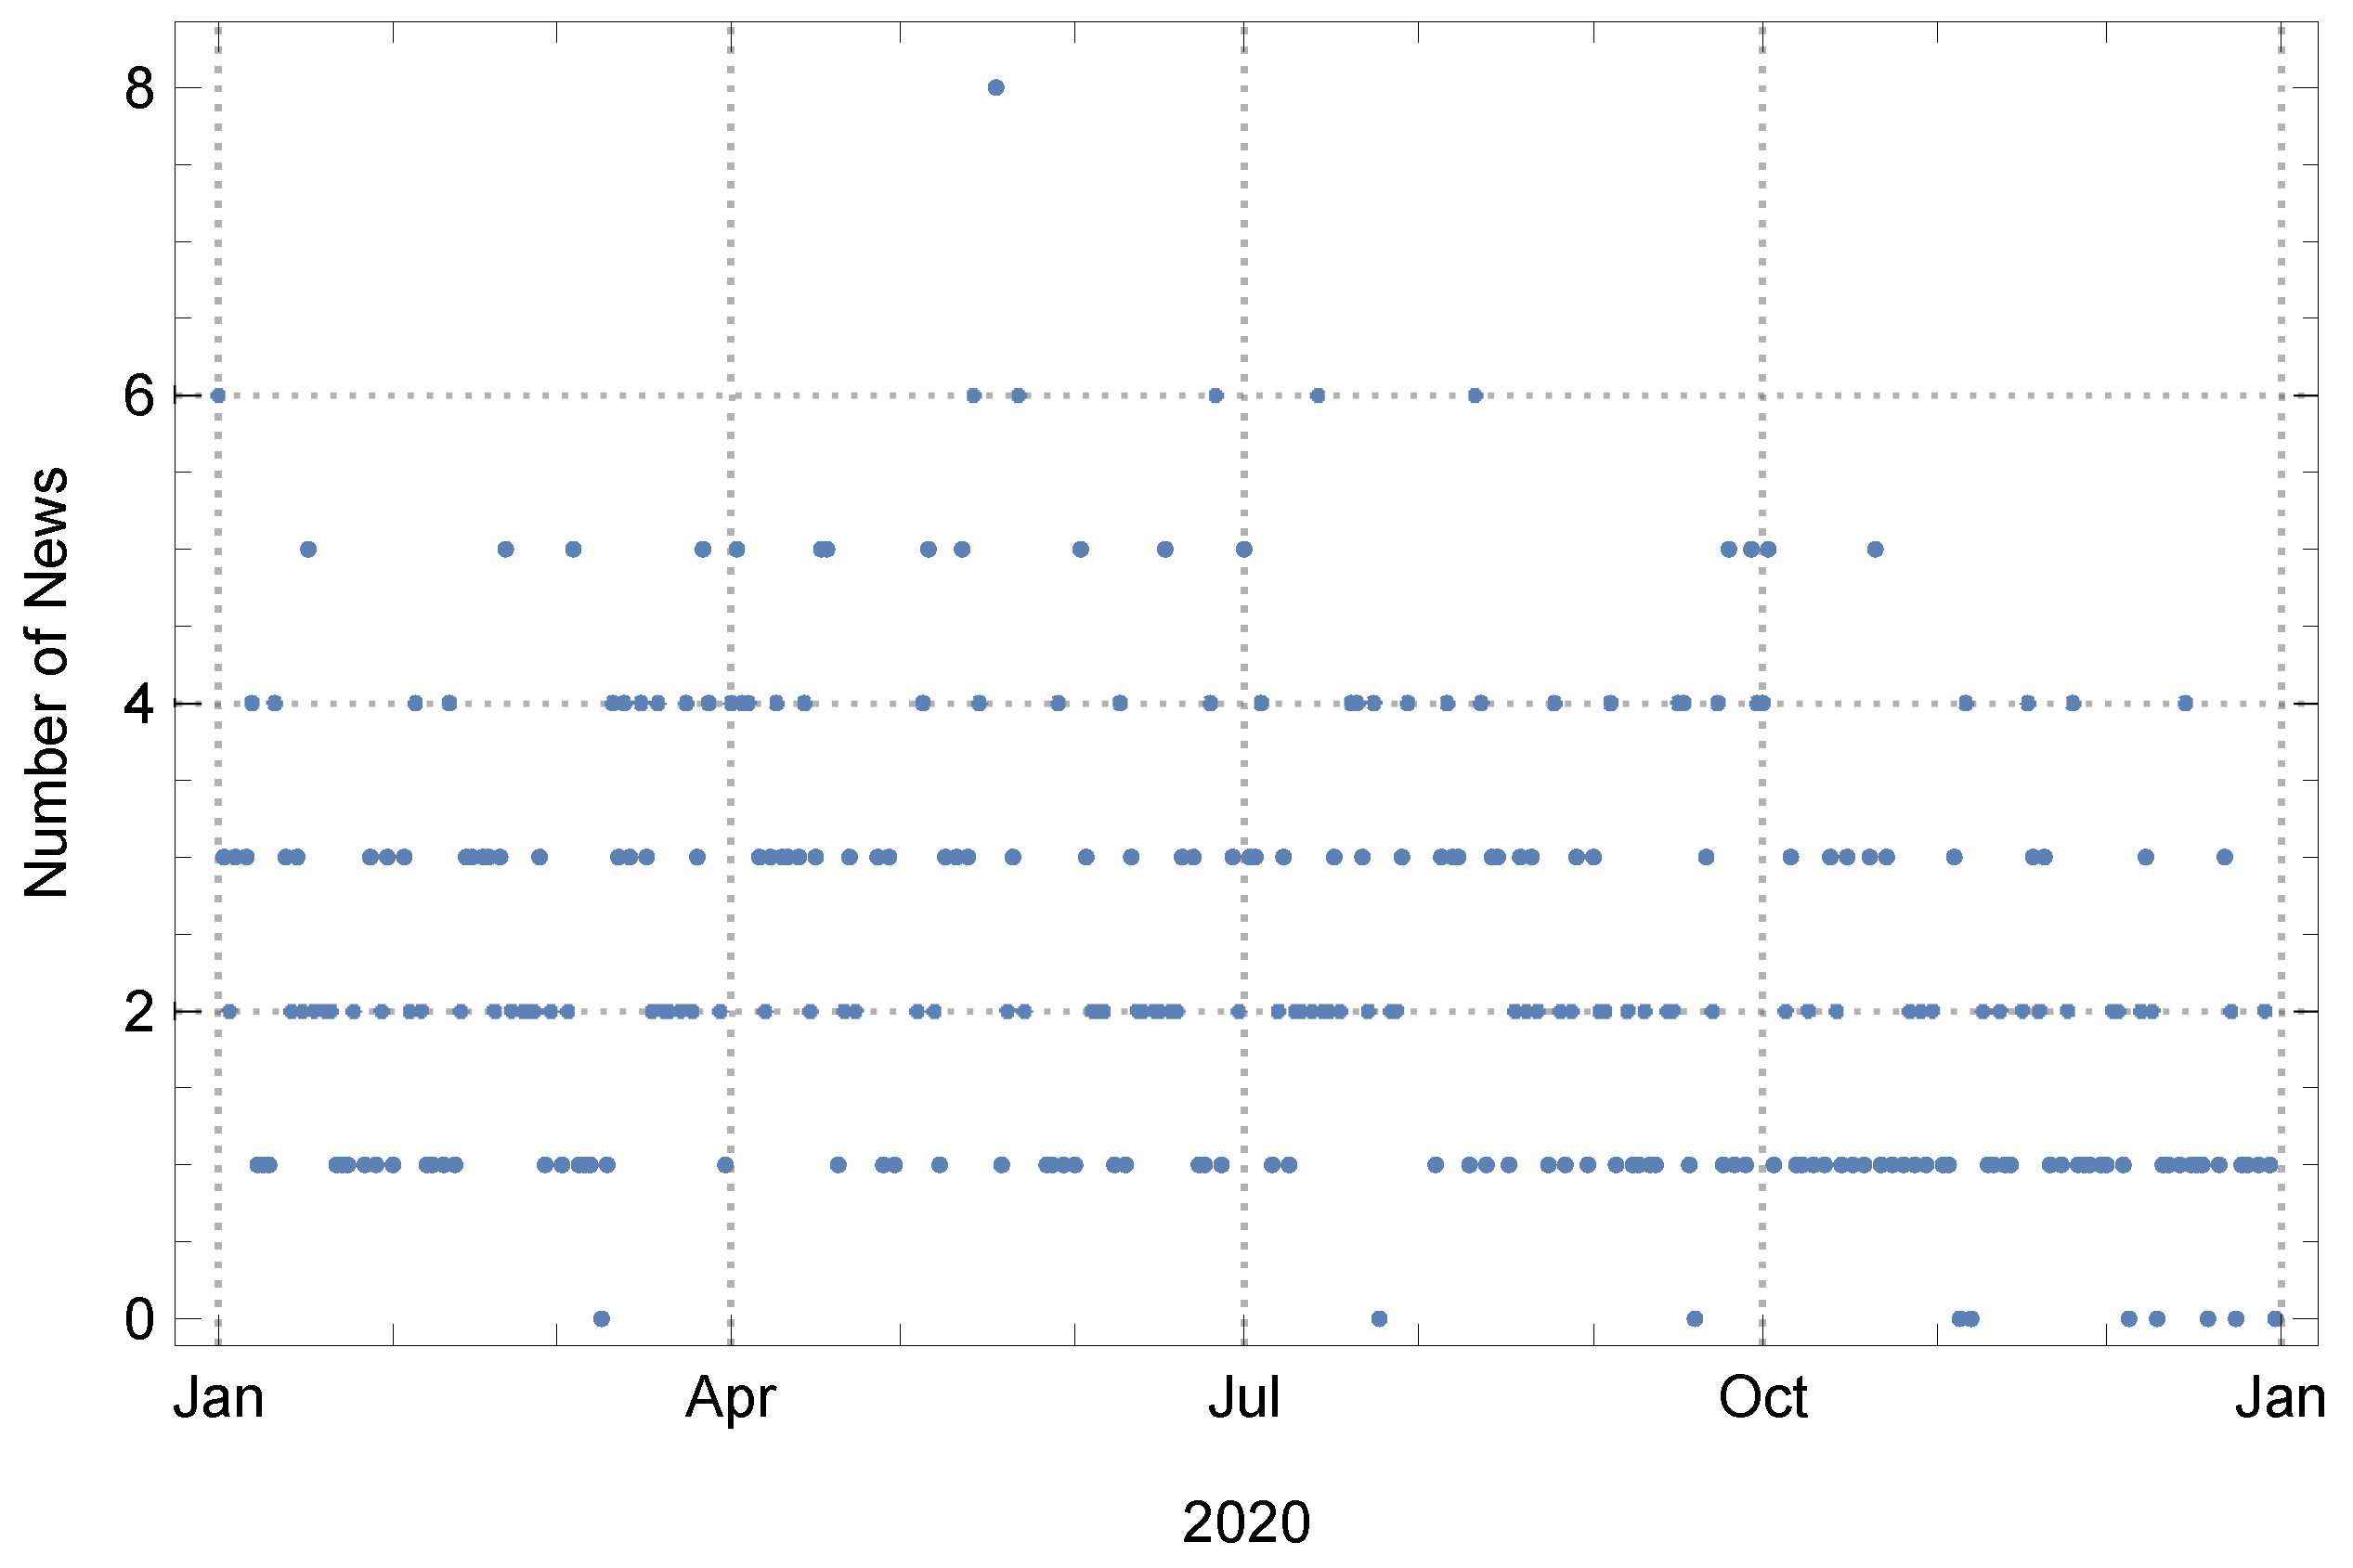
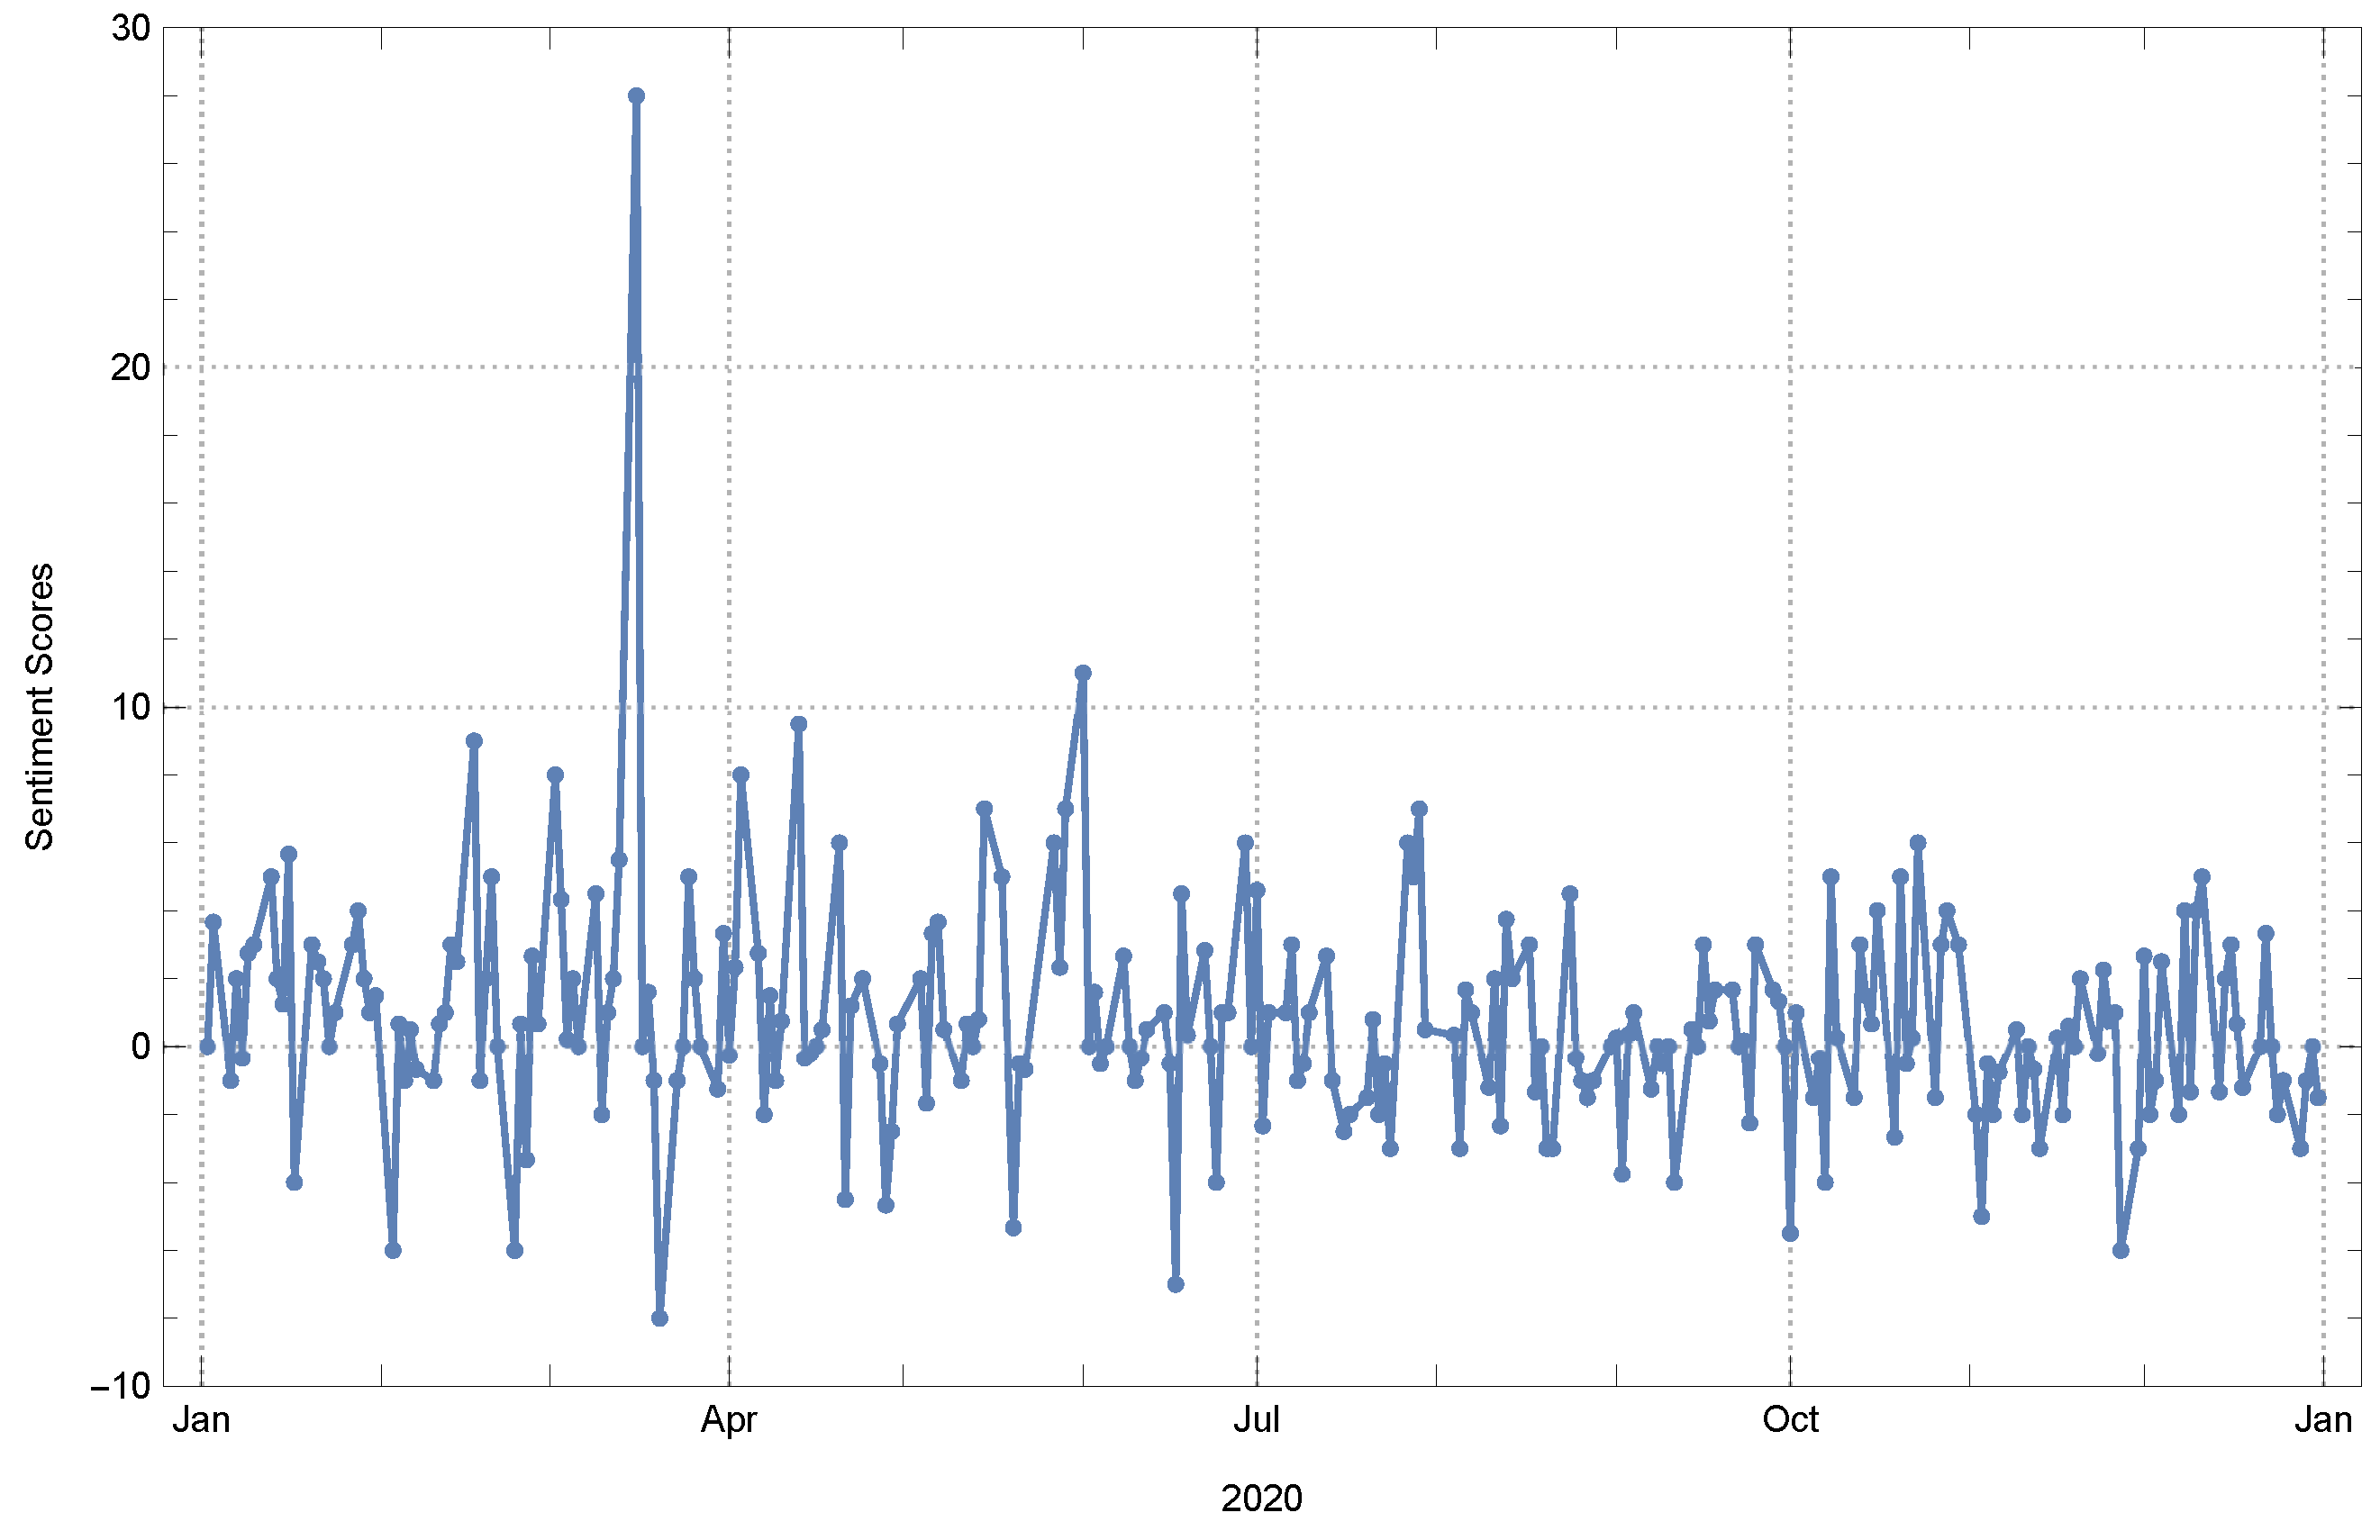
The statistical measurements reported in Table 3 pertain to a time series analysis that include sentiment scores of economic news as observations, sourced from the “Dünya Newspaper” website. Similarly to the methodology employed for calculating the network fractal dimension, the fractal dimensions of the present time series were computed by considering window sizes of 5 and 10.
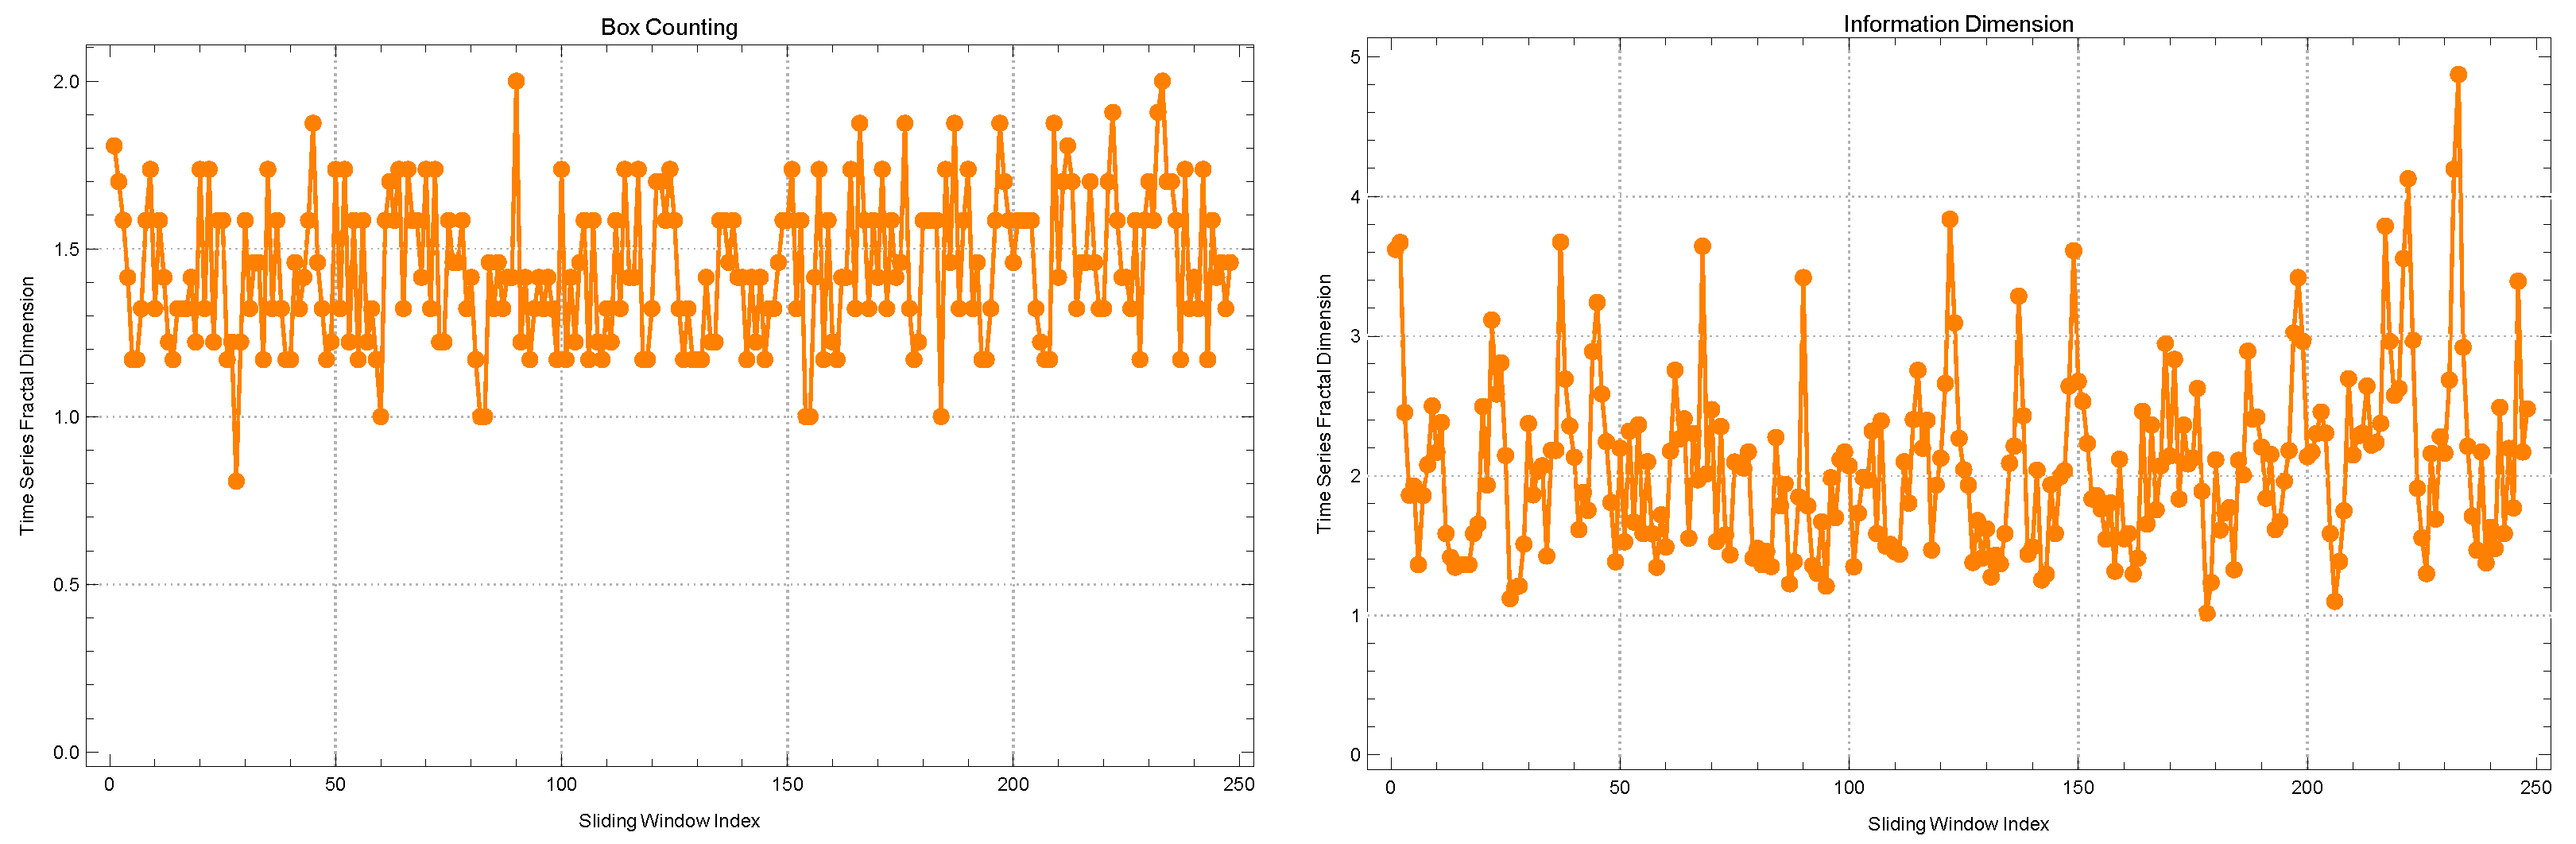
Through the application of sliding windows of width 5, an examination of the time series of sentiment scores derived from economic news in the year 2020 has been conducted. This analysis has employed both the box-counting and information dimension methods, which have yielded noteworthy observations regarding the dynamism and complexity of the sentiment fluctuations.
The calculated average fractal dimension, obtained through the box-counting method, is 1.43896 . The observed value indicates a moderate degree of complexity in the sub-time series, which highlights the intricate and multifaceted characteristics of economic news and its associated sentiments. The standard deviation of 0.219088 suggests that there is variability in the complexity measure across various time frames. This variability indicates that there are periods of both relative calm and turbulence in economic sentiment. The observation gains additional depth with the inclusion of the kurtosis value of 2.48927 and the skewness value of 0.159775 . A kurtosis value below 3 indicates that the observed changes in sentiment have a distribution with a flattened peak and lighter tails in comparison to a normal distribution. This suggests a relatively lower occurrence of extreme fluctuations in sentiment. The observed positive skewness, albeit small in magnitude, suggests a distribution that exhibits a slight inclination towards more positive shifts in sentiment. The autocorrelation coefficient of 0.00256183 , while approaching zero, indicates a minimal correlation between successive time windows. This implies a subtle persistence in sentiment trends at a minute level.
When considering the information dimension method, the observed results exhibit a heightened level of significance. The observed average fractal dimension of 2.06947 suggests a notable increase in complexity as measured by this particular method. A higher standard deviation of 0.634281 is equal to increased variability, implying more prominent fluctuations in sentiment over time. The kurtosis value of 4.89401 exhibits noteworthy characteristics. The observed distribution shows a high degree of leptokurtosis, implying that it possesses more pronounced peaks and heavier tails compared to a normal distribution. This suggests the occurrence of notable shifts in sentiment, both positive and negative, that deviate significantly from the mean. The skewness value of 1.1651 , which is significantly higher compared to the box-counting method, suggests a distribution that exhibits a more prominent positive tail. This indicates the presence of episodes with a strong positive sentiment. The extremely low autocorrelation value of 5.442776 ×   10 17 highlights the dynamic and volatile nature of the sentiment fluctuations observed in these economic news articles.
In the context of synthesis, it is worth noting that both methods under consideration effectively capture the complex dynamics of economic sentiment during the year 2020. However, it is noteworthy that the information dimension method in particular places a strong emphasis upon the existence of notable outliers representing positive sentiment. The data suggest that, throughout the year 2020, the economic news experienced fluctuations, with certain notable instances or timeframes characterized by significant levels of optimism.
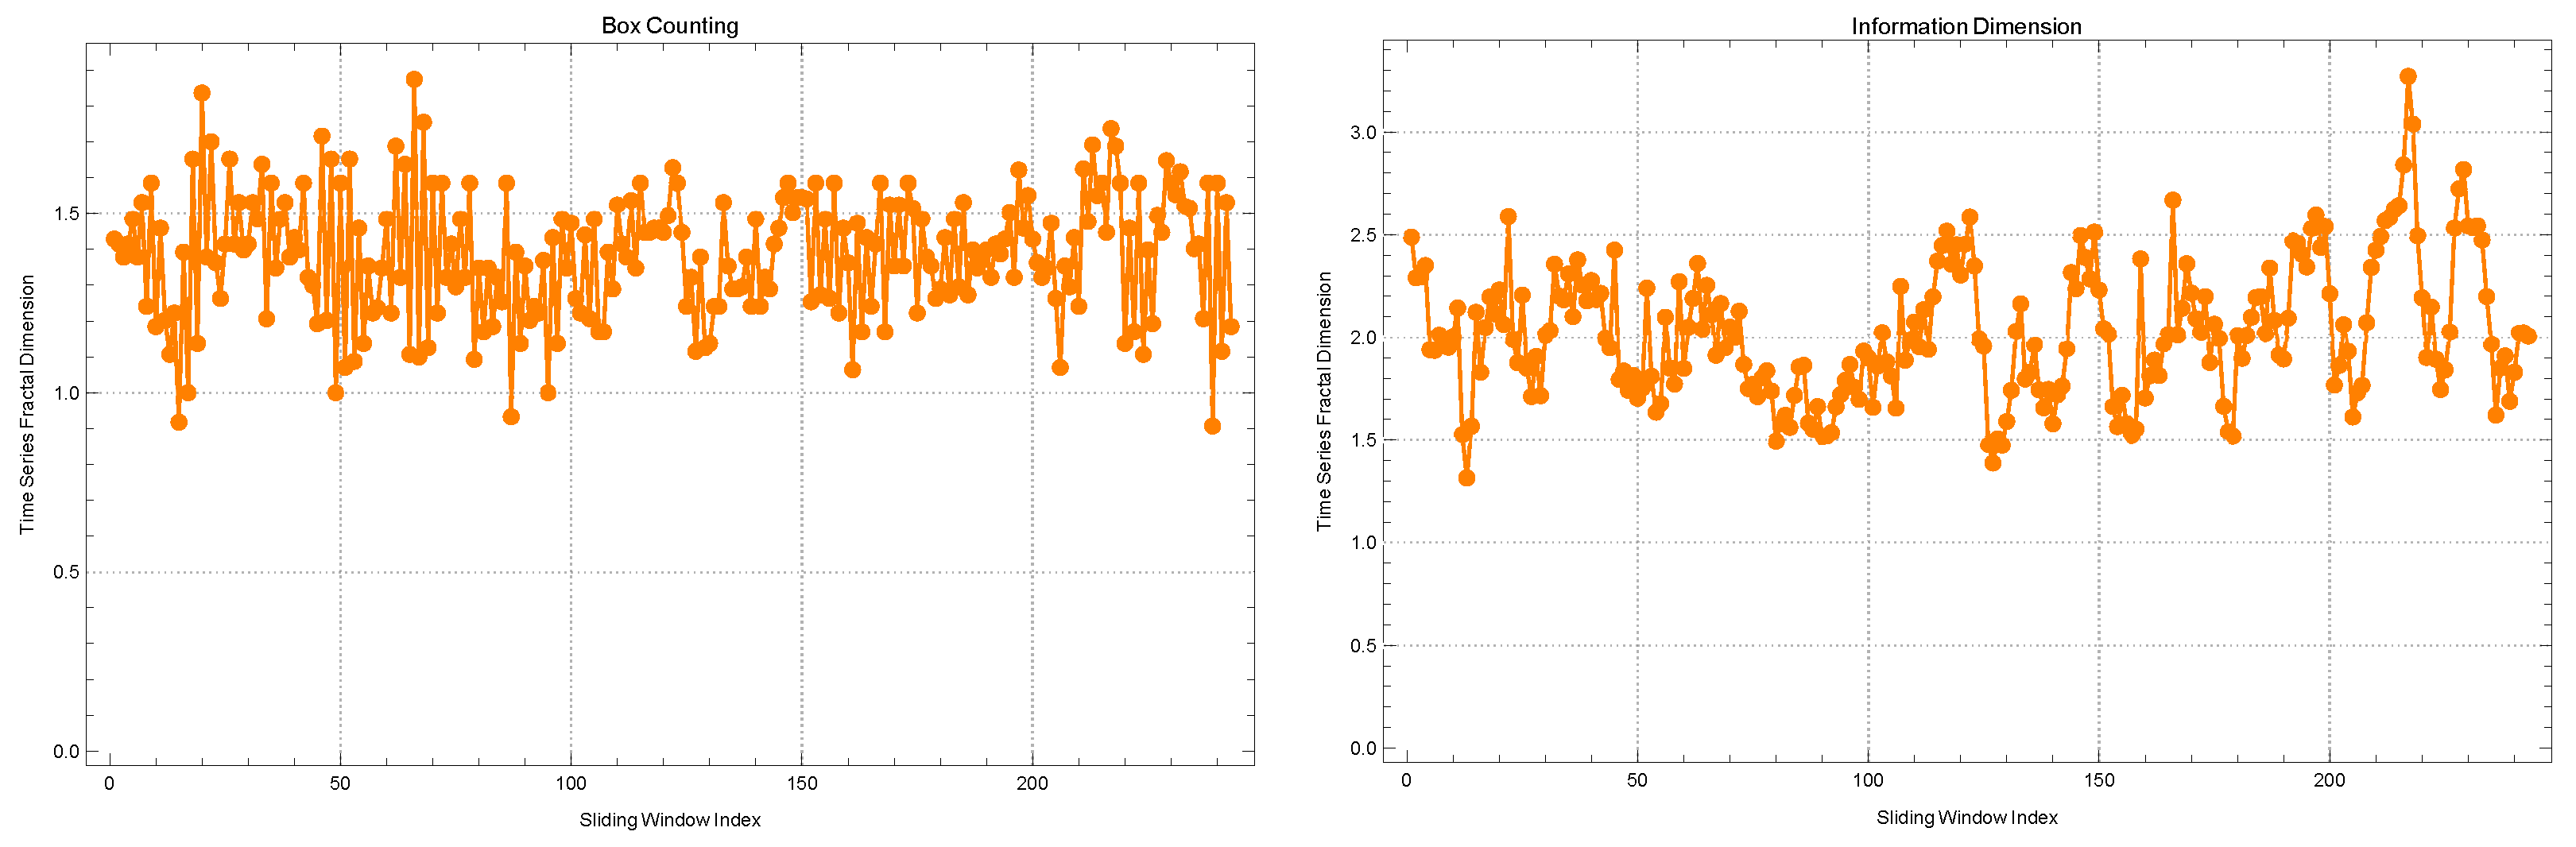
When considering the sentiment scores of economic news from 2020, an analysis was conducted using a 10-width sliding window. By employing the box-counting and information dimension methods, a more comprehensive understanding of the underlying sentiment dynamics over a wider timeframe was obtained.
According to the analysis conducted using the box-counting method, it has been observed that the mean fractal dimension has exhibited a slight decrease to a value of 1.38411 when compared to the results obtained using a window width of 5. The data imply that, as the time frame expands, there is a slight decrease in observed complexity. This may suggest that sentiment variations tend to stabilize or become more consistent over extended durations. The standard deviation of 0.174963 provides evidence supporting the notion of greater consistency in sentiment patterns across extended time periods. The observed phenomenon could potentially suggest the presence of relatively consistent patterns in sentiment within the economic news domain, particularly when noticed during extended time periods. The kurtosis value of 2.79881 indicates that the distribution has a relatively moderate level of peakedness compared to a normal distribution. This finding, where the kurtosis is less than 3, suggests that there are fewer instances of extreme sentiment fluctuations observed over the extended time period. The slight negative skewness of 0.141031 reveals a deviation from our previous findings, indicating a minor tail on the negative side of the distribution. This suggests the presence of occasional periods characterized by a more pronounced negative sentiment. The autocorrelation value of 2.10088 ×   10 33 remains consistently low across the shorter window, suggesting a lack of significant sentiment continuity between these longer intervals.
In the context of the information dimension method, it is noted that the average fractal dimension undergoes a decrease to a value of 2.02618 . The observed decline, while retaining its intricate complexity, suggests that certain subtle fluctuations identified within the shorter time frame are smoothed out when considering the longer time frame. The decrease in the standard deviation, specifically 0.326617 , indicates a convergence of sentiment patterns. The kurtosis of the sentiment scores is currently 3.21286 , which suggests that the distribution is approaching that of a normal distribution. This indicates that the shifts in sentiment scores are becoming more evenly spread out without any significant outliers. The positive skewness value of 0.510735 indicates that there are still occurrences of optimistic sentiment that marginally surpass the pessimistic ones. The autocorrelation, which is extremely close to zero at 3.06677 ×   10 64 , highlights the fleeting nature of sentiments even when considering the larger context.
In comparison to the preceding examination, the utilization of a 10-width window reveals a marginally more uniform and seamless sentiment landscape pertaining to the economic news of 2020. The patterns suggest a tendency towards a stabilized sentiment, as evidenced by a reduction in extreme fluctuations when the analysis is extended to a 10-day timeframe. However, it is important to note that the information dimension method highlights the underlying patterns of rapid shifts in sentiment, showcasing the ever-changing characteristics of economic news sentiment.
Independence tests are utilized in order to assess the potential association between the fractal dimension of the sentiment score time series of economic news and the fractal dimension of the network. The study employed statistical tests including Blomqvist β , Kendall τ , and Spearman Rank. Table 4 presents the outcomes of the independence tests conducted on 5-width sliding windows, while Table 5 displays the outcomes of the independence tests conducted on 10-width sliding windows.
The analysis reveals a significant correlation between the fractal dimension of the sentiment score time series of economic news and the fractal dimension of the network for companies in the BIST Stars segment. This correlation is consistently observed across both 5-width and 10-width sliding windows, as indicated by the results of the independence tests.
In the case of the 5-width window, when employing the box-counting method, it is noteworthy to observe remarkably minuscule p-values. In a similar vein, the application of the information dimension technique using the identical window width yields notably low p-values. When applying the box-counting method to a 10-width window, the statistical analysis reveals p-values for Blomqvist β , Kendall τ , and Spearman Rank. The information dimension method for this longer window yields p-values of Blomqvist β , Kendall τ , and Spearman rank at extremely small values.
When considering both sliding window widths and methods, it is evident that the consistently low p-values indicate a strong and reliable non-random relationship between the fractal dimensions of the sentiment score time series and the network. The observed data imply a notable correlation between the fluctuation of sentiment in economic news and the network configuration of the BIST Stars segment companies.
The findings demonstrate a consistent pattern across various window widths, suggesting a persistent and robust association between the time series and network regardless of the level of analysis granularity. Additionally, it is worth noting that, although the exact p-values differ, they all exhibit remarkably low values. This emphasizes the strength and reliability of the observed correlation regardless of the specific methodology or window duration employed. The aforementioned statement highlights the significant correlation between market sentiment, as reflected in the news, and the complex dynamics of the financial network. This further supports the notion that the overall economic narrative has a profound impact on financial market structures, and conversely, financial market structures also exert influence on the broader economic narrative.
The Granger causality tests were conducted to assess the predictive capacity of the fractal dimension of the sentiment score time series on the fractal dimension of the correlation network. This analysis was performed for two different window widths (5-window and 10-window) and utilizing both the box-counting and information dimension methods and results are presented in Table 6.
In the 5-window analysis utilizing the box counting method, the F-test value is 4.84164 . This value is accompanied by a statistically significant p-value. In a similar vein, upon employing the information dimension method with the identical window width, the F-test value exhibited an increase to 6.62702 , while the p-value demonstrated a decrease to a more pronounced level of significance, specifically 0.000215875 . The observed results suggest that the sentiment score time series, quantified by the information dimension, exhibits a higher level of predictive capability on the network’s fractal dimension compared to the box-counting method.
In the transition to the 10-window results, it is observed that the box-counting method produced an F-test value of 6.71049 . This value indicates a statistically significant relationship. The corresponding p-value is calculated to be 0.000193249 , further supporting the significance of the observed relationship. The information dimension method, when applied to a window of the same width, yielded an F-test value of 5.57551 . The corresponding p-value was calculated to be 0.000916932 . Both methods exhibit the strong rejection of the null hypothesis that the sentiment score time series do not Granger-cause the network fractal dimension. However, it is important to mention that, in this instance, the box-counting method demonstrates a slightly higher F-test value in comparison to the information dimension method.
In summary, the empirical findings consistently indicate that the fractal dimension of sentiment scores has a Granger-causal relationship with the fractal dimension of the correlation network, regardless of window widths and methods employed. The strength of the observed causality exhibits slight variations based on the selected methodology and window width. Notably, the information dimension method demonstrates a marginal advantage in the 5-window configuration, while the box counting method prevails in the 10-window arrangement.
Utilizing a nonlinear autoregressive distributed lag (NARDL) model for analyzing the connection between time series proves beneficial due to its ability to effectively capture nonlinear relationships commonly found in financial and economic data. The T N series, which represents the fractional dimension of company networks in the BIST Stars segment, and the T S series, which reflects the sentiments in Turkish economic news, are expected to display intricate and ever-changing interactions. With NARDL, one can delve into the analysis of both short- and long-term effects. It also helps uncover the asymmetrical relationships, like the varying impact of positive and negative sentiment shifts in economic news on the dynamics of the stock market network. This approach enables the discovery of profound insights, such as the varying market responses to positive or negative news, and the evolution of these responses across different time frames. Having a deep understanding of the intricacies of financial markets is essential, as investor sentiment and market reactions often defy simple patterns. When conducting NARDL tests, we utilize the Akaike information criterion (AIC) and Bayesian information criterion (BIC) to determine the most suitable lags. In this case, we selected a maximum lag of 4. For model diagnostics, we utilize the Jarque–Bera (JB), Lagrange multiplier (LM), and ARCH tests on each model.
In Table 7, the results are presented from the model T N T S for the time series with a window length of 5 and fractional dimensions derived from box dimensions.
According to the NARDL model results, there is a noteworthy correlation between the fractional network dimensions of BIST Stars segment companies ( T N ) and Turkish economic news sentiments ( T S ), both assessed using a 5-length windows and box dimension. Based on the statistical analysis, the model demonstrates a strong overall fit with a high F-statistic of 213.4 and an extremely low p-value of less than 2 ×   10 16 . With a significant negative coefficient of 0.99617 , there appears to be a strong inverse relationship between T N 1 and its own past values. This suggests a potential mean-reverting tendency in the T N series. Positive and negative changes in Turkish economic news sentiments have significant positive coefficients, indicating that both types of sentiment shifts have similar and substantial impacts on the T N series. The model’s R-squared value of 0.7805 suggests that a substantial amount of the variation in the dependent variable can be accounted for by the model. Nevertheless, the results of the short-run and long-run asymmetry tests, with p-values of 0.163418 and 0.1611531 , respectively, indicate that there is no substantial asymmetry in the impact of positive and negative sentiment changes. This suggests that both positive and negative sentiment changes have a symmetrical influence on T N in both the short and long term. The symmetry is further reinforced by the long-run coefficients for T S p and T S n , which are almost the same and extremely significant.
In Table 8, the results are presented from the model T N T S for the time series with a window length of 10 and fractional dimensions derived from box dimensions.
In this case, the model demonstrates a strong level of fit, as evidenced by the significant F-statistic value ( 454.7 ) and an extremely low p-value (lesser than 2 ×   10 16 ), indicating that the model is highly effective in predicting the relationship between T N and T S . The coefficients unveil intriguing dynamics. Based on the data, it appears that there is a strong inverse relationship between T N 1 and its own past values. This suggests that the T N series may have a mean-reverting characteristic. The coefficients for both positive ( T S p ) and negative ( T S n ) changes in Turkish economic news sentiments are significant, with values of 0.67560 and 0.62164 , respectively. This suggests that both the positive and negative news sentiments have a considerable impact on T N . Nevertheless, the coefficients for T S p 1 and T S n 1 are not as significant, indicating that the initial impact of news sentiments is more noticeable than their delayed effects. With an R-squared value of 0.9213 , it is clear that the model has a strong explanatory power and can account for a substantial amount of the variability in the dependent variable. Various diagnostic tests indicate that there are no significant problems related to normality, autocorrelation, or heteroskedasticity. This suggests that the model is robust. In addition, the short-run asymmetry test and long-run asymmetry test, both with p-values of 0.6196637 and 0.6744471 , respectively, indicate that there is no significant asymmetry in the short or long run. It can be observed that the effects of both positive and negative changes in T S on T N are symmetrical across both time horizons. Based on the significant long-run coefficients for T N and T S , it is evident that there is a strong long-term relationship between these variables.
The results from the model T N T S for the time series with a window length of 5 and fractional dimensions derived from information dimensions are presented in Table 9.
The model’s F-statistic is remarkably high at 1789.05 , and the p-value is incredibly small at less than 2 ×   10 16 . These results suggest an extremely strong fit, indicating that the model accurately captures the relationship between T N and T S . The coefficients indicate complex relationships. With a negative coefficient of 0.87911 , there is a strong inverse relationship between T N 1 and its own past values. This suggests that the T N series may exhibit a mean-reverting nature. The coefficients for both positive and negative changes in economic news sentiments are highly significant, indicating that both positive and negative news have a significant and immediate impact on T N . It is worth noting that the coefficients for positive changes ( T S p 1 and T S p 2 ) show a combination of significance, suggesting that the initial impact of positive news on T N is stronger than its effects in the long run, albeit with a slightly diminishing influence over time. The model’s high R-squared value of 0.9815 indicates that it effectively captures almost all of the variability in the dependent variable, showcasing its robust explanatory capability. The short-run and long-run asymmetry tests yielded p-values of 0.5006941 and 0.408568 , respectively. These results indicate that there is no significant asymmetry in the impact of positive and negative news sentiments on T N . This suggests that the influence of these sentiments is symmetrical in both the short and long term. Based on the model diagnostics tests, it appears that the model is generally reliable. However, there is a potential concern regarding the ARCH effect, as the p-value is quite low ( 0.01541819 ). This could suggest potential volatility clustering in the residuals that may need to be addressed.
Finally, the results from the model T N T S for the time series with a window length of 10 and fractional dimensions derived from information dimensions are presented in Table 10.
With an F-statistic of 501.8 and a p-value of less than 2 ×   10 16 , the model demonstrates a strong overall fit, suggesting a highly predictive relationship between T N and T S . Notable findings from the coefficients reveal a noteworthy negative coefficient for T N 1 ( 0.94122 ), indicating a robust inverse correlation with its previous values, which implies a tendency for the T N series to revert to its mean. Positive and negative changes in Turkish economic news sentiments have strong positive coefficients ( 0.85743 and 0.89230 , respectively), suggesting that changes in economic news, regardless of their nature, have a significant impact on T N . The coefficients indicate that economic news sentiments have a significant and immediate effect on the fractional dimension of the BIST Stars segment companies. The R-squared value of 0.9147 , along with an adjusted R-squared of 0.9129 , indicates that the model explains a substantial amount of the variation in the dependent variable, indicating its strong ability to provide explanations. Based on the model diagnostic tests, there are no significant concerns regarding normality, autocorrelation, or heteroskedasticity in the residuals. This suggests that the model is reliable. Based on the short-run and long-run asymmetry tests, it appears that there is no significant asymmetry in the impact of positive and negative news sentiments on T N , both in the short and long term. The p-values for these tests are 0.7767885 and 0.7519224 , respectively. The symmetry is further reinforced by the long-run coefficients for T S p and T S n , which are both highly significant and have similar magnitudes.

6. Conclusions

The examination of fractal dimensions in financial correlation networks and economic news sentiment time series holds significant significance in modern financial econometrics. Financial markets, being inherently intricate and diverse, exhibit attributes that frequently surpass the limitations of conventional linear models. Fractal dimensions serve as a valuable tool for comprehending the intricate nature of this complexity, providing a means to gain insights into the fundamental structures and patterns that govern the dynamics of the market. In an age characterized by rapid information flow, the impact of economic news sentiment on investor behavior and market movements is of the utmost significance. The examination of its fractal characteristics facilitates the identification of patterns within public sentiment and their potential ramifications on market dynamics. By analyzing the fractal dimensions of both domains, we can deepen our understanding of market intricacies and improve the development of more resilient financial strategies and forecasts.
Upon conducting an analysis pertaining to the correlation networks of companies and the time series of sentiment scores derived from economic news, a number of significant insights were revealed. By employing sliding window methodologies of width 5 and 10, we were able to observe variations in the fractal dimensions. Notably, there was a consistent interplay observed between the box counting and information dimension methods. The results of the independence tests conducted on the network fractal dimensions and sentiment score time series fractal dimensions indicate a strong statistical significance, as evidenced by the highly significant p-values obtained from various tests including Blomqvist β , Kendall τ , and Spearman rank. These findings suggest a significant and interconnected relationship between market dynamics and prevailing economic news sentiments. Moreover, the statistical analysis conducted using Granger causality tests provided additional evidence supporting the observed association. Specifically, it was found that the time series of sentiment scores demonstrated a predictive ability in relation to the fractal dimension of the correlation network. It is worth noting that the specific results varied slightly depending on the chosen method and window width. The findings presented collectively emphasize the complex relationships between public sentiment, as observed in the news, and the inherent structures within financial markets. These findings indicate a potential direction for future research and practical applications in the areas of financial forecasting and the development of market strategies.
When examining the NARDL model results, it becomes clear that there are noticeable trends in how the fractional dimensions of BIST Stars segment companies ( T N ) and Turkish economic news sentiments ( T S ) interact. These patterns vary depending on the window lengths and measurement dimensions being considered. The findings consistently show a strong inverse relationship between T N and its past values in both the 5-length and 10-length box dimension models. This suggests that the T N series has a mean-reverting characteristic. This pattern remains consistent across various window lengths and measurement dimensions, emphasizing a fundamental characteristic of the T N series. It is worth mentioning that the various models show that both positive and negative changes in T S have a considerable influence on T N . These effects are observed to be fairly balanced in both the short and long term, as evidenced by the lack of significant results in the short-run and long-run asymmetry tests. The symmetry observed in the T N series indicates a consistent and unbiased response to the changes in economic sentiment, regardless of the specific nature of that sentiment. Nevertheless, the impact of this phenomenon differs across models. The 5-length information dimension model reveals a gradual decrease in the influence of positive news over time, which is not observed in the box dimension models. The models’ impressive R-squared values, especially in the 5-length information dimension model, highlight their significant explanatory power and the reliability of the relationships identified. However, there are concerns about the ARCH effect in the 5-length information dimension model, which indicates the possibility of volatility clustering. This adds a level of complexity that is not present in the box dimension models. This difference indicates the distinct dynamics observed when using various measurement methods. To summarize, the main findings of the analysis show that there is a consistent inverse relationship between T N and its past values, and that T S has a symmetric impact. However, different models reveal variations in the magnitude of these effects and the presence of volatility clustering.
The outcomes presented in this context have important ramifications for the both regulatory bodies and individuals involved in the market. The interdependence of economic news sentiments and market dynamics, as emphasized by the fractal dimensions and correlations, indicates that the transmission of information in the public sphere has a significant impact on market behavior. The role of the transparent, precise, and punctual dissemination of economic information is emphasized considering its capacity to influence market dynamics. Regulators should contemplate the adoption of more stringent guidelines pertaining to financial news reporting in order to safeguard the accuracy and integrity of information, thereby mitigating the potential for misleading content. Moreover, the discerning capacity of sentiment scores concerning the fractal dimension of the correlation network suggests that sentiment analysis can be employed as a pre-emptive instrument. Central banks and financial authorities can utilize these insights to proactively detect and potentially alleviate systemic risks linked to sudden market fluctuations triggered by changes in public sentiment. However, it is worth noting that financial institutions and investors have the opportunity to utilize this information in order to develop investment strategies that are better informed and adaptable, while also considering the current sentiment reflected in economic news. This, as a consequence, can result in enhanced stability and resilience within the financial markets. In conclusion, the analysis pertaining to the employment of sliding window methodologies implies that the market’s response to news sentiment may exhibit temporal dependence. Policy-makers possess the opportunity to utilize this valuable insight in order to evaluate the immediate and foreseeable consequences of economic developments on the financial system. This will enable them to ascertain the appropriateness and efficacy of their interventions and strategies in a timely manner. Our research consequently lays the foundation for a comprehensive and refined approach to economic policy formulation in an era characterized by swift information diffusion.
Based on the findings of this study, future research could explore other possible avenues to gain a deeper understanding of the relationship between economic news perceptions and financial market dynamics. Integrating dividend adjustments into the analysis of log returns would provide a more holistic perspective on asset performance, encompassing both price appreciation and dividend income. Introducing this item would enhance the comprehension of overall returns and their impact on market dynamics. Furthermore, the range of sentiment research could potentially be expanded by incorporating a more extensive selection of news sources and social media platforms. Such an extension could offer a more detailed portrayal of public mood, particularly given the increasing impact of social media in molding market perceptions. An examination of these linkages over extended time periods would be highly beneficial for comprehending the evolution of economic news feelings and market dynamics during many market cycles. This analysis would provide insights into the resilience and adaptability of the market to long-term swings in sentiment. Moreover, doing cross-market comparisons, specifically between developed and emerging nations, can reveal distinct market sensitivities and reactions to economic news, providing essential insights for the development of global financial strategies. These potential study directions not only provide the possibility of enhancing our comprehension of market behavior in response to changing economic news, but also facilitate the development of more subtle and efficient financial market regulation and policy-making.

Author Contributions

Conceptualization, M.A.B., Ö.A., L.M.B. and A.N.; methodology, M.A.B., Ö.A., L.M.B. and A.N.; software, M.A.B. and Ö.A.; validation, M.A.B., Ö.A., L.M.B. and A.N.; formal analysis, M.A.B., Ö.A., L.M.B. and A.N.; investigation, M.A.B., Ö.A., L.M.B. and A.N.; resources, M.A.B., Ö.A., L.M.B. and A.N.; data curation, M.A.B. and Ö.A.; writing—original draft preparation, M.A.B., Ö.A., L.M.B. and A.N.; writing—review and editing, M.A.B., Ö.A., L.M.B. and A.N.; visualization, M.A.B. and Ö.A.; supervision, M.A.B.; project administration, M.A.B. and Ö.A.; funding acquisition, L.M.B. and A.N. All authors have read and agreed to the published version of the manuscript.

Funding

This research was funded by Scientific and Technological Research Council of Turkey (TUBITAK) grant number 121K708.

Institutional Review Board Statement

Not applicable.

Informed Consent Statement

Not applicable.

Data Availability Statement

Data are contained within the article.

Conflicts of Interest

The authors declare no conflicts of interest.

Appendix A

Table A1. Statistics for the companies in BIST Stars segment.
CompanyMeanSt. Dev.SkewnessKurtosisCompanyMeanSt. Dev.SkewnessKurtosis
AKBNK5.227820.9617211.093813.24292ISDMR5.533610.6686321.34464.94196
AKCNS10.54772.6017−0.1007361.97859ISFIN3.739290.437875−1.202324.72482
AKFGY1.345320.259118−0.4897053.14515ISGYO1.825790.267412−0.15622.89967
AKSGY2.441940.443922−0.09169872.80678ISMEN1.500790.707521.091593.43181
AKSA6.725561.585651.835996.11941KAREL2.449170.32718−0.1817623.80643
AKSEN2.447780.6250460.2615511.78307KARTN31.559829.29651.670014.21066
AKGRT1.533850.268709−0.1101222.52458KCHOL15.53422.022690.2381431.82697
ALGYO6.26461.194360.8155435.13479KERVT4.815751.385440.3326551.9783
ALARK5.305990.8826040.277283.5238KONYA449.846290.1371.333473.57736
ALBRK1.226510.181869−0.3251852.69119KORDS11.84361.614360.1558772.69406
ALCTL21.94975.768460.09739312.23593KOZAA12.28191.56216−0.6964553.54414
ALKIM10.27672.61899−0.5465511.70527KOZAL3.661980.344918−0.9695385.67069
AEFES16.98212.01803−0.3821621.99722KRDMD2.931940.8569221.22473.96154
AGHOL18.10292.919780.3943133.66565LOGO19.66464.243720.3946532.74403
ANHYT5.824920.795287−0.2519082.24688MAVI10.58191.793080.4943542.29205
ANSGR5.579520.962052−0.1953661.49586MGROS33.69677.44316−0.490681.71154
ARCLK19.21864.4220.2434212.13765MPARK17.0182.13026−0.5420083.42586
ASELS7.576671.20675−0.4885751.88305NETAS16.01233.837610.466343.08026
AYGAZ10.91931.30763−0.450583.51238NTHOL2.448530.5609660.0259762.71065
BAGFS6.020560.893728−0.7775813.27232ODAS1.838810.5739010.3988292.21656
BSOKE1.660710.5296540.3135332.24561OTKAR28.67667.644771.794356.50347
BIMAS54.25348.41462−0.4287011.47871OYAKC6.857141.365810.02378541.44949
BIZIM13.72223.17679−0.2206442.30686OZKGY0.9098020.209892−0.04076882.04267
BRSAN12.85954.189272.089039.59651PETKM3.435440.569591.078444.39429
BRISA10.09313.183640.8026162.72933PETUN14.77944.84756−0.3844261.80375
BUCIM1.191790.4435051.007013.43505PGSUS54.363612.10870.3063152.9369
CCOLA42.3387.520580.8765823.15734PNSUT14.69093.16913−0.4413642.3415
CEMTS1.957420.6574570.3267661.75667PRKAB6.691113.95340.7794182.02058
CIMSA10.12782.865890.5040212.53949SAHOL7.778290.8762650.374932.37554
CLEBI73.904716.95842.145610.8446SARKY2.85311.026730.9472112.79589
DEVA17.01815.30281−0.3655011.70606SASA2.005990.6582750.2247711.77886
DOAS10.94014.731370.9310763.11169SELEC8.203372.293811.910466.63172
DOCO401.878108.8690.789422.25196SISE5.398370.949679−0.127721.96821
DOHOL1.918970.3756720.5654883.31203SKBNK1.144210.246618−0.1934182.13174
ECILC5.226351.15214−0.3454871.76792SOKM11.21671.54365−0.7905432.98341
ECZYT13.59964.242920.6942463.04166TATGD8.583691.91242−0.3588241.83779
EGEEN708.517322.4591.602854.26196TAVHL18.80733.522220.9656063.15962
EGGUB20.37768.243970.1344181.61885TCELL12.97071.01478−0.1586872.27014
EKGYO1.583610.312183−0.2496572.07942THYAO11.59321.651180.2446212.75563
ENJSA6.643811.123960.5903723.1916TKFEN13.21551.597630.1123812.63614
ENKAI5.275040.6208650.08699461.76843TMSN7.791352.471850.8986133.43601
EREGL7.108451.345811.734675.55366TOASO19.47133.112250.1544033.2673
FROTO71.392319.1270.6949082.59753TSKB1.305480.4023191.523654.39581
GARAN7.64461.469620.8998462.75674TTKOM6.055950.481197−0.3736492.89927
GOODY5.030791.210680.6511432.90459TTRAK36.757614.89280.6472082.42249
GOZDE5.088611.26701−0.05583742.7263TUPRS12.08481.828351.00853.02576
GSDHO0.8030160.174266−0.5765172.45673TURSG3.710481.38958−0.1482841.38939
GUBRF26.611113.60731.243065.54556ULKER22.16771.63877−0.1850553.76567
HALKB5.586270.6638931.168643.26895VAKBN4.824250.7565941.229583.67699
HEKTS1.206430.2031720.01626373.37611VESTL12.50192.42042−0.2667622.44821
HLGYO1.459090.5106580.7442783.31866YATAS7.691431.818510.9184143.92327
INDES2.736750.7144370.1138922.01265YGGYO6.753570.278127−0.1226774.20944
IPEKE11.52272.10598−0.5453942.80927YKBNK2.089960.3296410.6039112.06595
ISCTR2.214960.3312630.7166232.05182ZOREN1.127460.349438−0.170891.41985

References

  1. Husain, A.; Nanda, M.N.; Chowdary, M.S.; Sajid, M. Fractals: An eclectic survey, part-I. Fractal Fract. 2022, 6, 89. [Google Scholar] [CrossRef]
  2. Khalili Golmankhaneh, A.; K Ali, K.; Yilmazer, R.; KA Kaabar, M. Economic models involving time fractal. J. Math. Model. Financ. 2021, 1, 159–178. [Google Scholar]
  3. Mosteanu, N.R.; Faccia, A.; Torrebruno, G.; Torrebruno, F. The newest intelligent financial decisions tool: Fractals. A smart approach to assess the risk. Bus. Manag. Rev. 2019, 10, 89–97. [Google Scholar]
  4. Tuyon, J.; Ahmad, Z. Behavioural finance perspectives on Malaysian stock market efficiency. Borsa Istanb. Rev. 2016, 16, 43–61. [Google Scholar] [CrossRef]
  5. Akarsu, S. Idiosyncratic volatility, network centrality, and stock returns. Borsa Istanb. Rev. 2023, 23, 1191–1206. [Google Scholar] [CrossRef]
  6. Liu, Y. The importance of trust distance on stock market correlation: Evidence from emerging economics. Borsa Istanb. Rev. 2020, 20, 37–47. [Google Scholar] [CrossRef]
  7. Balcı, M.A.; Akgüller, Ö.; Can Güzel, S. Hierarchies in communities of UK stock market from the perspective of Brexit. J. Appl. Stat. 2021, 48, 2607–2625. [Google Scholar] [CrossRef]
  8. Balcı, M.A.; Batrancea, L.M.; Akgüller, Ö.; Nichita, A. Coarse graining on financial correlation networks. Mathematics 2022, 10, 2118. [Google Scholar] [CrossRef]
  9. Nie, C.X.; Song, F.T. Stable versus fragile community structures in the correlation dynamics of Chinese industry indices. Chaos Solitons Fractals 2023, 167, 113044. [Google Scholar] [CrossRef]
  10. Song, C.; Gallos, L.K.; Havlin, S.; Makse, H.A. How to calculate the fractal dimension of a complex network: The box covering algorithm. J. Stat. Mech. Theory Exp. 2007, 2007, P03006. [Google Scholar] [CrossRef]
  11. Wei, D.J.; Liu, Q.; Zhang, H.X.; Hu, Y.; Deng, Y.; Mahadevan, S. Box-covering algorithm for fractal dimension of weighted networks. Sci. Rep. 2013, 3, 3049. [Google Scholar] [CrossRef] [PubMed]
  12. Wu, H.; Kuang, L.; Wang, F.; Rao, Q.; Gong, M.; Li, Y. A multiobjective box-covering algorithm for fractal modularity on complex networks. Appl. Soft Comput. 2017, 61, 294–313. [Google Scholar] [CrossRef]
  13. Wei, Z.W.; Wang, B.H.; Wu, X.T.; He, Y.; Liao, H.; Zhou, M.Y. Sampling-based box-covering algorithm for renormalization of networks. Chaos Interdiscip. J. Nonlinear Sci. 2019, 29. [Google Scholar] [CrossRef] [PubMed]
  14. Rosenberg, E. Minimal partition coverings and generalized dimensions of a complex network. Phys. Lett. A 2017, 381, 1659–1664. [Google Scholar] [CrossRef]
  15. Schneider, C.M.; Kesselring, T.A.; Andrade, J.S., Jr.; Herrmann, H.J. Box-covering algorithm for fractal dimension of complex networks. Phys. Rev. E 2012, 86, 016707. [Google Scholar] [CrossRef] [PubMed]
  16. Daqing, L.; Kosmidis, K.; Bunde, A.; Havlin, S. Dimension of spatially embedded networks. Nat. Phys. 2011, 7, 481–484. [Google Scholar] [CrossRef]
  17. Ramirez-Arellano, A.; Sigarreta Almira, J.M.; Bory-Reyes, J. Fractional information dimensions of complex networks. Chaos Interdiscip. J. Nonlinear Sci. 2020, 30. [Google Scholar] [CrossRef] [PubMed]
  18. Zhang, H.; Hu, Y.; Lan, X.; Mahadevan, S.; Deng, Y. Fuzzy fractal dimension of complex networks. Appl. Soft Comput. 2014, 25, 514–518. [Google Scholar] [CrossRef]
  19. Peach, R.; Arnaudon, A.; Barahona, M. Relative, local and global dimension in complex networks. Nat. Commun. 2022, 13, 3088. [Google Scholar] [CrossRef]
  20. Wen, T.; Cheong, K.H. The fractal dimension of complex networks: A review. Inf. Fusion 2021, 73, 87–102. [Google Scholar] [CrossRef]
  21. Schumaker, R.P.; Chen, H. Textual analysis of stock market prediction using breaking financial news: The AZFin text system. ACM Trans. Inf. Syst. (TOIS) 2009, 27, 1–19. [Google Scholar] [CrossRef]
  22. Wüthrich, B.; Permunetilleke, D.; Leung, S.; Lam, W.; Cho, V.; Zhang, J. Daily prediction of major stock indices from textual www data. Hkie Trans. 1998, 5, 151–156. [Google Scholar] [CrossRef]
  23. Lavrenko, V.; Schmill, M.; Lawrie, D.; Ogilvie, P.; Jensen, D.; Allan, J. Mining of concurrent text and time series. In Proceedings of the KDD-2000 Workshop on Text Mining, Boston, MA, USA, 20 August 2000; pp. 37–44. [Google Scholar]
  24. Gidofalvi, G.; Elkan, C. Using news articles to predict stock price movements. Dep. Comput. Sci. Eng. Univ. Calif. San Diego 2001, 17. [Google Scholar]
  25. Chan, W.S. Stock price reaction to news and no-news: Drift and reversal after headlines. J. Financ. Econ. 2003, 70, 223–260. [Google Scholar] [CrossRef]
  26. Kloptchenko, A.; Eklund, T.; Karlsson, J.; Back, B.; Vanharanta, H.; Visa, A. Combining data and text mining techniques for analysing financial reports. Intell. Syst. Account. Financ. Manag. Int. J. 2004, 12, 29–41. [Google Scholar] [CrossRef]
  27. Fang, L.; Peress, J. Media coverage and the cross-section of stock returns. J. Financ. 2009, 64, 2023–2052. [Google Scholar] [CrossRef]
  28. Garcia, D. Sentiment during recessions. J. Financ. 2013, 68, 1267–1300. [Google Scholar] [CrossRef]
  29. Tetlock, P. Giving Content to Investor Sentiment: The Role of Media in the Stock Market. J. Financ. 2007, 62, 1139–1168. [Google Scholar] [CrossRef]
  30. Schumaker, R.P.; Chen, H. A quantitative stock prediction system based on financial news. Inf. Process. Manag. 2009, 45, 571–583. [Google Scholar] [CrossRef]
  31. Mantegna, R.N. Hierarchical structure in financial markets. Eur. Phys. J. B Condens. Matter Complex Syst. 1999, 11, 193–197. [Google Scholar] [CrossRef]
  32. Guo, X.; Zhang, H.; Tian, T. Development of stock correlation networks using mutual information and financial big data. PLoS ONE 2018, 13, e0195941. [Google Scholar] [CrossRef] [PubMed]
  33. Millington, T.; Niranjan, M. Partial correlation financial networks. Appl. Netw. Sci. 2020, 5, 1–19. [Google Scholar] [CrossRef]
  34. Wang, G.J.; Xie, C.; Stanley, H.E. Correlation structure and evolution of world stock markets: Evidence from Pearson and partial correlation-based networks. Comput. Econ. 2018, 51, 607–635. [Google Scholar] [CrossRef]
  35. Deng, J.; Deng, Y.; Cheong, K.H. Combining conflicting evidence based on Pearson correlation coefficient and weighted graph. Int. J. Intell. Syst. 2021, 36, 7443–7460. [Google Scholar] [CrossRef]
  36. Zhou, Y.; Chen, Z.; Liu, Z. Dynamic analysis and community recognition of stock price based on a complex network perspective. Expert Syst. Appl. 2023, 213, 118944. [Google Scholar] [CrossRef]
  37. Tumminello, M.; Aste, T.; Di Matteo, T.; Mantegna, R.N. A tool for filtering information in complex systems. Proc. Natl. Acad. Sci. USA 2005, 102, 10421–10426. [Google Scholar] [CrossRef]
  38. Bardoscia, M.; Barucca, P.; Battiston, S.; Caccioli, F.; Cimini, G.; Garlaschelli, D.; Saracco, F.; Squartini, T.; Caldarelli, G. The physics of financial networks. Nat. Rev. Phys. 2021, 3, 490–507. [Google Scholar] [CrossRef]
  39. Yan, X.G.; Xie, C.; Wang, G.J. Stock market network’s topological stability: Evidence from planar maximally filtered graph and minimal spanning tree. Int. J. Mod. Phys. B 2015, 29, 1550161. [Google Scholar] [CrossRef]
  40. Akın, A.A.; Akın, M.D. Zemberek, an open source NLP framework for Turkic languages. Structure 2007, 10, 1–5. [Google Scholar]
  41. Büyük, O.; Arslan, L.M. Learning from mistakes: Improving spelling correction performance with automatic generation of realistic misspellings. Expert Syst. 2021, 38, e12692. [Google Scholar] [CrossRef]
  42. Göker, S.; Can, B. Neural text normalization for turkish social media. In Proceedings of the 2018 3rd International Conference on Computer Science and Engineering (UBMK), Sarajevo, Bosnia and Herzegovina, 20–23 September 2018; pp. 161–166. [Google Scholar]
  43. Pennington, J.; Socher, R.; Manning, C.D. Glove: Global vectors for word representation. In Proceedings of the 2014 Conference on Empirical Methods in Natural Language Processing (EMNLP), Doha, Qatar, 25–29 October 2014; pp. 1532–1543. [Google Scholar]
  44. Yadav, A.; Vishwakarma, D.K. Sentiment analysis using deep learning architectures: A review. Artif. Intell. Rev. 2020, 53, 4335–4385. [Google Scholar] [CrossRef]
  45. Jang, B.; Kim, M.; Harerimana, G.; Kang, S.u.; Kim, J.W. Bi-LSTM model to increase accuracy in text classification: Combining Word2vec CNN and attention mechanism. Appl. Sci. 2020, 10, 5841. [Google Scholar] [CrossRef]
  46. Liu, G.; Guo, J. Bidirectional LSTM with attention mechanism and convolutional layer for text classification. Neurocomputing 2019, 337, 325–338. [Google Scholar] [CrossRef]
  47. Rehman, A.U.; Malik, A.K.; Raza, B.; Ali, W. A hybrid CNN-LSTM model for improving accuracy of movie reviews sentiment analysis. Multimed. Tools Appl. 2019, 78, 26597–26613. [Google Scholar] [CrossRef]
  48. Shirazi, H.; Dadahstabar, K.; Hashemi Golpaygani, S.A. A New Preprocessing Method for Rumor Detection in Social Networks based on LSTM-CNN. C4I J. 2020, 4, 38–51. [Google Scholar]
  49. Medford, A.J.; Kunz, M.R.; Ewing, S.M.; Borders, T.; Fushimi, R. Extracting knowledge from data through catalysis informatics. ACS Catal. 2018, 8, 7403–7429. [Google Scholar] [CrossRef]
  50. Balcı, M.A.; Batrancea, L.M.; Akgüller, Ö.; Gaban, L.; Rus, M.I.; Tulai, H. Fractality of Borsa Istanbul during the COVID-19 pandemic. Mathematics 2022, 10, 2503. [Google Scholar] [CrossRef]
  51. Rizvi, S.A.R.; Arshad, S. How does crisis affect efficiency? An empirical study of East Asian markets. Borsa Istanb. Rev. 2016, 16, 1–8. [Google Scholar] [CrossRef]
Figure 1. Zemberek framework for text pre-processing.
Fractalfract 08 00032 g001
Figure 2. The CNN architecture.
Fractalfract 08 00032 g002
Figure 3. The distribution of the sentiment scores for training.
Fractalfract 08 00032 g003
Figure 4. The daily number of economic news articles.
Fractalfract 08 00032 g004
Figure 5. Global efficiency and mean weighted clustering coefficients for time windows of width 5.
Fractalfract 08 00032 g005
Figure 6. Global efficiency and mean weighted clustering coefficients for time windows of width 10.
Fractalfract 08 00032 g006
Figure 7. Network fractal dimensions for time windows of width 5.
Fractalfract 08 00032 g007
Figure 8. Network fractal dimensions for time windows of width 10.
Fractalfract 08 00032 g008
Figure 9. The confusion matrix for GloVE+CNN method.
Fractalfract 08 00032 g009
Figure 10. The sentiment scores of “Dünya Newspaper” news.
Fractalfract 08 00032 g010
Figure 11. Time-series fractal dimensions for time windows of width 5.
Fractalfract 08 00032 g011
Figure 12. Time series fractal dimensions for time windows of width 10.
Fractalfract 08 00032 g012
Table 1. Autocorrelation test results for the topological measures of correlation networks.
Size Ef gl C ¯ w
5 0.001076 1.42979 ×   10 66
10 2.7422 ×   10 58 3.3948 ×   10 110
Table 2. Statistics for the network fractal dimensions.
Window Width = 5 Window Width = 10
Box Counting Information Dimension Box Counting Information Dimension
Mean 2.97603 2.98858 2.98239 2.99146
St. Dev. 0.102647 0.0565154 0.077086 0.0504829
Kurtosis 2.73689 3.49575 3.55735 3.21884
Skewness 0.14067 0.287069 0.476812 0.471767
Auto-
correlation
3.22183 ×   10 38 2.41392 ×   10 128 1.13294 ×   10 119 2.41392 ×   10 128
Table 3. Statistics for the time series fractal dimensions.
Window Width = 5 Window Width = 10
Box Counting Information Dimension Box Counting Information Dimension
Mean 1.43896 2.06947 1.38411 2.02618
St. Dev. 0.219088 0.634281 0.174963 0.326617
Kurtosis 2.48927 4.89401 2.79881 3.21286
Skewness 0.159775 1.1651 0.141031 0.510735
Auto-
correlation
0.00256618 5.44276 ×   10 17 2.10088 ×   10 33 3.06677 ×   10 64
Table 4. Independence test results for the network and time-series fractal dimensions emerging from the time window of width 5.
Box CountingInformation Dimension
p -Value p -Value
Blomqvist β 1.13823 ×   10 43 1.38677 ×   10 41
Kendall τ 1.13375 ×   10 65 9.17509 ×   10 65
Spearman Rank 1.77585 ×   10 51 5.72405 ×   10 51
Table 5. Independence test results for the network and time series fractal dimensions emerging from the time window of width 10.
Box CountingInformation Dimension
p -Value p -Value
Blomqvist β 3.62258 ×   10 41 5.60204 ×   10 44
Kendall τ 1.19095 ×   10 63 3.3197 ×   10 65
Spearman Rank 4.37525 ×   10 53 2.26343 ×   10 52
Table 6. Granger causality test results.
MethodWindow
Width
df 1df 2F-Testp-Value
Box counting53474 4.84164 0.00249822
Information dimension53474 6.62702 0.000215875
Box counting103464 6.71049 0.0001193249
Information dimension103464 5.75551 0.000916932
Table 7. NARDL test results for 5-length and box dimensions.
Residuals
Min1QMedian3QMax
−0.29724−0.099920.009560.082670.31936
Coefficients
EstimateStd. Error t value p value
Const1.470600.0807518.211<2 ×   10 16
T N 1 −0.996170.04117−24.196<2 ×   10 16
T N 2 0.049310.041231.1960.233
T S p 0.581640.0317718.308<2 ×   10 16
T S n 0.580100.0318518.214<2 ×   10 16
Residual Std. Error:0.137 R -squared:0.7805 (multiple)0.7769 (adjusted)
F -Statistic:213.4 p value:<2 ×   10 16
Model Diagnostic Test
JB testLM testARCH test
Stat0.987186300.16191370.6117887
p value0.027511530.86912910.7364644
Lags022
Short-Run Asymmetry Test
W-Stat:3.622888 p value:0.163418
Long-Run Coefficients
EstimateStd. Error t value p value
T N 2 0.0494980.0412731.19930.2304
T S p 0.5838750.03825715.2621<2 ×   10 16
T S n 0.5823320.03837115.1763<2 ×   10 16
Long-Run Asymmetry Test
W-Stat:3.650801 p value:0.1611531
Table 8. NARDL test results for 10-length and box dimensions.
Residuals
Min1QMedian3QMax
−0.216049−0.0532210.0017070.0596290.208139
Coefficients
EstimateStd. Error t value p value
Const1.239090.1001312.374<2 ×   10 16
T N 1 −1.102310.05948−18.533<2 ×   10 16
T N 2 0.252600.034387.347<3 ×   10 12
T S p 0.675600.0407616.574<2 ×   10 16
T S p 1 0.064430.058621.0990.2728
T S n 0.621640.0406215.303<2 ×   10 16
T S n 1 0.118630.058702.0210.0444
Residual Std. Error:0.07843 R -squared:0.9213 (multiple)0.9193 (adjusted)
F -Statistic:454.7 p value:<2 ×   10 16
Model Diagnostic Test
JB testLM testARCH test
Stat0.99158370.47266172.1763864
p value0.18441500.71697510.3368245
Lags022
Short-Run Asymmetry Test
W-Stat:0.9571566 p value:0.6196637
Long-Run Coefficients
EstimateStd. Error t value p value
T N 2 0.2291560.0336746.8052 1.009 ×   10 11
T S p 0.6128900.05246611.6816<2 ×   10 16
T S p 1 0.0584480.0507821.15090.24976
T S n 0.5823320.03837115.1763<2 ×   10 16
T S n 1 0.1076240.0490522.19410.02823
Long-Run Asymmetry Test
W-Stat:0.787724 p value:0.6744471
Table 9. NARDL test results for 5-length and information dimensions.
Residuals
Min1QMedian3QMax
−0.187620−0.0642020.0010510.0650400.180677
Coefficients
EstimateStd. Error t value p value
Const3.147800.2333313.491<2 ×   10 16
T N 1 −0.879110.06551−13.419<2 ×   10 16
T N 2 −0.026150.01711−1.5290.1276
T S p 0.987860.0165059.856<2 ×   10 16
T S p 1 −0.147490.07033−2.0970.2728
T S p 2 0.047720.032301.4770.1409
T S n 0.949630.0222042.785<2 ×   10 16
T S n 1 −0.062150.06650−0.9340.3510
Residual Std. Error:0.0862 R -squared:0.9815 (multiple)0.981 (adjusted)
F -Statistic:1789 p value:<2 ×   10 16
Model Diagnostic Test
JB testLM testARCH test
Stat0.9794124822.09785788.34441450
p value0.0012983420.43870980.01541819
Lags022
Short-Run Asymmetry Test
W-Stat:1.38352 p value:0.5006941
Long-Run Coefficients
EstimateStd. Error t value p value
T N 2 −0.0297500.019816−1.50130.13328
T S p 1.1237040.08418913.3473<2 ×   10 16
T S p 1 −0.1677710.091711−1.82940.06735
T S p 2 0.0542820.0373871.45190.14654
T S n 1.0802230.08141513.2682<2 ×   10 16
T S n 1 −0.0706940.080470−0.87850.37967
Long-Run Asymmetry Test
W-Stat:1.790194 p value:0.408568
Table 10. NARDL test results for 10-length and information dimensions.
Residuals
Min1QMedian3QMax
−0.141489−0.057850−0.0004890.0558760.146757
Coefficients
EstimateStd. Error t value p value
Const2.362480.0858227.529<2 ×   10 16
T N 1 −0.941220.03302−28.508<2 ×   10 16
T N 2 0.035680.020611.7310.0848
T S p 0.857430.0306128.014<2 ×   10 16
T S p 1 0.034760.049050.7090.4792
T S n 0.892300.0315328.300<2 ×   10 16
Residual Std. Error:0.06968 R -squared:0.9147 (multiple)0.9129 (adjusted)
F -Statistic:501.8 p value:<2 ×   10 16
Model Diagnostic Test
JB testLM testARCH test
Stat0.9788267092.83422760.5463741
p value0.0011797180.38724640.7609504
Lags022
Short-Run Asymmetry Test
W-Stat:0.5051744 p value:0.7767885
Long-Run Coefficients
EstimateStd. Error t value p value
T N 2 0.0379060.0214601.76630.07734
T S p 0.9109840.05183017.5762<2 ×   10 16
T S p 1 0.0369320.0512390.72080.47105
T S n 0.9480260.02248042.1714<2 ×   10 16
Long-Run Asymmetry Test
W-Stat:0.5702442 p value:0.7519224
Disclaimer/Publisher’s Note: The statements, opinions and data contained in all publications are solely those of the individual author(s) and contributor(s) and not of MDPI and/or the editor(s). MDPI and/or the editor(s) disclaim responsibility for any injury to people or property resulting from any ideas, methods, instructions or products referred to in the content.

