

The Impact of COVID-19 on BRICS and MSCI Emerging Markets Efficiency: Evidence from MF-DFA


Abstract
1. Introduction
2. Data and Research Methodology
2.1. Time Series Analysis of Stock Markets
2.1.1. Stock Market Returns
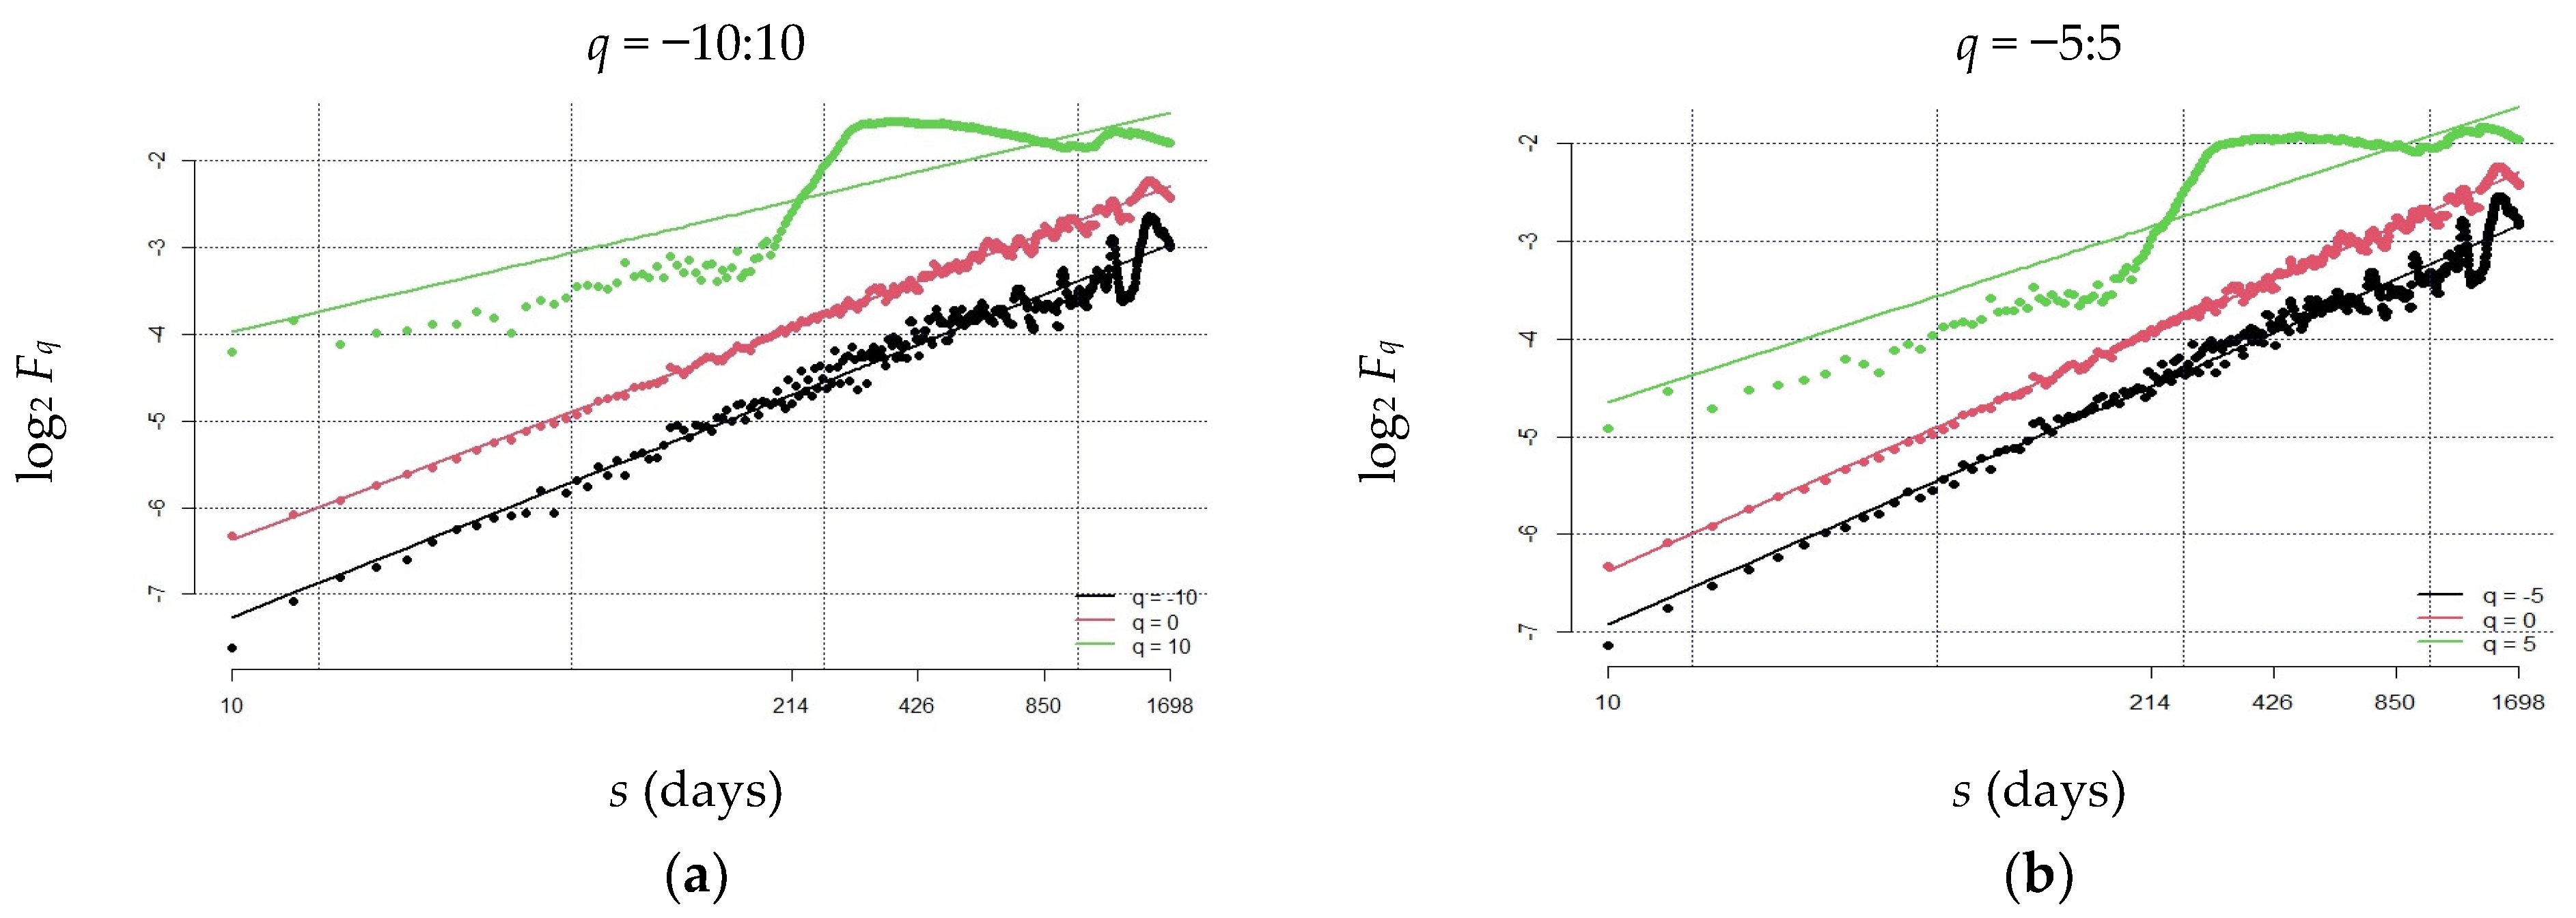
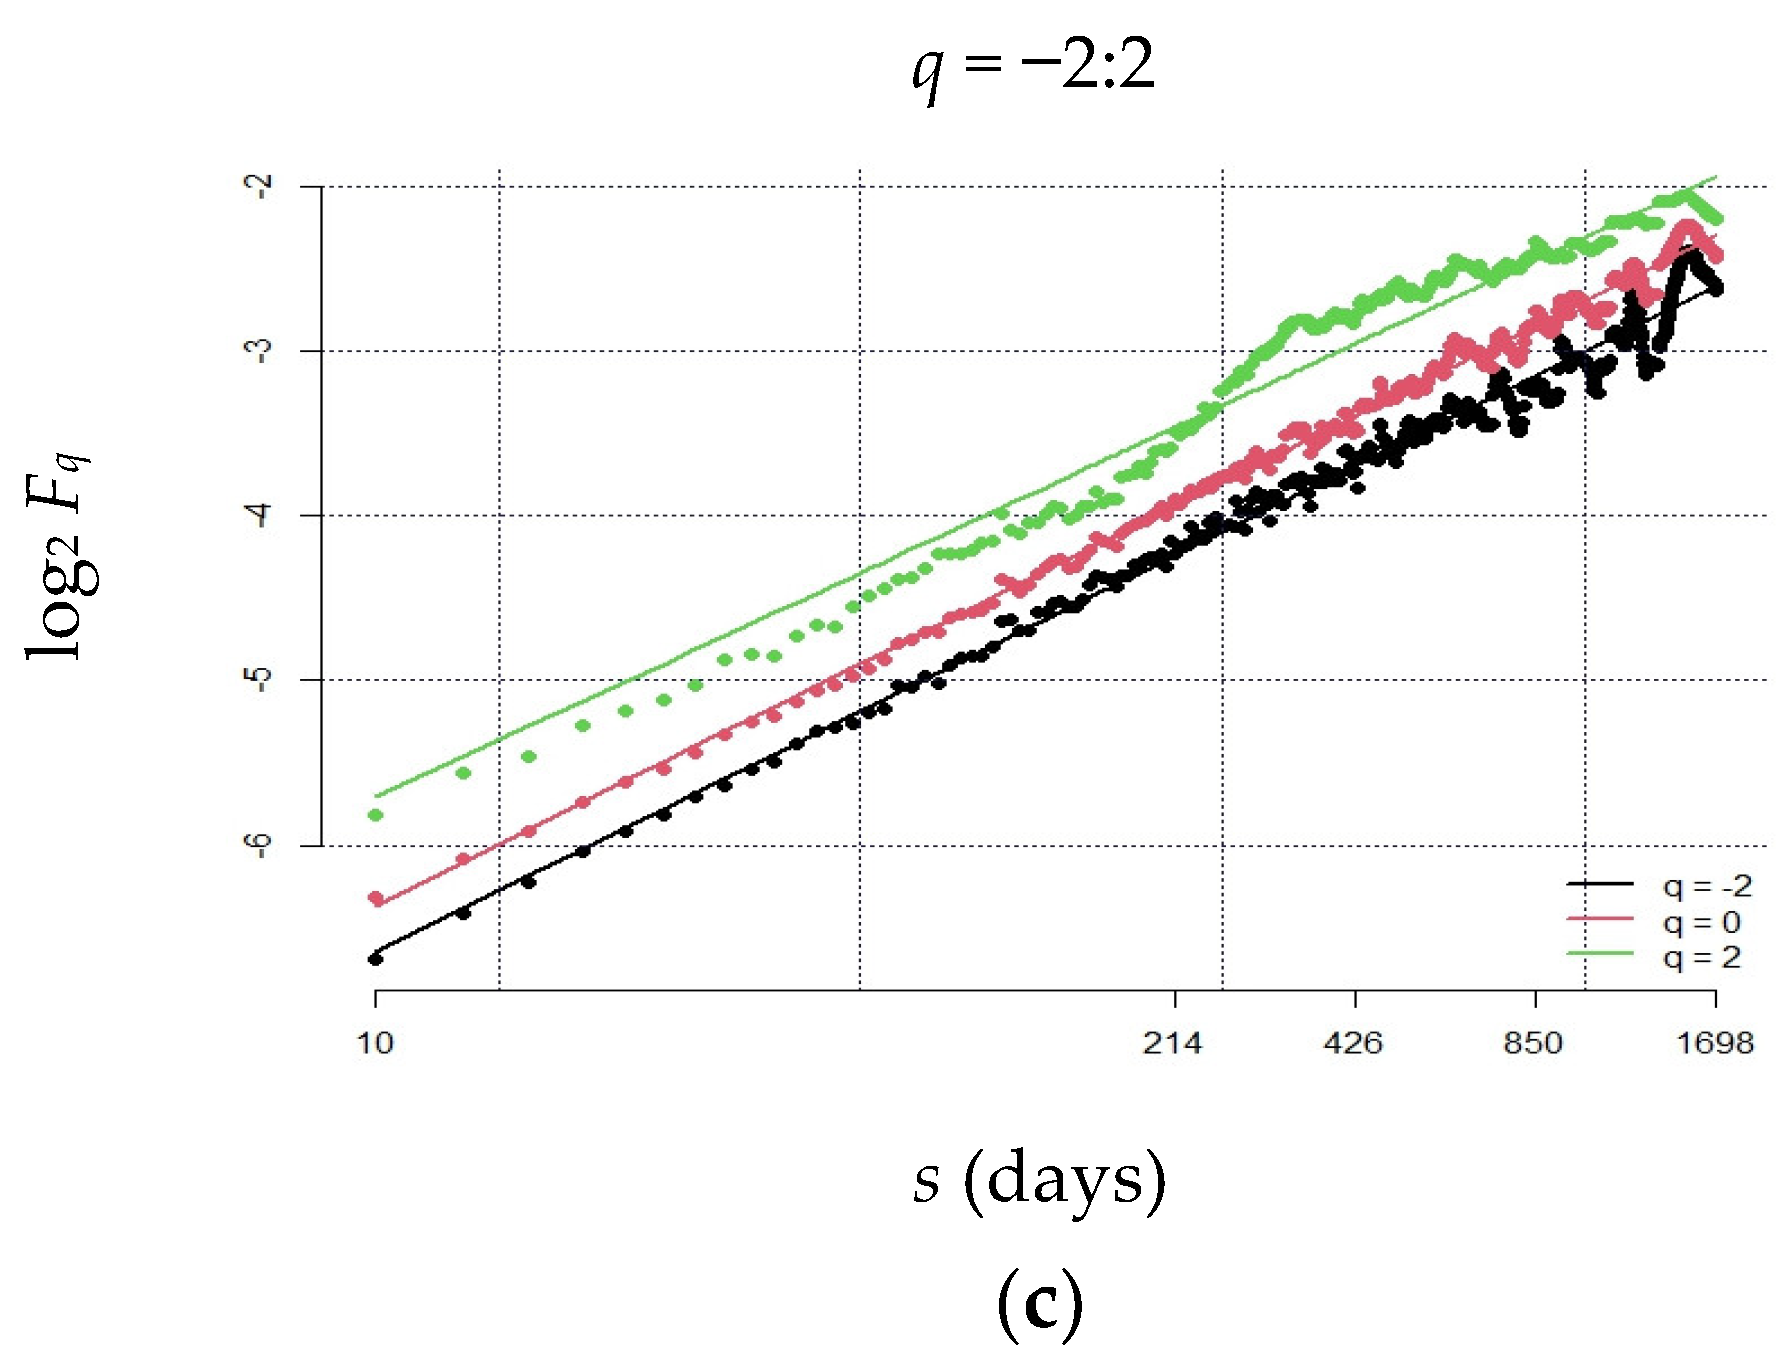
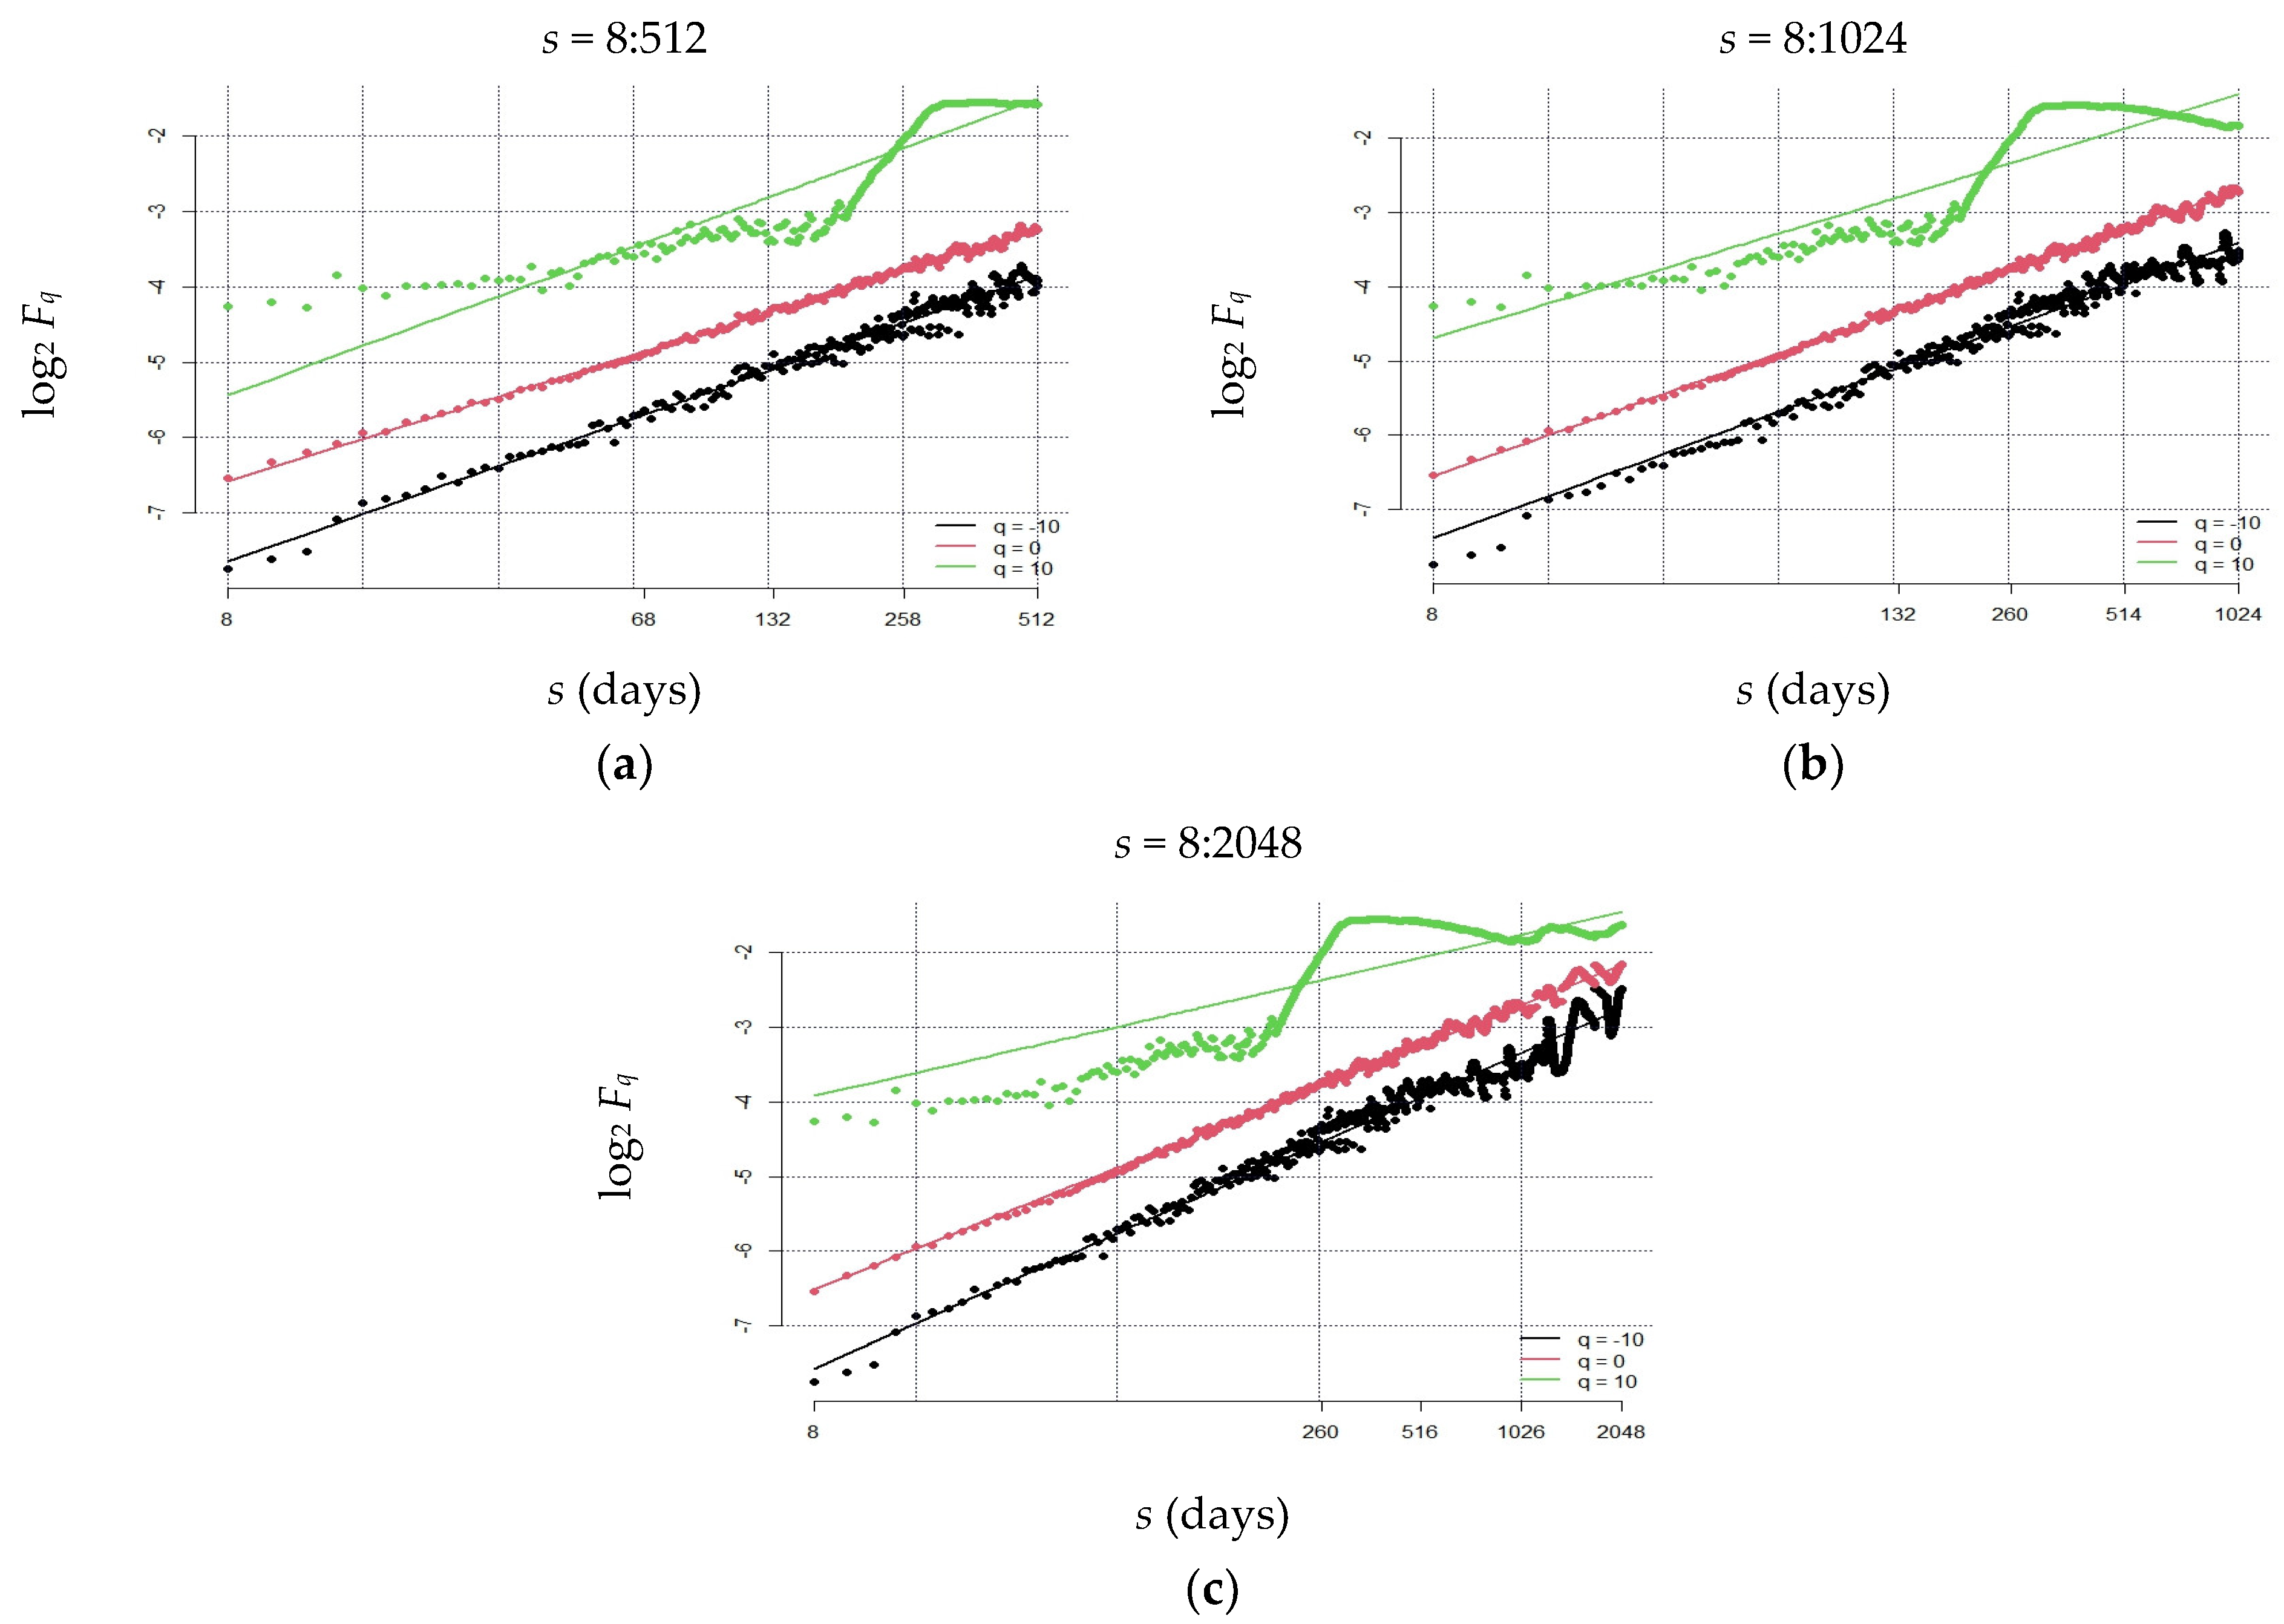
2.1.2. Multifractal Detrended Fluctuation Analysis (MF-DFA)
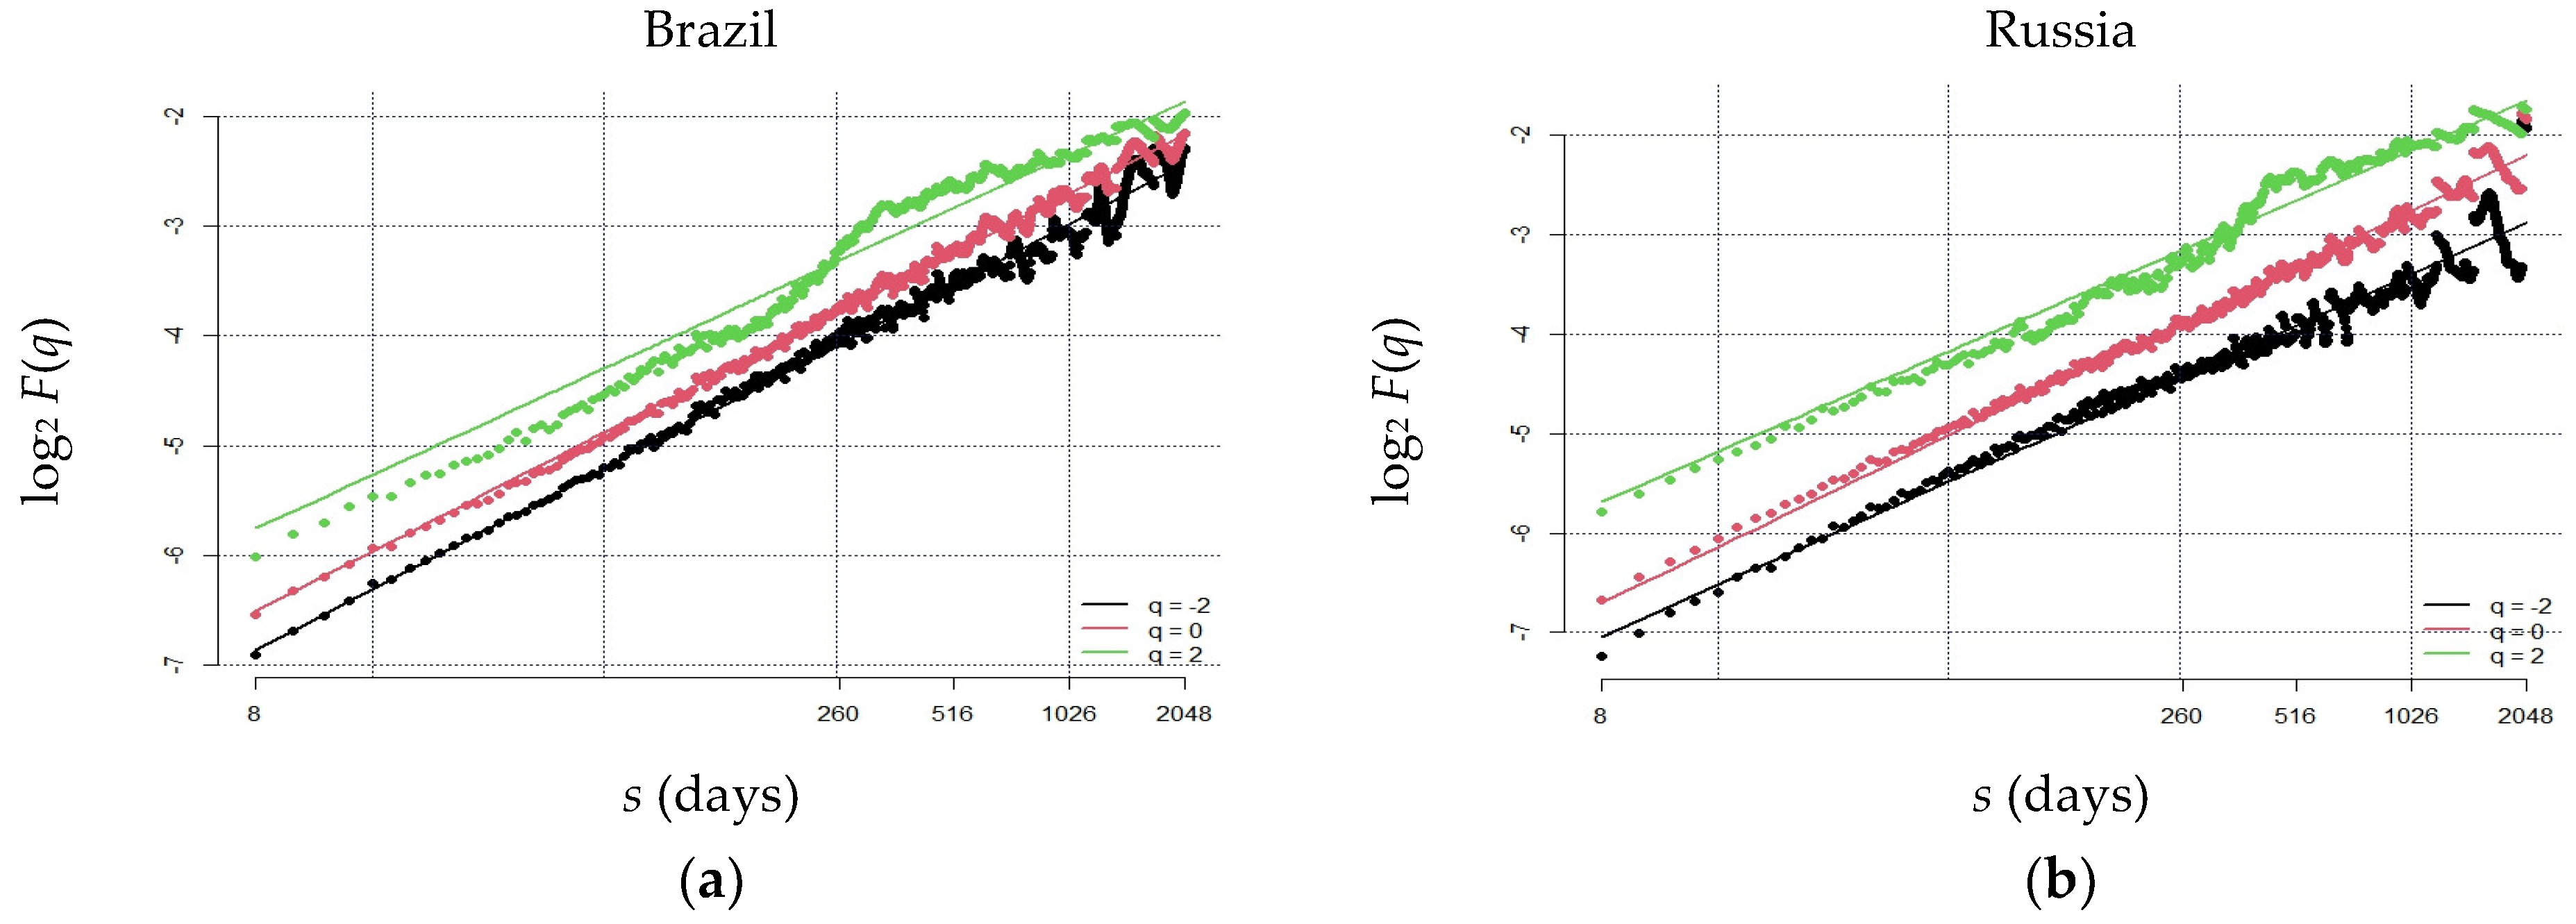
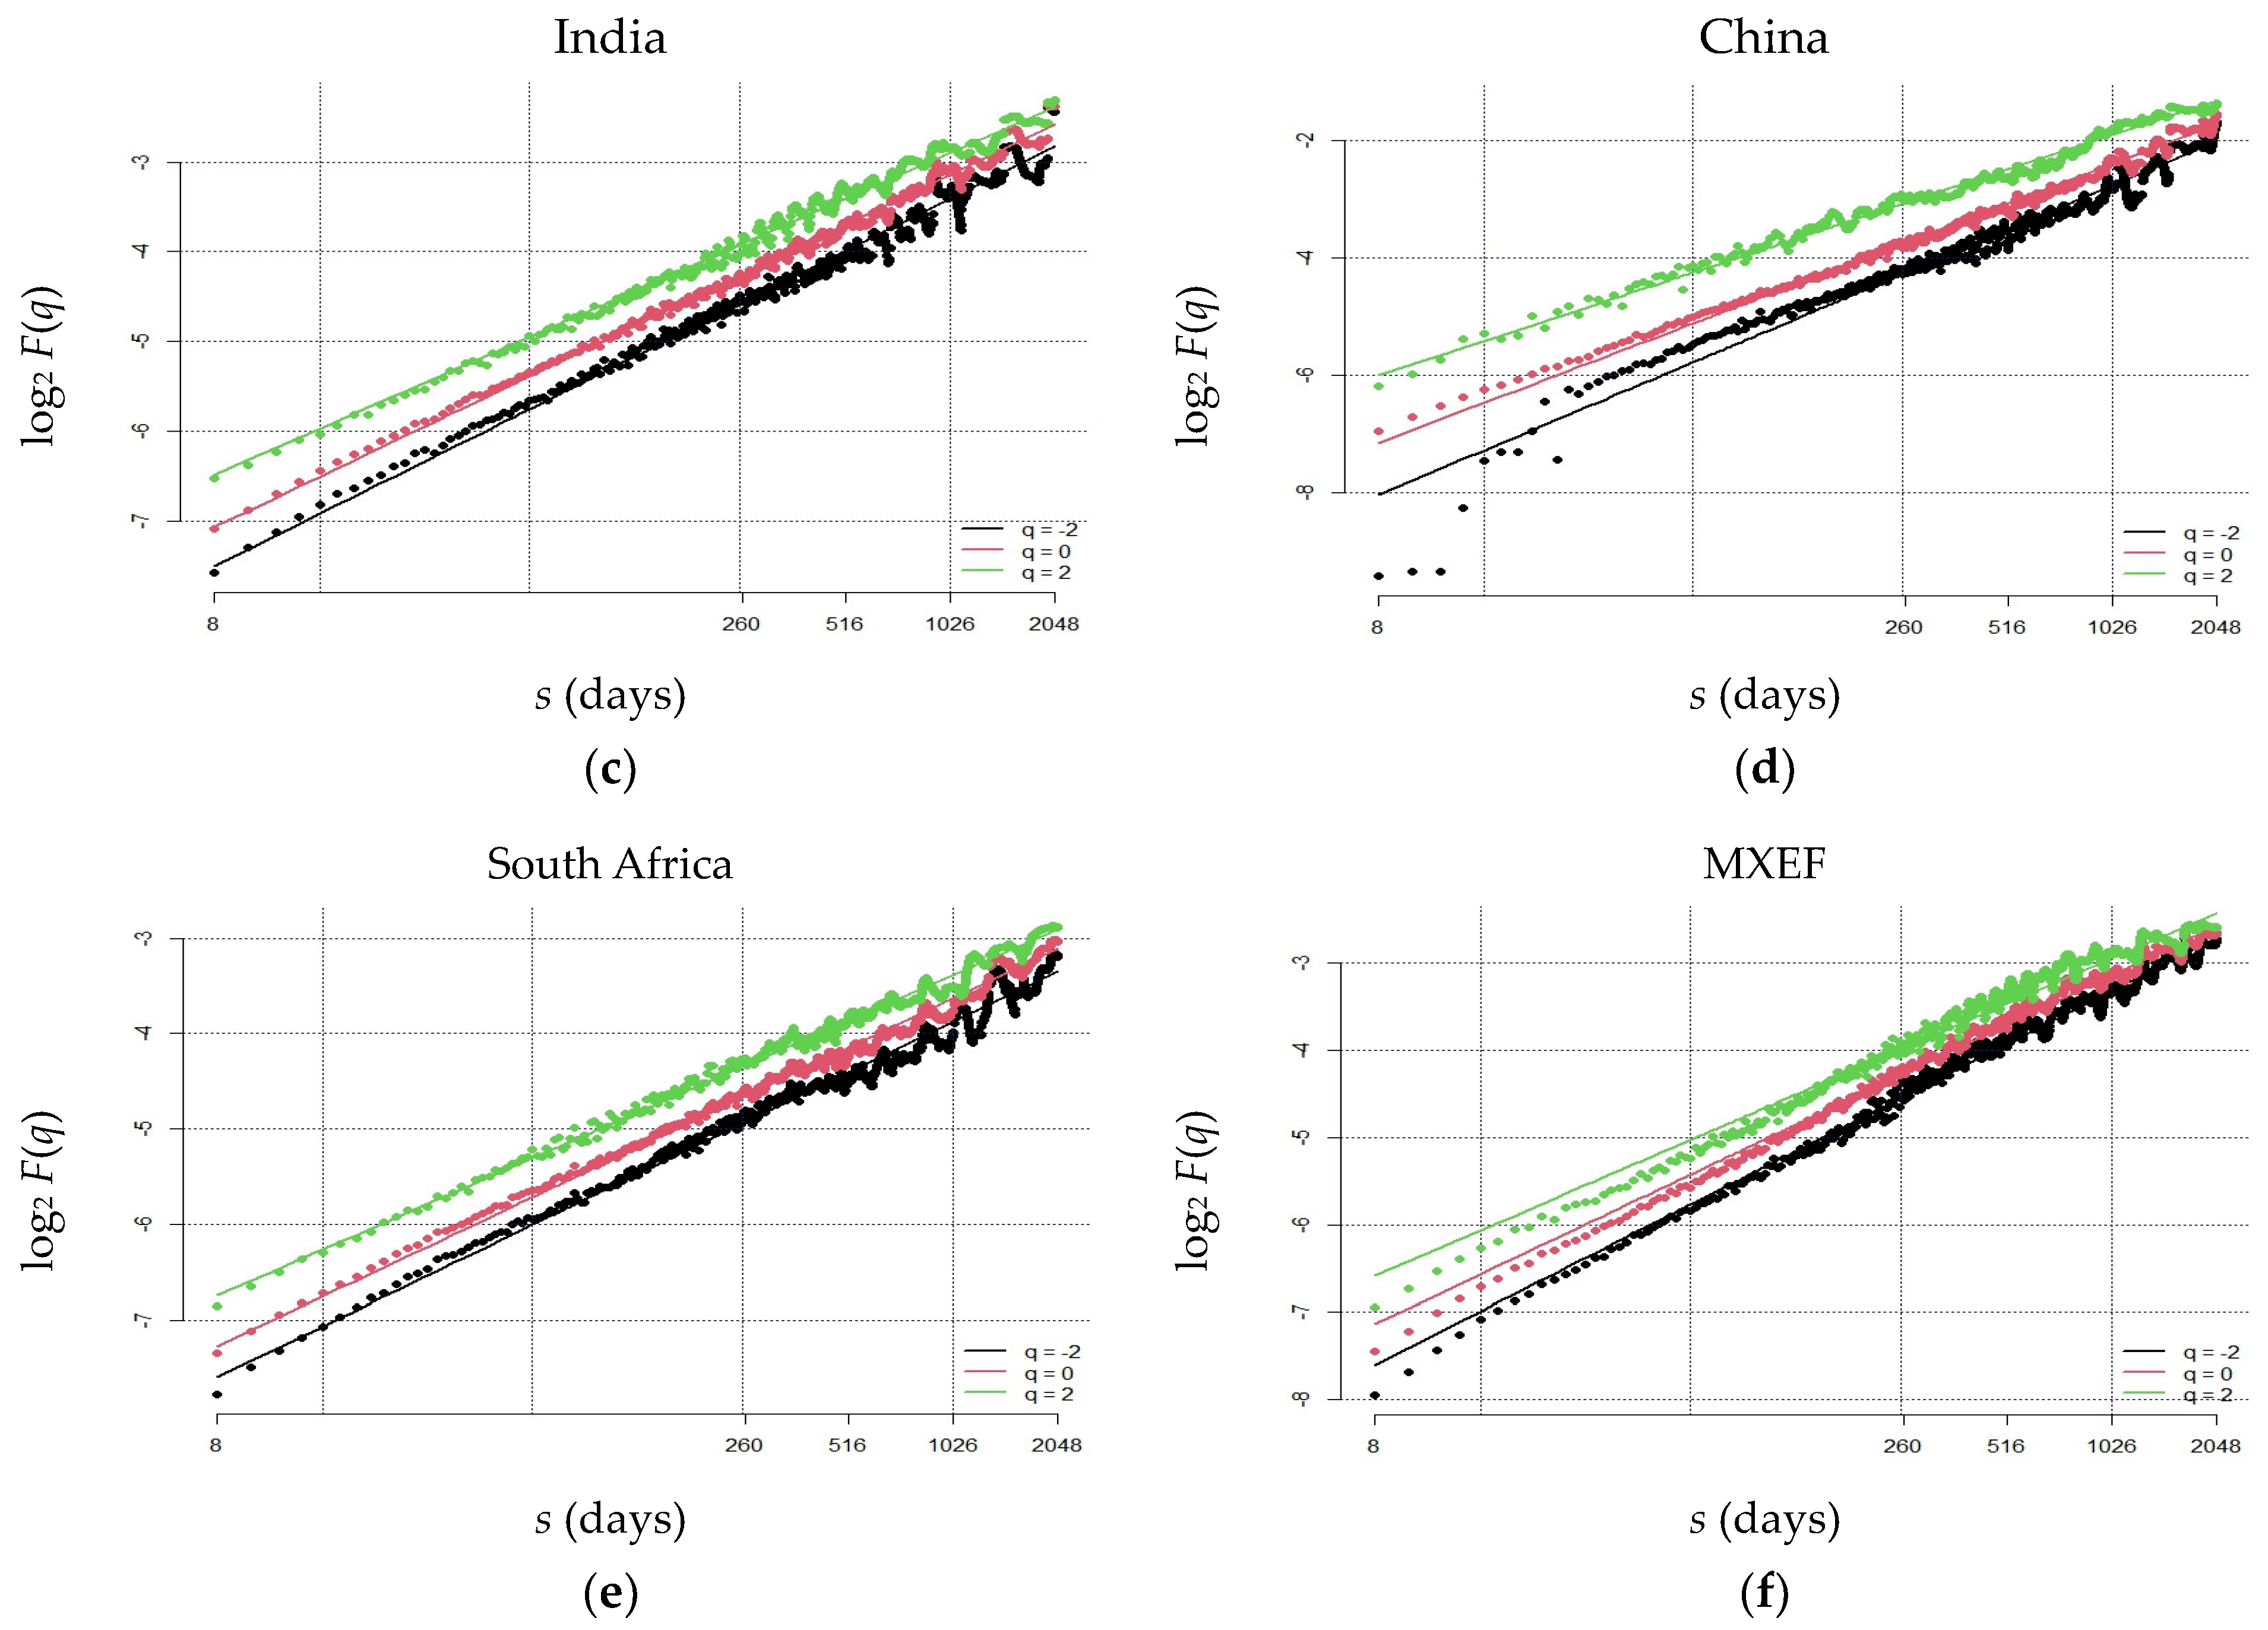
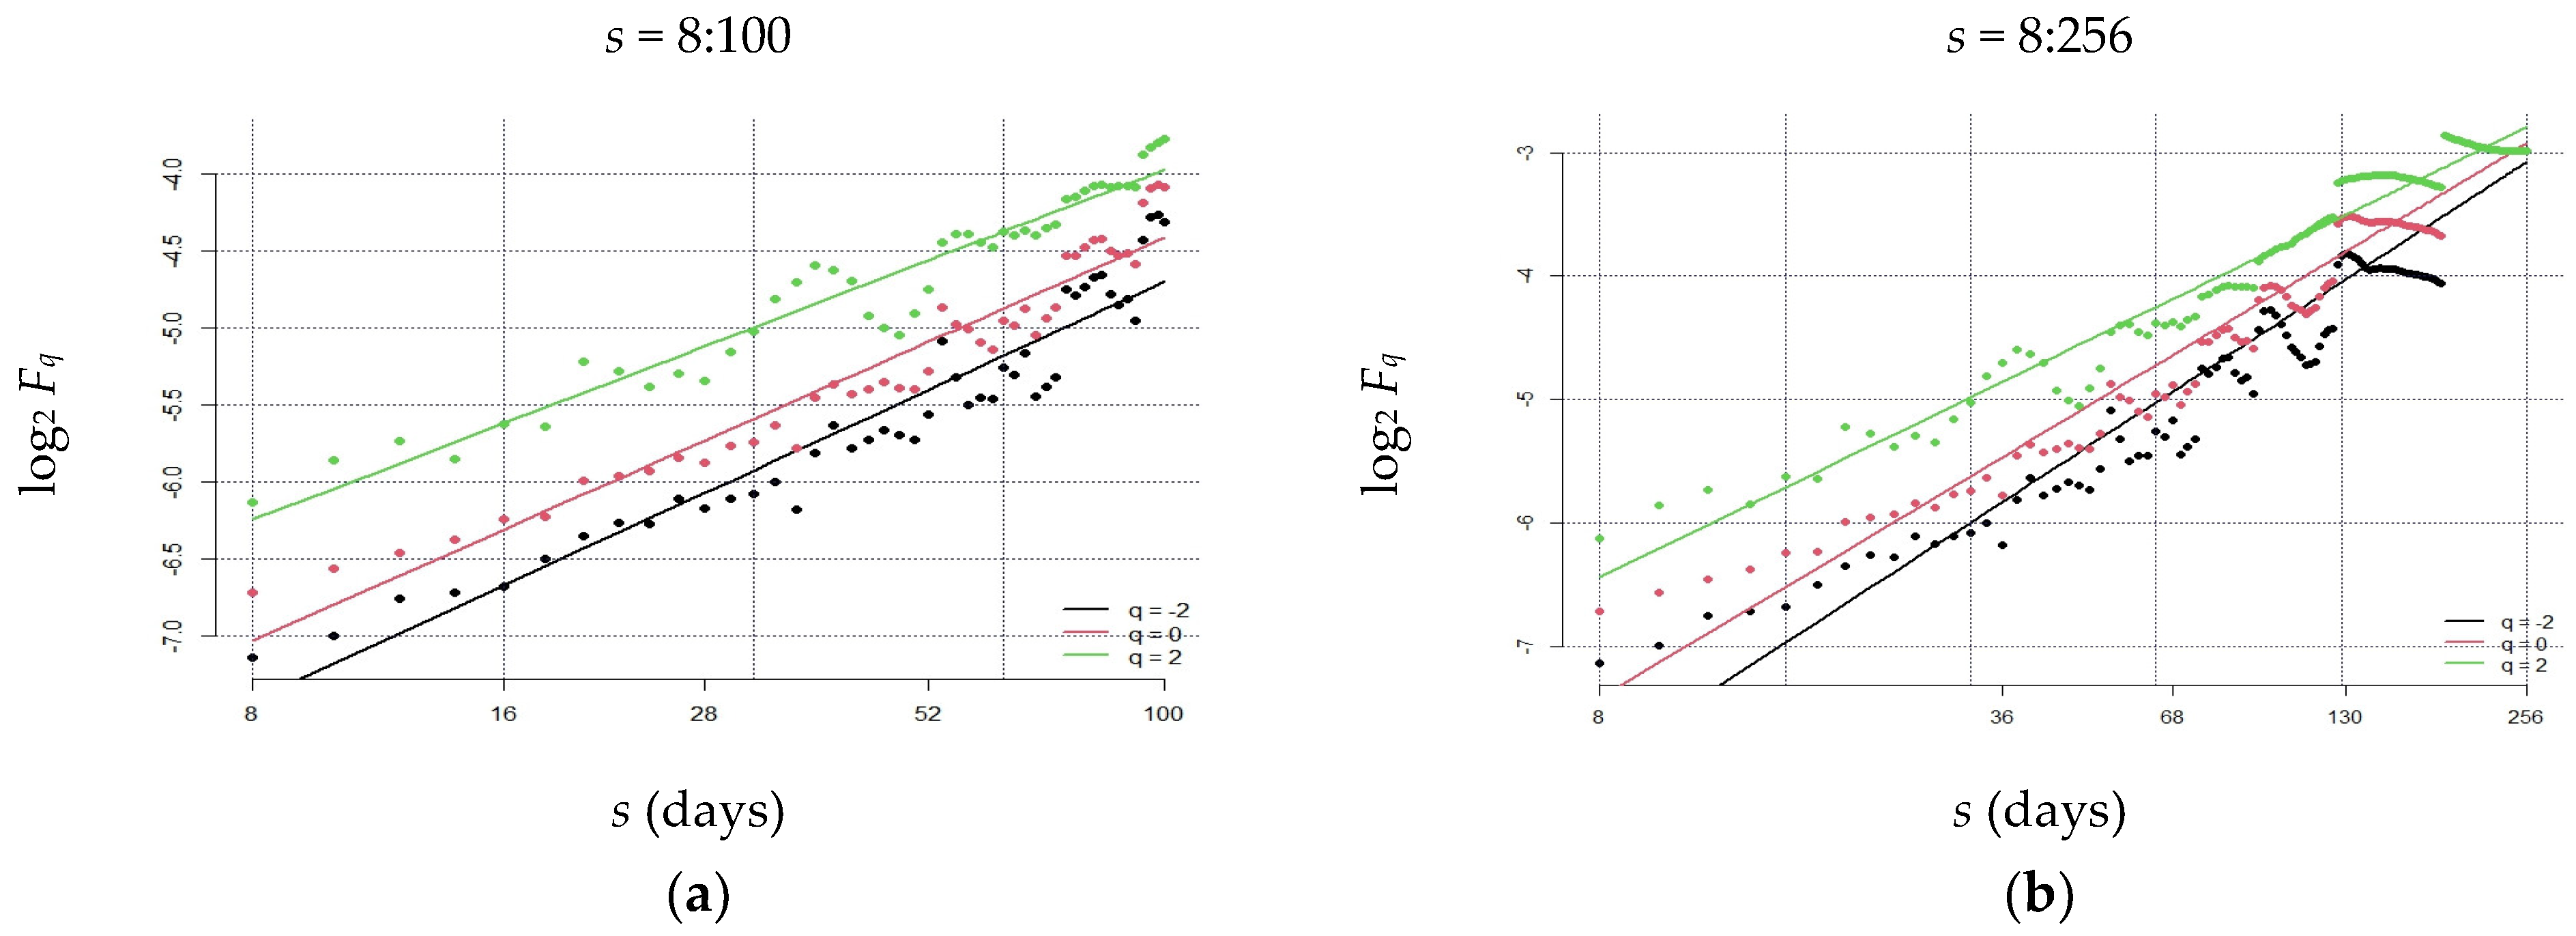
3. Empirical Results
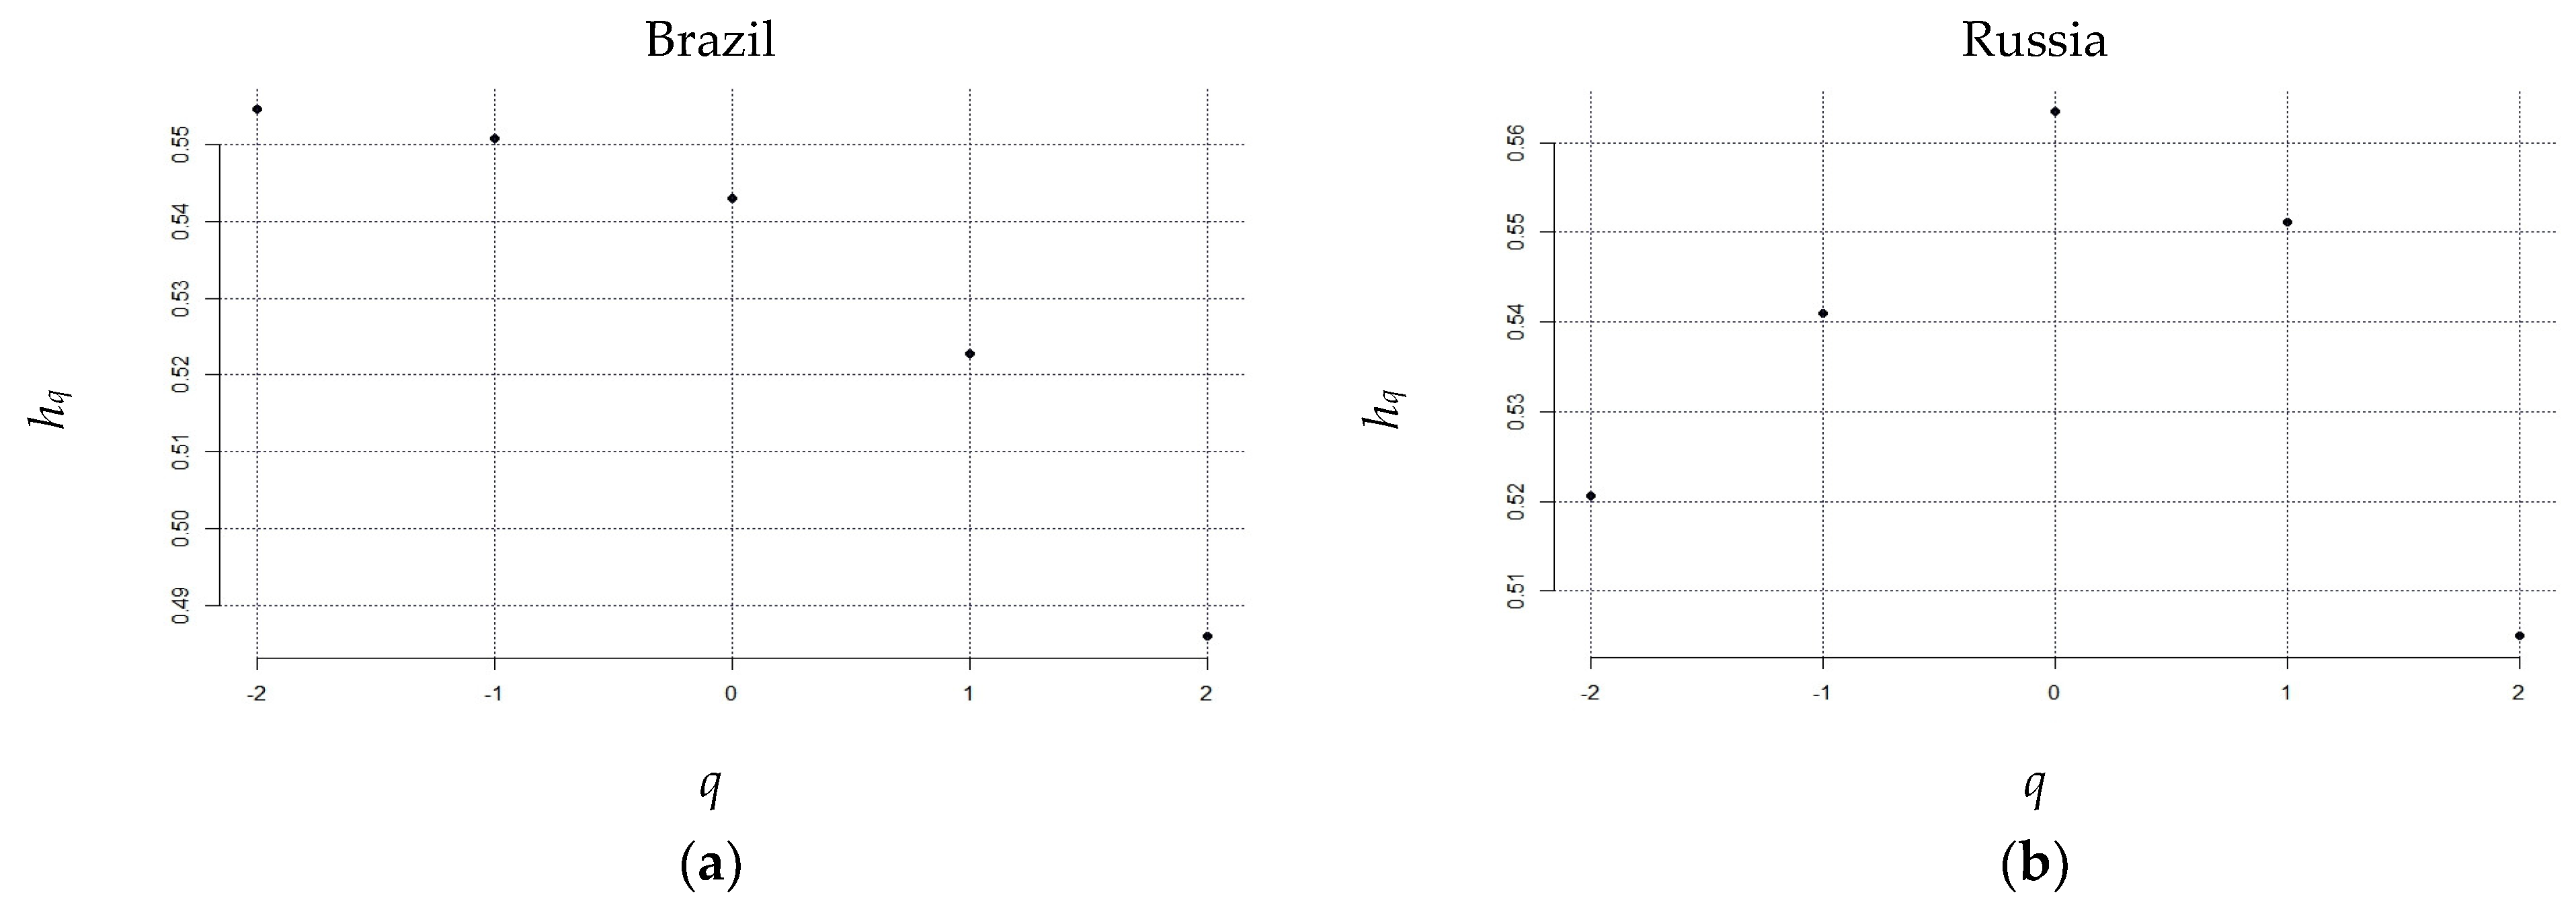
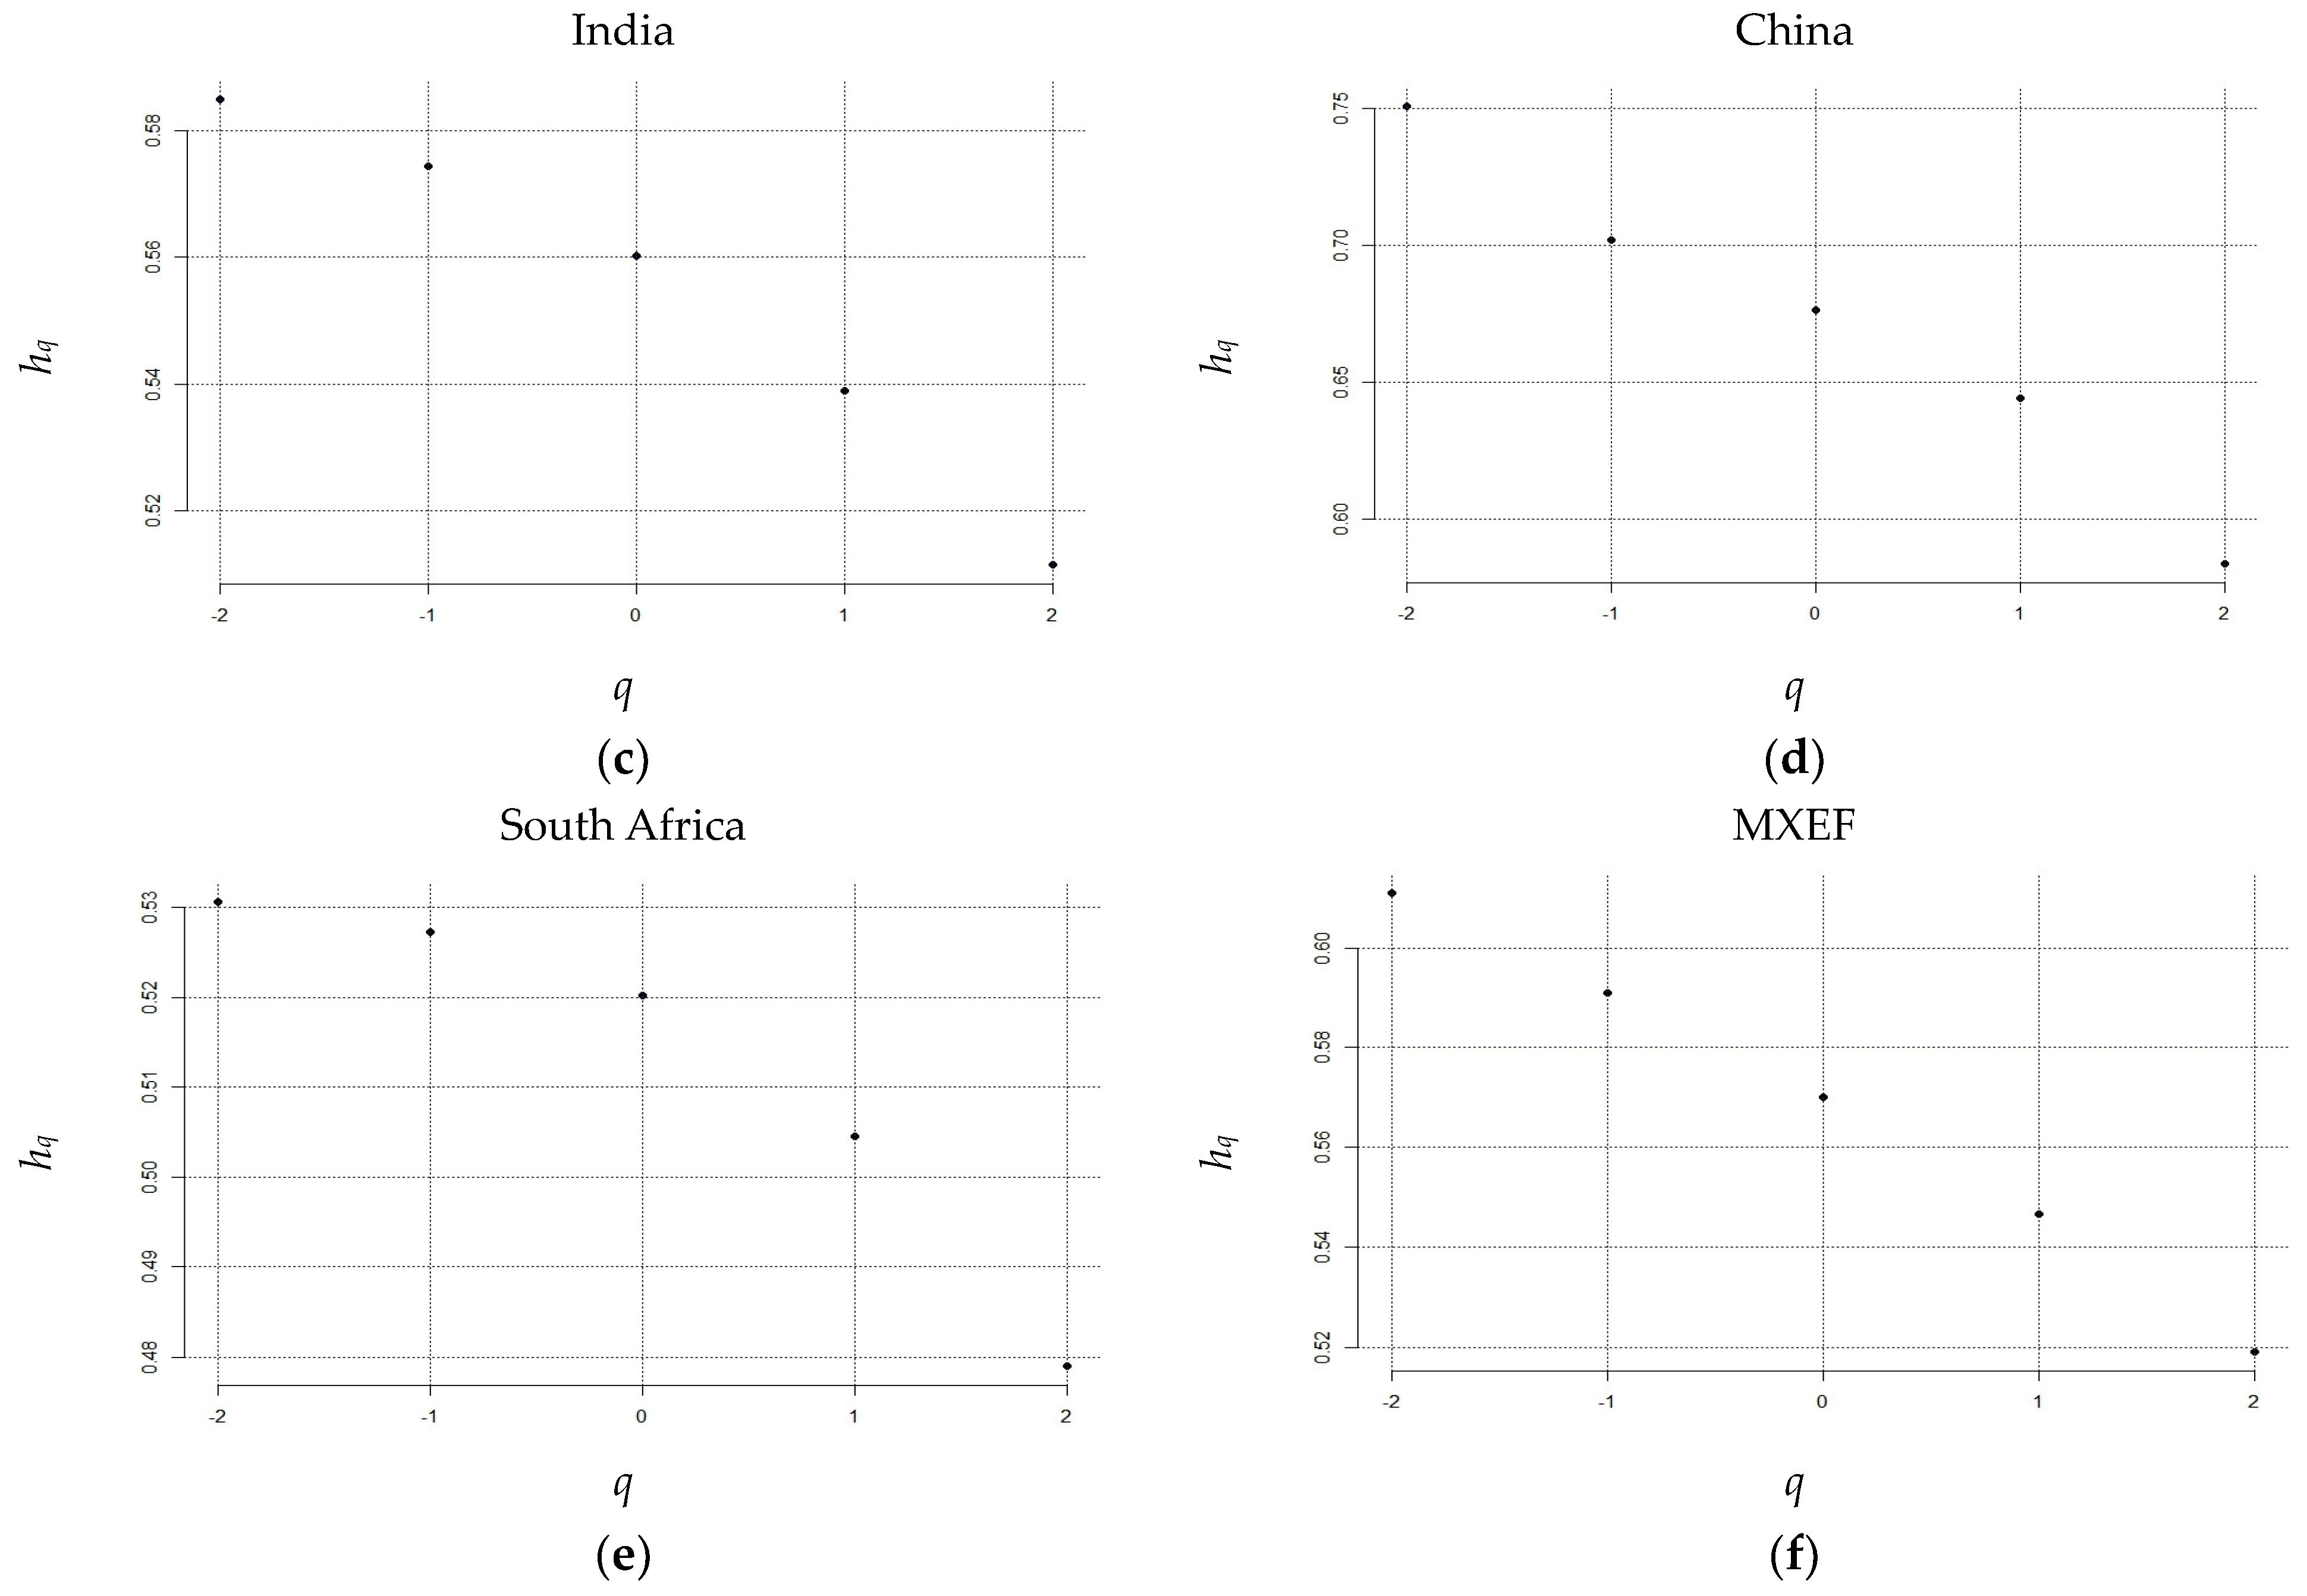
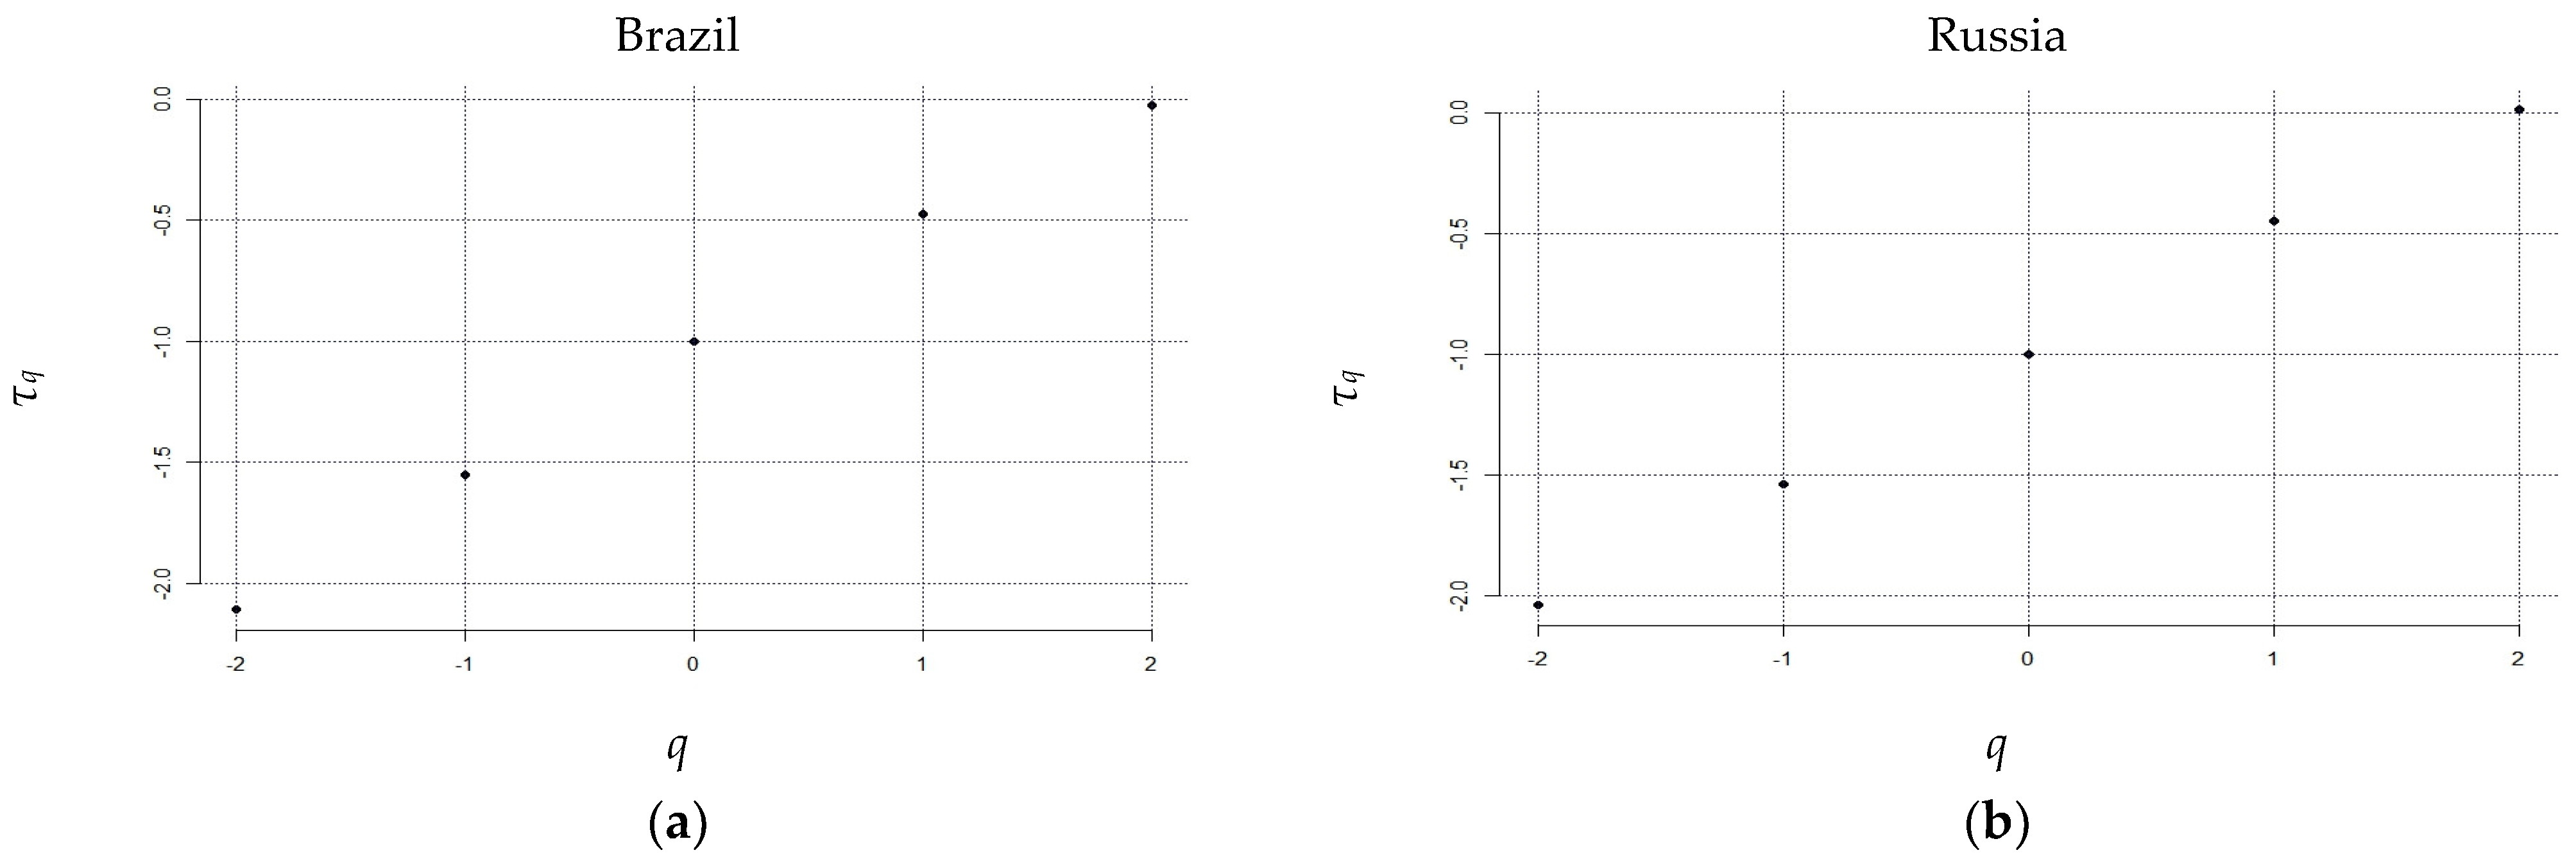
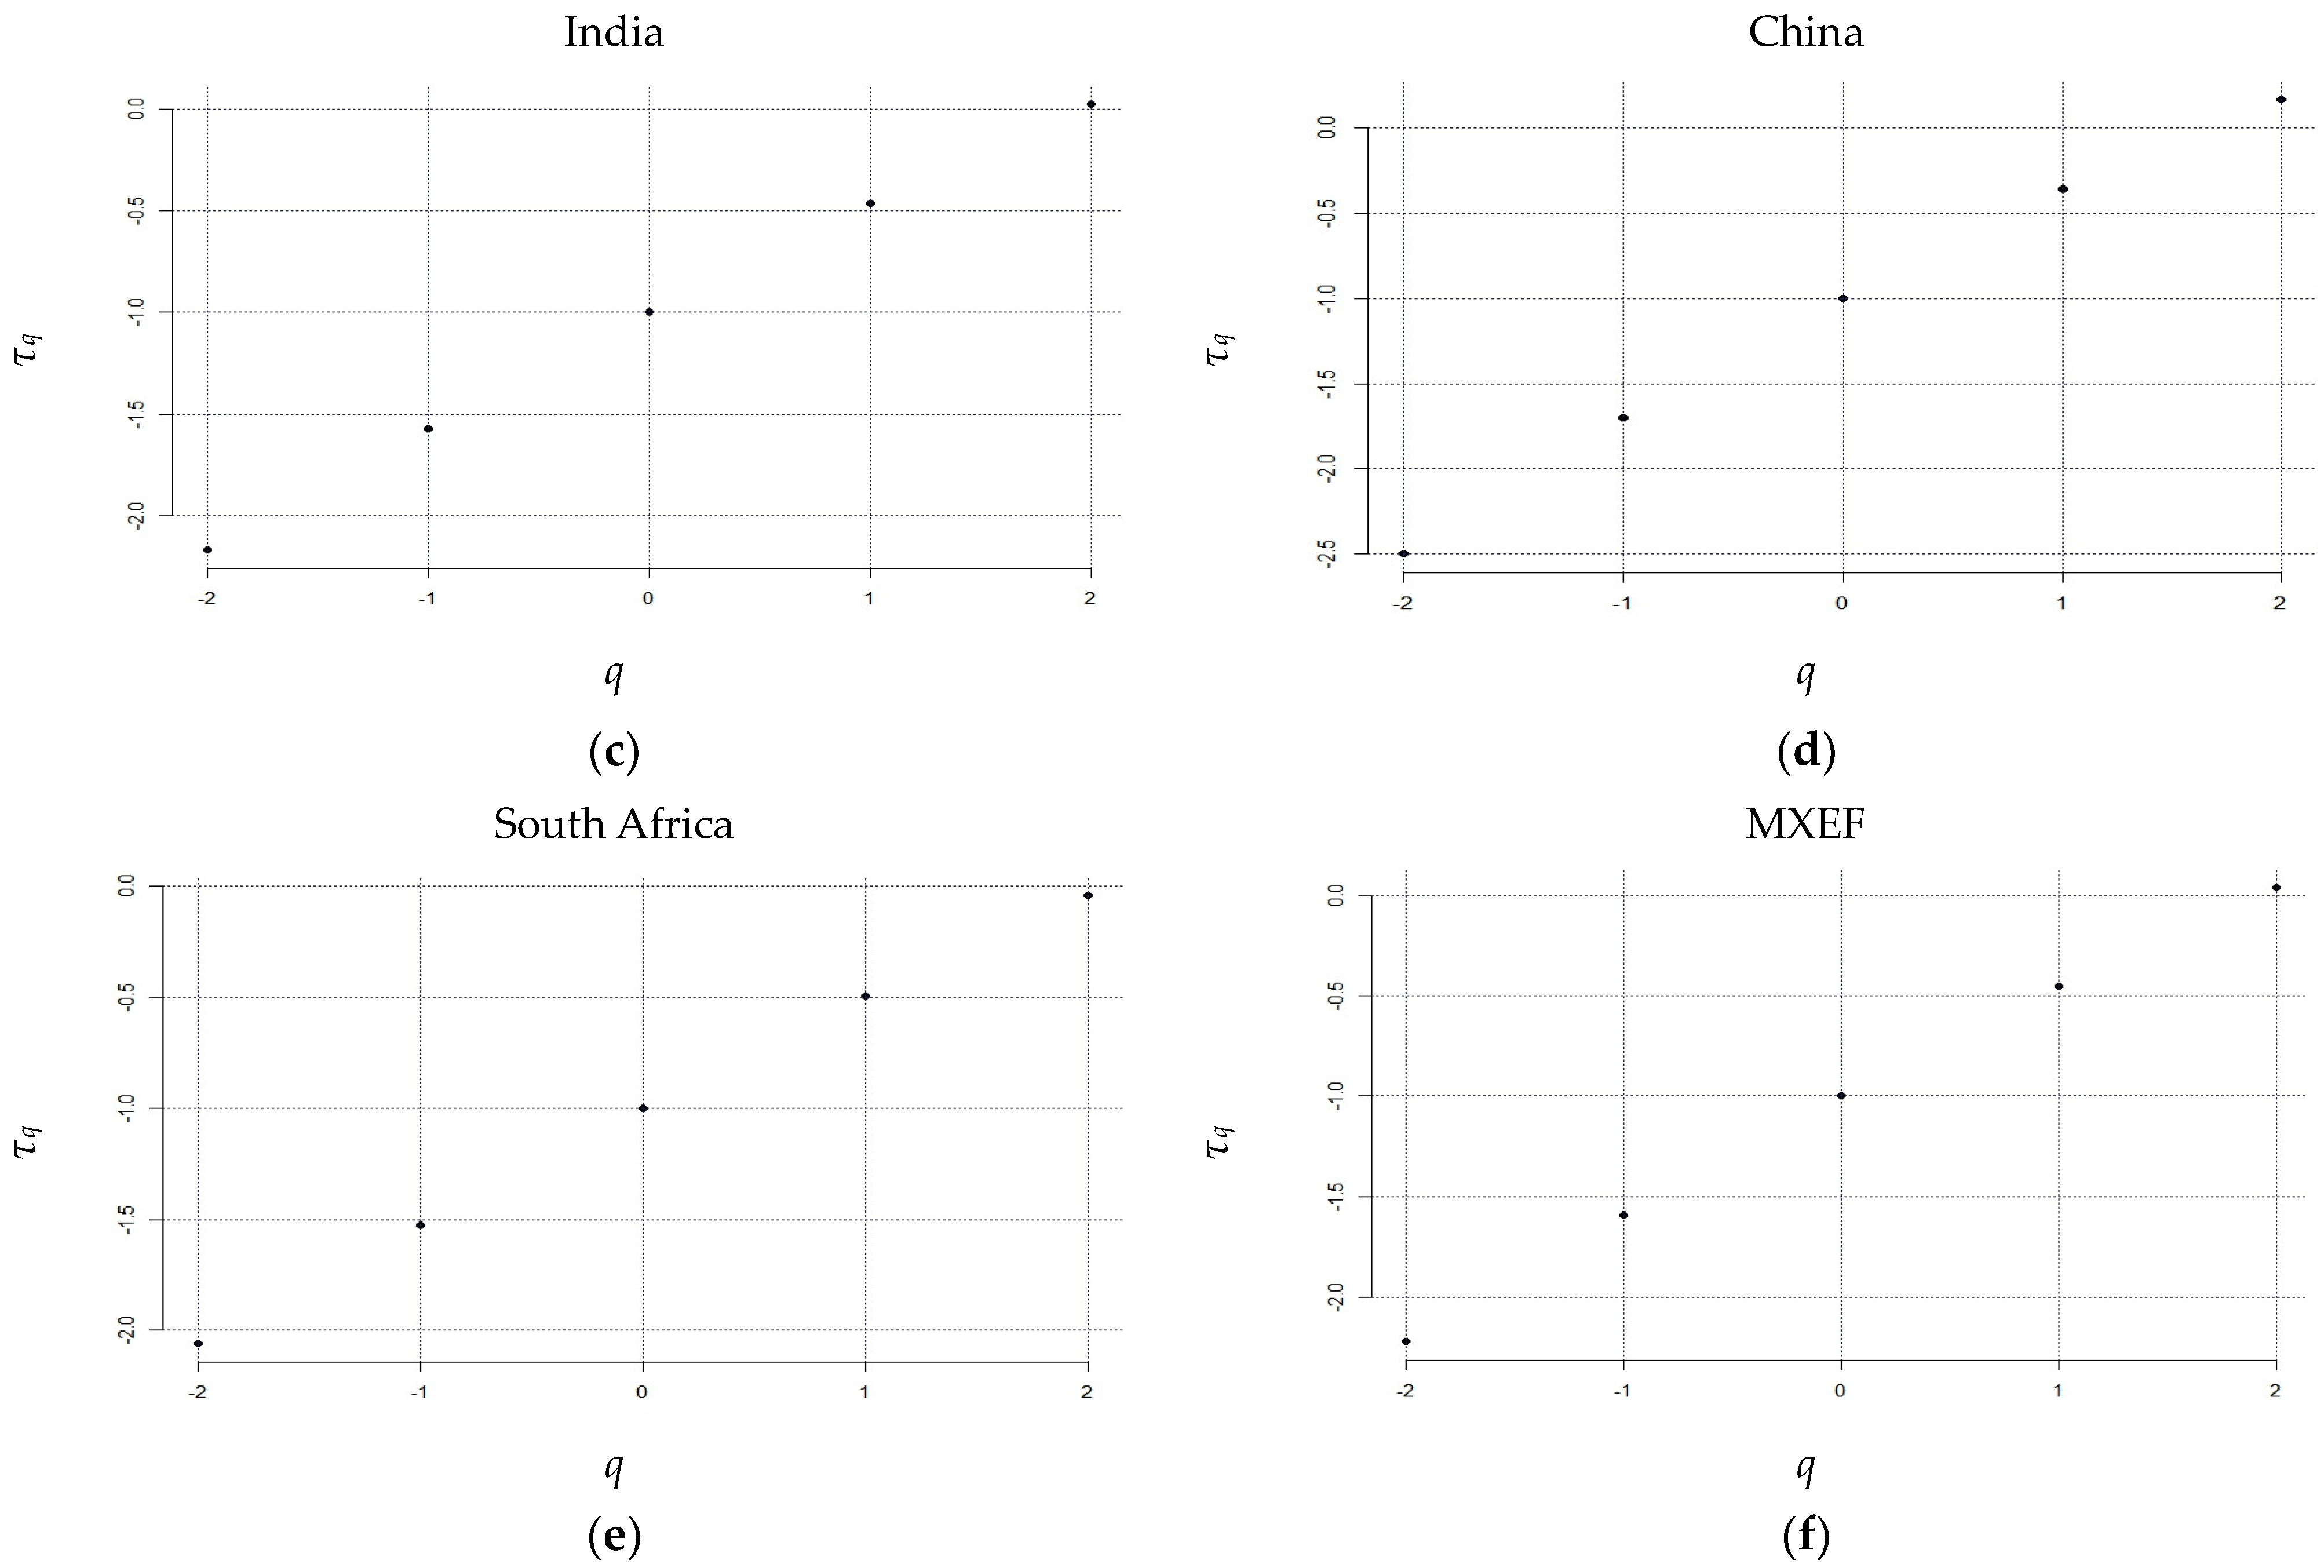
3.1. Overview of BRICS Stock Market Efficiency
3.2. Ranking BRICS Stock Market Efficiency
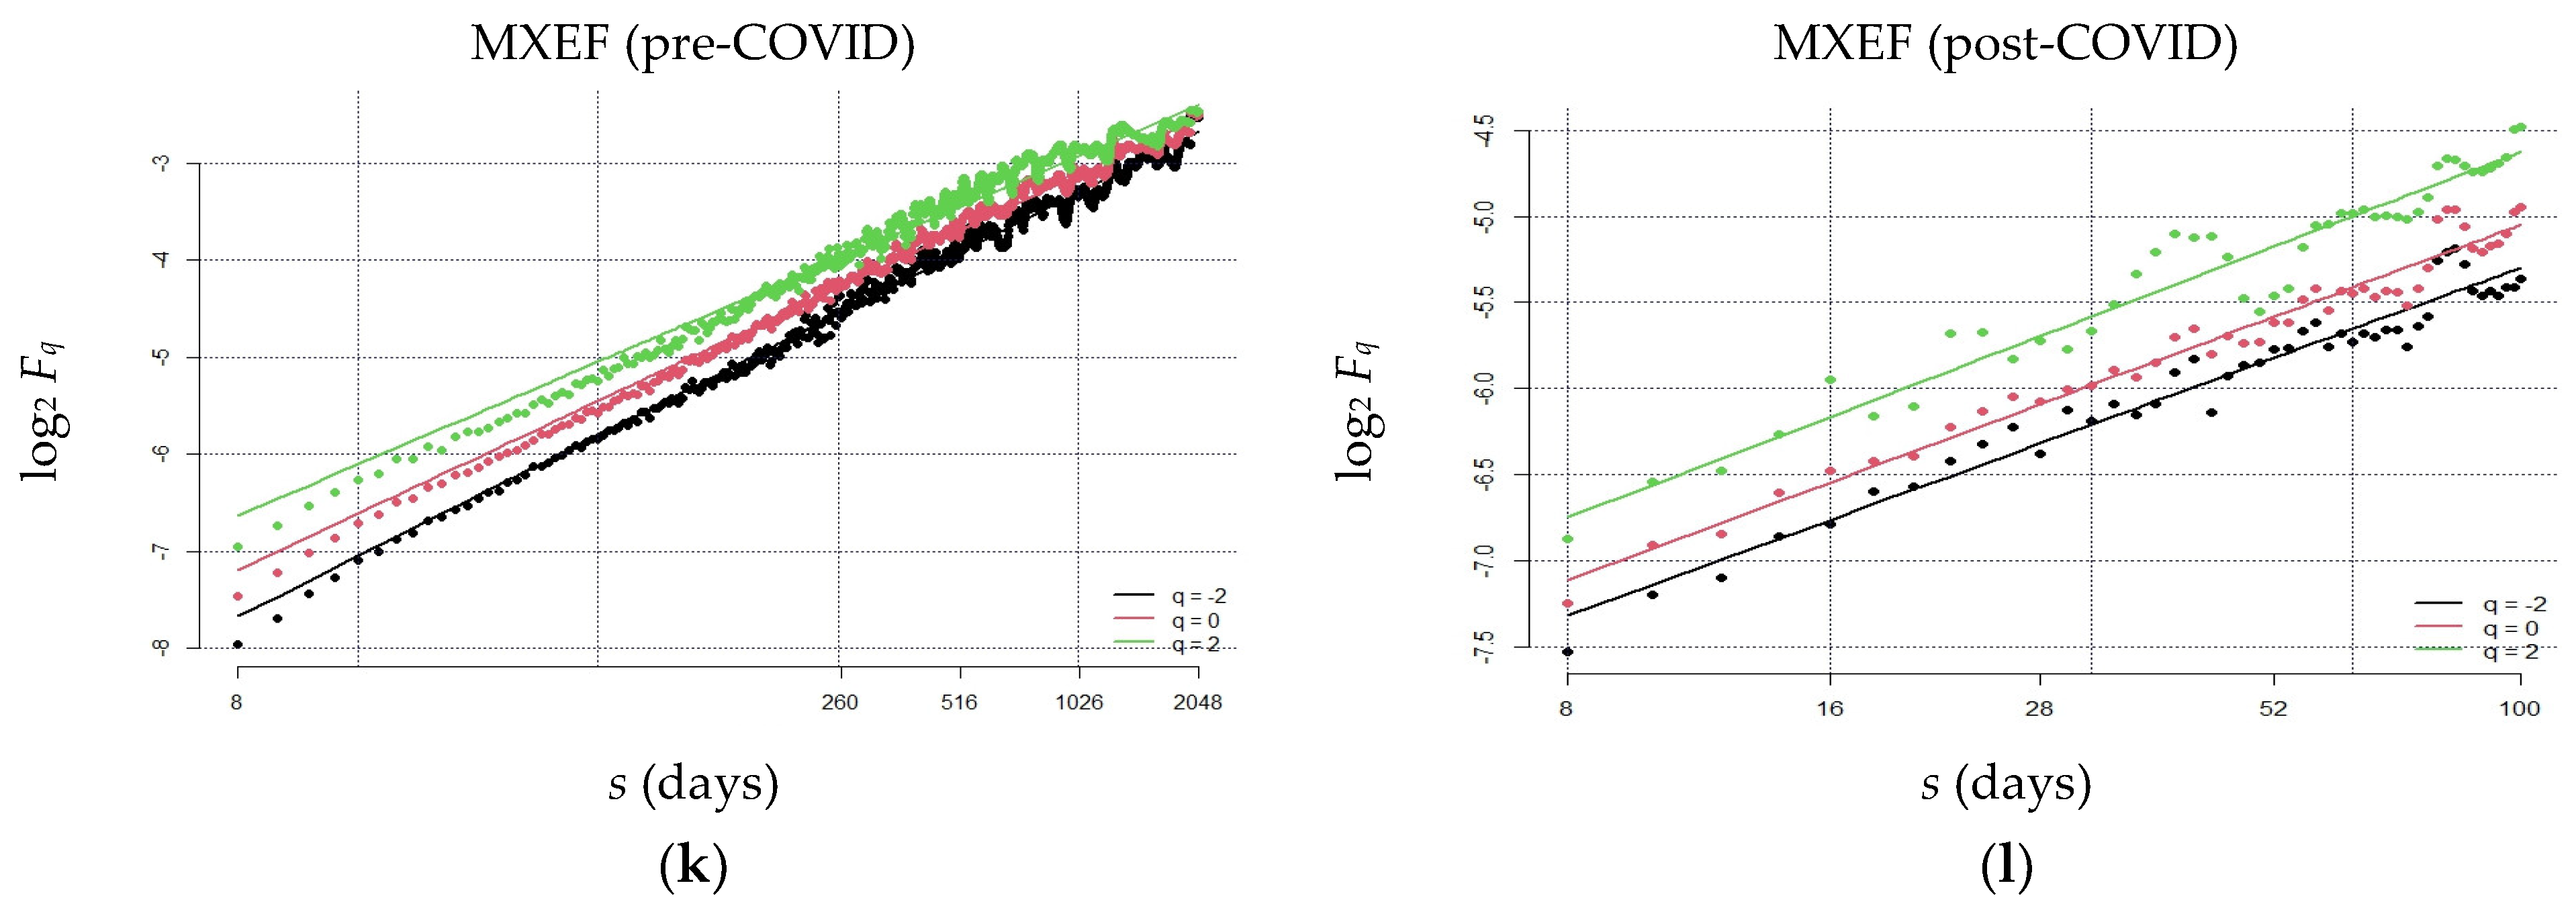
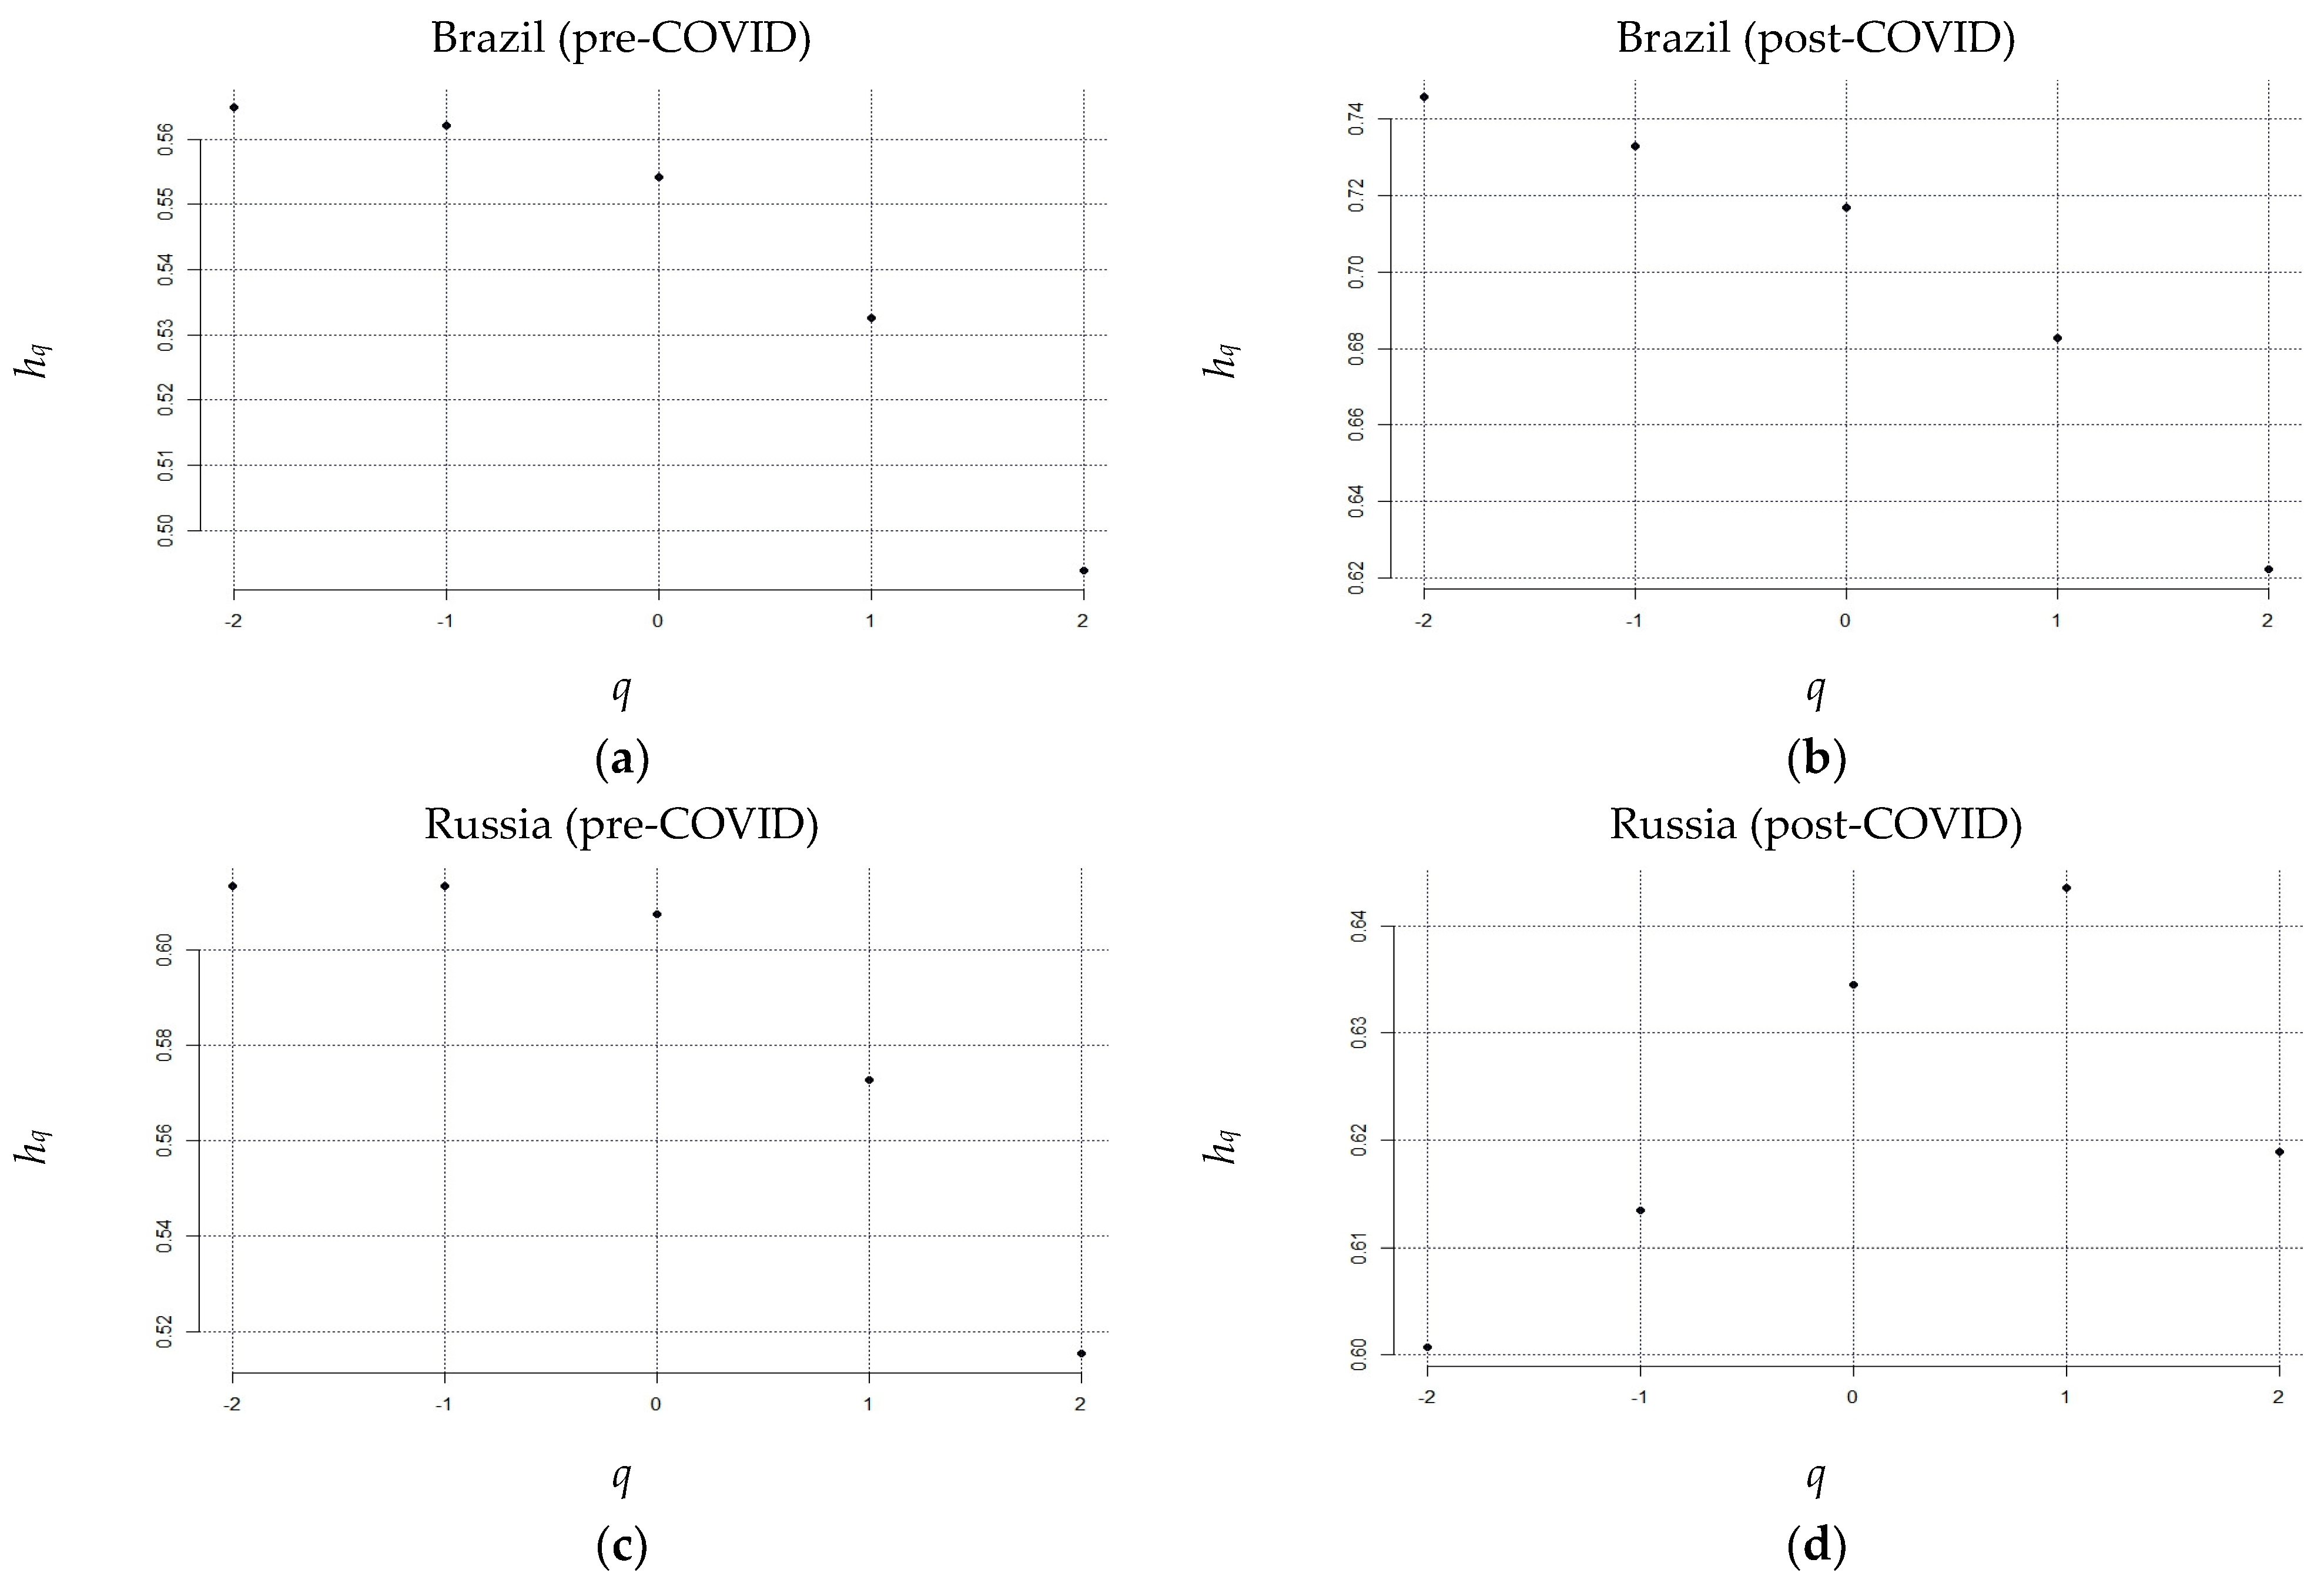
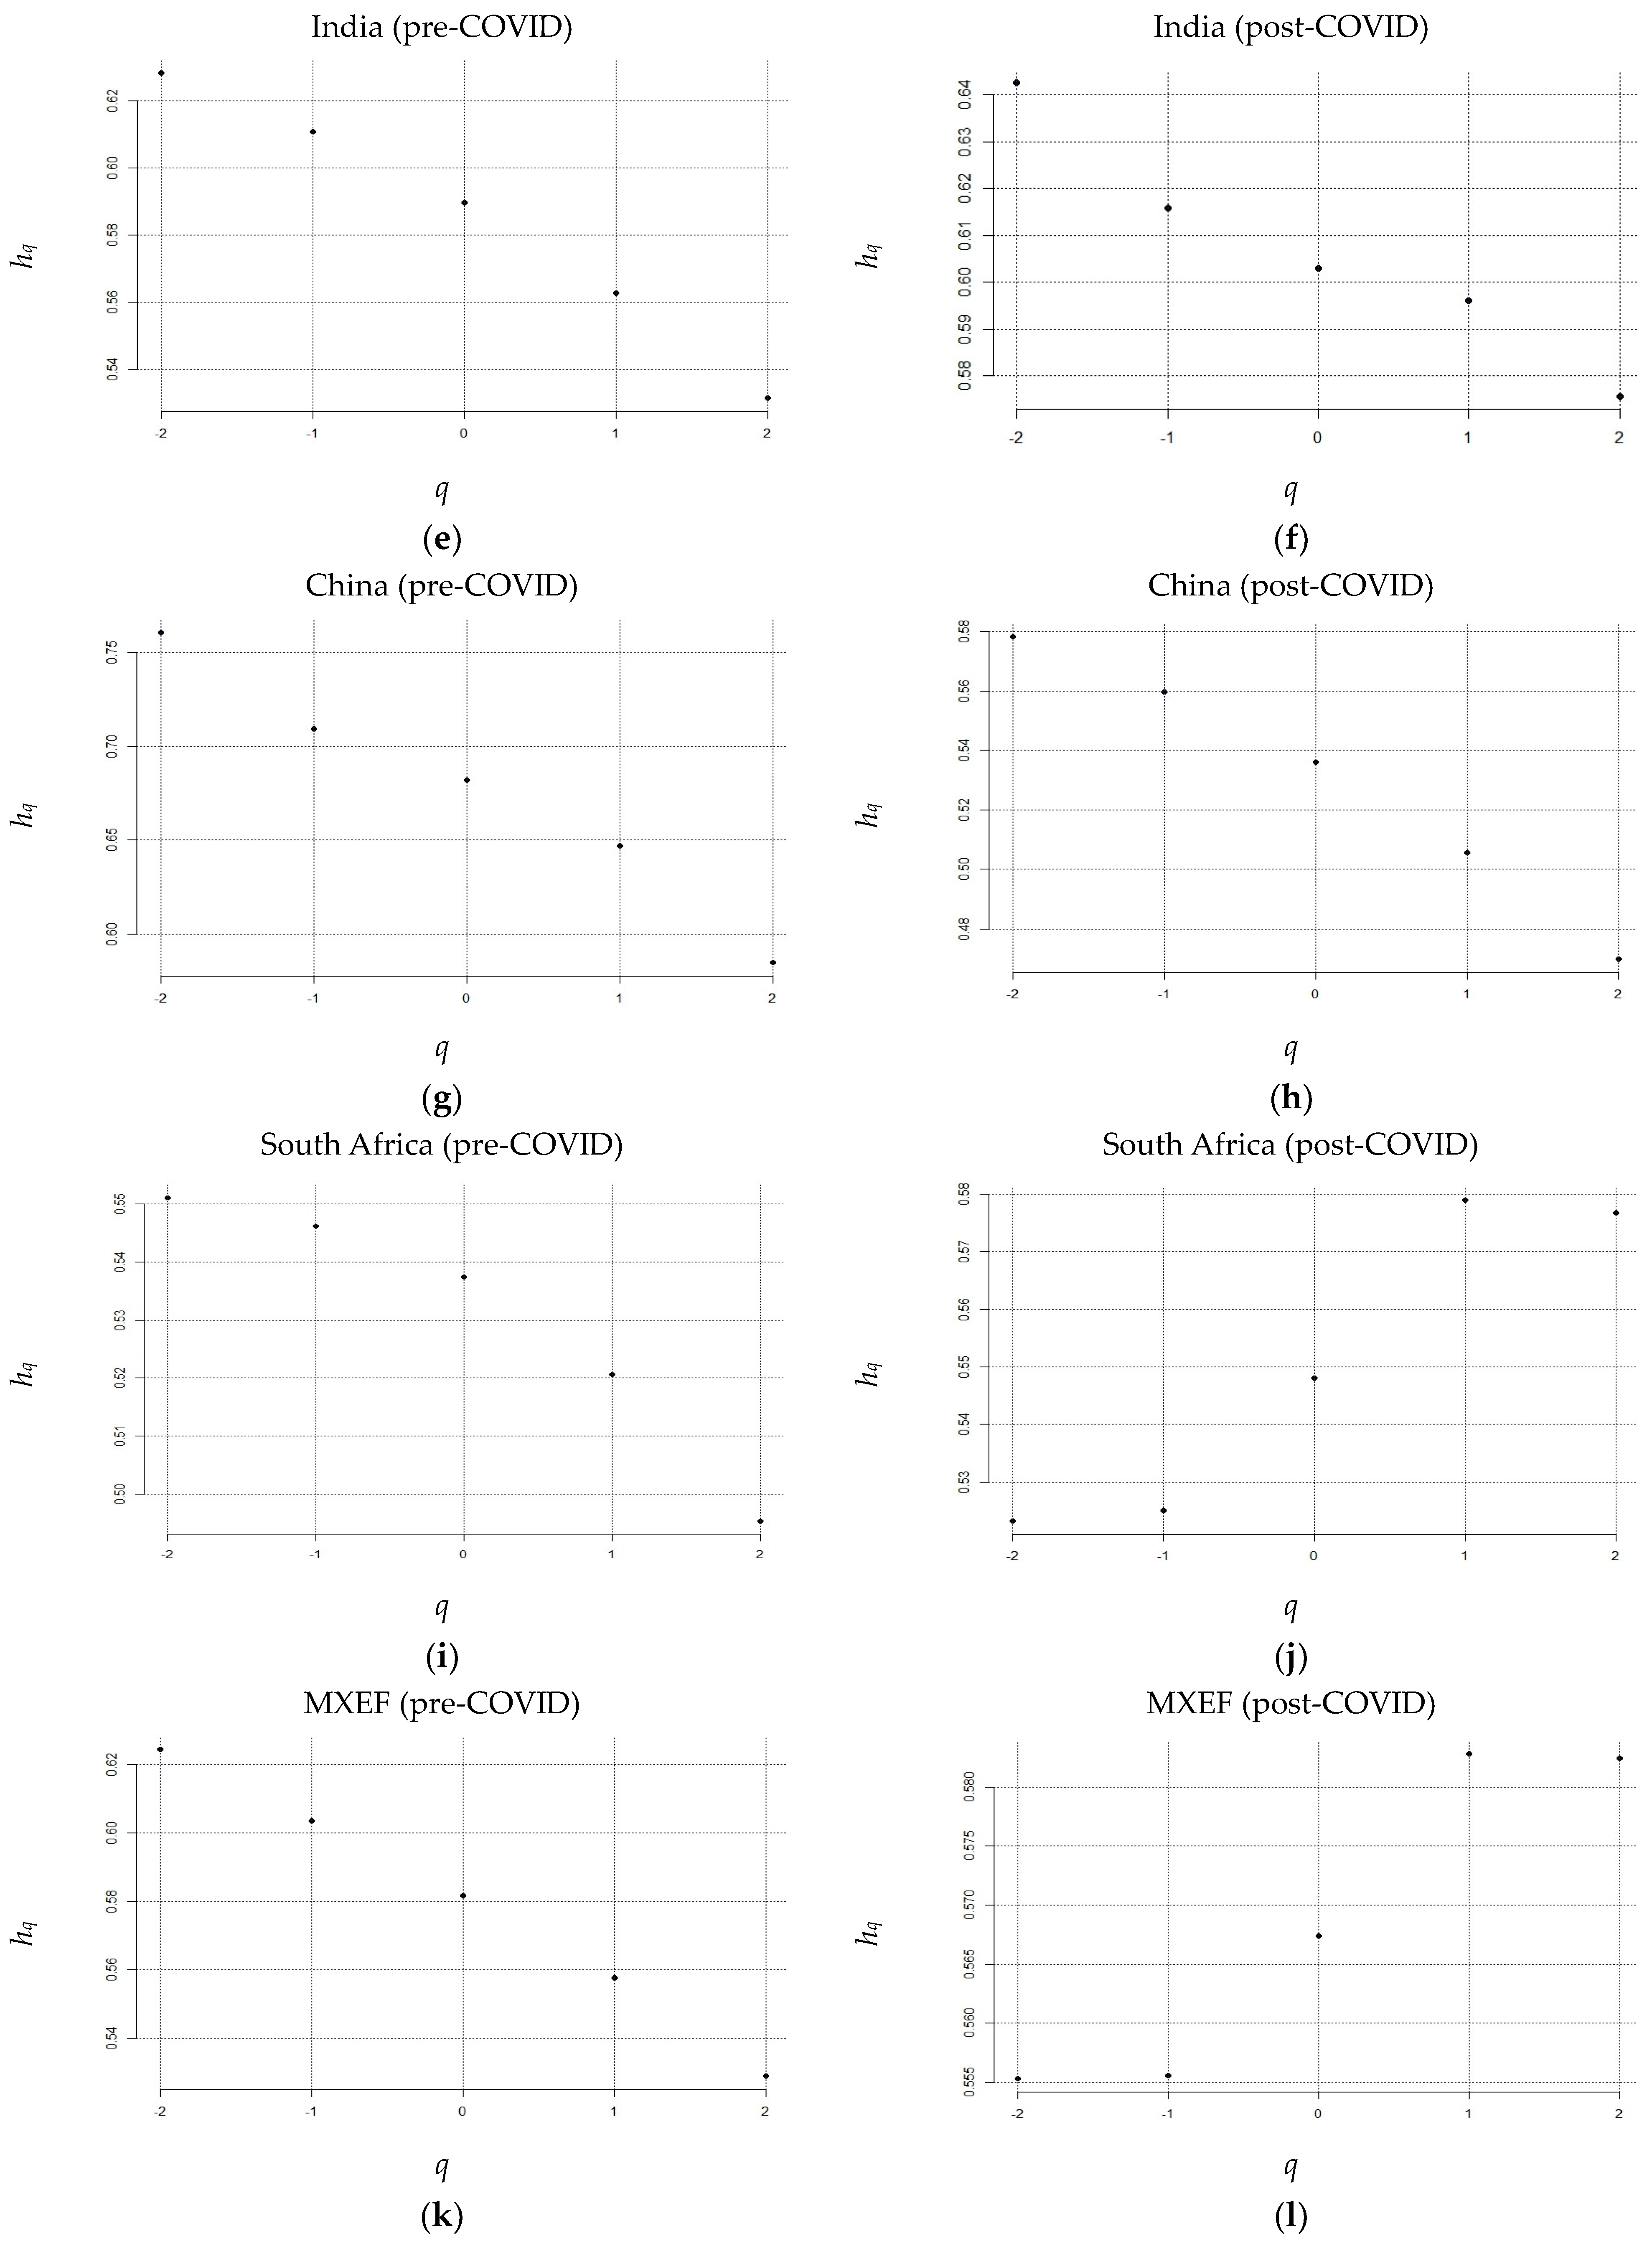
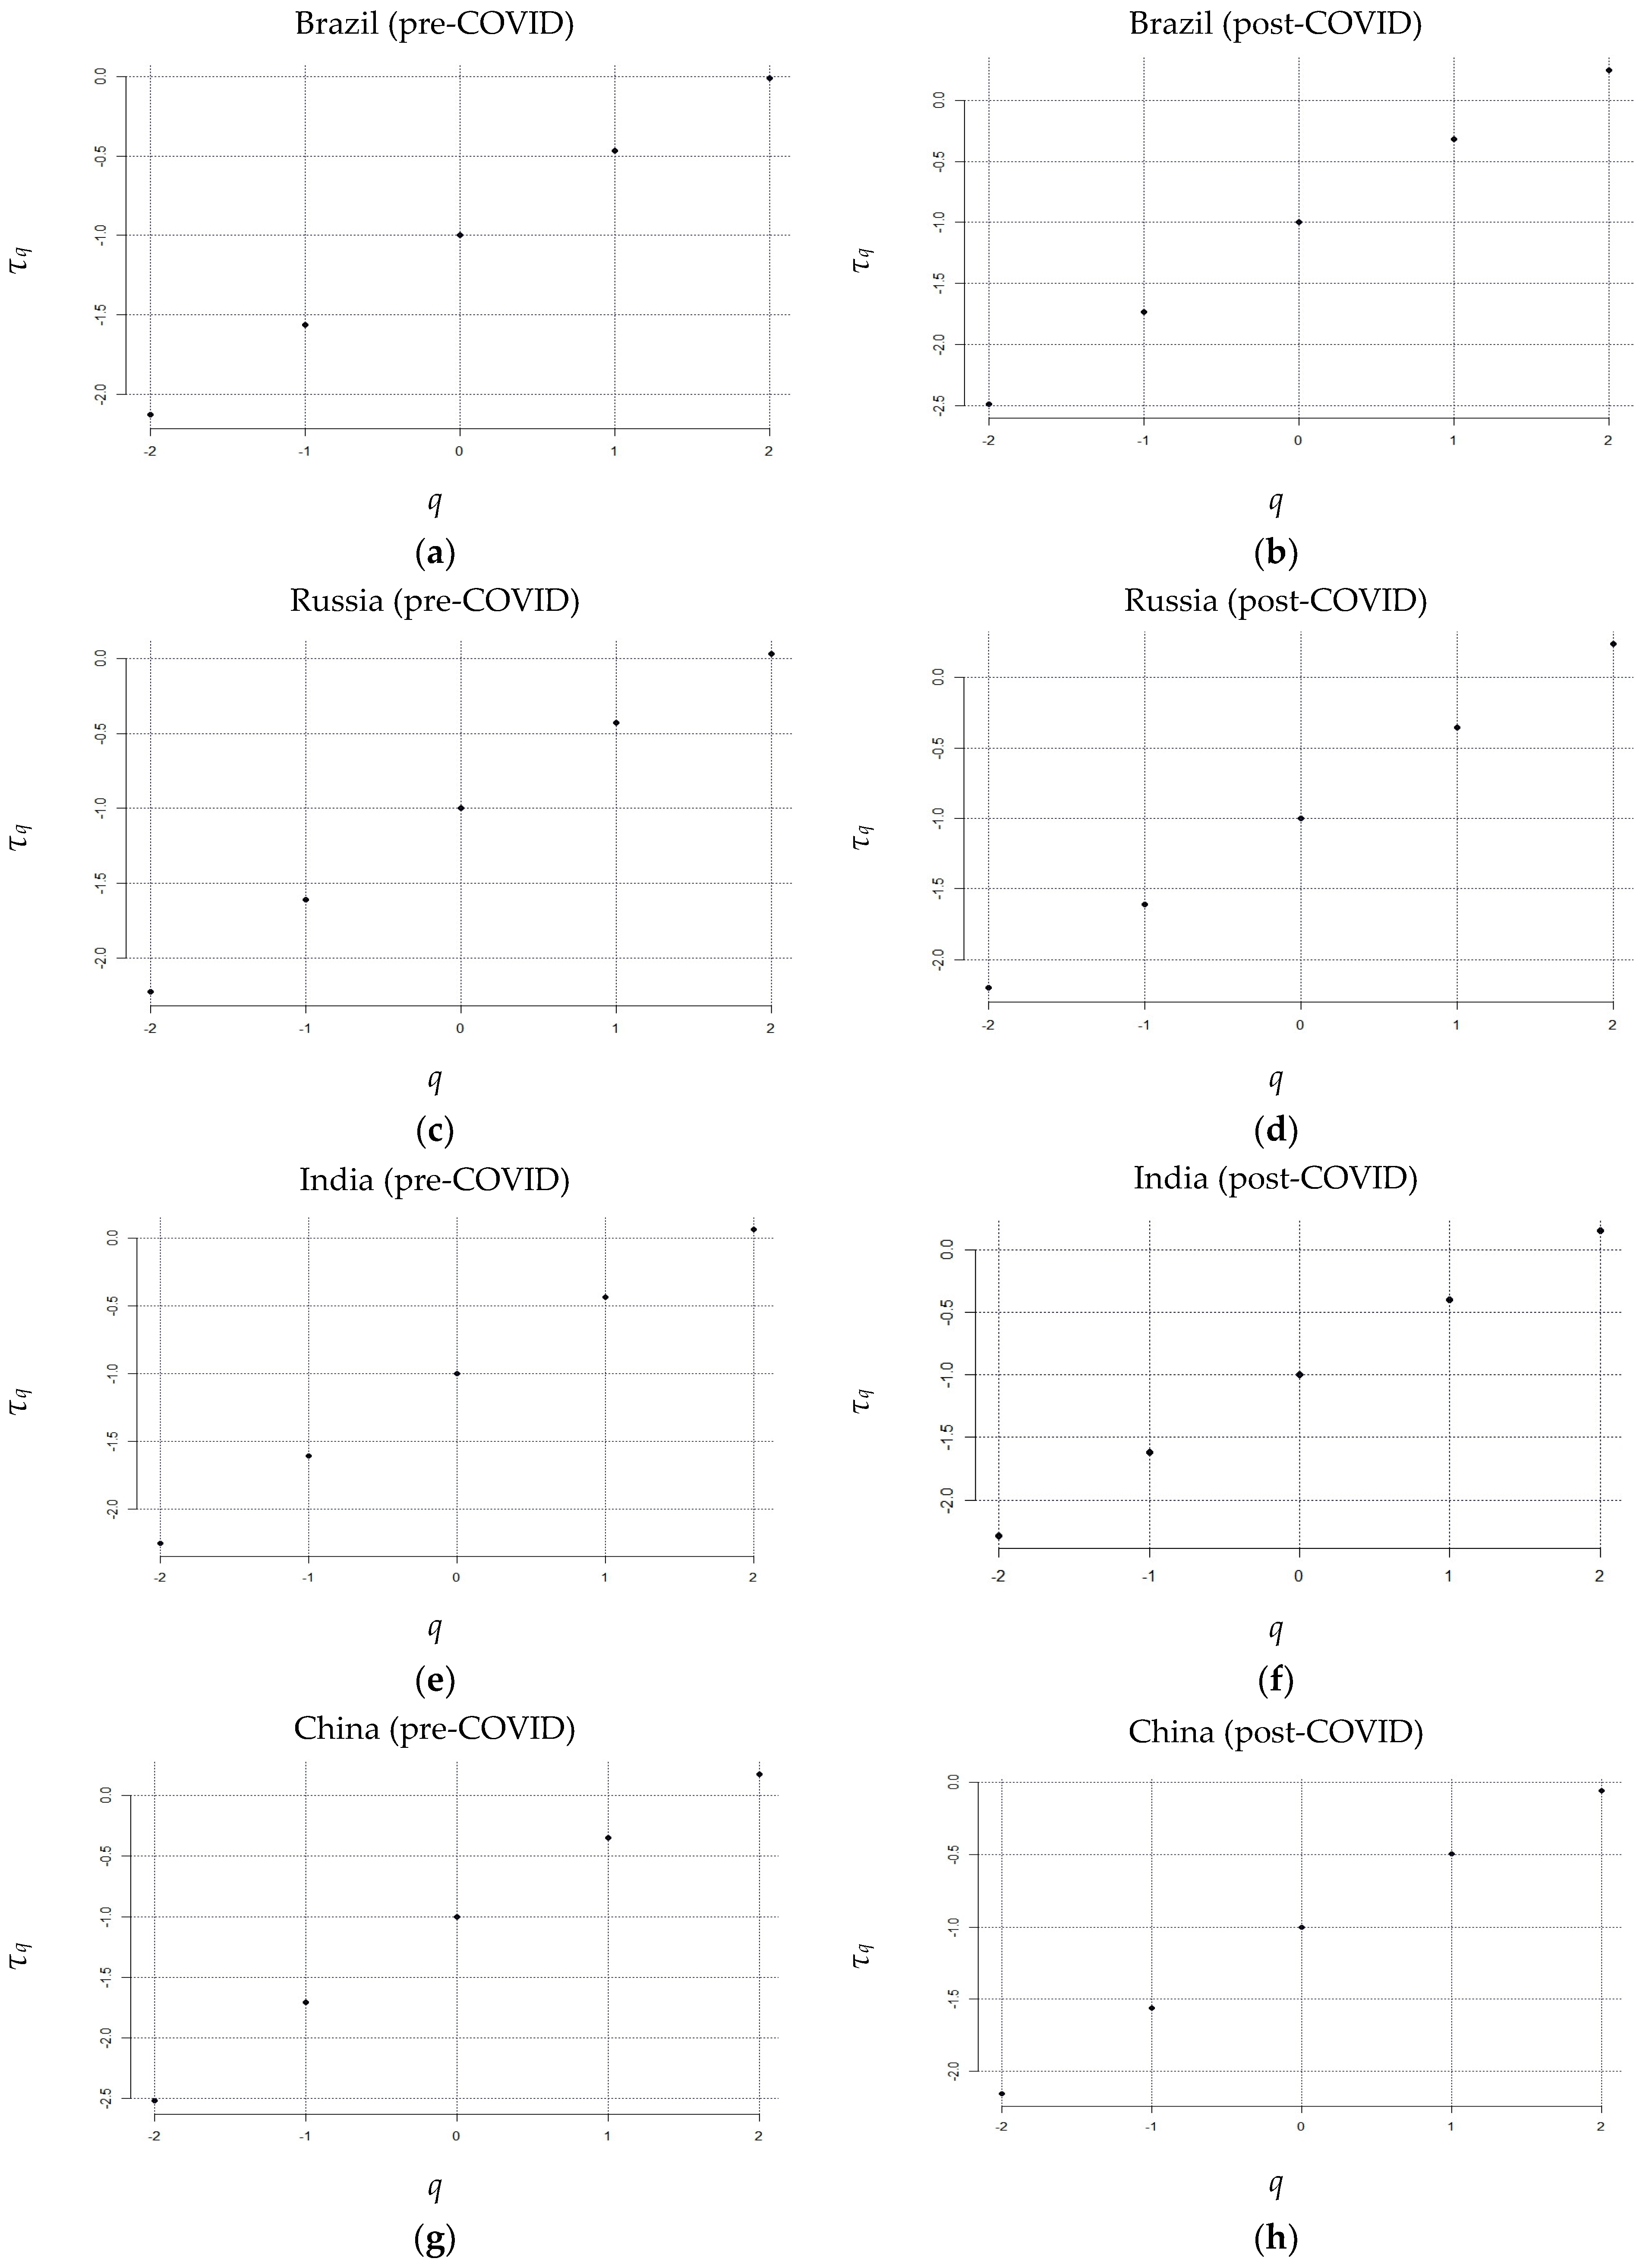
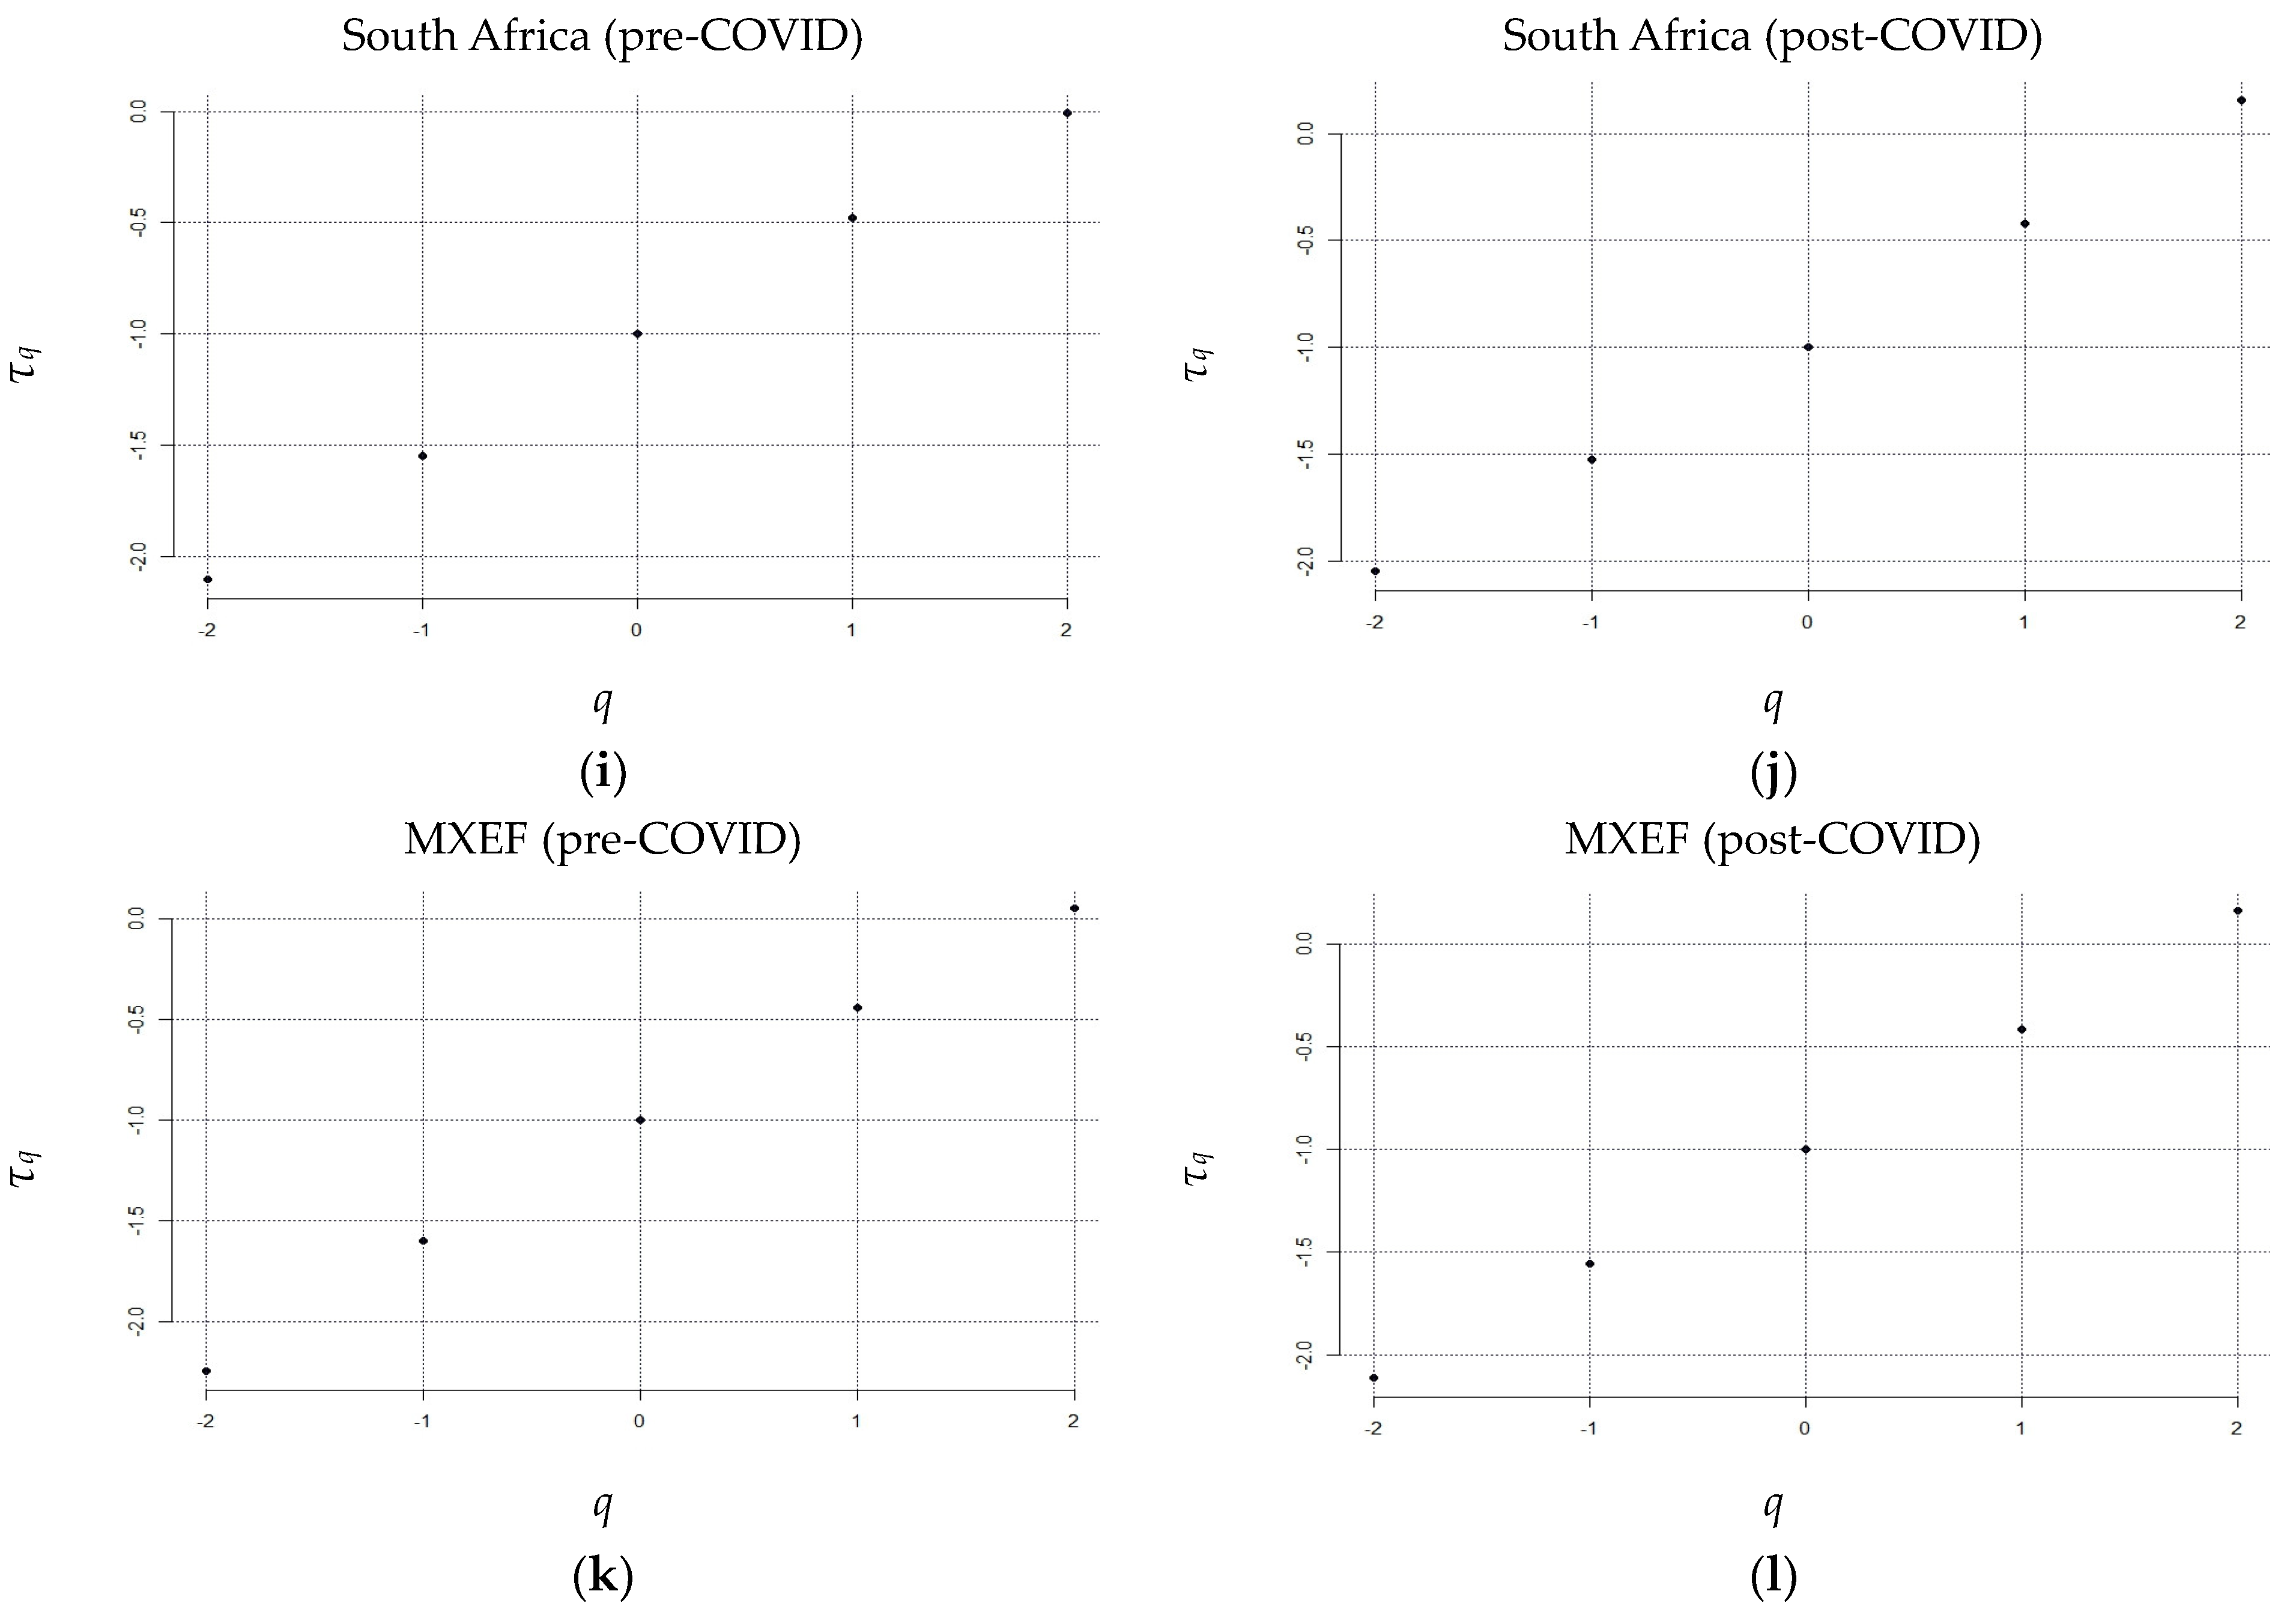
4. Subsample Analysis of the Impact of COVID-19 on Market Efficiency
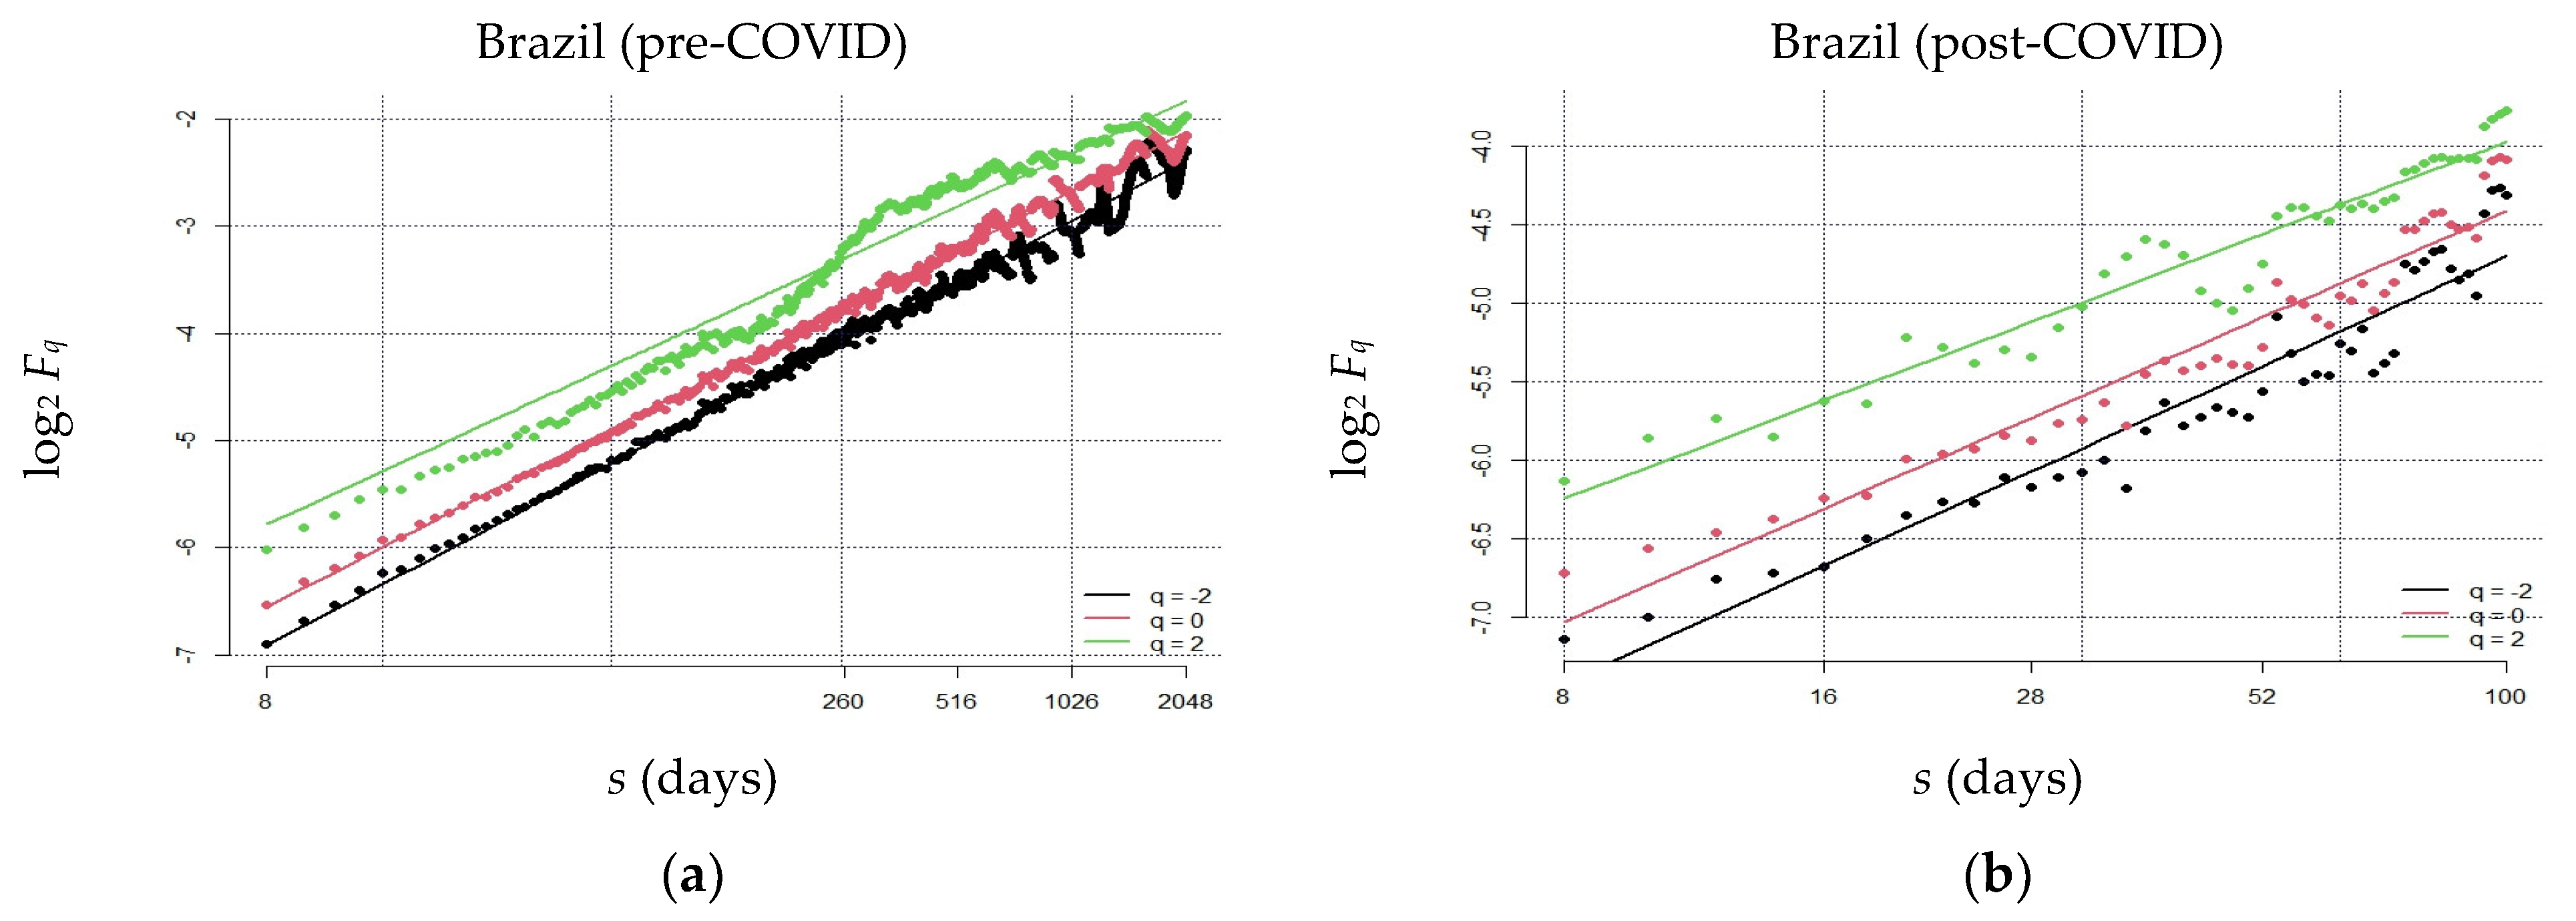
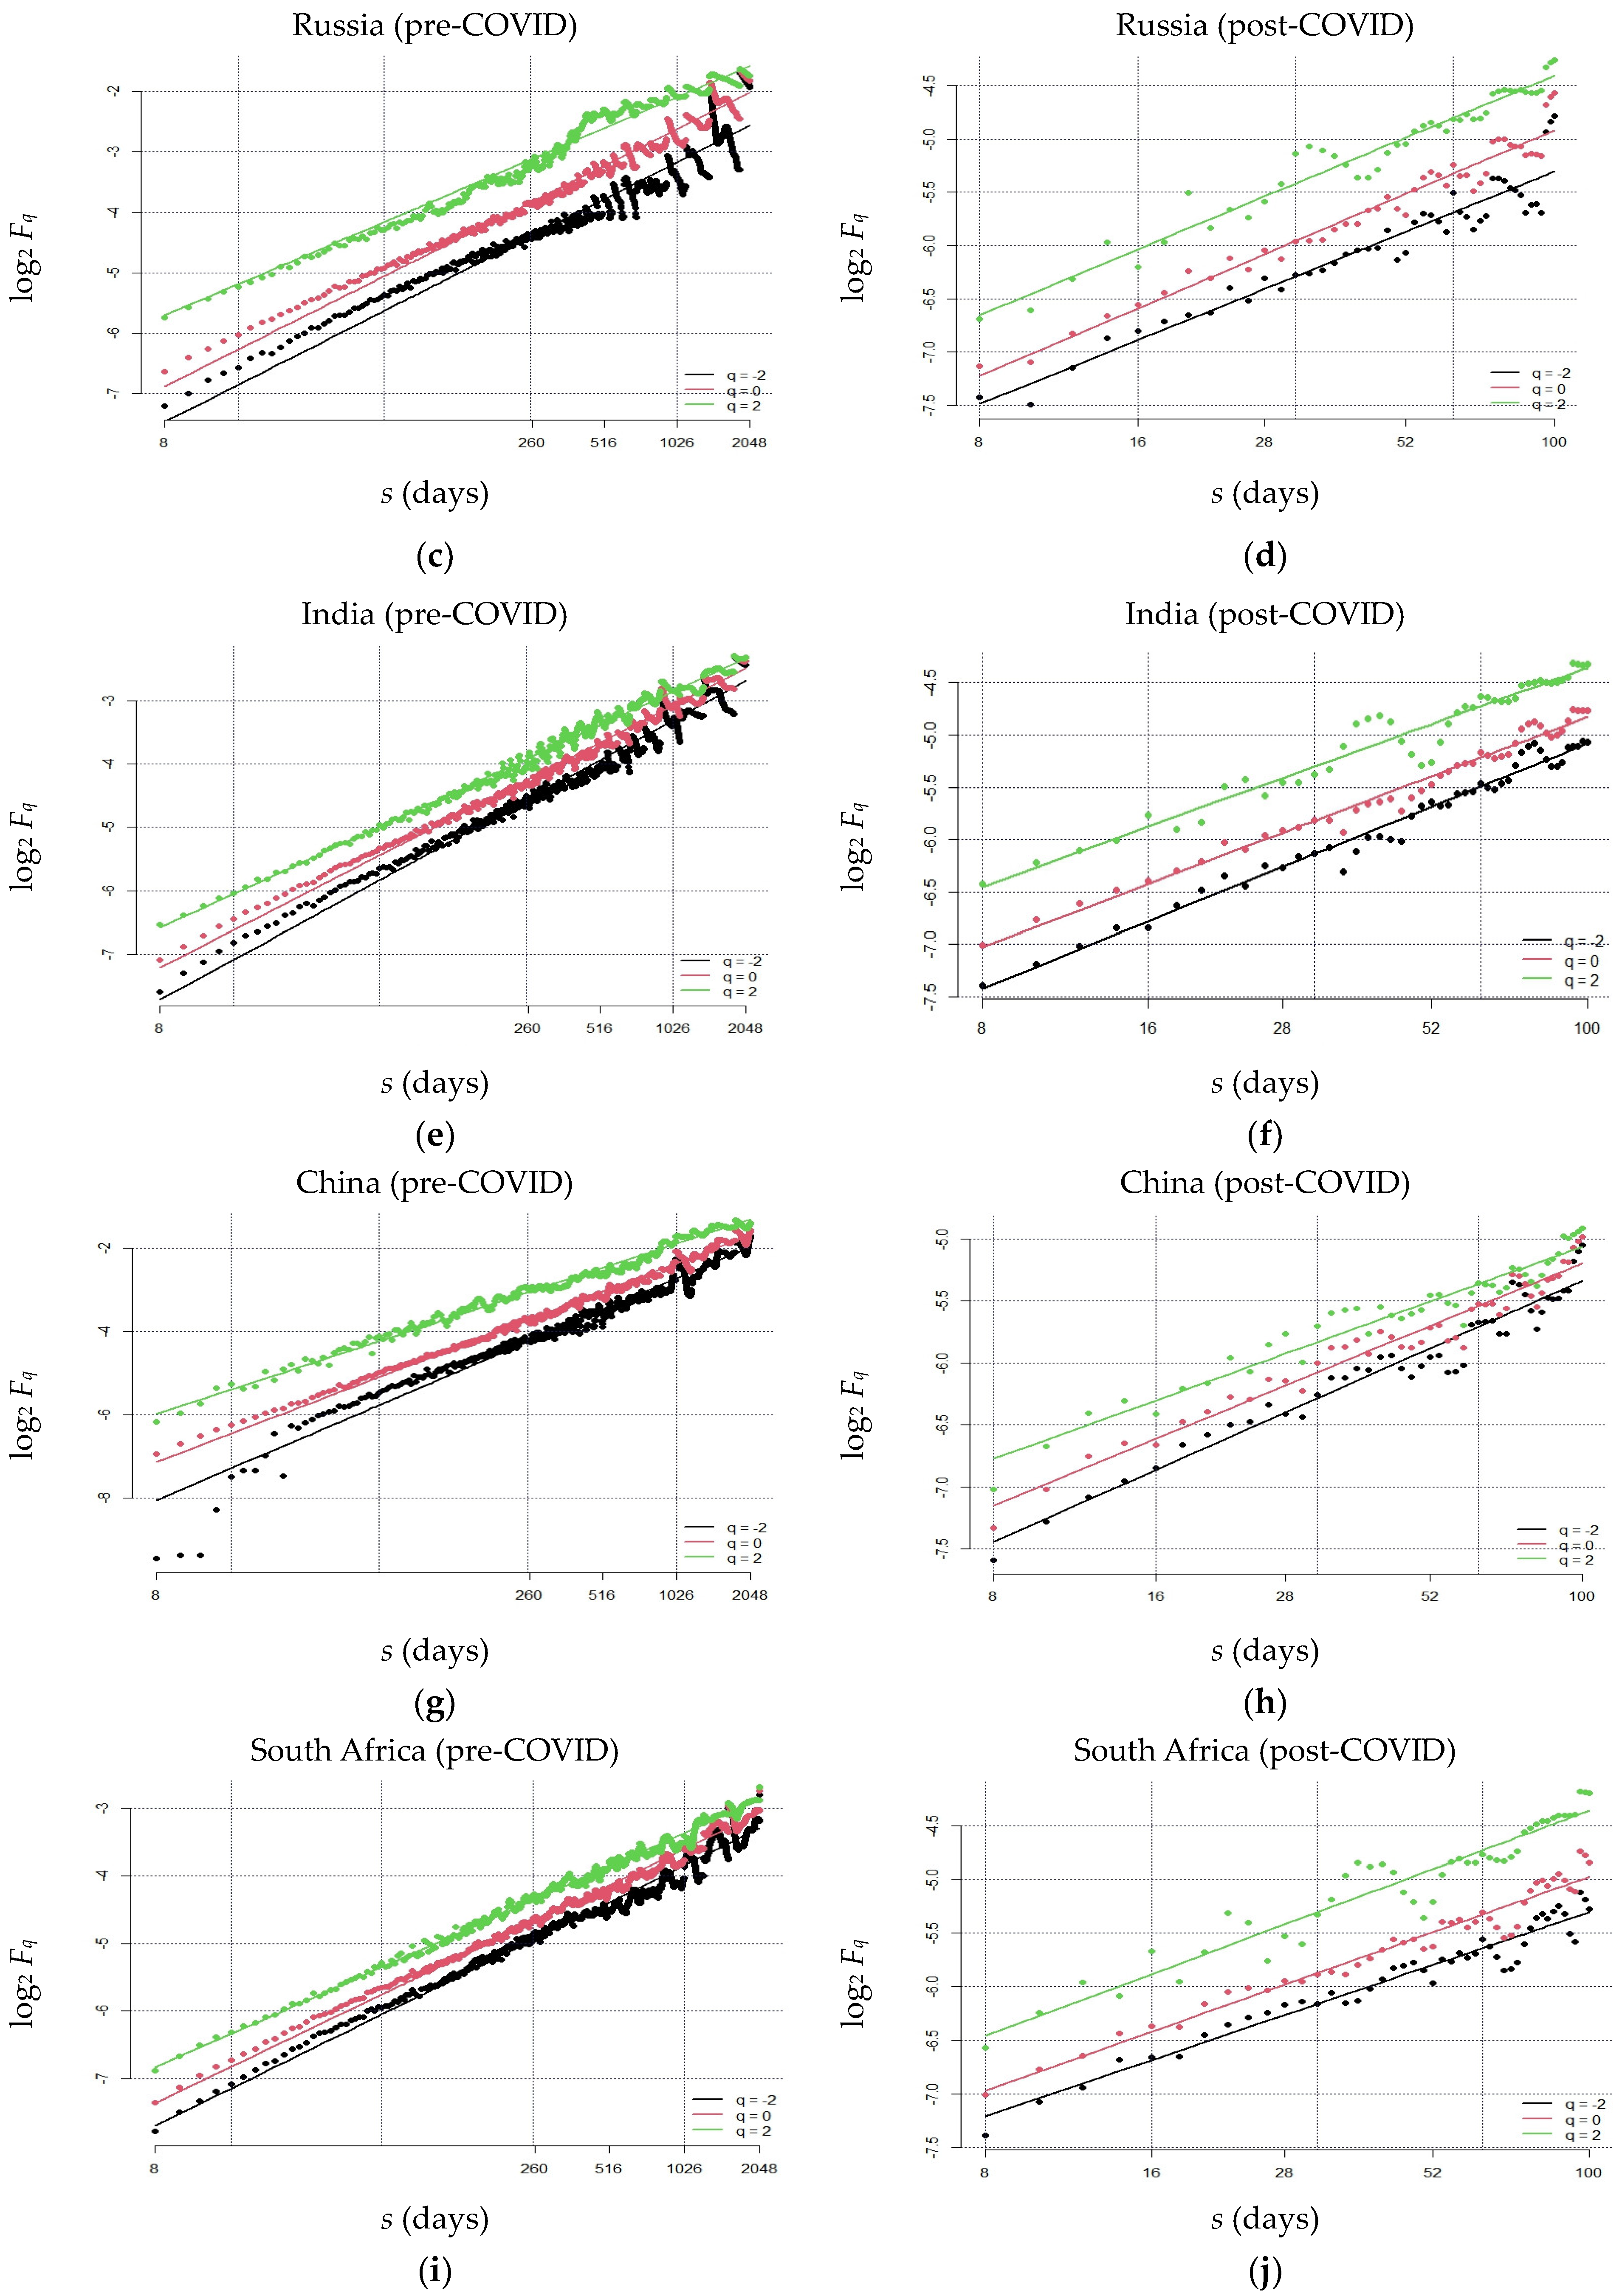
4.1. Stock Returns during Pre- and Post-COVID Periods
4.2. Market Efficiency during the Pre- and Post-COVID Periods
5. Conclusions and Implications
Author Contributions
Funding
Data Availability Statement
Acknowledgments
Conflicts of Interest
Appendix A

| hq (IBOV) | |||
|---|---|---|---|
| q = −10:10 | q = −5:5 | q = −2:2 | |
| −10 | 0.6024 | ||
| −9 | 0.5969 | ||
| −8 | 0.5908 | ||
| −7 | 0.5843 | ||
| −6 | 0.5774 | ||
| −5 | 0.5706 | 0.5706 | |
| −4 | 0.5641 | 0.5641 | |
| −3 | 0.5586 | 0.5586 | |
| −2 | 0.5545 | 0.5545 | 0.5545 |
| −1 | 0.5507 | 0.5507 | 0.5507 |
| 0 | 0.5429 | 0.5429 | 0.5429 |
| 1 | 0.5227 | 0.5227 | 0.5227 |
| 2 | 0.486 | 0.486 | 0.486 |
| 3 | 0.4431 | 0.4431 | |
| 4 | 0.4059 | 0.4059 | |
| 5 | 0.3773 | 0.3773 | |
| 6 | 0.3557 | ||
| 7 | 0.3392 | ||
| 8 | 0.3262 | ||
| 9 | 0.3159 | ||
| 10 | 0.3073 | ||


Appendix B
| hq (IBOV) | |||
|---|---|---|---|
| s = 8:512 | s = 8:1024 | s = 8:2048 | |
| −10 | 0.6324 | 0.568 | 0.6024 |
| −9 | 0.6253 | 0.5619 | 0.5969 |
| −8 | 0.6174 | 0.5554 | 0.5908 |
| −7 | 0.6086 | 0.5485 | 0.5843 |
| −6 | 0.5991 | 0.5417 | 0.5774 |
| −5 | 0.5890 | 0.5354 | 0.5706 |
| −4 | 0.5785 | 0.5306 | 0.5641 |
| −3 | 0.5682 | 0.5286 | 0.5586 |
| −2 | 0.5592 | 0.5311 | 0.5545 |
| −1 | 0.5540 | 0.5393 | 0.5507 |
| 0 | 0.5587 | 0.5519 | 0.5429 |
| 1 | 0.5832 | 0.5622 | 0.5227 |
| 2 | 0.6267 | 0.5617 | 0.4860 |
| 3 | 0.6625 | 0.5496 | 0.4431 |
| 4 | 0.6773 | 0.5326 | 0.4059 |
| 5 | 0.6789 | 0.5164 | 0.3773 |
| 6 | 0.6754 | 0.5029 | 0.3557 |
| 7 | 0.6703 | 0.4918 | 0.3392 |
| 8 | 0.6650 | 0.4827 | 0.3262 |
| 9 | 0.6599 | 0.4751 | 0.3159 |
| 10 | 0.6553 | 0.4686 | 0.3073 |

Appendix C
| hq (IBOV) | ||
|---|---|---|
| s = 8:100 | s = 8:256 | |
| −2 | 0.7457 | 0.9744 |
| −1 | 0.7329 | 0.9441 |
| 0 | 0.7170 | 0.8996 |
| 1 | 0.6828 | 0.8263 |
| 2 | 0.6222 | 0.7298 |

References
- Hassan, T.A.; Hollander, S.; Van Lent, L.; Schwedeler, M.; Tahoun, A. Firm-Level Exposure to Epidemic Diseases: COVID-19, SARS, and H1N1; NBER Working Papers Series; NBER: Cambridge, MA, USA, 2020; Available online: https://www.nber.org/papers/w26971 (accessed on 15 October 2022).
- Jordà, Ò.; Singh, S.R.; Taylor, A.M. The Long Economic Hangover of Pandemics: History Shows COVID-19’s Economic Fallout May Be with Us for Decades. Financ. Dev. 2020, 57. Available online: https://www.imf.org/en/Publications/fandd/issues/2020/06/long-term-economic-impact-of-pandemics-jorda (accessed on 24 December 2022).
- Baker, S.R.; Farrokhnia, R.A.; Meyer, S.; Pagel, M.; Yannelis, C. How does household spending respond to an epidemic? Consumption during the 2020 COVID-19 pandemic. Rev. Asset Pricing Stud. 2020, 10, 834–862. [Google Scholar] [CrossRef]
- Ludvigson, S.C.; Ma, S.; Ng, S. COVID-19 and the Macroeconomic Effects of Costly Disasters; NBER Working Papers Series; NBER: Cambridge, MA, USA, 2020; Available online: https://www.nber.org/papers/w26987 (accessed on 17 January 2023).
- Frezza, M.; Bianchi, S.; Pianese, A. Fractal analysis of market (in) efficiency during the COVID-19. Financ. Res. Lett. 2021, 38, 101851. [Google Scholar] [CrossRef]
- Okorie, D.I.; Lin, B. Adaptive market hypothesis: The story of the stock markets and COVID-19 pandemic. N. Am. J. Econ. Financ. 2021, 57, 101397. [Google Scholar] [CrossRef]
- Wang, J.; Wang, X. COVID-19 and financial market efficiency: Evidence from an entropy-based analysis. Financ. Res. Lett. 2021, 42, 101888. [Google Scholar] [CrossRef]
- Ashraf, B.N. Stock markets’ reaction to COVID-19: Cases or fatalities? Res. Int. Bus. Financ. 2020, 54, 101249. [Google Scholar] [CrossRef] [PubMed]
- Baker, S.R.; Nicholas, B.; Steven, J.D.; Kyle, J.K.; Marco, C.S.; Viratyosin, T. The Unprecedented Stock Market Impact of COVID-19; NBER Working Paper Series; NBER: Cambridge, MA, USA, 2020; Available online: https://www.nber.org/papers/w26945 (accessed on 18 January 2023).
- Ashraf, B.N. Economic impact of government interventions during the COVID-19 pandemic: International evidence from financial markets. J. Behav. Exp. Financ. 2020, 27, 100371. [Google Scholar] [CrossRef]
- Lekhal, M.; El Oubani, A. Does the Adaptive Market Hypothesis explain the evolution of emerging markets efficiency? Evidence from the Moroccan financial market. Heliyon 2020, 6, e04429. [Google Scholar] [CrossRef]
- Xu, Y.; Lien, D. COVID-19 and currency dependences: Empirical evidence from BRICS. Financ. Res. Lett. 2022, 45, 102119. [Google Scholar] [CrossRef]
- Beirne, J.; Renzhi, N.; Sugandi, E.; Volz, U. Financial Market and Capital Flow Dynamics during the COVID-19 Pandemic. 2020. Available online: https://papers.ssrn.com/sol3/papers.cfm?abstract_id=3656848 (accessed on 13 June 2022). [CrossRef]
- Narayan, P.K.; Phan, D.H.B.; Liu, G. COVID-19 lockdowns, stimulus packages, travel bans, and stock returns. Financ. Res. Lett. 2021, 38, 101732. [Google Scholar] [CrossRef]
- Rouatbi, W.; Demir, E.; Kizys, R.; Zaremba, A. Immunizing markets against the pandemic: COVID-19 vaccinations and stock volatility around the world. Int. Rev. Financ. Anal. 2021, 77, 101819. [Google Scholar] [CrossRef] [PubMed]
- Bachelier, L. Théorie de la spéculation. Ann. Sci. De L’école Norm. Supérieure 1900, 17, 21–86. [Google Scholar] [CrossRef]
- Malkiel, B.G. The efficient market hypothesis and its critics. J. Econ. Perspect. 2003, 17, 59–82. [Google Scholar] [CrossRef]
- Alvarez-Ramirez, J.; Alvarezn, J.; Rodriguez, E. Short-term predictability of crude oil markets: A detrended fluctuation analysis approach. Energy Econ. 2008, 30, 2645–2656. [Google Scholar] [CrossRef]
- Gopikrishnan, P.; Plerou, V.; Gabaix, X.; Amaral, L.; Stanley, H. Price fluctuations and market activity. Phys. A Stat. Mech. Its Appl. 2001, 299, 137–143. [Google Scholar] [CrossRef]
- Oh, G.; Kim, S.; Eom, C. Long-term memory and volatility clustering in high-frequency price changes. Phys. A Stat. Mech. Its Appl. 2008, 387, 1247–1254. [Google Scholar] [CrossRef]
- He, L.Y.; Fan, Y.; Wei, Y.M. The empirical analysis for fractal features and long-run memory mechanism in petroleum pricing systems. Int. J. Glob. Energy Issues 2007, 27, 492–502. [Google Scholar] [CrossRef]
- Adrangi, B.; Chatrath, A.; Dhanda, K.K.; Raffiee, K. Chaos in oil prices? Evidence from futures markets. Energy Econ. 2001, 23, 405–425. [Google Scholar] [CrossRef]
- Aslam, F.; Latif, S.; Ferreira, P. Investigating long-range dependence of emerging Asian stock markets using multifractal detrended fluctuation analysis. Symmetry 2020, 12, 1157. [Google Scholar] [CrossRef]
- Arshad, S.; Rizvi, S.A.R.; Ghani, G.M.; Duasa, J. Investigating stock market efficiency: A look at OIC member countries. Res. Int. Bus. Financ. 2016, 36, 402–413. [Google Scholar] [CrossRef]
- Günay, S. Performance of the multifractal model of asset returns (MMAR): Evidence from emerging stock markets. Int. J. Financ. Stud. 2016, 4, 11. [Google Scholar] [CrossRef]
- The World Bank. Market Capitalization of Listed Domestic Companies (Current US$); World Bank: Washington, DC, USA, 2020; Available online: https://data.worldbank.org/indicator/CM.MKT.LCAP.CD (accessed on 17 October 2022).
- MSCI. MSCI Emerging Markets Index (USD): Index Factsheet—30 September 2022; MSCI: New York, NY, USA, 2022; Available online: https://www.msci.com/documents/10199/c0db0a48-01f2-4ba9-ad01-226fd5678111 (accessed on 18 October 2022).
- Harjoto, M.A.; Rossi, F.; Paglia, J.K. COVID-19: Stock market reactions to the shock and the stimulus. Appl. Econ. Lett. 2021, 28, 795–801. [Google Scholar] [CrossRef]
- Öztürk, H. Cointegration analysis of BIST 30 index and MSCI emerging markets index: Pre and post global financial crisis. Bus. Econ. Res. J. 2018, 9, 109–121. [Google Scholar]
- Moshirian, F.; Ng, D.; Wu, E. The value of stock analysts’ recommendations: Evidence from emerging markets. Int. Rev. Financ. Anal. 2009, 18, 74–83. [Google Scholar] [CrossRef]
- Mandelbrot, B.B.; Fisher, A.J.; Calvet, L.E. A Multifractal Model of Asset Returns. 1997. Available online: https://papers.ssrn.com/sol3/papers.cfm?abstract_id=78588 (accessed on 23 November 2022).
- Laib, M.; Telesca, L.; Kanevski, M. Long-range fluctuations and multifractality in connectivity density time series of a wind speed monitoring network. Chaos Interdiscip. J. Nonlinear Sci. 2018, 28, 033108. [Google Scholar] [CrossRef] [PubMed]
- Wang, W.; Liu, K.; Qin, Z. Multifractal analysis on the return series of stock markets using MF-DFA method. In Service Science and Knowledge Innovation, Proceedings of the International Conference on Informatics and Semiotics in Organizations (ICISO 2014), Shanghai, China, 23–25 May 2014; Springer: Berlin/Heidelberg, Germany; pp. 107–115. [CrossRef]
- Brandi, G.; Di Matteo, T. On the statistics of scaling exponents and the multiscaling value at risk. Eur. J. Financ. 2022, 28, 1361–1382. [Google Scholar] [CrossRef]
- Buonocore, R.J.; Aste, T.; Di Matteo, T. Measuring multiscaling in financial time-series. Chaos Solitons Fractals 2016, 88, 38–47. [Google Scholar] [CrossRef]
- Jiang, Z.Q.; Xie, W.J.; Zhou, W.X.; Sornette, D. Multifractal analysis of financial markets: A review. Rep. Prog. Phys. 2019, 82, 125901. [Google Scholar] [CrossRef]
- Mensi, W.; Shahzad, S.J.H.; Hammoudeh, S.; Zeitun, R.; Rehman, M.U. Diversification potential of Asian frontier, BRIC emerging and major developed stock markets: A wavelet-based value at risk approach. Emerg. Mark. Rev. 2017, 32, 130–147. [Google Scholar] [CrossRef]
- Mnif, E.; Jarboui, A.; Mouakhar, K. How the cryptocurrency market has performed during COVID 19? A multifractal analysis. Financ. Res. Lett. 2020, 36, 101647. [Google Scholar] [CrossRef]
- Han, C.; Wang, Y.; Xu, Y. Efficiency and multifractality analysis of the Chinese stock market: Evidence from stock indices before and after the 2015 stock market crash. Sustainability 2019, 11, 1699. [Google Scholar] [CrossRef]
- Kroha, P.; Skoula, M. Hurst Exponent and Trading Signals Derived from Market Time Series. In Proceedings of the 20th International Conference on Enterprise Information Systems–Volume 1: ICEIS, Funchal, Portugal, 21–24 March 2018; pp. 371–378. [Google Scholar] [CrossRef]
- Peters, E.E. Fractal Market Analysis: Applying Chaos Theory to Investment and Economics; John Wiley & Sons: New York, NY, USA, 1994. [Google Scholar]
- Lo, A.W. The adaptive markets hypothesis. J. Portf. Manag. 2004, 30, 15–29. [Google Scholar] [CrossRef]
- Miloş, L.R.; Haţiegan, C.; Miloş, M.C.; Barna, F.M.; Boțoc, C. Multifractal detrended fluctuation analysis (MF-DFA) of stock market indexes. Empirical evidence from seven central and eastern European markets. Sustainability 2020, 12, 535. [Google Scholar] [CrossRef]
- Ali, S.; Shahzad, S.J.H.; Raza, N.; Al-Yahyaee, K.H. Stock market efficiency: A comparative analysis of Islamic and conventional stock markets. Phys. A Stat. Mech. Its Appl. 2018, 503, 139–153. [Google Scholar] [CrossRef]
- Naeem, M.A.; Farid, S.; Ferrer, R.; Shahzad, S.J.H. Comparative efficiency of green and conventional bonds pre-and during COVID-19: An asymmetric multifractal detrended fluctuation analysis. Energy Policy 2021, 153, 112285. [Google Scholar] [CrossRef]
- Huo, X.; Qiu, Z. How does China’s stock market react to the announcement of the COVID-19 pandemic lockdown? Econ. Political Stud. 2020, 8, 436–461. [Google Scholar] [CrossRef]
- Huang, Y.; Lin, C.; Wang, P.; Xu, Z. Saving China from the Coronavirus and Economic Meltdown: Experiences and Lessons. 2020. Available online: https://papers.ssrn.com/sol3/papers.cfm?abstract_id=3570696 (accessed on 9 December 2022).
- Ozkan, O. Impact of COVID-19 on stock market efficiency: Evidence from developed countries. Res. Int. Bus. Financ. 2021, 58, 101445. [Google Scholar] [CrossRef]
- Mnif, E.; Jarboui, A. COVID-19, bitcoin market efficiency, herd behaviour. Rev. Behav. Financ. 2021, 13, 69–84. [Google Scholar] [CrossRef]
- Shiba, S.; Aye, G.C.; Gupta, R.; Goswami, S. Forecastability of agricultural commodity futures realised volatility with daily infectious disease-related uncertainty. J. Risk Financ. Manag. 2022, 15, 525. [Google Scholar] [CrossRef]
- Nascimento, K.K.F.D.; Santos, F.B.S.D.; Junior, S.F.A.X.; Jale, J.S.; Ferreira, T.A. COVID-19 influence over Brazilian agricultural commodities and dollar-real exchange. Fractals 2022, 30, 2250100. [Google Scholar] [CrossRef]
- Nor, S.M.; Wickremasinghe, G. Market efficiency and technical analysis during different market phases: Further evidence from Malaysia. Invest. Manag. Financ. Innov. 2017, 14, 359–366. [Google Scholar] [CrossRef]
- Nor, S.M.; Zawawi, N.H.M. Does technical analysis work in the Russian market? Insights from MICEX (MOEX Russia) Index component stocks. Econ. Ann. XXI 2019, 178, 114–122. [Google Scholar] [CrossRef]
- Tiwari, A.K.; Kyophilavong, P. New evidence from the random walk hypothesis for BRICS stock indices: A wavelet unit root test approach. Econ. Model. 2014, 43, 38–41. [Google Scholar] [CrossRef]
- Nor, S.M.; Zawawi, N.H.M.; Wickremasinghe, G.; Halim, Z.A. Is technical analysis profitable on renewable energy stocks? Evidence from trend-reinforcing, mean-reverting and hybrid fractal trading systems. Axioms 2023, 12, 127. [Google Scholar] [CrossRef]


| Country/Index | Market Capitalization (USD) | Index | Beginning Date |
|---|---|---|---|
| Brazil | 988.37 billion | IBOVESPA | 3 January 1994 |
| Russia | 694.74 billion | IMOEX | 22 September 1997 |
| India | 2.60 trillion | SENSEX | 1 January 1998 |
| China | 12,214.47 trillion | SHCOMP | 19 December 1990 |
| South Africa | 1.05 trillion | JALSH | 2 July 1995 |
| MXEF | 5.73 trillion | MXEF | 1 December 1990 |
| Index | Brazil | Russia | India | China | South Africa | MXEF |
|---|---|---|---|---|---|---|
| Mean | 0.001093 | 0.000909 | 0.000568 | 0.000739 | 0.000476 | 0.000289 |
| Std. Dev. | 0.021981 | 0.024408 | 0.014992 | 0.024196 | 0.012151 | 0.011215 |
| Skewness | 0.831892 | 0.889429 | −0.083120 | 12.17468 | −0.389831 | −0.403955 |
| Kurtosis | 16.07679 | 22.37519 | 8.299817 | 494.5483 | 6.30476 | 7.60328 |
| JB | 74,045.00 | 125,000.00 | 16,779.00 | 76,248,000 | 10,938.00 | 20,032.00 |
| Prob. | 0.000 | 0.000 | 0.000 | 0.000 | 0.000 | 0.000 |
| Brazil | Russia | India | China | South Africa | MXEF | |
|---|---|---|---|---|---|---|
| −2 | 0.5545 | 0.5207 | 0.5848 | 0.7507 | 0.5306 | 0.6109 |
| −1 | 0.5507 | 0.541 | 0.5743 | 0.7019 | 0.5273 | 0.5909 |
| 0 | 0.5429 | 0.5634 | 0.5602 | 0.6766 | 0.5202 | 0.5701 |
| 1 | 0.5227 | 0.5511 | 0.539 | 0.6442 | 0.5045 | 0.5467 |
| 2 | 0.4860 | 0.5059 | 0.5115 | 0.5836 | 0.4790 | 0.5191 |
| Rank | Country/Index | hq=1 − 0.5 |
|---|---|---|
| 1 | China | 0.1442 |
| 2 | Russia | 0.0511 |
| 3 | MXEF | 0.0467 |
| 4 | India | 0.0390 |
| 5 | Brazil | 0.0227 |
| 6 | South Africa | 0.0045 |
| Brazil | Russia | India | China | South Africa | MXEF | |
|---|---|---|---|---|---|---|
| Panel A: Pre-COVID | ||||||
| Mean | 0.001126 | 0.000921 | 0.000551 | 0.000750 | 0.000472 | 0.000272 |
| Median | 0.001102 | 0.000893 | 0.000901 | 0.000657 | 0.000691 | 0.000754 |
| Std. Dev. | 0.021854 | 0.024940 | 0.014782 | 0.024657 | 0.011854 | 0.011101 |
| Skewness | 0.979245 | 0.897766 | 0.060064 | 12.096230 | −0.300497 | −0.359403 |
| Kurtosis | 19.355520 | 24.762950 | 10.588190 | 484.943500 | 8.574176 | 10.706560 |
| Jarque–Bera | 72,651 | 110,750 | 13,117 | 68,867,000 | 8019.20 | 19,537 |
| Prob. | 0.000 | 0.000 | 0.000 | 0.000 | 0.000 | 0.000 |
| Panel B: Post-COVID | ||||||
| Mean | 0.000519 | 0.000733 | 0.000821 | 0.000522 | 0.000542 | 0.000625 |
| Median | 0.001071 | 0.001766 | 0.001947 | 0.000776 | 0.001557 | 0.001292 |
| Std. Dev. | 0.024092 | 0.014377 | 0.017811 | 0.011989 | 0.016269 | 0.013305 |
| Skewness | −1.069069 | −0.667346 | -1.300632 | −0.736877 | −0.924510 | −0.933384 |
| Kurtosis | 15.162570 | 12.178310 | 15.381020 | 9.406056 | 10.784050 | 8.781479 |
| Jarque–Bera | 2363.70 | 1347.70 | 2480.90 | 651.74 | 1002.80 | 601.33 |
| Prob. | 0.000 | 0.000 | 0.000 | 0.000 | 0.000 | 0.000 |
| −2 | −1 | 0 | 1 | 2 | |
|---|---|---|---|---|---|
| Panel A: Pre-COVID | |||||
| Brazil | 0.5648 | 0.562 | 0.5542 | 0.5325 | 0.4938 |
| Russia | 0.6132 | 0.6132 | 0.6073 | 0.5727 | 0.5155 |
| India | 0.6281 | 0.6108 | 0.5897 | 0.5627 | 0.5314 |
| China | 0.7605 | 0.7094 | 0.6817 | 0.6468 | 0.5846 |
| South Africa | 0.551 | 0.5461 | 0.5374 | 0.5206 | 0.4953 |
| MXEF | 0.6245 | 0.6036 | 0.5818 | 0.5575 | 0.5288 |
| Panel B: Post-COVID | |||||
| Brazil | 0.7457 | 0.7329 | 0.717 | 0.6828 | 0.6222 |
| Russia | 0.6007 | 0.6134 | 0.6345 | 0.6435 | 0.6189 |
| India | 0.6426 | 0.6159 | 0.6029 | 0.5961 | 0.5756 |
| China | 0.5781 | 0.5596 | 0.536 | 0.5057 | 0.4699 |
| South Africa | 0.5232 | 0.5251 | 0.5481 | 0.5789 | 0.5768 |
| MXEF | 0.5553 | 0.5556 | 0.5674 | 0.5828 | 0.5824 |
| Pre-COVID Ranking | Post-COVID Ranking | ||||
|---|---|---|---|---|---|
| Rank | Country/Index | hq=1 − 0.5 | Rank | Country/Index | hq=1 − 0.5 |
| 1 | China | 0.1468 | 1 | Brazil | 0.1828 |
| 2 | Russia | 0.0727 | 2 | Russia | 0.1435 |
| 3 | India | 0.0627 | 3 | India | 0.0961 |
| 4 | MXEF | 0.0575 | 4 | MXEF | 0.0828 |
| 5 | Brazil | 0.0325 | 5 | South Africa | 0.0789 |
| 6 | South Africa | 0.0206 | 6 | China | 0.0057 |
| Rank | Country/Index | Post-COVID hq=1 − 0.5 | Pre-COVID hq=1 − 0.5 | Highly Hit to Lowest Hit |
|---|---|---|---|---|
| 1 | Brazil | 0.1828 | 0.0325 | 0.1503 |
| 2 | Russia | 0.1435 | 0.0727 | 0.0708 |
| 3 | South Africa | 0.0789 | 0.0206 | 0.0583 |
| 4 | India | 0.0961 | 0.0627 | 0.0334 |
| 5 | MXEF | 0.0828 | 0.0575 | 0.0253 |
| 6 | China | 0.0057 | 0.1468 | −0.1411 |
Disclaimer/Publisher’s Note: The statements, opinions and data contained in all publications are solely those of the individual author(s) and contributor(s) and not of MDPI and/or the editor(s). MDPI and/or the editor(s) disclaim responsibility for any injury to people or property resulting from any ideas, methods, instructions or products referred to in the content. |
© 2023 by the authors. Licensee MDPI, Basel, Switzerland. This article is an open access article distributed under the terms and conditions of the Creative Commons Attribution (CC BY) license (https://creativecommons.org/licenses/by/4.0/).
Share and Cite
Ameer, S.; Nor, S.M.; Ali, S.; Zawawi, N.H.M. The Impact of COVID-19 on BRICS and MSCI Emerging Markets Efficiency: Evidence from MF-DFA. Fractal Fract. 2023, 7, 519. https://doi.org/10.3390/fractalfract7070519
Ameer S, Nor SM, Ali S, Zawawi NHM. The Impact of COVID-19 on BRICS and MSCI Emerging Markets Efficiency: Evidence from MF-DFA. Fractal and Fractional. 2023; 7(7):519. https://doi.org/10.3390/fractalfract7070519
Chicago/Turabian StyleAmeer, Saba, Safwan Mohd Nor, Sajid Ali, and Nur Haiza Muhammad Zawawi. 2023. "The Impact of COVID-19 on BRICS and MSCI Emerging Markets Efficiency: Evidence from MF-DFA" Fractal and Fractional 7, no. 7: 519. https://doi.org/10.3390/fractalfract7070519
APA StyleAmeer, S., Nor, S. M., Ali, S., & Zawawi, N. H. M. (2023). The Impact of COVID-19 on BRICS and MSCI Emerging Markets Efficiency: Evidence from MF-DFA. Fractal and Fractional, 7(7), 519. https://doi.org/10.3390/fractalfract7070519