Article

High-Accuracy Simulation of Rayleigh Waves Using Fractional Viscoelastic Wave Equation

1
College of Geoexploration Science and Technology, Jilin University, Changchun 130012, China
2
School of Mathematics and Statistics, Northeast Petroleum University, Daqing 163318, China
3
School of Earth Sciences, Northeast Petroleum University, Daqing 163318, China
4
National Engineering Research Center of Offshore Oil and Gas Exploration, Bejing 100028, China
*
Authors to whom correspondence should be addressed.
Fractal Fract. 2023, 7(12), 880; https://doi.org/10.3390/fractalfract7120880
Submission received: 29 October 2023 / Revised: 3 December 2023 / Accepted: 9 December 2023 / Published: 12 December 2023

Abstract

:
The propagation of Rayleigh waves is usually accompanied by dispersion, which becomes more complex with inherent attenuation. The accurate simulation of Rayleigh waves in attenuation media is crucial for understanding wave mechanisms, layer thickness identification, and parameter inversion. Although the vacuum formalism or stress image method (SIM) combined with the generalized standard linear solid (GSLS) is widely used to implement the numerical simulation of Rayleigh waves in attenuation media, this type of method still has its limitations. First, the GSLS model cannot split the velocity dispersion and amplitude attenuation term, thus limiting its application in the Q-compensated reverse time migration/full waveform inversion. In addition, GSLS-model-based wave equation is usually numerically solved using staggered-grid finite-difference (SGFD) method, which may result in the numerical dispersion due to the harsh stability condition and poses complexity and computational burden. To overcome these issues, we propose a high-accuracy Rayleigh-waves simulation scheme that involves the integration of the fractional viscoelastic wave equation and vacuum formalism. The proposed scheme not only decouples the amplitude attenuation and velocity dispersion but also significantly suppresses the numerical dispersion of Rayleigh waves under the same grid sizes. We first use a homogeneous elastic model to demonstrate the accuracy in comparison with the analytical solutions, and the correctness for a viscoelastic half-space model is verified by comparing the phase velocities with the dispersive images generated by the phase shift transformation. We then simulate several two-dimensional synthetic models to analyze the effectiveness and applicability of the proposed method. The results show that the proposed method uses twice as many spatial step sizes and takes 0.6 times that of the GSLS method (solved by the SGFD method) when achieved at 95% accuracy.

1. Introduction

Rayleigh waves have been extensively observed in seismic exploration [1] and play an important role in near-surface geophysical exploration, e.g., widely used in urban underground space exploration [2,3,4,5], subsurface parameter inversion [6,7,8,9] and layer thickness identification [10,11,12]. Taking full waveform inversion as an example, ignoring Rayleigh wave information during gradient updating can lead to data mismatch and ultimately reduce the reliability of velocity inversion results [13,14]. Furthermore, the dispersion curve of Rayleigh waves is sensitive to shear-wave (S-wave) velocity and layer thickness, which is conducive to the construction of the velocity profiles and obtaining the layer thickness [12,15,16,17]. Therefore, the accurate simulation of Rayleigh waves is crucial in comprehending the mechanism of seismic-wave propagation and constructing reliable subsurface models.
The free-surface boundary condition severely affects the accuracy of Rayleigh-waves simulation [18]. Several strategies have been proposed for implementing surface modeling; for example, the vacuum formalism [19,20,21], the characteristic variable method [22,23], the stress image method (SIM) [24,25,26], Mittet’s scheme (MS) [27], and the acoustic-elastic boundary approach (AEA) [28]. Among them, the vacuum formalism is an early and efficient scheme that simulates Rayleigh waves by setting the S-wave-related parameters to zero. Nevertheless, this method suffers from severe numerical dispersion due to the inability to use high-order spatial difference operators [28,29], thus not being able to achieve the accuracy requirements of surface-wave simulation [30]. Alternatively, SIM is a more suitable option because of its stability and accuracy [24,25,26,31,32], although it lacks rigorous mathematical proof [26]. The advantages and disadvantages of common-used free boundary conditions and their formulas are shown in Table 1. Generally, Rayleigh waves suffer more severe numerical dispersion than body waves owing to energy leaking into the domain above the free surface or the low-velocity structure [25,33]. To achieve similar simulation accuracies between Rayleigh and body waves, small time or space steps may be adopted [28,32], resulting in a significant increase in computational requirements [34,35].
Earth materials usually behave as an imperfectly elastic medium [36], affecting the characteristics of Rayleigh waves in terms of amplitude and phase during their propagation [37,38,39]. So far, several mechanisms have been proposed for simulating Rayleigh waves in viscoelastic media [26,40,41,42]. The most common approach is developed by combining the generalized standard linear solid (GSLS) with SIM. Carcione [40] propagated Rayleigh waves by using the characteristic variable method. Zhang et al. [41] further modeled Rayleigh waves by using the Chebyshev pseudospectral method and analyzed the velocity dispersion. Yuan et al. [42] analyzed the attenuation and dispersion of Rayleigh waves by comparing elastic and viscoelastic wavefields. The abovementioned GSLS-model-based scheme has the advantage of parallel computation when solved using the staggered-grid finite-difference (SGFD) method [43,44,45]. Nevertheless, the GSLS model requires internal memory variables, which could significantly increase the computation time and memory, especially in 3D cases [46,47]. In contrast, the recently developed decoupled fractional Laplacians (DFL) equation is an ideal propagator for Rayleigh waves in attenuation media [48,49,50]. Compared with the time-fractional viscoelastic wave equation [51], the DFL equation avoids a large amount of wavefield storage, thus benefiting from higher computational efficiency [52]. Compared to the GSLS model, the DFL equation can decouple the two attenuation-associated effects, thus being convenient for amplitude compensation [53,54,55]. Recently, the DFL equation has been extensively used in both attenuation compensation imaging and full waveform inversion [55,56,57,58,59].
In this study, we stimulate Rayleigh waves in an attenuated medium by using the DFL viscoelastic wave equation. It is worth noting that the DFL viscoelastic wave equation is solved using the staggered-grid pseudospectral (SGPS) method, which naturally avoids the numerical dispersion problem encountered by the GSLS-based viscous equation (solved by the SGFD method) when employing the vacuum formalism. In addition, we set the vacuum formalism as the free-surface boundary condition and apply the convolutional perfectly matched layers (CPML) to absorb boundary reflections. The proposed scheme not only inherits the simplicity of the vacuum formalism but is also capable of propagating Rayleigh waves with Nyquist spatial accuracy because the spatial derivatives are solved using the fast Fourier transform (FFT).
The remainder of this paper is organized as follows. First, we review the DFL viscoelastic wave equation in Section 2. Then, we present the integration of the DFL viscoelastic wave equation and vacuum formalism to describe the propagation of body and Rayleigh waves. Next, several numerical experiments are conducted, as discussed in Section 3, to demonstrate the proposed scheme’s accuracy and superiority to other similar methods. Finally, we discuss computational efficiency in Section 4 and draw conclusions of this study in Section 5.

2. Modeling Method

2.1. DFL Viscoelastic Wave Equation

The first-order velocity-stress viscoelastic wave equation in the time domain can be derived from the momentum conservation equation and viscoelastic constitutive relationship. The linearized equation of momentum conservation [40,60] can be expressed as
ρ v x t = σ x x x + σ x z z + f x , ρ v z t = σ x z x + σ z z z + f z ,
where v x and v z represent the particle velocity components in the x- and z-directions, respectively; σ x x , σ z z and σ x z are the stress components; ρ denotes the mass density; f x and f x are the body forces. The constitutive equation [50] is derived as
σ x x t = M p v x x + v z z 2 M s v z z , σ z z t = M p v x x + v z z 2 M s v x x , σ x z t = M s v z x + v x z ,
where
M θ = ρ γ θ c θ ω 0 2 1 2 + ρ c θ 2 + ρ γ θ c θ 3 ω 0 2 1 2 + ρ π γ θ c θ 2 1 2 t + ρ π γ θ 2 c θ 2 1 ω 0 t ,
c θ = c ˜ θ cos π γ θ 2 , γ θ = 1 π arctan 1 Q θ ,
and θ = P or S representing P- or S-wave, respectively. Furthermore, c θ and γ θ are the associated propagation velocity and attenuation strength, respectively; c ˜ θ denotes the velocity at the reference frequency ω 0 ; and Q θ is the quality factor. Next, the 2D DFL viscoelastic wave equation can be derived by the following first-order system:
ρ v x t = σ x x x + σ x z z + f x , ρ v z t = σ x z x + σ z z z + f z , σ x x t = M p v x x + v z z 2 M s v z z , σ z z t = M p v x x + v z z 2 M s v x x , σ x z t = M s v z x + v x z ,
Note that the spatially independent Laplace operators in Equation (5) can accurately propagate seismic waves in the attenuation medium. In addition, Equation (5) can be used to decouple the amplitude decay and phase distortion, thereby providing a direct advantage for seismic modeling and imaging applications. Moreover, Equation (5) is generally solved using the SGPS method, which can effectively suppress numerical dispersion compared to the SGFD method.

2.2. Boundary Treatment

2.2.1. Free Surface Boundary

The vacuum formalism required for modeling a surface topography is to set v P , v S , ρ 0 in the region above the free surface. This approach is desirable because it can be implemented using the same scheme as that used in the interior of the model [19,20,21]. In this study, we assume that the free surface is set at j = 0 , and the z-axis is downward positive (Figure 1b). Then, the medium parameters above the free surface are set as
ρ ( i , j k ) = 0 , v P ( i , j k ) = 10 8 , v S ( i , j k ) = 10 8 , k = 1 , 2 , , N ,
to approximate the vacuum layers, where N is the thickness of the layers. Further, the velocity is set close to zero to avoid division by zero.

2.2.2. Absorbing Boundary

The actual medium of the Earth is a half-infinite space. Numerical simulations are usually performed in finite domains due to computational cost and hardware limitations. Therefore, accurate simulation results require an appropriate absorbing boundary condition, such as Perfectly Matched Layers (PML) [61], CPML [62], and Multiaxial Perfectly Matched Layers (M-PML) [63,64]. In this study, we adopt the CPML method [62] to eliminate the nonphysical reflections from the other artificial boundaries (Figure 1a). Compared to the classical PML method, waves with grazing incidence are better absorbed in the CPML method. Additionally, its memory storage cost is similar to that of the classical PML method. The CPML method is applied to the first-order velocity-stress viscoelastic wave equation, and it can be expressed as
ρ v x t = 1 κ x · σ x x x + Φ x x + 1 κ z · σ x z z + Φ x z ρ v z t = 1 κ x · σ x z x + Φ x z + 1 κ z · σ z z z + Φ z z σ x x t = M p 1 κ x · v x x + Ψ x x + 1 κ z · v z z + Ψ z z 2 M s 1 κ z · v z z + Ψ z z σ z z t = M p 1 κ x · v x x + Ψ x x + 1 κ z · v z z + Ψ z z 2 M s 1 κ x · v x x + Ψ x x σ x z t = M s 1 κ x · v z x + Ψ z x + 1 κ z · v x z + Ψ x z ,
with
Φ i j = B j Φ i j + A j σ i j j , Ψ i j = B j Ψ i j + A j v i j , i , j = x o r z ,
where B j = e d j d j κ j κ j + α j Δ t ; A j = d j κ j d j + α j κ j B j 1 ; d j = ( m + 1 ) v max 2 L l L ln γ controls the decay in the j direction; and l 0 l L denotes the distance between the point inside the CPML and internal boundary. Further, L is the thickness of CPML; m = 2 or 3 is a positive integer number; v max is the maximum velocity; γ represents the theoretical reflection coefficient; κ j = 1 + κ max 1 l L m controls the absorption of surface waves; and κ max 1 is a positive real number. Moreover, α j = π α max 1 l L controls the absorption of the low-frequency components, where α max is generally taken as the main frequency of the wavelet and j = x or z denotes spatial coordinates.

2.3. Numerical Implementation

As the pseudospectral method can effectively transform the exponential operator into a multiplication operator, it has been widely used for solving the fractional Laplacian operators [50,65,66]. In this study, we use the finite-difference scheme and SGPS method to calculate the temporal derivatives and fractional Laplace operators, respectively [66,67]. As shown in Figure 1b, as different components of one physical parameter are defined at different staggered-grid points, arithmetic averaging and harmonic-averaging schemes [68] are used to compute model parameters. Therefore, we have
ρ x i + 1 2 , j = ρ i , j + ρ i + 1 , j 2 , ρ z i , j + 1 2 = ρ i , j + ρ i , j + 1 2 ,
M i + 1 2 , j + 1 2 S = 4 1 M i , j S + 1 M i + 1 , j S + 1 M i , j + 1 S + 1 M i + 1 , j + 1 S 1 i f M i , j S M i + 1 , j S M i , j + 1 S M i + 1 , j + 1 S 0 0 o t h e r w i s e
The detailed numerical implementation can be summarized in the following four steps.
1.
Calculate the spatial derivatives
The spatial derivatives in Equation (5) can be solved using the SGPS method
± u m = F m 1 i k m e ± i k m Δ m / 2 F m u , m = x o r z ,
where u = v x + , v z + , σ x x , σ z z , σ x z T , F m represents the 1D Fourier transform, and F m 1 is the corresponding inverse transform. Note that ± of e-exponential denotes the half spatial interval shift, where + and − correspond to the left (up) and right (down) shifts, respectively. In addition, the + and − operators of partial u represent the current and previous time, respectively.
2.
Calculate the fractional Laplacians term as follows:
M θ v m + n = ρ γ θ c θ ω 0 F 1 k 1 F v m + n + ρ c θ 2 F 1 F v m + n + ρ γ θ c θ 3 ω 0 1 F 1 k F v m + n + ρ π γ θ c θ F 1 k 1 F t v m + n + ρ π γ θ 2 c θ 2 ω 0 1 F 1 F t v m + n
with
t v m + n = 1 Δ t v m + n v m n , m , n = x o r z ,
where F and F 1 represent the 2D Fourier and inverse transforms, respectively.
3.
Update the particle velocity and stress as follows:
v x + = v x + Δ t ρ σ x x x + σ x z z + f x v z + = v z + Δ t ρ σ x z x + σ z z z + f z σ x x + = σ x x + Δ t M P v x + x + v z + z 2 M S v z + z σ z z + = σ z z + Δ t M P v x + x + v z + z 2 M S v x + x σ x z + = σ x z + Δ t M S v x + z + v z + x .
4.
Update the particle velocity and stress of the absorbing boundary:
v x + = v x + Δ t ρ 1 κ x · σ x x x + Φ x x + 1 κ z · σ x z z + Φ x z + f x v z + = v z + Δ t ρ 1 κ x · σ x z x + Φ x z + 1 κ z · σ z z z + Φ z z + f z σ x x + = σ x x + Δ t M P 1 κ x · v x + x + Ψ x x + 1 κ z · v z + z + Ψ z z 2 M S 1 κ z · v z + z + Ψ z z σ z z + = σ z z + Δ t M P 1 κ x · v x + x + Ψ x x + 1 κ z · v z + z + Ψ z z 2 M S 1 κ x · v x + x + Ψ x x σ x z + = σ x z + Δ t M S 1 κ z · v x + z + Ψ z x + 1 κ x · v z + x + Ψ x z .
Therefore, the vacuum formalism combined with the DFL viscoelastic wave equation can be implemented to accurately simulate Rayleigh waves.

3. Numerical Examples

We first validate the accuracy and superiority of the proposed scheme by using the half-space and two-layer models, respectively. Then, the Marmousi model is used to demonstrate its ability to treat complex attenuation media. In the following tests, the vacuum formalism is applied to simulate Rayleigh waves, and the CPML method is used to suppress reflections from other boundaries.

3.1. Homogeneous Half-Space Model

3.1.1. Elastic Medium

First, we use a homogeneous elastic half-space model with a size of 2000 × 800 and spatial intervals of 1.25 m to verify the accuracy with respect to the analytical solution. For the homogeneous elastic medium, the analytical solution can be obtained using the Cagniard–De Hoop technique [69]. The model comprises 20 absorbing layers and the reference phase velocities are v P = 2000 m/s and v S = 1150 m/s defined at a reference frequency of 200 Hz and density of ρ = 1.5 g/cm 3 . The maximum simulation time is 1 s with a time interval of 0.25 ms. A Ricker wavelet with a peak frequency of 20 Hz is selected as the vertical point source. The source and receiver are placed at (0 m, 0 m) and (600 m, 0 m), respectively. To simulate Rayleigh waves, we use the vacuum formalism as the free surface boundary condition and apply the CPML method [62] to suppress reflections from other boundaries. Figure 2 shows traces of the v x and v z components, where the red dashed line and black line represent the numerical and analytical solutions, respectively. As observed, the red dashed lines satisfactorily match the black lines, indicating a prominent accuracy of the proposed scheme.
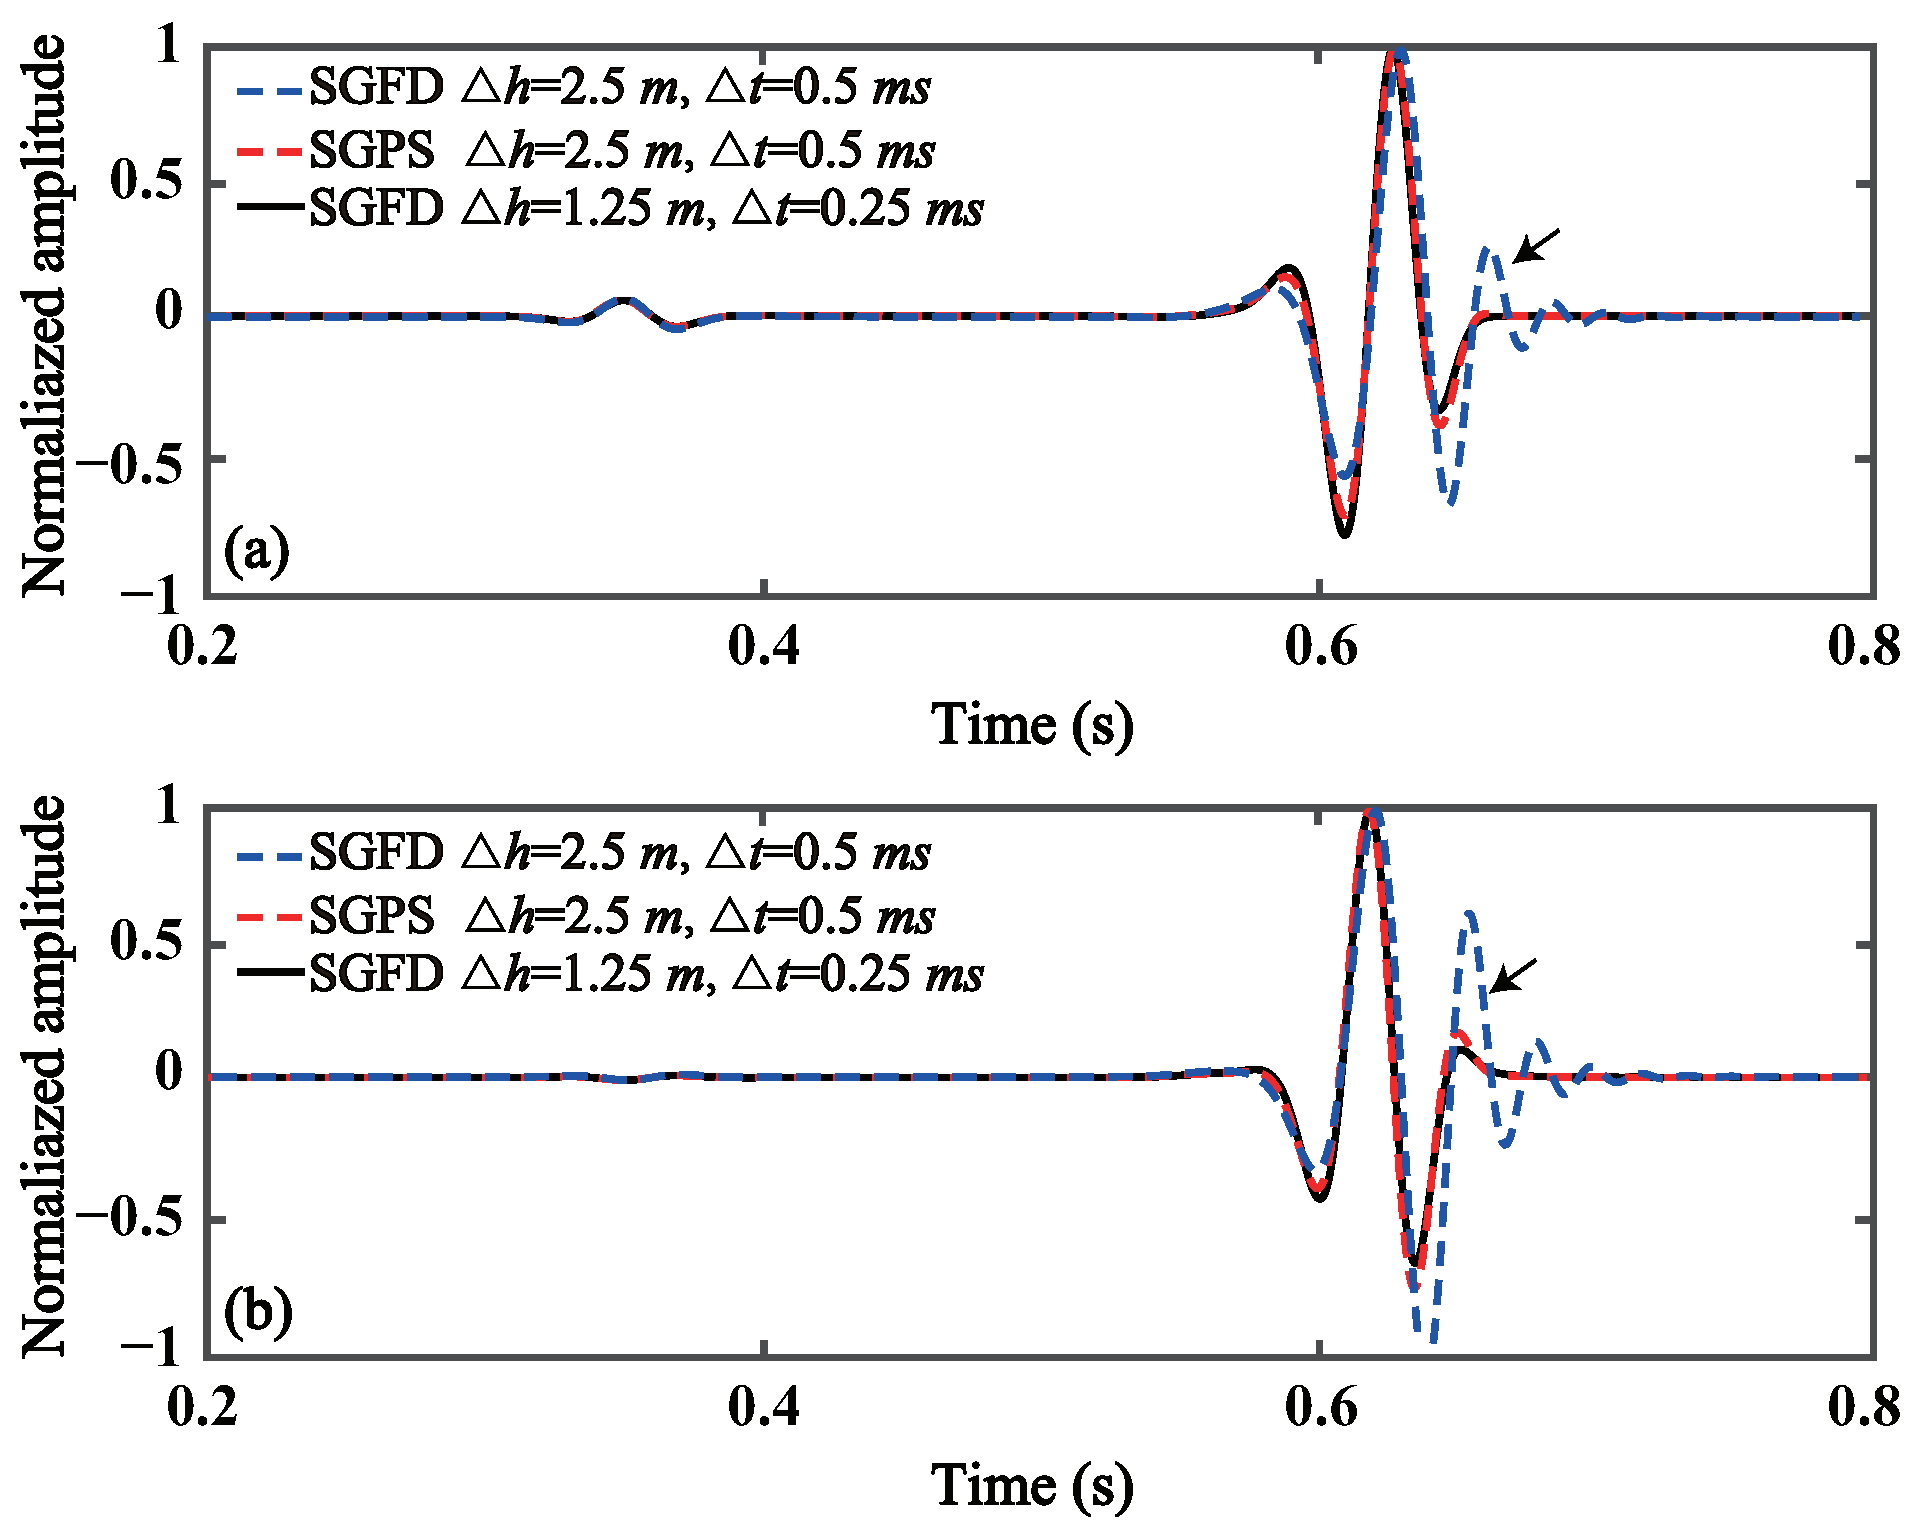
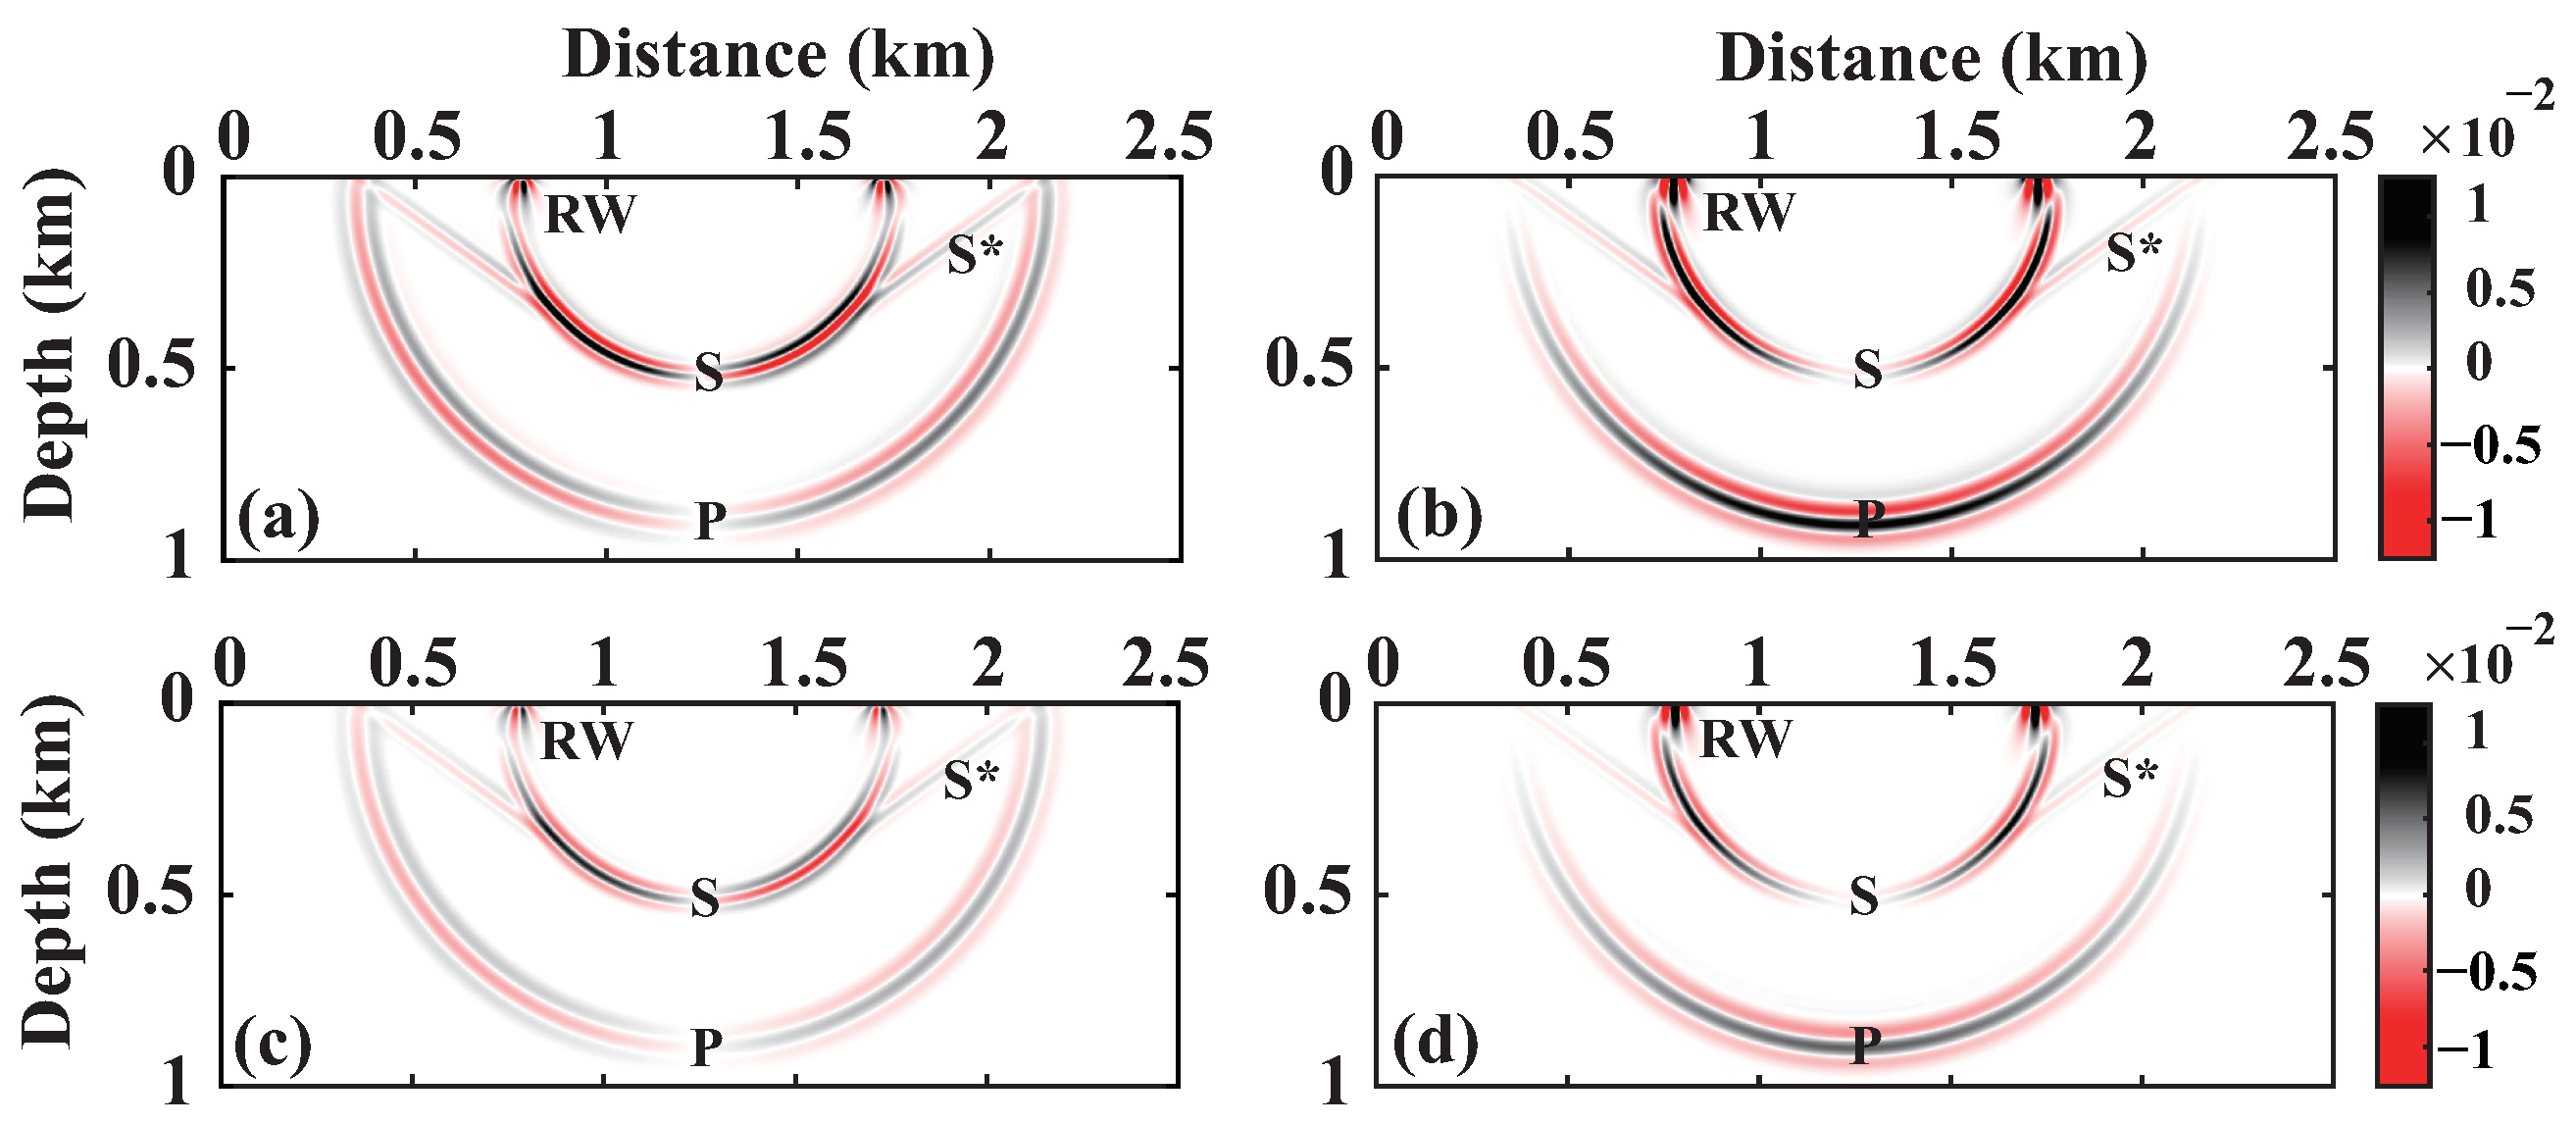
Next, to demonstrate the superiority of the proposed scheme in suppressing numerical dispersion, we employ SGPS and SGFD methods to solve the elastic wave equation. The first-order velocity-stress equation in isotropic elastic media and numerical implementation are given in Appendix A. A homogeneous elastic model is discretized into 1000 × 400 grids with spatial intervals of 2.5 m. The reference velocities defined at 200 Hz are v P = 2000 m/s and v S = 1150 m/s , with a time step of 0.5 ms and density of ρ = 1.5 g/cm 3 . A vertical point source with a dominant frequency of 20 Hz is located at (0 m, 0 m). Figure 3 shows the wavefield snapshots at t = 1 s, in which RW, P, S, and S* denote Rayleigh waves, direct P-waves, direct S-waves, and free-surface-related S-waves [70]; the left and right columns correspond to the v x and v z components, respectively. The first row represents the snapshots generated by using the SGFD method with spatial and time steps of 2.5 m and 0.5 ms; the second row represents those generated by the SGPS method with the same spatial and time intervals; the third row displays the snapshots obtained using the SGFD method with smaller intervals (spatial steps of 1.25 m and time steps of 0.25 ms). For a clear comparison, we enlarge the snapshots of the free surface in Figure 4. Figure 4a,b show obvious numerical artifacts (marked by the arrows), i.e., the simulation results of the SGFD method suffer serious numerical dispersion for larger spatial and time steps. When the spatial and time steps are reduced (Figure 4e,f), the numerical artifacts decrease significantly. This is because the second-order SGFD method produces a significant truncation error that can be reduced by increasing the FD stencil length or reducing the spatial sampling interval. The clean wavefront in Figure 3c–f indicates that the proposed scheme can accurately extrapolate wavefields with twice the spatial and time steps of the SGFD method. Figure 5 displays the seismic traces within 0.2–0.8 s recorded at (600 m, 0 m), where Figure 5a,b correspond to the traces of the v x and v z component waveforms, respectively. Similar to wavefield snapshots, obvious ring phenomena can be observed from the traces obtained using the SGFD method with spatial steps of 2.5 m and time steps of 0.5 ms (blue dashed lines). When the spatial and time steps are reduced, the waveform distortion of Rayleigh waves decreases significantly (black lines). These waveforms are almost the same as those obtained using the SGPS method, with spatial steps of 2.5 m and time steps of 0.5 ms (red dashed lines). Figure 3 and Figure 5 indicate that the proposed scheme can effectively suppress the spatial numerical dispersion compared to the SGFD method for the same mesh division. This phenomenon is attributed to the SGPS method propagating Rayleigh waves with Nyquist spatial accuracy as a result of using FFT to solve spatial derivatives.

3.1.2. Viscoelastic Medium

Next, we extend the vacuum formalism to the viscoelastic medium. The model used in this scenario is the same as the first model (Figure 2), except for the location of the source, which is at the (1250 m, 0 m). In addition, the values of the quality factor are Q p = 50 , Q s = 30 . Here, we only use the SGPS method for the simulation because numerically solving fractional Laplace operators by using the SGFD method is difficult. Figure 6 shows wavefield snapshots at t = 0.5 s. As shown, Rayleigh waves only propagate near the free surface, because the depth of its propagation is about one wavelength [37]. Compared with the elastic wavefield (Figure 6a,b), the amplitude of viscoelastic wavefield (Figure 6c,d) is seriously attenuated due to inherent attenuation characteristics of the viscoelastic medium.
Next, we obtain the dispersive images to verify the method’s accuracy, with the source located at (0 m, 0 m). Figure 7a shows the common-gather (offset from 250 to 1500 m) with a recording time of 2 s. As shown, the energy of Rayleigh waves is the strongest, and their amplitudes decrease gradually with the increase of the offset (represented by arrows). Figure 7b shows the corresponding dispersive images of Rayleigh waves in the frequency-velocity domain that are generated using the phase shift transform method [71], where the black dots denote the theoretical phase velocities of Rayleigh waves [40]. The results show that the dispersive images satisfactorily conform to the theoretical phase velocities, except for the slight differences at frequencies below 10 Hz, which can be attributed to the near-field effects, such as nonplane wave propagation and body-wave energy leakage [72]. Moreover, the phase velocities of Rayleigh waves increase with respect to frequency, as is consistent with Carcione’s analytical solution [40].

3.2. Two-Layer Model

We design a two-layer model to verify the ability of the proposed scheme to process the viscoelastic heterogeneous medium. The two-layer model is discretized into 1200 × 600 grid points with 1.25 m spatial intervals. A horizontal interface is observed at a depth of 250 m, and a vertical point source with 20 Hz dominant frequency is set at (750 m, 0 m). The time step is 0.25 ms, and the parameters of each layer are shown in Table 2. The vacuum formalism is set to the free surface boundary condition. The CPML method [62] is used to suppress reflections from other boundaries. Figure 8 displays the wavefield snapshots at t = 0.45 s. As shown, the energy of Rayleigh waves is stronger than that of the body waves near the free surface, which is consistent with the dominant proportion of surface wave energy in an elastic medium. In addition, the figure displays the reflected P-wave (RPP), reflected S-wave (RPS), transmitted P-wave (TPP), and transmitted S-wave (TPS) generated because of the presence of the reflecting interface.
Next, we further verify the accuracy of the proposed scheme in a heterogeneous attenuation medium by using the dispersion images. To obtain a clear dispersion phenomenon, the two-layer model is discretized into 1000 × 400 grid points with 2.5 m spatial intervals and a horizontal interface at a depth of 15 m. A Ricker wavelet with 20 Hz dominant frequency at (0 m, 0 m) serves as the vertical point source. The time step is 0.25 ms, and the parameters of each layer are shown in Table 3. Figure 9a shows the common-gather (offset from 250 to 1500 m) with a recording time of 3 s. We observe severe dispersion and amplitude decay, which are enhanced with the increase of the offset. Figure 9b shows the corresponding dispersive images. As shown, Rayleigh waves display multimode comprising fundamental and high-order modes due to an inherent characteristic that Rayleigh waves have dispersion phenomenon in the multilayered media. The fundamental mode exhibits a predominant energy, while the energy of the higher-order modes decreases with their increasing order. This phenomenon is associated with the detection depth of Rayleigh waves and the viscosity of the medium. Additionally, a noticeable decrease is observed in the resolution of the dispersion energy. The dispersive images reveal accurate phase velocities of Rayleigh waves compared with the analytical results (black dots) calculated using the Knopoff method [73]. This indicates that the simulation results of the heterogeneous medium are accurate.
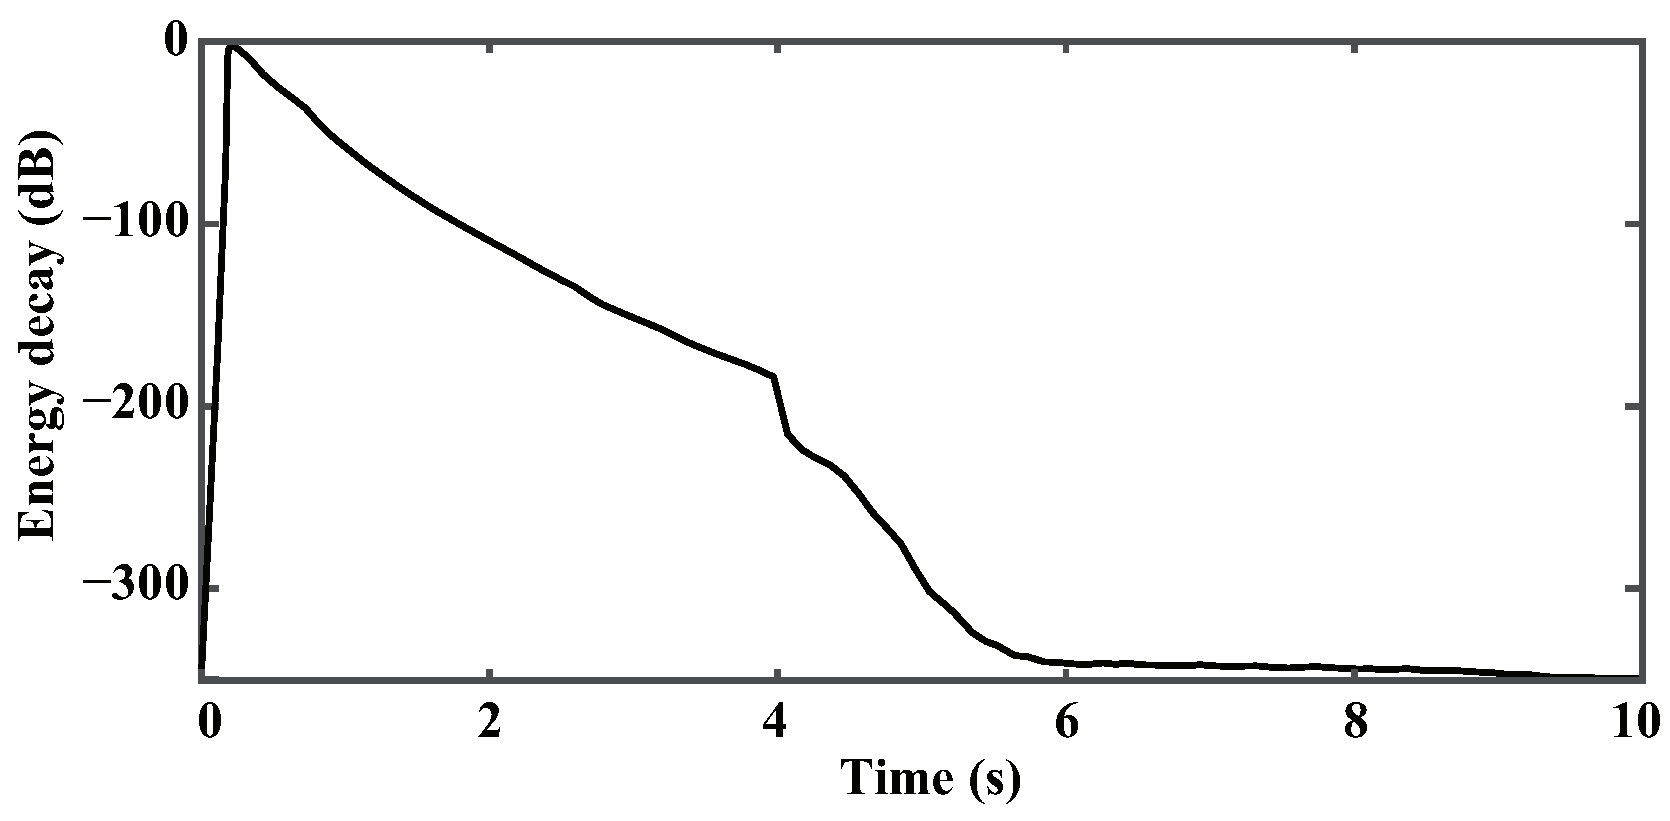
Next, we analyze the effect of attenuation on Rayleigh waves. For this, we set three models with the same simulation parameters as those of the first two-layer model (Figure 8), except for the Q values and model size (discretized into 2000 × 800 grid points). The detailed Q values are shown in Figure 10a. We make Q P = Q S for simplicity. We set Q = in Model 1 as the reference, and Models 2 and 3 display the upper and lower attenuation layers ( Q = 50 ), respectively. In Figure 10b, I–III display partial snapshots corresponding to Models 1–3 at t = 0.35 s, and IV represents the difference between Models 2 and 1; the strong amplitude residual near the free surface indicates that the shallow attenuation has a greater impact on surface waves. Furthermore, V shows the difference between Models 3 and 1; as observed, only the lower attenuation layer significantly affects the body waves. Figure 11 displays seismograms recorded at (875 m, 0 m), which provide a clearer verification of this phenomenon. This phenomenon can be attributed to the fact that the energy of Rayleigh waves decays exponentially along the depth and is mainly concentrated in a wavelength range [74]. To further evaluate the stability of the proposed scheme, we simulate the propagation of the Rayleigh waves up to 10 s. The energy attenuation curve (Figure 12) indicates that the proposed scheme is still stable even for a large simulation time.

3.3. Marmousi Model

This section demonstrates the simulation results of the Marmousi model with a more realistic level of structural complexity. Figure 13a–d display the P-wave velocity, S-wave velocity, Q P , and Q S , respectively. The model contains 663 × 234 grid points with a spacing of 2 m. A vertical point source with 20 Hz dominant frequency is added at (663 m, 0 m). The simulation time is 2 s with a time step of 0.1 ms. The vacuum formalism is used as the free surface boundary condition for the simulation of Rayleigh waves, and the CPML method [62] is used to suppress the reflections from other boundaries. To verify the simulation accuracy, the results of SIM function as a reference solution. Figure 14 shows the wavefield snapshots at t = 0.45 s and the common-gather of particle velocity v z component. Here, I/VI and II/VII display the simulation results generated by the SIM and proposed scheme, respectively. The proposed scheme and SIM simulate almost matched wavefields and common-gather, and the minor difference (IV and IX) between the two suggests that the proposed scheme can handle a complex heterogeneous medium. In the figure, III and VIII show the simulation results under the absorption-only boundaries. Compared with the proposed scheme, the wavefield snapshot of the shallow layer differs significantly (marked by the arrows) because free surface conditions are not set; that is, Rayleigh waves, R* waves, and other reflection waves are not generated near the free surface. In addition, these differences are more clearly observed (marked by boxes) in the common-gather. The residuals (V and X) indicate that surface waves have a greater influence on the shallow wavefield, especially energy distribution. To further test the performance of the proposed method in complex media, we then compare the simulation results between the DFL equation and the GSLS model (solved by the SGFD method and can be found in Appendix B), both employing the vacuum formalism. Figure 15a,c display the simulation results generated by solving the DFL equation using the SGPS method. Figure 15b,d show the simulation results obtained by solving the GSLS model using the SGFD method. In Figure 15b, we find obvious numerical artifacts (marked by arrows), and Figure 15d displays a visible tailing phenomenon. By contrast, the DFL equation (Figure 15a,c) generates clean wavefronts, and Rayleigh waves do not have a broomstick shape in the common shot gather. It is further verified that the proposed method can effectively suppress the numerical dispersion of Rayleigh waves.

4. Discussion

In the homogeneous elastic half-space and Marmousi models, we have confirmed the effectiveness of the proposed method in suppressing the numerical dispersion of Rayleigh waves at the same spatial step size. In addition, by enlarging the spatial step (approximately twice as much) in the elastic model, we achieve approximate simulation results. To test this for the attenuation media, we design a series of models with different time and spatial steps. The model size, time, and spatial steps are shown in Table 4. A vertical point source with a dominant frequency of 20 Hz is located at (0 m, 0 m), and the maximum simulation time is 1 s. We set the simulation results of the GSLS-model-based wave equation with spatial steps of 0.5 m and time steps of 0.1 ms as the reference. The seismograms and their L 2 misfit between the numerical and reference results are shown in Figure 16 and Table 5. Comparing Figure 16a,b, we observe that both methods agree well with the reference results when the spatial sampling is more than 50 points per minimum wavelength ( Δ h = 1 m). When we further reduce the spatial sampling to 25 points per minimum wavelength ( Δ h = 2 m), the proposed scheme achieves at least 95% accuracy, and the GSLS method produces unacceptable results. None of the methods obtain acceptable results when the spatial sampling is less than 12.5 points per minimum wavelength ( Δ h = 4 m). Compared to the GSLS equation, the numerical implementation of the DFL equation is approximately three times slower due to performing multiple FFTs. However, the computational efficiency of the DFL equation is more favorable when considering both the calculation accuracy and the number of spatial sampling points. For instance, when achieving 95% accuracy, the DFL equation implements a spatial step size of 2m, whereas the GSLS equation necessitates a spatial step size of 1 m. As a result, the DFL equation’s computation time is 0.6 times faster compared to the GSLS equation.

5. Conclusions

This study proposes a high-accuracy simulation method of Rayleigh waves, which integrates the vacuum formalism and DFL viscoelastic wave equation. Compared with the vacuum formalism based on the GSLS-model-based wave equation, the proposed scheme can suppress the numerical dispersion with a simple form and convenient implementation. We test the simulation results against the analytical solutions in an elastic half-space model. The comparisons are excellent except for some slight differences. We then compare the theoretical phase velocities with the dispersive images in a viscoelastic half-space model, demonstrating the accuracy of the model results and revealing an increase in Rayleigh wave phase velocities with frequency. To analyze the effectiveness and applicability of the proposed method, we simulate several two-dimensional synthetic models. The results demonstrate that the proposed method uses twice the spatial step size and requires 0.6 times less time than the GSLS method (solved by the SGFD method) when achieving 95% accuracy. We anticipate that the proposed scheme could provide valuable references for simulating Rayleigh waves and other seismic waves.

Author Contributions

Conceptualization, Y.W. and J.L.; methodology, Y.W.; software, Y.W. and N.W.; validation, J.L. and Y.S.; formal analysis, L.H.; investigation, L.H.; writing—original draft, Y.W.; writing—review and editing, N.W.; visualization, Y.W. and N.W.; supervision, L.H. All authors have read and agreed to the published version of the manuscript.

Funding

This research was partly supported by the National Natural Science Foundation of China (grant number: 41930431, 42204129), the Joint Guiding Project of the Natural Science Foundation of Heilongjiang Province (grant number: LH2021D009), and CNPC Innovation Found (2022DQ02-0303).

Data Availability Statement

The original contributions presented in the study are included in the article, further inquiries can be directed to the author.

Conflicts of Interest

The authors declare no conflict of interest.

Appendix A. The Elastic Equation and Numerical Implementation

In 2D isotropic elastic media, the first-order velocity-stress equation is written as:
ρ v x t = σ x x x + σ x z z + f x , ρ v z t = σ x z x + σ z z z + f z , σ x x t = λ + 2 μ v x x + λ v z z , σ z z t = λ v x x + λ + 2 μ v z z , σ x z t = μ v z x + v x z ,
where v x and v z represent the particle velocity components in the x- and z-directions, respectively; σ x x , σ z z and σ x z are the stress components; ρ denotes the mass density; f x and f x are the body forces; λ and μ are Lame parameters.
The first-order velocity-stress equation on a staggered grid is written as follows:
v x + = v x + Δ t ρ x D x + σ x x + D z σ x z + f x , v z + = v z + Δ t ρ z D z + σ z z + D x σ x z + f z , σ x x + = σ x x + Δ t λ + 2 μ D x v x + + λ D z v z + , σ z z + = σ z z + Δ t λ D x v x + + λ + 2 μ D z v z + , σ x z + = σ x z + Δ t μ x z D x + v z + + D z + v x + ,
The spatial derivatives in Equation (A2) are approximated by high-order finite-difference operators on a staggered grid. We define a forward operator D x + as
D x + u i , j + 1 2 = k = 1 N α k u i , j + k u i , j k + 1 Δ x .
and a backward operator D z as
D z u i + 1 2 , j = k = 1 N α k u i + k 1 , j u i k , j Δ z .
where u = v x + , v z + , σ x x , σ z z , σ x z T , the + and − operators of partial u represent the current and previous time, respectively. Δ x and Δ z are the grid spacing in the x- and z-directions, respectively. N denotes the length of the operator and α k is the corresponding weighting factor.
The spatial derivatives in Equation (A2) are computed using the SGPS method. We define D m ± as
D m ± u = F m 1 i k m e ± i k m Δ m / 2 F m u , m = x o r z ,
where F m represents the 1D Fourier transform, and F m 1 is the corresponding inverse transform. Note that ± of e-exponential denotes the half spatial interval shift, where + and − correspond to the left (up) and right (down) shifts, respectively.

Appendix B. The GSLS-Model-Based Wave Equation

The first-order velocity-stress viscoelastic wave equation of 2D media [43] in the time domain is written as follows:
ρ v x t = σ x x x + σ x z z + f x , ρ v z t = σ x z x + σ z z z + f z , σ x x t = λ ^ + 2 μ ^ v x x + λ ^ v z z + l = 1 L 1 e 1 l t + l = 1 L 2 e 2 l t , σ z z t = λ ^ v x x + λ ^ + 2 μ ^ v z z + l = 1 L 1 e 1 l t l = 1 L 2 e 2 l t , σ x z t = μ ^ v z x + v x z + l = 1 L 2 e 3 l t , 2 e 1 l t 2 = 1 τ σ l ( 1 ) e 1 l t + 1 2 ϕ 1 l v x x + v z z , l = 1 , , L 1 , 2 e 2 l t 2 = 1 τ σ l ( 2 ) e 2 l t + 1 2 ϕ 2 l v x x v z z , l = 1 , , L 2 , 2 e 3 l t 2 = 1 τ σ l ( 2 ) e 3 l t + 1 2 ϕ 2 l v x z + v z x , l = 1 , , L 2 .
where v x and v z represent the particle velocity components in the x- and z-directions, respectively; σ x x , σ z z and σ x z are the stress components; ρ denotes the mass density; f x and f x are the body forces. Further, e 1 l is a memory variable that describes the characteristics of the dilatational wave, and e 2 l and e 3 l are the memory variables for the quasi-shear wave. Moreover, τ σ l ( v ) and τ ε l ( v ) are material relaxation times; the quantities λ ^ and μ ^ are the unrelaxed Lame constants of 2D solid defined by:
λ ^ = M 1 2 1 1 L 1 l = 1 L 1 1 τ ε l ( 1 ) τ σ l ( 1 ) M 2 2 1 1 L 2 l = 1 L 2 1 τ ε l ( 2 ) τ σ l ( 2 ) , μ ^ = M 2 2 1 1 L 2 l = 1 L 2 1 τ ε l ( 2 ) τ σ l ( 2 ) , M 1 = 2 ρ v P 2 v S 2 Re 1 L 1 l = 1 L 1 1 + i w 0 τ ε l ( 1 ) 1 + i w 0 τ σ l ( 1 ) 1 2 2 , M 2 = 2 ρ v S 2 Re 1 L 2 l = 1 L 2 1 + i w 0 τ ε l ( 2 ) 1 + i w 0 τ σ l ( 2 ) 1 2 2 .
where M v ( v = 1 , 2 ) is the relaxed moduli; v P and v S are the reference velocities defined at the reference frequency w 0 ; and ϕ v l = M v L v τ σ l v 1 τ ε l ( v ) τ σ l ( v ) , ( v = 1 , 2 ) is response function.

References

  1. Rayleigh, L. On waves propagated along the plane surface of an elastic solid. Proc. Lond. Math. Soc. 1885, 1, 4–11. [Google Scholar] [CrossRef]
  2. Namazi, E.; Mohamad, H.; Jorat, M.E.; Hajihassani, M. Investigation on the effects of twin tunnel excavations beneath a road underpass. Electron. J. Geotech. Eng. 2011, 16, 441–450. [Google Scholar]
  3. Jusoh, S.N.; Mohamad, H.; Marto, A.; Yunus, N.M.; Kasim, F. Segment’s joint in precast tunnel lining design. J. Teknol. 2015, 77, 91–98. [Google Scholar] [CrossRef]
  4. Al-Bared, M.A.; Harahap, I.S.; Marto, A.; Mohamad, H.; Abad, S.V.A.N.K.; Mustaffa, Z. Cyclic behavior of RT-cement treated marine clay subjected to low and high loading frequencies. Geomech. Eng. 2020, 21, 433–445. [Google Scholar] [CrossRef]
  5. Chaiyasarn, K.; Buatik, A.; Mohamad, H.; Zhou, M.; Kongsilp, S.; Poovarodom, N. Integrated pixel-level CNN-FCN crack detection via photogrammetric 3D texture mapping of concrete structures. Autom. Constr. 2022, 140, 104388. [Google Scholar] [CrossRef]
  6. Xia, J.; Miller, R.D.; Park, C.B.; Tian, G. Determining Q of near-surface materials from Rayleigh waves. J. Appl. Geophys. 2002, 51, 121–129. [Google Scholar] [CrossRef]
  7. Xia, J.; Xu, Y.; Miller, R.D.; Chen, C. Estimation of elastic moduli in a compressible Gibson half-space by inverting Rayleigh-wave phase velocity. Surv. Geophys. 2006, 27, 1–17. [Google Scholar] [CrossRef]
  8. Pan, Y.; Schaneng, S.; Steinweg, T.; Bohlen, T. Estimating S-wave velocities from 3D 9-component shallow seismic data using local Rayleigh-wave dispersion curves—A field study. J. Appl. Geophys. 2018, 159, 532–539. [Google Scholar] [CrossRef]
  9. Mi, B.; Xia, J.; Tian, G.; Shi, Z.; Xing, H.; Chang, X.; Zhang, H. Near-surface imaging from traffic-induced surface waves with dense linear arrays: An application in the urban area of Hangzhou, China. Geophysics 2022, 87, B145–B158. [Google Scholar] [CrossRef]
  10. Yuan, D.; Nazarian, S. Automated surface wave method: Inversion technique. J. Geotech. Eng. 1993, 119, 1112–1126. [Google Scholar] [CrossRef]
  11. Wang, H.; Xu, R.; Feng, B.; Wu, J. Understanding of seismic exploration and viewpoint of seismic data imaging processing in a complex surface exploration area. Geophys. Prospect. Pet. 2023, 62, 789–805. [Google Scholar]
  12. Xia, J.; Miller, R.D.; Park, C.B. Estimation of near-surface shear-wave velocity by inversion of Rayleigh waves. Geophysics 1999, 64, 691–700. [Google Scholar] [CrossRef]
  13. Bleibinhaus, F.; Rondenay, S. Effects of surface scattering in full-waveform inversion. Geophysics 2009, 74, WCC69–WCC77. [Google Scholar] [CrossRef]
  14. Fang, J.; Zhou, H.; Zhang, Q.; Chen, H.; Wang, N.; Sun, P.; Wang, S. Effect of surface-related Rayleigh and multiple waves on velocity reconstruction with time-domain elastic FWI. J. Appl. Geophys. 2018, 148, 33–43. [Google Scholar] [CrossRef]
  15. Beaty, K.S.; Schmitt, D.R.; Sacchi, M. Simulated annealing inversion of multimode Rayleigh wave dispersion curves for geological structure. Geophys. J. Int. 2002, 151, 622–631. [Google Scholar] [CrossRef]
  16. Luo, Y.; Xia, J.; Liu, J.; Liu, Q.; Xu, S. Joint inversion of high-frequency surface waves with fundamental and higher modes. J. Appl. Geophys. 2007, 62, 375–384. [Google Scholar] [CrossRef]
  17. Song, X.; Gu, H.; Liu, J.; Zhang, X. Estimation of shallow subsurface shear-wave velocity by inverting fundamental and higher-mode Rayleigh waves. Soil Dyn. Earthq. Eng. 2007, 27, 599–607. [Google Scholar] [CrossRef]
  18. Lan, H.; Zhang, Z. Comparative study of the free-surface boundary condition in two-dimensional finite-difference elastic wave field simulation. J. Geophys. Eng. 2011, 8, 275–286. [Google Scholar] [CrossRef]
  19. Zahradník, J.; Hron, F. Robust finite-difference scheme for elastic waves on coarse grids. Stud. Geophys. Geod. 1992, 36, 1–19. [Google Scholar] [CrossRef]
  20. Frankel, A.; Leith, W. Evaluation of topographic effects on P and S-waves of explosions at the northern Novaya Zemlya test site using 3-D numerical simulations. Geophys. Res. Lett. 1992, 19, 1887–1890. [Google Scholar] [CrossRef]
  21. Schultz, C.A. A density-tapering approach for modeling the seismic response of free-surface topography. Geophys. Res. Lett. 1997, 24, 2809–2812. [Google Scholar] [CrossRef]
  22. Bayliss, A.; Jordan, K.E.; LeMesurier, B.J.; Turkel, E. A fourth-order accurate finite-difference scheme for the computation of elastic waves. Bull. Seismol. Soc. Am. 1986, 76, 1115–1132. [Google Scholar] [CrossRef]
  23. Kosloff, D.; Kessler, D.; Filho, A.Q.; Tessmer, E.; Behle, A.; Strahilevitz, R. Solution of the equations of dynamic elasticity by a Chebychev spectral method. Geophysics 1990, 55, 734–748. [Google Scholar] [CrossRef]
  24. Levander, A.R. Fourth-order finite-difference P-SV seismograms. Geophysics 1988, 53, 1425–1436. [Google Scholar] [CrossRef]
  25. Graves, R.W. Simulating seismic wave propagation in 3D elastic media using staggered-grid finite differences. Bull. Seismol. Soc. Am. 1996, 86, 1091–1106. [Google Scholar] [CrossRef]
  26. Robertsson, J.O. A numerical free-surface condition for elastic/viscoelastic finite-difference modeling in the presence of topography. Geophysics 1996, 61, 1921–1934. [Google Scholar] [CrossRef]
  27. Mittet, R. Free-surface boundary conditions for elastic staggered-grid modeling schemes. Geophysics 2002, 67, 1616–1623. [Google Scholar] [CrossRef]
  28. Xu, Y.; Xia, J.; Miller, R.D. Numerical investigation of implementation of air-earth boundary by acoustic-elastic boundary approach. Geophysics 2007, 72, SM147–SM153. [Google Scholar] [CrossRef]
  29. Zahradník, J.; Priolo, E. Heterogeneous formulations of elastodynamic equations and finite-difference schemes. Geophys. J. Int. 1995, 120, 663–676. [Google Scholar] [CrossRef]
  30. Bohlen, T.; Saenger, E.H. Accuracy of heterogeneous staggered-grid finite-difference modeling of Rayleigh waves. Geophysics 2006, 71, T109–T115. [Google Scholar] [CrossRef]
  31. Gottschammer, E.; Olsen, K.B. Accuracy of the explicit planar free-surface boundary condition implemented in a fourth-order staggered-grid velocity-stress finite-difference scheme. Bull. Seismol. Soc. Am. 2001, 91, 617–623. [Google Scholar] [CrossRef]
  32. Kristek, J.; Moczo, P.; Archuleta, R.J. Efficient methods to simulate planar free surface in the 3D 4th-order staggered-grid finite-difference schemes. Stud. Geophys. Geod. 2002, 46, 355–381. [Google Scholar] [CrossRef]
  33. Xu, H.; Day, S.M.; Minster, J.B.H. Two-dimensional linear and nonlinear wave propagation in a half-space. Bull. Seismol. Soc. Am. 1999, 89, 903–917. [Google Scholar] [CrossRef]
  34. Fang, X.; Yao, G.; Niu, F.; Wu, D. Estimating optimal parameters of finite-difference scheme for wavefield modeling. Chin. J. Geophys.-Chin. Ed. 2023, 66, 2520–2533. [Google Scholar]
  35. Yao, G.; Wu, D.; Debens, H.A. Adaptive finite difference for seismic wavefield modelling in acoustic media. Sci. Rep. 2016, 6, 30302. [Google Scholar] [CrossRef] [PubMed]
  36. Dutta, G.; Schuster, G.T. Attenuation compensation for least-squares reverse time migration using the viscoacoustic-wave equation. Geophysics 2014, 79, S251–S262. [Google Scholar] [CrossRef]
  37. Carcione, J.M. Rayleigh waves in isotropic viscoelastic media. Geophys. J. Int. 1992, 108, 453–464. [Google Scholar] [CrossRef]
  38. Borcherdt, R.D. Rayleigh-type surface wave on a linear viscoelastic half-space. J. Acoust. Soc. Am. 1973, 54, 1651–1653. [Google Scholar] [CrossRef]
  39. Currie, P.K.; Hayes, M.A.; O’Leary, P.M. Viscoelastic Rayleigh waves. Q. Appl. Math. 1977, 35, 35–53. [Google Scholar] [CrossRef]
  40. Carcione, J.M. Modeling anelastic singular surface waves in the earth. Geophysics 1992, 57, 781–792. [Google Scholar] [CrossRef]
  41. Zhang, K.; Luo, Y.; Xia, J.; Chen, C. Pseudospectral modeling and dispersion analysis of Rayleigh waves in viscoelastic media. Soil Dyn. Earthq. Eng. 2011, 31, 1332–1337. [Google Scholar] [CrossRef]
  42. Yuan, S.; Song, X.; Cai, W.; Hu, Y. Analysis of attenuation and dispersion of Rayleigh waves in viscoelastic media by finite-difference modeling. J. Appl. Geophys. 2018, 148, 115–126. [Google Scholar] [CrossRef]
  43. Carcione, J.M.; Kosloff, D.; Kosloff, R. Wave propagation simulation in a linear viscoelastic medium. Geophys. J. Int. 1988, 95, 597–611. [Google Scholar] [CrossRef]
  44. Xu, T.; McMechan, G.A. Composite memory variables for viscoelastic synthetic seismograms. Geophys. J. Int. 1995, 121, 634–639. [Google Scholar] [CrossRef]
  45. Carcione, J.M. Wave Fields in Real Media: Theory and Numerical Simulation of Wave Propagation in Anisotropic, Viscoelastic, Porous and Electromagnetic Media, 3rd ed.; Elsevier: Oxford, UK, 2014; pp. 385–424. [Google Scholar]
  46. Savage, B.; Komatitsch, D.; Tromp, J. Effects of 3D attenuation on seismic wave amplitude and phase measurements. Bull. Seismol. Soc. Am. 2010, 100, 1241–1251. [Google Scholar] [CrossRef]
  47. Zhu, T.; Carcione, J.M.; Harris, J.M. Approximating constant-Q seismic propagation in the time domain. Geophys. Prospect. 2013, 61, 931–940. [Google Scholar] [CrossRef]
  48. Yang, J.; Zhu, H. A time-domain complex-valued wave equation for modelling visco-acoustic wave propagation. Geophys. J. Int. 2018, 215, 1064–1079. [Google Scholar] [CrossRef]
  49. Wang, N.; Zhu, T.; Zhou, H.; Chen, H.; Zhao, X.; Tian, Y. Fractional Laplacians viscoacoustic wavefield modeling with k-space-based time-stepping error compensating scheme. Geophysics 2020, 85, T1–T13. [Google Scholar] [CrossRef]
  50. Wang, N.; Xing, G.; Zhu, T.; Zhou, H.; Shi, Y. Propagating seismic waves in VTI attenuating media using fractional viscoelastic wave equation. J. Geophys. Res.-Solid Earth 2022, 127, e2021JB023280. [Google Scholar] [CrossRef]
  51. Carcione, J.M.; Cavallini, F.; Mainardi, F.; Hanyga, A. Time-domain modeling of constant-Q seismic waves using fractional derivatives. Pure Appl. Geophys. 2002, 159, 1719–1736. [Google Scholar] [CrossRef]
  52. Carcione, J.M. Theory and modeling of constant-Q P-and S-waves using fractional time derivatives. Geophysics 2009, 74, T1–T11. [Google Scholar] [CrossRef]
  53. Yang, J.; Zhu, H. Viscoacoustic reverse time migration using a time-domain complex-valued wave equation. Geophysics 2018, 83, S505–S519. [Google Scholar] [CrossRef]
  54. Xing, G.; Zhu, T. Modeling frequency-independent Q viscoacoustic wave propagation in heterogeneous media. J. Geophys. Res.-Solid Earth 2019, 124, 11568–11584. [Google Scholar] [CrossRef]
  55. Wang, N.; Shi, Y.; Zhou, H. Accurately stable Q-compensated reverse-time migration scheme for heterogeneous viscoelastic media. Remote Sens. 2022, 14, 4782. [Google Scholar] [CrossRef]
  56. Yang, J.; Huang, J.; Zhu, H.; Li, Z.; Dai, N. Viscoacoustic reverse time migration with a robust space-wavenumber domain attenuation compensation operator. Geophysics 2021, 86, S339–S353. [Google Scholar] [CrossRef]
  57. Chen, H.; Zhou, H.; Rao, Y. Source wavefield reconstruction in fractional Laplacian viscoacoustic wave equation-based full waveform inversion. IEEE Trans. Geosci. Remote Sens. 2020, 59, 6496–6509. [Google Scholar] [CrossRef]
  58. Hu, B.; Huang, C.; Dong, L.; Zhang, J. A constant fractional Laplacian operator based viscoacoustic full waveform inversion for velocity and attenuation estimation. Chin. J. Geophys.-Chin. Ed. 2023, 66, 2123–2137. [Google Scholar] [CrossRef]
  59. Li, S.; Shi, Y.; Wang, W.; Wang, N.; Song, L.; Wang, Y. An explicit stable Q-compensated reverse time migration scheme for complex heterogeneous attenuation media. Front. Earth Sci. 2023, 11, 1121648. [Google Scholar] [CrossRef]
  60. Virieux, J. P-SV wave propagation in heterogeneous media: Velocity-stress finite-difference method. Geophysics 1986, 51, 889–901. [Google Scholar] [CrossRef]
  61. Berenger, J.P. A perfectly matched layer for the absorption of electromagnetic waves. J. Comput. Phys. 1994, 114, 185–200. [Google Scholar] [CrossRef]
  62. Komatitsch, D.; Martin, R. An unsplit convolutional perfectly matched layer improved at grazing incidence for the seismic wave equation. Geophysics 2007, 72, SM155–SM167. [Google Scholar] [CrossRef]
  63. Meza-Fajardo, K.C.; Papageorgiou, A.S. A nonconvolutional, split-field, perfectly matched layer for wave propagation in isotropic and anisotropic elastic media: Stability analysis. Bull. Seismol. Soc. Am. 2008, 98, 1811–1836. [Google Scholar] [CrossRef]
  64. Zeng, C.; Xia, J.; Miller, R.D.; Tsoflias, G.P. Application of the multiaxial perfectly matched layer (M-PML) to near-surface seismic modeling with Rayleigh waves. Geophysics 2011, 76, T43–T52. [Google Scholar] [CrossRef]
  65. Chen, H.; Zhou, H.; Li, Q.; Wang, Y. Two efficient modeling schemes for fractional Laplacian viscoacoustic wave equation. Geophysics 2016, 81, T233–T249. [Google Scholar] [CrossRef]
  66. Wang, N.; Zhou, H.; Chen, H.; Xia, M.; Wang, S.; Fang, J.; Sun, P. A constant fractional-order viscoelastic wave equation and its numerical simulation scheme. Geophysics 2018, 83, T39–T48. [Google Scholar] [CrossRef]
  67. Xing, G.; Zhu, T. A viscoelastic model for seismic attenuation using fractal mechanical networks. Geophys. J. Int. 2021, 224, 1658–1669. [Google Scholar] [CrossRef]
  68. Moczo, P.; Kristek, J.; Vavrycuk, V.; Archuleta, R.J.; Halada, L. 3D heterogeneous staggered-grid finite-difference modeling of seismic motion with volume harmonic and arithmetic averaging of elastic moduli and densities. Bull. Seismol. Soc. Am. 2002, 92, 3042–3066. [Google Scholar] [CrossRef]
  69. Berg, P.; If, F.; Nilsen, P.; Skovgaard, O. Analytical reference solutions: Advanced seismic Modeling. In Modeling the Earth for Oil Exploration; Helbig, K., Ed.; Pergamon Press: Oxford, UK, 1994; pp. 421–427. [Google Scholar]
  70. Hron, F.; Mikhailenko, B.G. Numerical modeling of nongeometrical effects by the Alekseev-Mikhailenko method. Bull. Seismol. Soc. Am. 1981, 71, 1011–1029. [Google Scholar] [CrossRef]
  71. Park, C.B.; Miller, R.D.; Xia, J. Multichannel analysis of surface waves. Geophysics 1999, 64, 800–808. [Google Scholar] [CrossRef]
  72. Xia, J.; Xu, Y.; Miller, R.D. Generating an image of dispersive energy by frequency decomposition and slant stacking. Pure Appl. Geophys. 2007, 164, 941–956. [Google Scholar] [CrossRef]
  73. Schwab, F.A.; Knopoff, L. Fast Surface Wave and Free Mode Computations. In Methods in Computational Physics; Bolt, B.A., Ed.; Academic Press: New York, NY, USA, 1972; pp. 87–180. [Google Scholar]
  74. Babuska, V.; Cara, M. Seismic Anisotropy in the Earth; Kluwer Academic Publishing: Dordrecht, The Netherlands, 1991; pp. 30–36. [Google Scholar]
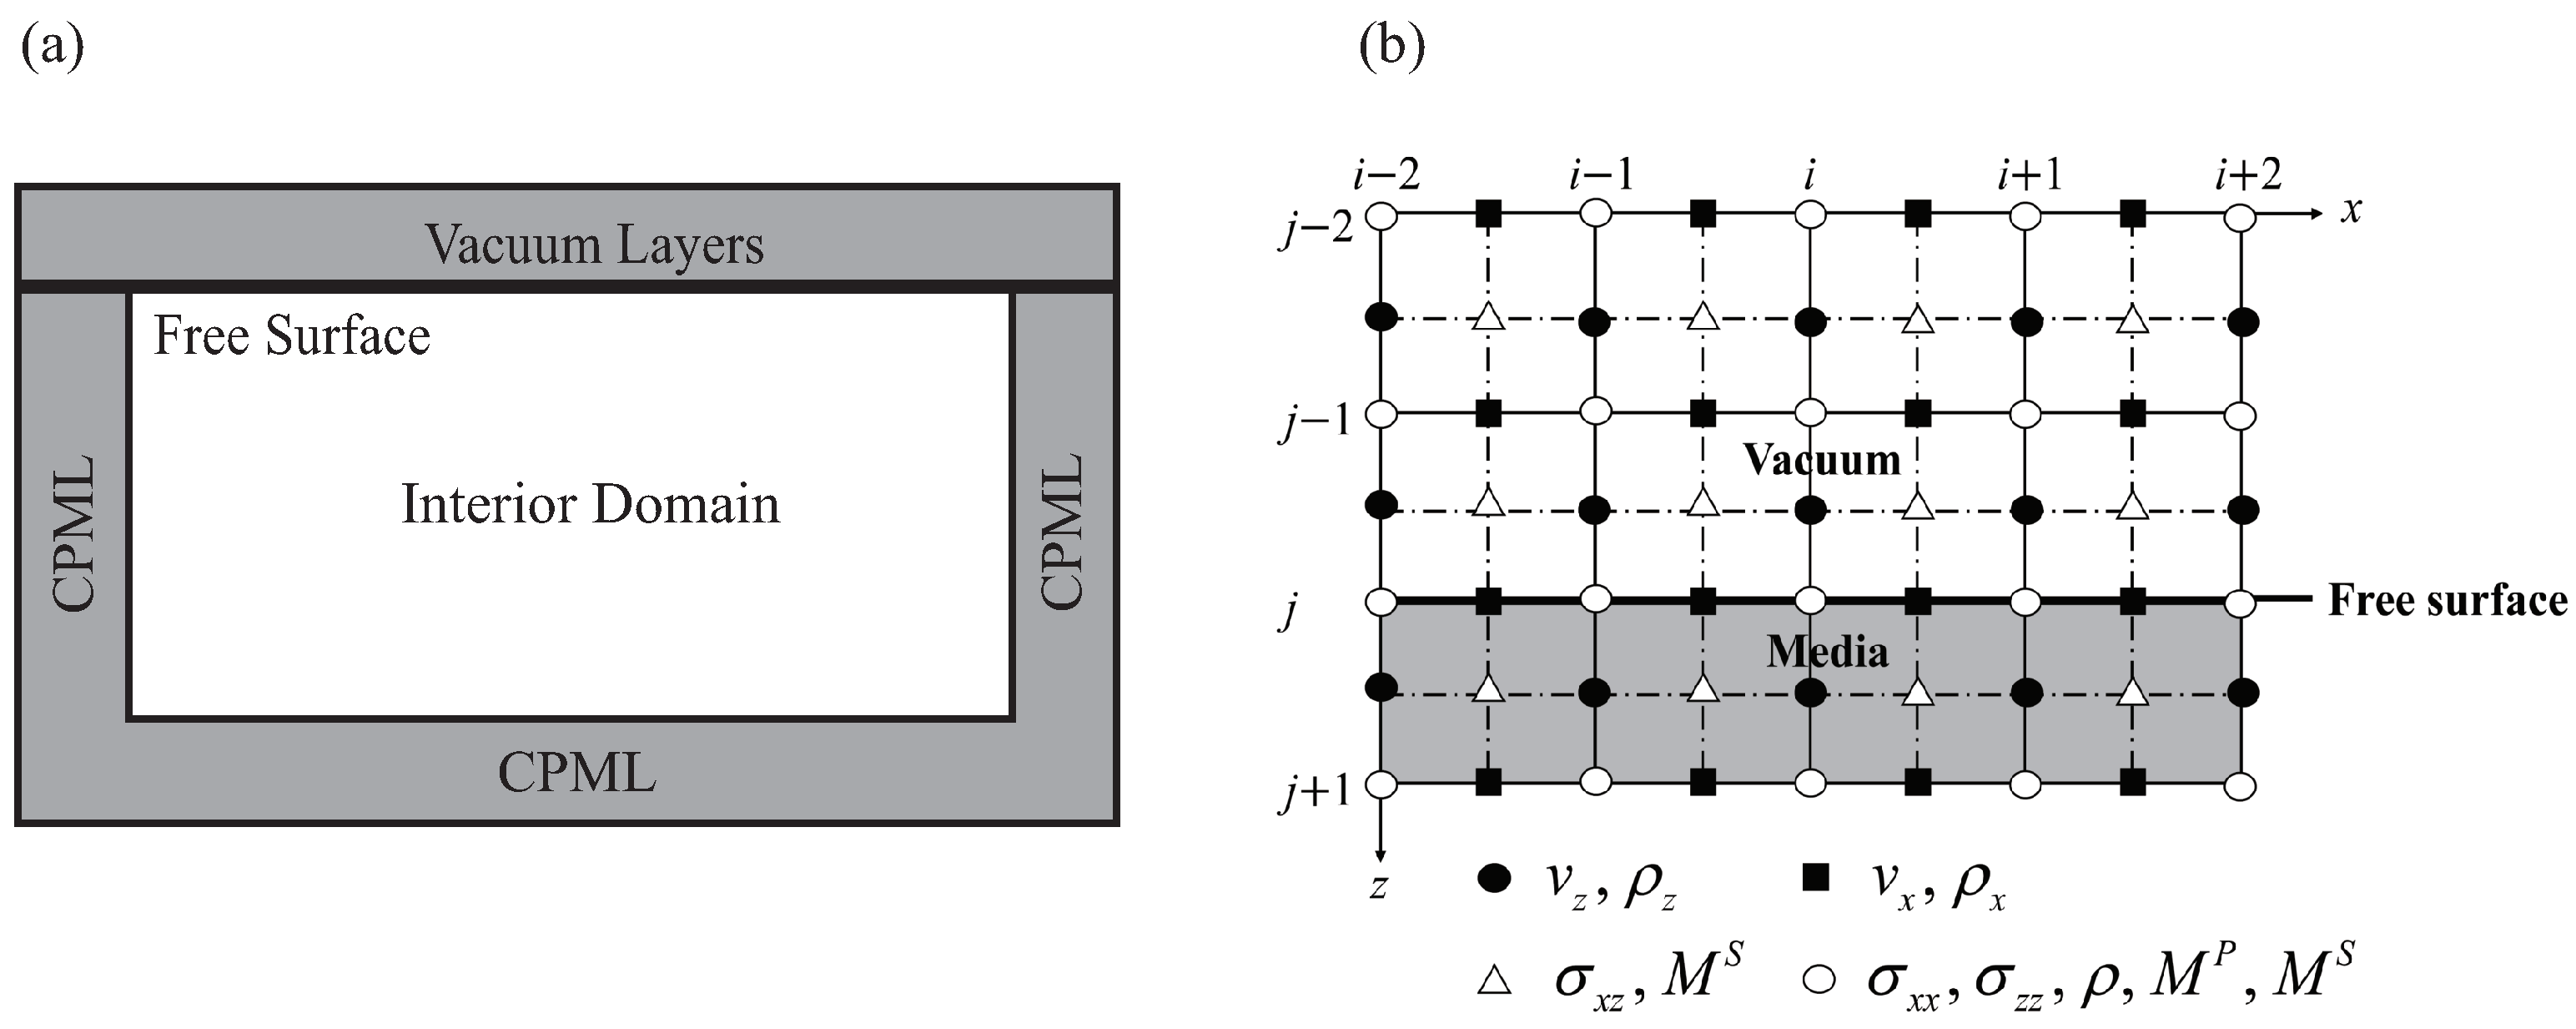
Figure 1. (a) Combined boundary condition structure schematic and (b) layout of the wavefield variables and medium parameters on the staggered-grids mesh.
Fractalfract 07 00880 g001
Figure 2. Comparison of seismograms computed using numerical (red dashed line) and analytical (black line) solutions at the offset of 600 m: (a) v x component and (b) v z component.
Fractalfract 07 00880 g002
Figure 3. Elastic wavefield snapshots in a homogeneous half-space model at t = 1 s. The left and right columns correspond to the v x and v z components, respectively. (a,b) Wavefields simulated using the SGFD method with Δ h = 2.5 m and Δ t = 0.5 ms; (c,d) Wavefields computed using the SGPS method with the same spatial and time intervals; (e,f) Wavefields generated using the SGFD method with Δ h = 1.25 m and Δ t = 0.25 ms.
Fractalfract 07 00880 g003
Figure 4. Zoom-in section of Figure 3. The left and right columns correspond to the v x and v z components, respectively. (a,b) Wavefields simulated using the SGFD method with Δ h = 2.5 m and Δ t = 0.5 ms; (c,d) Wavefields computed using the SGPS method with the same spatial and time intervals; (e,f) Wavefields generated using the SGFD method with Δ h = 1.25 m and Δ t = 0.25 ms.
Fractalfract 07 00880 g004
Figure 5. Seismograms recorded at (600 m, 0 m) computed using the SGFD and SGPS methods: (a) v x component and (b) v z component.
Fractalfract 07 00880 g005
Figure 6. Comparisons between the elastic and viscoelastic wavefield snapshots in a homogeneous half-space model at t = 0.5 s: (a) elastic v x component, (b) elastic v z component, (c) viscoelastic v x component, and (d) viscoelastic v z component.
Fractalfract 07 00880 g006
Figure 7. (a) Common-gather and (b) dispersive images in the homogeneous half-space model.
Fractalfract 07 00880 g007
Figure 8. Viscoelastic wavefield snapshots of the two-layer model at t = 0.45 s: (a) v x component and (b) v z component.
Fractalfract 07 00880 g008
Figure 9. (a) Common-gather and (b) dispersive images in the two-layer model.
Fractalfract 07 00880 g009
Figure 10. (a) Set of two-layer models and (b) wavefield snapshots. I–III show the partial snapshots of Models 1–3 at t = 0.35 s, respectively; IV shows the difference between Models 2 and 1; and V shows the difference between Models 3 and 1.
Fractalfract 07 00880 g010
Figure 11. Comparison of seismograms computed by different Q values. (a) Models 1 and 2; (b) Models 1 and 3.
Fractalfract 07 00880 g011
Figure 12. Energy decay for 10 s simulation.
Fractalfract 07 00880 g012
Figure 13. Marmousi model (a) P-wave velocity, (b) S-wave velocity, (c) Q P , and (d) Q S .
Fractalfract 07 00880 g013
Figure 14. (a) Wavefield snapshots at t = 0.45 s and (b) common-gathers. I–II are calculated using the SIM and proposed scheme, respectively. III shows the simulation results under absorption-only boundaries. IV represents the residuals between I and II, and V shows the residuals between II and III. VI–X show the common-gathers corresponding to wavefield snapshots.
Fractalfract 07 00880 g014
Figure 15. The wavefield snapshots at t = 0.45 s and the common-gather of particle velocity v z component. (a,c) display the simulation results obtained by solving the DFL equation using the SGPS method; (b,d) show the simulation results obtained by solving the GSLS equation using the SGFD method.
Fractalfract 07 00880 g015
Figure 16. Seismograms recorded at (600 m, 0 m) computed using (a) DFL and (b) GSLS equation.
Fractalfract 07 00880 g016
Table 1. Comparison of the free boundary conditions.
MethodAdvantageDisadvantageFormulation
vacuum formalismsimple and easy to implementlow-accuracy and poor numerical stability ρ ( i , j k ) 0 , v P ( i , j k ) = 0 , v S ( i , j k ) = 0
characteristic variable methodhigh accuracyhigh computational load v ˙ x n e w = v ˙ x o l d + 1 ρ c S σ ˙ x z o l d v ˙ z n e w = v ˙ z o l d + 1 ρ c P σ ˙ z z o l d σ ˙ x x n e w = σ ˙ x x o l d λ ˜ λ ˜ + 2 μ ˜ σ ˙ z z o l d σ ˙ z z n e w = 0 , σ ˙ x z n e w = 0
SIMhigh computational efficiency and high-accuracyonly for plane waves and semi-infinite media σ x x t = 4 μ λ + μ λ + 2 μ v x t σ z z i , j = 0 σ z z i , j k = σ z z i , j + k σ x z i , j k = σ x z i , j + k 1
MShigh computational efficiencycomplicated calculation σ z z = 0 , ρ x = 0.5 ρ 0 λ = 0 , 2 μ = μ 0
AEAhigh computational efficiencycomplicated calculation σ z z = 0 , ρ x = 0.5 ρ 0 λ = 0 , 2 μ = 2 μ 0
Table 2. Parameters of the two-layer model.
Depth (m) ρ (g/cm 3 ) v S (m/s) v P (m/s) Q S Q P
Layer 12501.570015003050
Layer 25002.01150200090150
Table 3. Parameters of the two-layer model.
Depth (m) ρ (g/cm 3 ) v S (m/s) v P (m/s) Q S Q P
Layer 1151.560024003050
Layer 29852.0800300090150
Table 4. Parameters of the homogeneous viscoelastic half-space model. Note v P = 2000 m/s, v S = 1000 m/s, Q P = 50 , Q S = 30 and ρ = 1.8 g / c m 3 .
Points/Minimum WavelengthMeshSpatial Step (m)Time Step (ms)
10200 × 16051
12.5250 × 20040.8
25500 × 40020.4
501000 × 80010.2
Table 5. Computation time and misfit of the GSLS and DFL equation.
EquationSpatial Step (m)Computation Time (s) L 2 misfit (%)
GSLS532207
454165
220827.49
110751.52
DFL56242.67
418029.02
26434.85
139920.61
Disclaimer/Publisher’s Note: The statements, opinions and data contained in all publications are solely those of the individual author(s) and contributor(s) and not of MDPI and/or the editor(s). MDPI and/or the editor(s) disclaim responsibility for any injury to people or property resulting from any ideas, methods, instructions or products referred to in the content.