
Analyzing Asymmetric Volatility and Multifractal Behavior in Cryptocurrencies Using Capital Asset Pricing Model Filter


Abstract
1. Introduction
2. Method
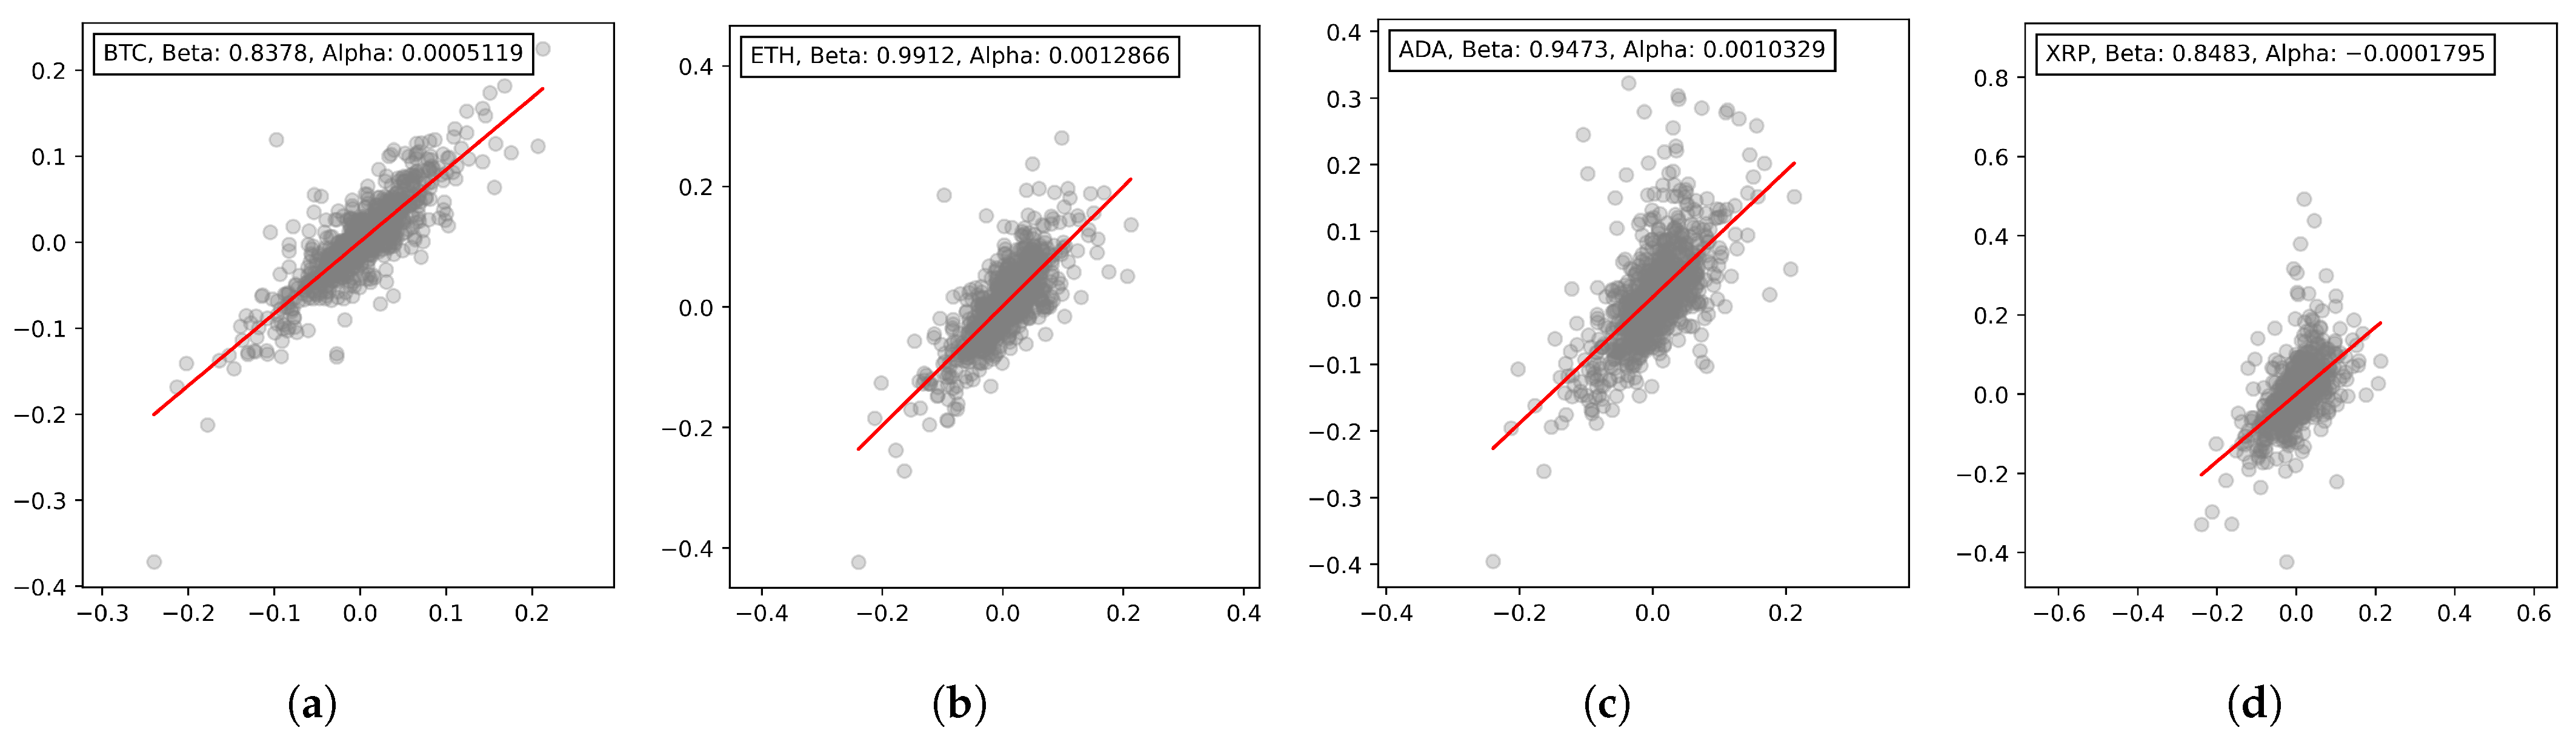
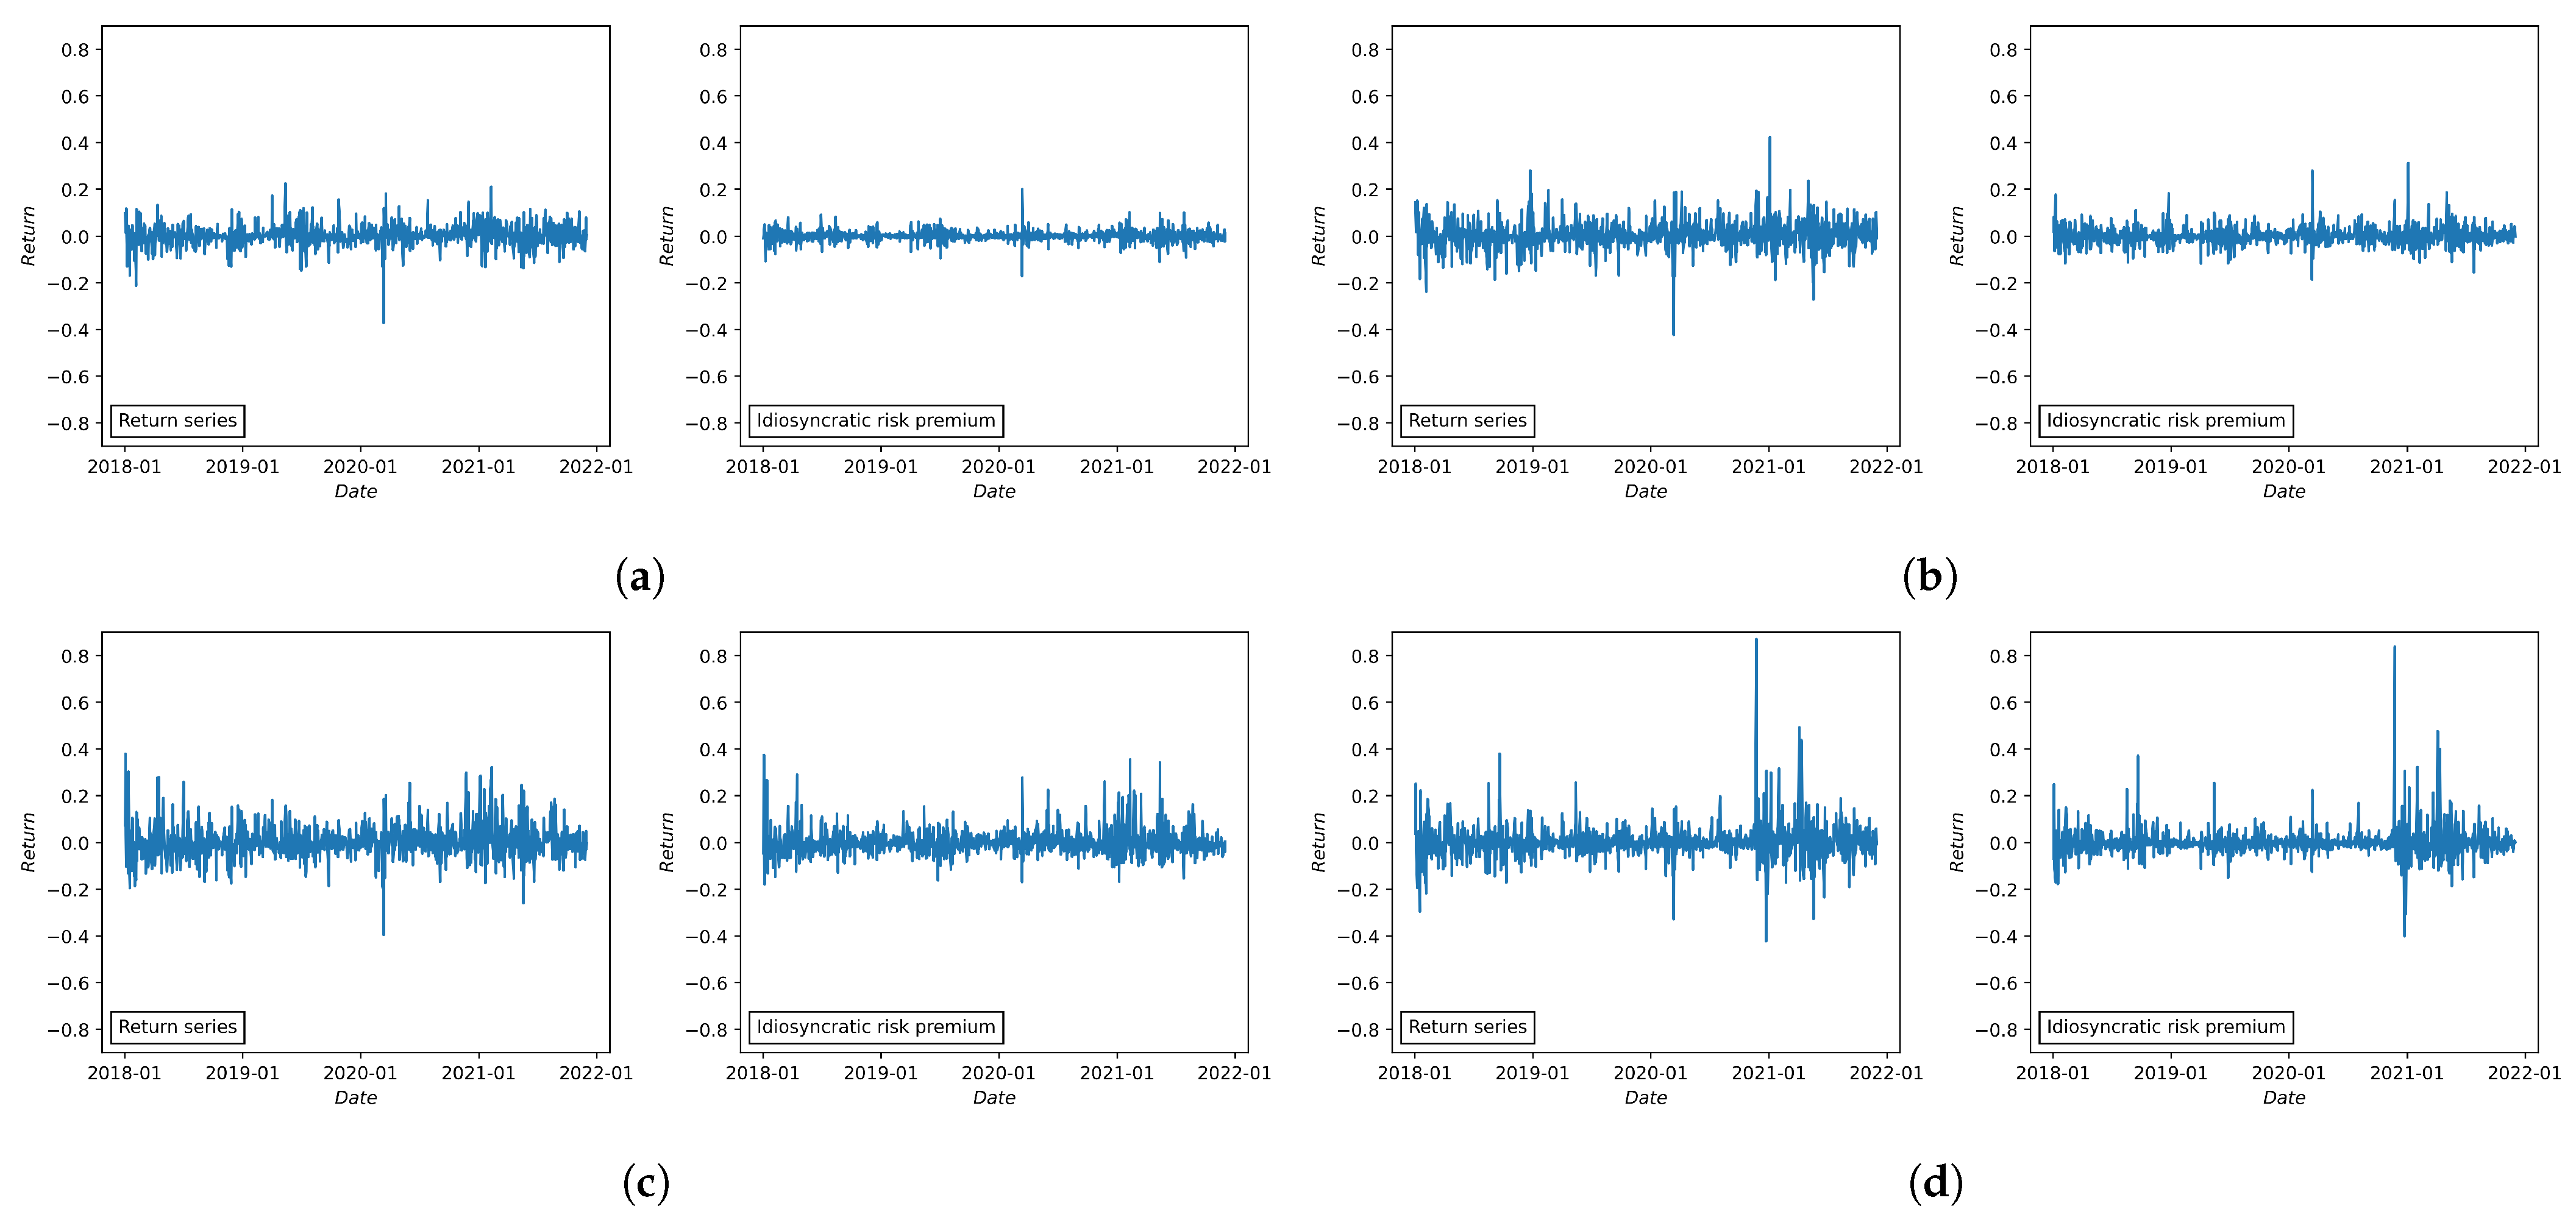
2.1. CAPM Filtering
2.2. Index-Based A-MFDFA
- Step 1: Determine the profile.where .
- Step 2: Divide the time series into nonoverlapping subtime series.Let as for , where . Note that is an indexing proxy for return series, which can be determined by or . Then, and are divided into nonoverlapping subtime series of equal length n. The number of resulting subtime series is , where is the largest integer less than or equal to . This procedure is repeated from both ends of and , creating subtime series. Suppose : is the jth subtime series of with length n and ; then is the length n subtime series of in the jth time interval. Both and have . Finally, the elements of and areand for , we have
- Step 3: Calculate a local trend and construct the fluctuation function.For each subperiod and , we use the ordinary least squares method to estimateNote that divides the trend of , whereas detrends the time series . In this regard, we define the fluctuation function as follows:
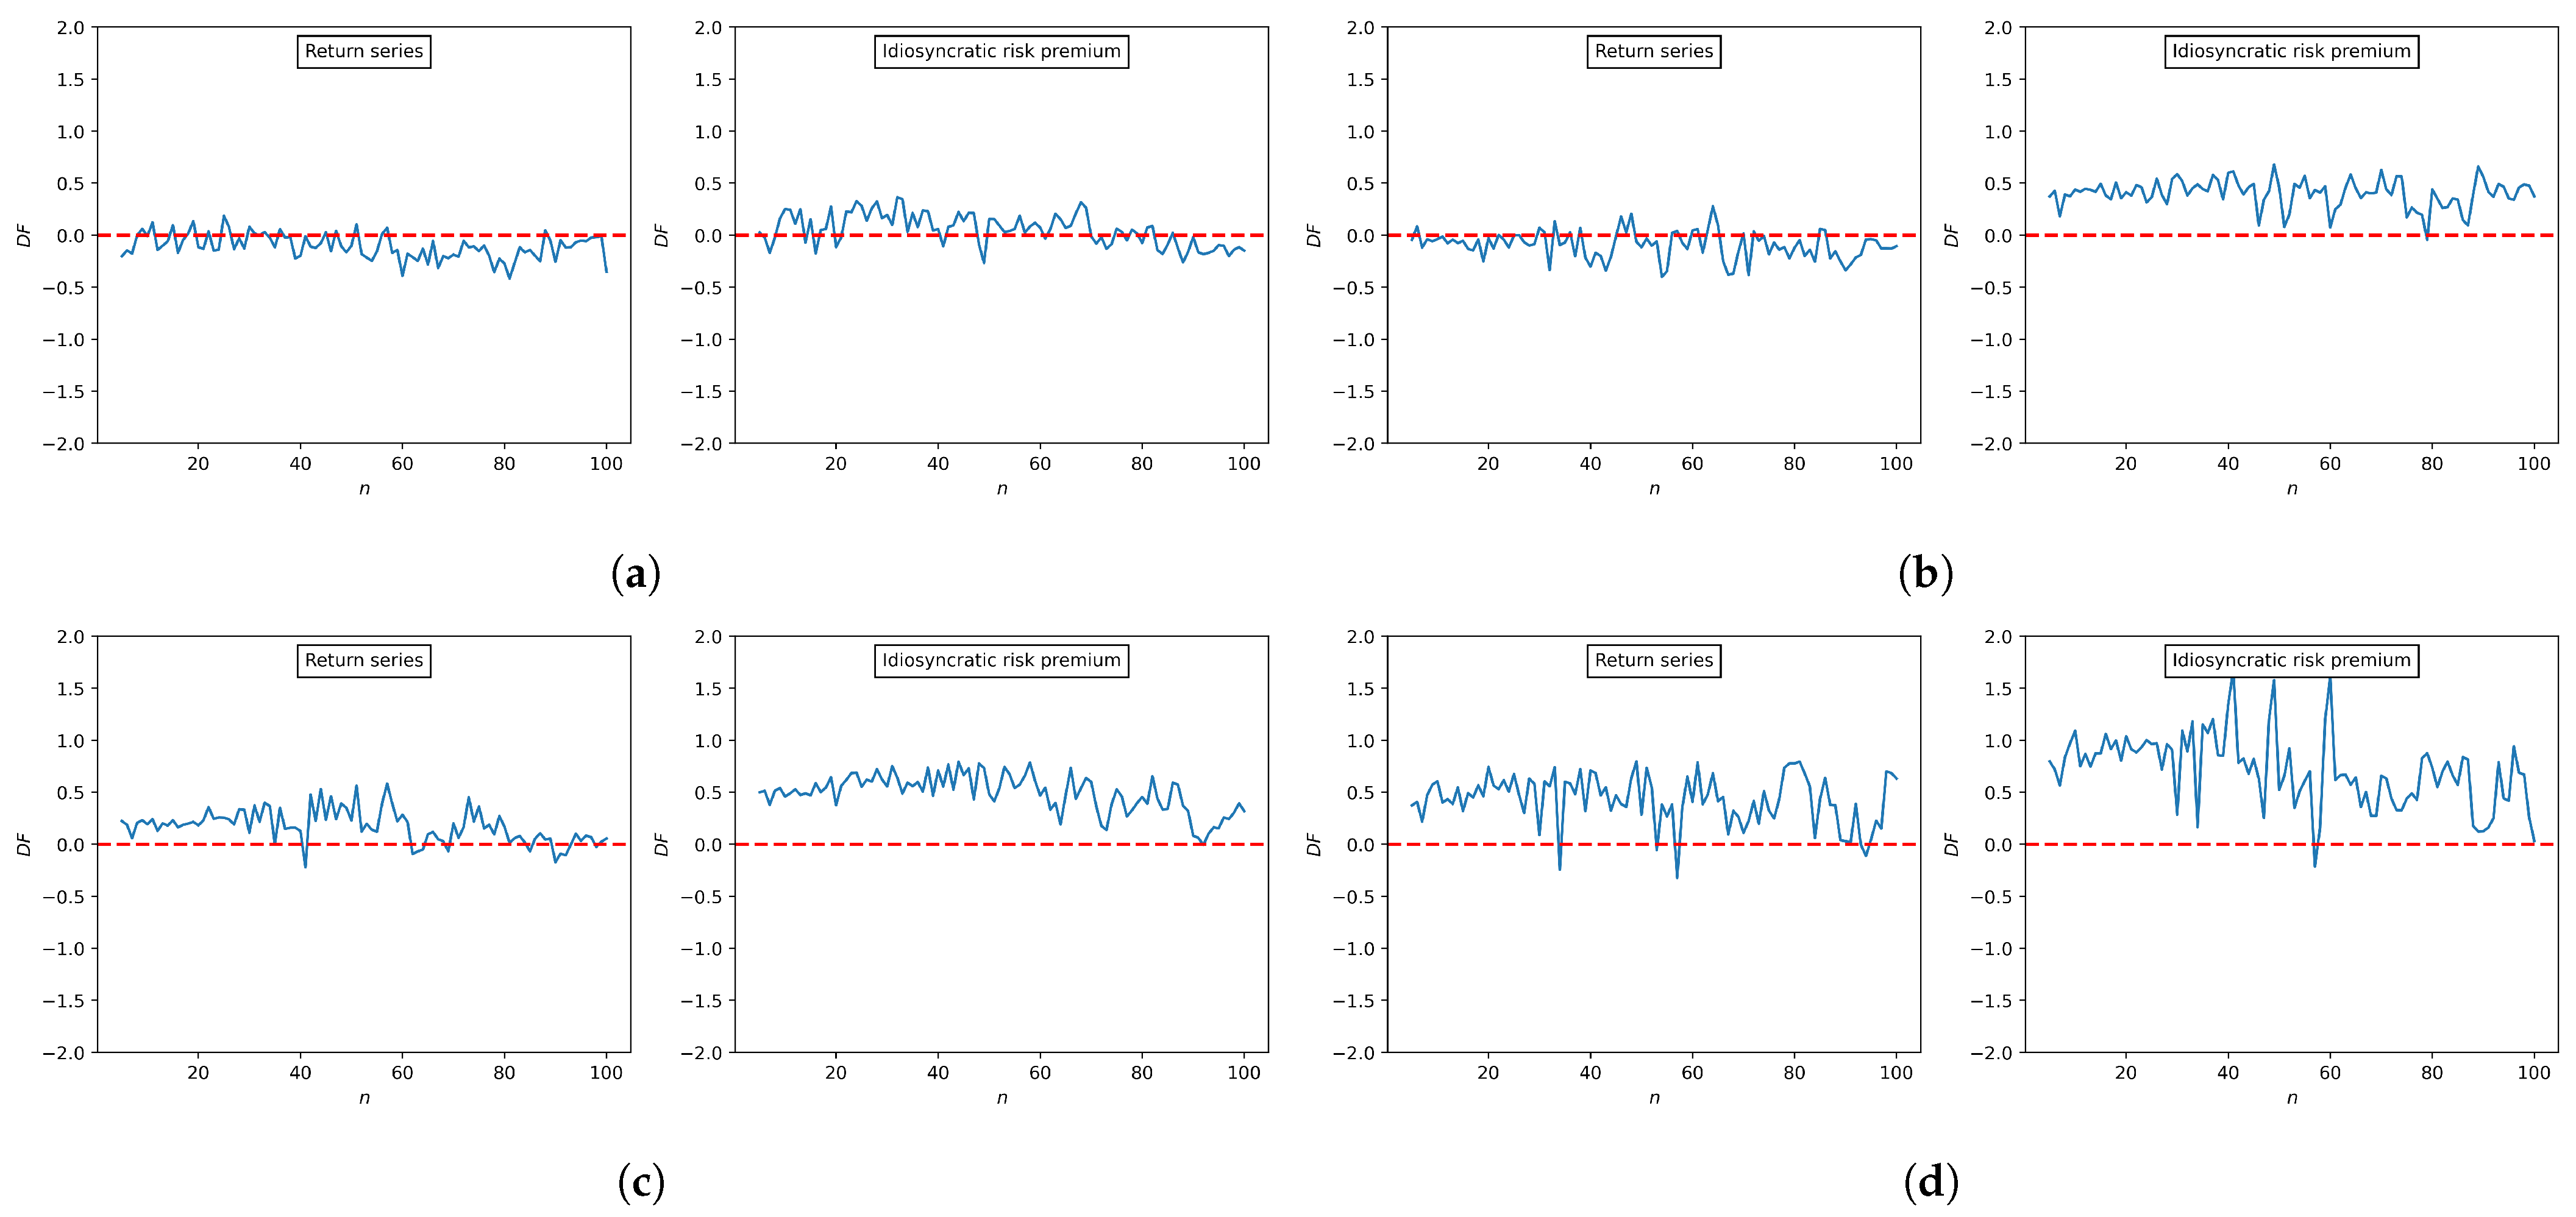
- Step 4: Identify the trend of subtime series.The sign of the slope, , determines the trend for each subperiod and . If (), the subtime series of is classified as an uptrend (downtrend).
- Step 5: Construct q-order average fluctuation functions.Assuming that and , we construct the directional q-order average fluctuation functions for uptrends and downtrends as follows:where ; ; and is a sign of arbitrary value x. Note that the average fluctuation function that does not discriminate the trend of the subtime series can be computed as
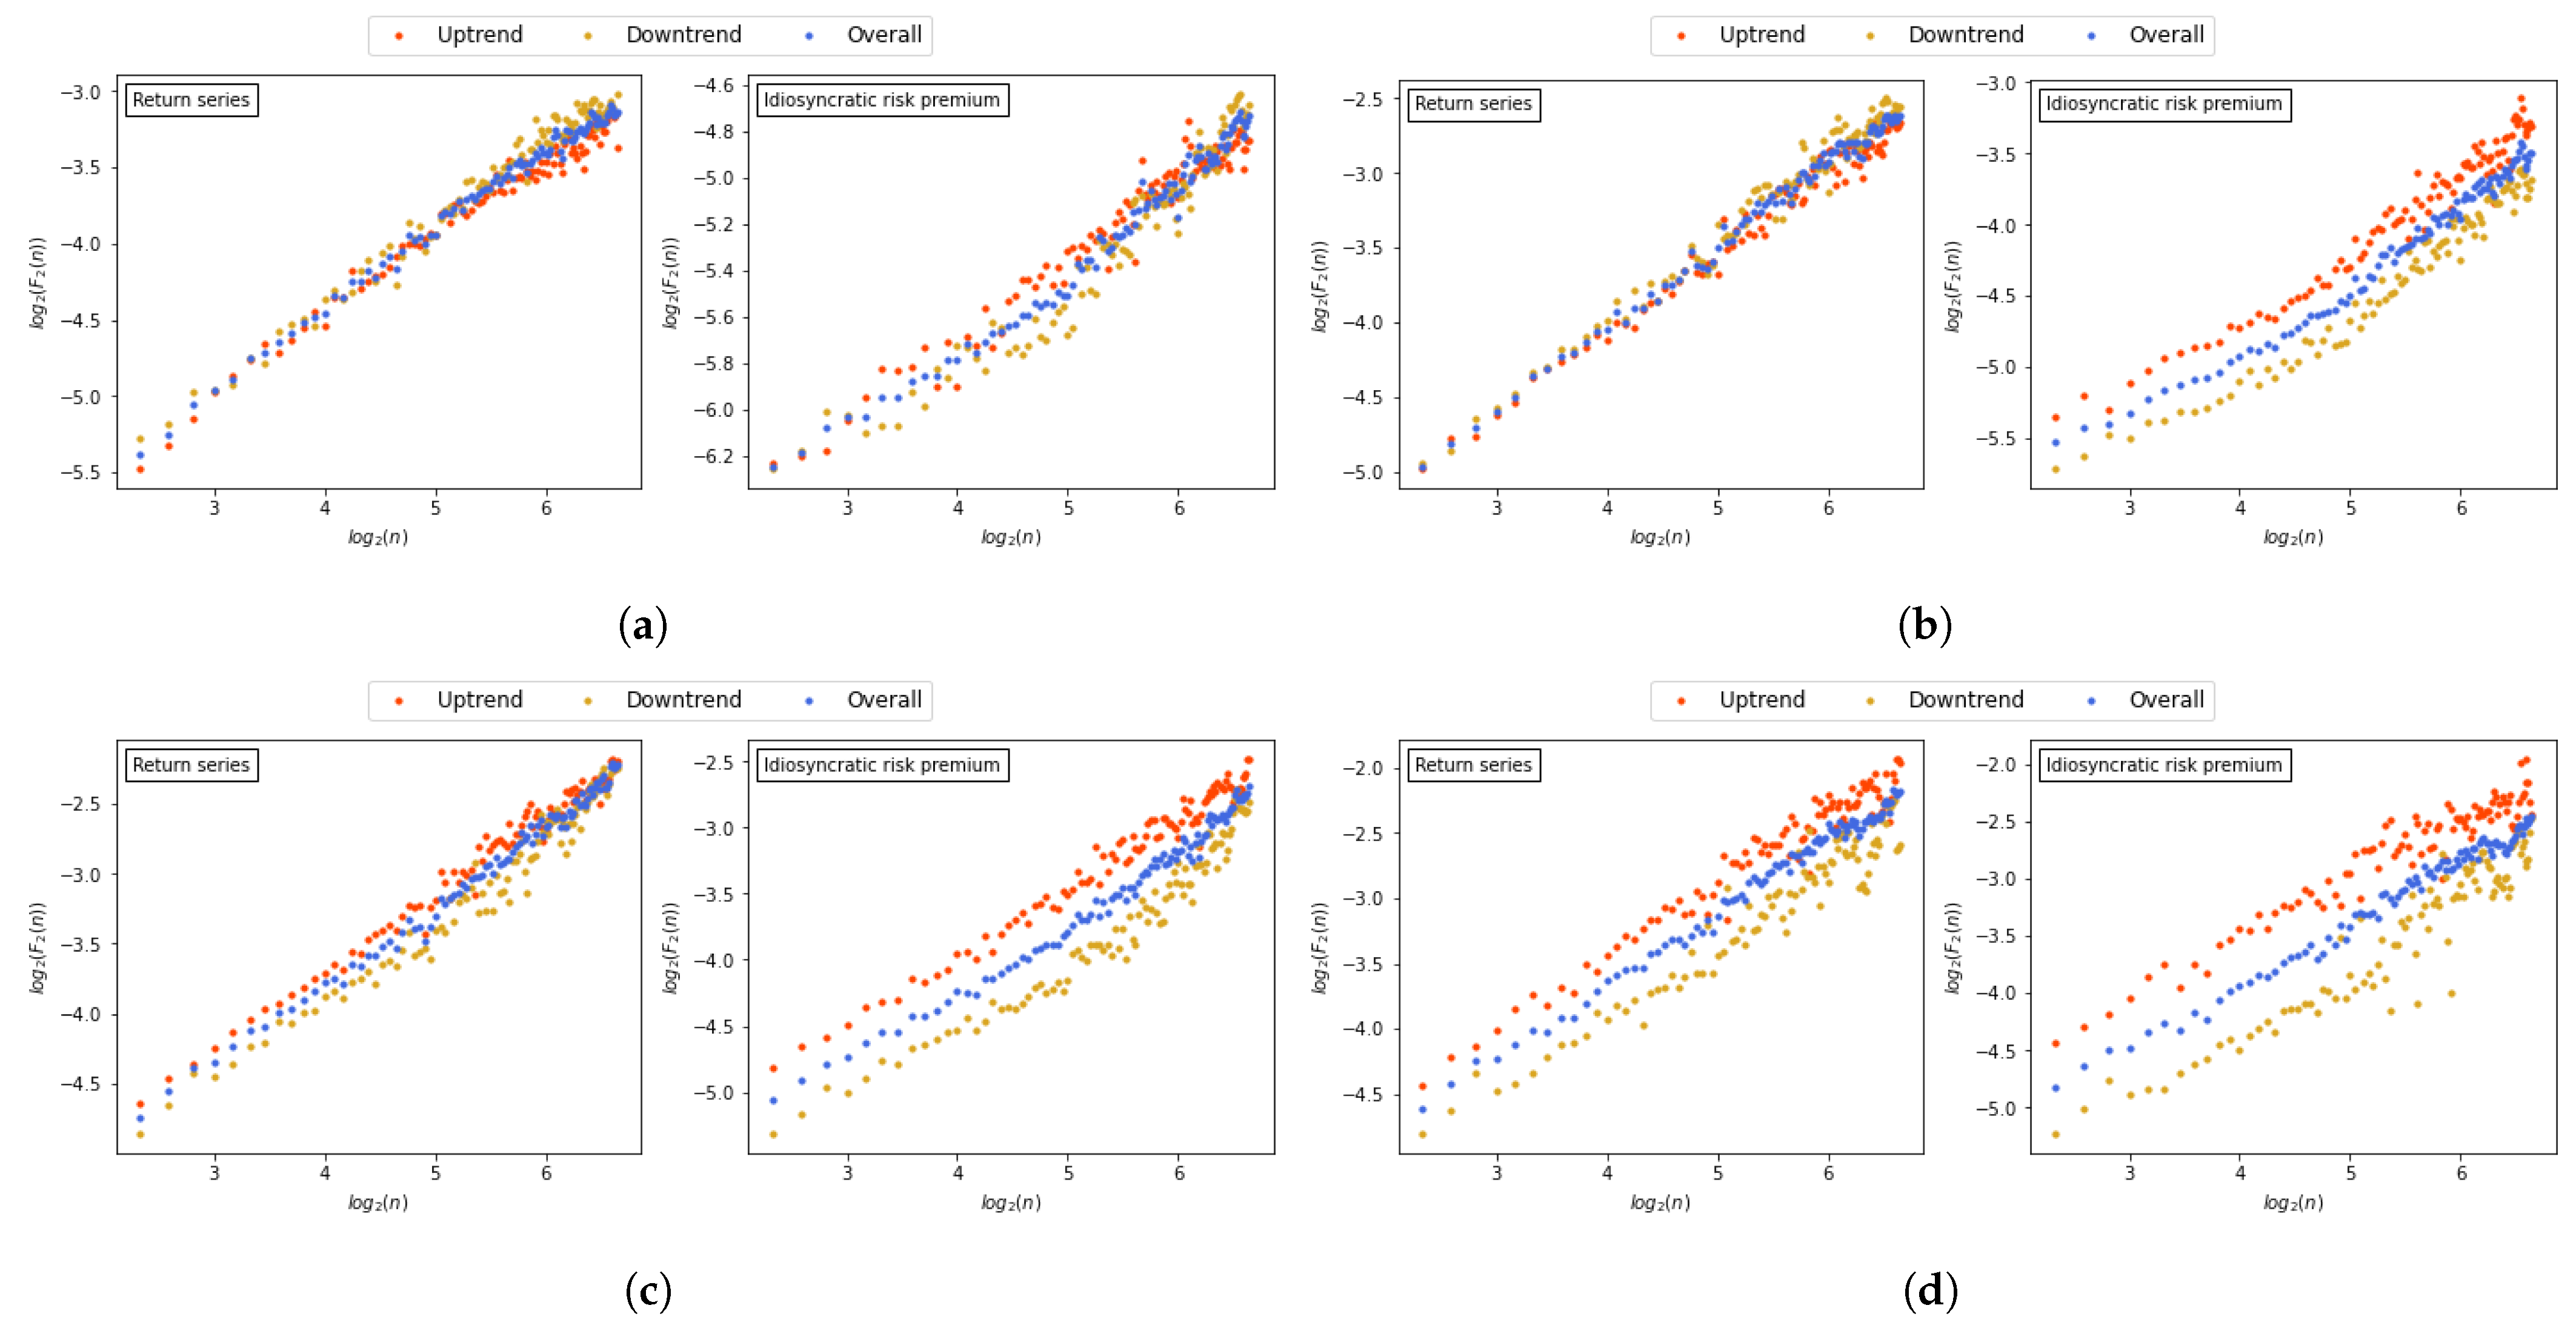
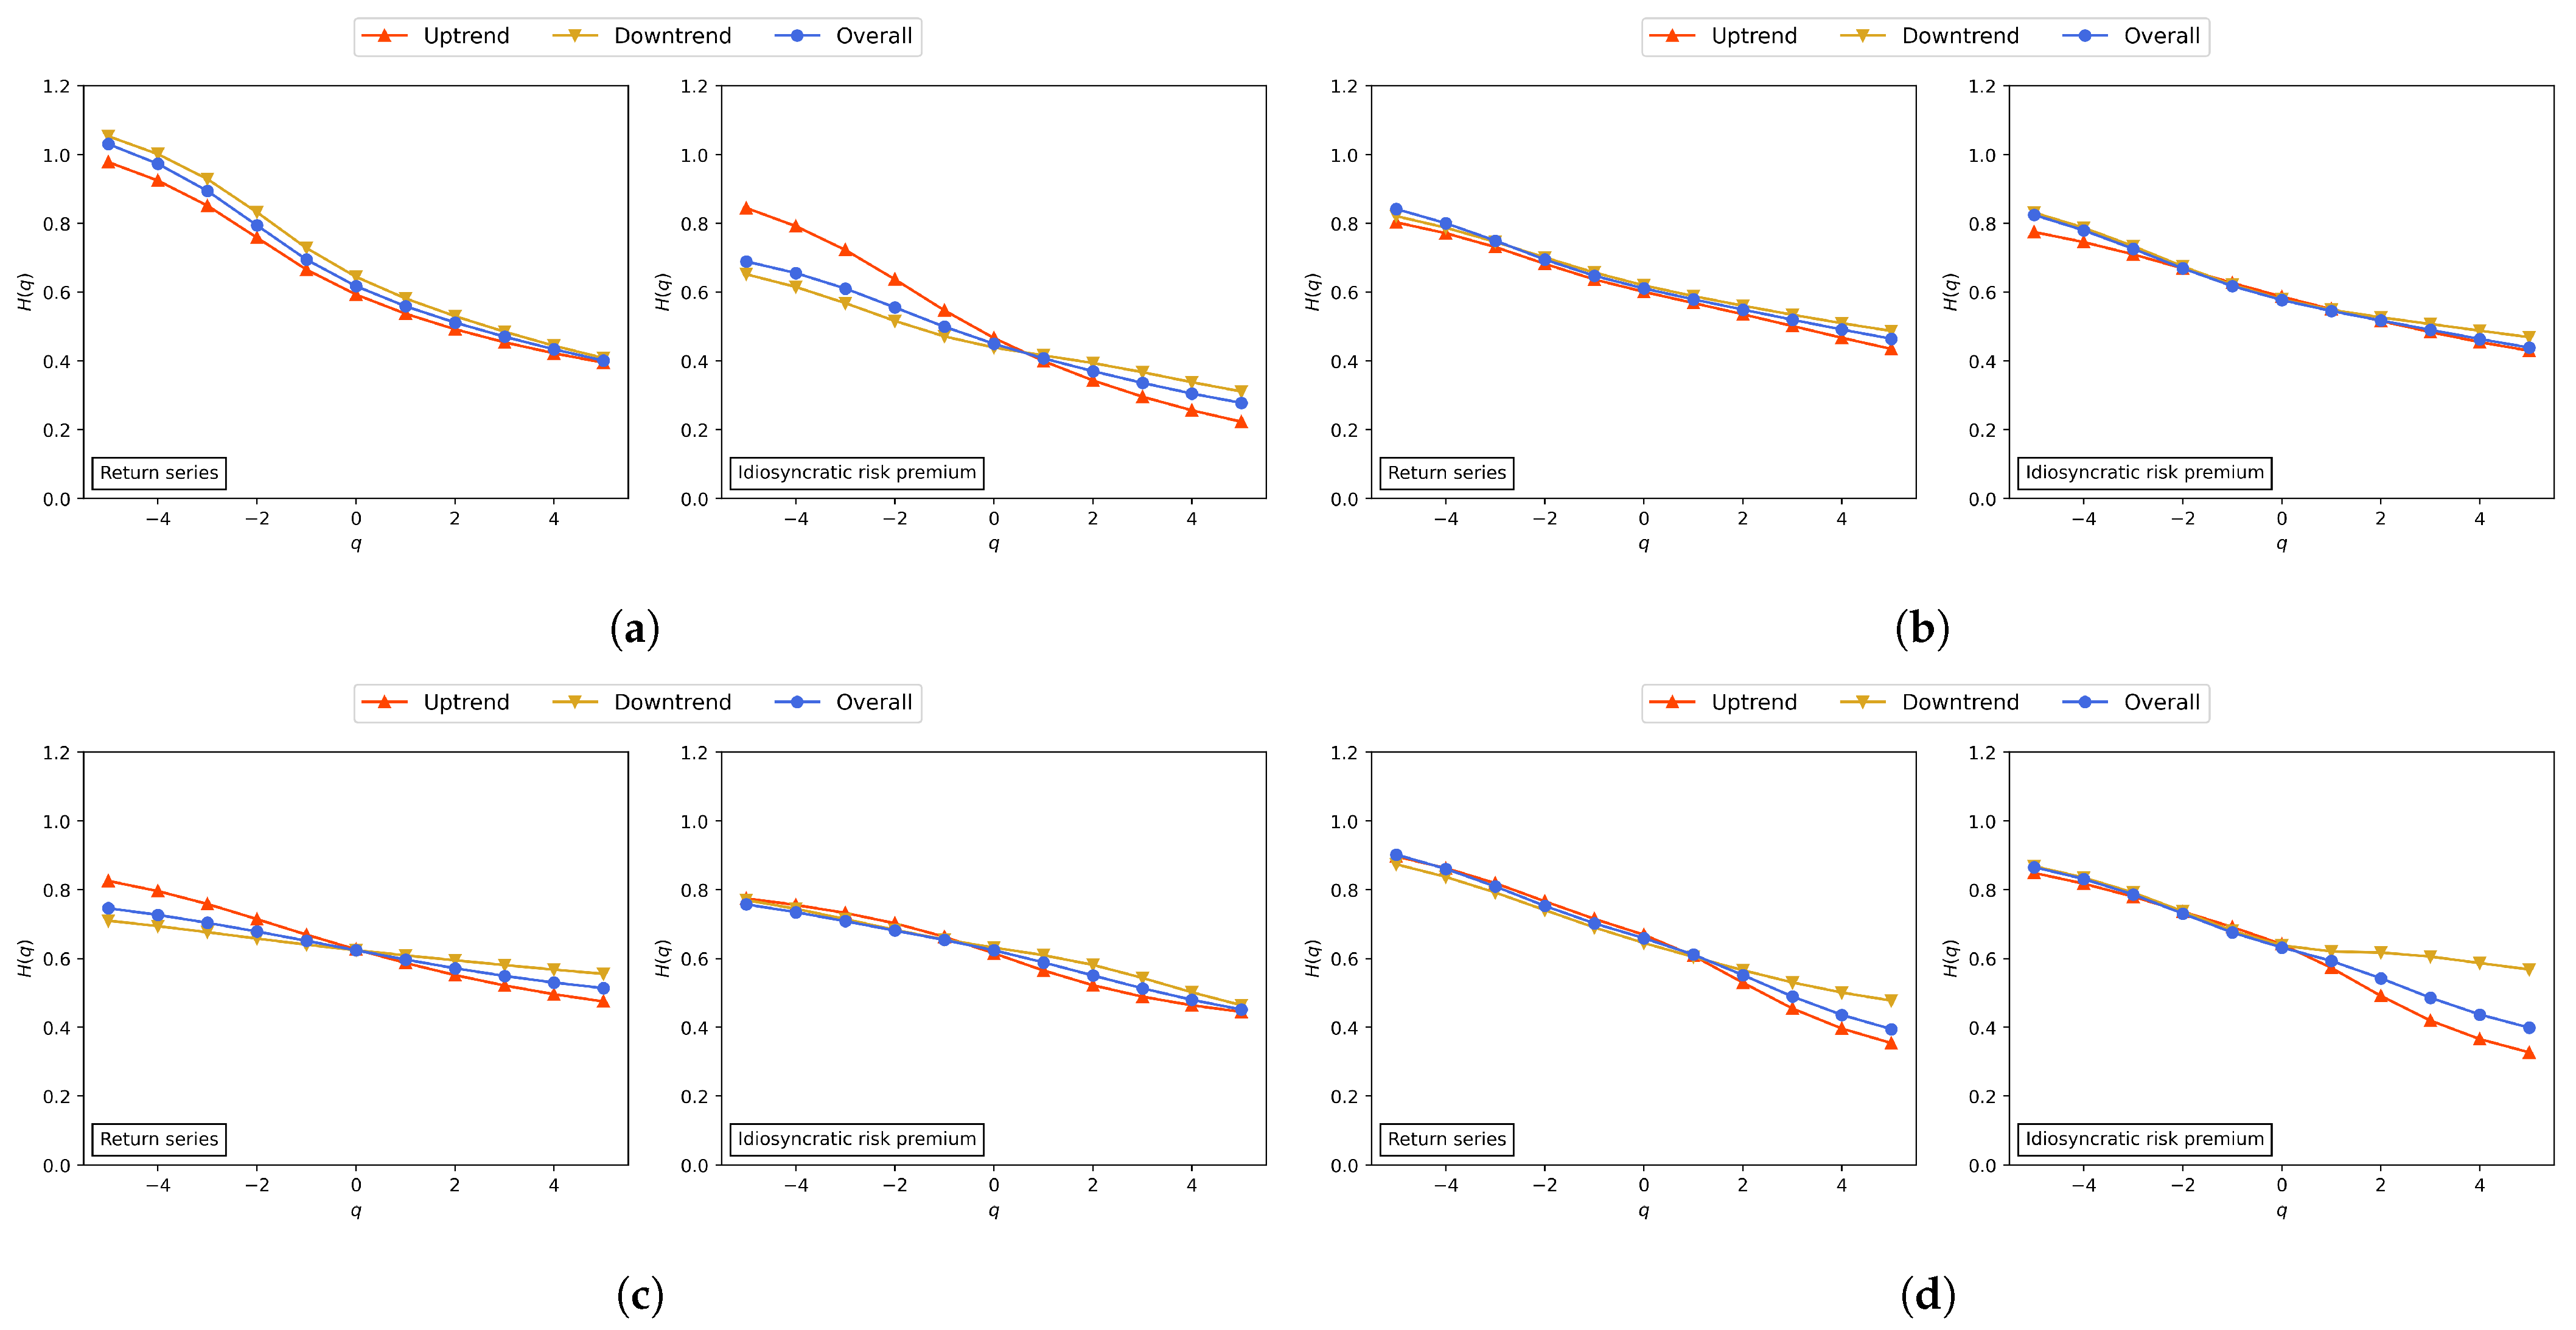
- Step 6: Calculate the generalized Hurst exponent.The Hurst exponent is related to the autocorrelation of a time series, claiming the long-term memory property. Let and be the generalized Hurst exponents of the overall trend, uptrend, and downtrend, respectively. These values satisfy the following power-law scaling of , , and , respectively. of a monofractal time series is a constant function of q, whereas that of a multifractal time series is a nonconstant function of q. In addition, a time series is persistent when , whereas it is antipersistent when . Note that a time series follows a random walk when . Furthermore, an asymmetric behavior in time series can be analyzed by comparing the values of and . A time series is symmetric when two values are the same, whereas a time series is asymmetric otherwise.
3. Results and Discussion
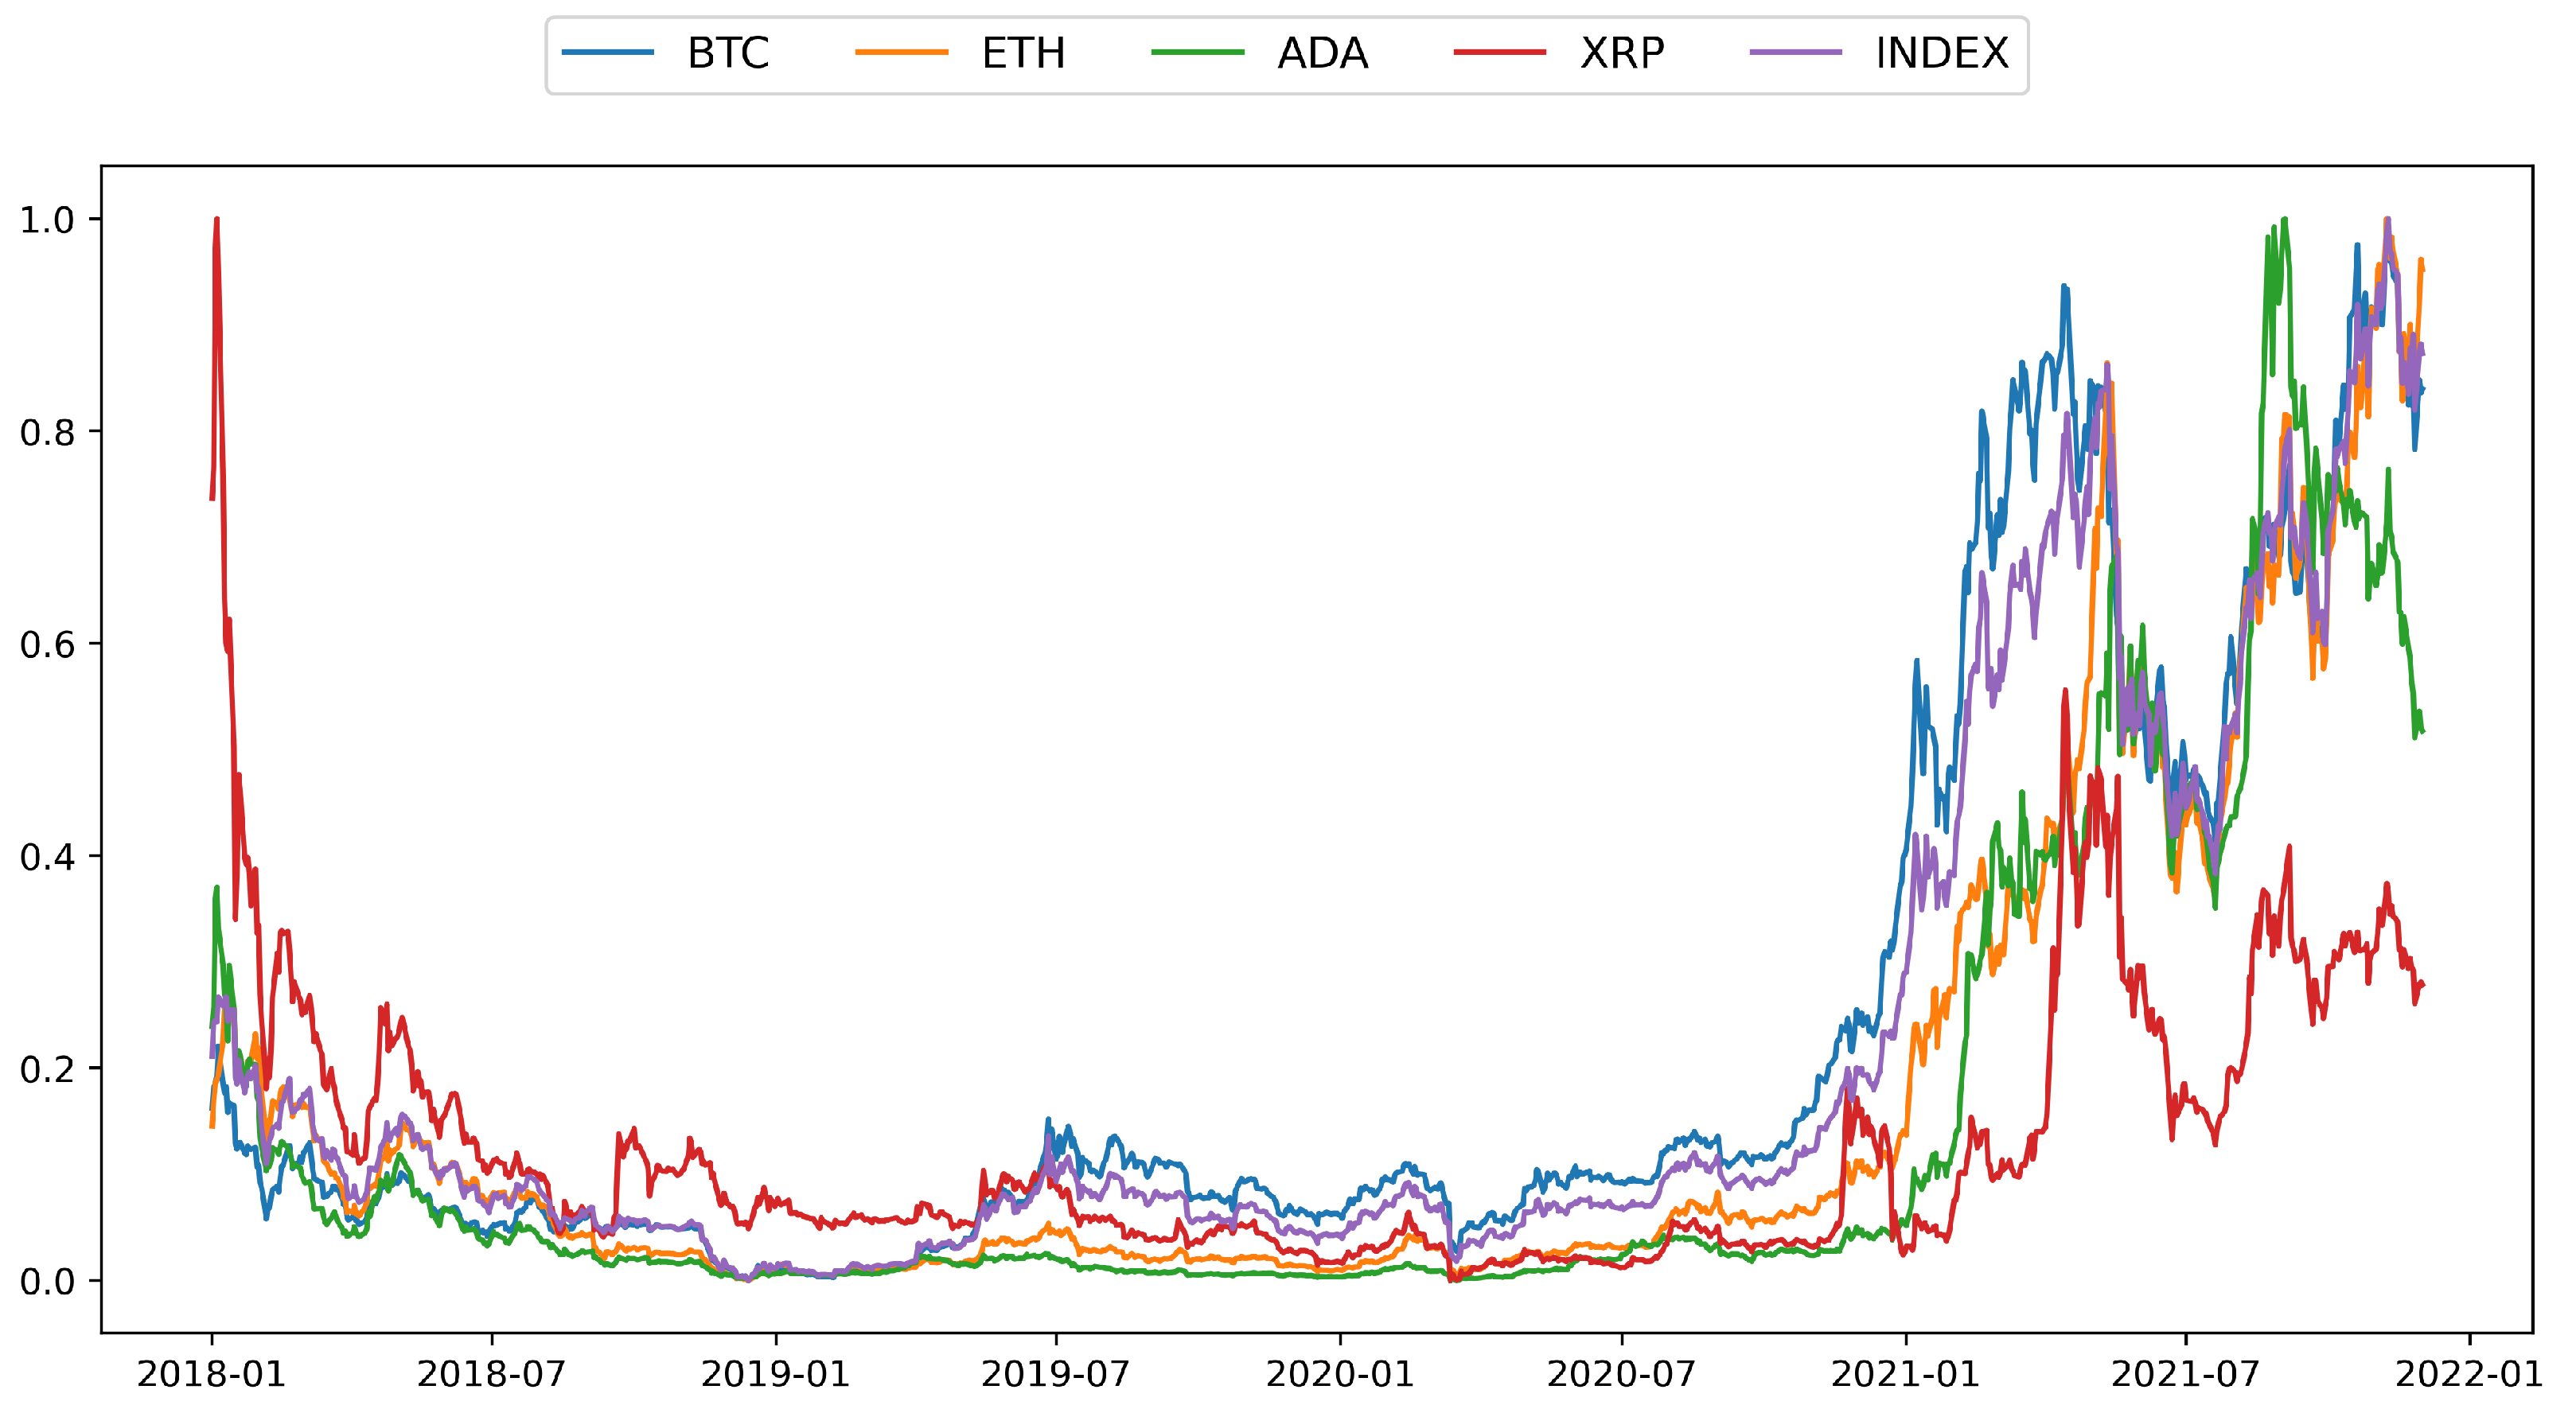
3.1. Data
3.2. Asymmetric Volatility
3.3. Source of Asymmetric Multifractality
- Randomly shuffled series
- When the length of the entire time series is N, two integers smaller than N are randomly extracted to produce () pairs.
- Swaps the xth value of the original time series with the yth value.
- Repeat 1 and 2 for 20N times.
- Surrogate series
- When the total time series has a length of N, we randomly extract from the Gaussian distribution generated using the mean and variance of the original time series.
- Rearrange to have the same rank pattern as .
4. Conclusions
Author Contributions
Funding
Data Availability Statement
Conflicts of Interest
References
- Fama, E.F. Efficient capital markets: A review of theory and empirical work. J. Financ. 1970, 25, 383–417. [Google Scholar] [CrossRef]
- Wachtel, S.B. Certain observations on seasonal movements in stock prices. J. Bus. Univ. Chic. 1942, 15, 184–193. [Google Scholar] [CrossRef]
- Ball, R. The global financial crisis and the efficient market hypothesis: What have we learned? J. Appl. Corp. Financ. 2009, 21, 8–16. [Google Scholar] [CrossRef]
- Peters, E.E. Fractal Market Analysis: Applying Chaos Theory to Investment and Economics; John Wiley & Sons: Hoboken, NJ, USA, 1994; Volume 24. [Google Scholar]
- Peng, C.K.; Buldyrev, S.V.; Havlin, S.; Simons, M.; Stanley, H.E.; Goldberger, A.L. Mosaic organization of DNA nucleotides. Phys. Rev. E 1994, 49, 1685. [Google Scholar] [CrossRef] [PubMed]
- Qian, X.Y.; Gu, G.F.; Zhou, W.X. Modified detrended fluctuation analysis based on empirical mode decomposition for the characterization of anti-persistent processes. Phys. A Stat. Mech. Its Appl. 2011, 390, 4388–4395. [Google Scholar] [CrossRef]
- Morales Martínez, J.L.; Segovia-Domínguez, I.; Rodríguez, I.Q.; Horta-Rangel, F.A.; Sosa-Gómez, G. A modified multifractal detrended fluctuation analysis (MFDFA) approach for multifractal analysis of precipitation. Phys. A Stat. Mech. Its Appl. 2021, 565, 125611. [Google Scholar] [CrossRef]
- Lahmiri, S.; Bekiros, S. Disturbances and complexity in volatility time series. Chaos Solitons Fractals 2017, 105, 38–42. [Google Scholar] [CrossRef]
- Cao, G.; Cao, J.; Xu, L. Asymmetric multifractal scaling behavior in the Chinese stock market: Based on asymmetric MF-DFA. Phys. A Stat. Mech. Its Appl. 2013, 392, 797–807. [Google Scholar] [CrossRef]
- Shahzad, S.J.H.; Bouri, E.; Kayani, G.M.; Nasir, R.M.; Kristoufek, L. Are clean energy stocks efficient? Asymmetric multifractal scaling behaviour. Phys. A Stat. Mech. Its Appl. 2020, 550, 124519. [Google Scholar] [CrossRef]
- Aslam, F.; Mohti, W.; Ferreira, P. Evidence of intraday multifractality in European stock markets during the recent coronavirus (COVID-19) outbreak. Int. J. Financ. Stud. 2020, 8, 31. [Google Scholar] [CrossRef]
- Xu, M.; Shang, P.; Lin, A. Cross-correlation analysis of stock markets using EMD and EEMD. Phys. A Stat. Mech. Its Appl. 2016, 442, 82–90. [Google Scholar] [CrossRef]
- Xu, C.; Ke, J.; Peng, Z.; Fang, W.; Duan, Y. Asymmetric Fractal Characteristics and Market Efficiency Analysis of Style Stock Indices. Entropy 2022, 24, 969. [Google Scholar] [CrossRef] [PubMed]
- Tiwari, A.K.; Aye, G.C.; Gupta, R. Stock market efficiency analysis using long spans of data: A multifractal detrended fluctuation approach. Financ. Res. Lett. 2019, 28, 398–411. [Google Scholar] [CrossRef]
- Lee, M.; Song, J.W.; Kim, S.; Chang, W. Asymmetric market efficiency using the index-based asymmetric-MFDFA. Phys. A Stat. Mech. Its Appl. 2018, 512, 1278–1294. [Google Scholar] [CrossRef]
- Zhuanga, X.; Wei, D. Asymmetric multifractality, comparative efficiency analysis of green finance markets: A dynamic study by index-based model. Phys. A Stat. Mech. Its Appl. 2022, 604, 127949. [Google Scholar] [CrossRef]
- Choi, S.Y. Analysis of stock market efficiency during crisis periods in the US stock market: Differences between the global financial crisis and COVID-19 pandemic. Phys. A Stat. Mech. Its Appl. 2021, 574, 125988. [Google Scholar] [CrossRef]
- Mnif, E.; Jarboui, A. COVID-19, bitcoin market efficiency, herd behaviour. Rev. Behav. Financ. 2021, 13, 69–84. [Google Scholar] [CrossRef]
- Aslam, F.; Ferreira, P.; Mohti, W. Investigating efficiency of frontier stock markets using multifractal detrended fluctuation analysis. Int. J. Emerg. Mark. 2021. [Google Scholar] [CrossRef]
- Gaio, L.E.; Stefanelli, N.O.; Júnior, T.P.; Bonacim, C.A.G.; Gatsios, R.C. The impact of the Russia-Ukraine conflict on market efficiency: Evidence for the developed stock market. Financ. Res. Lett. 2022, 50, 103302. [Google Scholar] [CrossRef]
- Lahmiri, S.; Uddin, G.S.; Bekiros, S. Nonlinear dynamics of equity, currency and commodity markets in the aftermath of the global financial crisis. Chaos Solitons Fractals 2017, 103, 342–346. [Google Scholar] [CrossRef]
- Stosic, T.; Nejad, S.A.; Stosic, B. Multifractal analysis of Brazilian agricultural market. Fractals 2020, 28, 2050076. [Google Scholar] [CrossRef]
- Arshad, S.; Rizvi, S.A.R.; Haroon, O.; Mehmood, F.; Gong, Q. Are oil prices efficient? Econ. Model. 2021, 96, 362–370. [Google Scholar] [CrossRef]
- Fernandes, L.H.; Silva, J.W.; de Araujo, F.H.; Ferreira, P.; Aslam, F.; Tabak, B.M. Interplay multifractal dynamics among metal commodities and us-epu. Phys. A Stat. Mech. Its Appl. 2022, 606, 128126. [Google Scholar] [CrossRef]
- Pagan, A.R.; Sossounov, K.A. A simple framework for analysing bull and bear markets. J. Appl. Econom. 2003, 18, 23–46. [Google Scholar] [CrossRef]
- Alvarez-Ramirez, J.; Rodriguez, E.; Echeverria, J.C. A DFA approach for assessing asymmetric correlations. Phys. A Stat. Mech. Its Appl. 2009, 388, 2263–2270. [Google Scholar] [CrossRef]
- Gu, G.F.; Zhou, W.X. Detrending moving average algorithm for multifractals. Phys. Rev. E 2010, 82, 011136. [Google Scholar] [CrossRef]
- Zhang, C.; Ni, Z.; Ni, L.; Li, J.; Zhou, L. Asymmetric multifractal detrending moving average analysis in time series of PM2. 5 concentration. Phys. A Stat. Mech. Its Appl. 2016, 457, 322–330. [Google Scholar] [CrossRef]
- Alessio, E.; Carbone, A.; Castelli, G.; Frappietro, V. Second-order moving average and scaling of stochastic time series. Eur. Phys. J. B-Condens. Matter Complex Syst. 2002, 27, 197–200. [Google Scholar] [CrossRef]
- Lee, M.; Song, J.W.; Park, J.H.; Chang, W. Asymmetric multi-fractality in the US stock indices using index-based model of A-MFDFA. Chaos Solitons Fractals 2017, 97, 28–38. [Google Scholar] [CrossRef]
- Nakamoto, S.; Bitcoin, A. A peer-to-peer electronic cash system. Bitcoin 2008, 4. Available online: https://bitcoin.org/bitcoin.pdf (accessed on 13 February 2016).
- Kristjanpoller, W.; Bouri, E. Asymmetric multifractal cross-correlations between the main world currencies and the main cryptocurrencies. Phys. A Stat. Mech. Its Appl. 2019, 523, 1057–1071. [Google Scholar] [CrossRef]
- Kristjanpoller, W.; Bouri, E.; Takaishi, T. Cryptocurrencies and equity funds: Evidence from an asymmetric multifractal analysis. Phys. A Stat. Mech. Its Appl. 2020, 545, 123711. [Google Scholar] [CrossRef]
- Begušić, S.; Kostanjčar, Z.; Stanley, H.E.; Podobnik, B. Scaling properties of extreme price fluctuations in Bitcoin markets. Phys. A Stat. Mech. Its Appl. 2018, 510, 400–406. [Google Scholar] [CrossRef]
- Takaishi, T. Statistical properties and multifractality of Bitcoin. Phys. A Stat. Mech. Its Appl. 2018, 506, 507–519. [Google Scholar] [CrossRef]
- da Silva Filho, A.C.; Maganini, N.D.; de Almeida, E.F. Multifractal analysis of Bitcoin market. Phys. A Stat. Mech. Its Appl. 2018, 512, 954–967. [Google Scholar] [CrossRef]
- Stavroyiannis, S.; Babalos, V.; Bekiros, S.; Lahmiri, S.; Uddin, G.S. The high frequency multifractal properties of Bitcoin. Phys. A Stat. Mech. Its Appl. 2019, 520, 62–71. [Google Scholar] [CrossRef]
- Mnif, E.; Jarboui, A.; Mouakhar, K. How the cryptocurrency market has performed during COVID 19? A multifractal analysis. Financ. Res. Lett. 2020, 36, 101647. [Google Scholar] [CrossRef]
- Wątorek, M.; Drożdż, S.; Kwapień, J.; Minati, L.; Oświęcimka, P.; Stanuszek, M. Multiscale characteristics of the emerging global cryptocurrency market. Phys. Rep. 2021, 901, 1–82. [Google Scholar] [CrossRef]
- Ghazani, M.M.; Khosravi, R. Multifractal detrended cross-correlation analysis on benchmark cryptocurrencies and crude oil prices. Phys. A Stat. Mech. Its Appl. 2020, 560, 125172. [Google Scholar] [CrossRef]
- Song, J.Y.; Chang, W.; Song, J.W. Cluster analysis on the structure of the cryptocurrency market via bitcoin–ethereum filtering. Phys. A Stat. Mech. Its Appl. 2019, 527, 121339. [Google Scholar] [CrossRef]
- Song, J.W.; Ko, B.; Cho, P.; Chang, W. Time-varying causal network of the Korean financial system based on firm-specific risk premiums. Phys. A Stat. Mech. Its Appl. 2016, 458, 287–302. [Google Scholar] [CrossRef]
- Baur, D.G.; Dimpfl, T. Asymmetric volatility in cryptocurrencies. Econ. Lett. 2018, 173, 148–151. [Google Scholar] [CrossRef]
- Markowitz, H. Portfolio Selection. J. Financ. 1952, 7, 77–91. [Google Scholar]
- Yuan, Y.; Zhuang, X.T.; Jin, X. Measuring multifractality of stock price fluctuation using multifractal detrended fluctuation analysis. Phys. A Stat. Mech. Its Appl. 2009, 388, 2189–2197. [Google Scholar] [CrossRef]
- Zhang, X.; Yang, L.; Zhu, Y. Analysis of multifractal characterization of Bitcoin market based on multifractal detrended fluctuation analysis. Phys. A Stat. Mech. Its Appl. 2019, 523, 973–983. [Google Scholar] [CrossRef]
- Kracík, J.; Lavička, H. Fluctuation analysis of high frequency electric power load in the Czech Republic. Phys. A Stat. Mech. Its Appl. 2016, 462, 951–961. [Google Scholar] [CrossRef]
- Cheng, Q.; Liu, X.; Zhu, X. Cryptocurrency momentum effect: DFA and MF-DFA analysis. Phys. A Stat. Mech. Its Appl. 2019, 526, 120847. [Google Scholar] [CrossRef]


| Return Series | Idiosyncratic Risk Premium | |||||
|---|---|---|---|---|---|---|
| (a) BTC | Original | Shuffled | Surrogate | Original | Shuffled | Surrogate |
| Overall | 0.6297 | 0.3242 (48.52%) | 0.3869 (38.56%) | 0.4113 | 0.3551 (13.67%) | 0.1689 (58.93%) |
| Uptrend | 0.5831 | 0.2775 (52.42%) | 0.3690 (36.72%) | 0.6218 | 0.3585 (42.35%) | 0.3270 (47.41%) |
| Downtrend | 0.6450 | 0.3570 (44.66%) | 0.3613 (43.99%) | 0.3410 | 0.3440 (−0.87%) | 0.1069 (68.65%) |
| (b) ETH | Original | Shuffled | Surrogate | Original | Shuffled | Surrogate |
| Overall | 0.3773 | 0.2982 (20.98%) | 0.1756 (53.46%) | 0.3859 | 0.3251 (15.75%) | 0.1402 (63.66%) |
| Uptrend | 0.3682 | 0.2887 (21.60%) | 0.1631 (55.71%) | 0.3452 | 0.3280 (4.99%) | 0.2382 (31.00%) |
| Downtrend | 0.3340 | 0.3059 (8.43%) | 0.1642 (50.94%) | 0.3623 | 0.2788 (23.05%) | 0.0680 (81.24%) |
| (c) ADA | Original | Shuffled | Surrogate | Original | Shuffled | Surrogate |
| Overall | 0.2323 | 0.2517 (−8.35%) | 0.1335 (42.52%) | 0.3060 | 0.3251 (−6.24%) | 0.1867 (38.99%) |
| Uptrend | 0.3506 | 0.2550 (27.29%) | 0.1677 (52.18%) | 0.3301 | 0.3385 (−2.53%) | 0.1582 (52.08%) |
| Downtrend | 0.1549 | 0.2611 (−68.60%) | 0.1102 (28.88%) | 0.3057 | 0.2514 (17.76%) | 0.2276 (25.55%) |
| (d) XRP | Original | Shuffled | Surrogate | Original | Shuffled | Surrogate |
| Overall | 0.5077 | 0.4463 (12.10%) | 0.2361 (53.49%) | 0.4667 | 0.5245 (−12.38%) | 0.2121 (54.57%) |
| Uptrend | 0.5429 | 0.5035 (7.25%) | 0.2719 (49.92%) | 0.5220 | 0.5354 (−2.57%) | 0.3697 (29.19%) |
| Downtrend | 0.3965 | 0.3160 (20.32%) | 0.1960 (50.57%) | 0.3003 | 0.4006 (−33.40%) | 0.1892 (37.00%) |
Disclaimer/Publisher’s Note: The statements, opinions and data contained in all publications are solely those of the individual author(s) and contributor(s) and not of MDPI and/or the editor(s). MDPI and/or the editor(s) disclaim responsibility for any injury to people or property resulting from any ideas, methods, instructions or products referred to in the content. |
© 2023 by the authors. Licensee MDPI, Basel, Switzerland. This article is an open access article distributed under the terms and conditions of the Creative Commons Attribution (CC BY) license (https://creativecommons.org/licenses/by/4.0/).
Share and Cite
Lee, M.; Cho, Y.; Ock, S.E.; Song, J.W. Analyzing Asymmetric Volatility and Multifractal Behavior in Cryptocurrencies Using Capital Asset Pricing Model Filter. Fractal Fract. 2023, 7, 85. https://doi.org/10.3390/fractalfract7010085
Lee M, Cho Y, Ock SE, Song JW. Analyzing Asymmetric Volatility and Multifractal Behavior in Cryptocurrencies Using Capital Asset Pricing Model Filter. Fractal and Fractional. 2023; 7(1):85. https://doi.org/10.3390/fractalfract7010085
Chicago/Turabian StyleLee, Minhyuk, Younghwan Cho, Seung Eun Ock, and Jae Wook Song. 2023. "Analyzing Asymmetric Volatility and Multifractal Behavior in Cryptocurrencies Using Capital Asset Pricing Model Filter" Fractal and Fractional 7, no. 1: 85. https://doi.org/10.3390/fractalfract7010085
APA StyleLee, M., Cho, Y., Ock, S. E., & Song, J. W. (2023). Analyzing Asymmetric Volatility and Multifractal Behavior in Cryptocurrencies Using Capital Asset Pricing Model Filter. Fractal and Fractional, 7(1), 85. https://doi.org/10.3390/fractalfract7010085