
Global Collective Dynamics of Financial Market Efficiency Using Attention Entropy with Hierarchical Clustering


Abstract
1. Introduction
2. Literature Review
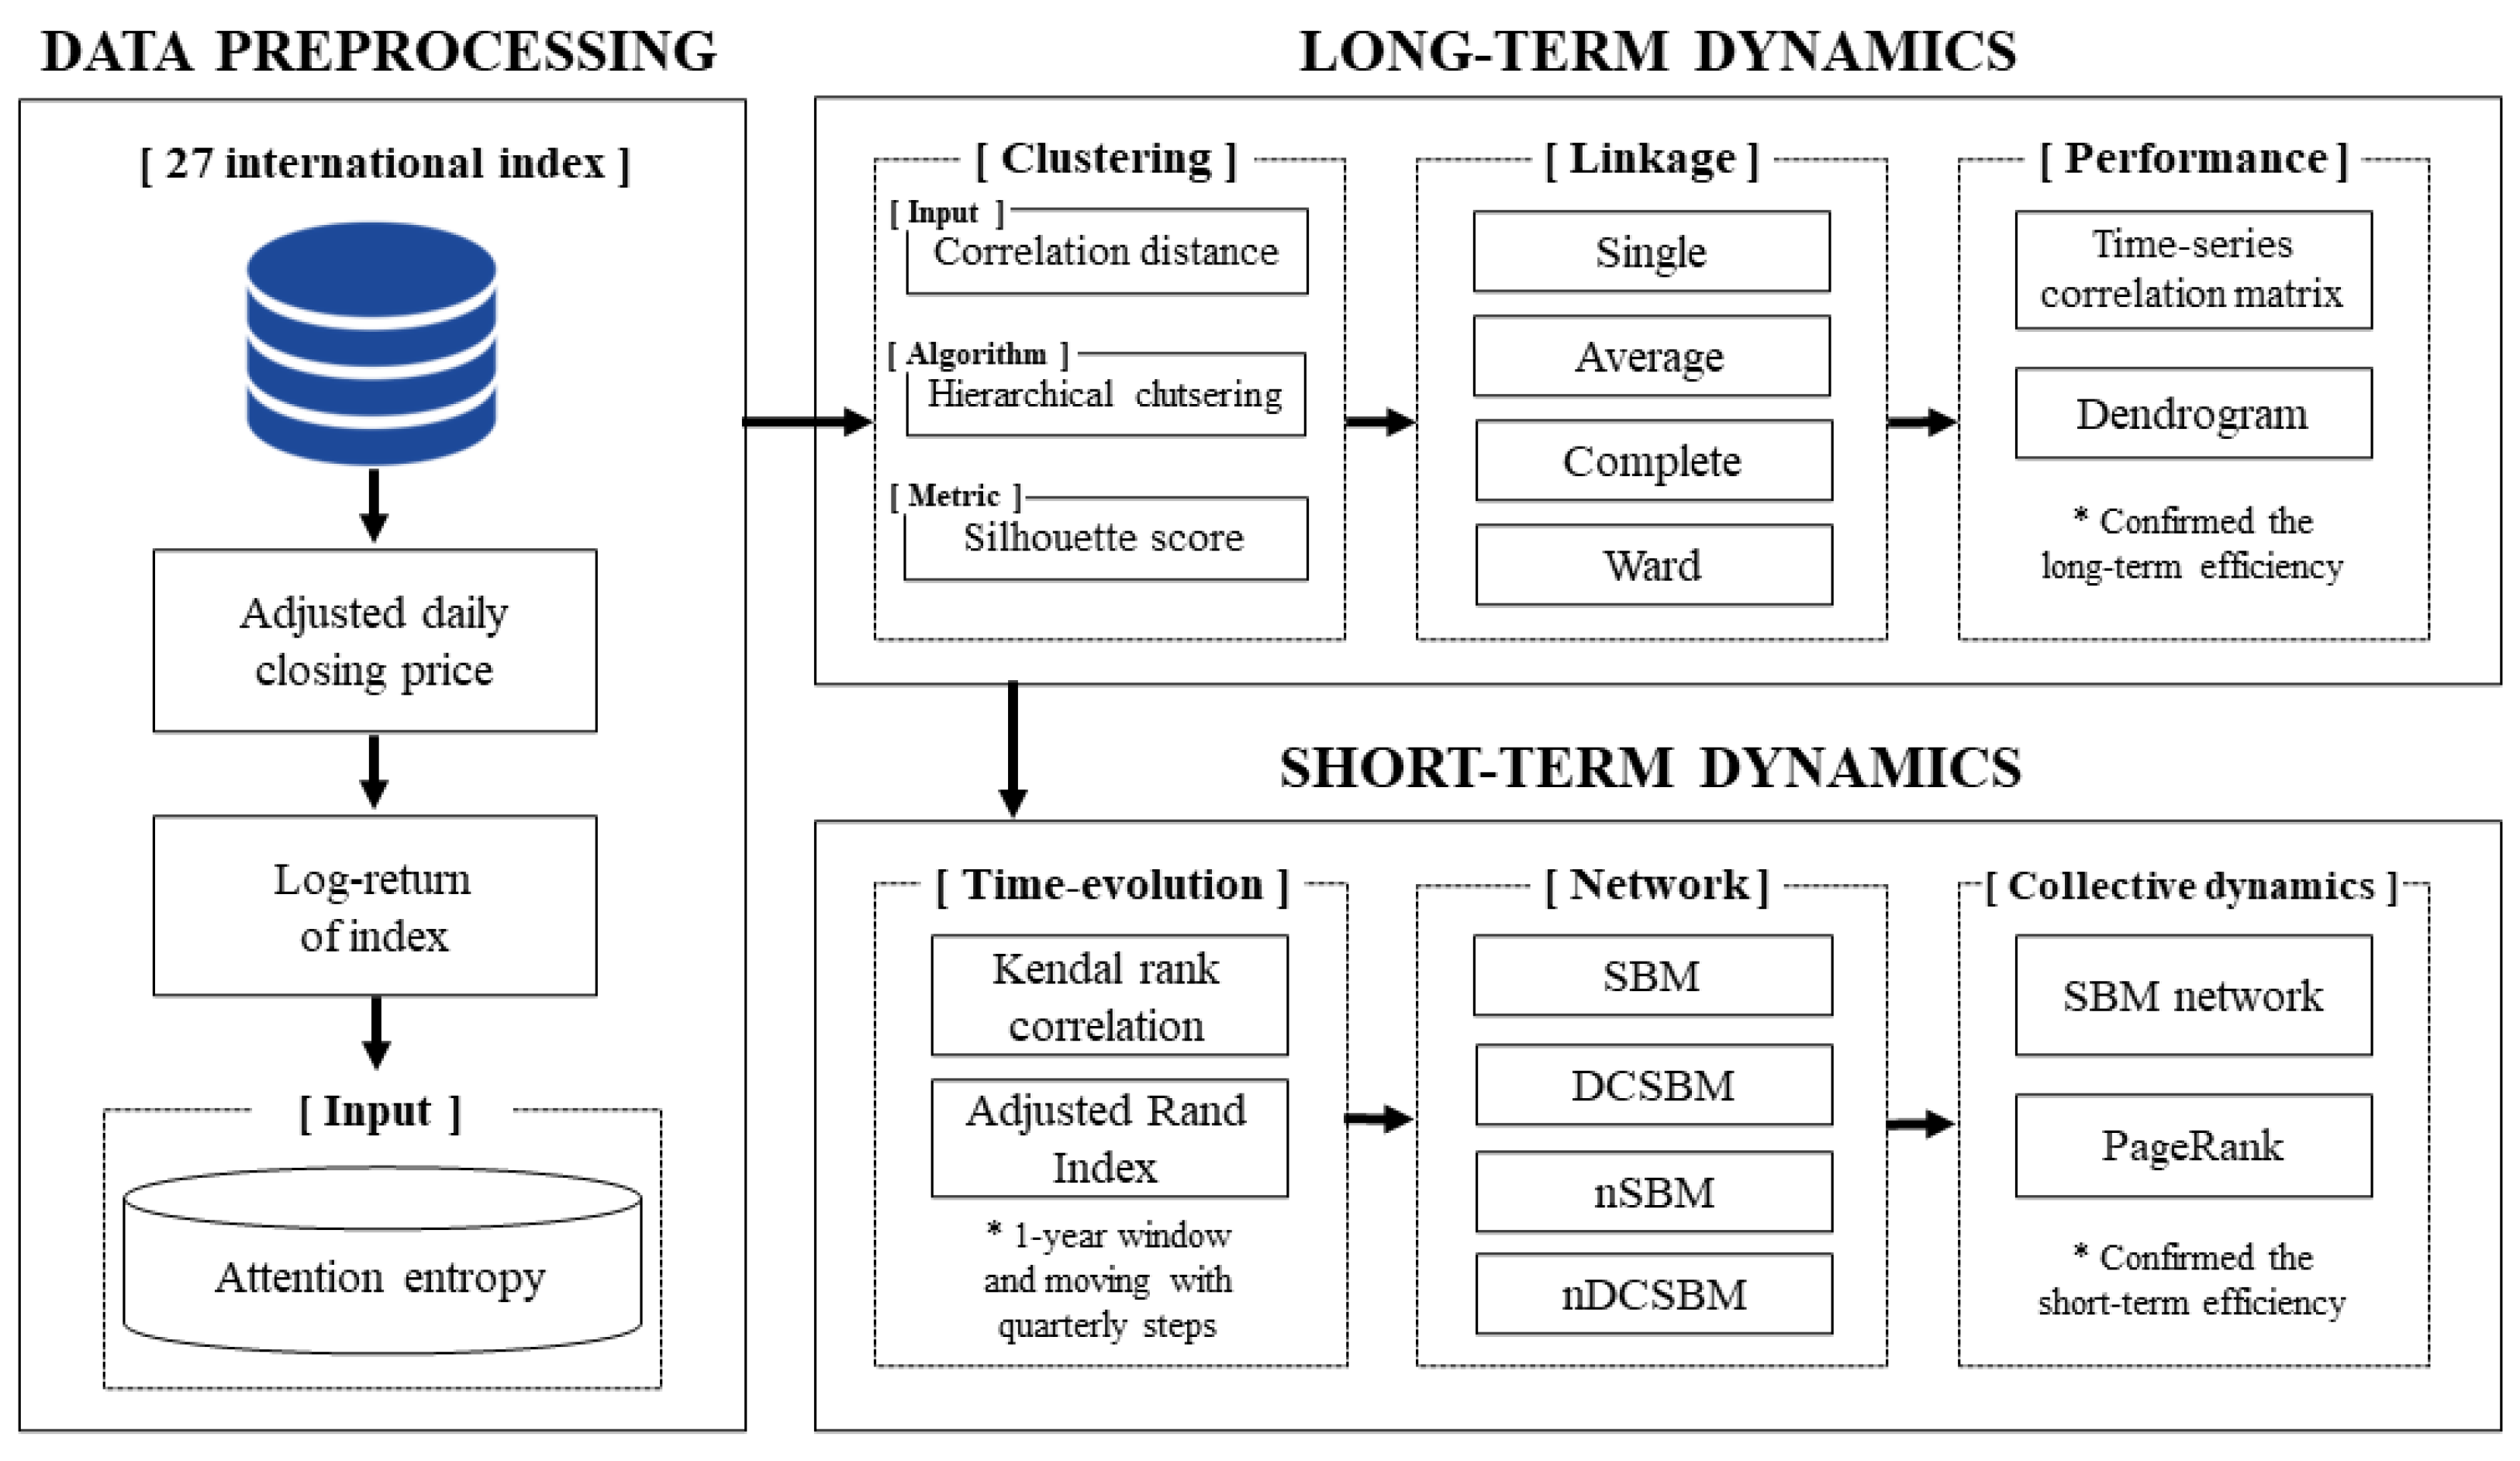
3. Methods
3.1. Attention Entropy
3.2. Hierarchical Clustering
3.3. Stochastic Block Model (SBM)
4. Experiments and Data
4.1. Experiments
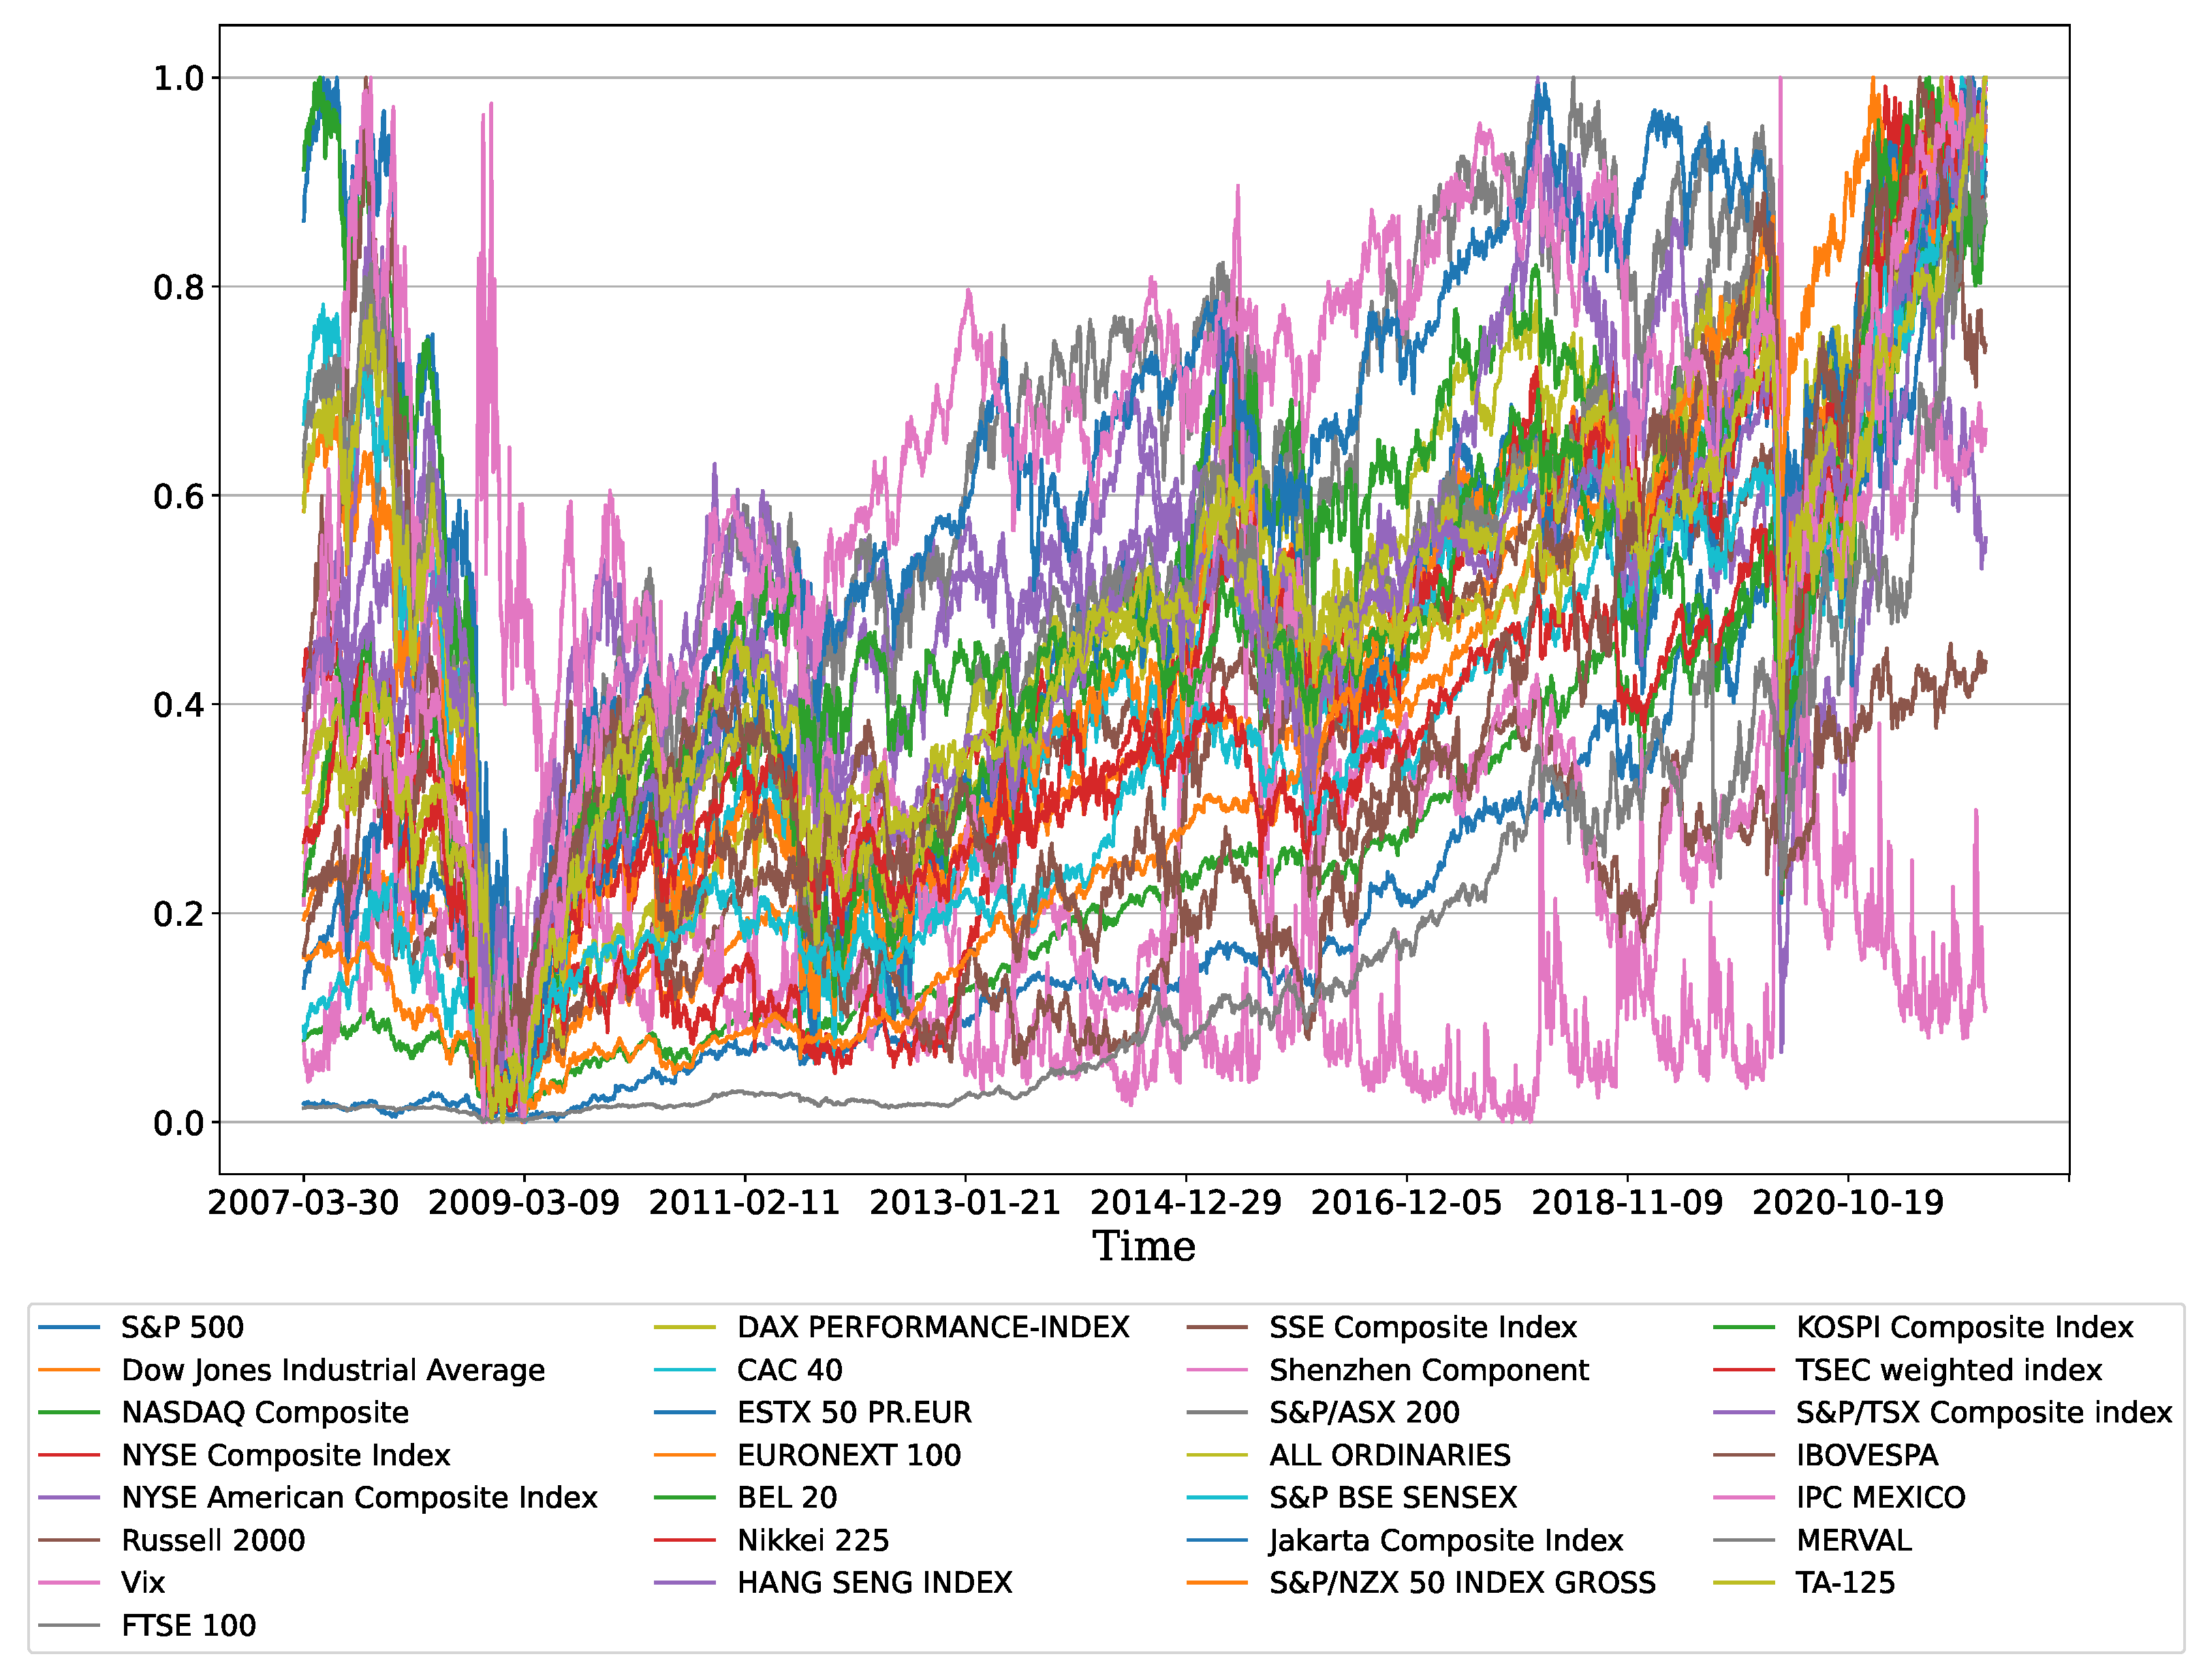
4.2. Data
5. Results
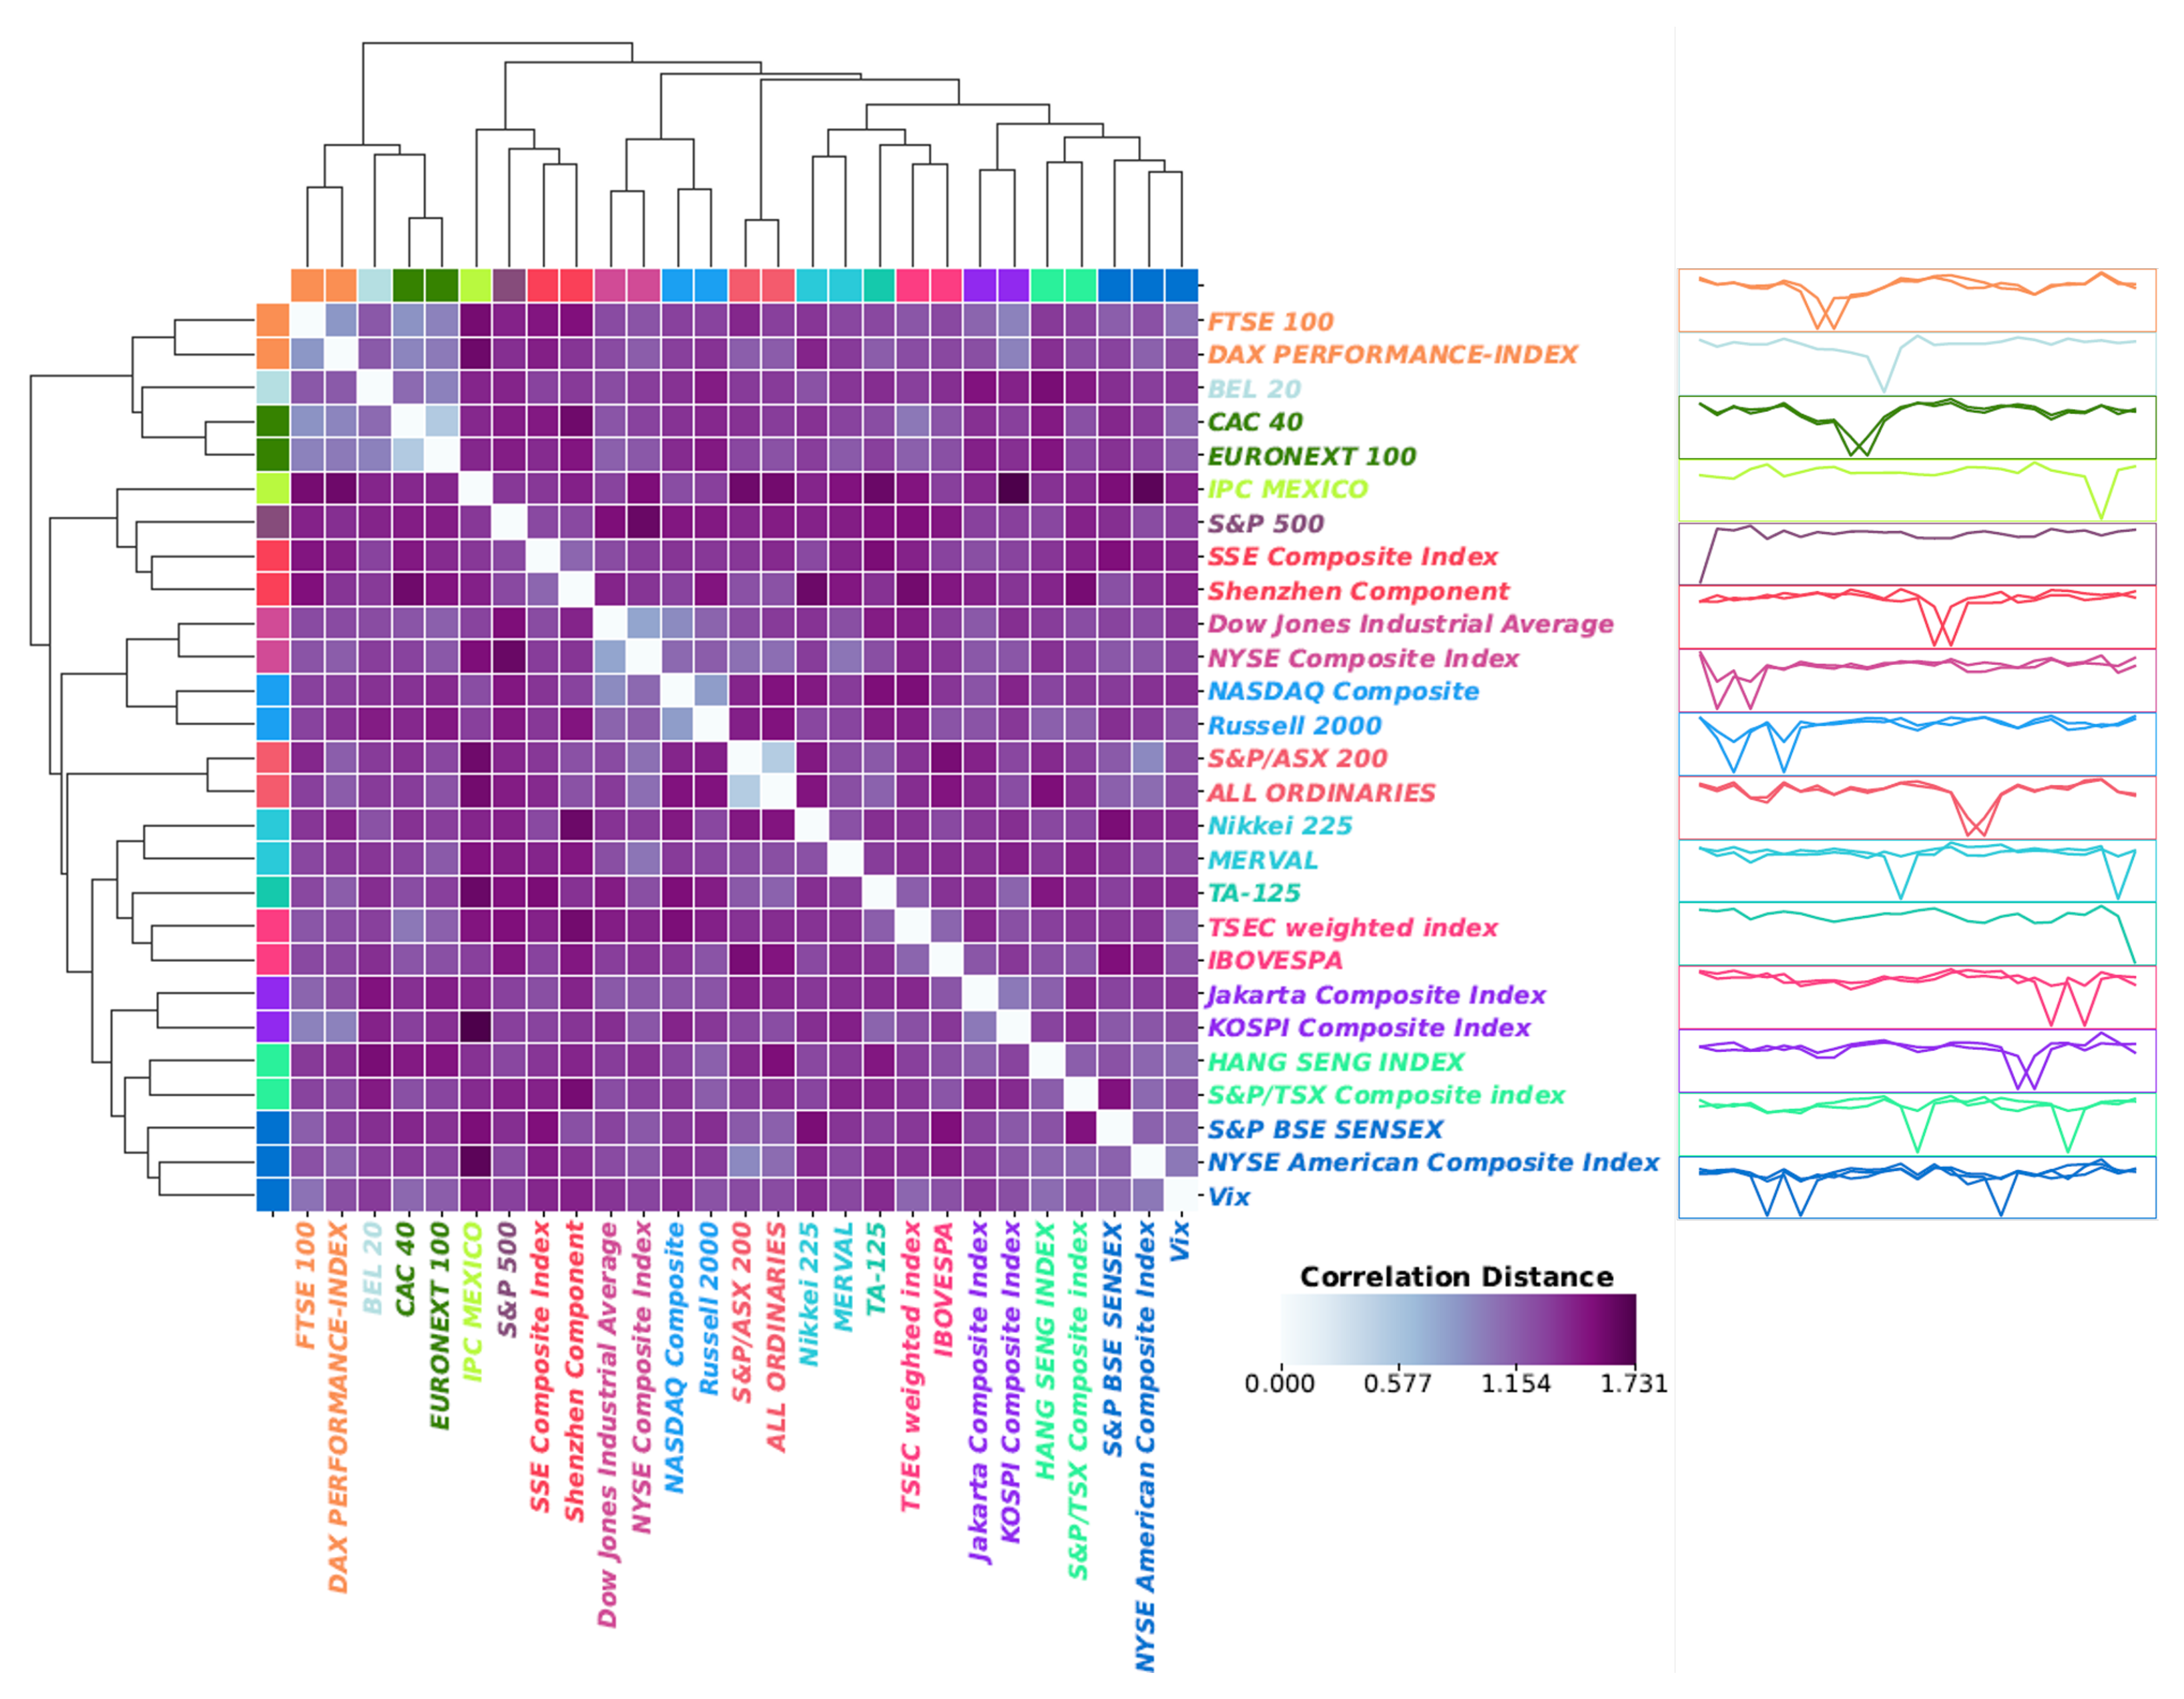
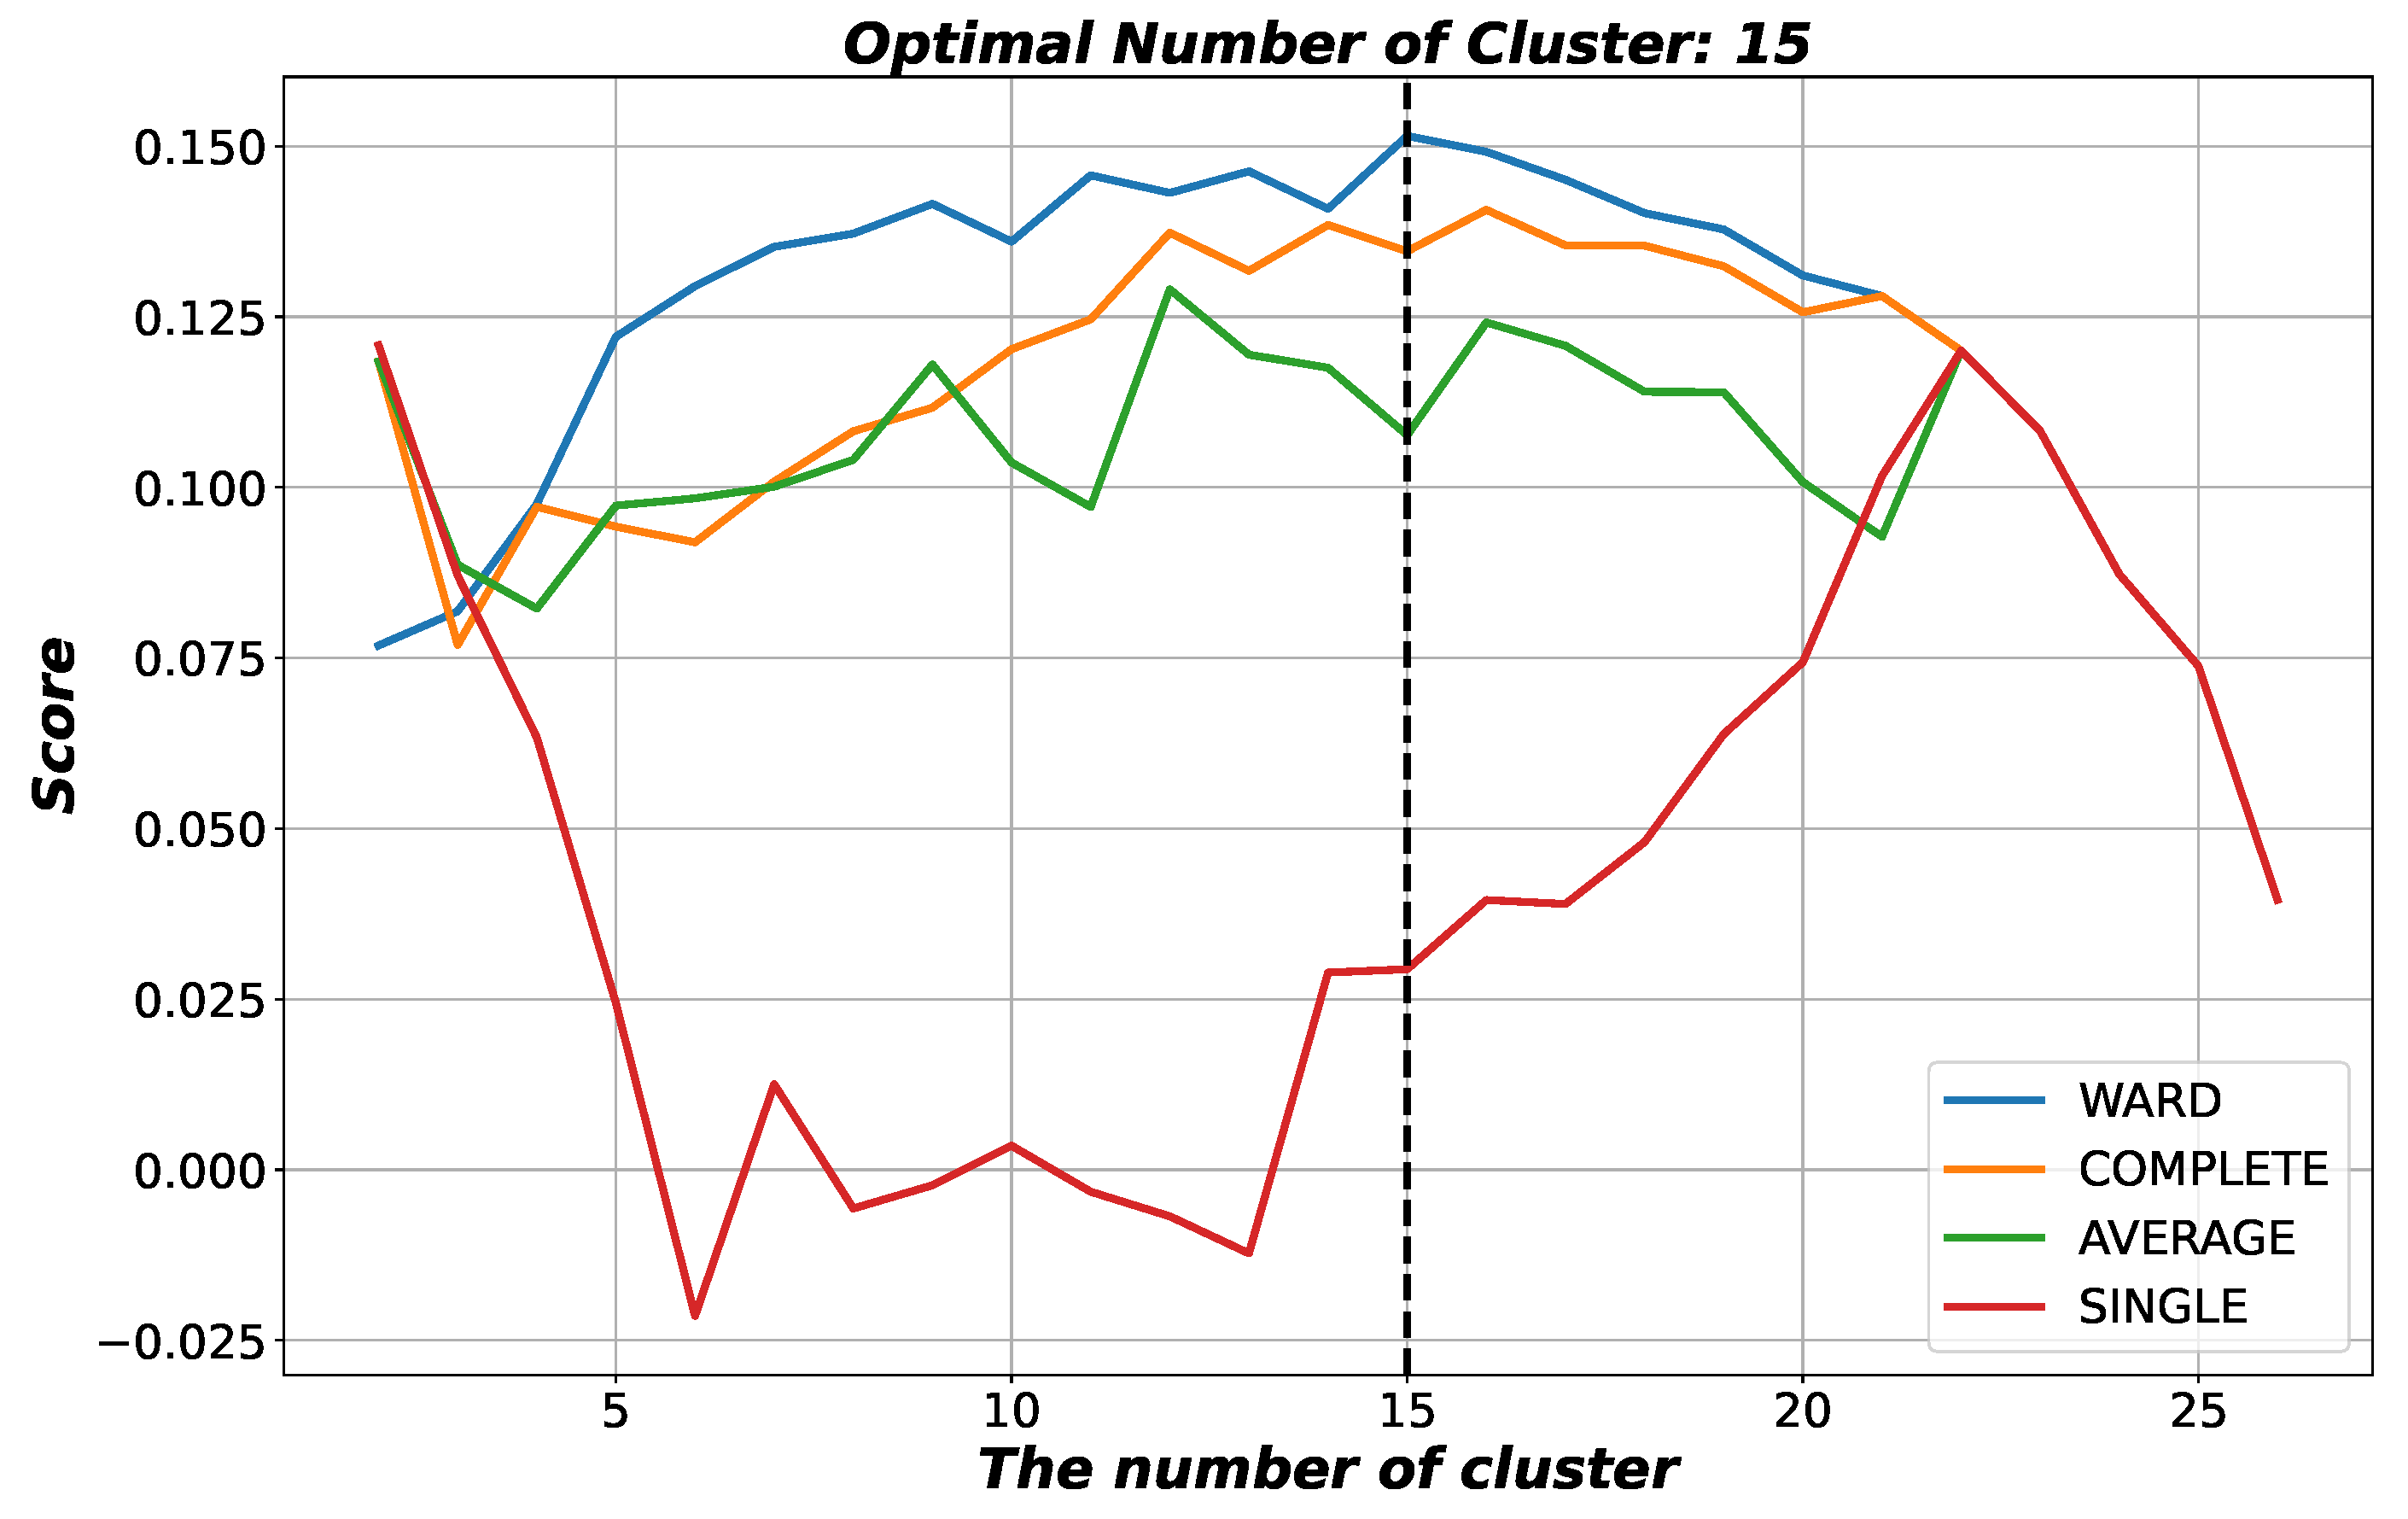
5.1. Long-Term Efficiency with Clustering
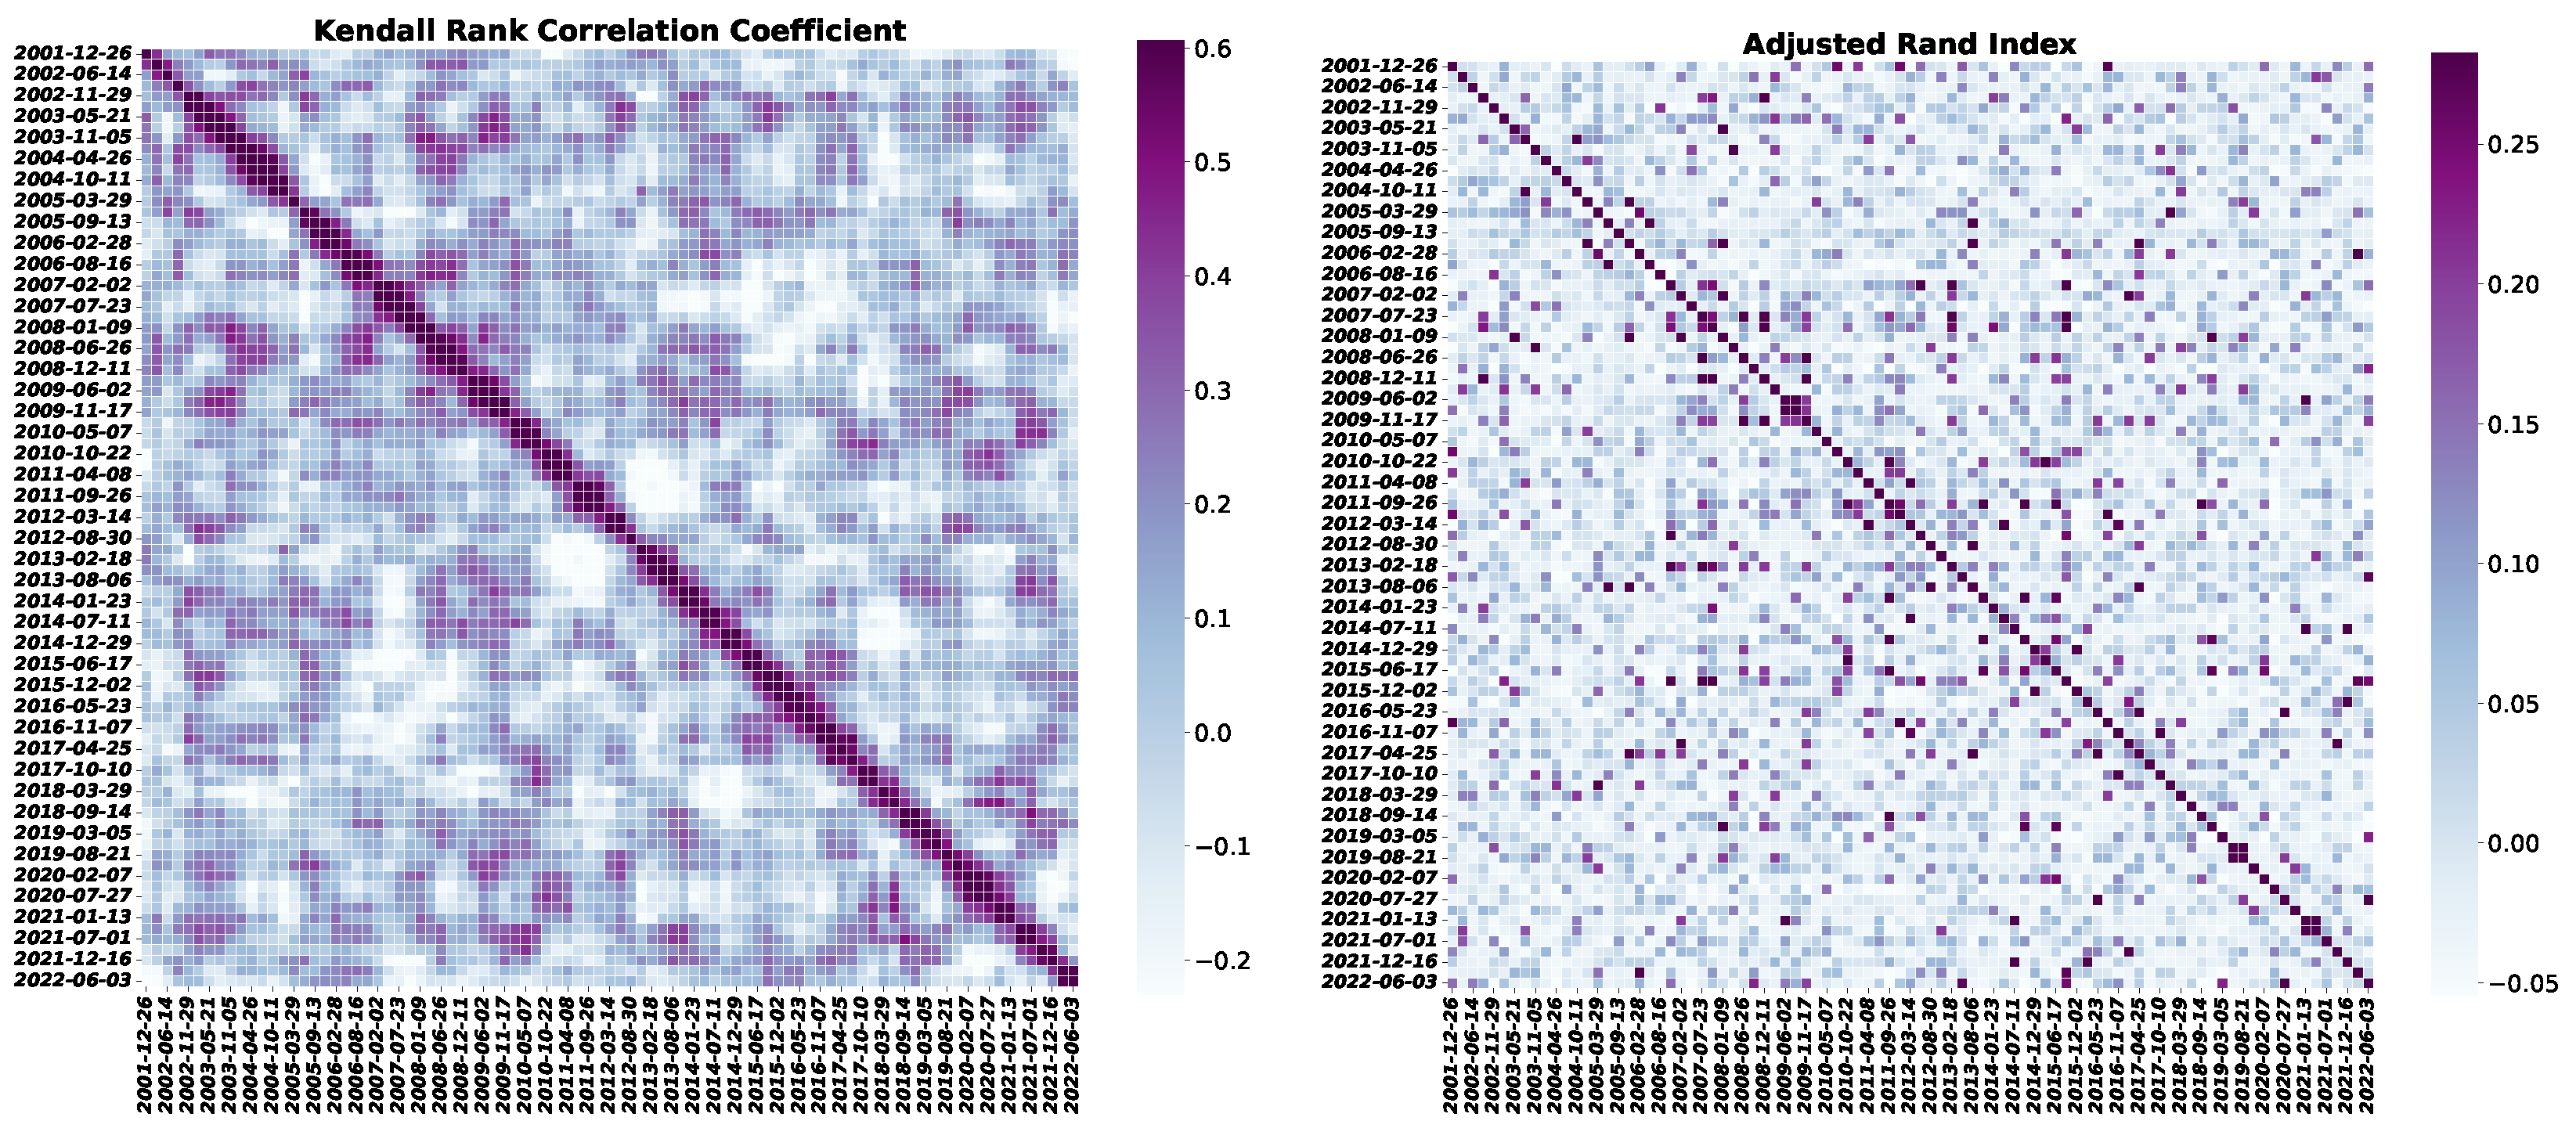
5.2. Short-Term Efficiency with Sliding Window
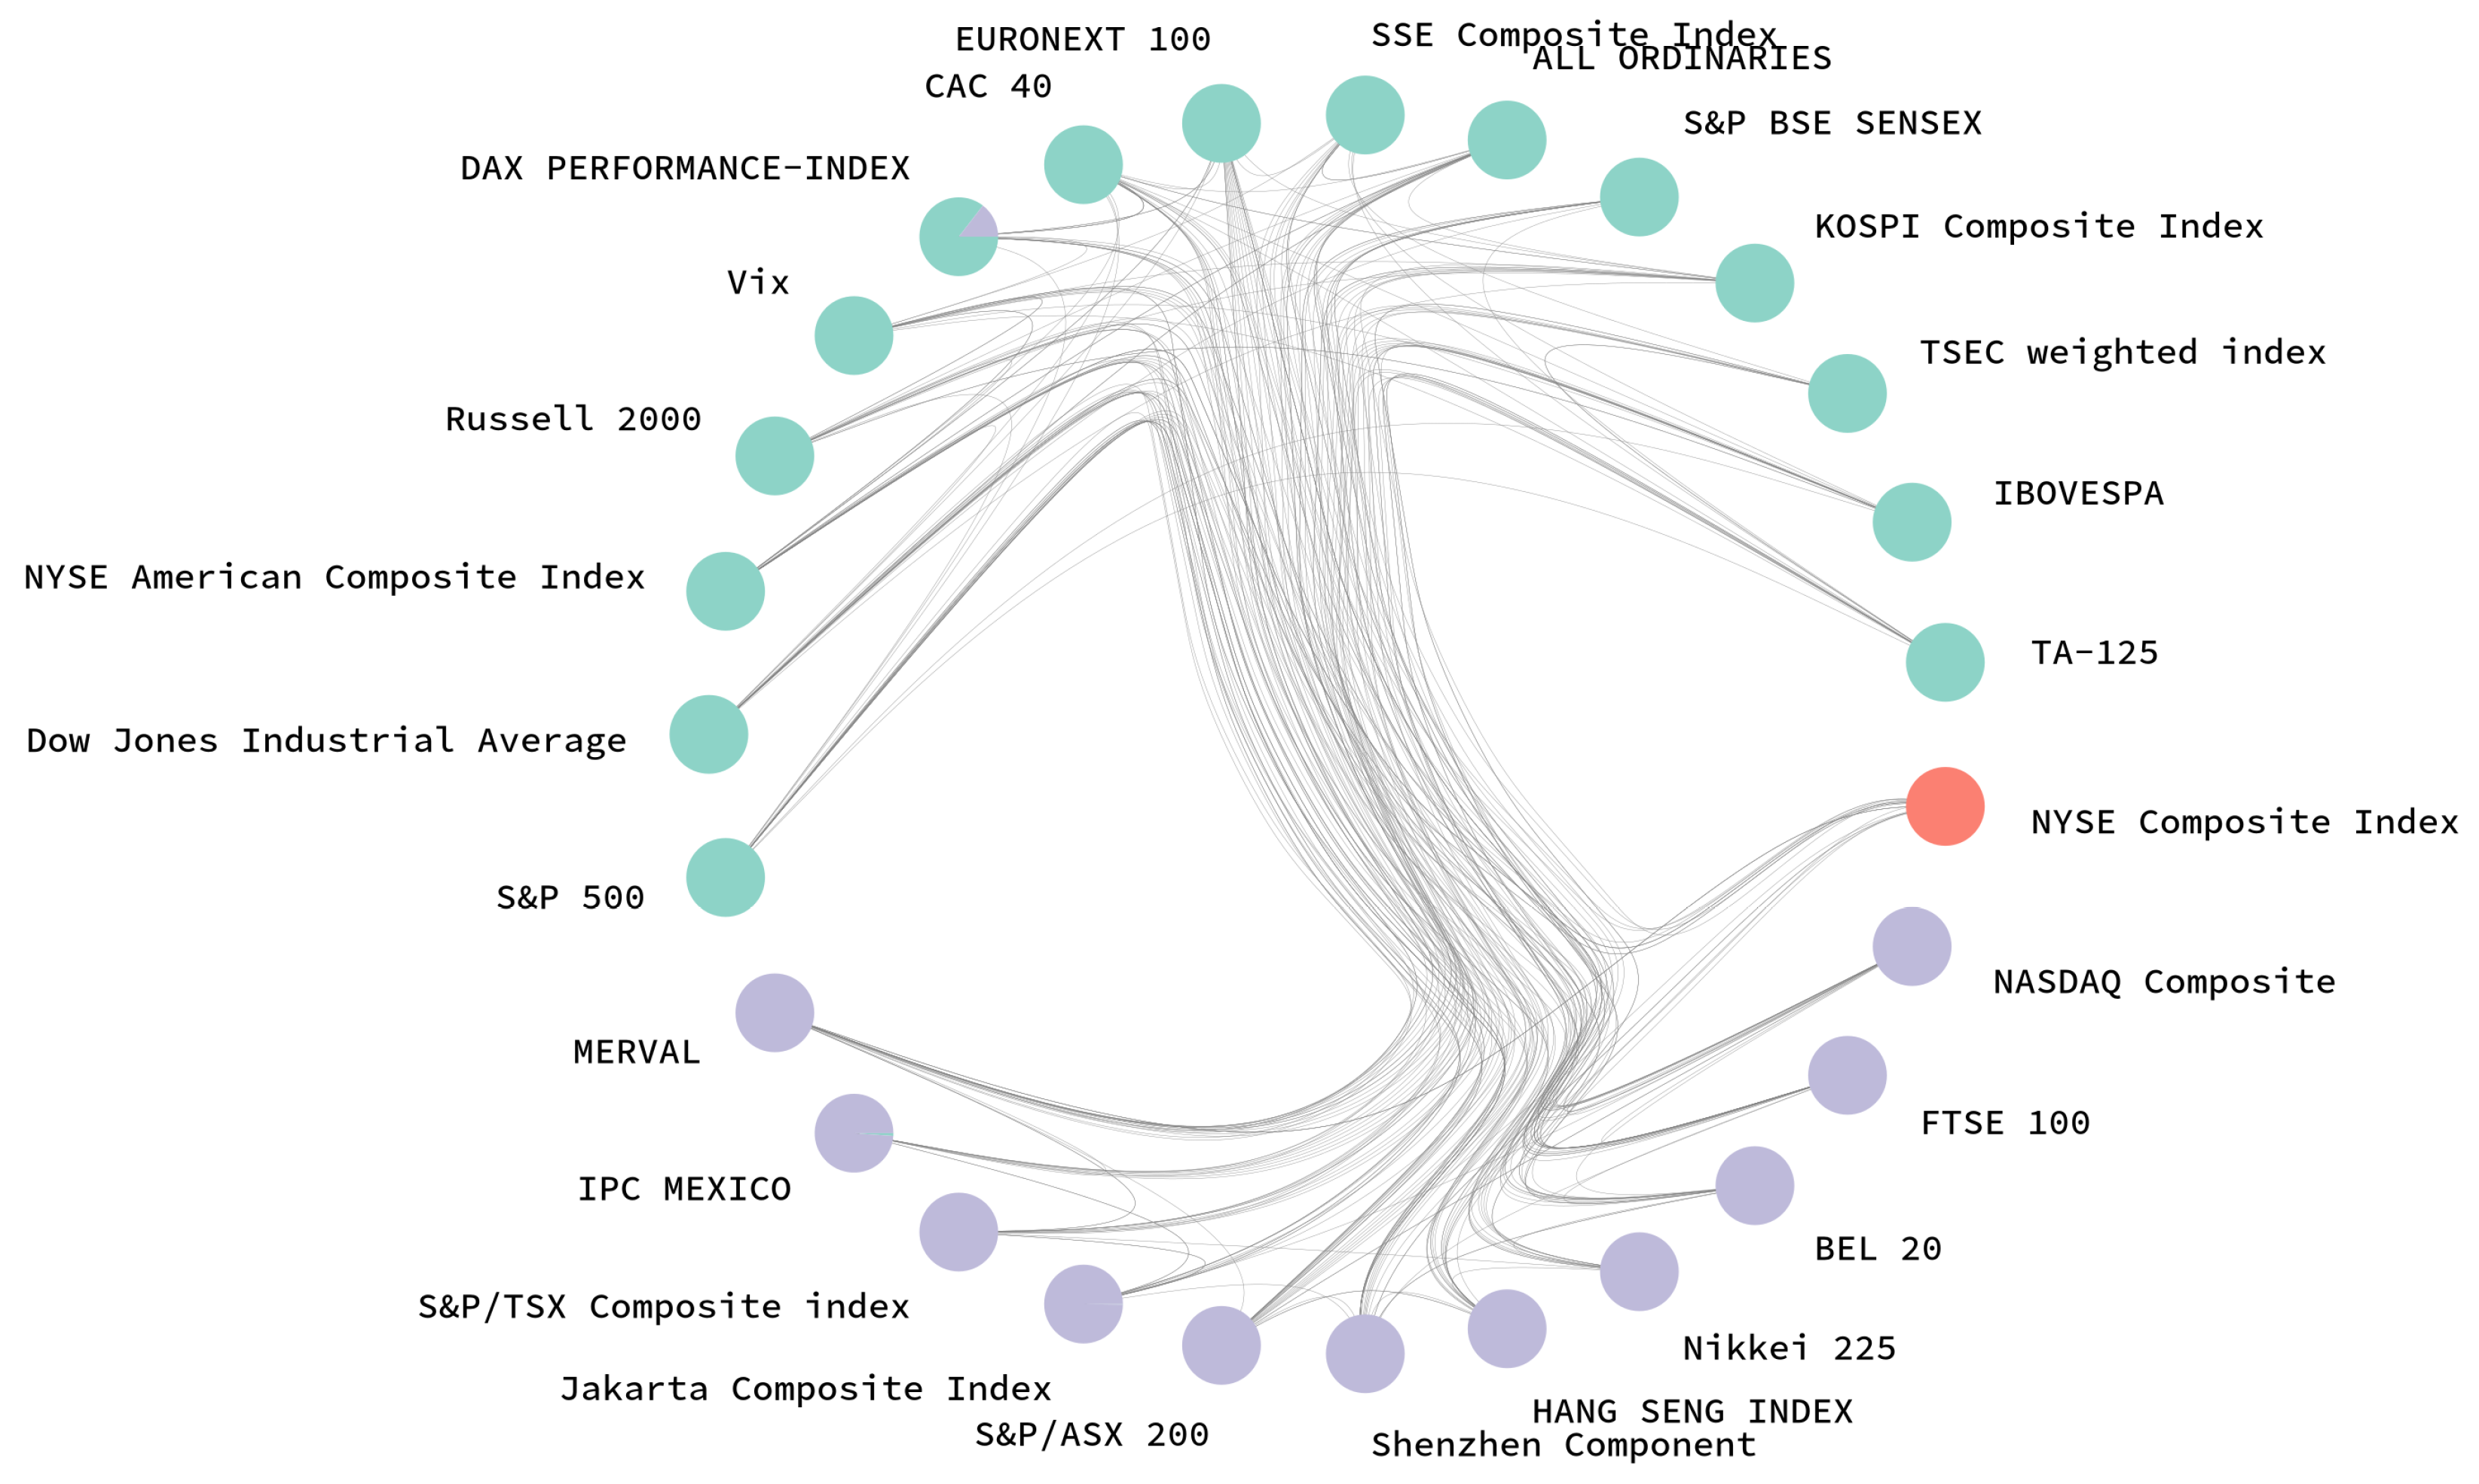
5.3. Short-Term Efficiency with SBM Network
6. Discussion and Conclusions
Author Contributions
Funding
Data Availability Statement
Conflicts of Interest
Appendix A


References
- Cootner, P.H. The Random Character of Stock Market Prices; MIT Press: Cambridge, MA, USA, 1964. [Google Scholar]
- Fama, E.F. Efficient capital markets: A review of theory and empirical work. J. Financ. 1970, 25, 383–417. [Google Scholar] [CrossRef]
- Fama, E.F. The behavior of stock-market prices. J. Bus. 1965, 38, 34–105. [Google Scholar] [CrossRef]
- Malkiel, B.G. The efficient market hypothesis and its critics. J. Econ. Perspect. 2003, 17, 59–82. [Google Scholar] [CrossRef]
- Sornette, D. Why Stock Markets Crash: Critical Events in Complex Financial Systems; Princeton University Press: Princeton, NJ, USA, 2003. [Google Scholar]
- Stanley, H.E.; Amaral, L.A.; Gabaix, X.; Gopikrishnan, P.; Plerou, V. Similarities and differences between physics and economics. Phys. Stat. Mech. Appl. 2001, 299, 1–15. [Google Scholar] [CrossRef][Green Version]
- Gopikrishnan, P.; Plerou, V.; Amaral, L.A.N.; Meyer, M.; Stanley, H.E. Scaling of the distribution of fluctuations of financial market indices. Phys. Rev. E 1999, 60, 5305. [Google Scholar] [CrossRef]
- Mantegna, R.N.; Stanley, H.E. Scaling behaviour in the dynamics of an economic index. Nature 1995, 376, 46–49. [Google Scholar] [CrossRef]
- Johansen, A.; Ledoit, O.; Sornette, D. Crashes as critical points. Int. J. Theor. Appl. Financ. 2000, 3, 219–255. [Google Scholar] [CrossRef]
- Preis, T.; Moat, H.S.; Stanley, H.E. Quantifying trading behavior in financial markets using Google Trends. Sci. Rep. 2013, 3, 1–6. [Google Scholar] [CrossRef]
- Preis, T.; Stanley, H.E. Bubble trouble. Phys. World 2011, 24, 29–32. [Google Scholar] [CrossRef]
- Sornette, D. Predictability of catastrophic events: Material rupture, earthquakes, turbulence, financial crashes, and human birth. Proc. Natl. Acad. Sci. USA 2002, 99, 2522–2529. [Google Scholar] [CrossRef]
- Lim, K.P.; Brooks, R. The evolution of stock market efficiency over time: A survey of the empirical literature. J. Econ. Surv. 2011, 25, 69–108. [Google Scholar] [CrossRef]
- Lo, A.W.; MacKinlay, A.C. The size and power of the variance ratio test in finite samples: A Monte Carlo investigation. J. Econom. 1989, 40, 203–238. [Google Scholar] [CrossRef]
- Lo, A.W. The adaptive markets hypothesis. J. Portf. Manag. 2004, 30, 15–29. [Google Scholar] [CrossRef]
- Urquhart, A.; McGroarty, F. Are stock markets really efficient? Evidence of the adaptive market hypothesis. Int. Rev. Financ. Anal. 2016, 47, 39–49. [Google Scholar] [CrossRef]
- Ito, M.; Noda, A.; Wada, T. The evolution of stock market efficiency in the US: A non-Bayesian time-varying model approach. Appl. Econ. 2016, 48, 621–635. [Google Scholar] [CrossRef]
- Noda, A. A test of the adaptive market hypothesis using a time-varying AR model in Japan. Financ. Res. Lett. 2016, 17, 66–71. [Google Scholar] [CrossRef]
- Zunino, L.; Tabak, B.M.; Pérez, D.G.; Garavaglia, M.; Rosso, O.A. Inefficiency in Latin-American market indices. Eur. Phys. J. B 2007, 60, 111–121. [Google Scholar] [CrossRef]
- Zunino, L.; Zanin, M.; Tabak, B.M.; Pérez, D.G.; Rosso, O.A. Forbidden patterns, permutation entropy and stock market inefficiency. Phys. Stat. Mech. Appl. 2009, 388, 2854–2864. [Google Scholar] [CrossRef]
- Zunino, L.; Bariviera, A.F.; Guercio, M.B.; Martinez, L.B.; Rosso, O.A. On the efficiency of sovereign bond markets. Phys. Stat. Mech. Appl. 2012, 391, 4342–4349. [Google Scholar] [CrossRef]
- Rocha Filho, T.M.; Rocha, P.M. Evidence of inefficiency of the Brazilian stock market: The IBOVESPA future contracts. Phys. Stat. Mech. Appl. 2020, 543, 123200. [Google Scholar] [CrossRef]
- Sánchez-Granero, M.; Balladares, K.; Ramos-Requena, J.; Trinidad-Segovia, J. Testing the efficient market hypothesis in Latin American stock markets. Phys. Stat. Mech. Appl. 2020, 540, 123082. [Google Scholar] [CrossRef]
- Szarek, D.; Bielak, Ł.; Wyłomańska, A. Long-term prediction of the metals’ prices using non-Gaussian time-inhomogeneous stochastic process. Phys. Stat. Mech. Appl. 2020, 555, 124659. [Google Scholar] [CrossRef]
- Yang, J.; Choudhary, G.I.; Rahardja, S.; Franti, P. Classification of interbeat interval time-series using attention entropy. IEEE Trans. Affect. Comput. 2020. [Google Scholar] [CrossRef]
- Pedregosa, F.; Varoquaux, G.; Gramfort, A.; Michel, V.; Thirion, B.; Grisel, O.; Blondel, M.; Prettenhofer, P.; Weiss, R.; Dubourg, V.; et al. Scikit-learn: Machine learning in Python. J. Mach. Learn. Res. 2011, 12, 2825–2830. [Google Scholar]
- Virtanen, P.; Gommers, R.; Oliphant, T.E.; Haberland, M.; Reddy, T.; Cournapeau, D.; Burovski, E.; Peterson, P.; Weckesser, W.; Bright, J.; et al. SciPy 1.0: Fundamental algorithms for scientific computing in Python. Nat. Methods 2020, 17, 261–272. [Google Scholar] [CrossRef]
- Gaio, L.E.; Stefanelli, N.O.; Pimenta, T.; Bonacim, C.A.G.; Gatsios, R.C. The impact of the Russia-Ukraine conflict on market efficiency: Evidence for the developed stock market. Financ. Res. Lett. 2022, 50, 103302. [Google Scholar] [CrossRef]
- Hkiri, B.; Béjaoui, A.; Gharib, C.; AlNemer, H.A. Revisiting efficiency in MENA stock markets during political shocks: Evidence from a multi-step approach. Heliyon 2021, 7, e08028. [Google Scholar] [CrossRef]
- Espinosa-Paredes, G.; Rodriguez, E.; Alvarez-Ramirez, J. A singular value decomposition entropy approach to assess the impact of COVID-19 on the informational efficiency of the WTI crude oil market. Chaos Solitons Fractals 2022, 160, 112238. [Google Scholar] [CrossRef]
- Wang, X. Efficient markets are more connected: An entropy-based analysis of the energy, industrial metal and financial markets. Energy Econ. 2022, 111, 106067. [Google Scholar] [CrossRef]
- Shternshis, A.; Mazzarisi, P.; Marmi, S. Measuring market efficiency: The Shannon entropy of high-frequency financial time series. Chaos Solitons Fractals 2022, 162, 112403. [Google Scholar] [CrossRef]
- Dinga, E.; Oprean-Stan, C.; Tănăsescu, C.R.; Brătian, V.; Ionescu, G.M. Entropy-Based Behavioural Efficiency of the Financial Market. Entropy 2021, 23, 1396. [Google Scholar] [CrossRef] [PubMed]
- Choi, S.Y. Analysis of stock market efficiency during crisis periods in the US stock market: Differences between the global financial crisis and COVID-19 pandemic. Phys. Stat. Mech. Appl. 2021, 574, 125988. [Google Scholar] [CrossRef]
- Mensi, W.; Hamdi, A.; Yoon, S.M. Modelling multifractality and efficiency of GCC stock markets using the MF-DFA approach: A comparative analysis of global, regional and Islamic markets. Phys. A Stat. Mech. Appl. 2018, 503, 1107–1116. [Google Scholar] [CrossRef]
- Han, C.; Wang, Y.; Ning, Y. Analysis and comparison of the multifractality and efficiency of Chinese stock market: Evidence from dynamics of major indexes in different boards. Phys. A Stat. Mech. Appl. 2019, 528, 121305. [Google Scholar] [CrossRef]
- Mensi, W.; Tiwari, A.K.; Al-Yahyaee, K.H. An analysis of the weak form efficiency, multifractality and long memory of global, regional and European stock markets. Q. Rev. Econ. Financ. 2019, 72, 168–177. [Google Scholar] [CrossRef]
- Cho, P.; Lee, M. Forecasting the Volatility of the Stock Index with Deep Learning Using Asymmetric Hurst Exponents. Fractal Fract. 2022, 6, 394. [Google Scholar] [CrossRef]
- Mensi, W.; Vo, X.V.; Kang, S.H. Upward/downward multifractality and efficiency in metals futures markets: The impacts of financial and oil crises. Resour. Policy 2022, 76, 102645. [Google Scholar] [CrossRef]
- Zhuang, X.; Wei, D. Asymmetric multifractality, comparative efficiency analysis of green finance markets: A dynamic study by index-based model. Phys. A Stat. Mech. Appl. 2022, 604, 127949. [Google Scholar] [CrossRef]
- Bonanno, G.; Caldarelli, G.; Lillo, F.; Micciche, S.; Vandewalle, N.; Mantegna, R.N. Networks of equities in financial markets. Eur. Phys. J. B 2004, 38, 363–371. [Google Scholar] [CrossRef]
- Kuang, P.C. Measuring information flow among international stock markets: An approach of entropy-based networks on multi time-scales. Phys. A Stat. Mech. Appl. 2021, 577, 126068. [Google Scholar] [CrossRef]
- Shin, K.H.; Lim, G.; Min, S. Dynamics of the Global Stock Market Networks Generated by DCCA Methodology. Appl. Sci. 2020, 10, 2171. [Google Scholar] [CrossRef]
- Balcı, M.A.; Batrancea, L.M.; Akgüller, O.; Nichita, A. Coarse Graining on Financial Correlation Networks. Mathematics 2022, 10, 2118. [Google Scholar] [CrossRef]
- Alves, L.G.; Sigaki, H.Y.; Perc, M.; Ribeiro, H.V. Collective dynamics of stock market efficiency. Sci. Rep. 2020, 10, 1–10. [Google Scholar] [CrossRef]
- Shannon, C.E. A mathematical theory of communication. Bell Syst. Tech. J. 1948, 27, 379–423. [Google Scholar] [CrossRef]
- Aranganayagi, S.; Thangavel, K. Clustering Categorical Data Using Silhouette Coefficient as a Relocating Measure. In Proceedings of the International Conference on Computational Intelligence and Multimedia Applications (ICCIMA 2007), Sivakasi, India, 13–15 December 2007; Volume 2, pp. 13–17. [Google Scholar]
- Page, L.; Brin, S.; Motwani, R.; Winograd, T. The PageRank Citation Ranking: Bringing Order to the Web; Technical Report 1999-66; Stanford InfoLab: Stanford, CA, USA, 1999. [Google Scholar]
- Kendall, M.G. A new measure of rank correlation. Biometrika 1938, 30, 81–93. [Google Scholar] [CrossRef]
- Rand, W.M. Objective criteria for the evaluation of clustering methods. J. Am. Stat. Assoc. 1971, 66, 846–850. [Google Scholar] [CrossRef]


| Mean | Stdev | Skewness | Kurtosis | ARCH (10) | ARCH (20) | Augmented Dickey–Fuller | |
|---|---|---|---|---|---|---|---|
| S&P 500 | 0.07 | 1.55 | 0.16 | 3.53 | 230.1 *** | 250.07 *** | −29.91 *** |
| Dow Jones Industrial Average | 0.03 | 1.22 | −0.49 | 16.05 | 1262.23 *** | 1311.84 *** | −15.14 *** |
| NASDAQ Composite | 0.05 | 1.38 | −0.50 | 9.24 | 998.5 *** | 1045.3 *** | −14.49 *** |
| NYSE Composite Index | 0.02 | 1.32 | −0.68 | 13.41 | 1225.34 *** | 1295.24 *** | −14.79 *** |
| NYSE American Composite Index | 0.01 | 1.31 | −1.00 | 16.49 | 984.88 *** | 1161.64 *** | −15.2 *** |
| Russell 2000 | 0.03 | 1.62 | −0.66 | 8.60 | 1146.88 *** | 1214.77 *** | −14.73 *** |
| Vix | 0.00 | 7.70 | 1.05 | 6.14 | 192.18 *** | 195.78 *** | −25.58 *** |
| FTSE 100 | 0.00 | 1.20 | −0.41 | 10.03 | 788.14 *** | 834.46 *** | −23.79 *** |
| DAX PERFORMANCE-INDEX | 0.02 | 1.39 | −0.23 | 8.39 | 583.26 *** | 674.27 *** | −22.63 *** |
| CAC 40 | 0.01 | 1.42 | −0.28 | 8.25 | 628.1 *** | 688.32 *** | −23.59 *** |
| ESTX 50 PR.EUR | 0.00 | 1.43 | −0.32 | 7.99 | 589.85 *** | 613.74 *** | −29.08 *** |
| EURONEXT 100 | 0.01 | 1.30 | −0.38 | 9.10 | 692.21 *** | 759.31 *** | −23.48 *** |
| BEL 20 | −0.00 | 1.30 | −0.65 | 10.77 | 584.09 *** | 614.49 *** | −12.24 *** |
| Nikkei 225 | 0.01 | 1.47 | −0.45 | 8.38 | 1054.16 *** | 1098.86 *** | −63.39 *** |
| HANG SENG INDEX | 0.00 | 1.48 | −0.03 | 8.96 | 997.94 *** | 1106.29 *** | −10.72 *** |
| SSE Composite Index | 0.00 | 1.53 | −0.61 | 5.44 | 408.67 *** | 472.35 *** | −12.97 *** |
| Shenzhen Component | 0.02 | 1.78 | −0.55 | 3.45 | 364.1 *** | 426.68 *** | −14.66 *** |
| S&P/ASX 200 | 0.01 | 1.12 | −0.69 | 7.80 | 1129.81 *** | 1175.54 *** | −14.4 *** |
| ALL ORDINARIES | 0.01 | 1.07 | −0.66 | 9.66 | 768.79 *** | 817.83 *** | −37.55 *** |
| S&P BSE SENSEX | 0.04 | 1.37 | −0.21 | 13.61 | 543.65 *** | 561.24 *** | −11.96 *** |
| Jakarta Composite Index | 0.03 | 1.27 | −0.58 | 9.61 | 508.49 *** | 614.77 *** | −18.47 *** |
| S&P/NZX 50 INDEX GROSS | 0.03 | 0.74 | −0.65 | 8.21 | 886.56 *** | 947.68 *** | −21.0 *** |
| KOSPI Composite Index | 0.02 | 1.23 | −0.55 | 10.44 | 966.23 *** | 990.46 *** | −12.24 *** |
| TSEC weighted index | 0.02 | 1.14 | −0.42 | 5.11 | 488.16 *** | 541.14 *** | −14.08 *** |
| S&P/TSX Composite index | 0.01 | 1.15 | −1.08 | 20.75 | 1126.95 *** | 1262.88 *** | −11.45 *** |
| IBOVESPA | 0.02 | 1.74 | −0.44 | 10.17 | 1174.02 *** | 1267.65 *** | −26.78 *** |
| IPC MEXICO | 0.02 | 1.18 | −0.02 | 7.29 | 724.97 *** | 843.78 *** | −27.88 *** |
| MERVAL | 0.10 | 2.32 | −2.67 | 50.22 | 37.67 *** | 58.42 *** | −61.87 *** |
| TA-125 | 0.02 | 1.09 | −1.17 | 12.07 | 466.91 *** | 527.72 *** | −18.56 *** |
| Average | 0.02 | 1.58 | −0.52 | 11.01 | - | - | - |
| Cluster | Market | Country |
|---|---|---|
| 1 | FTSE 100 | United Kingdom |
| DAX PERFORMANCE-INDEX | Germany | |
| 2 | BEL 20 | Belgium |
| 3 | CAC 40 | France |
| EURONEXT 100 | France | |
| 4 | IPC MEXICO | Mexico |
| 5 | S&P 500 | United States |
| 6 | SSE Composite Index | China |
| Shenzhen Component | China | |
| 7 | Dow Jones Industrial Average | United States |
| NYSE Composite Index | United States | |
| 8 | NASDAQ Composite | United States |
| Russell 2000 | United States | |
| 9 | S&P/ASX 200 | Australia |
| ALL ORDINARIES | Australia | |
| 10 | Nikkei 225 | Japan |
| MERVAL | Argentina | |
| 11 | TA-125 | Israel |
| 12 | TSEC weighted index | Taiwan |
| IBOVESPA | Brazil | |
| 13 | Jakarta Composite Index | Indonesia |
| KOSPI Composite Index | Republic of Korea | |
| 14 | HANG SENG INDEX | Hong Kong |
| S&P/TSX Composite index | Canada | |
| 15 | S&P BSE SENSEX | India |
| NYSE American Composite Index | United States | |
| Vix | United States |
Publisher’s Note: MDPI stays neutral with regard to jurisdictional claims in published maps and institutional affiliations. |
© 2022 by the authors. Licensee MDPI, Basel, Switzerland. This article is an open access article distributed under the terms and conditions of the Creative Commons Attribution (CC BY) license (https://creativecommons.org/licenses/by/4.0/).
Share and Cite
Cho, P.; Kim, K. Global Collective Dynamics of Financial Market Efficiency Using Attention Entropy with Hierarchical Clustering. Fractal Fract. 2022, 6, 562. https://doi.org/10.3390/fractalfract6100562
Cho P, Kim K. Global Collective Dynamics of Financial Market Efficiency Using Attention Entropy with Hierarchical Clustering. Fractal and Fractional. 2022; 6(10):562. https://doi.org/10.3390/fractalfract6100562
Chicago/Turabian StyleCho, Poongjin, and Kyungwon Kim. 2022. "Global Collective Dynamics of Financial Market Efficiency Using Attention Entropy with Hierarchical Clustering" Fractal and Fractional 6, no. 10: 562. https://doi.org/10.3390/fractalfract6100562
APA StyleCho, P., & Kim, K. (2022). Global Collective Dynamics of Financial Market Efficiency Using Attention Entropy with Hierarchical Clustering. Fractal and Fractional, 6(10), 562. https://doi.org/10.3390/fractalfract6100562