Article

Fractal Analysis for Fatigue Crack Growth Rate Response of Engineering Structures with Complex Geometry

by
Mudassar Hussain Hashmi
1,
Seyed Saeid Rahimian Koloor
2,3,
Mohd Foad Abdul-Hamid
1 and
Mohd Nasir Tamin
1,*
1
Faculty of Engineering, School of Mechanical Engineering, Universiti Teknologi Malaysia, Johor Bahru 81310, Malaysia
2
Institute for Structural Engineering, Department of Civil Engineering and Environmental Sciences, Universität der Bundeswehr München, Werner-Heisenberg-Weg 39, Neubiberg, 85579 Munich, Germany
3
Institute for Nanomaterials, Advanced Technologies and Innovation, Technical University of Liberec, Studentská 2, 461 17 Liberec, Czech Republic
*
Author to whom correspondence should be addressed.
Fractal Fract. 2022, 6(11), 635; https://doi.org/10.3390/fractalfract6110635
Submission received: 23 September 2022 / Revised: 22 October 2022 / Accepted: 25 October 2022 / Published: 1 November 2022
(This article belongs to the Special Issue Fractal Mechanics of Engineering Materials)

Abstract

:
A growing fatigue crack in metallic materials and structures exhibits multifractal features that inherit signatures of the crack growth rate behavior of the material. This study exploits the recently established multifractal fatigue crack growth model to quantify the characteristic fatigue crack growth rate response of the AISI 410 martensitic stainless steel using an L-shaped bell crank structure. The objective is to demonstrate that the fatigue crack growth rate response of the material could be established by quantifying the fractality of the growing crack. The fractal approach avoids the need of the crack geometry factor when calculating the crack tip driving force. The fractal analysis of the crack image employs the box-counting algorithm to determine the fractal dimension along the edge of the crack length. The analysis is confined to the power law crack growth rate stage (Paris crack growth regime). Results show that the fatigue crack growth path in the bell crank structure is dictated by the Mode I (opening) component of the crack loading. The distribution of fractal-based fatigue crack growth rate data is within the 99% confidence limit of the median crack growth response by the Paris equation. Thus, the model could be employed for prediction of the fatigue crack growth response of engineering structures where the crack geometry factor is not readily available.

1. Introduction

Load-bearing and complex geometry structures such as aircraft wing spars, thick-walled chemical-processing vessels, and offshore platform and jacket structures are designed based on damage-tolerant design philosophy. The design employs fracture mechanics and test data to ensure that structural cracks nucleating during the operation will not propagate before they are detected by periodic inspections. The fracture-mechanics equation describing the crack tip stress field (K-field) is expressed in terms of the far-field stress and relies on the crack geometry factor. Closed-form equations for the far-field stress and the crack geometry factor have been established for standard fracture test coupons and relatively simple structures [1,2,3]. The unavailability of the crack geometry factor for complex structures and loading renders the use of the fracture mechanics equation impractical. In this respect, the finite element (FE) method for continuum domain is extended (to XFEM) to address the numerical singularity associated with the crack tip stress field [4]. The virtual crack closure technique (VCCT) has also been implemented to address the crack growth in interfaces of laminated composites and adhesives [5,6,7,8,9,10,11,12]. A relatively new approach employing fractal analysis to quantify the fatigue crack growth rates of single-phase metallic material has been developed by the authors [13]. Application of the analysis method to the general structures that lack the crack geometry factor for fatigue crack growth analysis is deliberated in this paper. Inaccurate assessment of the fatigue crack and crack growth rates could jeopardize the safety and integrity of the structures.
Fatigue crack growth response of metallic structures has been quantified by several approaches. At the material coupon level, fracture-mechanics tests using standard specimen geometry and test setup provide crack growth data as a function of the applied fatigue loading. The phenomenological fatigue crack growth rates, d a d N , within the range that exhibit the power-law response (Stage 2), could be expressed as functions of the stress intensity factor range, Δ K , as [14]:
d a d N = C [ Δ K   ] n
where
Δ K = Δ σ   π a   Y ( a W )
The crack tip driving force, Δ K , assumes the value of Δ K I or Δ K I I under the Mode I (opening) or Mode II (shearing) crack tip loading, respectively. The term Δ σ is the remotely applied stress range, a is the crack length, and Y ( a W ) is the crack geometry factor of the test specimen. The coefficient C and exponent n are curve-fitting parameters. Variations of Equations (1) and (2) to account for the mean stress effect have been established [15,16,17,18,19,20,21,22,23,24,25]. These models could also represent the threshold crack growth rate (Stage 1) and the fast fracture regime (Stage 3). However, the unavailability of the crack geometry factor for calculating the stress intensity factor range Δ K of Equation (2) for numerous structural members poses the greatest challenge in establishing the crack growth rate response of the material. In this respect, several numerical approaches employing the FE method have been examined in quantifying Δ K of a structural crack. FE modeling inaccuracies resulting from ill-defined loading conditions, specifically in multiple crack systems, have been discussed and documented [26]. For a stationary crack, the contour integral (CI) method specifies the crack front and the virtual crack extension direction to determine the fracture parameters including the J-integral, stress intensity factor, T-stress, and the crack propagation direction [27]. The method has been employed to establish K-solutions for a crack in pressure vessels [28]. The virtual crack closure technique (VCCT) calculates the energy release rates based on results from continuum FE analysis to predict the fracture event [29,30]. The technique is commonly employed to establish strain energy release rates in delamination problems [7,8]. The extended FE method (XFEM) improves the approximation of the local displacement field by adding an enrichment function to the standard shape function [4]. The method has been used in numerous problems including multiple crack systems [31,32], elastic-plastic fracture [33], and stress intensity calculations [34,35].
A crack in a continuum is created through the breaking of the bonds between atoms in the atomic structure under the imposed stress field. In a growing fatigue crack, a tortuous topology of various degrees is exhibited in the wake of the crack. The different observed morphology of the crack surface and along the edge is manifested by the different intensity of the crack tip stress field. Studies have demonstrated that the crack edges along the crack length could be described as a fractal continuum exhibiting multifractal characteristics at the mesoscale [36,37,38,39,40,41,42,43]. The crack paths are self-affine and exhibit an intrinsically anomalous roughness [44]. The characteristic fractality of the continuum is quantified in terms of the fractal dimension. It quantifies the effect of the crack tip stress field The characteristic fractal dimension, d F , along the edge of a fatigue crack has been correlated with the increasing stress intensity factor range ( Δ K ) as the crack grows. A linear relationship between Δ K and d F has been established by authors through a series of fatigue crack growth tests on compact tension (C(T)) specimen geometry [13]. Consequently, the crack tip driving force could be determined by analyzing the signature fractal features of the propagating fatigue crack. This eliminates the dependence on the crack geometry factor, Y ( a W ) , of Equation (2) and extends Equation (1) to determine the fatigue crack growth rate of a cracked structure with relatively complex geometry.
The development of the multifractal fatigue crack growth rate model based on measured data using standard compact tension C(T) specimen geometry is deliberated in the authors’ previous work [13]. The fractal dimensions of the fatigue crack are correlated with the crack tip driving force for the C(T) specimen with the known crack geometry factor. The applicability of the model to predict the fatigue crack growth rate response of a crack in a general structure where the crack geometry factor is unavailable has yet to be demonstrated. This paper examines the multifractal fatigue crack growth model developed earlier for an engineering structure with complex geometry and/or crack loading where the crack geometry factor is unavailable. The objective is to demonstrate that the resulting fatigue crack growth rate, being a material property, is comparable with those determined using the standard test specimen geometry. The case study uses a bell crank geometry with a fatigue crack experiencing a general plane stress field. Once a comparative crack growth rate response is established, the validated multifractal-based model could be employed in predicting the fatigue crack growth behavior in structures with complex geometry.

2. Multifractal Fatigue Crack Growth Model

A propagating fatigue crack in a metallic material leaves an intrinsic fracture surface morphology corresponding to the magnitude of the crack tip driving force. The crack is multifractal along the edges; thus, the quantitative description requires a range of fractal dimensions. The multifractal features are also influenced by the local microstructural features along the crack path, such as the impurity particle inclusion, type of grain and its orientation, and grain boundary. The observed multifractal nature of a fatigue crack and its postulated one-to-one dependency with the crack tip driving force is central to the multifractal fatigue crack growth model. Although it has not been reported, if a fatigue crack is monofractal, then it is described by a single fractal dimension at any stage of the crack growth. In this case, the (multi)fractal fatigue crack growth model, as examined in this work, is not applicable for the material because the relationship between fractal dimension and crack tip driving force is unavailable.
The fatigue crack growth rate behavior of metallic materials is quantified in terms of the crack growth rate d a d N vs. the stress intensity factor range Δ K . While the growth rate is extracted from the incremental slope of the crack growth curve (a vs. N), the corresponding Δ K is calculated using Equation (2) with the respective crack geometry factor of the test specimen used. In the absence of the crack geometry factor, fractal analysis of the fatigue crack offers an alternative approach. The fractal dimension of the crack corresponding to the position of the crack tip is correlated to the crack tip driving force Δ K . The resulting multifractal crack tip driving force is expressed in the normalized form as [13]:
Δ K K IC = Δ K th K IC + C F d F F
where Δ K th is the threshold stress intensity factor range and K IC is the fracture toughness of the material. The term d F F is the fractional fractal dimension at the crack tip defined as d F F = d F d E ,   d F is the characteristic fractal dimension, and d E is the Euclidean dimension ( d E = 1.0 for a linear crack). The coefficient of fractality, C F , is a material parameter determined through curve-fitting procedures on measured data.
Equations (1) and (3) are combined to yield the multifractal fatigue crack growth rate model as:
d a d N = C   [ Δ K th + C F ( d F d E ) K IC ] n
It is worth noting that this model is applicable for describing the phenomenological fatigue crack growth behavior in the power-law crack growth rate regime. In addition, in its current form, the model is calibrated for the predominantly Mode I crack loading.

3. Materials and Experimental Methods

The material employed in this study is an AISI 410 martensitic stainless steel in the as-received condition with hardness, H V   = 268. The chemical composition (in wt.%) is: 0.15C, 0.35Si, 0.495Mn, 0.027P, 0.002S, 12.40Cr, 0.08Mo, the balance being Fe. The material exhibits randomly oriented plates and needle-like microstructure as shown in Figure 1. The mechanical and fatigue fracture properties of the steel are listed in Table 1.
The reference fatigue crack growth rate behavior of the material has been established using compact tension C(T) specimen geometry [13]. The threshold stress intensity factor range Δ K th is listed in Table 1. The Stage 2 fatigue crack growth rate regime spans within the range of 4 × 10 5   < d a d N < 5 × 10 4 mm/cycle, while the corresponding stress intensity factor range varies from 18 to 40 MPa m , respectively. Within this regime, the median fatigue crack growth rate is represented by the Paris equation, Equation (1), as:
d a d N = 6.53 × 10 9   ( Δ K I ) 3.04   mm / cycle
The unit of Δ K I is in MPa m .
The complex geometry structure employed in this study is represented by an L-shaped bell crank design, as illustrated in Figure 2a. The thickness of the bell crank plate structure is 20 mm. The sharp notch is designed to facilitate the formation of an initial crack of length 30.0 mm (measured from the load line) during the precracking procedure. The presence of a straight-through hole ahead of the initial crack tip is designed to simulate the development of a mixed-mode crack tip loading as the crack grows. In addition, the complex stress field would also dictate the crack path under the fatigue loading.
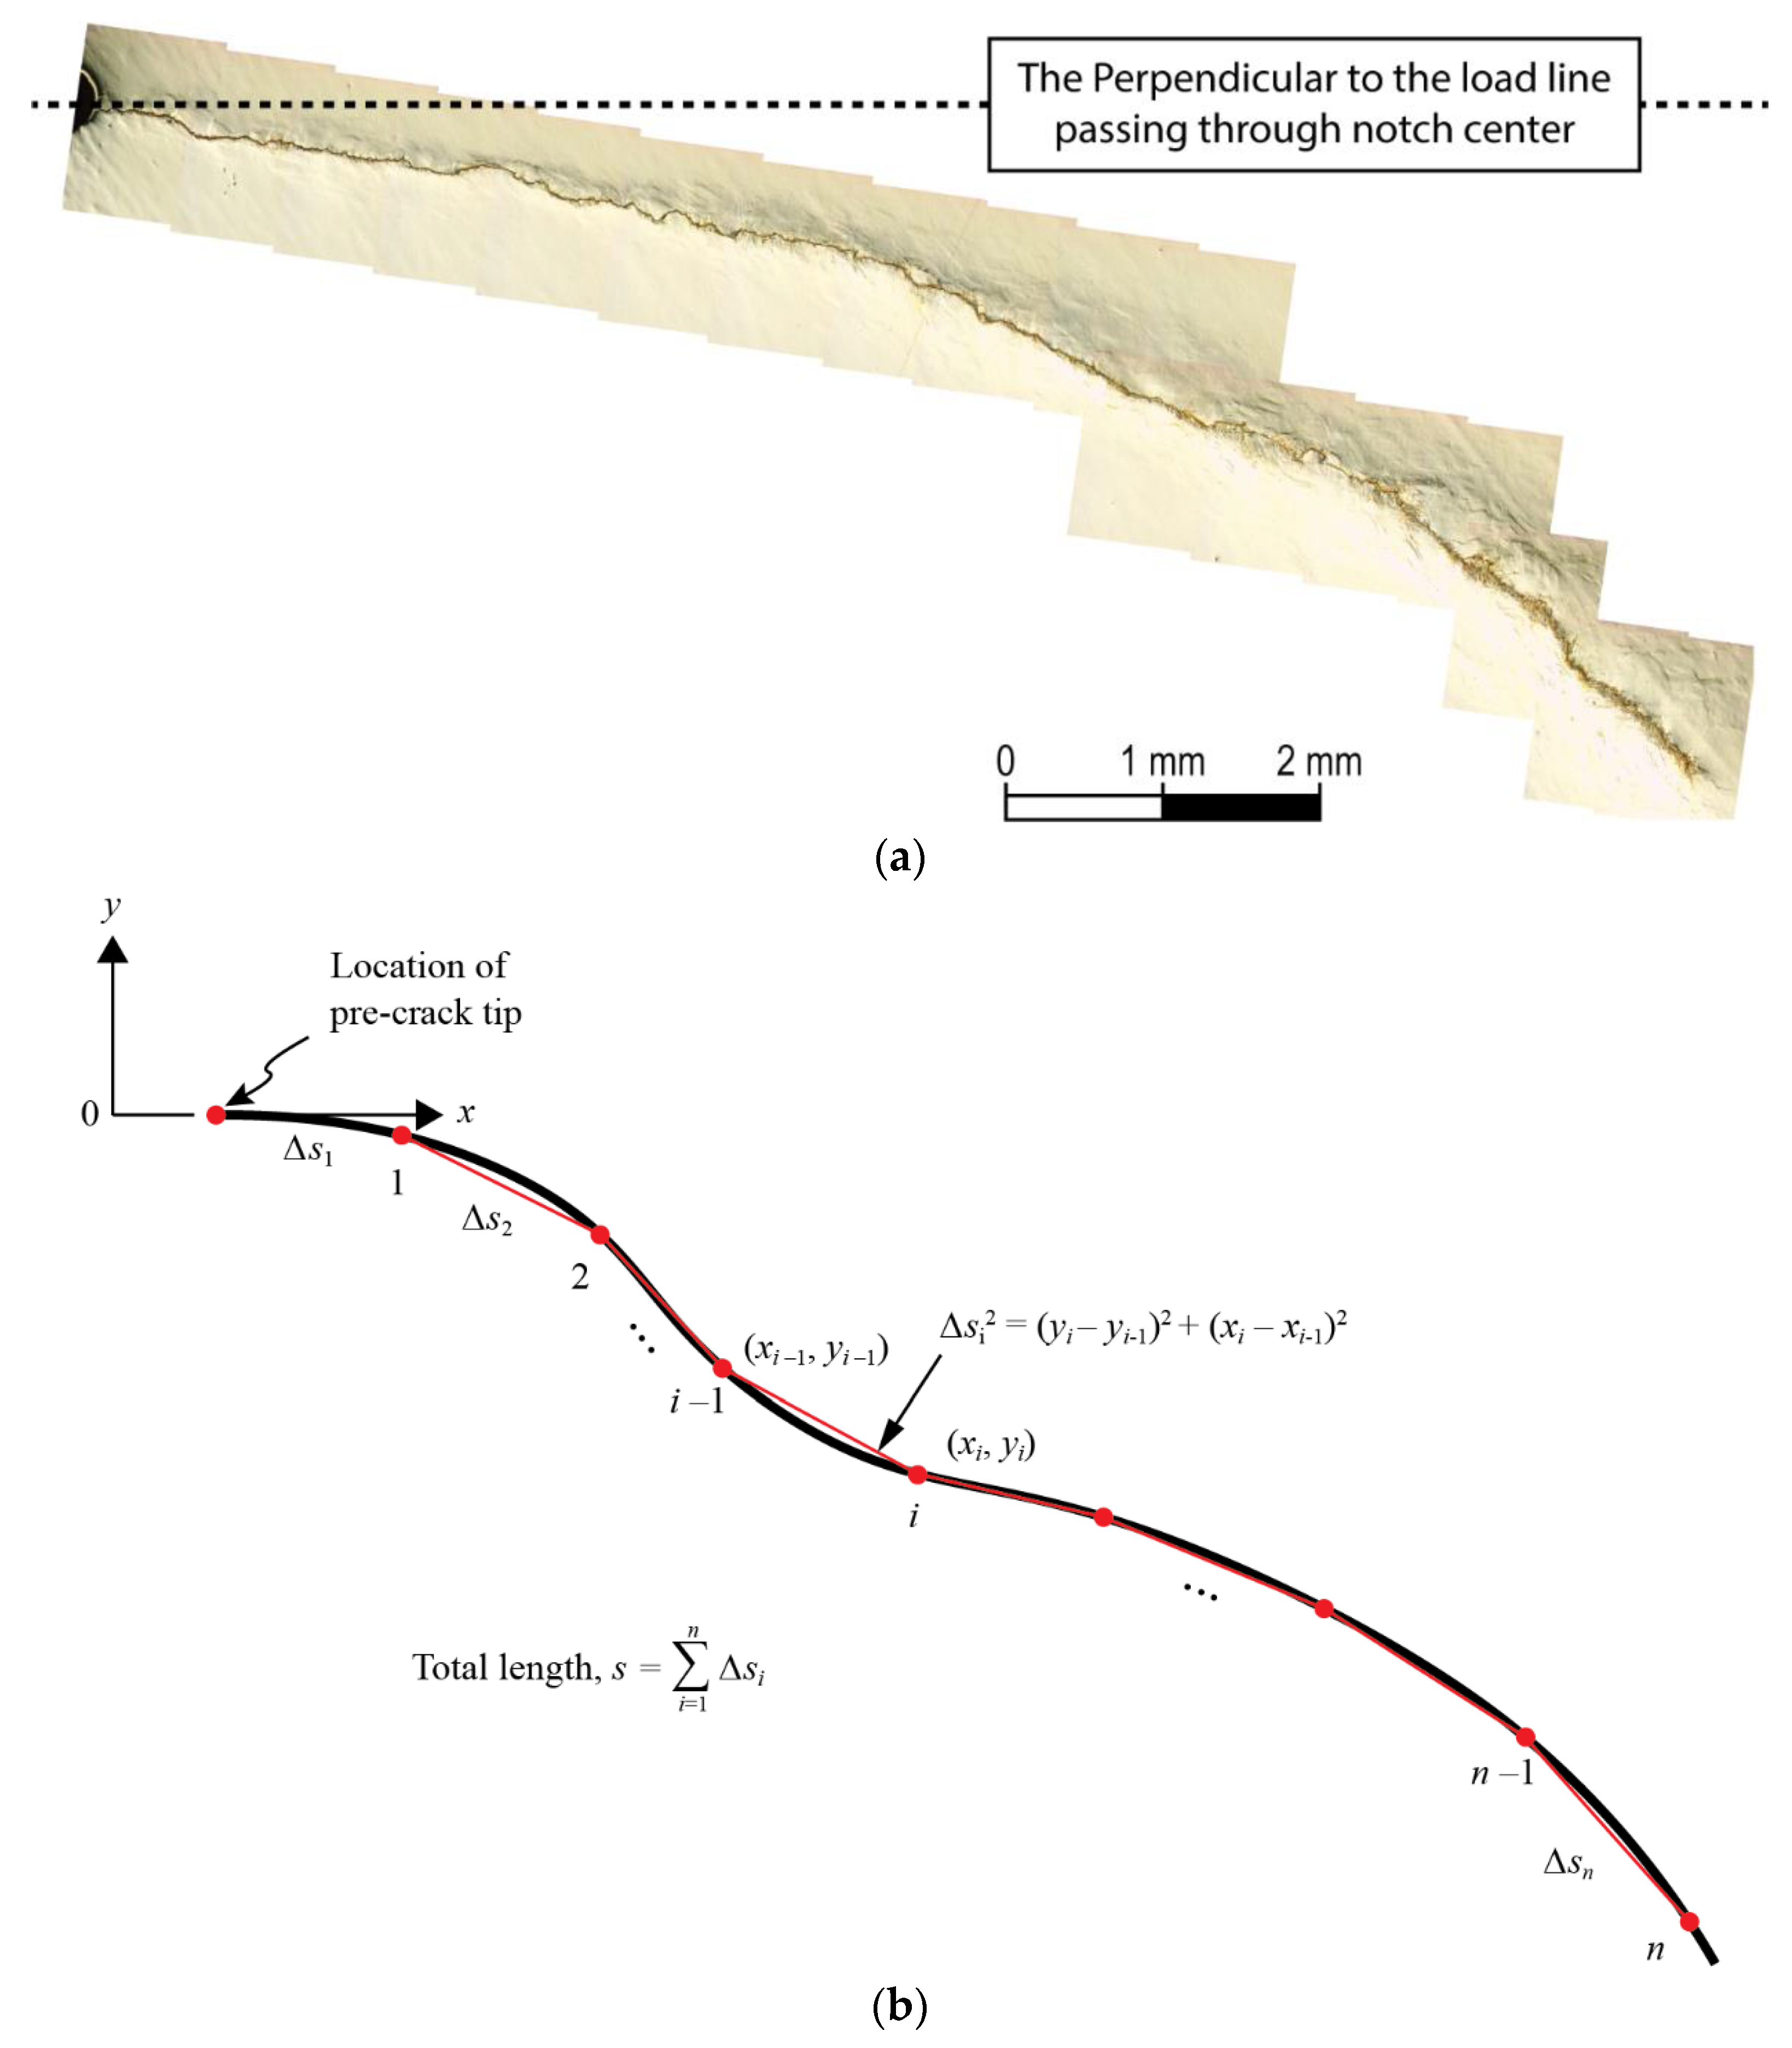
Fatigue crack growth test of the bell crank structure is performed under load-controlled mode in the Shimadzu 100 kN servo-hydraulic dynamic testing machine with the setup as shown in Figure 2b. The applied fatigue loading consists of ( Δ P = 5.40   kN ,   R = 0.1 ) with the loading frequency of 10 Hz. The test is paused momentarily, and the crack tip location is identified at 17 selected load cycle intervals. Simultaneously, the crack tip image is recorded at 50X magnification using a travelling microscope. At the end of the fatigue test, the bell crank structure is unloaded and removed from the machine. The image of the crack is taken using an Olympus BX51M digital microscopic camera at 100X magnification with a resolution of 1090 pixel/mm. The resulting composite image of the crack is shown in Figure 3a. The growing length of the crack, a is measured from the load line and following the curved path of the growing crack, as illustrated in the Figure 3b. The test is terminated when the growing fatigue crack is in proximity with the edge of the structure such that the crack tip stress field is affected by the traction-free edge.
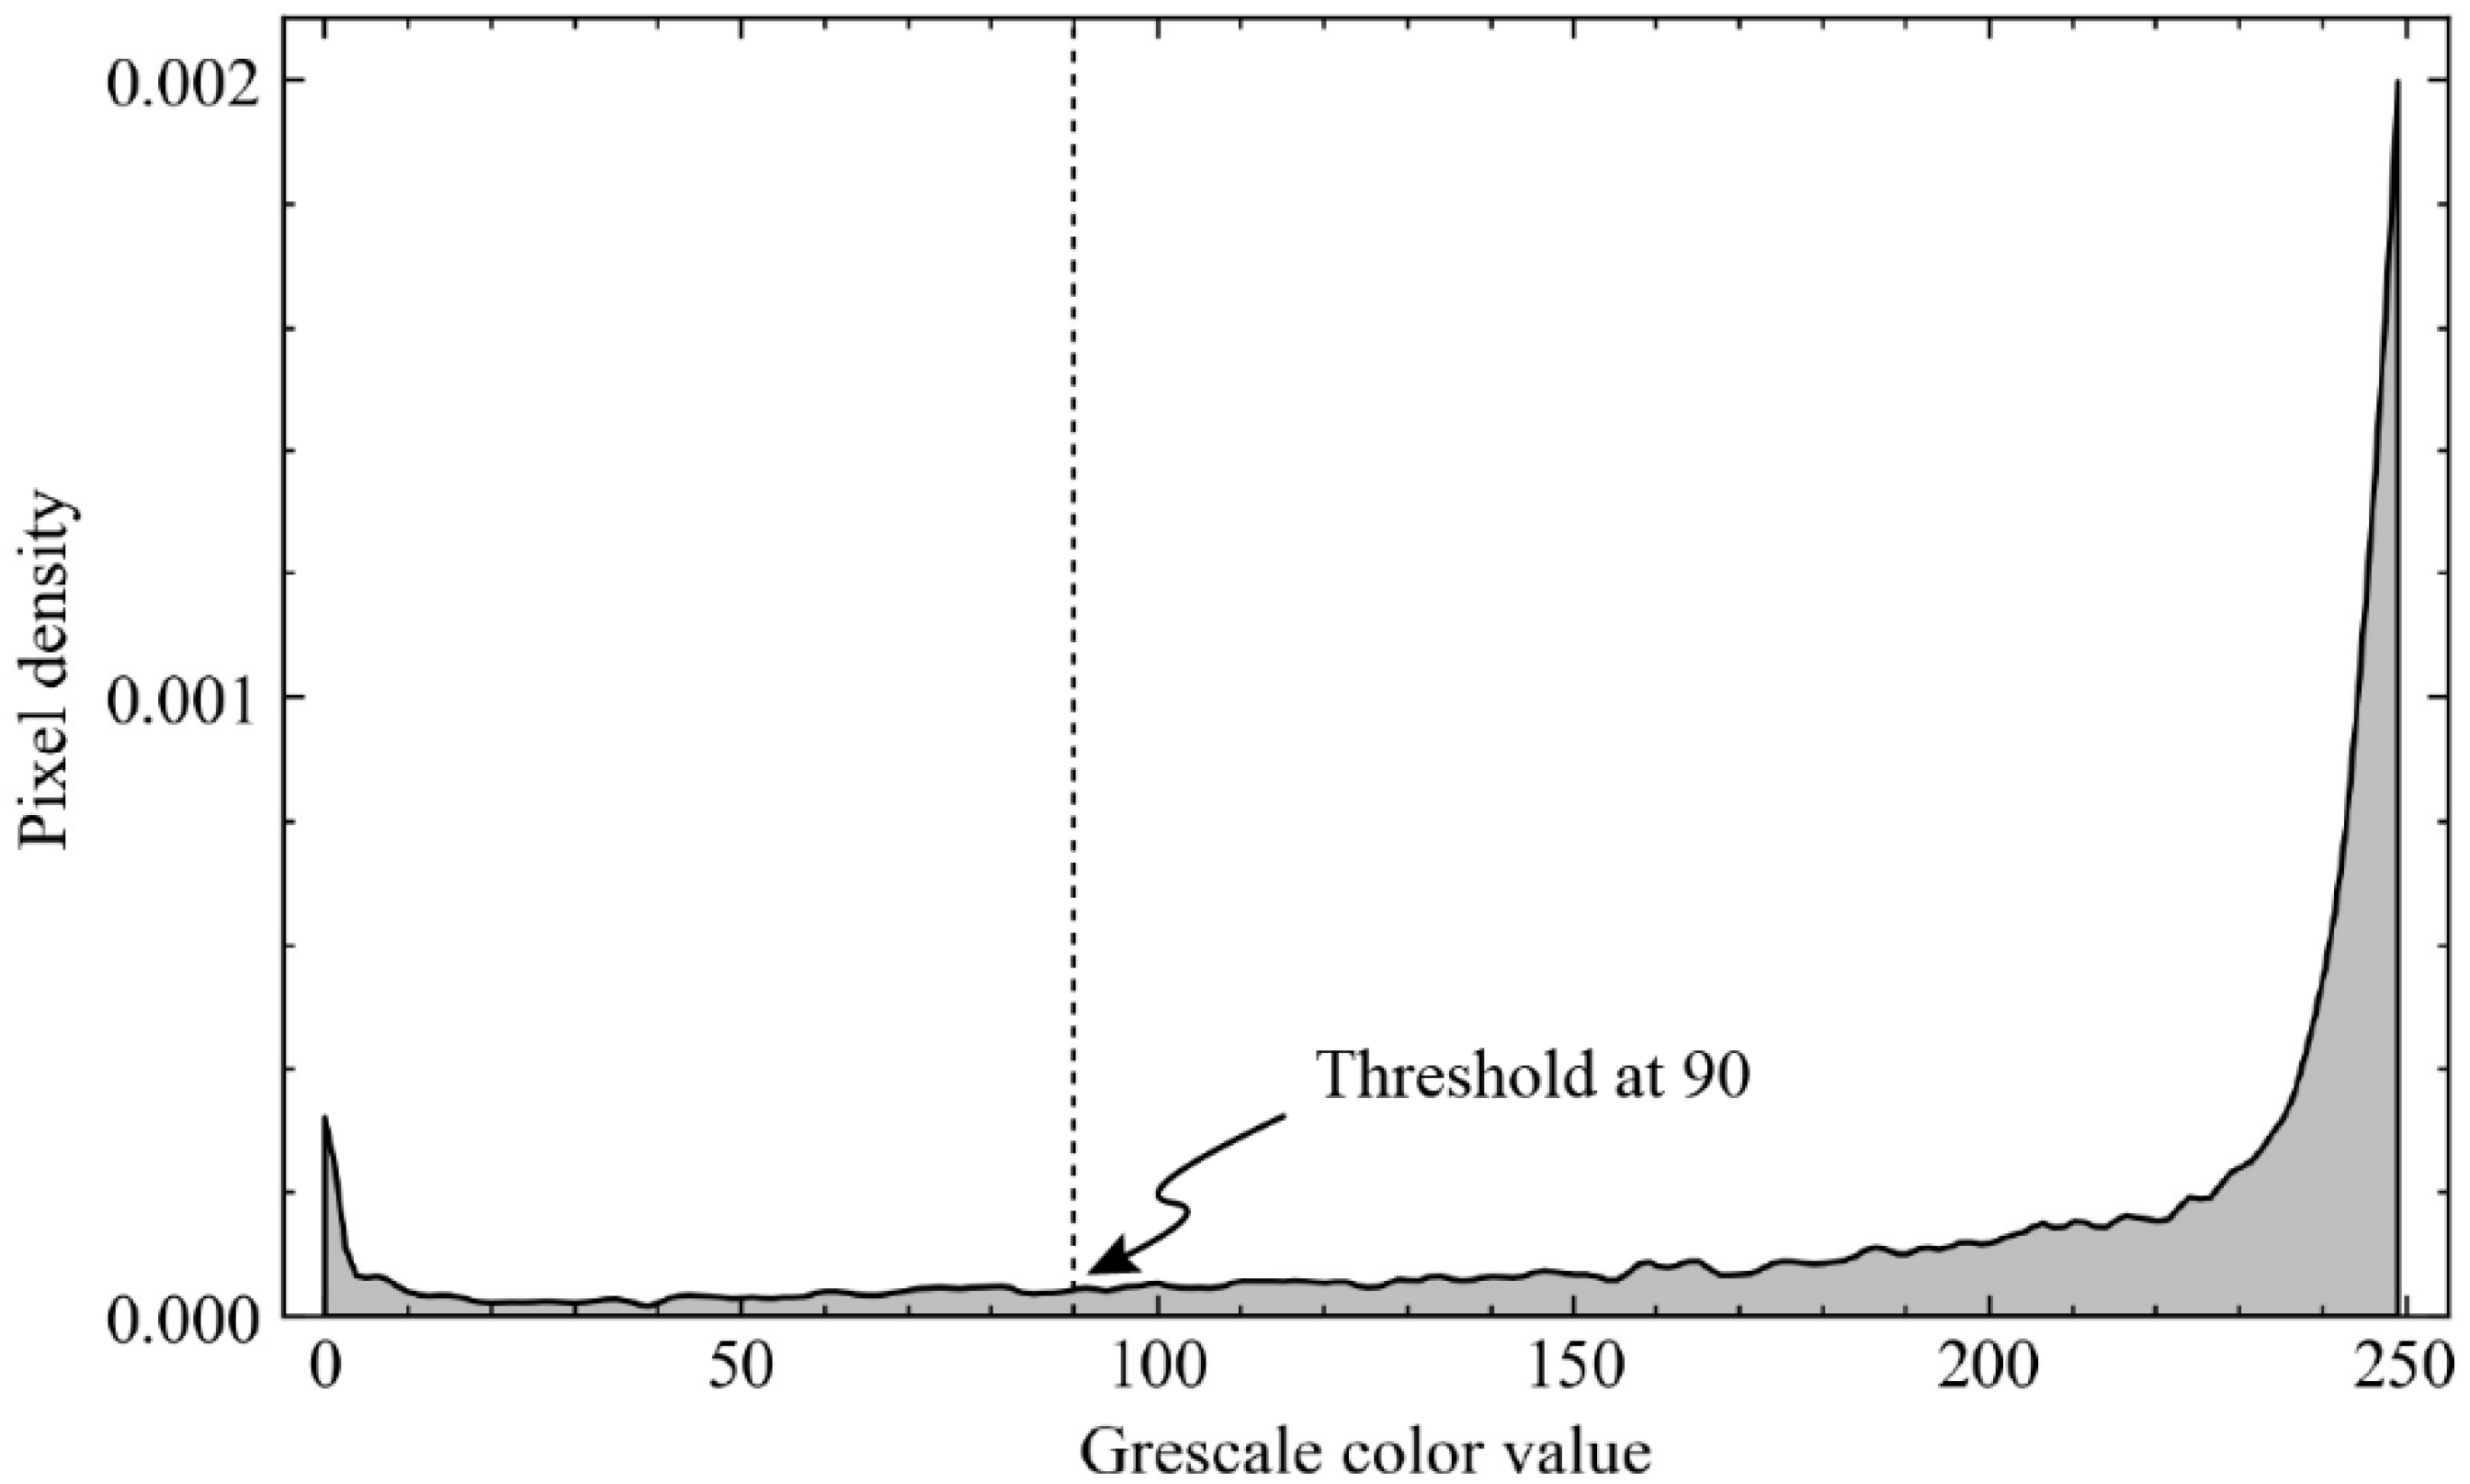
The crack image is processed to quantify the fractality of the fatigue crack using the procedures developed earlier and described in adequate details elsewhere [13]. The OTSU greyscale thresholding algorithm is used to differentiate the crack from its background [45]. The resulting bimodal distribution of the greyscale values of the crack image is shown in Figure 4. The observed two well-separated peaks, the left representing pixel densities of the crack while the right is of the material, ensure the existence of the desired contrast between the crack edge and the background pixels. Based on this distribution, the threshold grayscale value is taken at 90. Image partitioning scheme with optimized scanning parameters of the window size, Δ max   = 0.117 mm and increment, Ψ min   = 0.939 mm are employed to establish the local variation in the fractal dimension. The box-counting algorithm, based on the Minkowski-Bouligand method is then employed to determine the piecewise fractality [46,47]. In this method, a square grid of size, ϵ is superimposed on the binary image of the crack. The grid having side length overlapping the crack edge are counted as N B . The process is repeated with smaller grid until the grid spacing approaches the digitization resolution. The fractal dimension, d F is defined as the (negative) slope of the log 2 N B vs. log 2 ϵ curve, as illustrated in Figure 5. Once the fractal dimension value at the respective crack length is obtained, the corresponding crack tip driving force and the fatigue crack growth rate can be calculated using Equations (3) and (4), respectively.
This paper shall demonstrate that the predicted fatigue crack growth rate of the material based on the fractality of the crack (Equation (4)) is comparable to that obtained by the classical Paris equation (Equation (1)). Thus, the multifractal fatigue crack growth model could be used for the general structures, without requiring the crack geometry factor when calculating the crack tip driving force.

4. Results and Discussion

The measured and analyzed data of the L-shaped bell crank structure are presented and discussed in terms of the measured fatigue crack growth behavior, evolution of the fractal dimension, and the predicted fatigue crack growth rate response of the material.

4.1. Fatigue Crack Growth Behavior

The torturous crack growth path in the L-shaped bell crank structure is shown in Figure 3a. The crack deviates away from the direction perpendicular to the applied load line, forming a curved path. The crack path deviation occurs at early loading stage and indicates that the crack tip is driven by a mix-mode loading of Mode I (opening) and Mode II (shearing). The crack path curves downward in response to the higher stress magnitude in favor of the crack growth in the lower part of the asymmetrical bell crank. The measured fatigue crack growth curves of the bell crank structure and of a standard compact tension specimen [13] are shown in Figure 6. Although the test condition is identical (∆P = 5.4 kN, R = 0.1, f = 10 Hz), a one-to-one comparison of these curves is inappropriate. This is due to the different crack tip loading conditions and geometry of the structures, therefore a different crack geometry factor, which results in different crack tip driving force. However, the evolution of the crack length (aa0) shows a similar exponentially increasing trend with the accumulated load cycles N. In addition, the incremental fatigue crack growth rate could be computed based on the local slope of the curve, as recommended in ASTM E647 standard [48]. The higher initial slope of the curve for the bell crank structure suggests that the starting crack tip driving force is higher, likely due primarily to longer initial crack length compared to the C(T) specimen. While acknowledging the intrinsic scatter of the fatigue data, the rough measured curved crack path is attributed to the observed torturous crack morphology under the operating mix-mode loading of the crack tip in the bell crank structure.

4.2. Fractal Dimensions of the Fatigue Crack

The variation of the computed local fractal dimensions along the edge length of the crack is shown in Figure 7. The scatter of the fractal data is typical for measured fatigue life data. Fractal dimension value of 1.0 represents the Euclidean crack. Results show that the crack starts with a relatively smooth morphology, ( d F 1.0 ) and gradually grows and exhibits a rough morphology as quantified by the fractal dimension of up to 1.18. In addition, the fractal dimension increases nonlinearly and in the same manner as the crack length with the applied fatigue cycles (refer to Figure 6). The continuously increasing driving force at the crack tip results in increasing roughness of the fracture surface morphology and along the crack edges. The nonlinearity of the resulting fractal dimensions with the crack growth is an intrinsic characteristic and likely attributed to the microstructural features including the grain size, grain orientation, and distribution of second phase particles. The observed similar nonlinear trend of increasing crack length and fractal dimension with the applied fatigue cycles suggests that the multifractality of the crack is indicative of the operating crack tip driving force. This suggests that the fractal dimension is an appropriate parameter to describe the fatigue crack growth response of the materials and structures. Once d F is quantified for a given crack length, a the crack tip driving force, Δ K could be determined from Equation (3) without requiring the crack geometry factor. The corresponding fatigue crack growth rate, d a d N could be established based on the crack growth curve of the structure as shown in Figure 6.

4.3. Multifractal Fatigue Crack Growth Rate

Fatigue crack growth rate data from the test performed on compact tension C(T) specimen of the case study material are shown as hollow-circle symbols in Figure 8. The regression (solid) line represents the least-squared fit of all data points in the Paris crack growth regime, as expressed by Equation (5). In addition, the data are normally distributed in the log-log scale plot with the 99% confidence band as shown by the pair of dashed lines. The fatigue crack growth response of the material, established by considering the fractality of the growing crack in the L-shaped bell crank structure, is superimposed on the plot, as shown by the solid square symbols. For each data point, the fatigue crack growth rate is computed from the local slope of the ( a a 0 ) vs. N curve for the bell crank structure (see Figure 6) at the specific crack length, while Δ K is computed by the multifractal Equation (3) using the fractal dimension value of the crack tip region (see Figure 7). The results demonstrate that the multifractal fatigue crack growth rate data based on the bell crank structure distribute fairly around the median growth rate behavior of the material obtained using the standard C(T) specimen geometry. Thus, the effect of crack geometry on the crack tip driving force is intrinsic in the fractal features of the crack. Such an effect is quantified in terms of the fractal dimension. Although the fatigue crack in the bell crank structure grows under the mixed-mode tension and shear loading, it could be inferred that the crack grows predominantly under the Mode I crack tip loading.
Comparable multifractal fatigue crack growth rate response of the material d a d N Δ K is demonstrated for test data using the bell crank structure and the standard C(T) specimen. It follows that the multifractal crack growth model, as represented by Equation (3) for the crack tip driving force and Equation (4) for the crack growth rate within the Paris regime, could be used when assessing the growth rate behavior of the crack in structures with complex geometry where the crack geometry factor is not easily available.

5. Conclusions

This study has demonstrated that the fractal features of a growing fatigue crack in a metallic structure of complex geometry inherit signatures of the crack growth rate behavior of the material. The observed nonlinear variation of the fractal dimension of the fatigue crack in the AISI 410 martensitic steel structure is due to the increasing crack tip driving force as the crack grows. This results in greater variations and thus higher fractal dimension values of the fractal features of the crack. Within the Paris crack growth regime, the multifractal fatigue crack growth rate determined using the L-shaped bell crank structure is comparable with that established using the standard compact tension specimen. Thus, the multifractal fatigue crack growth model, represented by Equations (3) and (4), could be used to establish the fatigue crack growth rate of the crack in an engineering structure where the crack geometry factor is not readily available.

Author Contributions

Conceptualization, M.H.H. and M.N.T.; data curation, M.H.H.; formal analysis, M.H.H., S.S.R.K., M.F.A.-H. and M.N.T.; funding acquisition, M.N.T.; investigation, M.H.H. and M.N.T.; methodology, M.H.H. and M.N.T.; project administration, S.S.R.K., M.F.A.-H. and M.N.T.; resources, S.S.R.K. and M.N.T.; software, M.H.H.; supervision, M.F.A.-H. and M.N.T.; validation, M.H.H., S.S.R.K., M.F.A.-H. and M.N.T.; visualization, M.H.H., S.S.R.K. and M.N.T.; writing—original draft, M.H.H. and M.N.T.; writing—review and editing, S.S.R.K. and M.F.A.-H. All authors have read and agreed to the published version of the manuscript.

Funding

This research is funded by the Universiti Teknologi Malaysia under the Transdisciplinary Research Grant No. TDR 13.1(06G09).

Data Availability Statement

Data is contained within the article.

Conflicts of Interest

The authors declare no conflict of interest.

References

  1. Tada, H.; Paris, P.; Irwin, G. The Analysis of Cracks Handbook; ASME Press: New York, NY, USA, 2000; Volume 2, p. 1. [Google Scholar]
  2. Rooke, D.P.; Cartwright, D.J. Compendium of Stress Intensity Factors; H.M.S.O.: London, UK, 1976; p. 330.
  3. Sherry, A.H.; France, C.; Goldthorpe, M. Compendium of T-stress solutions for two and three dimensional cracked geometries. Fatigue Fract. Eng. Mater. Struct. 1995, 18, 141–155. [Google Scholar] [CrossRef]
  4. Moës, N.; Dolbow, J.; Belytschko, T. A finite element method for crack growth without remeshing. Int. J. Numer. Methods Eng. 1999, 46, 131–150. [Google Scholar] [CrossRef]
  5. de Morais, A.B.; de Moura, M.F.; Gonçalves, J.P.M.; Camanho, P.P. Analysis of crack propagation in double cantilever beam tests of multidirectional laminates. Mech. Mater. 2003, 35, 641–652. [Google Scholar] [CrossRef]
  6. Shokrieh, M.M.; Heidari-Rarani, M.; Rahimi, S. Influence of curved delamination front on toughness of multidirectional DCB specimens. Compos. Struct. 2012, 94, 1359–1365. [Google Scholar] [CrossRef]
  7. Orifici, A.C.; Krueger, R. Benchmark assessment of automated delamination propagation capabilities in finite element codes for static loading. Finite Elem. Anal. Des. 2012, 54, 28–36. [Google Scholar] [CrossRef] [Green Version]
  8. Shokrieh, M.M.; Rajabpour-Shirazi, H.; Heidari-Rarani, M.; Haghpanahi, M. Simulation of mode I delamination propagation in multidirectional composites with R-curve effects using VCCT method. Comput. Mater. Sci. 2012, 65, 66–73. [Google Scholar] [CrossRef]
  9. Pereira, A.B.; de Morais, A.B. Mode I interlaminar fracture of carbon/epoxy multidirectional laminates. Compos. Sci. Technol. 2004, 64, 2261–2270. [Google Scholar] [CrossRef] [Green Version]
  10. Robinson, P.; Javidrad, F.; Hitchings, D. Finite element modelling of delamination growth in the DCB and edge delaminated DCB specimens. Compos. Struct. 1995, 32, 275–285. [Google Scholar] [CrossRef]
  11. Samborski, S. Numerical analysis of the DCB test configuration applicability to mechanically coupled Fiber Reinforced Laminated Composite beams. Compos. Struct. 2016, 152, 477–487. [Google Scholar] [CrossRef]
  12. Jimenez, M.A.; Miravete, A. Application of the Finite-Element Method to Predict the Onset of Delamination Growth. J. Compos. Mater. 2004, 38, 1309–1335. [Google Scholar] [CrossRef]
  13. Hashmi, M.H.; Koloor, S.S.R.; Abdul-Hamid, M.F.; Tamin, M.N. Exploiting fractal features to determine fatigue crack growth rates of metallic materials. Eng. Fract. Mech. 2022, 270, 108589. [Google Scholar] [CrossRef]
  14. Paris, P.; Erdogan, F. A Critical Analysis of Crack Propagation Laws. J. Basic Eng. 1963, 85, 528–533. [Google Scholar] [CrossRef]
  15. Walker, K. The effect of stress ratio during crack propagation and fatigue for 2024-T3 and 7075-T6 aluminum. In Effects of Environment and Complex Load History on Fatigue Life; ASTM International: West Conshohocken, PA, USA, 1970. [Google Scholar]
  16. Forman, R.G. Study of fatigue crack initiation from flaws using fracture mechanics theory. Eng. Fract. Mech. 1972, 4, 333–345. [Google Scholar] [CrossRef]
  17. Collipriest, J., Jr. An experimentalist’s view of the surface flaw problem. In The Surface Crack-Physical Problems and Computational Solutions; ASME: New York, NY, USA, 1972; pp. 43–61. [Google Scholar]
  18. McEvily, A. Phenomenological and microstructural aspects of fatigue. In The Microstructure and Design of Alloys; Iron and Steel Institute: Cambridge, UK, 1973; pp. 204–225. [Google Scholar]
  19. McEvily, A.J.; Groeger, J. On the threshold for fatigue crack growth. In Advances in Research on the Strength and Fracture of Materials; Taplin, D.M.R., Ed.; Pergamon: Amsterdam, The Netherlands, 1978; pp. 1293–1298. [Google Scholar] [CrossRef] [Green Version]
  20. Frost, N.; Pook, L.; Denton, K. A fracture mechanics analysis of fatigue crack growth data for various materials. Eng. Fract. Mech. 1971, 3, 109–126. [Google Scholar] [CrossRef]
  21. Xiulin, Z.; Hirt, M.A. Fatigue crack propagation in steels. Eng. Fract. Mech. 1983, 18, 965–973. [Google Scholar] [CrossRef]
  22. Wang, W.; Hsu, C.-T.T. Fatigue crack growth rate of metal by plastic energy damage accumulation theory. J. Eng. Mech. 1994, 120, 776–795. [Google Scholar] [CrossRef]
  23. Miller, M.; Gallagher, J. An analysis of several fatigue crack growth rate (FCGR) descriptions. Fatigue Crack Growth Meas. Data Anal. ASTM STP 1981, 738, 205–251. [Google Scholar]
  24. Dowling, N.; Begley, J. Fatigue Crack Growth during Gross Plasticity and the J-Integral; ASTM International: West Conshohocken, PA, USA, 1976. [Google Scholar]
  25. Pugno, N.M.; Ruoff, R.S. Quantized fracture mechanics. Philos. Mag. 2004, 84, 2829–2845. [Google Scholar] [CrossRef] [Green Version]
  26. Broek, D. The Practical Use of Fracture Mechanics; Springer Science & Business Media: Berlin/Heidelberg, Germany, 2012. [Google Scholar]
  27. Wen, P.H.; Aliabadi, M.H.; Rooke, D.P. A contour integral for the evaluation of stress intensity factors. Appl. Math. Model. 1995, 19, 450–455. [Google Scholar] [CrossRef]
  28. Berer, M.; Mitev, I.; Pinter, G. Finite element study of mode I crack opening effects in compression-loaded cracked cylinders. Eng. Fract. Mech. 2017, 175, 1–14. [Google Scholar] [CrossRef]
  29. Irwin, G.R. Analysis of stresses and strains near the end of a crack traversing a plate. J. Appl. Mech. 1957, 24, 361–364. [Google Scholar] [CrossRef]
  30. Rybicki, E.F.; Kanninen, M.F. A finite element calculation of stress intensity factors by a modified crack closure integral. Eng. Fract. Mech. 1977, 9, 931–938. [Google Scholar] [CrossRef]
  31. Daux, C.; Moës, N.; Dolbow, J.; Sukumar, N.; Belytschko, T. Arbitrary branched and intersecting cracks with the extended finite element method. Int. J. Numer. Methods Eng. 2000, 48, 1741–1760. [Google Scholar] [CrossRef]
  32. Mariano, P.M.; Stazi, F.L. Strain localization due to crack–microcrack interactions: X-FEM for a multifield approach. Comput. Methods Appl. Mech. Eng. 2004, 193, 5035–5062. [Google Scholar] [CrossRef]
  33. Elguedj, T.; Gravouil, A.; Combescure, A. Appropriate extended functions for X-FEM simulation of plastic fracture mechanics. Comput. Methods Appl. Mech. Eng. 2006, 195, 501–515. [Google Scholar] [CrossRef]
  34. Dumstorff, P.; Meschke, G. Crack propagation criteria in the framework of X-FEM-based structural analyses. Int. J. Numer. Anal. Methods Geomech. 2007, 31, 239–259. [Google Scholar] [CrossRef]
  35. Legrain, G.; Moes, N.; Verron, E. Stress analysis around crack tips in finite strain problems using the extended finite element method. Int. J. Numer. Methods Eng. 2005, 63, 290–314. [Google Scholar] [CrossRef] [Green Version]
  36. Li, L.; Sun, H.-X.; Zhang, Y.; Yu, B. Surface Cracking and Fractal Characteristics of Bending Fractured Polypropylene Fiber-Reinforced Geopolymer Mortar. Fractal Fract. 2021, 5, 142. [Google Scholar] [CrossRef]
  37. Hashmi, M.H.; Abdul-Hamid, M.F.; Abdul-Latif, A.; Tamin, M.N.; Khattak, M.A. Fractal Dimensions of a Propagating Fatigue Crack in Metallic Materials. J. Fail. Anal. Prev. 2021, 21, 1644–1651. [Google Scholar] [CrossRef]
  38. Ma, G.; Li, J.; Zhou, X.; Zhang, L.; Qiu, P.; Yu, Y. Application of Asymmetric Notched Semi-Circular Bending Specimen to Evaluate Mixed-Mode I-II Fracture Behaviors of Sandstone. Fractal Fract. 2022, 6, 336. [Google Scholar] [CrossRef]
  39. Wang, L.; Yu, Z.; Liu, B.; Zhao, F.; Tang, S.; Jin, M. Effects of Fly Ash Dosage on Shrinkage, Crack Resistance and Fractal Characteristics of Face Slab Concrete. Fractal Fract. 2022, 6, 335. [Google Scholar] [CrossRef]
  40. Li, W.; Wu, M.; Shi, T.; Yang, P.; Pan, Z.; Liu, W.; Liu, J.; Yang, X. Experimental Investigation of the Relationship between Surface Crack of Concrete Cover and Corrosion Degree of Steel Bar Using Fractal Theory. Fractal Fract. 2022, 6, 325. [Google Scholar] [CrossRef]
  41. Wang, L.; Song, X.; Yang, H.; Wang, L.; Tang, S.; Wu, B.; Mao, W. Pore Structural and Fractal Analysis of the Effects of MgO Reactivity and Dosage on Permeability and F–T Resistance of Concrete. Fractal Fract. 2022, 6, 113. [Google Scholar] [CrossRef]
  42. An, Q.; Chen, X.; Wang, H.; Yang, H.; Yang, Y.; Huang, W.; Wang, L. Segmentation of Concrete Cracks by Using Fractal Dimension and UHK-Net. Fractal Fract. 2022, 6, 95. [Google Scholar] [CrossRef]
  43. Wang, L.; Zeng, X.; Yang, H.; Lv, X.; Guo, F.; Shi, Y.; Hanif, A. Investigation and Application of Fractal Theory in Cement-Based Materials: A Review. Fractal Fract. 2021, 5, 247. [Google Scholar] [CrossRef]
  44. Balankin, A.S.; Susarrey, O.; Paredes, R.G.; Morales, L.; Samayoa, D.; López, J.A. Intrinsically anomalous roughness of admissible crack traces in concrete. Phys. Rev. E 2005, 72, 065101. [Google Scholar] [CrossRef] [Green Version]
  45. Otsu, N. A Threshold Selection Method from Gray-Level Histograms. IEEE Trans. Syst. Man Cybern. 1979, 9, 62–66. [Google Scholar] [CrossRef] [Green Version]
  46. Liebovitch, L.S.; Toth, T. A fast algorithm to determine fractal dimensions by box counting. Phys. Lett. A 1989, 141, 386–390. [Google Scholar] [CrossRef]
  47. Gonzato, G. A practical implementation of the box counting algorithm. Comput. Geosci. 1998, 24, 95–100. [Google Scholar] [CrossRef]
  48. ASTM E647-15e1; Standard Test Method for Measurement of Fatigue Crack Growth Rates. ASTM International: West Conshohocken, PA, USA, 2015.
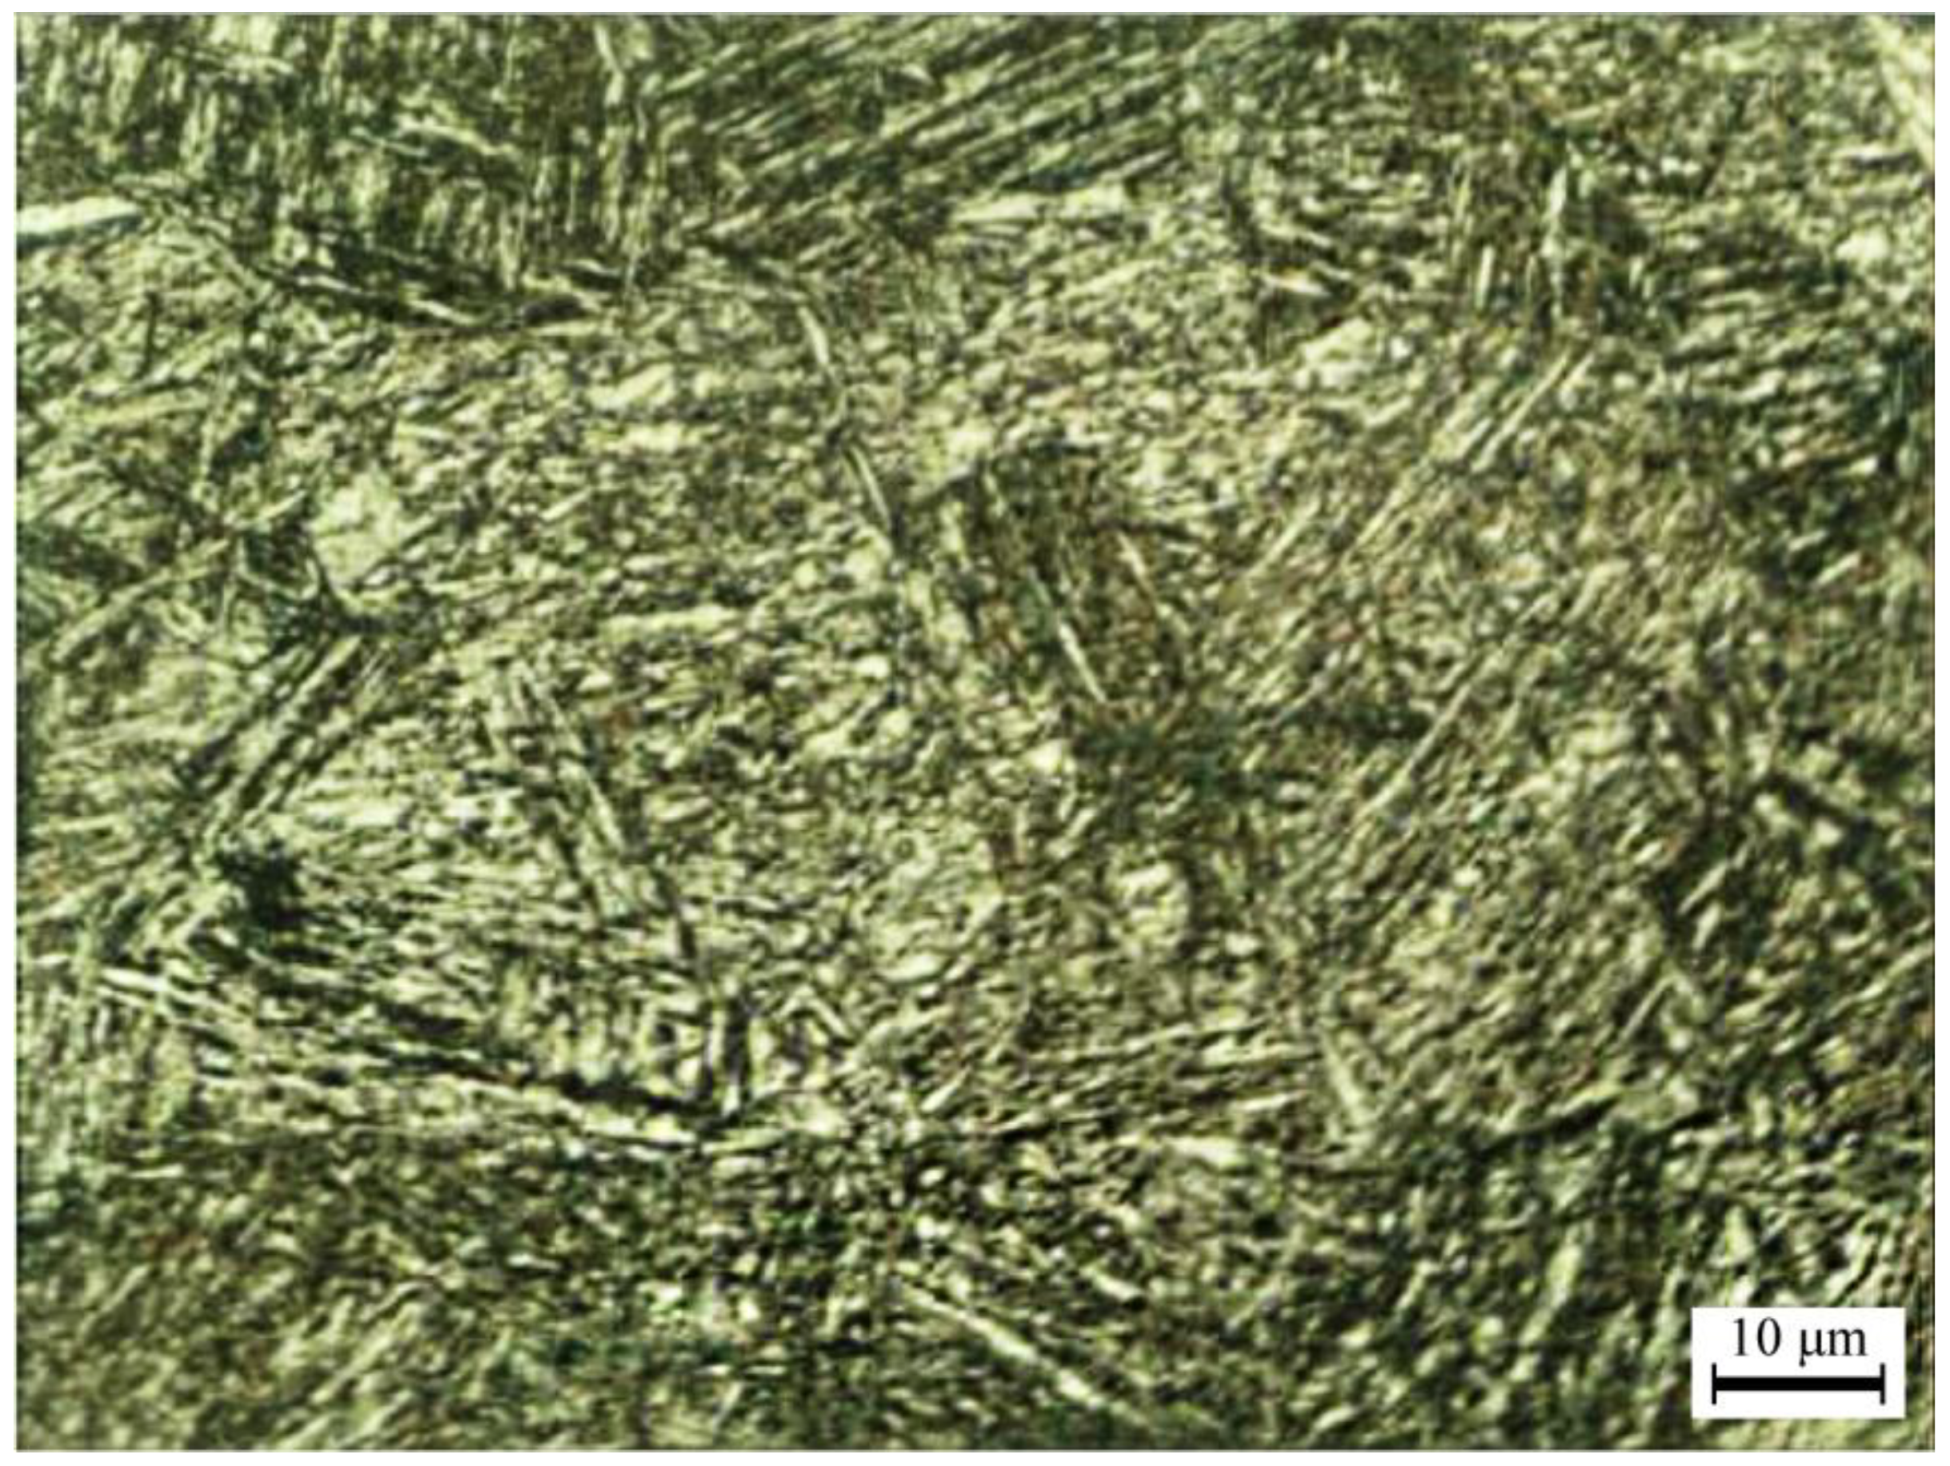
Figure 1. Needle-like microstructure of the AISI 410 martensitic steel.
Fractalfract 06 00635 g001
Figure 2. Testing of the bell crank structure. (a) Geometry and dimensions (in mm) of the L-shaped bell crank structure. Thickness is 20 mm. (b) Experimental setup of the fatigue crack growth test of the bell crank structure.
Fractalfract 06 00635 g002
Figure 3. (a) Composite image of the fatigue crack in the bell crank structure and (b) calculation methodology of the crack length along the curved crack path.
Fractalfract 06 00635 g003
Figure 4. Bimodal distribution of greyscale values of the crack image based on OTSU thresholding algorithm.
Fractalfract 06 00635 g004
Figure 5. Plot of log2  N B vs. log2  ϵ defining the fractality of the fatigue crack.
Fractalfract 06 00635 g005
Figure 6. Fatigue crack growth curves of AISI 410 stainless steel measured using compact tension (C(T)) specimen and L-shaped bell crank structure.
Fractalfract 06 00635 g006
Figure 7. Variation of the local fractal dimension along the edge of a growing fatigue crack in the bell crank structure.
Fractalfract 06 00635 g007
Figure 8. Comparison of fatigue crack growth rate data determined using the multifractal crack growth model with that obtained using the Paris crack growth equation. Grey-colored symbols represent data outside the Paris crack growth regime.
Fractalfract 06 00635 g008
Table 1. Mechanical and fatigue fracture properties of AISI 410 martensitic steel.
Property E   ( GPa ) σ Y   ( MPa ) σ UTS   ( MPa ) ν K IC   ( MPa m ) Δ K th   ( MPa m )
Value2006206570.3055.015.2 (min.)
Publisher’s Note: MDPI stays neutral with regard to jurisdictional claims in published maps and institutional affiliations.