Abstract
A surface topography characterization parameter system based on fractal parameters has been established, and several estimation methods for these fractal parameters have been suggested accordingly. Since scale dependence exists in these conventional methods, it is necessary to find an estimation method for characterization parameters with uniqueness. An estimation method for ideal fractal parameters for multi-scale measurement of polished surface topography is proposed in this study. Polished surfaces of two materials, WC-Ni and 9Cr18Mo, are measured under multi-scale for frequency component analysis. This study proposes an estimation method for ideal fractal parameters based on a modified determination method for the scale-free region and the decomposition of frequency components into three classifications. The reasonable results verify the existence of ideal fractal parameters: for the WC-Ni surface, ideal fractal dimension D = 1.3 and scale coefficient G = ; for the 9Cr18Mo surface, ideal fractal dimension D = 1.2 and scale coefficient G = . Additionally, it is revealed that the scale-dependent components conform to the same regulation on the same instrument by comparing the results of two materials. The conclusions of this study are expected to support tribology research and mechanical engineering related to surface topography.
1. Introduction
The parameter system is the basis of surface topography characterization. Traditionally, a statistical parameter system is used for such characterization [1,2,3,4,5,6]. In recent decades, with the increasing demands on describing the multi-scale intrinsic of surface topography, a fractal parameter system has been established since the self-similarity of geometries between different scales could be represented by a fractal [7,8,9,10]. Generally, the fractal parameter system includes fractal dimension D, an evaluation parameter of the space occupancy by surface roughness, and scale coefficient G, a scaling constant for surface roughness [11,12,13]. In addition, several estimation methods have been proposed for these fractal parameters. Power spectrum density (PSD) function and structure function are two common methods. Among these two methods, D and G are obtained from the slopes and intercepts of the linear region in the log-log figure of the functions [14,15,16]. In practice, fractal parameter systems and corresponding estimation methods have been widely applied to characterize different surfaces, including machined metal, anisotropy graphite, magnetic disks, and textured rocks [8,9,10,17,18].
Though remarkable progress has been achieved in surface topography characterization based on fractal parameter systems, a few issues remain to be solved in this field. Firstly, it is necessary to define the scale-free region range where fractal components exist [19,20,21,22] due to the surface topography being a combination of stationary random processes in the low-frequency range and fractal processes in the high-frequency range [1,9,23]. The scale-free region has received less attention as a prerequisite for estimating fractal parameters. Furthermore, the classification of the surface topography components has not been determined. Among existing studies, three components have been mentioned: a fractal component, a random component, and a scale-dependent component, while previous researchers [12,24] generally consider two of the three components in each study. Finally, due to the ignoring of scale-free region determination and incomplete consideration of three components, the fractal dimension D and scale coefficient G change under multi-scale measurement [25,26] though they are ideally expected to be scale-independent [27,28]. Conventional methods focus on mathematical modifications to solve this scale-dependent problem [12,24], but the intrinsic and origin of the mentioned scale-dependent components are seldom discussed.
Thus, this study aims to provide an approach to obtaining ideal unique fractal parameters, filling the gap that fractal parameters are not the same due to different measurement frequencies for the same surface. This paper is organized as follows: In Section 2, the theoretical method is proposed based on the scale-free region determination method proposed in the authors’ previous study and the components’ decomposition into three classifications; in Section 3, polished surfaces of WC-Ni and 9Cr18Mo measured under different scales are used as examples, and the ideal fractal parameters of them are calculated to verify the proposed method; and in Section 4, the three components are further discussed.
2. Theoretical Methods
According to the research of Majumdar and Bhushan [8,9,10], for surface topography, there is a (−5 − 2D)) power function relationship between the PSD P(f) of fractal components and frequency f, shown in Equation (1). Equation (1) could be represented as a linear function by a logarithmic operation, shown as Equation (2). The slope (−(5 − 2D)) and intercept ((2D − 2)log(G) − log(2ln)) of Equation (2) represent fractal dimension D and scale coefficient G, respectively [14,15,16]. Thus, fractal parameters could be estimated from the linear log-log PSD of fractal components.
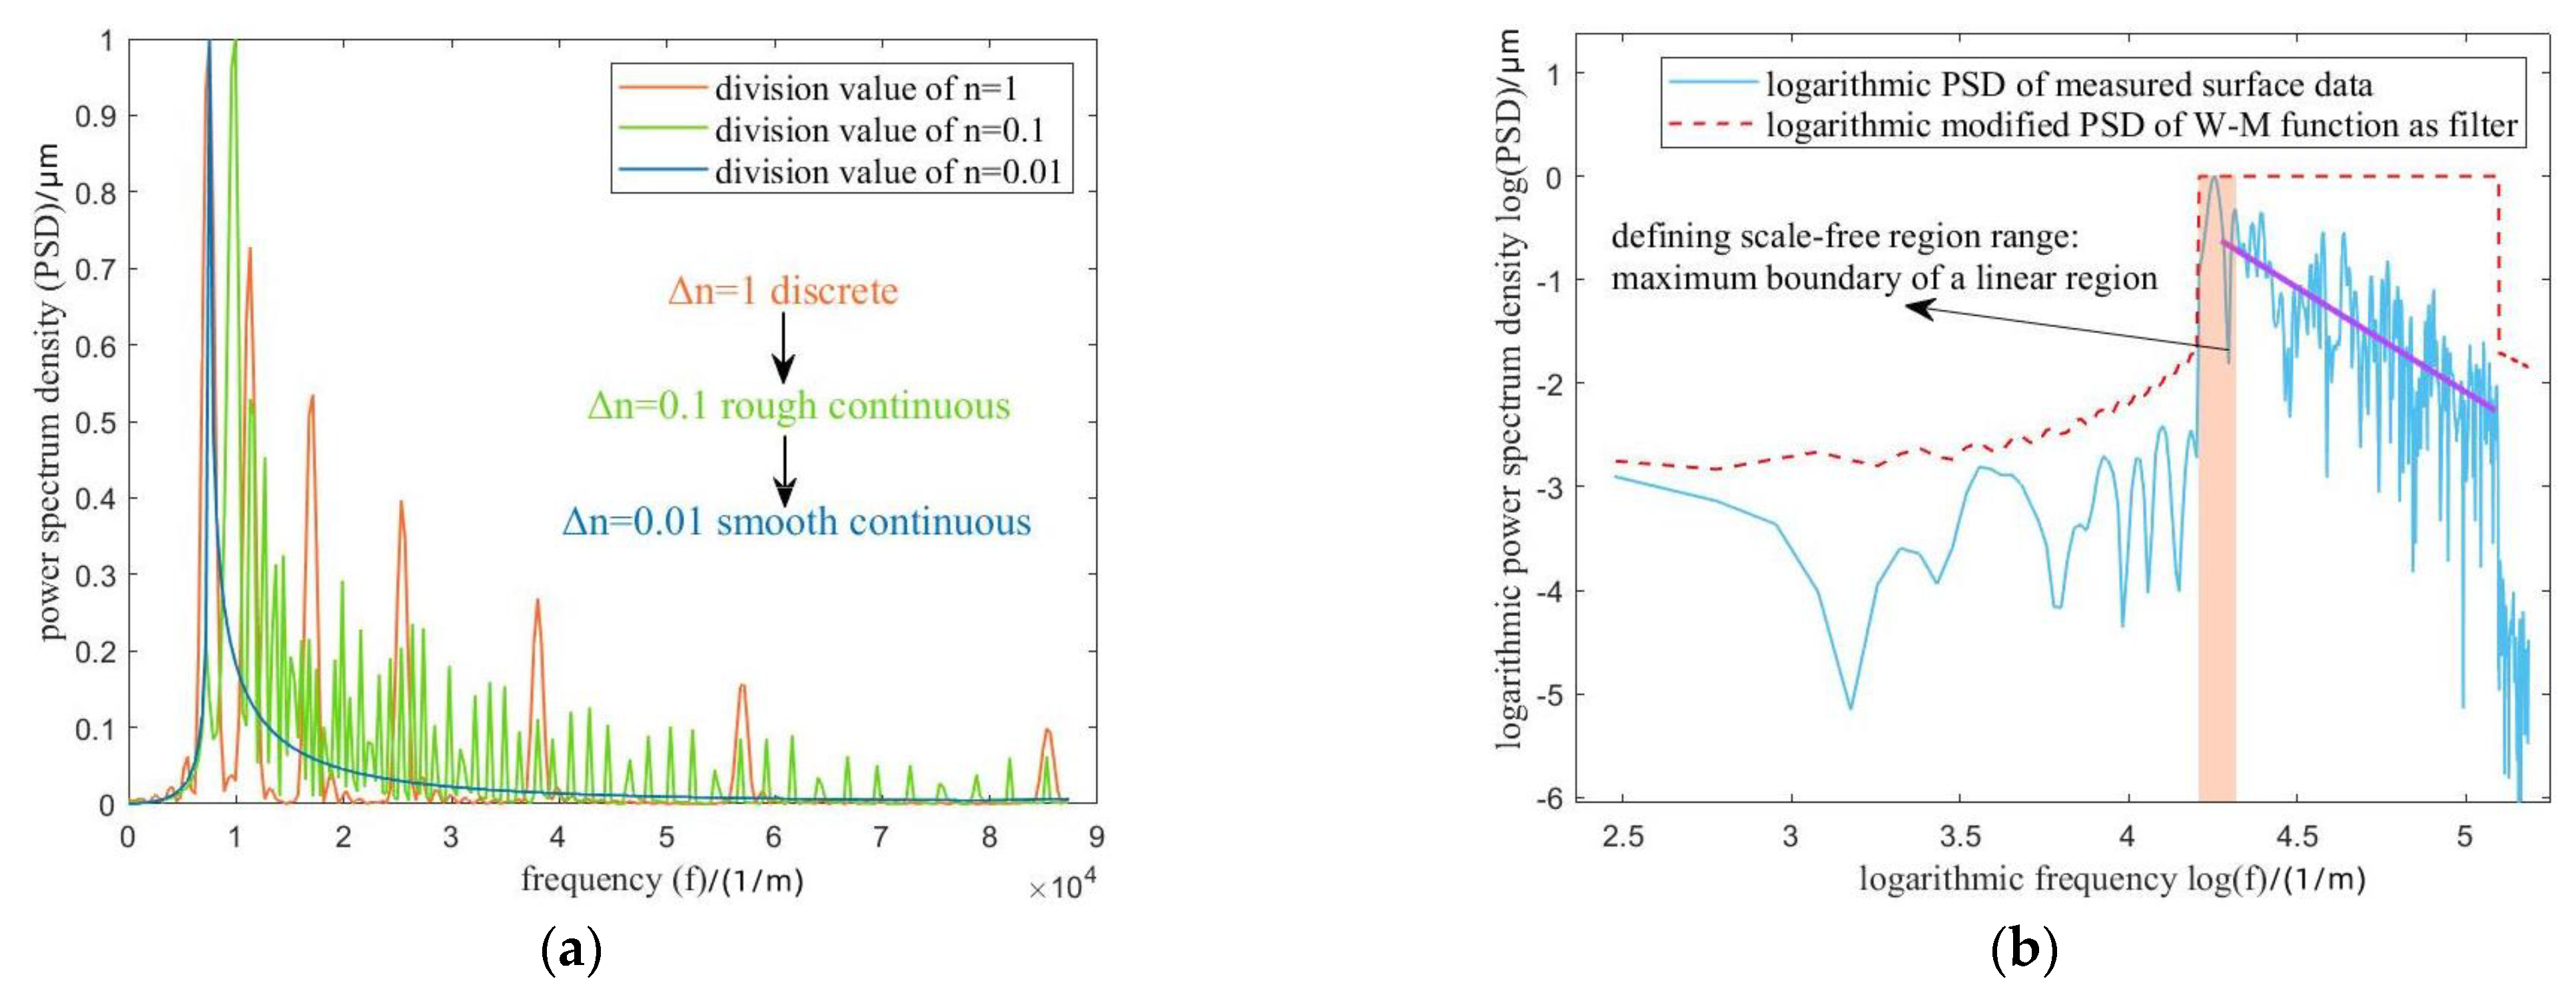
However, the log-log PSD of actual surface topography, which is represented by measured height data, could be divided into two parts (Figure 1a): a linear region at high frequencies and a constant region at low frequencies. The fractal characterizations only exist in this linear region, which is defined as the scale-free region. Thus, the determination of the scale-free region range should be one of the keys to estimating fractal parameters.

Figure 1.
The basic concepts of fractals and scale dependence. (a) the scale-free region; (b) the scale-dependence phenomenon.
Figure 1b shows that the linear functions’ offset changed with the measurement scales. Such an offset represents the scale dependence in fractal parameters. Thus, another key to estimating fractal parameters is the elimination of such scale dependence.
In conclusion, the estimation method for ideal unique fractal parameters is proposed in this section. The main steps of this method include scale-free region determination, the decomposition of three components, and scale dependence elimination.
Additionally, two concepts of frequency need to be stated here. The natural frequency f represents the component characteristics of surface topography. Another is measurement frequency , which represents the scale. The natural frequency f is the reciprocal of the characteristic lateral length l of surface asperity. In comparison, the measurement frequency is the reciprocal of the measurement interval , shown in Equation (3).
2.1. Scale-Free Region Determination
A determination method was proposed in the authors’ previous study [29]. The Weierstrass–Mandelbrot (W–M) function (Equation (5)) is rewritten into an equal amplitude variant (Equation (6)), which modifies the amplitude into an adjustment parameter , setting spectrum line amplitudes in PSD as 1.
In the previous method, the frequency index n is an integer, so that only discrete spectrum lines at specific frequencies could be extracted. This study must consider continuous PSD information to analyze its components. So that the frequency index n is extended to a non-integer, modifying the discrete sum of Equation (6) into the continuous integration of Equation (7). Equation (7) could be applied as a band-pass filter, shown in Figure 2.
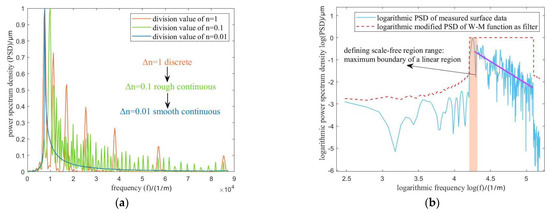
Figure 2.
Determination method for the scale-free region based on modified W–M function. (a) introduction of non-integer frequency index; (b) results in log-log PSD.
Figure 2a shows the introduction of the non-integer frequency index. By gradually subdividing the values of n, more spectrum lines are extracted, filling the blanks between discrete lines. The spectrum could be considered a continuous curve when subdivided to a certain extent. All components in the scale-free region could be extracted by modifying the amplitudes of such continuous curves as one and multiplying them with surface PSD. Figure 2b shows the resulting PSD and its log-log plot. The region where the PSD could be fitted as a linear function represents the scale-free region, and the frequency of the highest peak (marked as orange) represents the boundary of this scale-free region. Though the modified W–M function becomes continuous in the frequency domain, its characteristic in the spatial domain is still continuous but not differentiable.
2.2. Components Decomposition
After the scale-free region determination and inside component extraction, these components are investigated to determine the scale dependence under multi-scale measurement of surface topography. The polished surface of the 9Cr18Mo stainless steel is used as an example here. The surface is measured at intervals of 0.8 and 0.16 on a ZYGO NexView white light interferometer (Middlefield, CT, USA). Detailed information is given in Section 3.
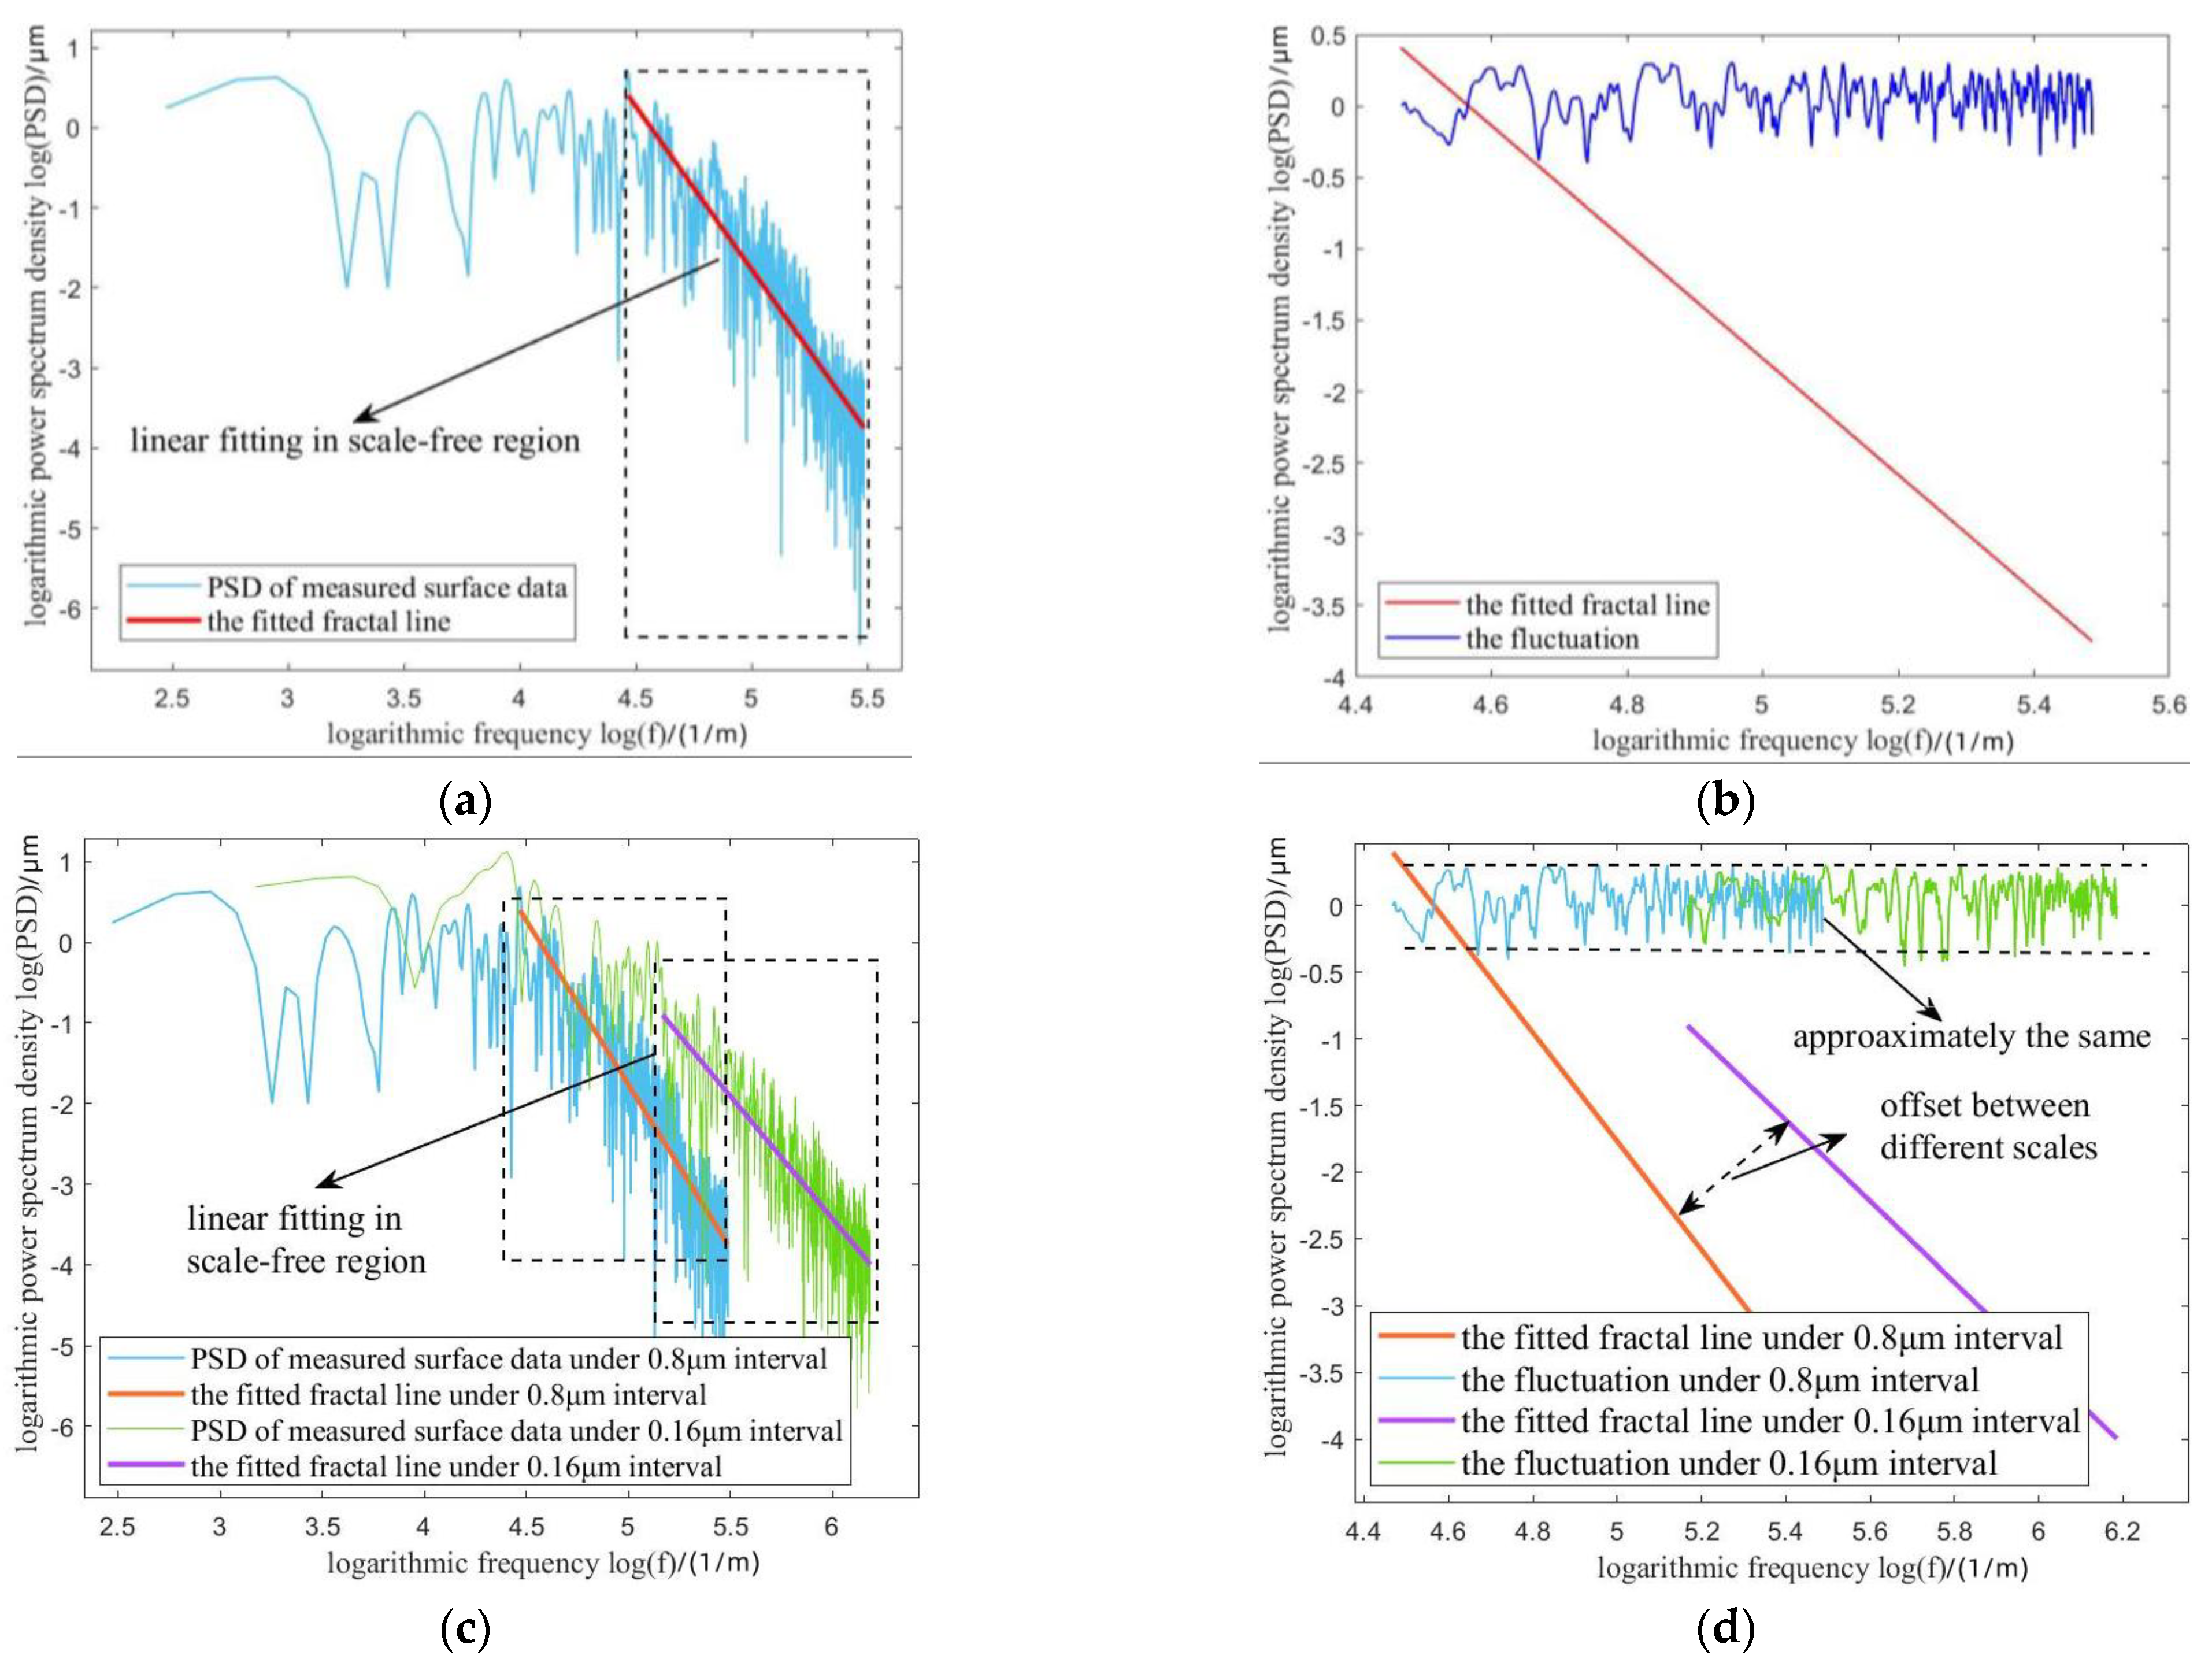
Under single-scale, PSD in the scale-free region (Figure 3a) could be decomposed into two parts: the linear components and the fluctuation components, shown in Figure 3b. Though the fractal component is a linear function according to Equation (2), there are other components in this linear function in addition to the fractal component in Figure 3b. Figure 3c shows the PSD surface topography of the 9Cr18Mo under two measurement scales. It can be seen from Figure 3d that there is an offset between the linear components under different scales, while the fluctuation components are approximately the same. The detailed average values and variances are shown in Table 1, showing that the two fluctuations conform to approximately the same distribution.
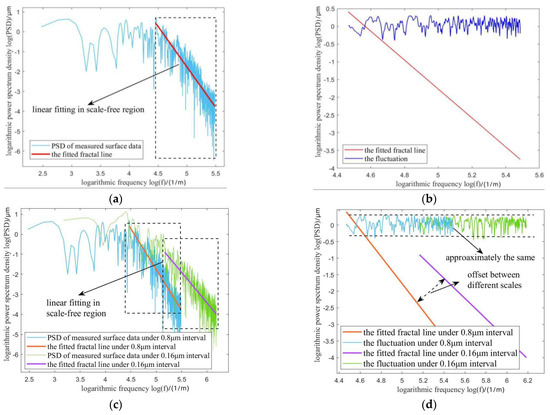
Figure 3.
Separation of three components in linear log-log PSD. (a) linear function under a single scale; (b) the fractal components and fluctuation components under a single scale; (c) linear function under multi-scales; (d) the fractal components, fluctuation components, and offset components under multi-scales.

Table 1.
Detailed parameters under the two scales.
Thus, if the fractal components are supposed to be unique, they should be mixed with scale-dependent offset components.
So, the PSD of an actual surface topography under different measurement scales could be decomposed into three components: the unique fractal components with a linear function, the fluctuation components with approximately the same parameters under every scale, and scale-dependent offset components. Therefore, the PSD of measured surface topography is the sum of these three components, shown in Equation (8).
2.3. Scale-Dependence Elimination
Figure 3d shows that though linear functions could be fitted and relative offsets between them could be obtained, the ideal fractal linear function and the absolute offsets could not be decomposed through their mixed functions under each scale. The scale-dependent components could not be recognized and eliminated through data under a single scale. Measurement data collected under multi-scales must be analyzed comprehensively to obtain unique fractal parameters. Because the fluctuation components are scale-independent, they could be subtracted from the log-log PSD first, obtaining a smooth linear function that is the combination of fractal components and offset components, shown in Equation (9).
For this linear function , its slope K() (changed with a measurement scale ) and intercept I() could be assumed as the sum of two parts: a scale-dependent function E() or S() representing the offset components and a constant part (c and b) representing the ideal unique fractal components, shown in Equations (10) and (11).
Based on such an assumption, the could be written as Equation (12).
The combination functions K() and I() could be fitted with slopes and intercepts obtained under multi-scales. If the ideal unique fractal parameters exist, the constants c and b will be obtained from the fitted K() and I(). According to Equation (2), the ideal fractal dimension D and scale coefficient G could be obtained through Equations (13) and (14). D is calculated from the slopes of Equation (2), shown as Equation (13). G could be calculated with the obtained D and any point (log(f), log(P)) in Equation (2). Herein, the point where log(f) = 0 is selected to simplify the calculation, shown as Equation (14).
3. Verification of the Experiment
3.1. Experiment Design
The method proposed in Section 2 is verified through two surface topography measurement experiments. The surfaces of WC-Ni hard alloy and 9Cr18Mo stainless steel, which are common materials for tribo-pair in seals and bearings, were selected as the experiment samples to verify if unique fractal parameters could be obtained. The different surfaces are conducted on the same instrument as the verification experiment, aiming to prove whether the regular offset components are invariant. The surface topography is measured by the ZYGO NexView white-light interferometer.
Each surface is machined in three steps, a common machining process for mechanical seal surfaces.

Table 2.
Machining information of experiment sample surface of WC-Ni.

Table 3.
Machining information of additional experiment sample surface of 9Cr18Mo.
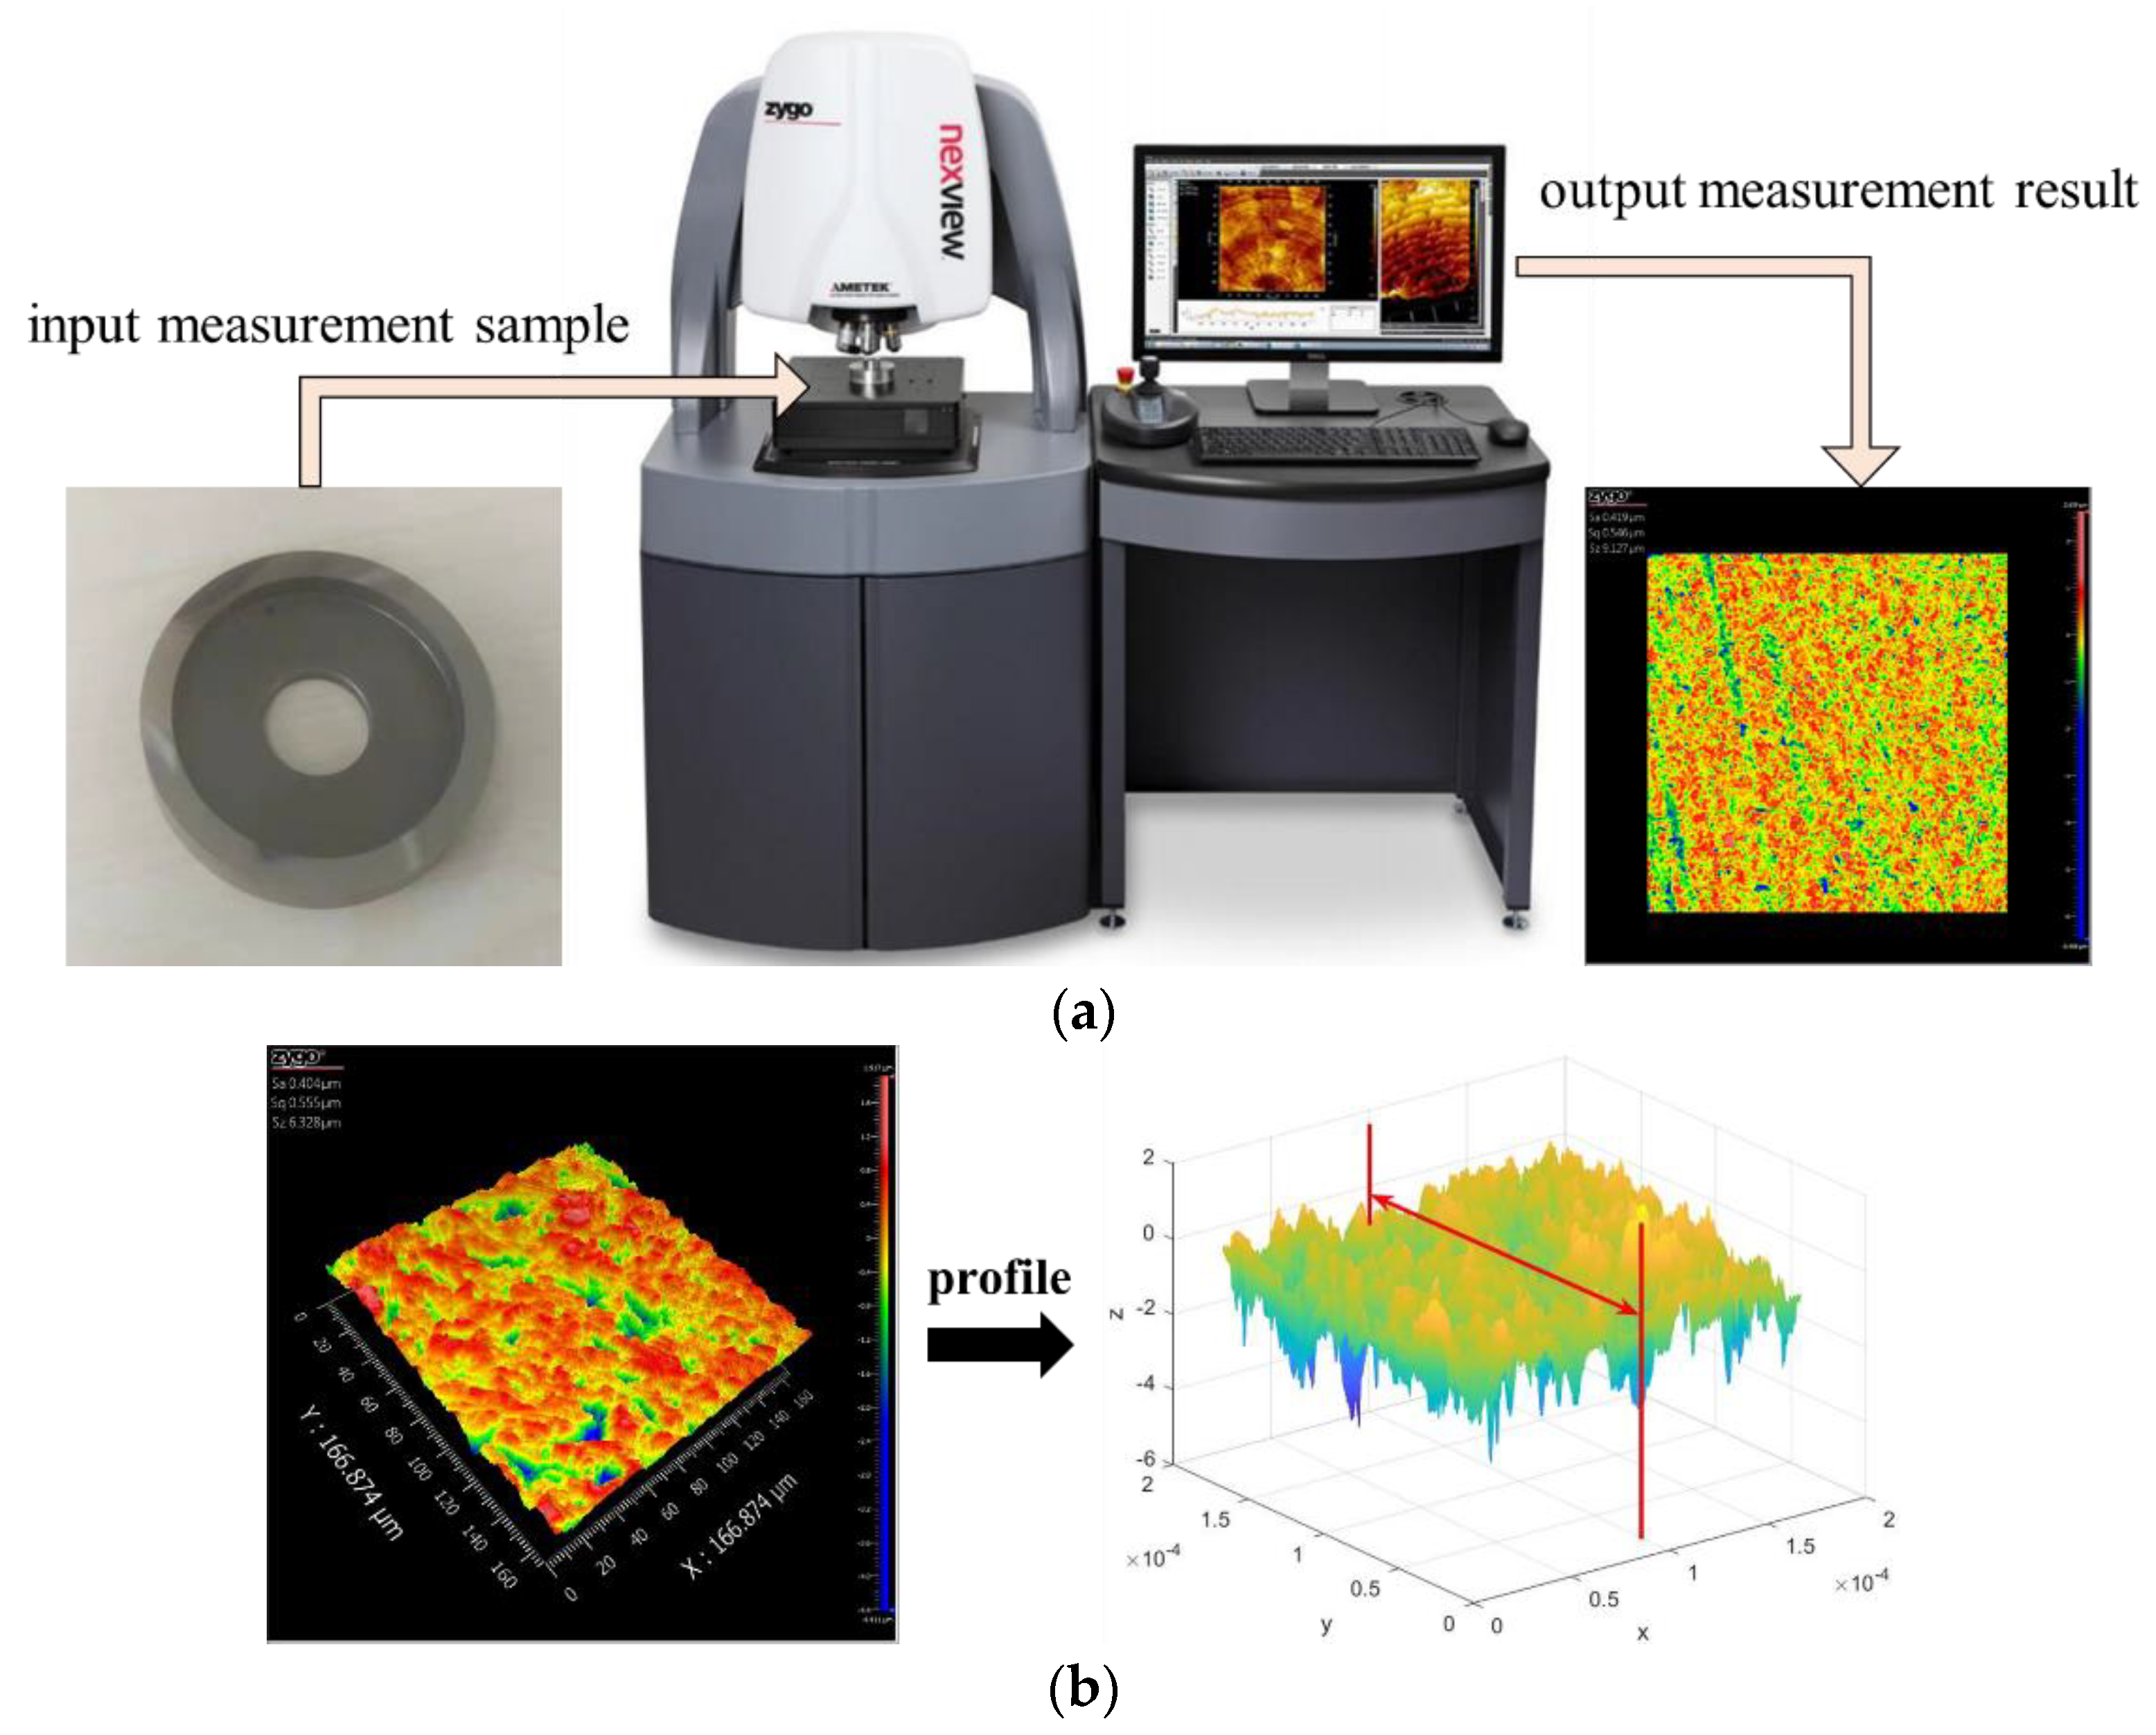
The measurement process is shown in Figure 4a; 1024 × 1024 data points are obtained from this process. Then, the obtained surface data could be divided into 1024 roughness profiles, as shown in Figure 4b. The PSD of these profiles will then be applied to calculate the fractal parameters.
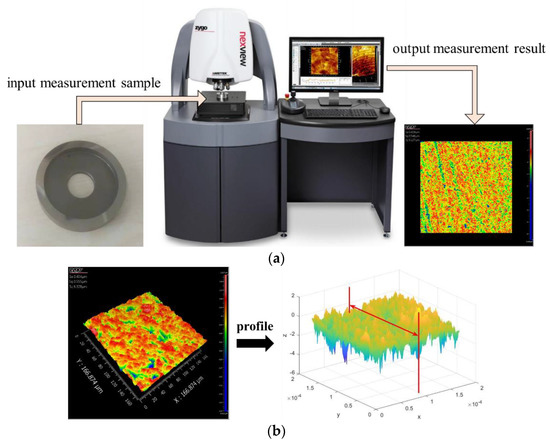
Figure 4.
Measurement process of the experiment. (a) measurement instrument; (b) roughness profiles.
The sampling point numbers of the measurement instrument are fixed at 1024 × 1024. The sample surface is measured under four different scales listed in Table 4. The measurement frequencies are determined by the setting times of the scopes of the instrument. Table 4 gives the corresponding relation between the times of scopes and the measurement frequencies. According to Equation (4), the measurement frequency is the reciprocal of the measurement interval .

Table 4.
Measurement information of experiment sample surface.
The components in the scale-free region are extracted according to the method proposed in Section 2. The slopes and intercepts of 1024 roughness profiles are calculated under each scale, and the statistical average results are used to fit the functions K() and I(), with the goal of determining the ideal fractal parameters.
3.2. Experiment Results
3.2.1. Results of WC-Ni Surface
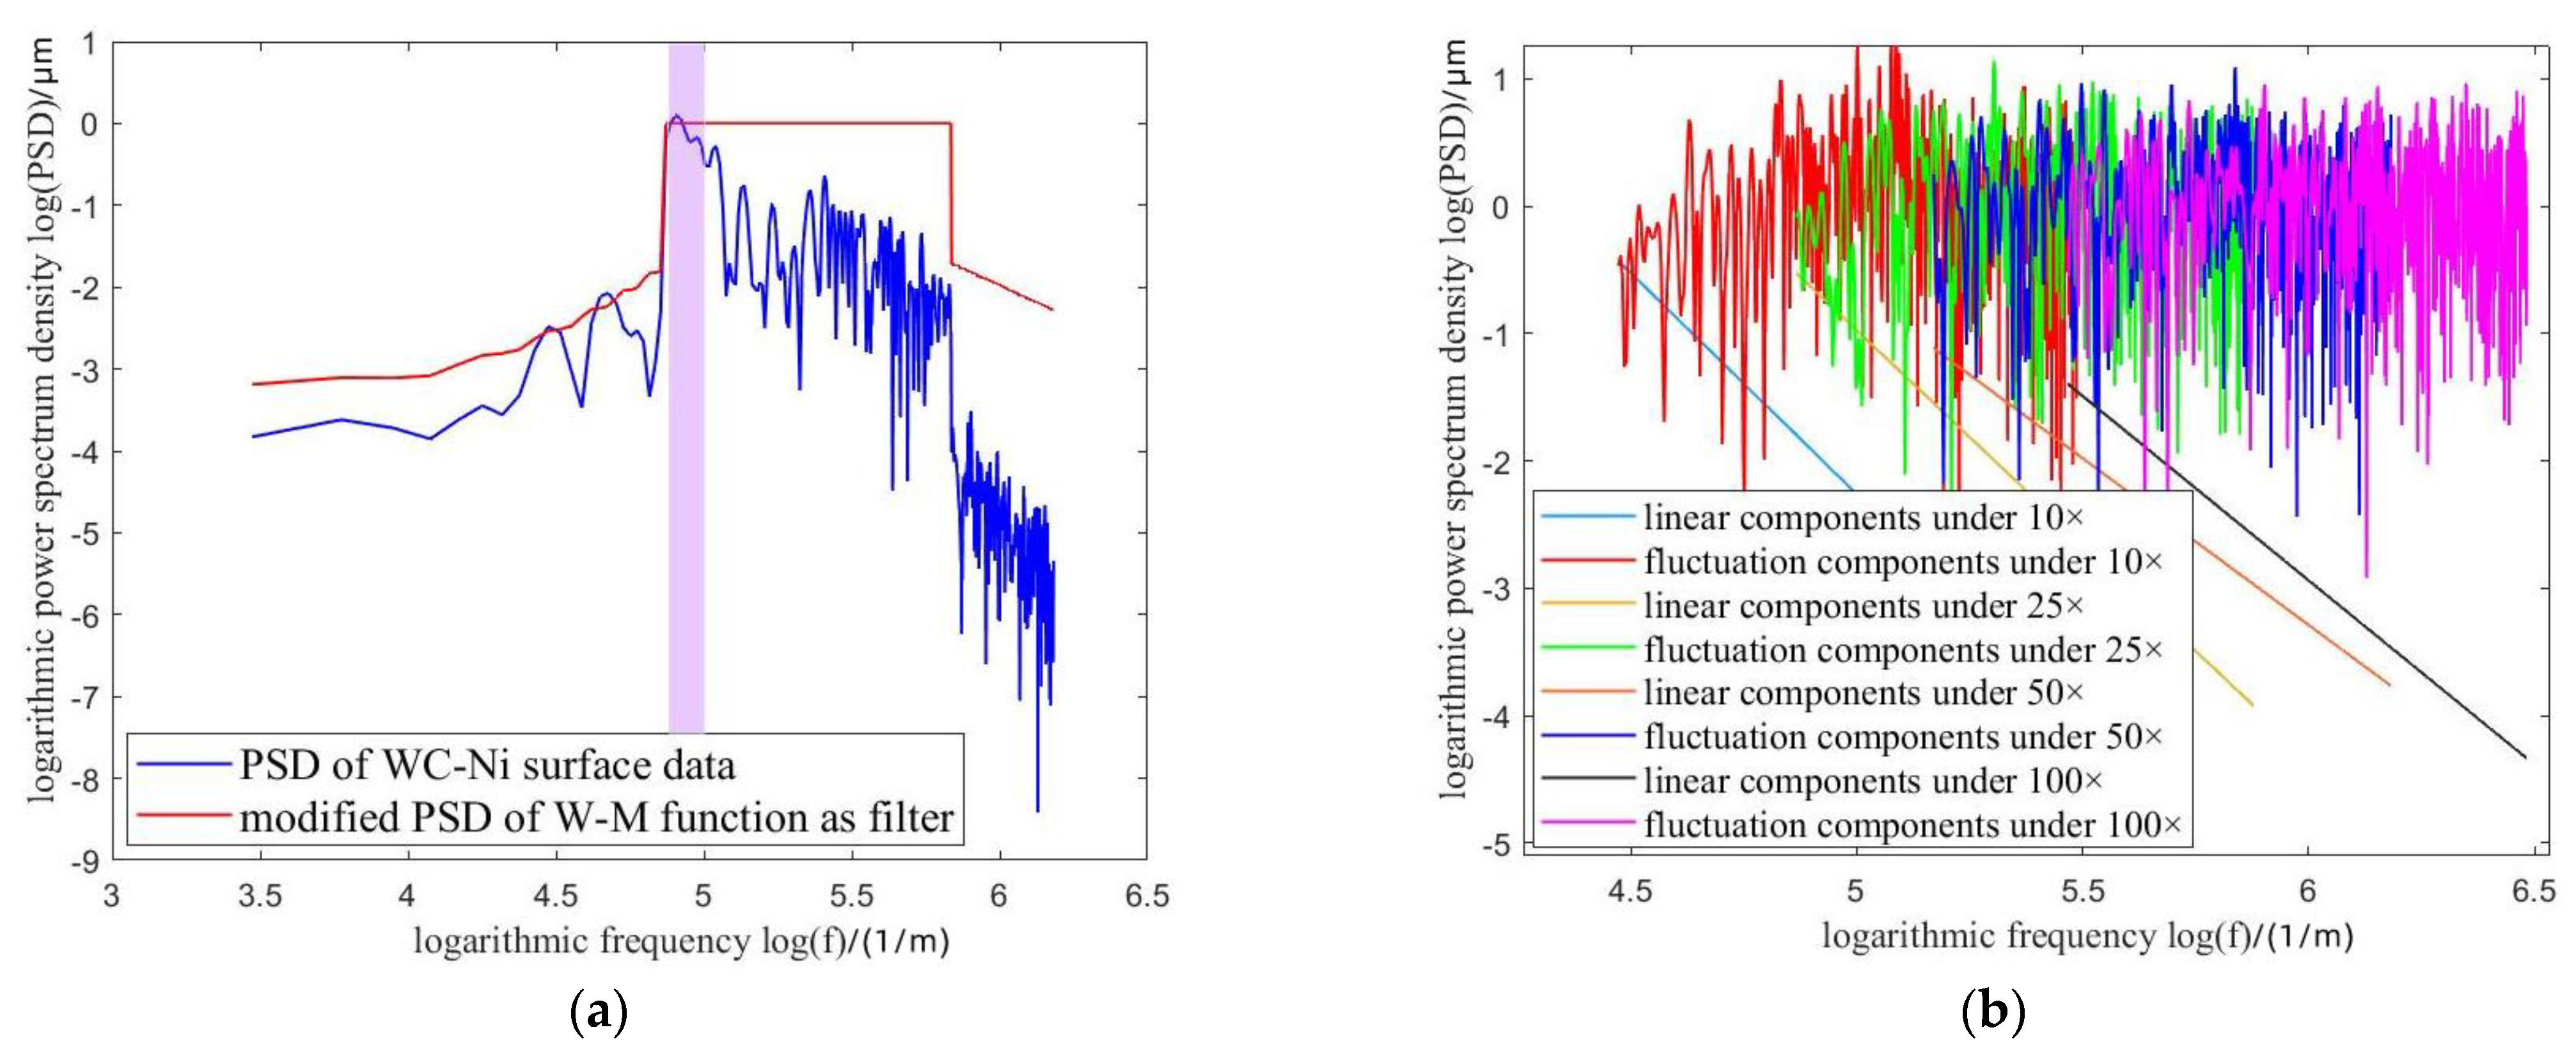
The multi-scale measurement data from roughness profiles of the WC-Ni surface is analyzed by the steps of the proposed method, as shown in Figure 5. First, the scale-free region range is determined as 127,830 in Figure 5a; then, the fluctuation components are filtered, resulting in linear functions, which are combinations of fractal components and offset components in Figure 5b.
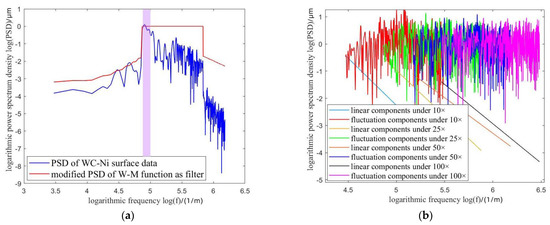
Figure 5.
Operation processes on the measured data. (a) determination of scale-free region; (b) component decomposition and filtering fluctuation components.
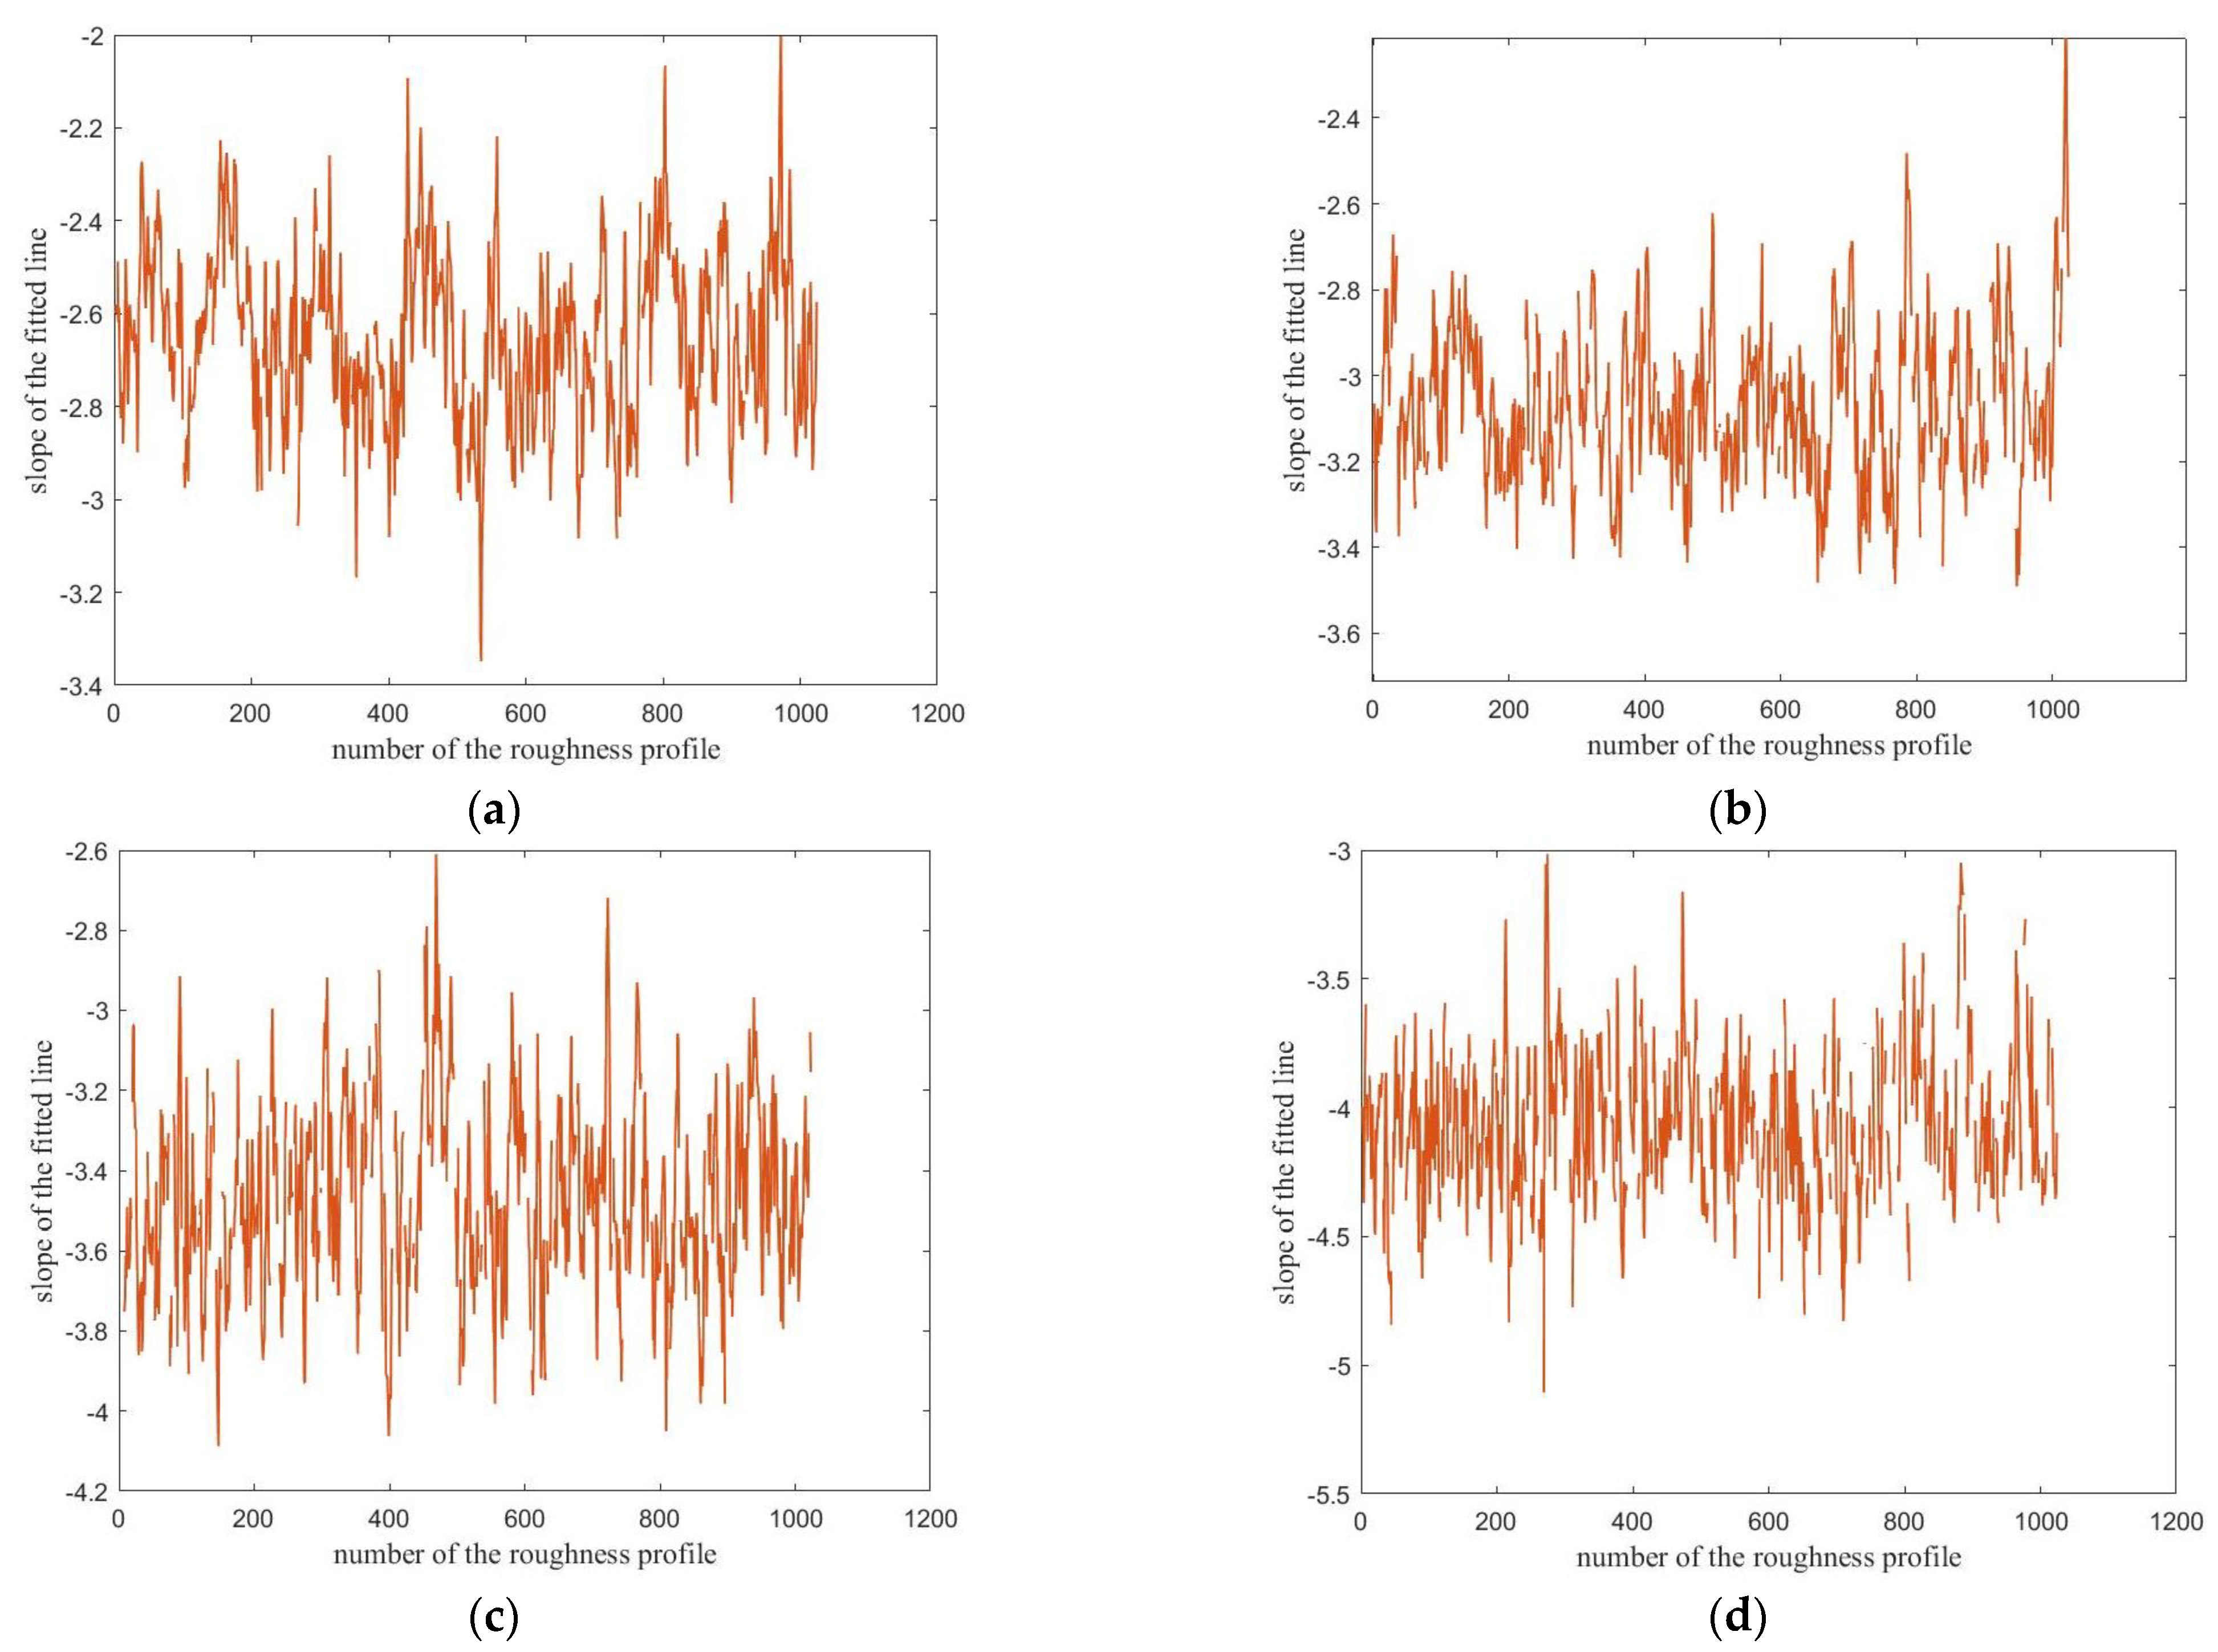
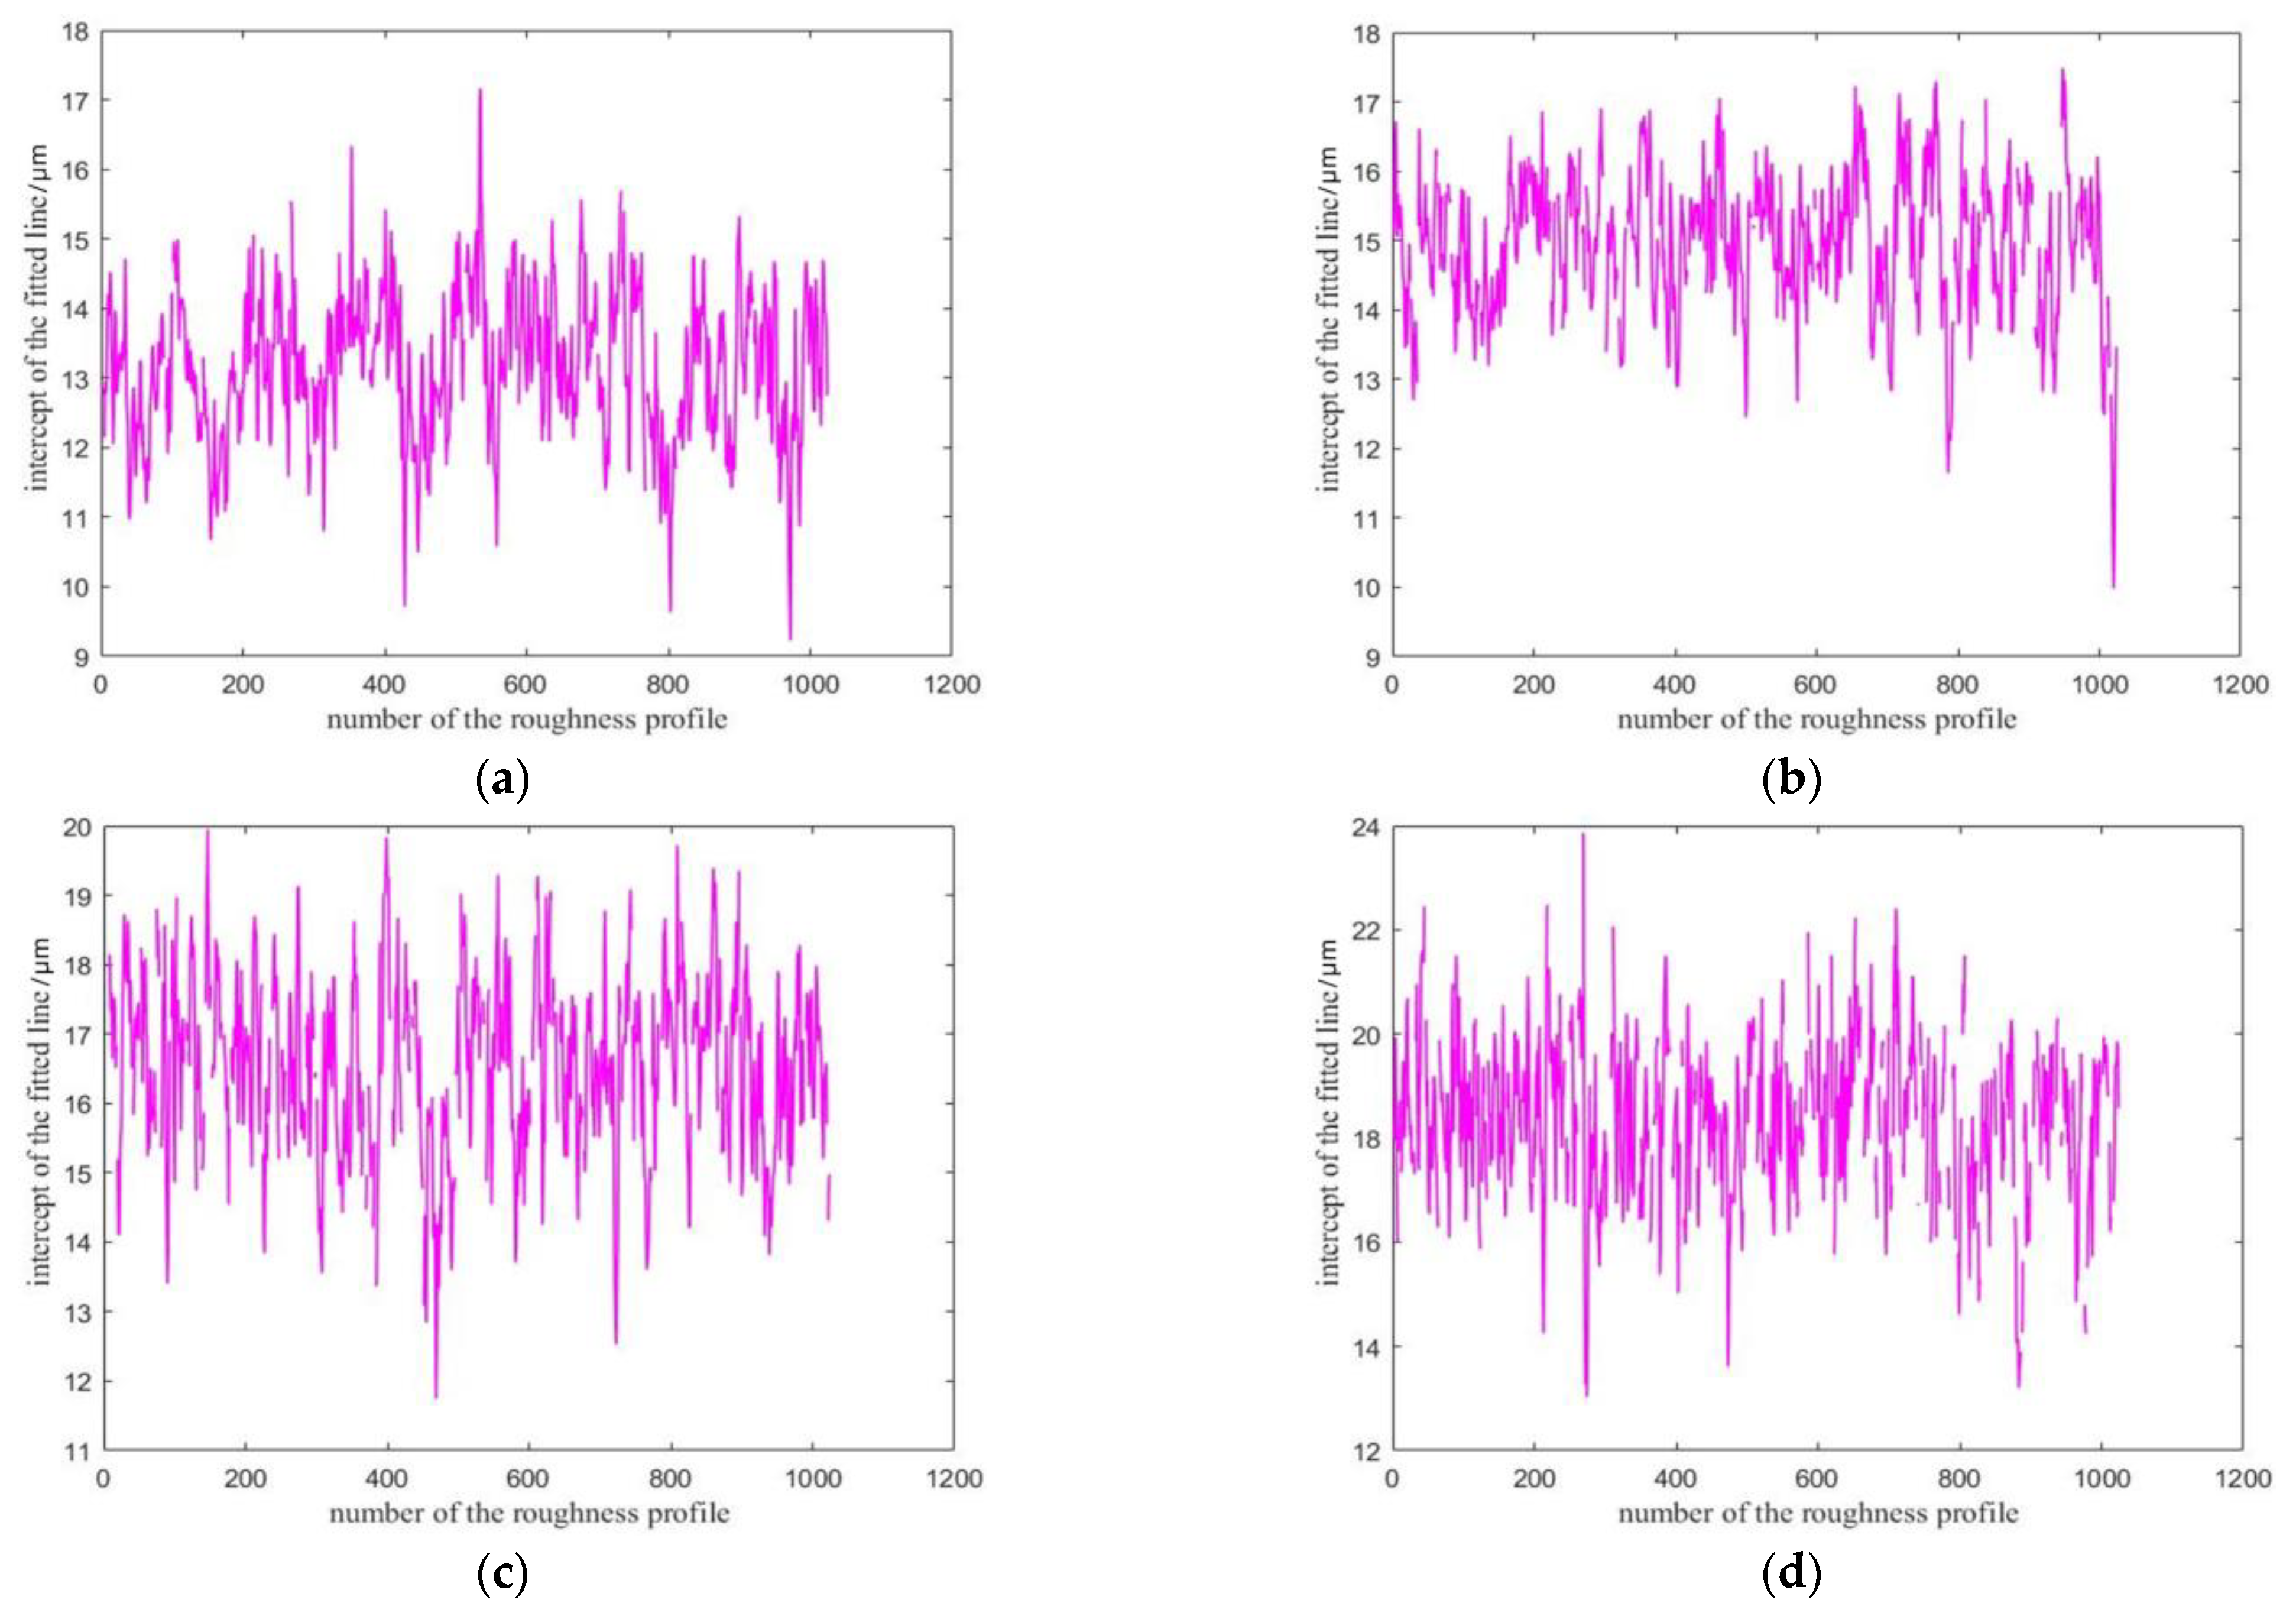
Since there are 1024 profiles measured under each scale , these 1024 slopes and intercepts will be calculated to fit the functions and I(). The results of 1024 slopes and 1024 intercepts under each scale (time of scope) are shown in Figure 6 and Figure 7, respectively. The average values of 1024 slopes and 1024 intercepts under each scale are listed in Table 5.
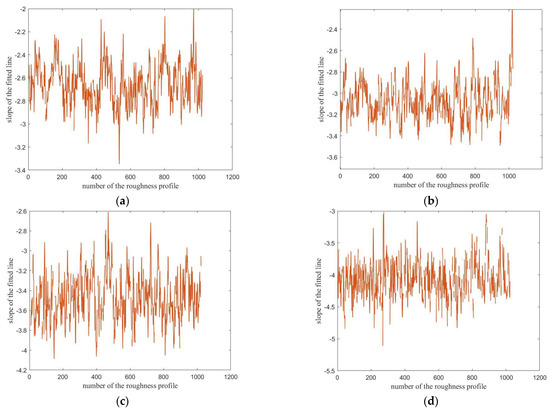
Figure 6.
Results of 1024 slopes under each scale (WC-Ni). (a) 100; (b) 50; (c) 25; (d) 10.
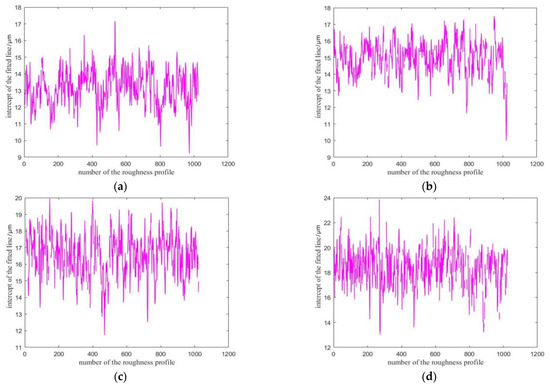
Figure 7.
Results of 1024 intercepts under each scale (WC-Ni). (a) 100; (b) 50; (c) 25; (d) 10.

Table 5.
Average slopes and intercepts under different measurement frequencies (WC-Ni).
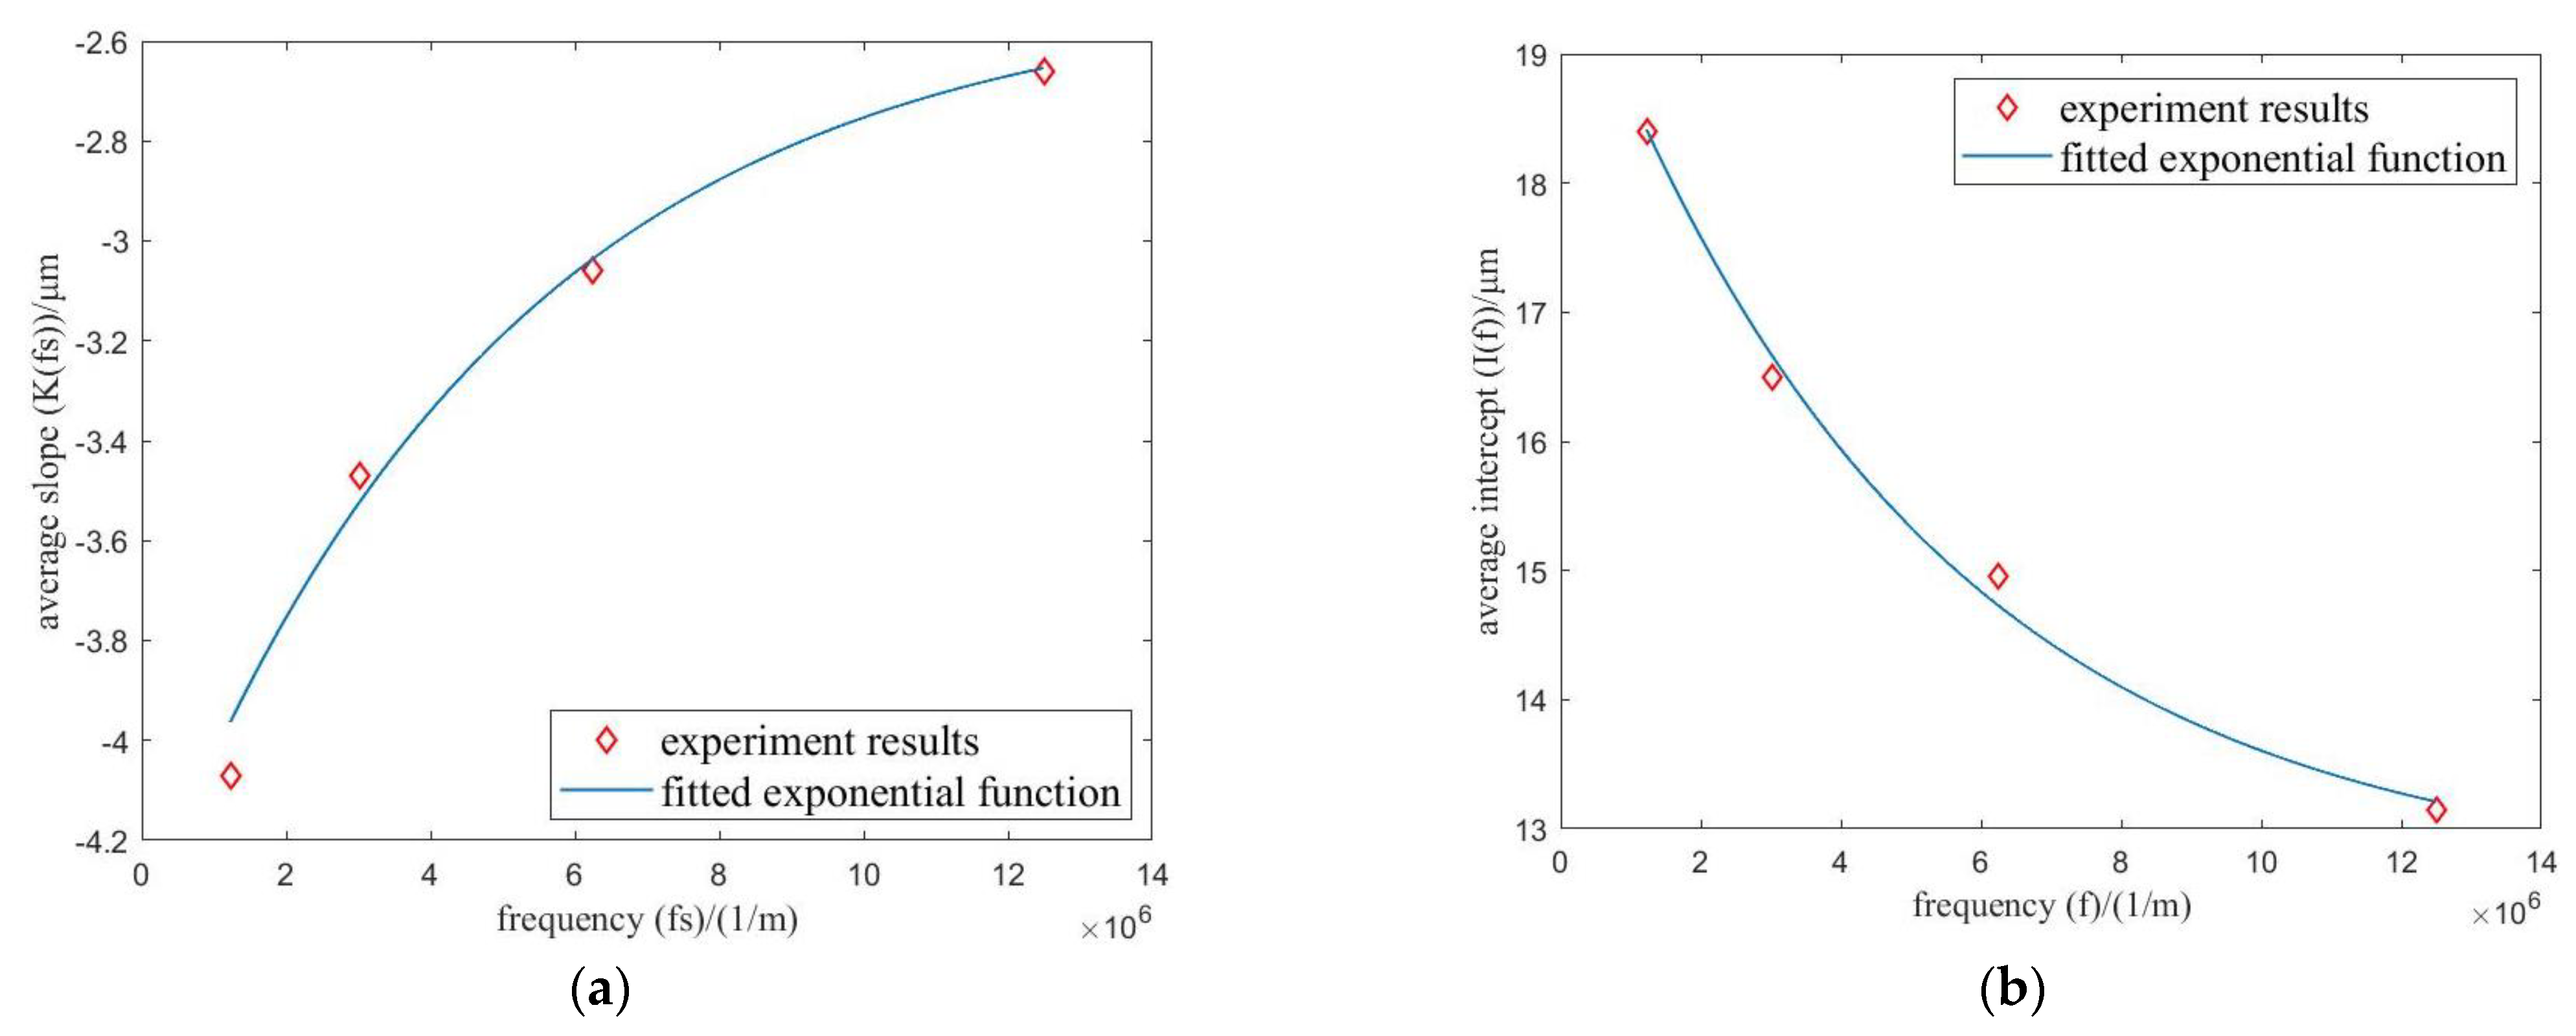
The multi-scale functions K() and I() of slopes and intercepts could be fitted with their average values according to Equation (12), as shown in Figure 8. The slopes and intercepts tend to converge to a certain value with increasing measurement frequency. When the measurement frequency approaches infinite, the measurement result could be regarded as the actual surface topography, which is the ideal fractal characteristic.
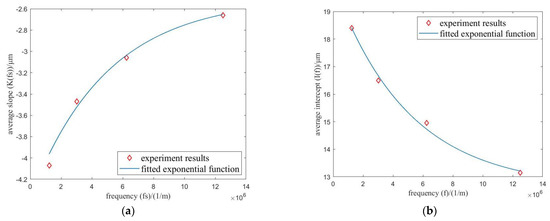
Figure 8.
Experiment results and fitted exponential function (WC-Ni). (a) slopes; (b) intercepts.
According to Figure 8, the fitted functions could be written as Equations (15) and (16), the goodness of fitting . In Equations (15) and (16), the exponential functions E() and S() represent the offset components that changed with scales, while the existence of constants c and b represents the ideal fractal components.
Based on the assumption in Section 2.3, the proposed method is verified through the existence of the constants c and b; thus, the fractal dimension D and the scale coefficient G could be obtained with uniqueness according to Equations (13) and (14). For this experiment, the results were D = 1.3 and G = . Such D and G are regarded as the ideal fractal parameters for this surface.
3.2.2. Results of 9Cr18Mo Surface
For this additional experiment, the surface topography of 9Cr18Mo is measured under three scope magnifications: 100, 50, and 10. The process is the same as that of the WC-Ni surface. The results of 1024 slopes and 1024 intercepts under each scale are shown in Figure 9 and Figure 10, respectively. The norm plots of them are also presented. Linearity is revealed from their norm plots, which represent a Gaussian random characteristic. The average values of 1024 slopes and 1024 intercepts under each scale are listed in Table 6.

Figure 9.
Results of 1024 slopes under each scale (9Cr18Mo). (a) 100; (b) 50; (c) 10.

Figure 10.
Results of 1024 intercepts under each scale (9Cr18Mo). (a) 100; (b) 50; (c) 10.

Table 6.
Average slopes and intercepts under different measurement frequencies (9Cr18Mo).
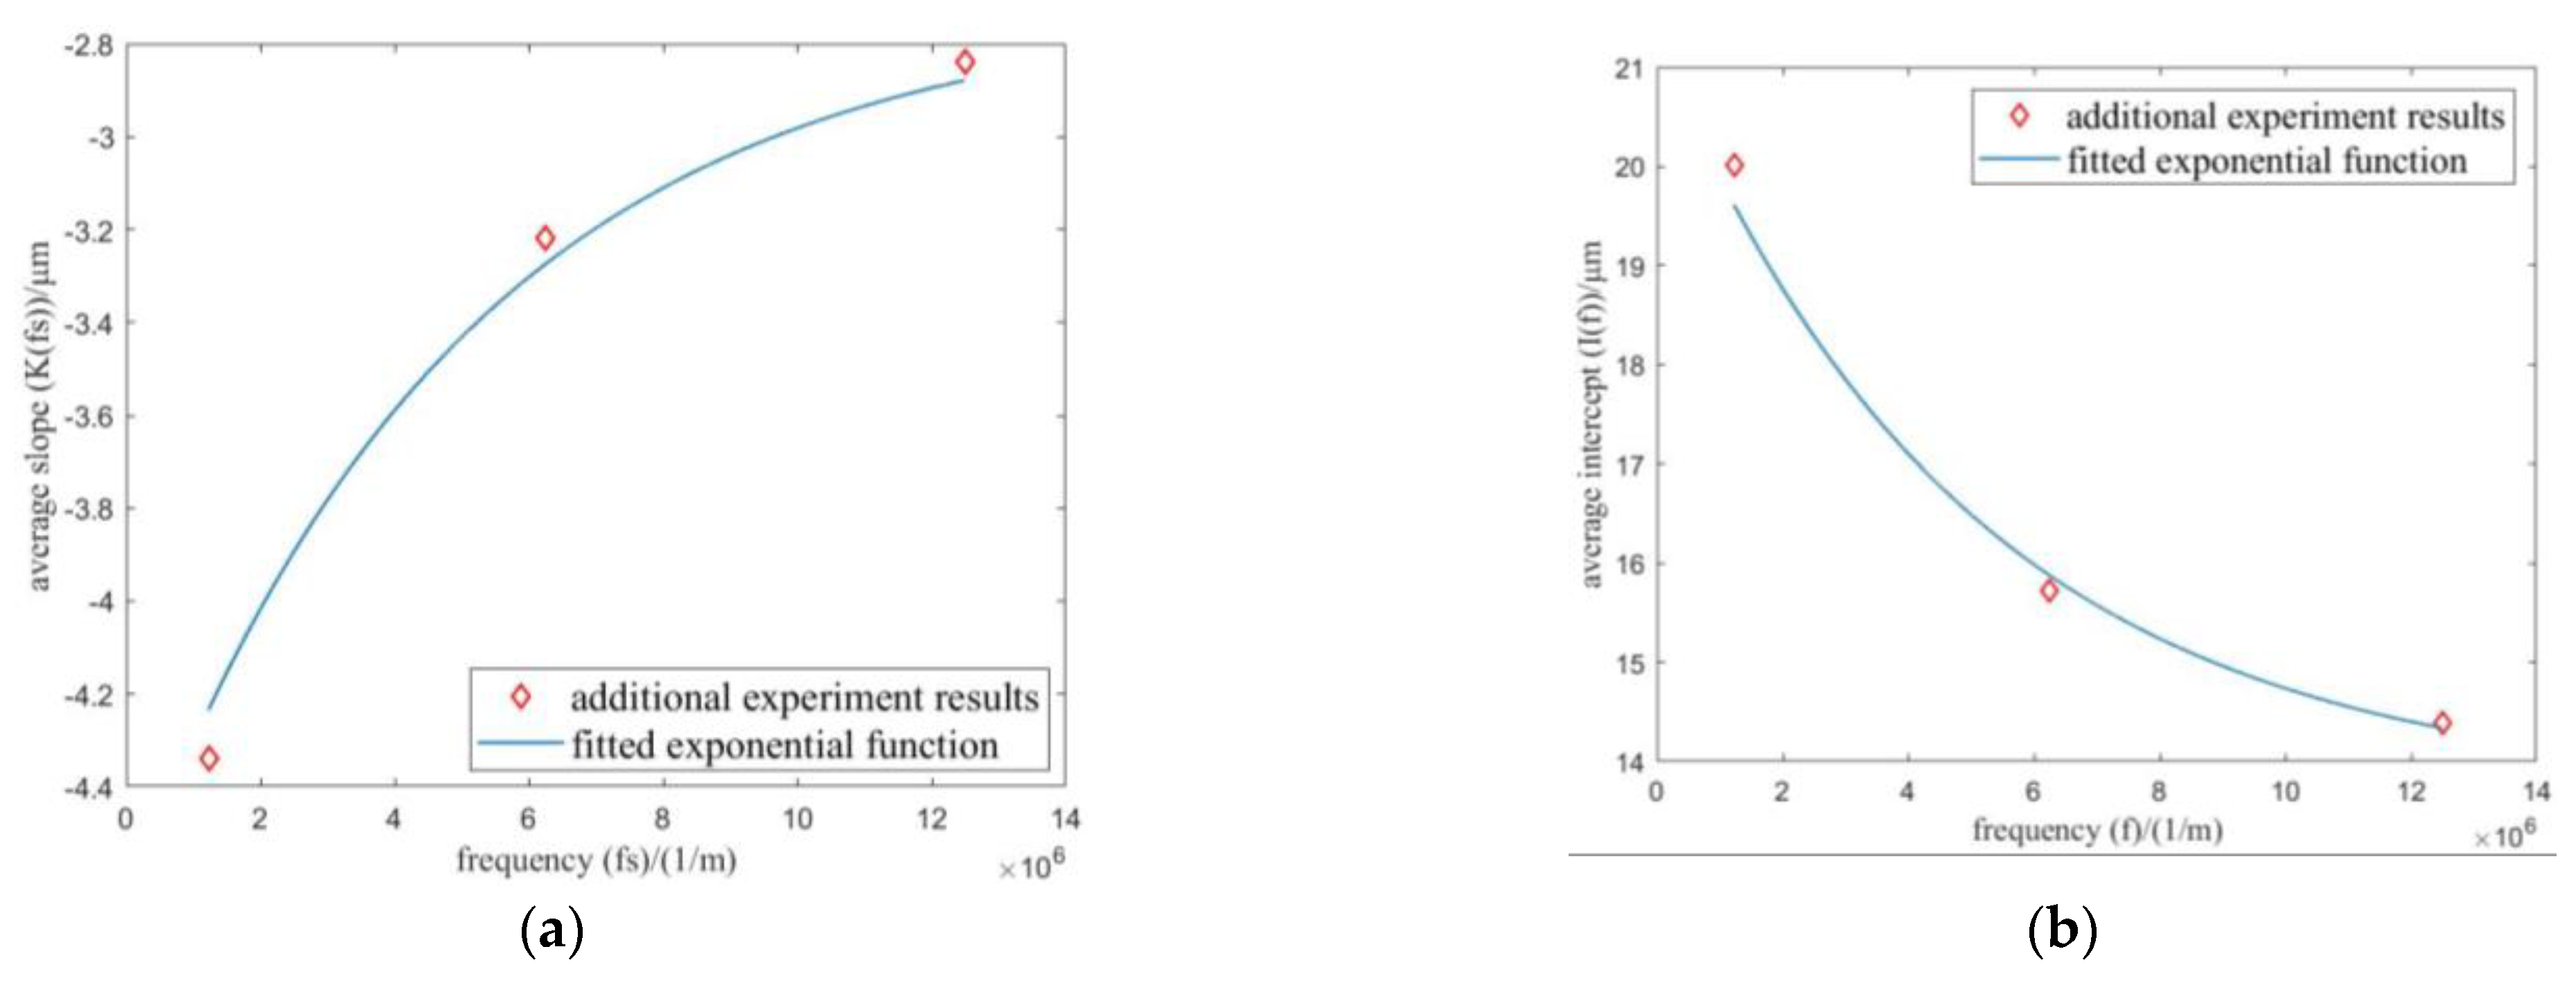
The average values of slopes and intercepts could be fitted according to Equations (17) and (18), as shown in Figure 11.
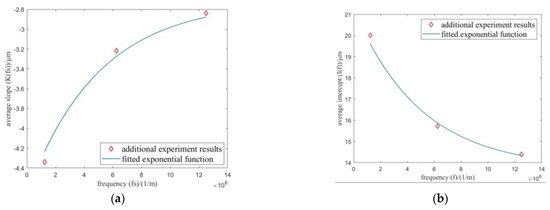
Figure 11.
Experiment results and fitted exponential function (9Cr18Mo). (a) slopes; (b) intercepts.
According to Figure 11, the fitted functions could be written as Equations (17) and (18), the goodness of fitting . In Equations (17) and (18), the exponential functions E() and S() represent the offset components that change with scales, while the constants c and b represent the unique fractal components.
The proposed method is verified through the existence of the constants c and b, the fractal dimension D, and the scale coefficient G, which could be obtained with uniqueness. For this experiment, the resulted ideals were D = 1.2 and G = . Such D and G are regarded as the ideal fractal parameters for this surface.
4. Discussion
The sections above propose methods to analyze the fractal components and obtain ideal fractal parameters. Here, the characteristics of fluctuation and offset components in the experiment results and the scale-independent fractal parameters are discussed further.
4.1. Fluctuation Components
According to Equation (9), the fluctuation components could be obtained by subtracting the fitted linear function shown in Equation (19).
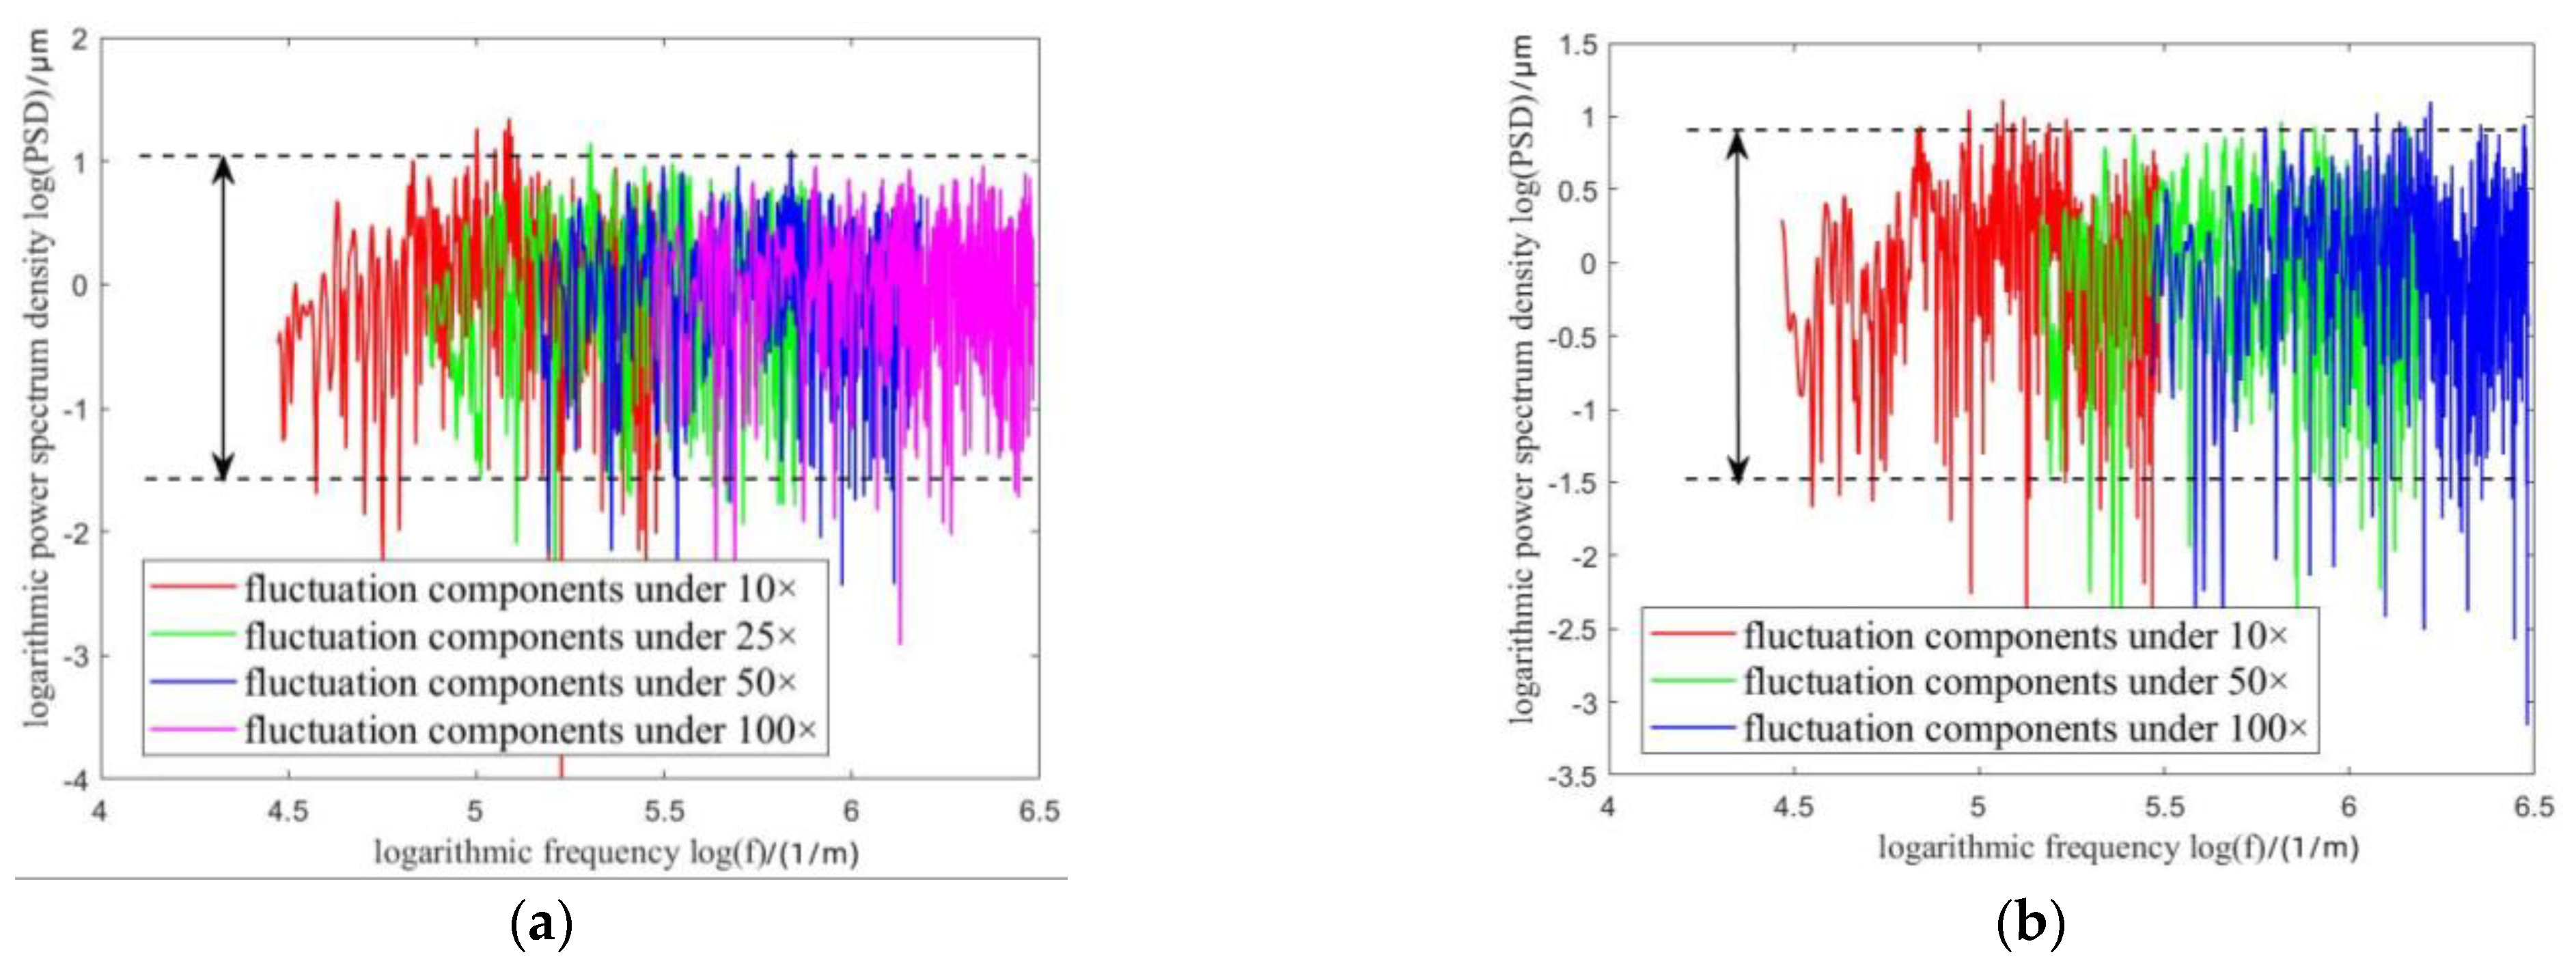
The fluctuation components of the WC-Ni surface and the 9Cr18Mo surface under multi-scales are obtained according to Equation (19), as shown in Figure 12. Table 7 and Table 8 list the detailed average values and variances of these fluctuation components. It could be revealed that the fluctuation components under each scale have approximately the same values, so the fluctuation components could be regarded as scale-independent.
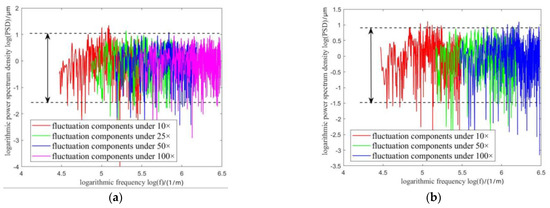
Figure 12.
Fluctuation components of WC-Ni surface under different scales. (a) WC-Ni surface; (b) 9Cr18Mo surface.

Table 7.
Detailed values of fluctuation components in WC-Ni surfaces.

Table 8.
Detailed values of fluctuation components on 9Cr18Mo surfaces.
4.2. Offset Components
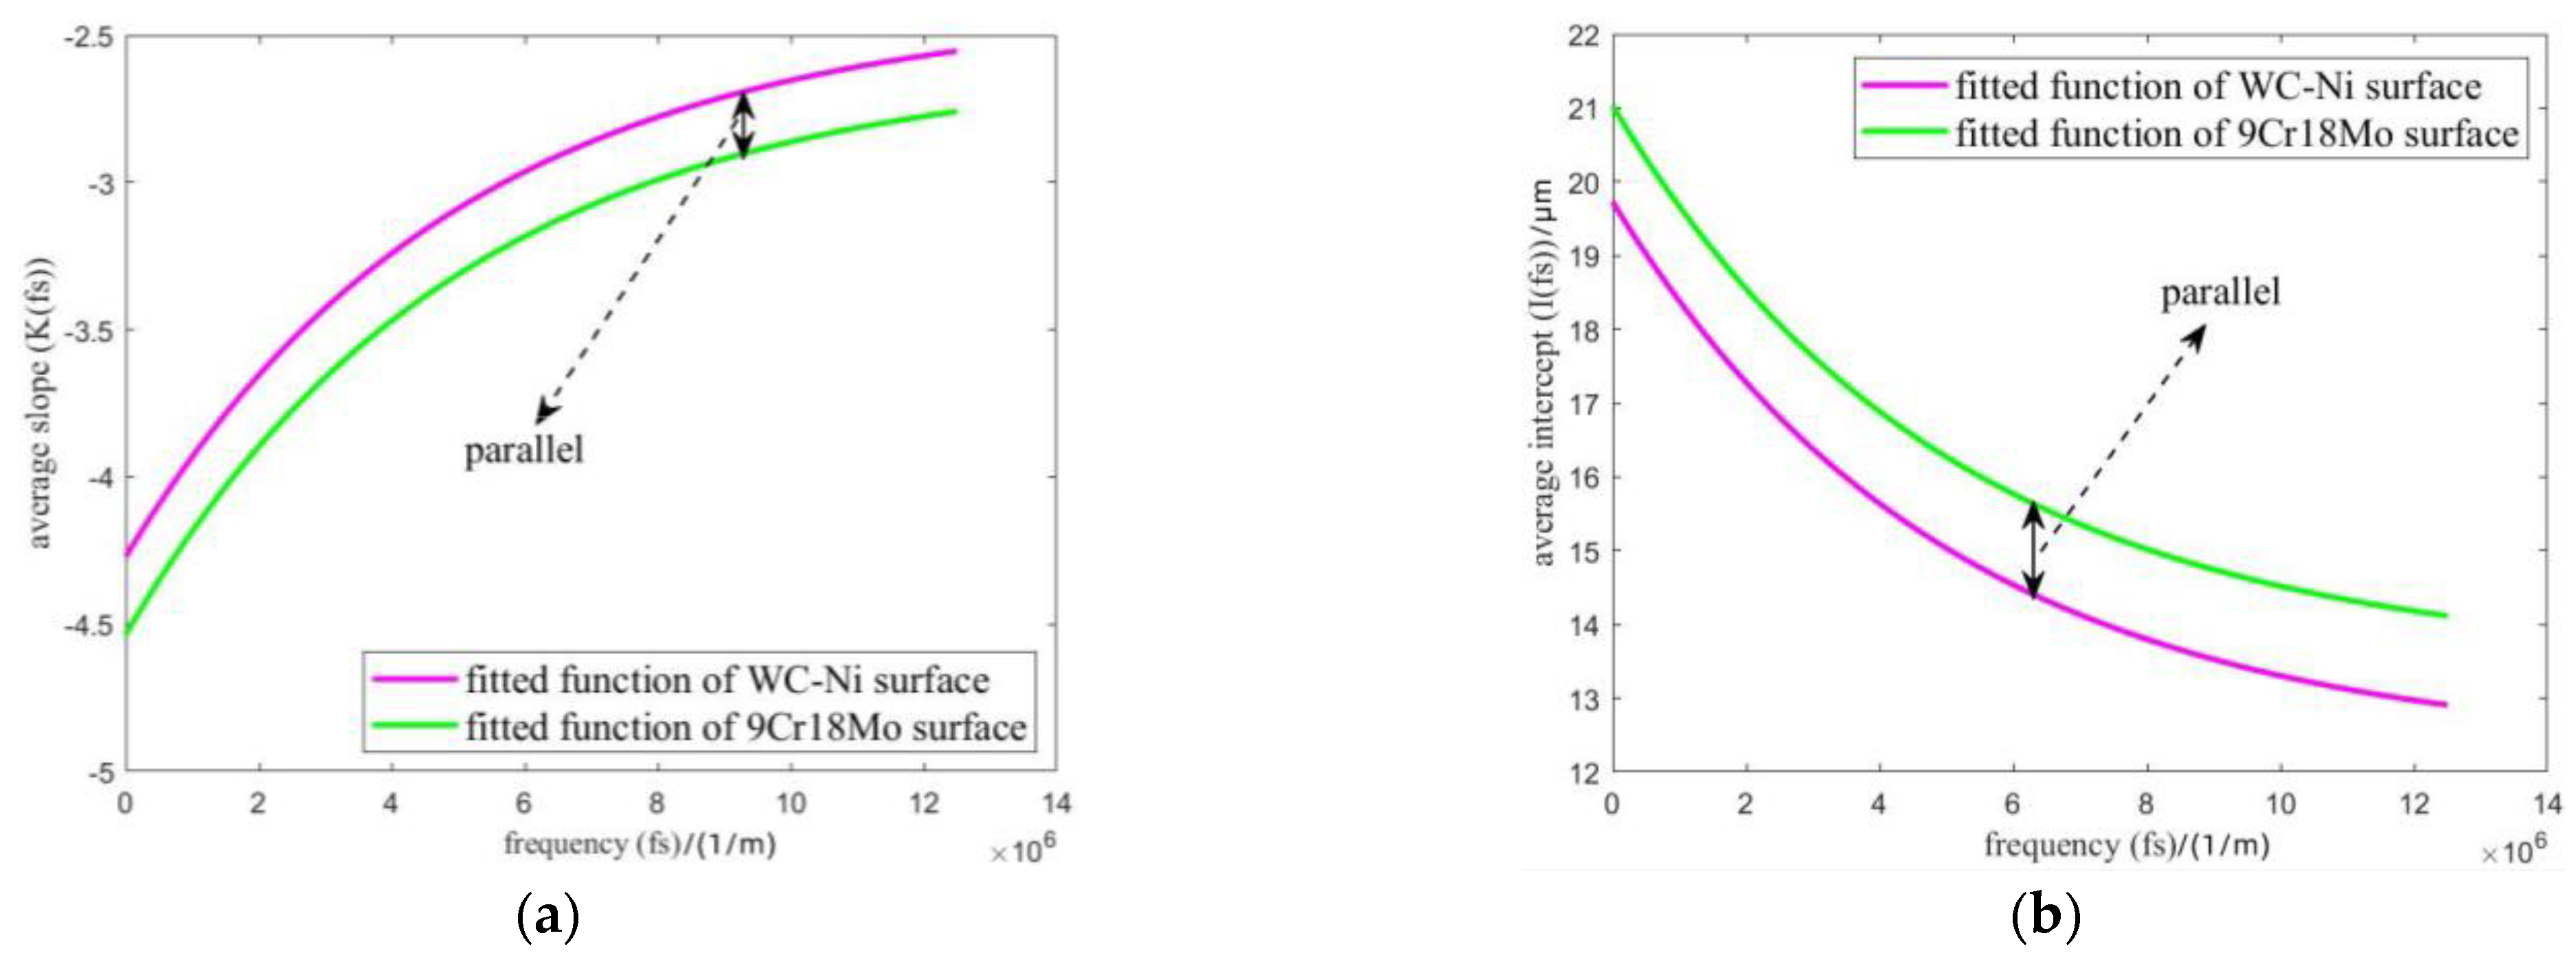
The same instrument measures the surfaces of WC-Ni and 9Cr18Mo. According to Equations (15) to (18), the regular pattern of the multi-scale fitted slopes and intercepts function is approximately the same trend for the two surfaces, as shown in Figure 13.
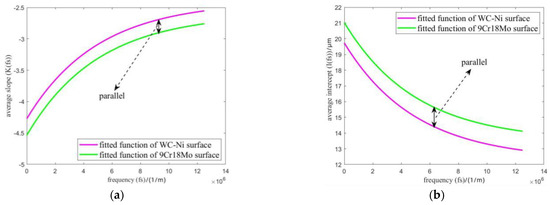
Figure 13.
Comparison of the two experimental results. (a) slopes; (b) intercepts.
The similarity could be evaluated through the relative errors between the exponential parts of the two surfaces, as shown in Equations (20) and (21). The relative errors in Figure 14a,b are 3.33% and 1.34%, respectively.
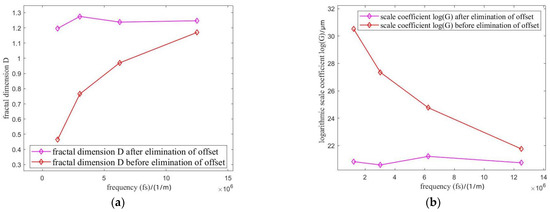
Figure 14.
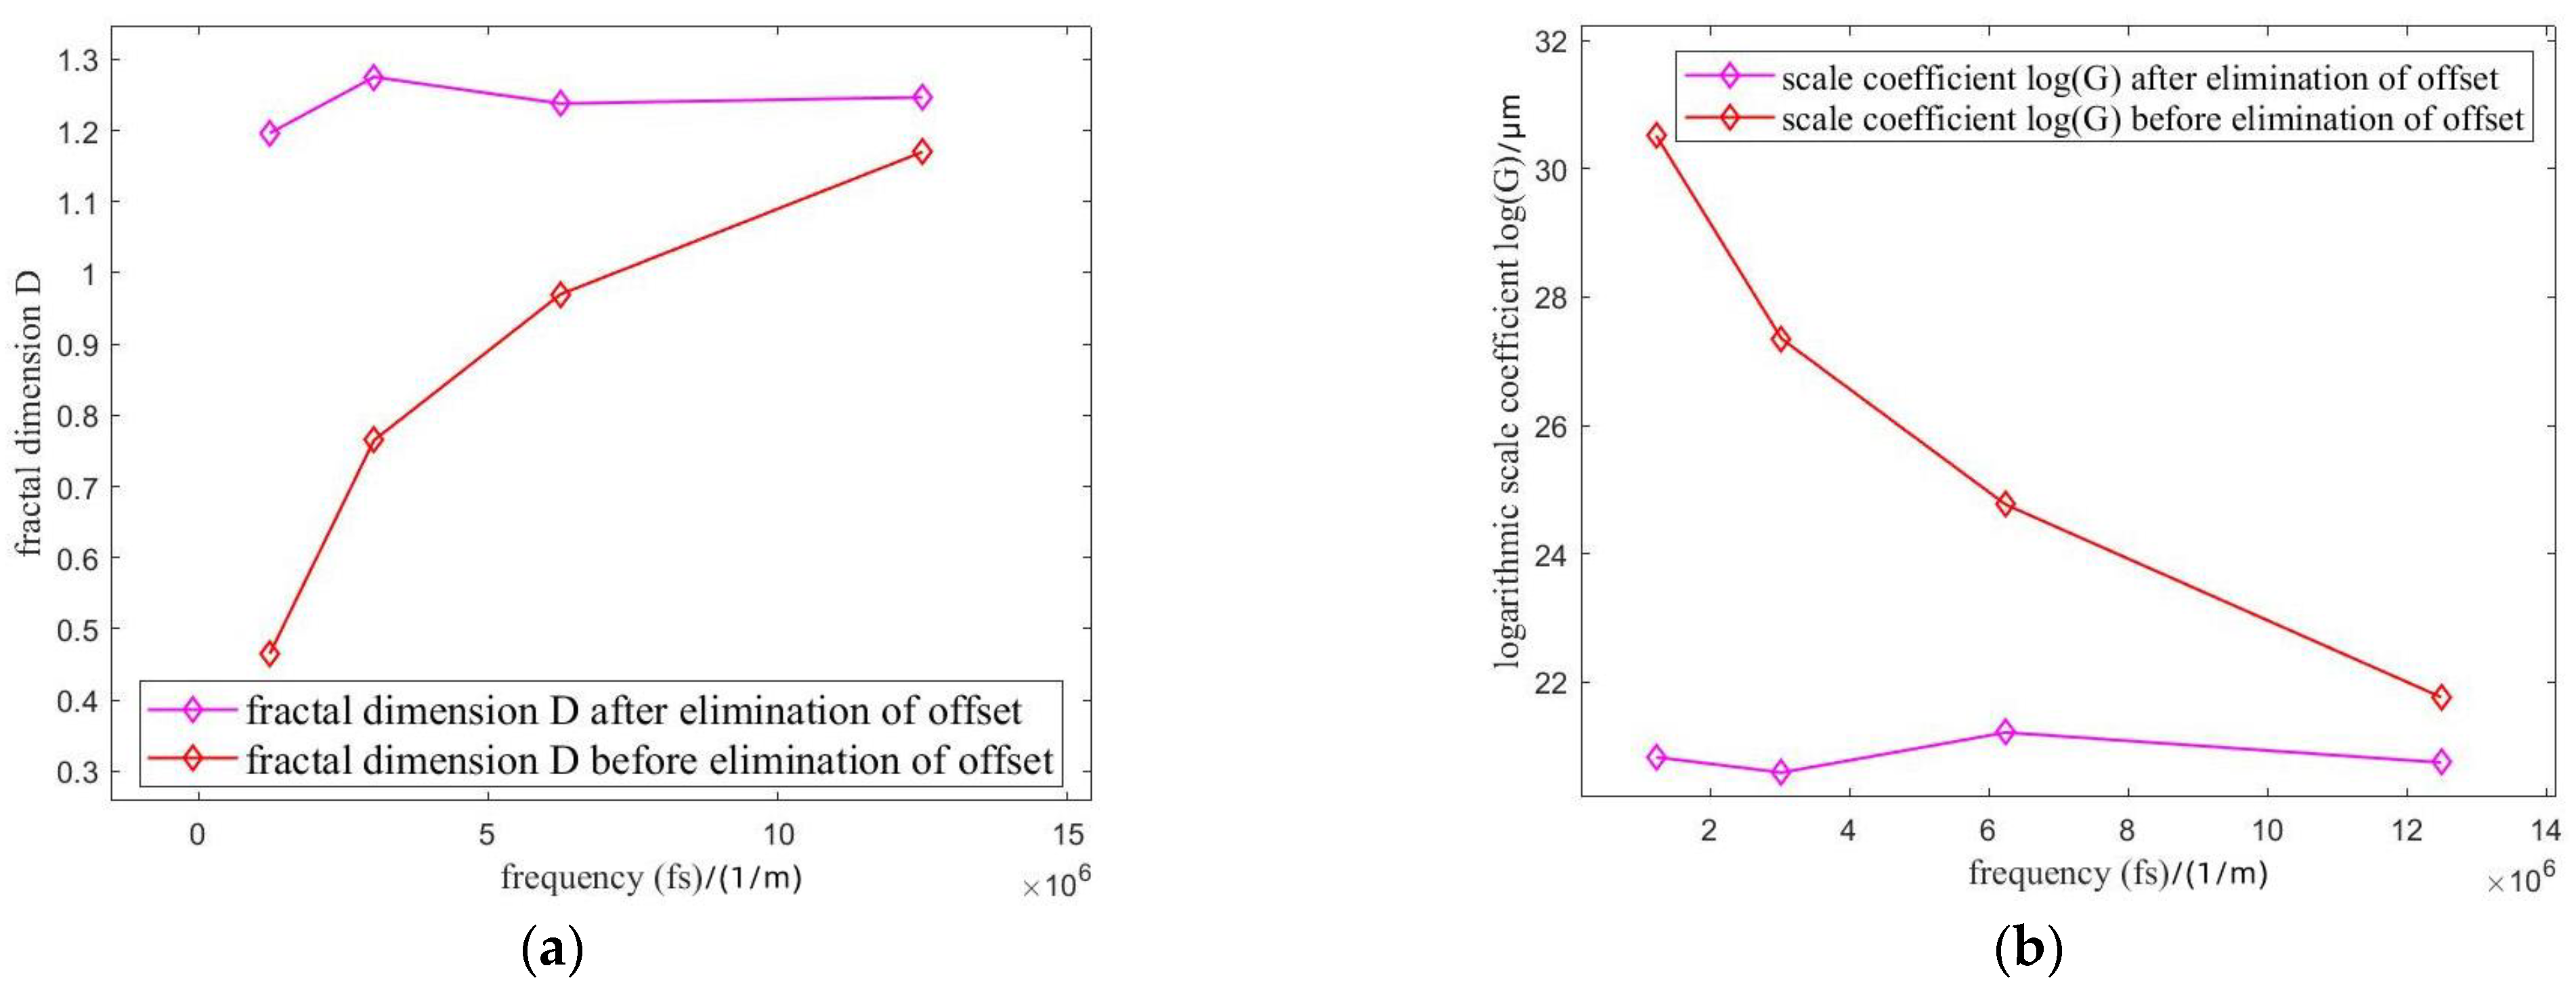
Comparison of fractal dimension D and scale coefficient G of fractal components before and after eliminating offset components. (a) D; (b) G.
Thus, it could be concluded that, on the same instrument, the same offset functions E() and S() are shared by the fitted functions K() and I() while their constants c and b are different. In other words, it could be revealed that the offset function is caused by the measurement instrument’s characteristics when noteworthy fractal characteristics exist. On this basis, a practical inspiration is that the offset function of an instrument can be calibrated before the formal measurement experiment and subtracted from the results to obtain the fractal components and parameters independent of the scale.
4.3. Fractal Components
In Section 3.2, the functions of offset components E() and S() (Equations (15) to (18)) have been calibrated. In this section, the calibrated function values of offset components are eliminated from the original slopes and intercepts values under each scale (see Equations (22) and (23)), and fractal parameters are estimated for each scale.
By checking the differences between the ideal parameters and the estimated parameters, the scale independence of the fractal parameters was verified. Taking the data of the measured surface of WC-Ni as an example, the results of the fractal dimension and scale coefficient, under each scale, before and after eliminating the influence of offset, are shown in Figure 14.
The comparison results and their errors between the ideal fractal parameters obtained in Section 3.2.1 (D = 1.3, G = ) are listed in Table 9 and Table 10. Since the errors of G before elimination are numerous, logarithmic G is applied here to calculate errors. The proposed method reveals that the scale-dependent errors are remarkably reduced. Thus, this result shows that the proposed method could be applied generally to analyze surfaces with fractal characteristics.

Table 9.
Fractal dimension D obtained by different methods and their relative errors between the ideal D.

Table 10.
Scale coefficient logG obtained by different methods and their relative errors between the ideal logG.
5. Conclusions
In this paper, an estimation method for ideal fractal parameters for multi-scale measurement of polished surface topography is launched. The detailed conclusions are listed as follows:
- (1)
- The method to obtain ideal fractal parameters of the polishing surface measured under multi-scales is proposed: firstly, determining the scale-free region through a modified W–M function with a non-integer frequency index; then decomposing the surface PSD into three components: fractal, fluctuation, and offset; and finally, obtaining the fractal components by filtering the fluctuation components and eliminating the scale-dependent influence of the offset components.
- (2)
- Experiments are designed to verify the proposed method. Polished WC-Ni and 9Cr18Mo surfaces are measured under multiscales by the same instrument. The results show that ideal fractal parameters were obtained for the two surfaces: for the WC-Ni surface, ideal fractal dimension D = 1.3 and scale coefficient G = ; for the 9Cr18Mo surface, ideal fractal dimension D = 1.2 and scale coefficient G = .
- (3)
- Experiment results show that the offset components have the same regular pattern for different surfaces on the applied measurement instrument in this study. Thus, scale-independent fractal parameters were obtained by eliminating the calibration error of the offset components under each scale. The maximum relative error between the obtained fractal parameters and ideal parameters is 7.98%. The experiment results also reveal that the fluctuation components are scale-independent.
Author Contributions
Conceptualization, H.L. (Hongju Li) and Y.L.; methodology, H.L. (Hongju Li) and Y.W.; software, H.L. (Hongju Li); validation, H.L. (Hongju Li) and H.L. (Haoran Liao); formal analysis, H.L. (Hongju Li); investigation, H.L. (Hongju Li), Y.W. and H.L. (Haoran Liao); resources, Y.L.; data curation, H.L. (Hongju Li); writing-original draft preparation, H.L. (Hongju Li); writing-review and editing, H.L. (Hongju Li), Y.L., Y.W. and H.L. (Haoran Liao); visualization, H.L. (Hongju Li), Y.W. and H.L. (Haoran Liao); supervision, Y.L.; project administration, Y.L.; funding acquisition, Y.L. All authors have read and agreed to the published version of the manuscript.
Funding
This research was funded by the National Natural Science Foundation of China (51975315) and the National Science and Technology Major Project (2019-IV-0020-0088).
Data Availability Statement
The data that support the findings of this study are included in the article.
Conflicts of Interest
The authors declare no conflict of interest.
Nomenclature
| D | fractal dimension |
| G | scale coefficient |
| P | power spectrum density |
| constant related to frequency | |
| z | surface topography height |
| x | coordinate point |
| n | frequency index |
| lower cut-off frequency index | |
| upper cut-off frequency index | |
| phase position | |
| modified W–M function for filter | |
| adjustment parameter | |
| l | characteristic lateral length |
| measurement interval | |
| f | Natural frequency of surface |
| measurement frequency |
References
- Dong, W.P.; Sullivan, P.J.; Stout, K.J. Comprehensive study of parameters for characterizing three-dimensional surface topography: III: Parameters for characterising amplitude and some functional properties. Wear 1994, 178, 29–43. [Google Scholar] [CrossRef]
- Dong, W.P.; Sullivan, P.J.; Stout, K.J. Comprehensive study of parameters for characterising three-dimensional surface topography: IV: Parameters for characterising spatial and hybrid properties. Wear 1994, 178, 45–60. [Google Scholar] [CrossRef]
- Dong, W.P.; Sullivan, P.J.; Stout, K.J. Comprehensive study of parameters for characterizing three-dimensional surface topography II: Statistical properties of parameter variation. Wear 1993, 167, 9–21. [Google Scholar] [CrossRef]
- Hu, Y.Z.; Tonder, K. Simulation of 3-D random rough-surface by 2-D digital-filter and Fourier-analysis. Int. J. Mach. Tools Manuf. 1992, 32, 83–90. [Google Scholar] [CrossRef]
- Wu, J.J. Simulation of rough surfaces with FFT. Tribol. Int. 2000, 33, 47–58. [Google Scholar] [CrossRef]
- Nayak, P.R. Random process model of rough surfaces. J. Lubr. Technol. 1971, 93, 398–407. [Google Scholar] [CrossRef]
- Majumdar, A.; Bhushan, B. Role of fractal geometry in roughness characterization and contact mechanics of surfaces. J. Tribol. 1990, 112, 205–215. [Google Scholar] [CrossRef]
- Zahouani, H.; Vargiolu, R.; Loubet, J.L. Fractal models of surface topography and contact mechanics. Math. Comput. Model. 1998, 28, 517–534. [Google Scholar] [CrossRef]
- Sayles, R.S.; Thomas, T.R. Surface topography as a non-stationary random process. Nature 1978, 271, 431–434. [Google Scholar] [CrossRef]
- Majunmdar, A.; Tien, C. Fractal characterization and simulation of rough surfaces. Wear 1990, 136, 313–327. [Google Scholar] [CrossRef]
- Majumdar, A.; Bhushan, B. Fractal model of elastic-plastic contact between rough surfaces. J. Tribol. 1991, 113, 1–11. [Google Scholar] [CrossRef]
- Bhushan, B.; Majumdar, A. Elastic-plastic contact model for bifractal surfaces. Wear 1992, 153, 53–64. [Google Scholar] [CrossRef]
- Morag, Y.; Etsion, I. Resolving the contradiction of asperities plastic to elastic mode transition in current contact models of fractal rough surfaces. Wear 2007, 262, 624–629. [Google Scholar] [CrossRef]
- Wen, R.J.; Sinding-Larsen, R. Uncertainty in fractal dimension estimated from power spectra and variograms. Math. Geol. 1997, 29, 727–753. [Google Scholar] [CrossRef]
- Berry, M.V.; Lewis, Z.V. On the Weierstrass-Mandelbrot Fractal Function. Proc. R. Soc. Lond. 1980, 370, 459–484. [Google Scholar] [CrossRef]
- Ausloos, M.; Berman, D.H. A Multivariate Weierstrass-Mandelbrot Function. Proc. R. Soc. A Math. Phys. Eng. Sci. 1985, 400, 331–350. [Google Scholar]
- Pérez-López, R.; Paredes, C. On measuring the fractal anisotropy of 2-D geometrical sets: Application to the spatial distribution of fractures. Geoderma 2006, 134, 402–414. [Google Scholar] [CrossRef]
- Xue, D.J.; Liu, Y.T.; Zhou, H.W.; Wang, J.Q.; Liu, J.F.; Zhou, J. Fractal Characterization on Anisotropy and Fractal Reconstruction of Rough Surface of Granite Under Orthogonal Shear. Rock Mech. Rock Eng. 2020, 53, 1225–1242. [Google Scholar] [CrossRef]
- Wu, J.J. Characterization of fractal surfaces. Wear 2000, 239, 36–47. [Google Scholar] [CrossRef]
- Podsiadlo, P.; Stachowiak, G.W. Scale-invariant analysis of wear particle surface morphology: II. Fractal Dimension. Wear 2000, 242, 180–188. [Google Scholar] [CrossRef]
- Tang, G.J.; Du, B.Q.; Wang, S.L. Scaleless band automatic identification for fractal fault diagnosis of rotro system. J Power Eng 2009, 29, 440–444. [Google Scholar]
- Fang, Z.J.; Zhou, Y.H.; Zou, D.W.; Zhou, J.; Zhang, Z.H. Efficient scheme for determining fractal scaleless range. J. Infrared Millim. Waves 2004, 23, 321–324. [Google Scholar] [CrossRef]
- Goerke, D.; Willner, K. Normal contact of fractal surfaces-experimental and numerical investigations. Wear 2008, 264, 589–598. [Google Scholar] [CrossRef]
- Gneiting, T.; Sevcikova, H.; Percival, D.B. Estimators of fractal dimension: Assessing the roughness of time series and spatial data. Stat. Sci. 2012, 27, 247–277. [Google Scholar] [CrossRef]
- Zhang, X.H.; Xu, Y.; Jackson, R.L. An analysis of generated fractal and measured rough surfaces in regards to their multi-scale structure and fractal dimension. Tribol. Int. 2017, 105, 94–101. [Google Scholar] [CrossRef]
- Ganti, S.; Bhushan, B. Generalized fractal analysis and its applications to engineering surfaces. Wear 1995, 180, 17–34. [Google Scholar] [CrossRef]
- Miao, X.M.; Huang, X.D. A complete contact model of a fractal rough surface. Wear 2014, 309, 146–151. [Google Scholar] [CrossRef]
- Zhang, X.L.; Wang, Y.S.; Wen, S.H.; Fan, S.R.; Chen, Y.H.; Lan, G.S. Logarithmic wavelet spectrum method for computing fractal dimension of machined surface profiles. China Mech. Eng. 2016, 27, 3142–3148. [Google Scholar] [CrossRef]
- Li, H.J.; Liu, Y.; Wang, Y.C.; Liao, H.R. Extraction method to ensure the uniqueness of scale-free region in surface fractal PSD equation. Surf. Topogr. Metrol. Proporties 2022, 10, 025017. [Google Scholar] [CrossRef]
Disclaimer/Publisher’s Note: The statements, opinions and data contained in all publications are solely those of the individual author(s) and contributor(s) and not of MDPI and/or the editor(s). MDPI and/or the editor(s) disclaim responsibility for any injury to people or property resulting from any ideas, methods, instructions or products referred to in the content. |
© 2022 by the authors. Licensee MDPI, Basel, Switzerland. This article is an open access article distributed under the terms and conditions of the Creative Commons Attribution (CC BY) license (https://creativecommons.org/licenses/by/4.0/).


