Article

Pore-Fracture Evolution and Fractal Characteristics of Deep Coal Under Coupled Seepage and Mining-Induced Stress


1
Information Institute of the Ministry of Emergency Management of the PRC, Beijing 100029, China
2
College of Energy and Mining Engineering, Xi’an University of Science and Technology, Xi’an 710054, China
3
Institut für Geotechnik, Universität für Bodenkultur Wien (BOKU University), Feistmantelstraße 4, 1180 Vienna, Austria
4
School of Smart Construction and Energy Engineering, Hunan Institute of Engineering, Xiangtan 411104, China
*
Authors to whom correspondence should be addressed.
Fractal Fract. 2026, 10(9), 634; https://doi.org/10.3390/fractalfract10090634
Submission received: 8 August 2026 / Revised: 7 September 2026 / Accepted: 9 September 2026 / Published: 11 September 2026

Abstract

Clarifying the evolution of pore-fracture structure (PFS) and the associated seepage mechanisms of deep coal under coupled seepage and mining-induced stress is important for the safe and efficient in situ fluidized mining of deep coal resources. In this study, a nuclear magnetic resonance (NMR) online triaxial testing system was used to conduct coupled seepage–mining-induced stress tests under different seepage pressures, following a mining-induced stress path characterized by increasing axial stress and decreasing confining pressure. Transverse relaxation time (T2) spectra and nuclear magnetic resonance imaging (NMRI) were combined to characterize the dynamic evolution of PFS in terms of its spatial distribution, pore volume, mean pore size, pore compressibility, and fractal characteristics. The results show that, based on the NMRI characteristics, the deformation and failure process of coal can be divided into three stages: compaction and elastic deformation, PFS propagation, and post-peak failure. Across the tested specimens, higher seepage pressure was associated with an earlier onset of PFS propagation, a lower PFS damage threshold, and enhanced PFS propagation and connectivity. The volumes of adsorption pores (APs), seepage pores and fractures (SPFs), and total pores (TPs) generally increase initially and then decrease during the compaction and elastic deformation stage, increase slowly or remain relatively stable during the PFS propagation stage, and increase sharply at the peak-strength point, with the magnitude of the increase differing among the three tested specimens. The mean pore size, represented by T2g, initially increases and then gradually stabilizes with increasing strain, followed by a rapid increase at the peak-strength point. For specimen M2, SPF exhibited a substantially stronger compressibility response than AP and TP at the peak-strength point. The fractal dimension of SPF remains relatively stable before the peak strain but decreases sharply at the peak strain, indicating reduced structural complexity and enhanced connectivity of SPF. These observations suggest that, in the tested specimens, SPF expansion and coalescence under coupled seepage and mining-induced stress were associated with the reorganization of the internal seepage pathways of coal. These findings provide an experimental basis for evaluating stress-dependent permeability, gas transport pathways, and seepage-related failure risks in deep coal under mining-induced stress.

1. Introduction

During deep coal mining, mining disturbance significantly alters the stress state of coal ahead of the working face, with a progressive increase in vertical stress accompanied by a decrease in horizontal stress [1]. This stress redistribution directly affects the internal structure of coal, altering the morphology and connectivity of the pore-fracture structure (PFS) and consequently inducing dynamic changes in porosity and permeability [2,3]. In turn, variations in porosity and permeability further affect seepage pressure distribution and the effective stress field, resulting in two-way stress–seepage–deformation coupling. Therefore, investigating the mechanical behavior and PFS evolution of coal under coupled mining-induced stress and seepage is of considerable theoretical and engineering significance for the safe and efficient exploitation of deep coal resources and the prevention of mining-induced hazards.
Previous studies have extensively investigated the behavior of rock and coal under coupled seepage and stress conditions. Zhang et al. [4] conducted coupled seepage–mining-induced stress tests on deep sandstone using a Rock Top multi-field coupling testing system. They found that the dominant deformation mode shifted from axial to circumferential deformation, while the energy storage capacity was highest during the elastic stage and was jointly affected by the unloading level and seepage pressure. Tan et al. [5] investigated the mechanical response, energy evolution, and damage constitutive behavior of water-saturated sandstone under the combined effects of pore water pressure and stress. Hu et al. [6] systematically examined the mechanical behavior and permeability evolution of damaged granite under coupled stress and seepage, revealing its seepage mechanism and strength degradation characteristics. Zhang et al. [7] investigated the mechanical response, permeability evolution, energy dissipation, and constitutive behavior of granite subjected to confining pressure and pore water pressure under deep mining conditions. Based on elastic damage mechanics, poroelasticity, and the effective stress principle, Li et al. [8] reproduced the rock failure process using COMSOL and explored the failure mechanisms and seepage pressure distribution at characteristic points under different hydro-mechanical coupling conditions. Overall, previous studies on coupled seepage and mining-induced stress have predominantly focused on macroscopic mechanical responses, permeability evolution, and failure behavior, whereas the real-time evolution of the internal PFS and its quantitative linkage to seepage-related parameters remain insufficiently characterized.
Current methods for characterizing PFS in coal include low-temperature nitrogen adsorption (LTNA) [9,10,11,12], mercury intrusion porosimetry (MIP) [10,11,12,13,14], scanning electron microscopy (SEM) [15], and computed tomography (CT) [16]. Although these techniques can effectively characterize PFS in coal, each has inherent limitations. LTNA and MIP cannot directly characterize PFS under mechanical loading conditions [17], while SEM has limited capability for characterizing the overall PFS of a specimen [18]. CT enables real-time observation of porous media under external loading, but its detectable pore-size range is limited, primarily capturing macropores and fractures [17]. Therefore, investigating the real-time evolution of PFS in coal under coupled seepage and stress requires an experimental system capable of simultaneously applying mechanical loading and monitoring dynamic PFS evolution.
In recent years, nuclear magnetic resonance (NMR) has been increasingly applied in energy and mining research because of its rapid and nondestructive characteristics [19,20,21,22,23]. With advances in NMR technology, NMR systems can now be integrated with mechanical loading devices, enabling real-time in situ observation of PFS evolution in coal under triaxial stress conditions [17,19]. Zhou et al. [17,19] and Zhao et al. [24,25] conducted online triaxial NMR tests on coal and investigated PFS evolution during triaxial compression. Jia et al. [26] pioneered online triaxial NMR creep tests to characterize PFS evolution during creep. Zhang et al. [27] developed an NMR-compatible true triaxial loading cell and conducted true triaxial NMR tests considering in situ stress conditions to investigate the dynamic evolution of PFS in coal. These studies have demonstrated the applicability of T2 spectra, NMRI, fractal analysis, and NMR-based pore characterization for investigating coal PFS evolution under conventional triaxial compression, creep, and in situ stress conditions. However, these parameters have rarely been evaluated in an integrated manner under the simultaneous effects of seepage pressure and a mining-induced stress path characterized by increasing axial stress and decreasing confining pressure. In particular, the coupled evolution of the T2 spectrum, spatial PFS distribution, multiscale pore compressibility, and SPF fractal dimension under different seepage pressures, and their implications for seepage-pathway evolution, remain insufficiently quantified.
Therefore, this study employed an online triaxial NMR testing system to investigate the real-time evolution of the stress state, PFS, and seepage behavior along a mining-induced stress path under different seepage pressures. By combining mechanical measurements, T2 spectra, and NMRI, the mechanical response, spatial PFS distribution, multiscale pore-volume evolution, mean pore size, pore compressibility, and fractal characteristics of seepage pores and fractures (SPFs) were quantitatively analyzed. These results provide experimental evidence for understanding PFS reorganization and its implications for seepage pathways in deep coal under coupled seepage and mining-induced stress.

2. Materials and Methods

2.1. Coal Specimen Preparation

The coal used in this study was collected from a working face of the Fengjiata Coal Mine in Fugu County, Yulin City, Shaanxi Province, China. A coal block approximately 30 cm × 30 cm × 30 cm was collected from the working face, carefully wrapped with plastic film and shock-absorbing bubble wrap, and transported to the laboratory. Cylindrical specimens with a diameter of 25 mm were cored parallel to the joint direction and subsequently cut and polished to a final size of 25 mm in diameter and 50 mm in length. Three specimens with smooth surfaces and no visible defects were selected for testing. All specimens were obtained from the same coal block and cored parallel to the same joint direction to minimize differences in material source and structural anisotropy. Their porosities ranged from 8.35% to 9.60%, as listed in Table 1. One specimen was tested at each seepage pressure of 1, 3, and 5 MPa. Because no replicate specimen was tested at a given seepage pressure, the present dataset does not permit statistical estimation of specimen-to-specimen variability, and the cross-pressure comparisons are therefore interpreted as mechanistic trends rather than statistically representative relationships.

2.2. Experimental Apparatus and Procedures

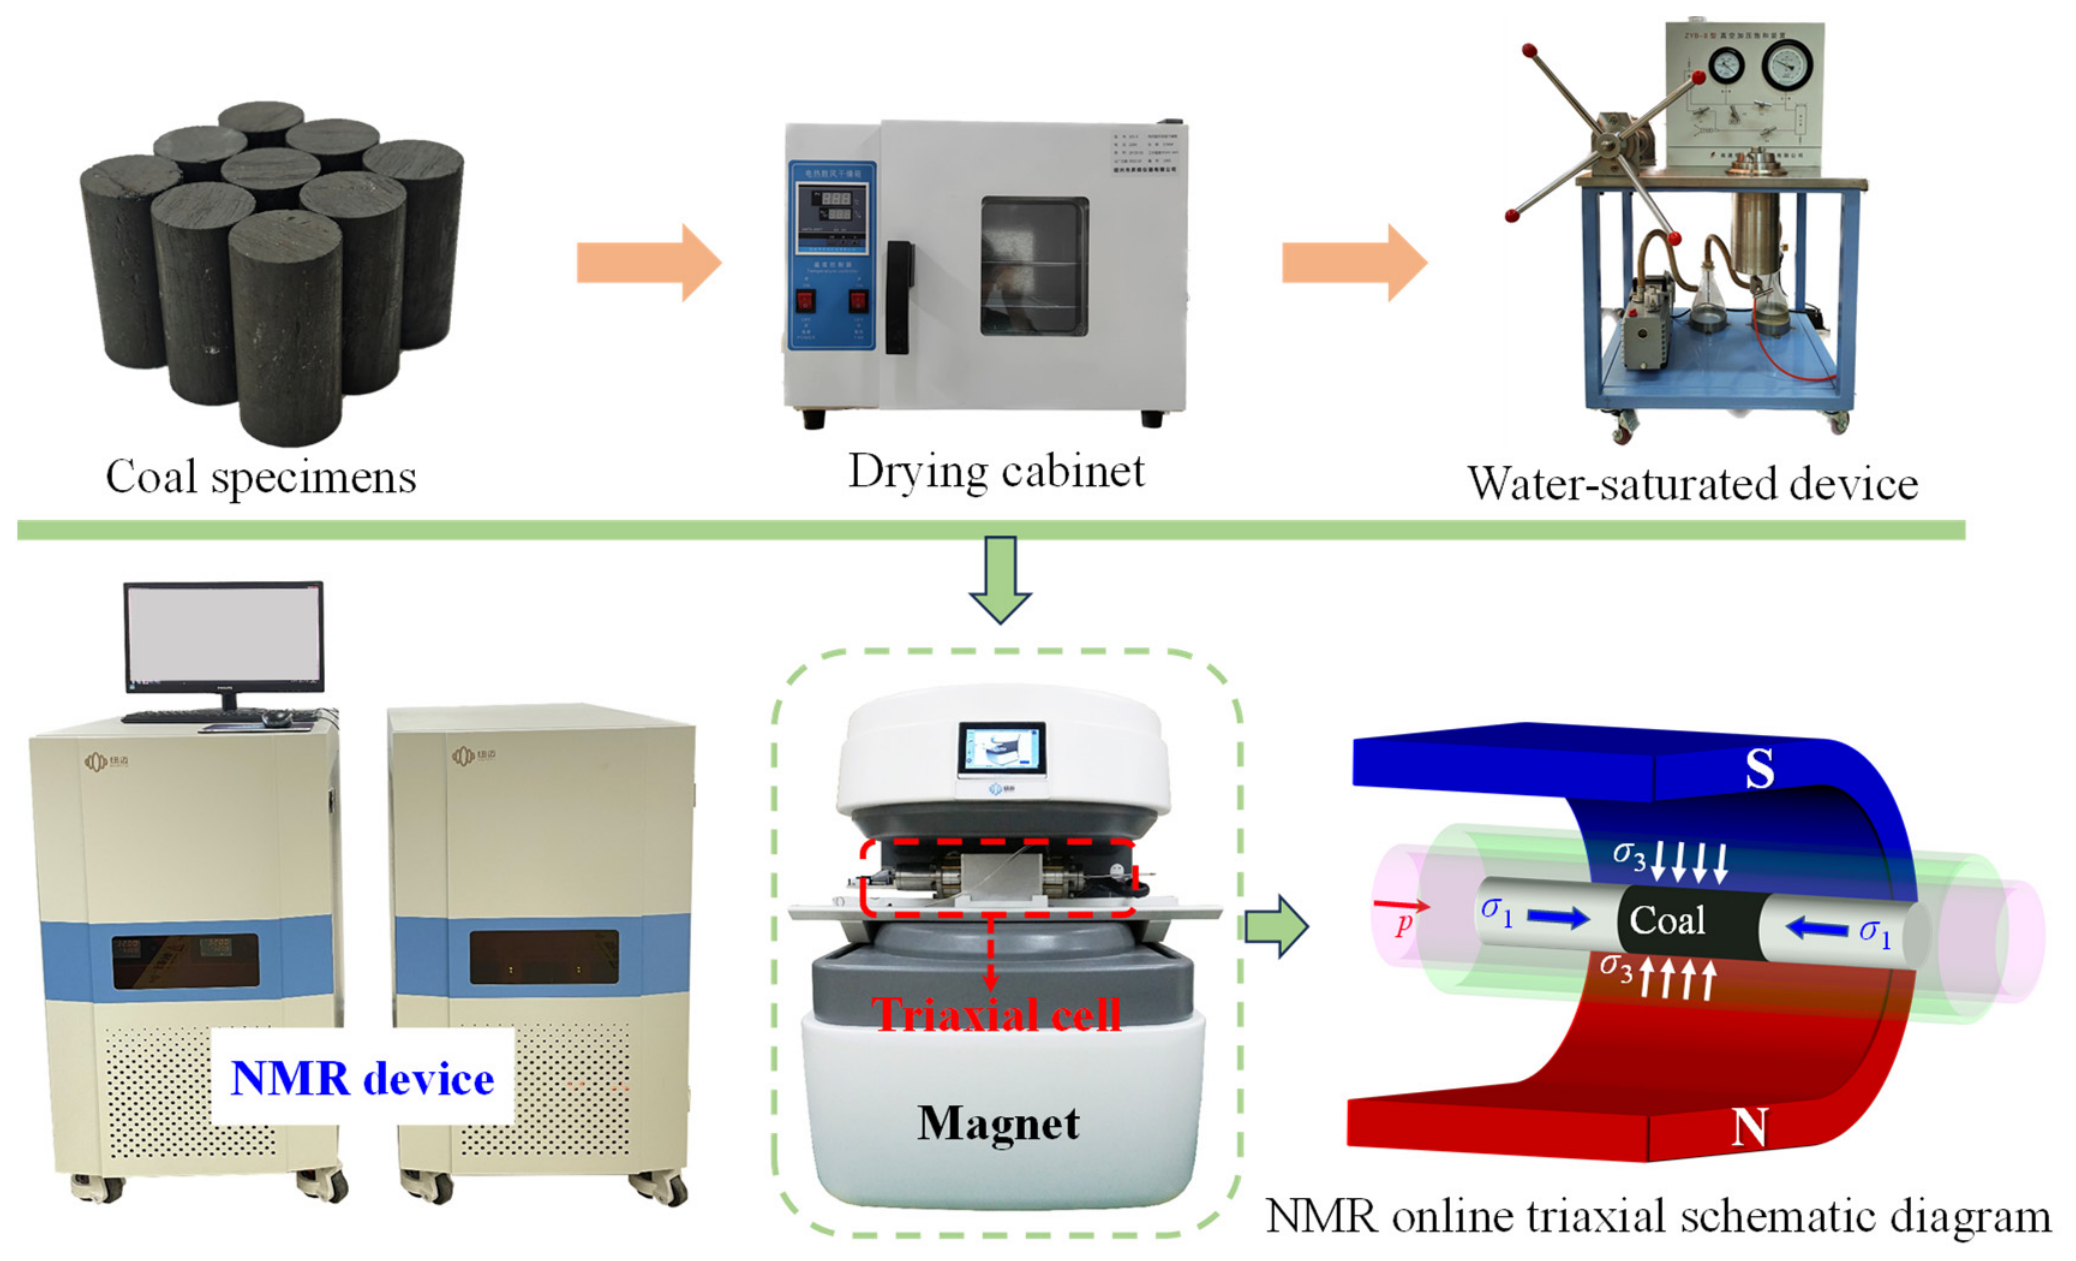
To investigate the dynamic evolution of PFS in coal under coupled stress and seepage and to enable real-time monitoring of pore-size distributions under different stress states, triaxial compression tests were conducted using an NMR analysis and imaging system equipped with a mechanical loading unit (MacroMR12-150H-I, Suzhou Niumag, Suzhou, China). As shown in Figure 1, the system can apply a maximum confining pressure of 40 MPa, a maximum axial pressure of 120 MPa, and a maximum water pressure of 25 MPa, while continuously recording stress, axial strain, temperature, and flow rate during loading. The Carr–Purcell–Meiboom–Gill (CPMG) sequence was used for NMR measurements. The echo time was set to 0.2 ms to minimize the influence of internal magnetic field gradients, and the waiting time was set to 1.5 s to ensure that the specimen returned to a stable state before each measurement. The number of echoes was set to 18,000 to fully capture the magnetization decay. Each NMR measurement consisted of 32 scans to ensure a reliable signal-to-noise ratio.
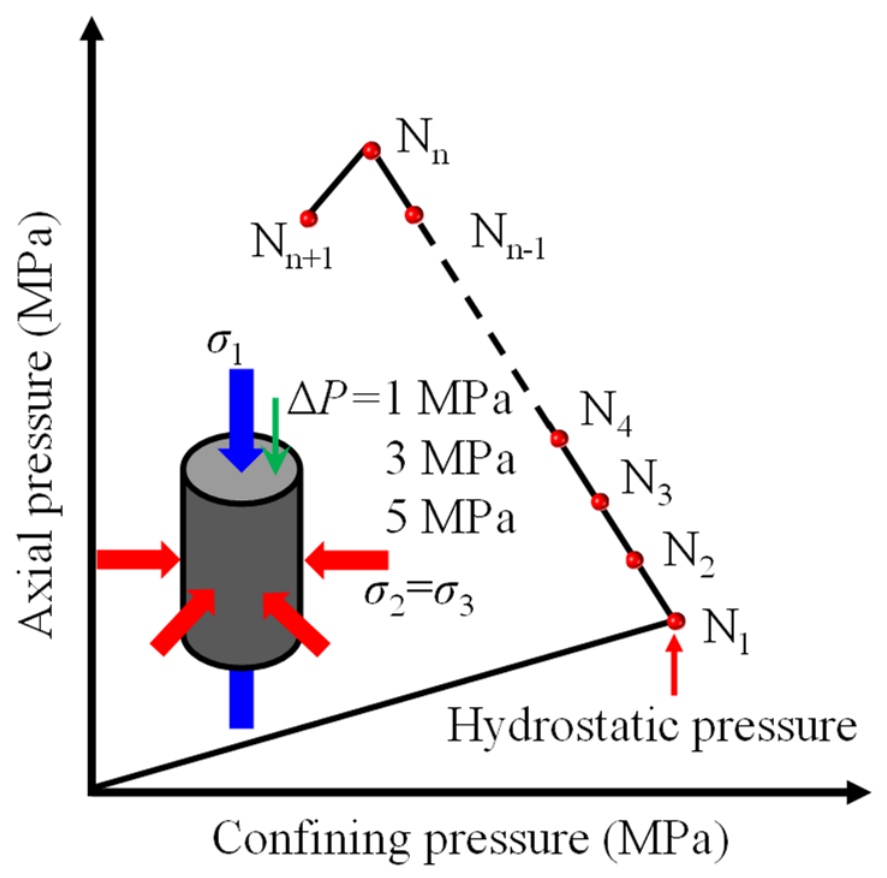
During deep coal mining, coal is subjected to the combined effects of the seepage field and disturbance induced by fluidized mining. Coal ahead of the working face experiences a transition from an initial hydrostatic stress state to progressively increasing vertical stress and gradually decreasing horizontal stress, while high seepage pressure further weakens the coal structure. Accordingly, a mining-induced stress path characterized by decreasing confining pressure and increasing axial stress was adopted (Figure 2), and NMR tests were conducted considering the effect of seepage pressure. The initial confining pressure, σ3, was set to 10 MPa, and the seepage pressures were set to 1, 3, and 5 MPa. The detailed experimental procedure was as follows:
(1)
The coal specimens were dried in a thermostatic oven at 60 °C for 24 h and then immediately weighed using a high-precision balance to obtain the dry mass.
(2)
The dried specimens were placed in a vacuum-pressure saturation device and evacuated for 2 h. The pressure was then increased to 15 MPa, and the specimens were saturated with distilled water for 24 h. After saturation, free water on the specimen surfaces was removed with tissue paper, and the saturated mass of each specimen was measured using a high-precision balance. The vacuum-pressure procedure was used to maximize water filling of the accessible pore space. However, the degree of water saturation and the residual gas fraction were not independently measured; therefore, complete water saturation cannot be quantitatively verified. Accordingly, the NMR measurements in this study are interpreted relative to the reference state established after the above saturation procedure rather than as a direct measurement of absolute pore saturation.
(3)
After the saturation procedure, the specimen was wrapped with heat-shrink tubing and installed in the core holder. The axial stress and confining pressure were simultaneously increased to 10 MPa at a rate of 3 MPa/min, after which a seepage pressure of 1 MPa was applied. Once a stable water flow was observed at the outlet, T2 and NMRI measurements were performed to obtain the initial T2 spectrum and NMRI results.
(4)
After acquisition of the initial T2 spectrum and NMRI data, the confining pressure decreased at a rate of 0.25 MPa/min, while the axial stress continuously increased at a rate of 3 MPa/min. T2 and NMRI measurements were conducted at every 6 MPa increment in axial stress during pre-peak loading. A final set of T2 and NMRI measurements was acquired at the peak-strength point. This peak-strength measurement was the final T2 dataset used for spectral analysis; severe specimen failure after the peak prevented further T2 acquisition in the post-peak stage.
(5)
A new specimen was installed for each subsequent test, and the seepage pressure was set to 3 and 5 MPa, respectively. Steps (3) and (4) were repeated to complete the triaxial compression tests under different seepage pressures.

2.3. NMR Principles and Fractal Theory

Under a magnetic field, fluids in porous media exhibit three relaxation mechanisms: bulk relaxation, surface relaxation, and diffusion relaxation. In this study, low-viscosity water was used as the pore fluid, and the magnetic field was maintained homogeneous throughout the experiments. Therefore, bulk and diffusion relaxation can be neglected, and the overall relaxation is dominated by surface relaxation [28]. Accordingly, the total relaxation time can be expressed as follows [29]:
1 T 2 ρ 2 S V = ρ 2 C s r
where T2 is the transverse relaxation time; ρ2 is the surface relaxivity; S is the pore surface area (m2); V is the pore volume (m3); Cs is the pore-shape factor, with Cs = 2 for cylindrical pores and Cs = 3 for spherical pores; and r is the pore radius (nm).
Fractal theory provides an effective tool for characterizing the structural complexity of PFS in porous media [30]. Investigating the evolution of PFS heterogeneity in coal during confining-pressure unloading is important for understanding gas migration pathways during coal mining. The relationship between the fractal dimension and the cumulative pore volume percentage can be expressed as follows [31]:
V p = T 2 max T 2 D 3
where Vp is the cumulative pore volume percentage; T2max is the maximum transverse relaxation time; and D is the fractal dimension.
Taking the logarithm of both sides of Equation (2) gives the following:
lg V p = 3 D lg T 2 + D 3 lg T 2 max
According to Equation (3), the fractal dimension D can be determined by linear fitting of the logarithm of the cumulative pore volume fraction against the logarithm of T2.

3. Experimental Results and Discussion

3.1. Effect of Seepage Pressure on the Mechanical Behavior of Coal

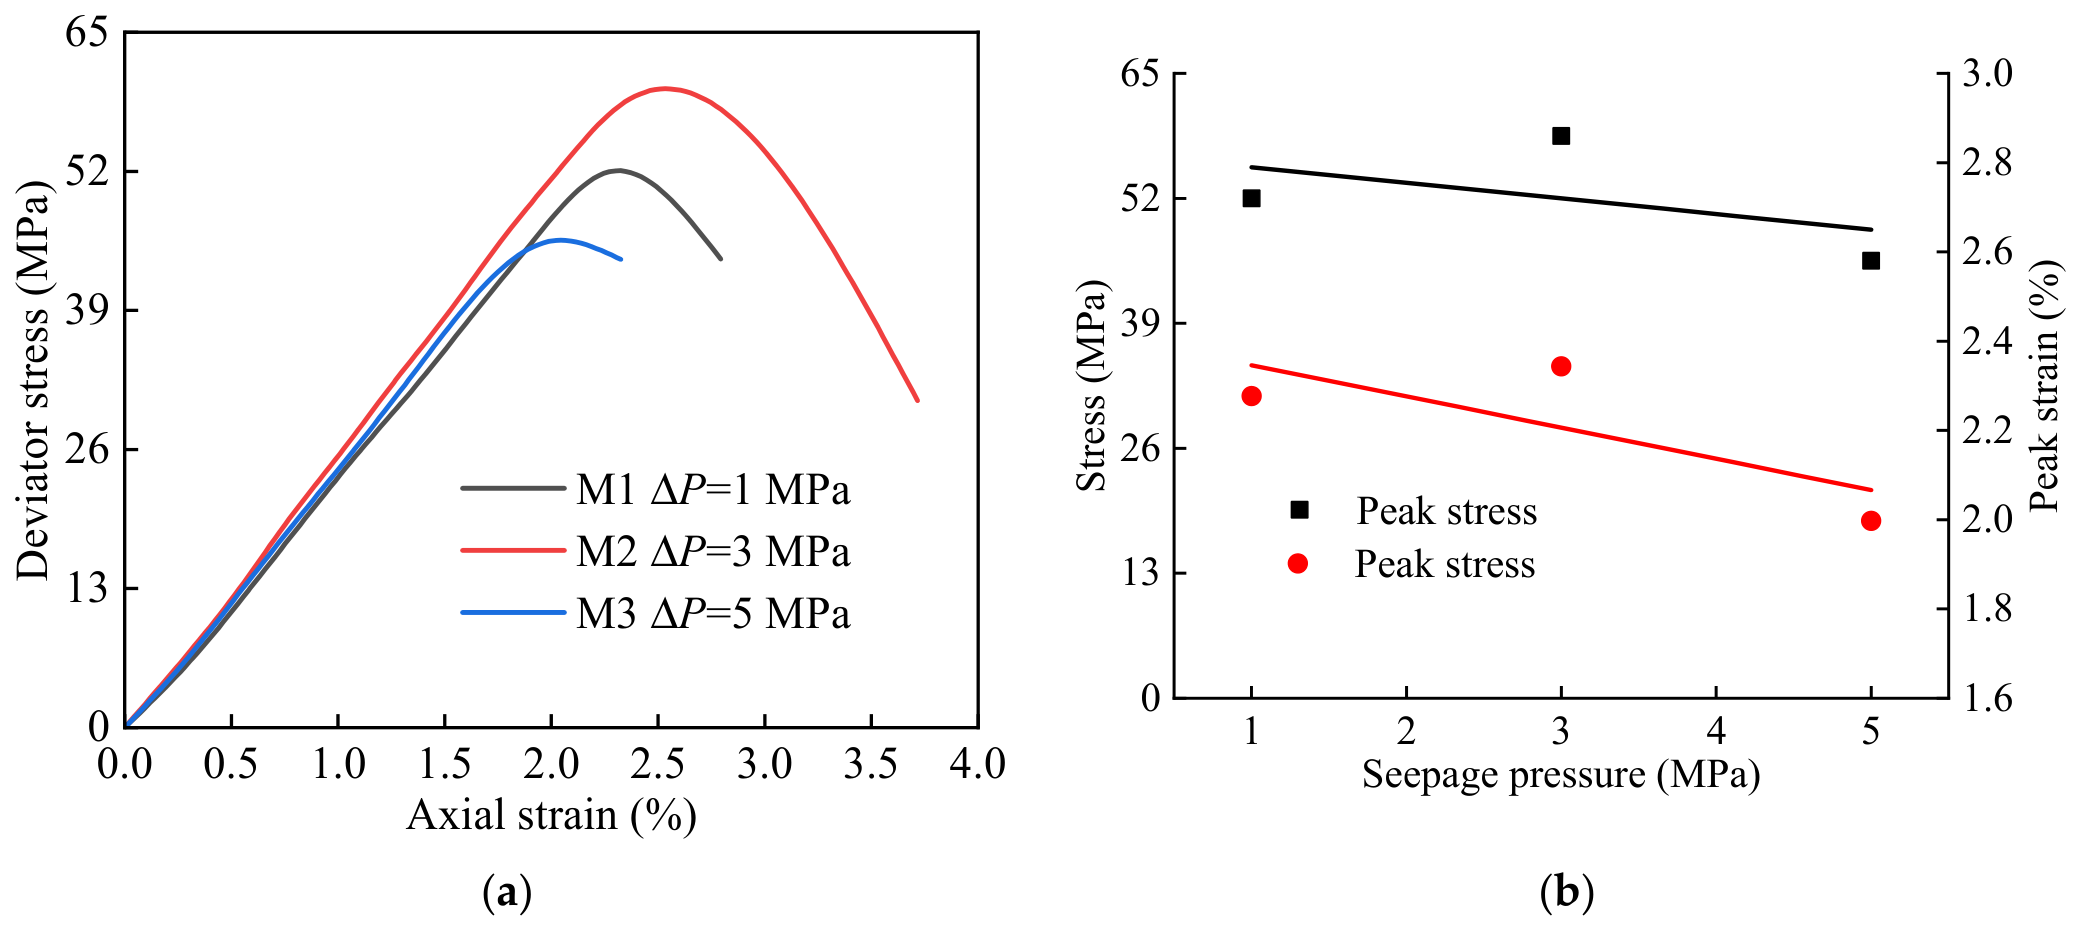
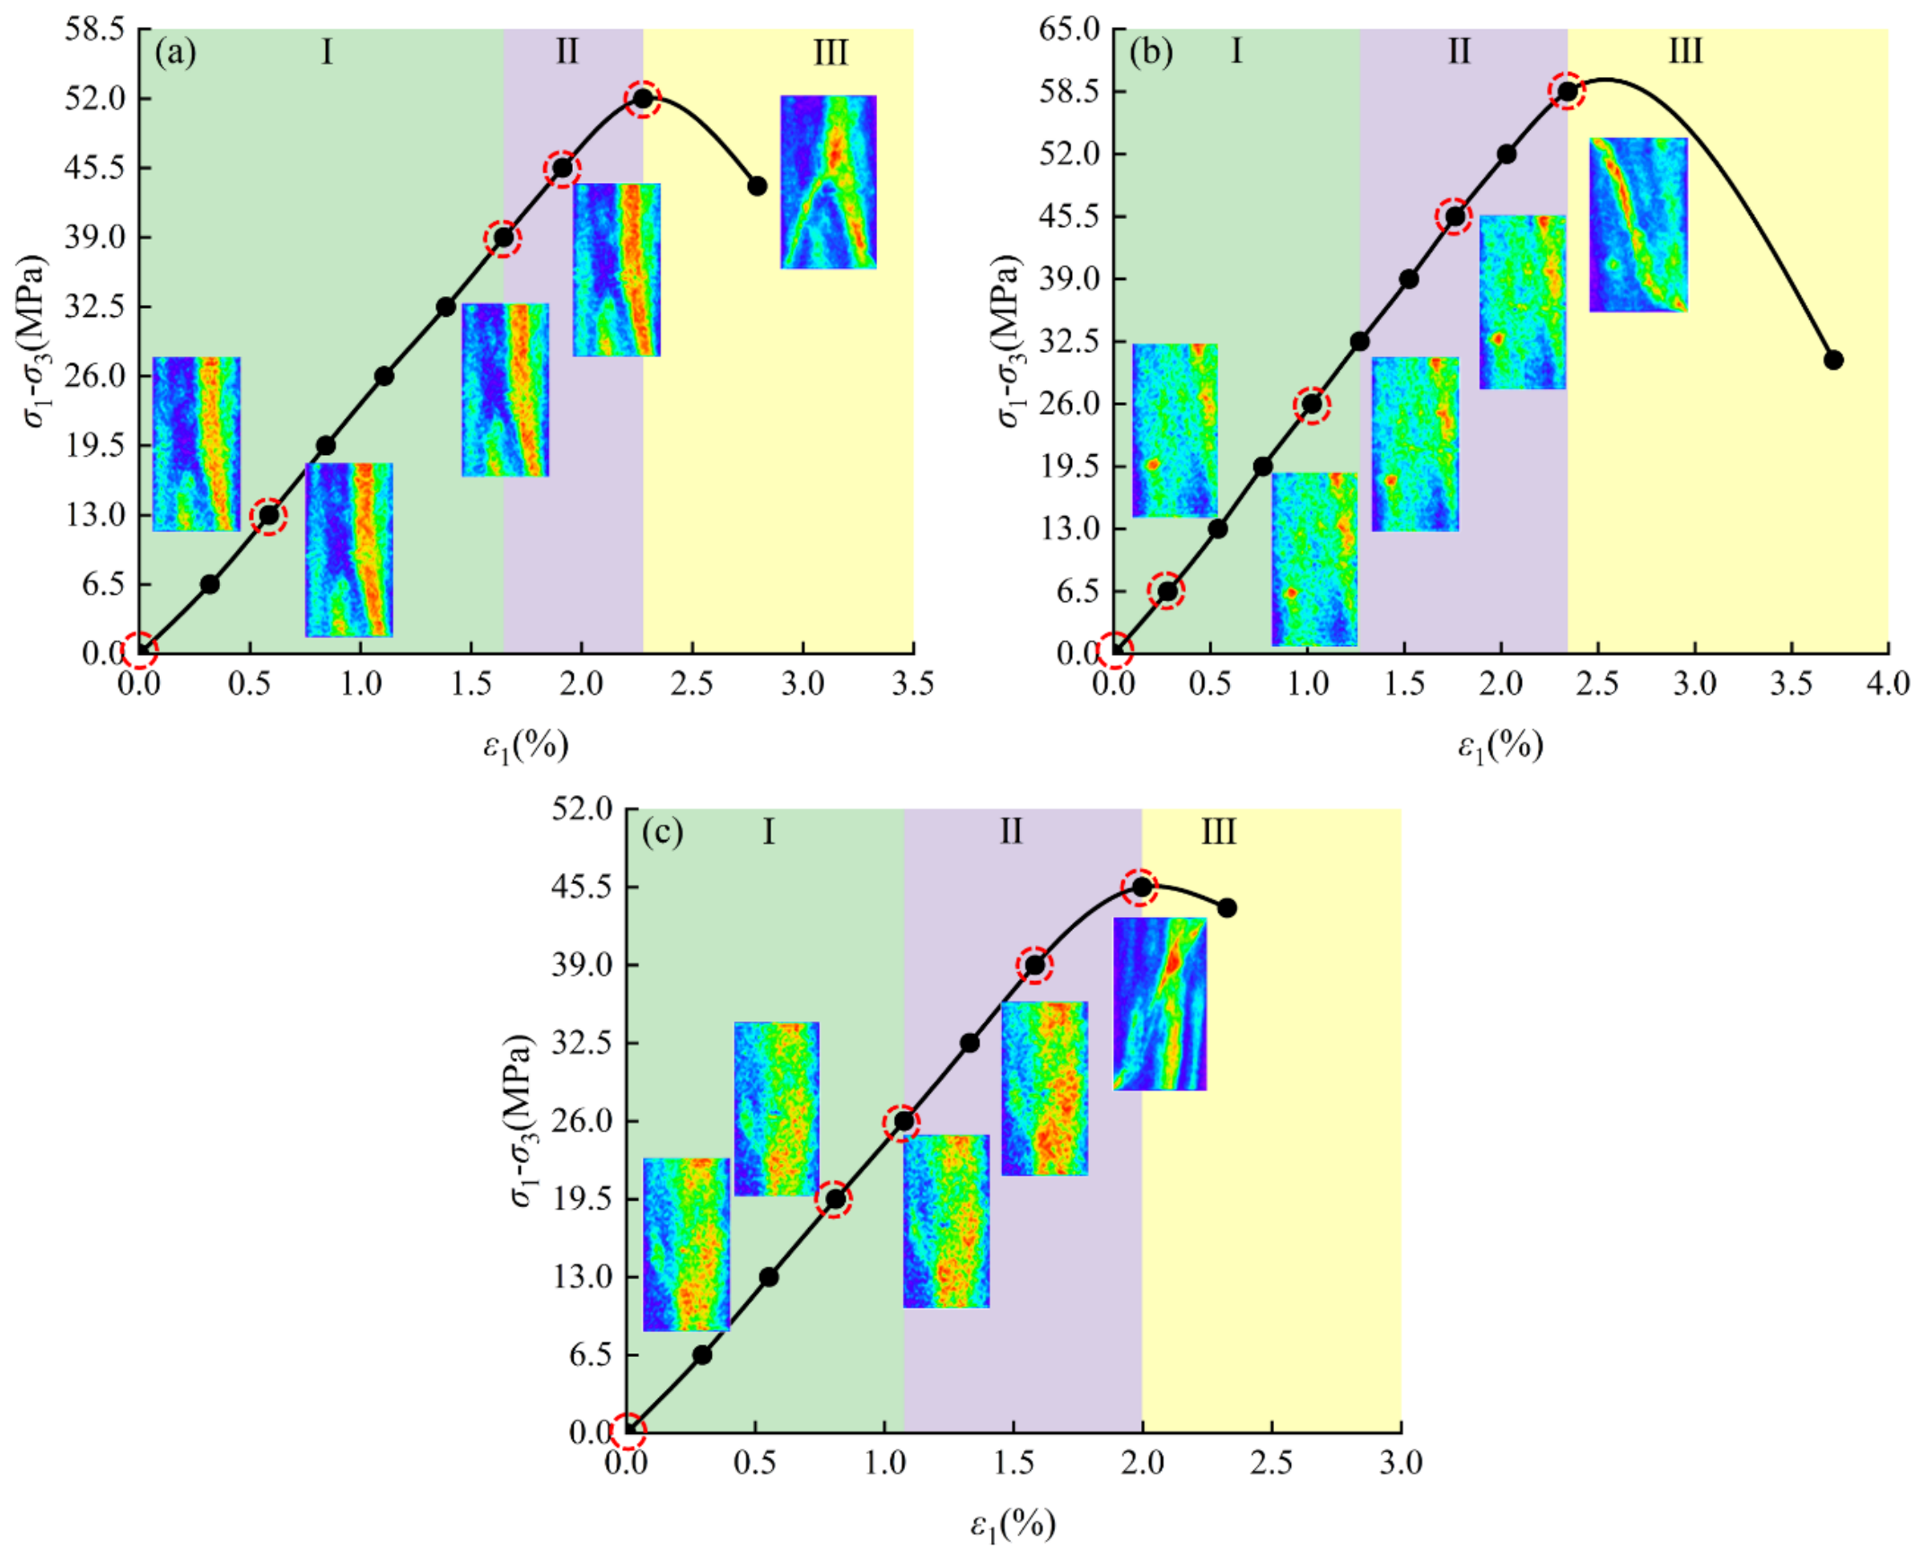
Figure 3 shows the stress–strain curves under the mining-induced stress path at ΔP = 1, 3, and 5 MPa, together with the relationships of peak stress and peak strain with seepage pressure. As ΔP increased from 1 to 3 MPa, the peak stress, σf, increased from 52 to 58.5 MPa. The peak strain and elastic modulus showed corresponding variations. This anomalous behavior is attributed to pre-existing defects in specimen M1. As shown in Figure 4, a distinct elongated orange region is observed on the right side of the NMRI image of M1, indicating locally stronger NMR signal intensity and higher water content. The elongated and spatially continuous feature is consistent with a pre-existing water-accessible pore-fracture zone in M1. This defective region reduced the deformation resistance of the specimen and induced premature shear failure along the densely developed pore-fracture zone, resulting in a lower strength of M1. Consequently, the lower strength of M1 at ΔP = 1 MPa highlights the influence of initial PFS heterogeneity and indicates that the comparison between the 1 and 3 MPa conditions should not be used to infer a general seepage-pressure dependence of coal strength.
For specimens M2 and M3, as ΔP increased from 3 to 5 MPa, σf decreased from 58.5 to 45.5 MPa, corresponding to a reduction of 22.22%, while the peak strain decreased from 2.34% to 1.99%. In addition, the slope of the linear portion of the stress–strain curve was lower for M3 at ΔP = 5 MPa than for M2 at ΔP = 3 MPa. These observations suggest a weakening response at the higher seepage pressure in the M2–M3 comparison, although replicate tests are required to determine whether this trend is statistically robust.

3.2. Evolution of PFS in Coal

3.2.1. Evolution of the Spatial Distribution of PFS

Figure 4 shows the stress–strain curves and corresponding NMRI results under different seepage pressures. The NMRI signal intensity reflects the spatial distribution of NMR-detectable water within the specimen, with warmer colors generally indicating stronger local signals and higher local water content. Under seepage conditions, however, the local NMRI signal is not controlled solely by pore volume; it may also be influenced by local water saturation, fluid redistribution associated with the imposed pressure gradient, and heterogeneous fracture permeability. Therefore, the NMRI color variations are interpreted qualitatively as changes in the distribution of water-filled pore-fracture space and are considered together with the T2 spectra to infer PFS evolution, rather than being treated as a direct measure of local pore volume.
The initial NMRI results of the three specimens show that specimen M1 exhibited relatively good PFS connectivity, with a connected fracture extending from the top to the bottom of the specimen. In contrast, specimens M2 and M3 exhibited poorer PFS connectivity and a more heterogeneous PFS distribution. Based on the combined stress–strain and NMRI results, the deformation process can be divided into three stages: (I) compaction and elastic deformation stage; (II) PFS propagation stage; and (III) post-peak failure stage.
(I)
Compaction and elastic deformation stage: This stage corresponds to the green region in Figure 4. At the beginning of this stage, the local NMRI signal intensity increased slightly and then gradually decreased as loading progressed. For example, when the deviatoric stress increased from 0 to 6 MPa, the NMRI image of specimen M1 became warmer in color, whereas the color gradually became cooler when the deviatoric stress exceeded 6 MPa. Considering the possible effects of local saturation and seepage-induced water redistribution, these color changes are interpreted as relative variations in the distribution of water-filled pore-fracture space rather than direct changes in absolute pore volume.
(II)
PFS propagation stage: This stage corresponds to the purple region in Figure 4. During this stage, the NMRI images showed marked expansion and increased spatial continuity of water-rich regions after the crack damage threshold, σcd, consistent with the progressive development and coalescence of water-accessible pores and fractures. For specimen M3, as the deviatoric stress increased from 26 to 39 MPa, the orange region expanded substantially and nearly extended throughout the entire specimen. This spatial evolution suggests progressive opening and connection of water-accessible PFS during loading, although the local NMRI intensity may also be affected by saturation heterogeneity, pressure-driven water redistribution, and fracture permeability.
(III)
Post-peak failure stage: This stage corresponds to the yellow region in Figure 4. After the specimen reached its peak strength, rapid PFS propagation and fracture coalescence resulted in macroscopic fracture formation and shear failure. A throughgoing fracture extending from the upper to the lower end of the specimen is clearly visible in the NMRI image.
For the three tested specimens, the axial strains corresponding to the onset of PFS propagation at ΔP = 1, 3, and 5 MPa were 1.65%, 1.27%, and 1.07%, respectively, while the corresponding crack damage thresholds, σcd, were 39, 32.5, and 26 MPa. From ΔP = 1 to 5 MPa, the onset strain and crack damage threshold decreased by approximately 35.2% and 33.3%, respectively. Earlier PFS propagation and lower crack damage thresholds were observed in the specimens tested at higher seepage pressures. However, because the specimens exhibited different initial PFS characteristics and only one specimen was tested at each seepage pressure, these cross-pressure differences should be interpreted as specimen-specific trends rather than as a statistically established pressure-dependent relationship.

3.2.2. Distribution and Evolution of T2 Spectra

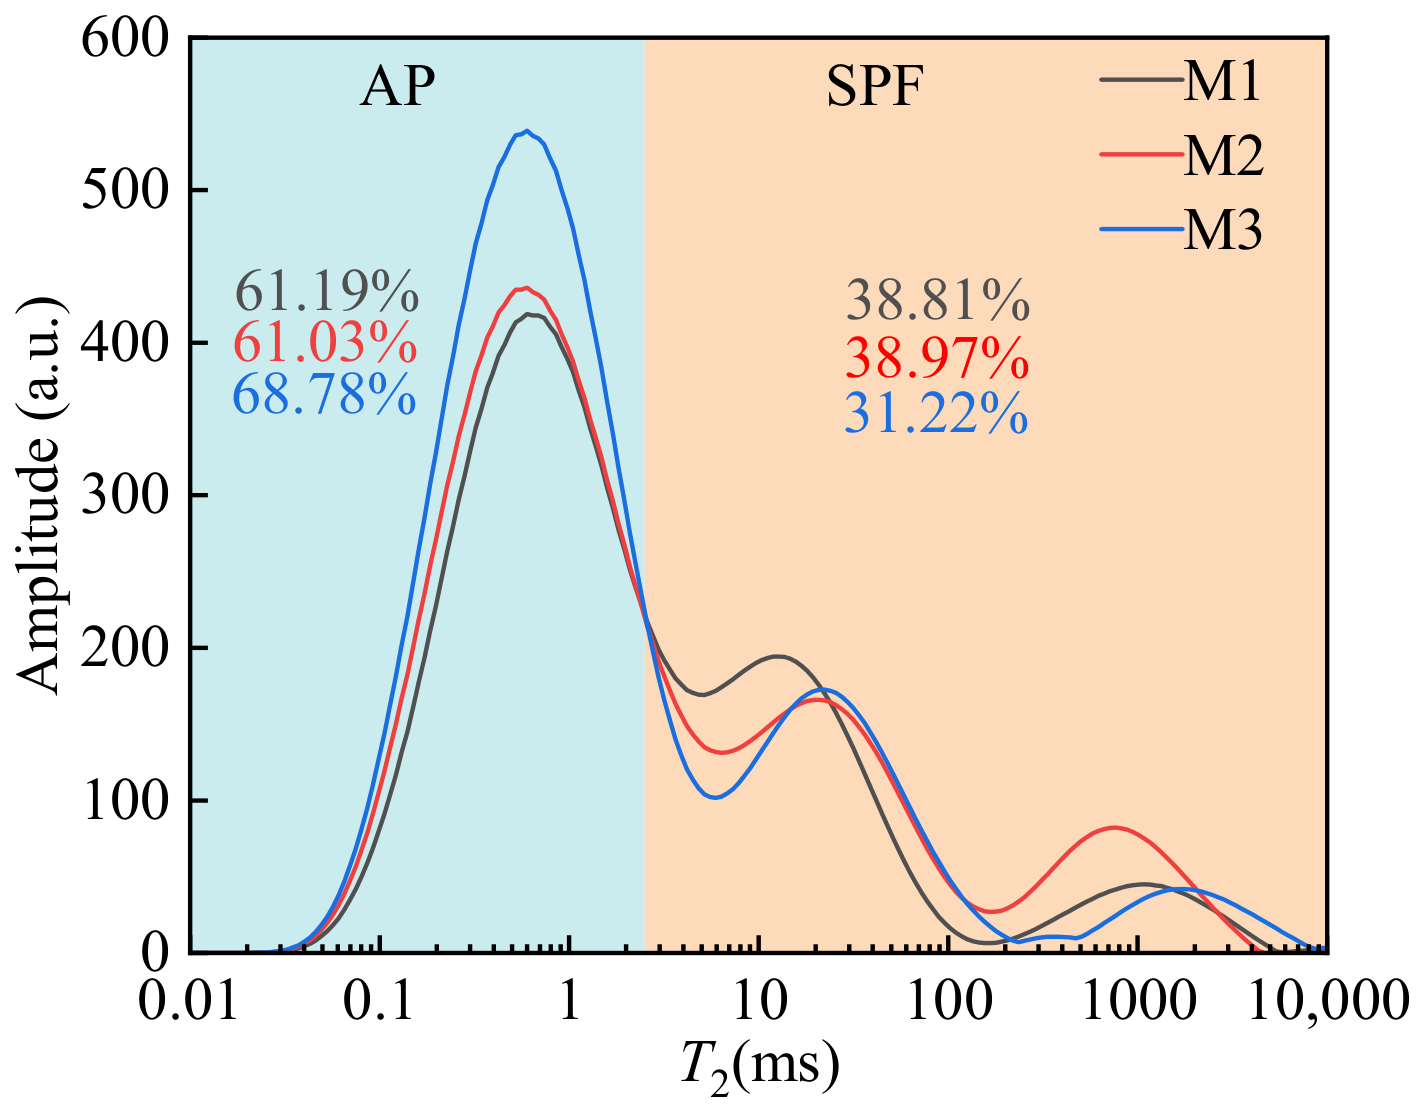
Figure 5 shows the T2 spectra of specimens M1, M2, and M3 under hydrostatic pressure. Following the pore classification proposed by Zhou et al. [19], pores with T2 < 2.5 ms were classified as adsorption pores (APs), whereas those with T2 > 2.5 ms were classified as SPF. As shown in Figure 5, the first peak at T2 < 2.5 ms represents AP, while the second and third peaks at T2 > 2.5 ms represent SPF. AP constitutes the primary gas-storage space in coal, whereas SPF serves as the main pathway for gas transport. The initial AP and SPF proportions differed among the three specimens. For M1, M2, and M3, the AP proportions were 61.19%, 61.03%, and 68.78%, respectively, whereas the corresponding SPF proportions were 38.81%, 38.97%, and 31.22%. In particular, M3 exhibited a lower initial SPF proportion than M1 and M2, demonstrating appreciable specimen-to-specimen heterogeneity in the initial PFS. Therefore, differences observed among the three seepage-pressure conditions may reflect the combined effects of seepage pressure and initial PFS heterogeneity and should not be attributed solely to seepage pressure.
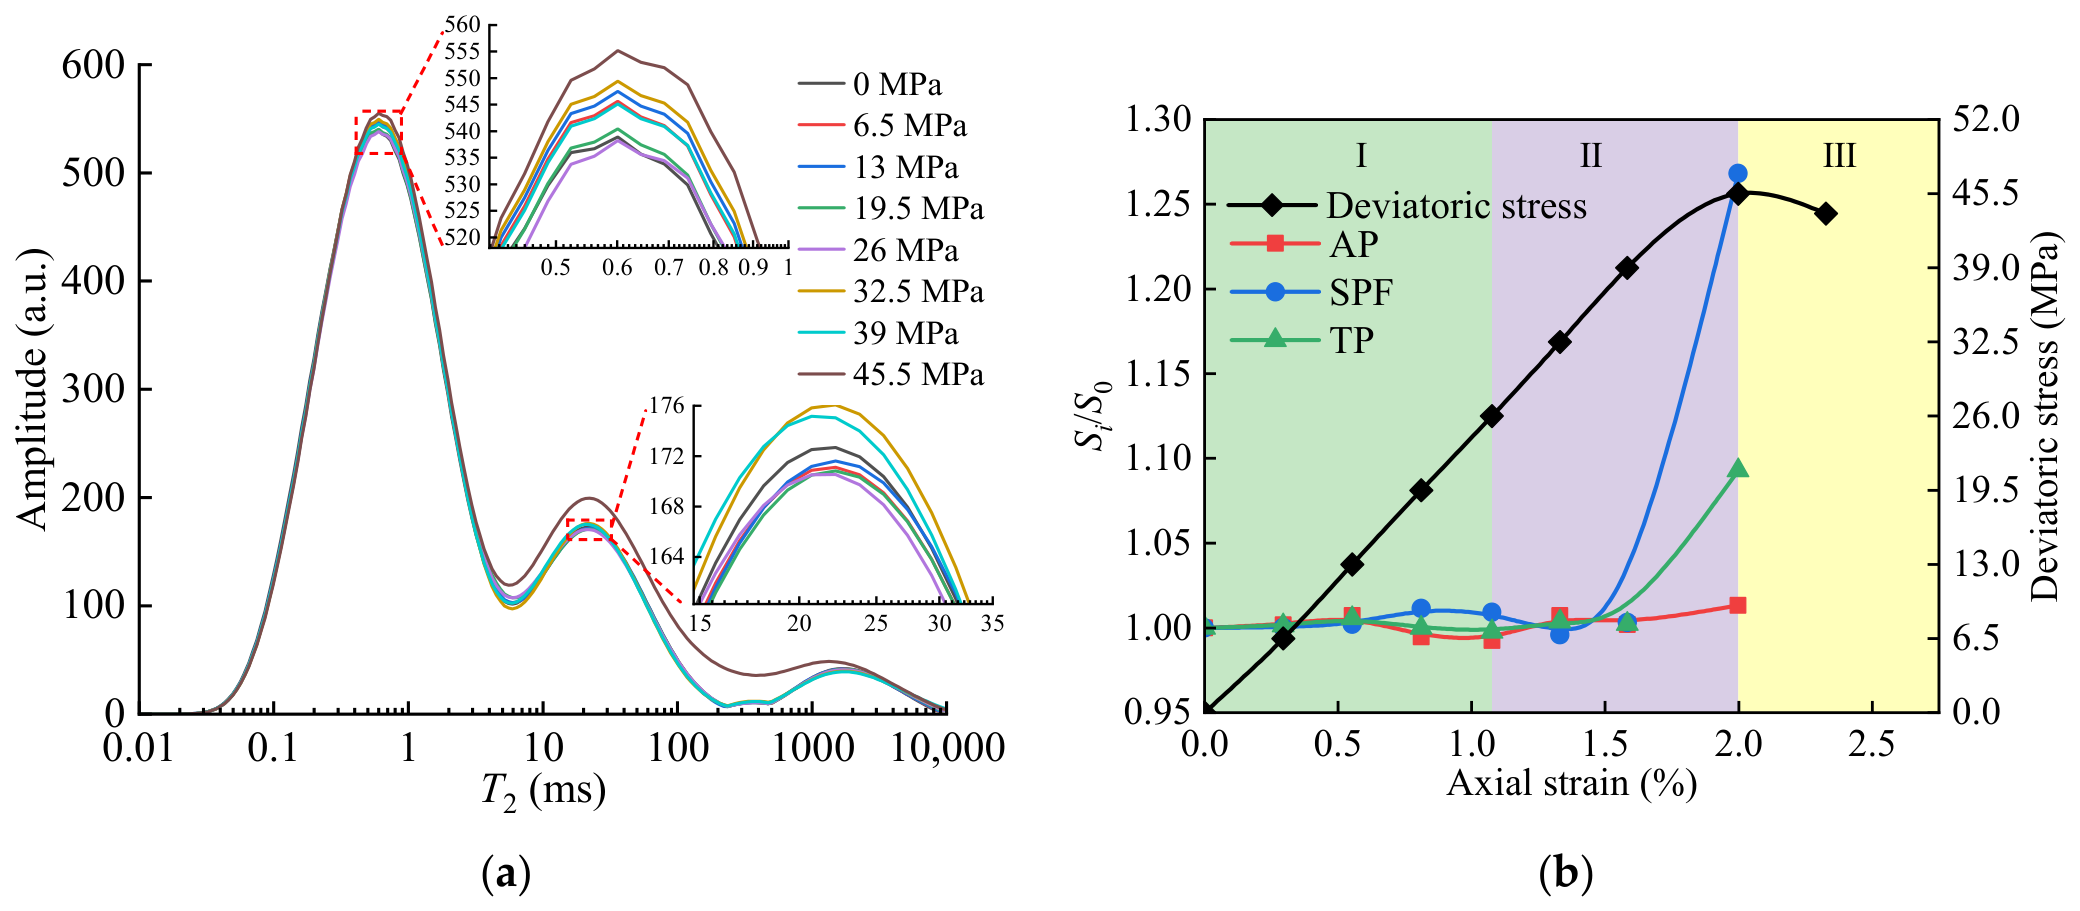
To quantitatively characterize the stress sensitivity of multiscale pores, Zhou et al. [19] defined the ratios of the areas under the T2 spectra of AP, SPF, and total pores (TPs) under different confining pressures to their corresponding initial values (Si/S0), which can be calculated as follows:
A A i = S A i S A 0
A S i = S S i S S 0
A T i = S T i S T 0
where AAi, ASi, and ATi are the area ratios of the T2 spectra of AP, SPF, and TP, respectively, under different stress states; SAi, SSi, and STi are the corresponding areas under the T2 spectra of AP, SPF, and TP under different stress states; and SA0, SS0, and ST0 are the initial areas under the T2 spectra of AP, SPF, and TP, respectively.
Taking the areas under the T2 spectra measured under hydrostatic pressure as the initial values, the corresponding areas for AP, SPF, and TP under different stress states were normalized to obtain their T2 spectrum area ratios. Because the degree of water saturation was not independently quantified, these normalized area ratios are interpreted as relative changes in the NMR-detectable water-filled pore volume with respect to the initial reference state. This specimen-specific normalization reduces the influence of differences in initial signal magnitude when evaluating within-specimen evolution, but it does not eliminate the confounding effect of initial PFS heterogeneity in cross-pressure comparisons. Under the mining-induced stress path, severe specimen failure after the peak-strength point prevented further T2 measurements in the post-peak stage. Therefore, the T2 analysis includes measurements obtained during pre-peak loading and the final measurement acquired at the peak-strength point; no post-peak T2 spectra are included.
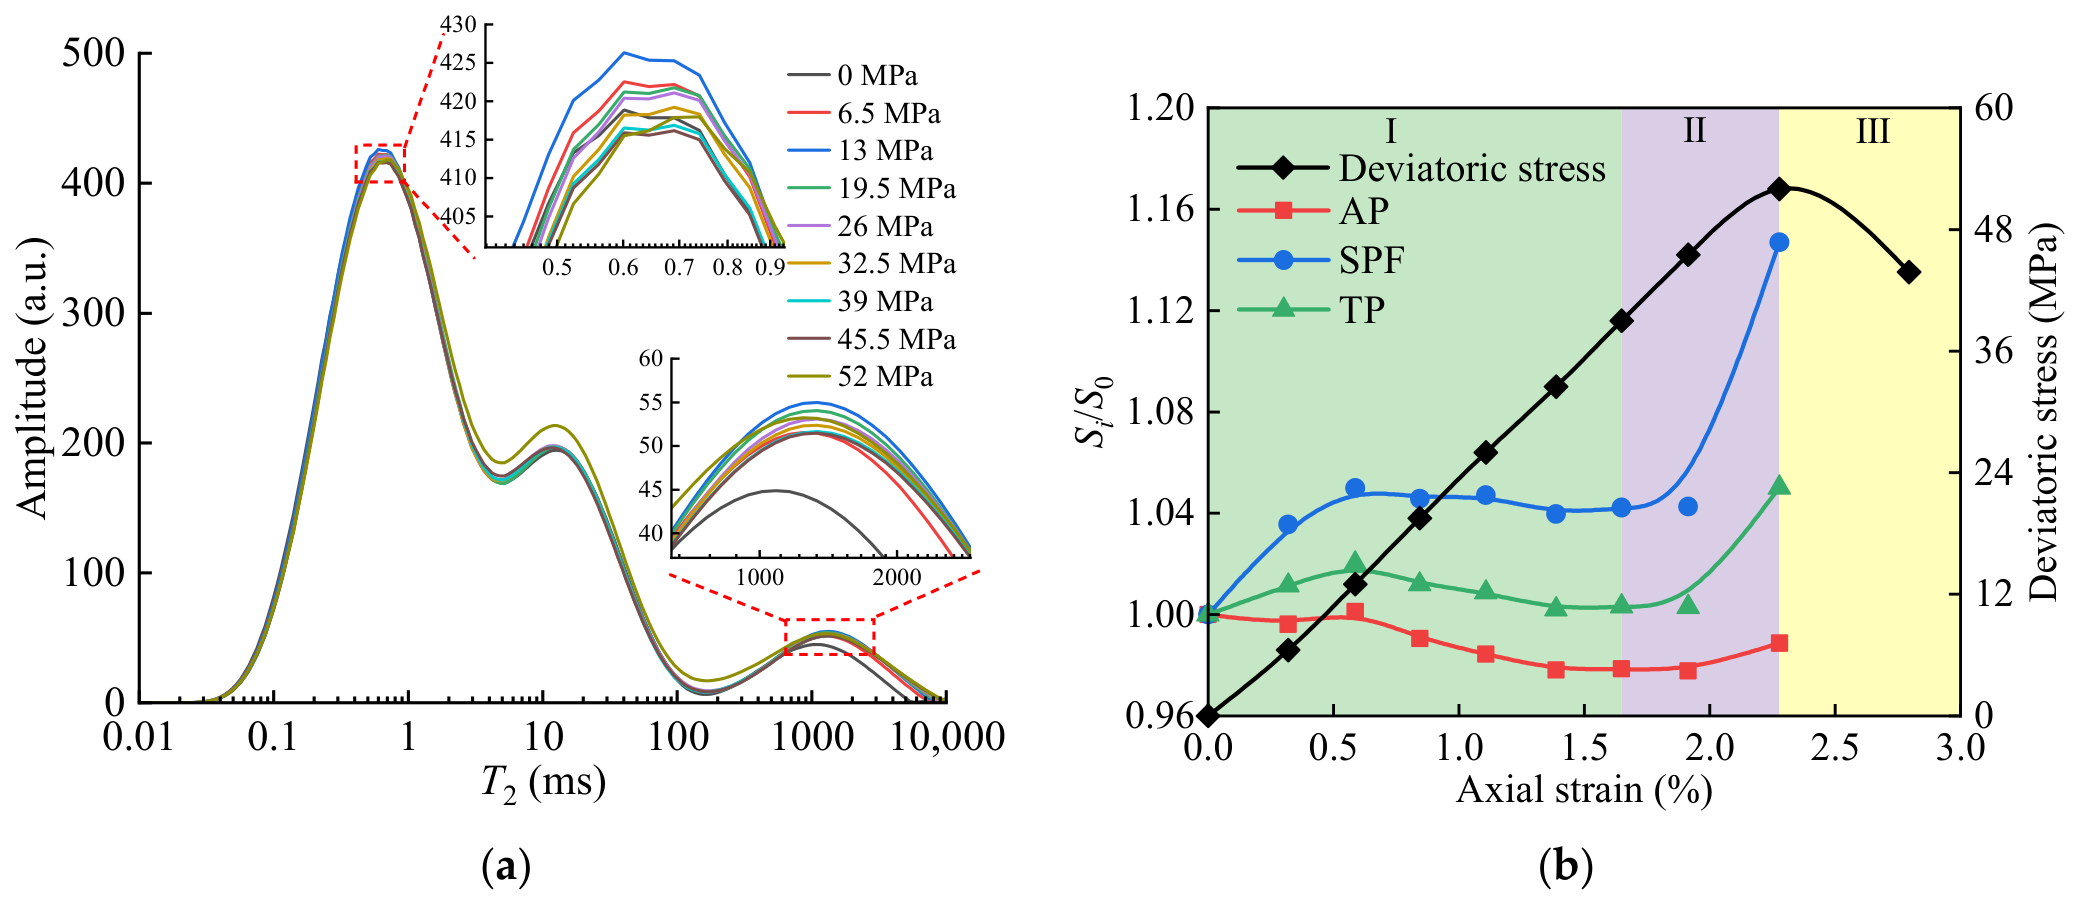
Figure 6 shows the evolution of the T2 spectra and the corresponding spectrum area ratios with strain under different stress states at a seepage pressure of 1 MPa. During the compaction and elastic deformation stage, the volume of SPF first increased and then decreased slowly, consistent with the variation in the amplitude of the third peak in the T2 spectrum. When the deviatoric stress reached 13 MPa, the SPF volume increased to 1.05 times its value under hydrostatic pressure, and then decreased to 1.04 times the initial value at a deviatoric stress of 32.5 MPa. This initial increase resulted from the combined effects of seepage pressure and confining-pressure unloading, which generated new SPF. However, because the confining-pressure unloading rate was much lower than the axial loading rate, axial compression became dominant when the deviatoric stress exceeded 13 MPa. Consequently, the reduction in pore volume caused by axial compression exceeded the increase induced by unloading, resulting in a gradual decrease in SPF volume.
During the PFS propagation stage, the SPF volume increased slowly at first and then rose sharply at the peak-strength point, reaching 1.15 times the initial value under hydrostatic pressure. The volumes of AP and TP exhibited trends similar to those of SPF. At the peak-strength point, the AP volume recovered to 98.87% of its initial value under hydrostatic pressure, while the TP volume increased to 1.05 times its initial value.
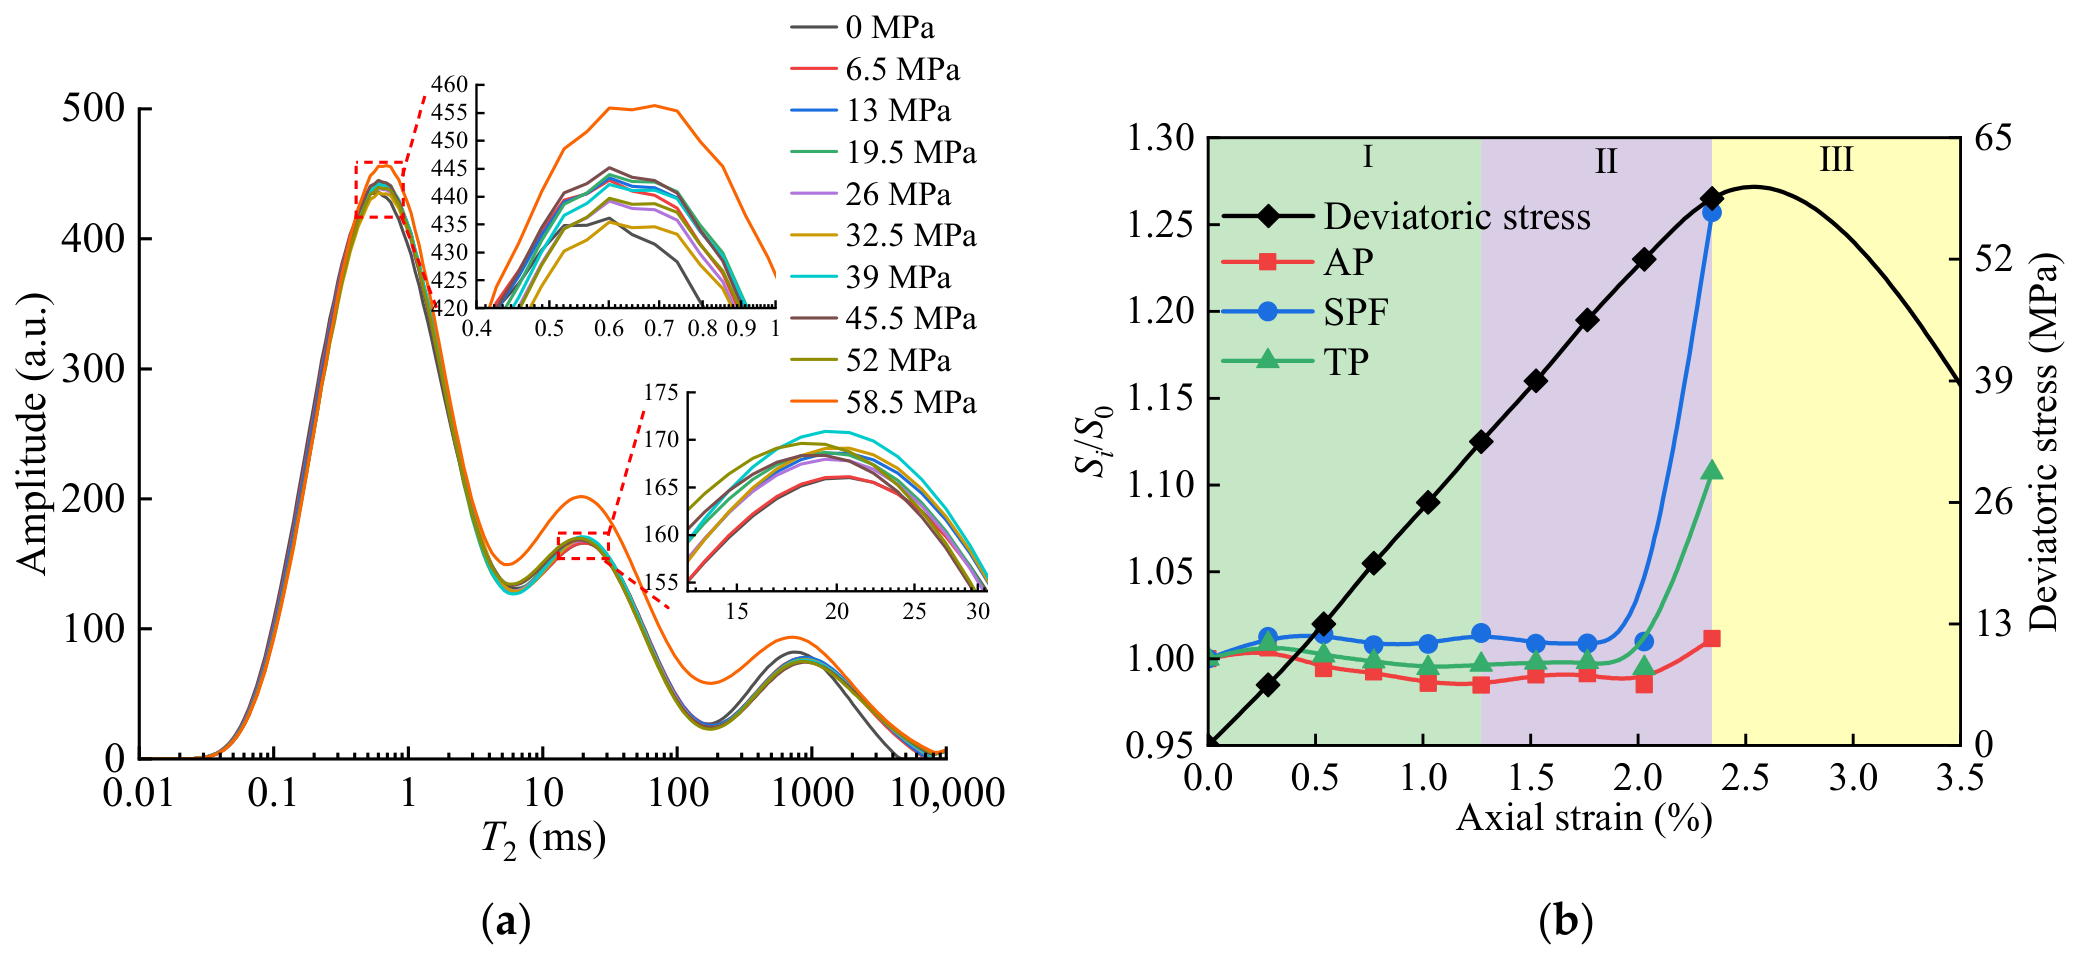
Figure 7 shows the evolution of the T2 spectra and the corresponding spectrum area ratios with strain under different stress states at a seepage pressure of 3 MPa. During the compaction and elastic deformation stage, the SPF volume increased to 1.014 times its initial value under hydrostatic pressure at a deviatoric stress of 13 MPa and then decreased to 1.008 times the initial value when the deviatoric stress reached 26 MPa. During the PFS propagation stage, the SPF area ratio fluctuated around 1.008. At the peak-strength point, the SPF volume increased rapidly to 1.257 times its initial value under hydrostatic pressure. The amplitude of the second peak in the T2 spectrum varied consistently with the SPF volume. The AP volume increased to 1.006 times its initial value under hydrostatic pressure at a deviatoric stress of 6.5 MPa and then decreased to 0.98 times the initial value by the end of Stage I. After entering the PFS propagation stage, the AP volume increased with fluctuations and reached 1.011 times its initial value at the peak-strength point. The TP volume increased to 1.107 times its initial value under hydrostatic pressure at the peak-strength point.
As shown in Figure 8, at a seepage pressure of 5 MPa, the multiscale pore volumes showed a marked increase at the peak-strength point. The volumes of AP, SPF, and TP were 1.013, 1.09, and 1.268 times their initial values under hydrostatic pressure, respectively.
A comparison of the three seepage-pressure conditions reveals a common stage-dependent evolution but distinct responses among AP, SPF, and TP. During the compaction and elastic deformation stage, the evolution of the pore system reflects the competition between axial compression and the opening effects associated with confining-pressure unloading and seepage. AP exhibited relatively small variations, whereas SPF showed more pronounced changes, indicating that the water-accessible transport pathways were more responsive to stress-induced PFS reorganization. As loading approached the peak-strength point, the relative changes in SPF were greater than those in AP for all three specimens. In contrast, TP represents the overall response of the NMR-detectable water-filled pore space resulting from the combined evolution of AP and SPF.
At the peak-strength point, the normalized AP volume ratios of specimens M1, M2, and M3 were 0.9887, 1.011, and 1.013, respectively, indicating relatively limited changes in AP. The corresponding SPF ratios were 1.15, 1.257, and 1.09, while the TP ratios were 1.05, 1.107, and 1.268, respectively. Notably, the SPF response did not vary monotonically among the three seepage-pressure conditions, with the largest normalized SPF ratio occurring in M2 at ΔP = 3 MPa rather than in M3 at ΔP = 5 MPa. Together with the lower initial SPF proportion of M3 shown in Figure 5, this nonmonotonic response indicates that the differences among the three conditions cannot be attributed solely to seepage pressure. Instead, they reflect the combined effects of axial compression, confining-pressure unloading, seepage-related PFS opening, and specimen-specific initial PFS heterogeneity.

3.2.3. Evolution of the Mean Pore Size Characterized by T2g

As indicated by Equation (1), the transverse relaxation time T2 is proportional to the pore radius r. Therefore, the logarithmic mean of T2, denoted as T2g, reflects the mean pore size of the coal specimen. A larger T2g indicates a larger mean pore size, whereas a smaller T2g indicates a denser PFS dominated by smaller pores. In addition, T2g has been used to predict coal permeability [29], identify fluid types [32], and evaluate reservoir quality [33]. Therefore, investigating the evolution of T2g under coupled stress and seepage is important for the quantitative characterization of PFS. T2g can be calculated as follows:
T 2 g = exp i = 1 n A i A T ln T 2 i
where Ai is the amplitude at data point i; AT is the cumulative amplitude of all n data points in the T2 spectrum; and T2i is the T2 value at data point i (ms).
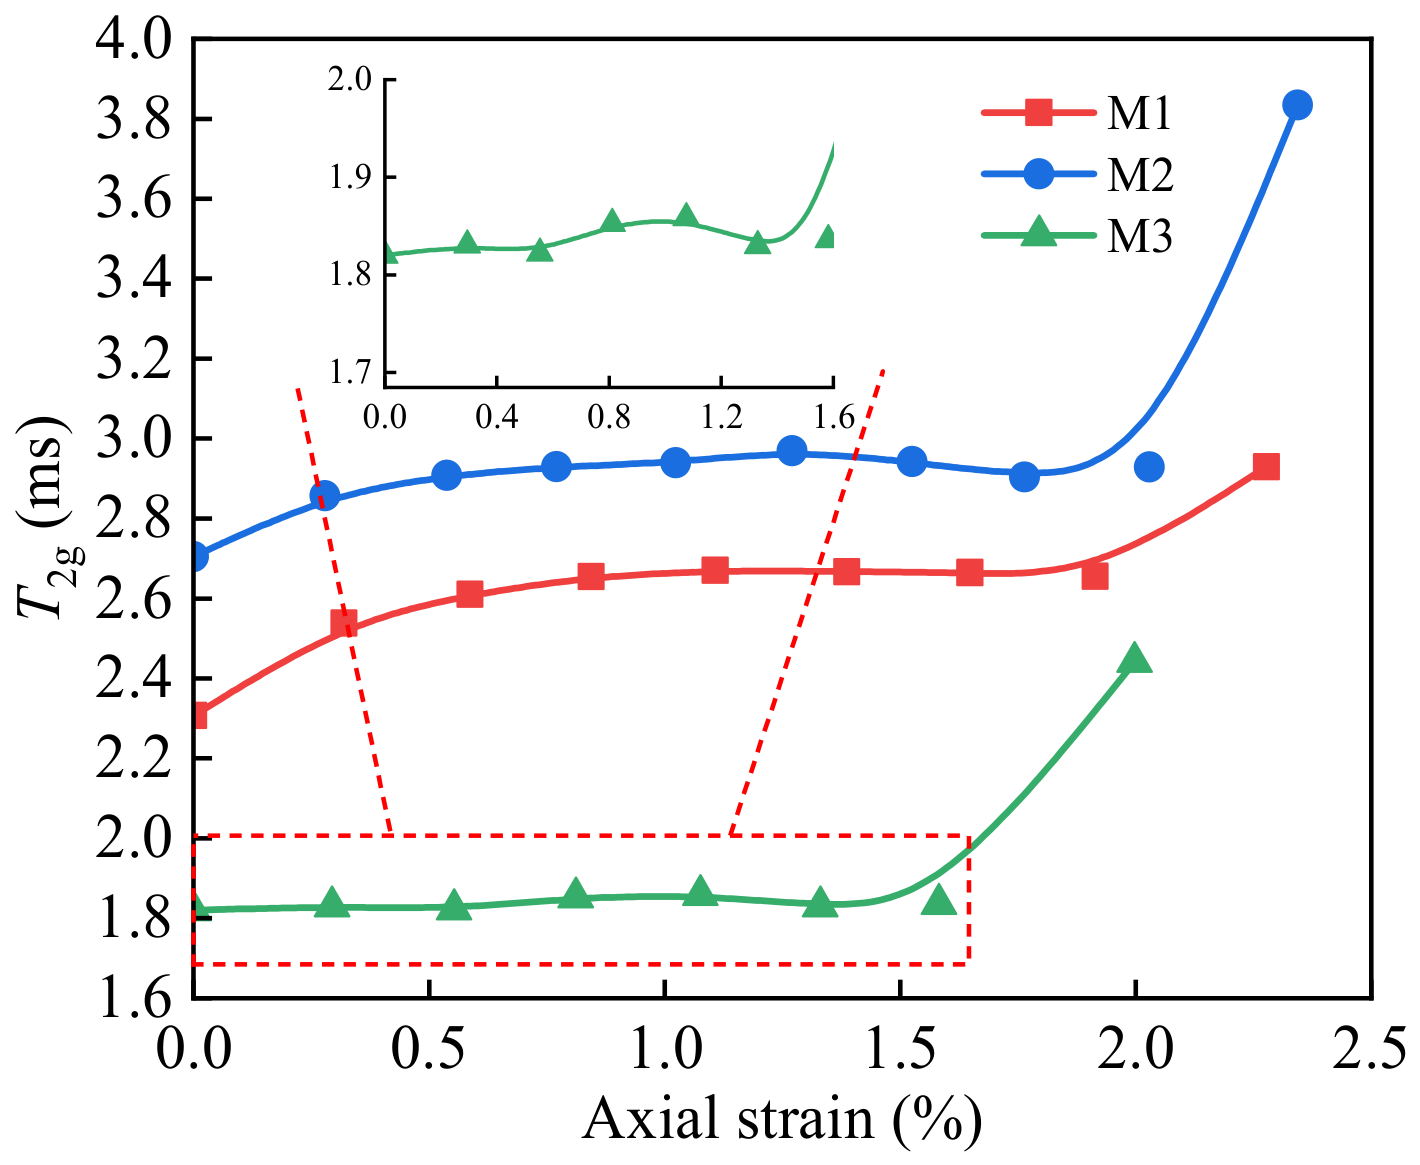
The mean pore-size parameter T2g represents the mean pore radius, with a larger T2g corresponding to a larger mean pore radius. The T2g values of the coal specimens under different stress states were calculated, as shown in Figure 9. Across the three specimens, T2g followed a broadly comparable strain-dependent pattern. During the compaction and elastic deformation stage, the combined effects of seepage pressure and unloading initially generated new AP and SPF, with the increase in SPF being greater than that in AP, resulting in a gradual increase in T2g. As the axial stress increased, both AP and SPF were compressed at similar rates, and T2g gradually stabilized. After entering the PFS propagation stage, new AP developed within the specimen, causing T2g to decrease slowly. At the peak-strength point, rapid PFS propagation and coalescence were accompanied by a substantial increase in SPF; consequently, T2g increased sharply. For example, at a seepage pressure of 3 MPa, T2g of specimen M2 increased from its initial value of 2.70 ms to 2.91 ms during the compaction and elastic deformation stage and then remained relatively stable at approximately 2.94 ms. After entering the PFS propagation stage, T2g gradually decreased from 2.97 to 2.90 ms. At the peak-strength point, T2g increased sharply to 1.13 times its initial value under hydrostatic pressure. These quantitative changes further demonstrate the distinct stage-dependent evolution of the mean pore size during loading and failure.

3.2.4. Evolution of Pore Compressibility

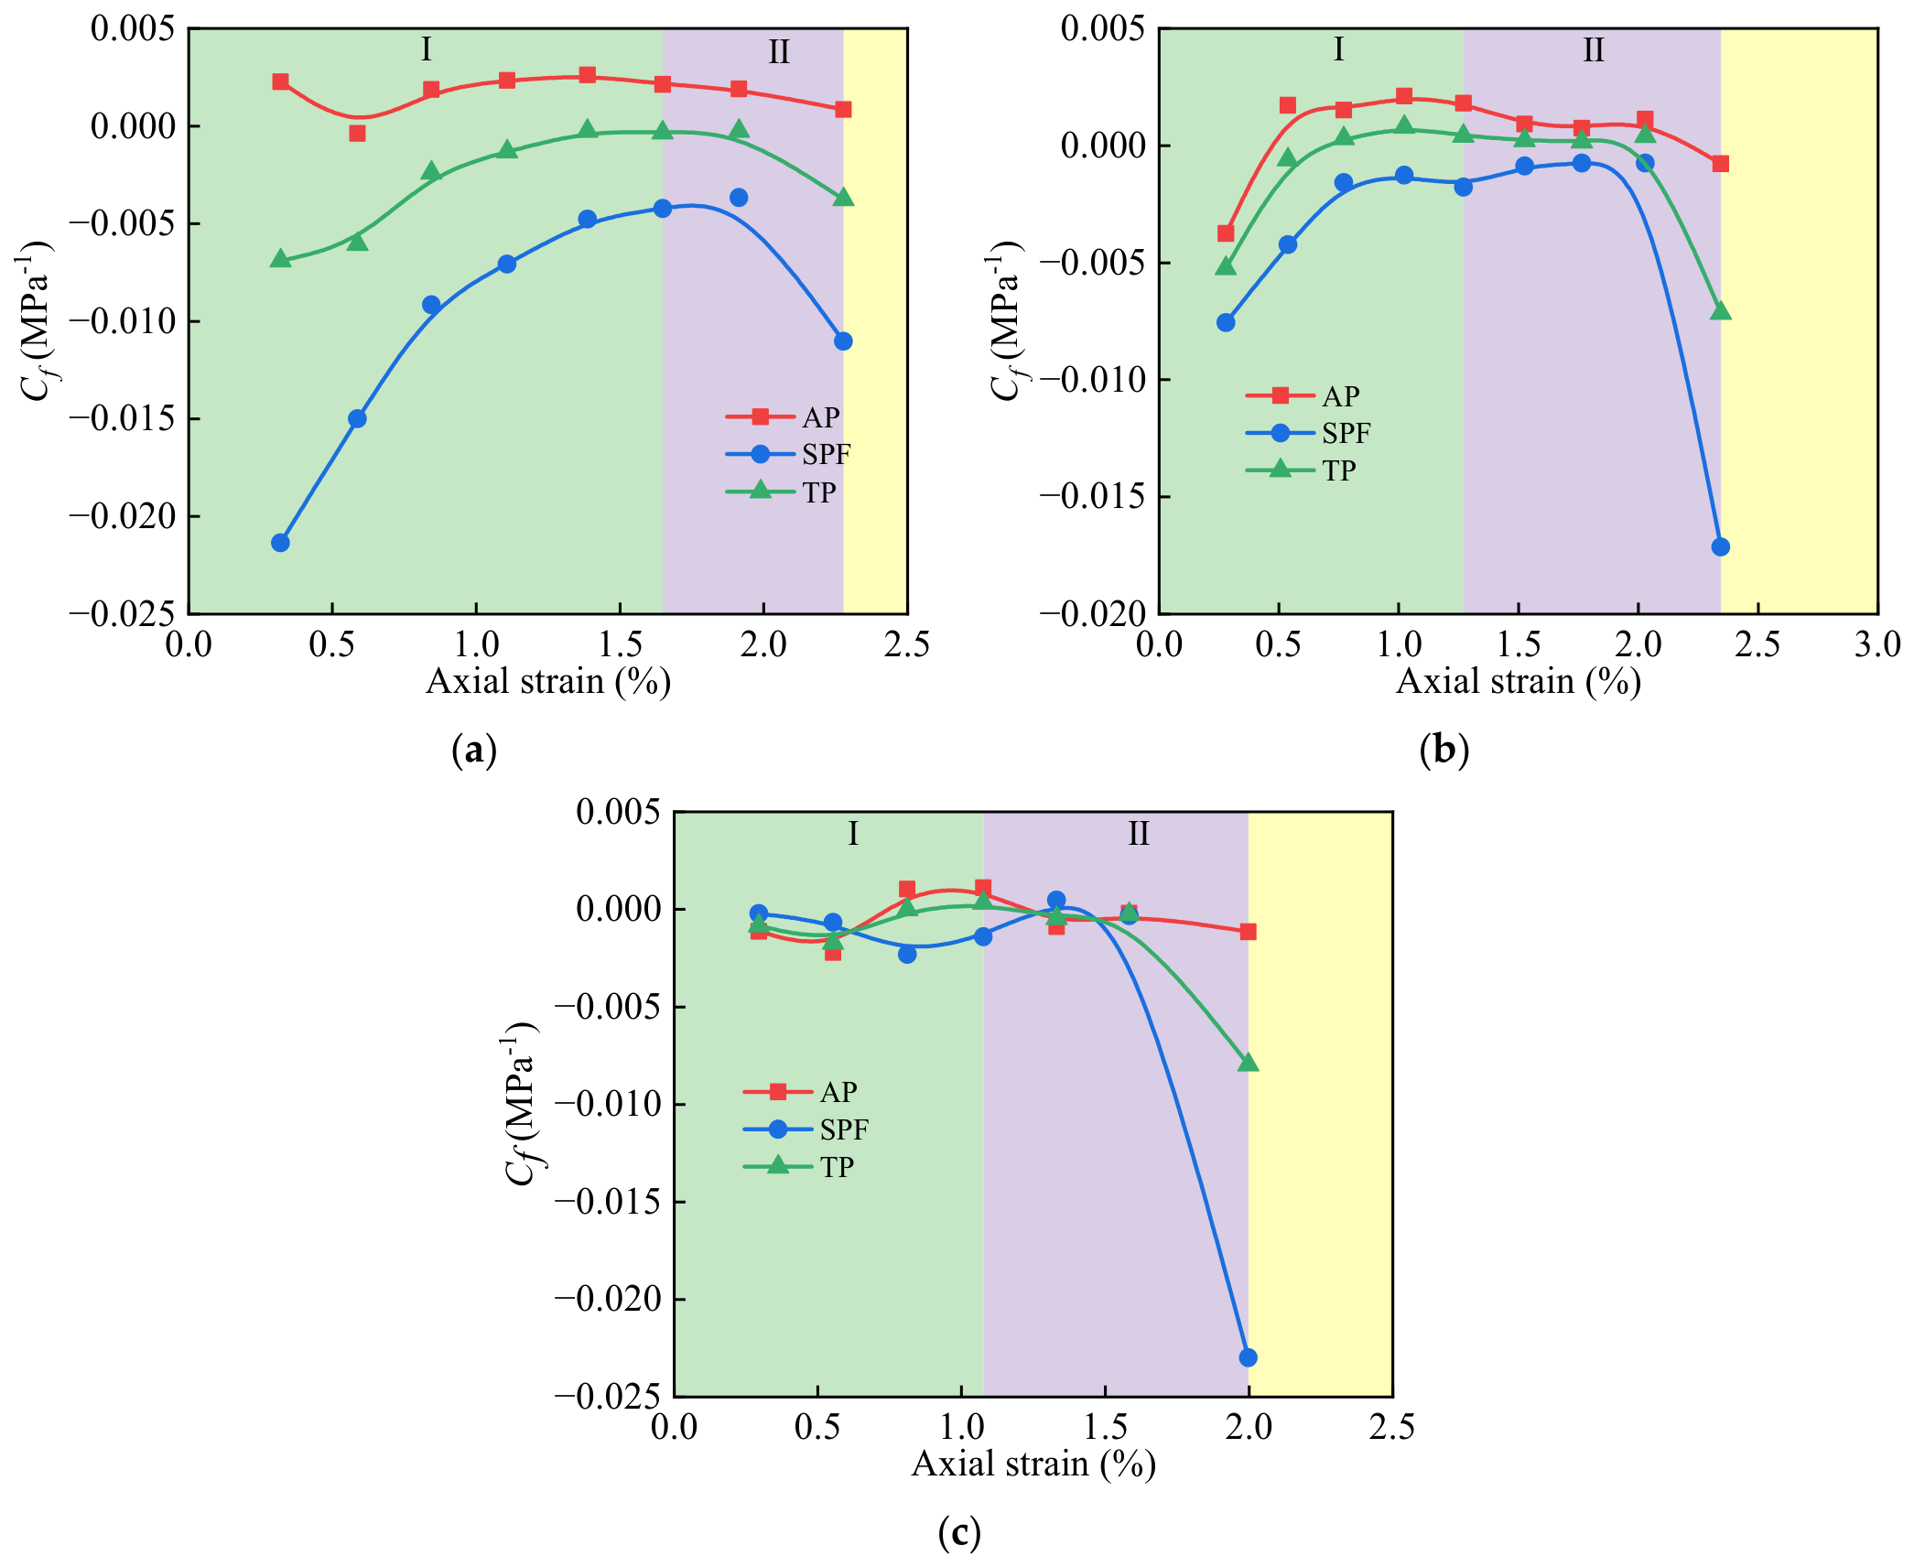
The pore compressibility, Cf, is commonly used in permeability models for coal reservoirs. An increase in Cf indicates a greater reduction in pore volume per unit stress increment and, consequently, a decrease in permeability; conversely, a decrease in Cf indicates pore expansion and an increase in permeability. According to Li et al. [34], Cf can be calculated as follows:
C f = S i / S 0 1 σ m i σ m 0
where Cf is the pore compressibility of the coal specimen (MPa−1); σmi is the mean stress corresponding to each T2 measurement point (MPa); and σm0 is the mean stress under the initial hydrostatic pressure condition (MPa).
Under triaxial loading conditions, the compressibility of multiscale pores in coal can be calculated using the mean stress, which is given by the following [35]:
σ m i = σ 1 i + 2 σ 3 i 3
where σ1i is the axial stress corresponding to each T2 measurement point (MPa), and σ3i is the confining pressure corresponding to each T2 measurement point (MPa).
The compressibilities of multiscale pores under different stress states along the mining-induced stress path were calculated using Equation (8), as shown in Figure 10. For specimens M1 and M2, the AP, SPF, and TP compressibilities followed comparable strain-dependent patterns (Figure 10a,b). Throughout the loading process, the SPF compressibility increased rapidly at first and then more gradually, followed by an abrupt decrease at the peak-strength point. For specimen M2 at ΔP = 3 MPa, the SPF compressibility increased from −0.0075 to −0.0007 MPa−1 and then dropped abruptly to −0.017 MPa−1 at the peak-strength point. The SPF compressibility remained negative throughout the loading process, ranging from −0.017 to −0.0007 MPa−1, indicating persistent expansion of SPF.
During the compaction and elastic deformation stage, the AP and TP compressibilities increased rapidly with strain and then tended to stabilize. During the PFS propagation stage, both decreased gradually and then dropped sharply at the peak-strength point. For specimen M2, the compressibilities of AP and TP increased from −0.0037 and −0.0052 MPa−1 to 0.0021 and 0.0008 MPa−1, respectively, indicating a transition from pore expansion to compression. They subsequently decreased gradually to 0.0009 and 0.0001 MPa−1 and finally dropped sharply to −0.0008 and −0.0071 MPa−1 at the peak-strength point, indicating rapid pore expansion. At the peak-strength point, the compressibilities of SPF, AP, and TP decreased by 0.0163, 0.0017, and 0.0072 MPa−1, respectively, relative to their preceding measured values. The decrease in SPF compressibility was approximately 9.6 and 2.3 times those of AP and TP, respectively, demonstrating a substantially stronger deformation response of SPF.
At a seepage pressure of 5 MPa, the AP and TP compressibilities increased during the early loading stage and decreased toward the peak-strength point. In contrast, the SPF compressibility did not increase during the compaction and elastic deformation stage but gradually decreased from −0.0002 to −0.0007 MPa−1. This behavior is consistent with sustained SPF expansion during this stage. During the PFS propagation stage, axial compression initially exceeded the expansion effect associated with seepage and confining-pressure unloading, causing the SPF volume to decrease and its compressibility to increase to −0.0002 MPa−1. With further loading, newly formed pores and fractures propagated and coalesced, and the SPF compressibility decreased again. At the peak-strength point, the SPF compressibility dropped sharply to −0.023 MPa−1.
Overall, the AP and TP compressibilities increased during the compaction and elastic deformation stage and remained relatively stable before decreasing during the PFS propagation stage and dropping sharply at the peak-strength point. In contrast, the SPF compressibility generally increased before the peak stress for specimens M1 and M2, whereas specimen M3 showed a nonmonotonic response. At the peak-strength point, the SPF compressibilities of specimens M2 and M3 were −0.017 and −0.023 MPa−1 at ΔP = 3 and 5 MPa, respectively. These cross-specimen differences should be interpreted with consideration of the initial PFS heterogeneity of the two specimens.

3.2.5. Evolution of Fractal Dimension and Heterogeneity

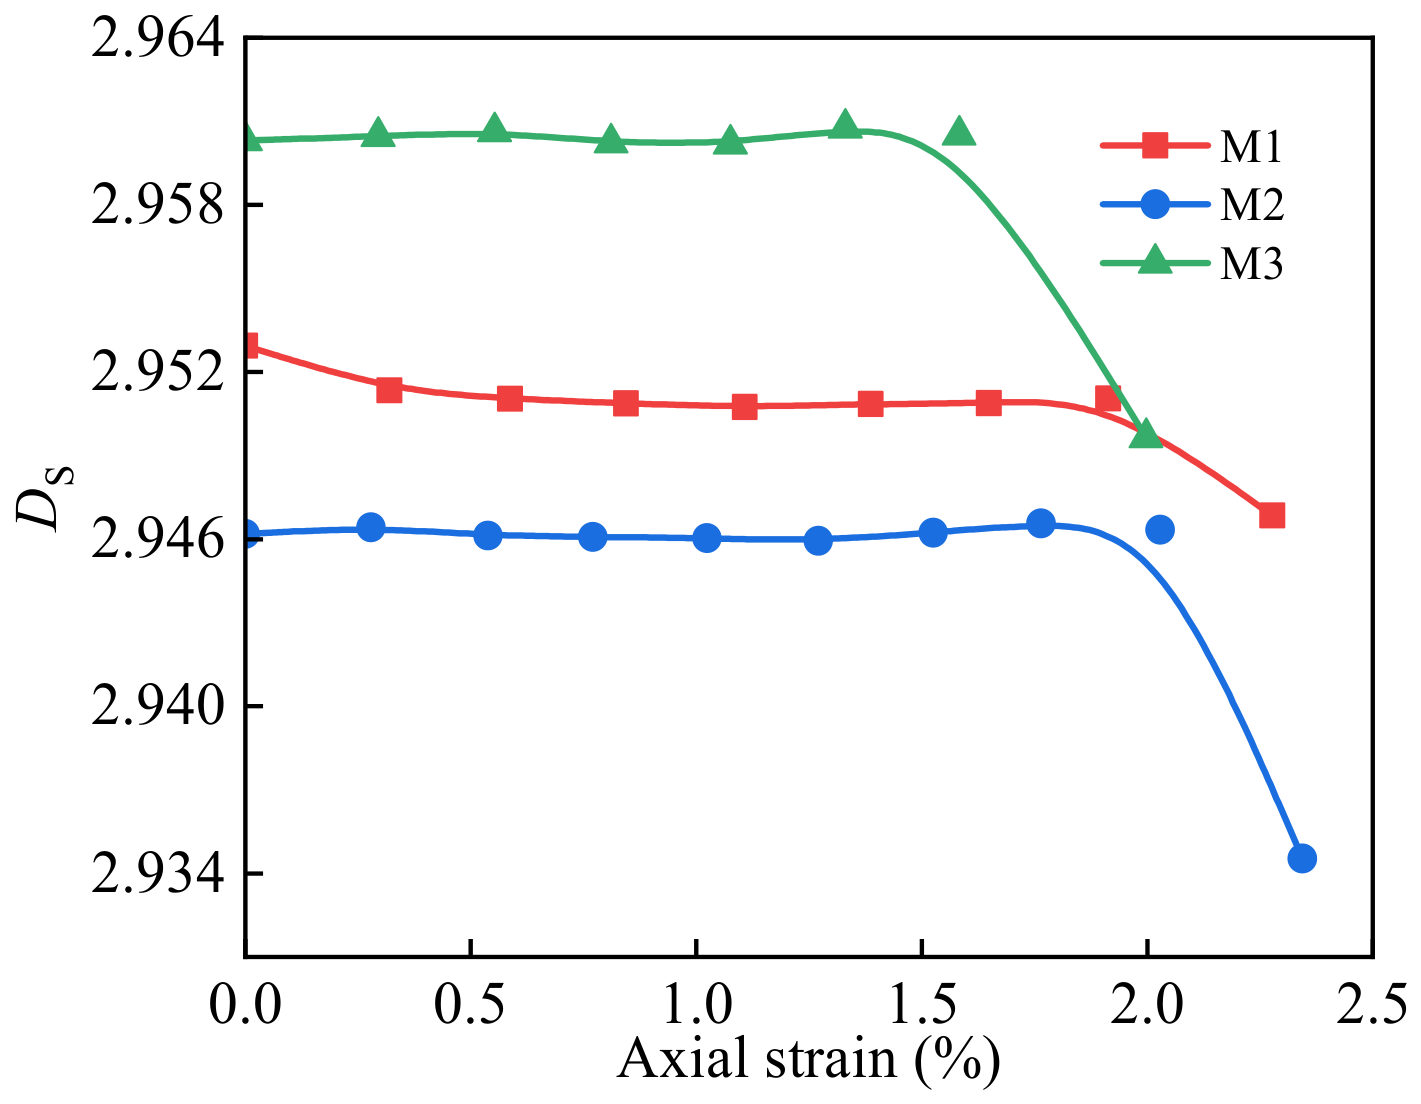
The fractal dimension (D) reflects the structural complexity and heterogeneity of the PFS. Based on Equation (3), the fractal dimensions of AP and SPF were calculated under different stress states. For a three-dimensional pore system, physically meaningful fractal dimensions should fall within the range of 2–3 [36]. The calculated D values of AP were consistently lower than 2, indicating that the AP domain did not exhibit a valid fractal scaling relationship under the adopted NMR-based fractal model. AP corresponds to the short-T2 range below 2.5 ms, which provides a relatively limited scale interval for establishing the power–law relationship between cumulative pore volume and T2. In addition, the relationship between T2 and pore size may be more strongly influenced by variations in surface relaxation and pore geometry within the small-pore domain. Therefore, the fitted values below 2 are not interpreted as physical fractal dimensions of AP, and AP is excluded from the subsequent quantitative fractal analysis. In contrast, the fractal dimension of SPF, DS, ranged from 2.934 to 2.960, and the fitting coefficients between lg(SV) and lg(T2) were all greater than 0.76, indicating a more reliable fractal scaling relationship for SPF under different stress states. Accordingly, the subsequent fractal analysis focuses on SPF.
The evolution of DS with strain is shown in Figure 11. Under hydrostatic pressure, specimen M3 exhibited the highest DS, whereas specimen M2 exhibited the lowest. As shown in Figure 5, M3 had the lowest volume percentage of SPF, while M2 had the highest. This indicates that a higher SPF volume percentage corresponds to a lower DS and a simpler PFS.
Across the three specimens, DS remained nearly constant before the peak strain and decreased sharply at the peak strain. Prior to the peak strain, the volumes of SPF and AP changed synchronously, while SPF accounted for approximately 39.5% of the total pore volume. Consequently, DS changed only slightly, indicating relatively stable structural complexity of SPF.
At the peak strain, rapid PFS propagation and coalescence were accompanied by a higher SPF content and improved connectivity. As a result, DS decreased sharply, indicating a reduction in the structural complexity of SPF. For example, at a seepage pressure of 3 MPa, DS of specimen M2 fluctuated around 2.946 before the peak strain and then dropped sharply to 2.934 at the peak strain. This corresponds to a decrease of 0.012, or approximately 0.41%, quantitatively confirming the reduction in the structural complexity of SPF during coal failure.

4. Conclusions

To reveal the deformation and failure characteristics and PFS evolution of deep coal under coupled seepage and mining-induced stress, online triaxial NMR tests were conducted under different seepage pressures along a mining-induced stress path characterized by increasing axial stress and decreasing confining pressure. The evolution of the multiscale PFS was quantitatively characterized using T2 spectra, NMRI, mean pore size, pore compressibility, and fractal dimension. The main conclusions and their engineering implications are as follows:
(1)
Across the three tested specimens, the onset of PFS propagation occurred at lower axial strains and lower crack damage thresholds for the specimens tested at higher seepage pressures. At ΔP = 1, 3, and 5 MPa, the axial strains corresponding to the onset of PFS propagation were 1.65%, 1.27%, and 1.07%, respectively, while the corresponding crack damage thresholds were 39, 32.5, and 26 MPa. From ΔP = 1 to 5 MPa, these values decreased by 35.2% and 33.3%, respectively. Because the three specimens exhibited different initial PFS characteristics, these cross-pressure differences should be regarded as trends among the tested specimens rather than effects attributable solely to seepage pressure. The crack damage threshold may nevertheless provide an experimental indicator for identifying the onset of mining-induced PFS instability under seepage conditions.
(2)
The multiscale PFS exhibited differentiated deformation responses in the tested specimens, with SPF showing a particularly pronounced response near the peak-strength point. At the peak-strength point, the normalized TP volumes of specimens M1, M2, and M3 were 1.05, 1.107, and 1.268, respectively; these cross-specimen differences should be interpreted with consideration of their different initial PFS characteristics. Within specimen M2 at ΔP = 3 MPa, the decrease in SPF compressibility at the peak-strength point was approximately 9.6 and 2.3 times those of AP and TP, respectively, demonstrating a stronger deformation response of SPF within the same specimen. Because SPF constitutes the principal transport pathways in coal, its compressibility response may provide an experimentally derived indicator for characterizing stress-dependent transport-pathway evolution and may inform permeability assessment under mining-induced stress.
(3)
In the tested specimens, coal failure was accompanied by a transition of SPF from a relatively complex structure to a more connected transport network. The SPF fractal dimension, DS, ranged from 2.934 to 2.960 and remained relatively stable before the peak strain. For specimen M2 at ΔP = 3 MPa, DS decreased from approximately 2.946 before failure to 2.934 at the peak strain, accompanied by rapid PFS propagation and enhanced connectivity. The coupled evolution of DS and SPF connectivity may serve as a potential structural indicator for evaluating changes in gas transport pathways. The fractal results characterize the evolution of SPF rather than the entire PFS because AP did not exhibit physically valid fractal scaling under the adopted NMR-based model.
A limitation of this study is that only one coal specimen was tested at each seepage pressure. Although the specimens were obtained from the same coal block and cored in the same direction, differences in their initial PFS characteristics, particularly the SPF fraction, indicate that natural specimen heterogeneity may influence the measured mechanical and PFS responses. Therefore, the cross-pressure comparisons reported in this study should be regarded as mechanistic trends among the tested specimens rather than statistically representative pressure-dependent relationships and cannot be attributed exclusively to seepage pressure. In addition, the degree of water saturation and residual gas fraction was not independently quantified, and the NMR-derived pore-volume variations are therefore interpreted as relative changes in water-filled pore space rather than absolute pore volumes. Future work will employ replicate specimens at each seepage pressure and directly quantify the degree of saturation and residual gas content to evaluate specimen-to-specimen variability and further verify the observed trends.

Author Contributions

Conceptualization, W.J., S.Y. and F.L.; methodology, S.Y., Y.W. and F.L.; software, S.X., S.J. and E.H.; validation, W.J., S.Y. and Y.W.; formal analysis, F.L., S.J. and E.H.; investigation, S.Y., W.C. and Y.W.; data curation, W.J.; writing—original draft preparation, W.J., S.J. and S.X.; writing—review and editing, W.J., S.Y. and F.L.; visualization, E.H., S.J. and W.C.; supervision, W.J., S.X., W.C. and Y.W.; funding acquisition, W.J., S.Y., S.X. and W.C. All authors have read and agreed to the published version of the manuscript.

Funding

This study was funded by the S&T Innovation and Development Project of Information the Institution of the Ministry of Emergency Management (Project No. 2025506), the National Natural Science Foundation of China (52574121, 52504102, 52404080), Deep Earth Probe and Mineral Resources Exploration-National Science and Technology Major Project (2024ZD1003902), the Intergovernmental International Science and Technology Innovation Cooperation Key Special Project (2025YFE0109800), Hunan Provincial Key Research and Development Program Project (2025AQ2019), and European Commission Horizon Europe Marie Skłodowska-Curie Actions Staff Exchanges Project—LOC3G (101129729).

Data Availability Statement

The original contributions presented in this study are included in the article. Further inquiries can be directed to the corresponding authors.

Acknowledgments

The authors thank the editors and anonymous reviewers for their valuable and constructive suggestions.

Conflicts of Interest

The authors declare no conflicts of interest.

References

  1. Xie, H.P.; Zhou, H.W.; Liu, J.F.; Gao, F.; Zhang, R.; Xue, D.J.; Zhang, Y. Mining-Induced Mechanical Behavior in Coal Seams under Different Mining Layouts. J. China Coal Soc. 2011, 36, 1067–1074. (In Chinese) [Google Scholar] [CrossRef]
  2. Xie, S.L.; Yang, S.; Jia, W.H.; Chen, Y.T.; Wang, Y.T.; Huang, C.H.; Cao, Z.Z. Evolution of Pore and Fracture Structure in Coal under Mining-Induced Unloading Conditions. Fractal Fract. 2026, 10, 391. [Google Scholar] [CrossRef] [Scilit]
  3. Xie, S.L.; Yang, S.; Jia, W.H.; Chen, Y.T.; Wang, Y.D.; Chen, W.; Wan, W. NMR-Based Fractal Characterization of Pore and Fracture Structure Evolution in Coal under Cyclic Unloading. Fractal Fract. 2026, 10, 509. [Google Scholar] [CrossRef] [Scilit]
  4. Zhang, P.S.; Wang, H.W.; Hong, H.; Xu, D.Q.; Chen, Z.B.; Deng, Y.C.; Liang, Z.; Li, J.K.; Chen, W.H.; Cui, Q. Mechanical Properties and Energy Evolution Law of Deep-Buried Sandstone under Seepage-Mining Stress Coupling. Rock Soil Mech. 2025, 46, 1997–2010. [Google Scholar] [CrossRef]
  5. Tan, T.; Zhang, C.Y.; Zhao, Y.L.; Li, X.S. Mechanical Behavior and Damage Constitutive Model of Sandstone under Hydro-Mechanical (H-M) Coupling. Int. J. Min. Sci. Technol. 2024, 34, 837–853. [Google Scholar] [CrossRef] [Scilit]
  6. Hu, J.H.; Dong, Z.Z.; Ma, S.W.; Qin, Y.G.; Xu, X.; Dai, Z. Seepage Characteristics of Damaged Rock under Stress-Seepage Coupling. Gold Sci. Technol. 2021, 29, 355–363. [Google Scholar]
  7. Zhang, C.; Du, C.F.; Song, W.D.; Fu, J.X. Degradation Effect and Failure Characteristics of Granite under Stress–Seepage Coupling. Chin. J. Eng. 2024, 46, 600–613. [Google Scholar] [CrossRef]
  8. Li, M.; Liu, X.S. Experimental and Numerical Investigation of the Failure Mechanism and Permeability Evolution of Sandstone Based on Hydro-Mechanical Coupling. J. Nat. Gas Sci. Eng. 2021, 95, 104240. [Google Scholar] [CrossRef] [Scilit]
  9. Zhang, B.; Chen, Y.L. Particle Size Effect on Pore Structure Characteristics of Lignite Determined via Low-Temperature Nitrogen Adsorption. J. Nat. Gas Sci. Eng. 2020, 84, 103633. [Google Scholar] [CrossRef] [Scilit]
  10. Xu, C.P.; Li, H.; Lu, Y.; Liu, T.; Lu, J.X.; Shi, S.L.; Ye, Q.; Jia, Z.Z.; Wang, Z. Influence of Microwave-Assisted Oxidant Stimulation on Pore Structure and Fractal Characteristics of Bituminous Coal Based on Low-Temperature Nitrogen Adsorption. Fuel 2022, 327, 125173. [Google Scholar] [CrossRef] [Scilit]
  11. Ni, G.H.; Li, S.; Rahman, S.; Xun, M.; Wang, H.; Xu, Y.H.; Xie, H.C. Effect of Nitric Acid on the Pore Structure and Fractal Characteristics of Coal Based on the Low-Temperature Nitrogen Adsorption Method. Powder Technol. 2020, 367, 506–516. [Google Scholar] [CrossRef] [Scilit]
  12. Qi, L.L.; Tang, X.; Wang, Z.F.; Peng, X.S. Pore Characterization of Different Types of Coal from Coal and Gas Outburst Disaster Sites Using Low Temperature Nitrogen Adsorption Approach. Int. J. Min. Sci. Technol. 2017, 27, 371–377. [Google Scholar] [CrossRef] [Scilit]
  13. Qin, L.; Li, S.G.; Zhai, C.; Lin, H.F.; Zhao, P.X.; Shi, Y.; Bai, Y. Changes in the Pore Structure of Lignite after Repeated Cycles of Liquid Nitrogen Freezing as Determined by Nitrogen Adsorption and Mercury Intrusion. Fuel 2020, 267, 117214. [Google Scholar] [CrossRef] [Scilit]
  14. Zhang, M.; Duan, C.C.; Li, G.F.; Fu, X.H.; Zhong, Q.; Liu, H.H.; Dong, Z.Y. Determinations of the Multifractal Characteristics of the Pore Structures of Low-, Middle-, and High-Rank Coal Using High-Pressure Mercury Injection. J. Pet. Sci. Eng. 2021, 203, 108656. [Google Scholar] [CrossRef] [Scilit]
  15. Xu, H.; Wang, G.; Fan, C.; Liu, X.L.; Wu, M.M. Grain-Scale Reconstruction and Simulation of Coal Mechanical Deformation and Failure Behaviors Using Combined SEM Digital Rock Data and DEM Simulator. Powder Technol. 2020, 360, 1305–1320. [Google Scholar] [CrossRef] [Scilit]
  16. Ju, Y.; Xi, C.D.; Zhang, Y.; Mao, L.T.; Gao, F.; Xie, H.P. Laboratory in Situ CT Observation of the Evolution of 3D Fracture Networks in Coal Subjected to Confining Pressures and Axial Compressive Loads: A Novel Approach. Rock Mech. Rock Eng. 2018, 51, 3361–3375. [Google Scholar] [CrossRef] [Scilit]
  17. Zhou, H.W.; Liu, Z.L.; Zhao, J.W.; Chen, B.C.; Li, X.N.; Zhong, J.C. In-Situ Observation and Modeling Approach to Evolution of Pore-Fracture Structure in Coal. Int. J. Min. Sci. Technol. 2023, 33, 265–274. [Google Scholar] [CrossRef] [Scilit]
  18. Liu, S.Q.; Sang, S.X.; Wang, G.; Ma, J.S.; Wang, X.; Wang, W.F.; Du, Y.; Wang, T. FIB-SEM and X-Ray CT Characterization of Interconnected Pores in High-Rank Coal Formed from Regional Metamorphism. J. Pet. Sci. Eng. 2017, 148, 21–31. [Google Scholar] [CrossRef] [Scilit]
  19. Zhou, H.W.; Liu, Z.L.; Zhong, J.C.; Chen, B.C.; Zhao, J.W.; Xue, D.J. NMRI Online Observation of Coal Fracture and Pore Structure Evolution under Confining Pressure and Axial Compressive Loads: A Novel Approach. Energy 2022, 261, 125297. [Google Scholar] [CrossRef] [Scilit]
  20. Mao, Y.Q.; Xia, W.C.; Peng, Y.L.; Xie, G.Y. Wetting of Coal Pores Characterized by LF-NMR and Its Relationship to Flotation Recovery. Fuel 2020, 272, 117737. [Google Scholar] [CrossRef] [Scilit]
  21. Zhang, Q.T.; Zhou, G.; Hu, Y.Y.; Xing, M.Y.; Zhang, R.; Wang, P.F.; Hu, S.Y. Microwetting Dynamic Behavior and Mechanism for Coal Dust Based on Low Field NMR Method—A Case Study. Fuel 2021, 297, 120702. [Google Scholar] [CrossRef] [Scilit]
  22. Liu, Z.L.; Guo, P.Y.; Chen, R.X.; Su, T.; Zhang, S.; Chen, B.C.; Song, L.; Zhou, H.W. Online Triaxial–NMR Monitoring of Pore–Fracture Reorganization and Creep Response in Coal under a Mining-Type Stress Path. Int. J. Rock Mech. Min. Sci. 2026, 201, 106462. [Google Scholar] [CrossRef] [Scilit]
  23. Jia, W.H.; Zhou, H.W.; Li, F.W.; Hu, E.Y.; Xie, S.L.; Zhang, L.; Liu, Z.L.; Jin, S.K. Coal Creep Deformation and Pore-Fracture Evolution under Cyclic Loading–Unloading Using NMRI and Fractal Analysis. Int. J. Min. Sci. Technol. 2026, 36, 1329–1344. [Google Scholar] [CrossRef] [Scilit]
  24. Zhao, Y.; Wang, C.L.; Ning, L.; Zhao, H.F.; Bi, J. Pore and Fracture Development in Coal under Stress Conditions Based on Nuclear Magnetic Resonance and Fractal Theory. Fuel 2022, 309, 122112. [Google Scholar] [CrossRef] [Scilit]
  25. Wang, C.L.; Zhao, Y.; Ning, L.; Bi, J. Permeability Evolution of Coal Subjected to Triaxial Compression Based on In-Situ Nuclear Magnetic Resonance. Int. J. Rock Mech. Min. Sci. 2022, 159, 105213. [Google Scholar] [CrossRef] [Scilit]
  26. Jia, W.H.; Zhou, H.W.; Xie, S.L.; Wang, Y.M.; Liu, Z.L.; Deng, H.L. Real-Time Monitoring of Pore-Fracture Structure Evolution during Coal Creep Based on NMR. Energy Fuels 2023, 37, 1057–1069. [Google Scholar] [CrossRef] [Scilit]
  27. Zhang, T.; Tang, M.; Yuan, L.; Liu, Z.G.; Ju, Y.W.; Xie, Z.Z. Dynamic Pore-Fracture Characteristic and Evolution Influenced by the Underground Mining Considering the In-Situ Stress. Energy 2024, 289, 130119. [Google Scholar] [CrossRef] [Scilit]
  28. Zheng, S.J.; Yao, Y.B.; Liu, D.M.; Cai, Y.D.; Liu, Y. Nuclear Magnetic Resonance Surface Relaxivity of Coals. Int. J. Coal Geol. 2019, 205, 1–13. [Google Scholar] [CrossRef] [Scilit]
  29. Yao, Y.B.; Liu, D.M.; Che, Y.; Tang, D.Z.; Tang, S.H.; Huang, W.H. Petrophysical Characterization of Coals by Low-Field Nuclear Magnetic Resonance (NMR). Fuel 2010, 89, 1371–1380. [Google Scholar] [CrossRef] [Scilit]
  30. Zhang, J.J.; Wei, C.T.; Ju, W.; Qin, Z.Y.; Ji, Y.K.; Quan, F.K.; Hu, Y.B. Microscopic Distribution and Dynamic Variation of Water under Stress in Middle and High Rank Coal Samples. J. Nat. Gas Sci. Eng. 2020, 79, 103369. [Google Scholar] [CrossRef] [Scilit]
  31. Zhou, S.D.; Liu, D.M.; Cai, Y.D.; Yao, Y.B. Fractal Characterization of Pore-Fracture in Low-Rank Coals Using a Low-Field NMR Relaxation Method. Fuel 2016, 181, 218–226. [Google Scholar] [CrossRef] [Scilit]
  32. Sun, Y.; Zhai, C.; Zhao, Y.; Xu, J.Z.; Cong, Y.Z.; Zheng, Y.F.; Tang, W. Multifractal Analysis and Neural Network Prediction of Pore Structures in Coal Reservoirs Based on NMR T2 Spectra. Energy Fuels 2021, 35, 11306–11318. [Google Scholar] [CrossRef] [Scilit]
  33. Liu, Z.L.; Zhou, H.W.; Chen, B.C.; Song, L.; Sun, X.T. Integrated NMR Analysis for Evaluating Pore-Fracture Structures and Permeability in Deep Coals: A One-Stop Approach. Energy Fuels 2024, 38, 6854–6867. [Google Scholar] [CrossRef] [Scilit]
  34. Li, S.; Tang, D.Z.; Pan, Z.J.; Xu, H.; Huang, W.Q. Characterization of the Stress Sensitivity of Pores for Different Rank Coals by Nuclear Magnetic Resonance. Fuel 2013, 111, 746–754. [Google Scholar] [CrossRef] [Scilit]
  35. Chen, D.; Pan, Z.J.; Shi, J.Q.; Si, G.Y.; Ye, Z.H.; Zhang, J.L. A Novel Approach for Modelling Coal Permeability during Transition from Elastic to Post-Failure State Using a Modified Logistic Growth Function. Int. J. Coal Geol. 2016, 163, 132–139. [Google Scholar] [CrossRef] [Scilit]
  36. Yang, H.; Liu, Z.; Zhao, D.W.; Lv, J.L.; Yang, W.Z. Insights into the Fluid Wetting Law and Fractal Characteristics of Coal Particles during Water Injection Based on Nuclear Magnetic Resonance. Chaos Solitons Fractals 2022, 159, 112109. [Google Scholar] [CrossRef] [Scilit]
Figure 1. Online triaxial NMR testing system.
Fractalfract 10 00634 g001
Figure 2. Mining-induced stress path under seepage pressures of 1, 3, and 5 MPa.
Fractalfract 10 00634 g002
Figure 3. Stress–strain behavior of coal specimens under different seepage pressures: (a) stress–strain curves; (b) peak stress and peak strain.
Fractalfract 10 00634 g003
Figure 4. Relationship between the stress–strain curves and the spatial evolution of the pore −fracture structure (PFS) under different seepage pressures: (a) M1, ΔP = 1 MPa; (b) M2, ΔP = 3 MPa; (c) M3, ΔP = 5 MPa.
Fractalfract 10 00634 g004
Figure 5. T2 spectra of the coal specimens under hydrostatic pressure. AP and SPF denote adsorption pores and seepage pores and fractures, respectively.
Fractalfract 10 00634 g005
Figure 6. Evolution of the T2 spectra and corresponding spectrum area ratios of specimen M1 under different stress states at ΔP = 1 MPa: (a) T2 spectra; (b) spectrum area ratios (Si/S0). AP, SPF, and TP denote adsorption pores, seepage pores and fractures, and total pores, respectively.
Fractalfract 10 00634 g006
Figure 7. Evolution of the T2 spectra and corresponding spectrum area ratios of specimen M2 under different stress states at ΔP = 3 MPa: (a) T2 spectra; (b) spectrum area ratios (Si/S0). AP, SPF, and TP denote adsorption pores, seepage pores and fractures, and total pores, respectively.
Fractalfract 10 00634 g007
Figure 8. Evolution of the T2 spectra and corresponding spectrum area ratios of specimen M3 under different stress states at ΔP = 5 MPa: (a) T2 spectra; (b) spectrum area ratios (Si/S0). AP, SPF, and TP denote adsorption pores, seepage pores and fractures, and total pores, respectively.
Fractalfract 10 00634 g008
Figure 9. Evolution of T2g with axial strain in the three coal specimens.
Fractalfract 10 00634 g009
Figure 10. Evolution of multiscale pore compressibility: (a) M1, ΔP = 1 MPa; (b) M2, ΔP = 3 MPa; (c) M3, ΔP = 5 MPa. AP, SPF, and TP denote adsorption pores, seepage pores and fractures, and total pores, respectively.
Fractalfract 10 00634 g010
Figure 11. Evolution of the fractal dimension DS of seepage pores and fractures (SPFs) with strain.
Fractalfract 10 00634 g011
Table 1. Basic physical properties of the coal specimens.
Specimen IDDiameter (mm)Height (mm)Volume (mm3)Natural Mass (g)Dry Mass (g)Saturated Mass (g)Porosity (%)
M125.0850.1024,75031.44630.12532.5019.60
M225.1250.1424,84932.75931.45033.5258.35
M325.1650.2024,95832.75930.85333.1539.22
Disclaimer/Publisher’s Note: The statements, opinions and data contained in all publications are solely those of the individual author(s) and contributor(s) and not of MDPI and/or the editor(s). MDPI and/or the editor(s) disclaim responsibility for any injury to people or property resulting from any ideas, methods, instructions or products referred to in the content.