1. Introduction
The distribution characteristics of porous structures in coal have a significant impact on the mechanical properties and seepage behavior of the rock. When subjected to external stress, the internal porous structures and fracture networks in coal can undergo changes in permeability pathways and mechanical performance [
1,
2,
3,
4]. A thorough understanding of the micromechanical behavior and seepage characteristics of porous rock materials under coupled seepage–stress conditions is crucial for predicting and controlling the mechanical properties of rocks in complex physical fields, as well as the rock engineering response.
In recent years, extensive research has focused on the behavior of rock materials under coupled seepage–stress conditions. Research efforts have encompassed theoretical analysis, laboratory experiments, and numerical simulations, leading to a series of significant findings. In terms of theoretical analysis, Liu et al. [
5,
6,
7] combined geomechanics and seepage mechanics to study the coupling effect in porous media and fractured rock masses, establishing a seepage coupling model for rock masses. Tan et al. [
8], Xia Binwei et al. [
9], and Liu et al. [
10] separately developed an improved element constitutive law based on the Hoek–Brown failure criterion, a permeability model for fractured coal with complex curved fractures, and a permeability evolution equation that characterizes the coupling of micro and macro stress–seepage in rocks.
In laboratory experiments, Xia Tongqiang et al. [
11] independently developed a multi-process coupling test system for coal–rock stress–seepage–temperature, simulating the stress deformation and gas migration behaviors of coal–rock bodies under various stress, temperature, and fluid pressure conditions. Zhang Peisen et al. [
12,
13,
14,
15] studied the mechanical and permeability characteristics of sandstone and the evolution of permeability under different damage conditions by controlling confining pressure, pore water pressure, and unloading paths. Jia Lifeng et al. [
16] utilized a self-developed stress–seepage–desorption coal deformation test device to analyze the effects of confining pressure and pore pressure on coal deformation. Lin Jian et al. [
17] conducted nuclear magnetic resonance (NMR) experiments on rock seepage under hydrostatic pressure, examining the changes in pore structure within the rock during the seepage process.
In numerical simulations, Zhao et al. [
18] developed a three-dimensional digital analysis model through MATLAB 2017a combined with linear interpolation techniques, enabling an approximate calculation of seepage in fractured rock masses. Liu et al. [
19] described the quantitative relationship between the seepage capacity of rocks and fluid tortuosity, fracture distribution, and fractal dimensions of fractures. Wang et al. [
20] investigated the weathered granite from the deep section of the Shenzhen-Zhongshan Bridge subsea tunnel, employing CFD-DEM numerical simulations under hydro-mechanical coupling conditions. Simulations demonstrate that higher confining pressure promotes shear failure, while elevated confining and fluid pressures accelerate the formation of stable micro-cracks. A comparison of isotropic and anisotropic permeability models for a hypothetical Valhall well reveals that isotropy underestimates near-wellbore permeability impairment. However, the anisotropic model also indicates a limited (~10%) reduction in radial permeability [
21]. A simulation was performed to characterize the mathematical relationship between the permeability of the coal seam sample and the overburden–gas pressure, incorporating the dynamic stress-balance parameters after borehole drilling. Water injection in coal significantly enhances permeability, with a 26.7–58.4% stress reduction in concentrated zones, increasing it by 263.7–563.5% [
22].
Based on previous research, this study experimentally observes the fracture evolution in coal under uniaxial compression by using a CT scanning system. It then introduces the Knudsen number to analyze the gas migration behavior within coal pores. A permeability analysis is conducted by incorporating fractal dimensions and tortuosity into Darcy’s law, examining the relationship between permeability and factors such as the maximum pore size, fractal dimension of the material, and the number of pores with the maximum size. A coupled seepage–stress model is established to determine the diffusion and development patterns of micro-fractures within the coal under the influence of combined fields. The findings provide theoretical support for understanding the micromechanical behavior and seepage characteristics of gas migration in porous rock materials under seepage–stress coupling conditions.
2. Microporous Structure of Coal
Pores of different scales exhibit distinct physical and mechanical behaviors, and their size-based classification is essential for investigating the pore–fracture structural characteristics of coal. However, no universally accepted standard for pore-size classification in coal has been established in the existing literature. According to the classification scheme proposed by the Soviet scholar B.B. Khodot [
23], coal pores are divided into macropores (
d > 1000 nm), mesopores (100 <
d < 1000 nm), small pores (10 <
d < 100 nm), and micropores (
d < 10 nm). In contrast, Fu et al. [
24] classified coal pores into diffusion pores and seepage pores. The diffusion pores are further subdivided into micropores (<8 nm), transition pores (8–20 nm), and small pores (20–65 nm), while seepage pores are categorized into mesopores (65–325 nm), transition pores (325–1000 nm), and macropores (>1000 nm). Among these classifications, Khodot’s method was proposed earlier and is more widely applied. Therefore, the theoretical calculations in this study are based on Khodot’s classification scheme.
2.1. CT Scanning of Fracture Evolution in Coal Under Uniaxial Compression
Using CT scanning technology, real-time, non-destructive, three-dimensional visualization observations of the internal structure of coal samples were conducted during uniaxial compression. Raw coal blocks obtained from the field were processed into standard cylindrical specimens with a diameter of 25 mm and a height of 50 mm.
(1) The standard coal samples were subjected to constant-temperature drying to remove moisture, with a temperature set at 80 °C for 24 h. After dehydration, the samples were installed into the CT scanning experimental system.
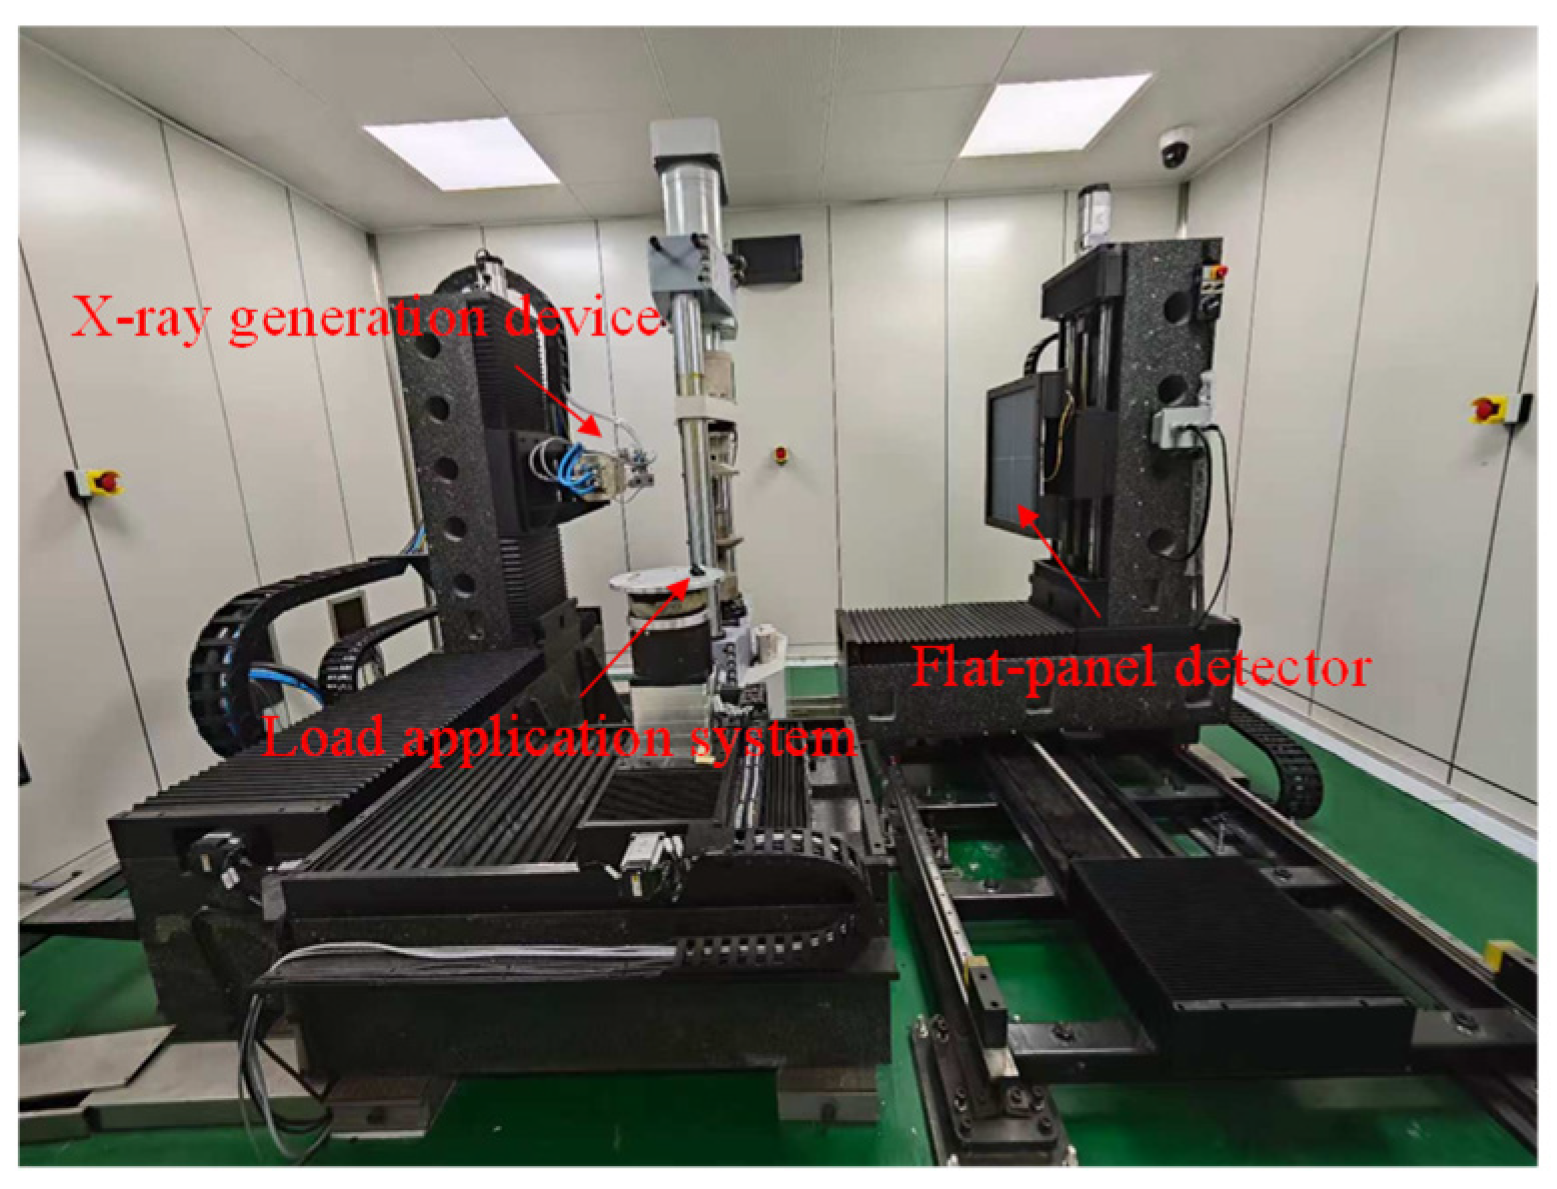
Figure 1 shows the NanoVoxel-4000 X-ray three-dimensional scanning system produced by Sanying Precision Instruments Co., Ltd. in Tianjin, China. Uniaxial compression was conducted under displacement control at a constant loading rate of 0.1 mm/min.
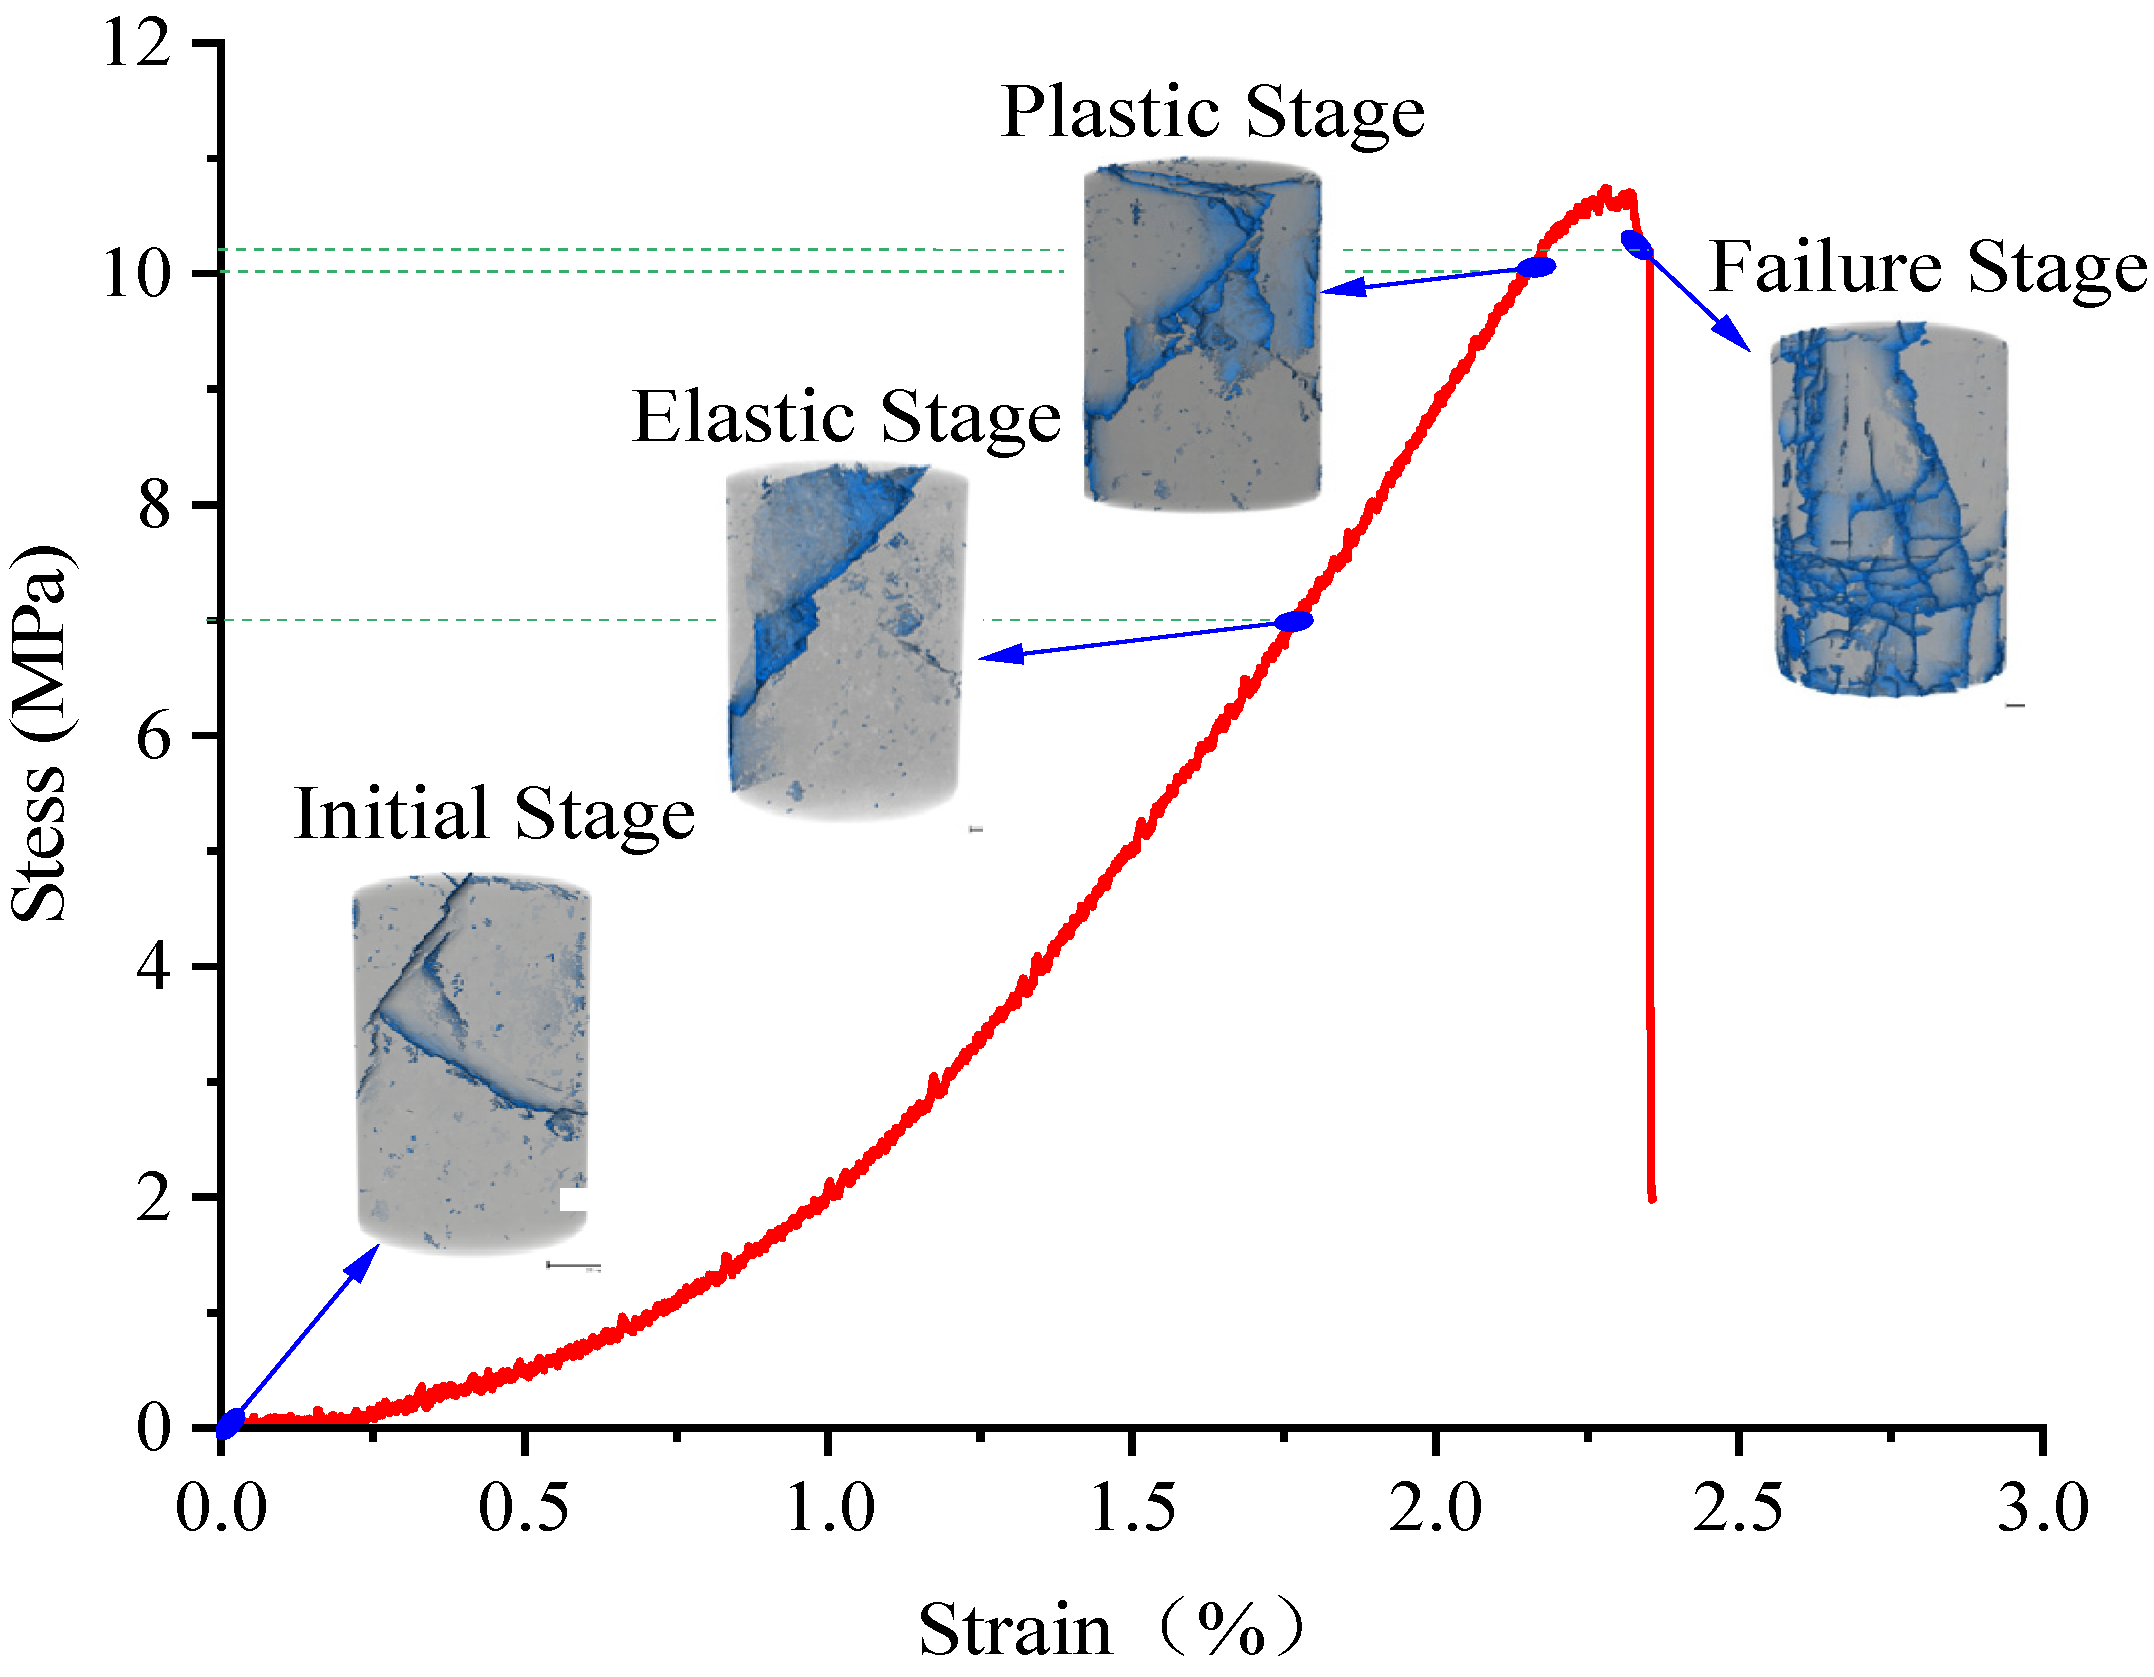
(2) During the uniaxial compression of the coal samples, CT scans were performed at four characteristic stages of the initial stage, elastic stage, plastic stage and failure stage. In the actual experimental process, the axial stresses corresponding to the elastic and plastic stages were 7 and 10 MPa, respectively, and the stress corresponding to the failure stage was 10.2 MPa post-peak.
(3) Three-dimensional reconstructions of the CT scan results were performed at all four loading stages. The visualization software Avizo 2024 was then utilized to quantitatively analyze the resulting pore and fracture networks.
2.2. Evolution Law of Fracture Network Structure
Figure 2 shows the CT scan results of the coal sample at four typical stress levels under uniaxial compression. In the figure, the blue color-rendered areas represent fracture distribution, while the gray areas represent the coal matrix. It can be observed that under initial conditions, the coal sample contains relatively distinct primary fractures, and the evolution of the fracture network is controlled by the progressive stress levels during uniaxial compression. In the elastic stage, stress growth leads to fracture development at the upper end of the primary fractures. In the plastic stage, local stress concentration occurs around the primary fractures, exceeding the strength threshold of the coal sample, resulting in the initiation and propagation of micro-fractures, with a sharp increase in both their number and size. In the failure stage, the concentrated release of strain energy drives the unstable coalescence of main fractures, triggering the expansion and interconnection of the fracture network. The number and size of fractures increase explosively until macroscopic failure of the coal sample occurs.
2.3. Variation Law of Coal Porosity
Coal porosity refers to the ratio of the total volume of open, unfilled fractures in coal to the total volume of the coal sample. It is a key reservoir space parameter that directly affects the storage capacity of fluids such as carbon dioxide or water in coal seams.
Table 1 lists the calculated porosity values of the coal sample under four stress states during uniaxial compression.
During the four stages of coal compression deformation, the porosity increases sequentially. From initial loading to the elastic stage, fracture porosity increases by 34% compared to the initial state. The main reason for this increase is that stress concentration causes slight initiation and propagation of pre-existing fractures, accompanied by the generation of a small number of new micro-fractures in weak areas on the surfaces of pre-existing fractures. On the other hand, the actual increase in fracture porosity during the elastic stage is the net result of the competition between fracture propagation and the compaction effect of stress on the primary pores of the coal matrix. Upon entering the plastic stage, fracture porosity increases significantly twice compared to the initial value. After reaching the peak strength, in the failure stage, fracture porosity rises sharply to 11.4 times that of the initial state.
2.4. Variation Law of Fracture Length
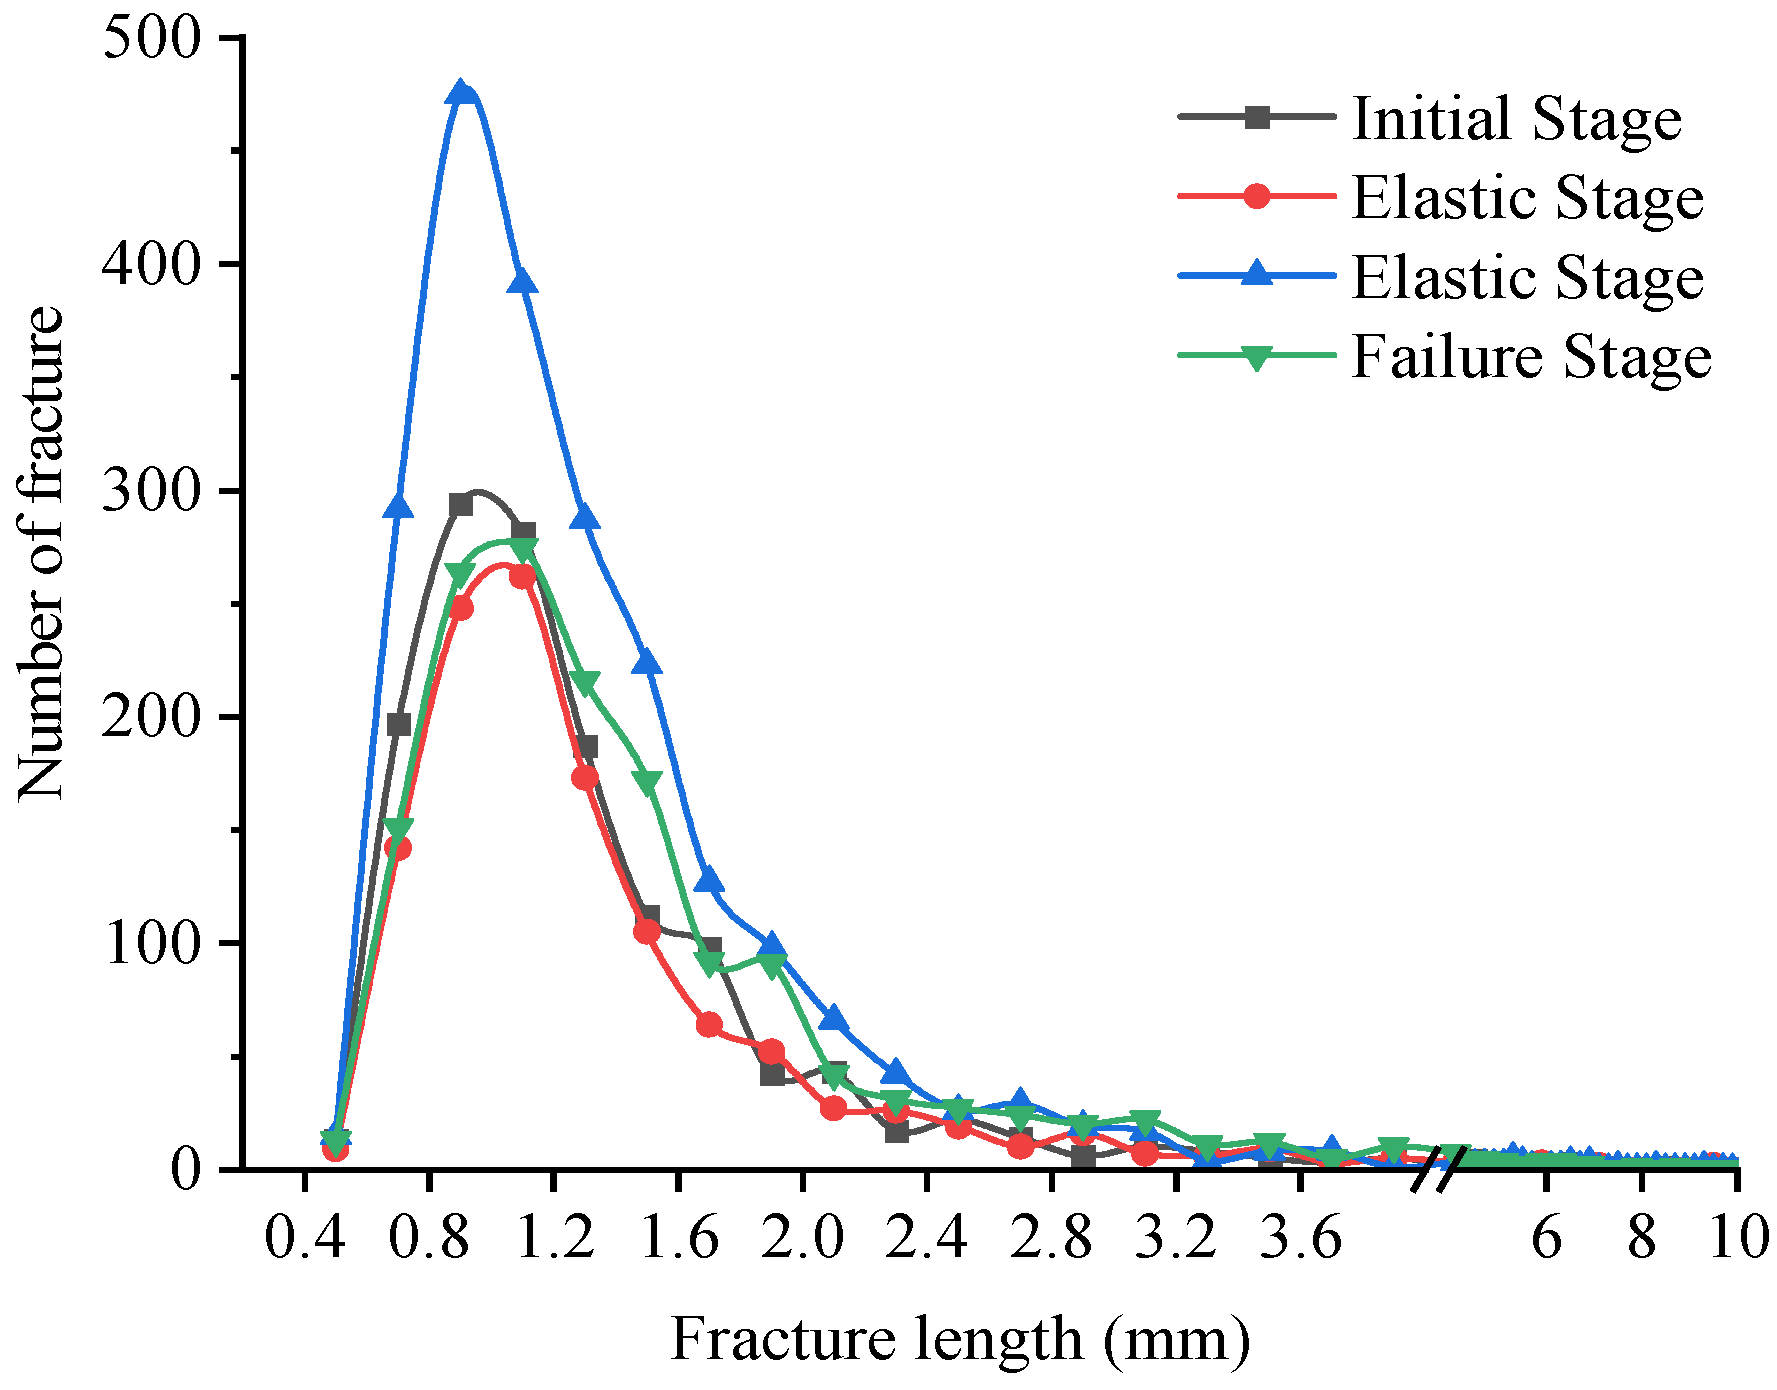
The fracture structures in coal exhibit a highly tortuous, heterogeneous, and complex spatial distribution. Using three-dimensional visualization software, the fracture network of the coal sample was segmented, and the relationship between the total tortuous length of fractures and the number of fractures was statistically analyzed, as shown in
Figure 3.
In each compression deformation stage, the distribution pattern of fracture length versus number is generally consistent. Fractures with lengths ranging from 0.4 to 2.4 mm dominate, accounting for more than 90% of the total number of fractures. Among these, the number of fractures with lengths between 0.4 and 1.2 mm increases with length, while those in the range of 1.2~2.4 mm decrease significantly. Fractures exceeding 2.4 mm in length are extremely rare. Comparing the four stages, the number of small fractures is the smallest in the elastic stage, whereas the plastic stage exhibits the largest number of fractures and the most significant increase. This is mainly because plastic deformation induces the initiation and propagation of a large number of new micro-fractures, but through-going large fractures have not yet formed.
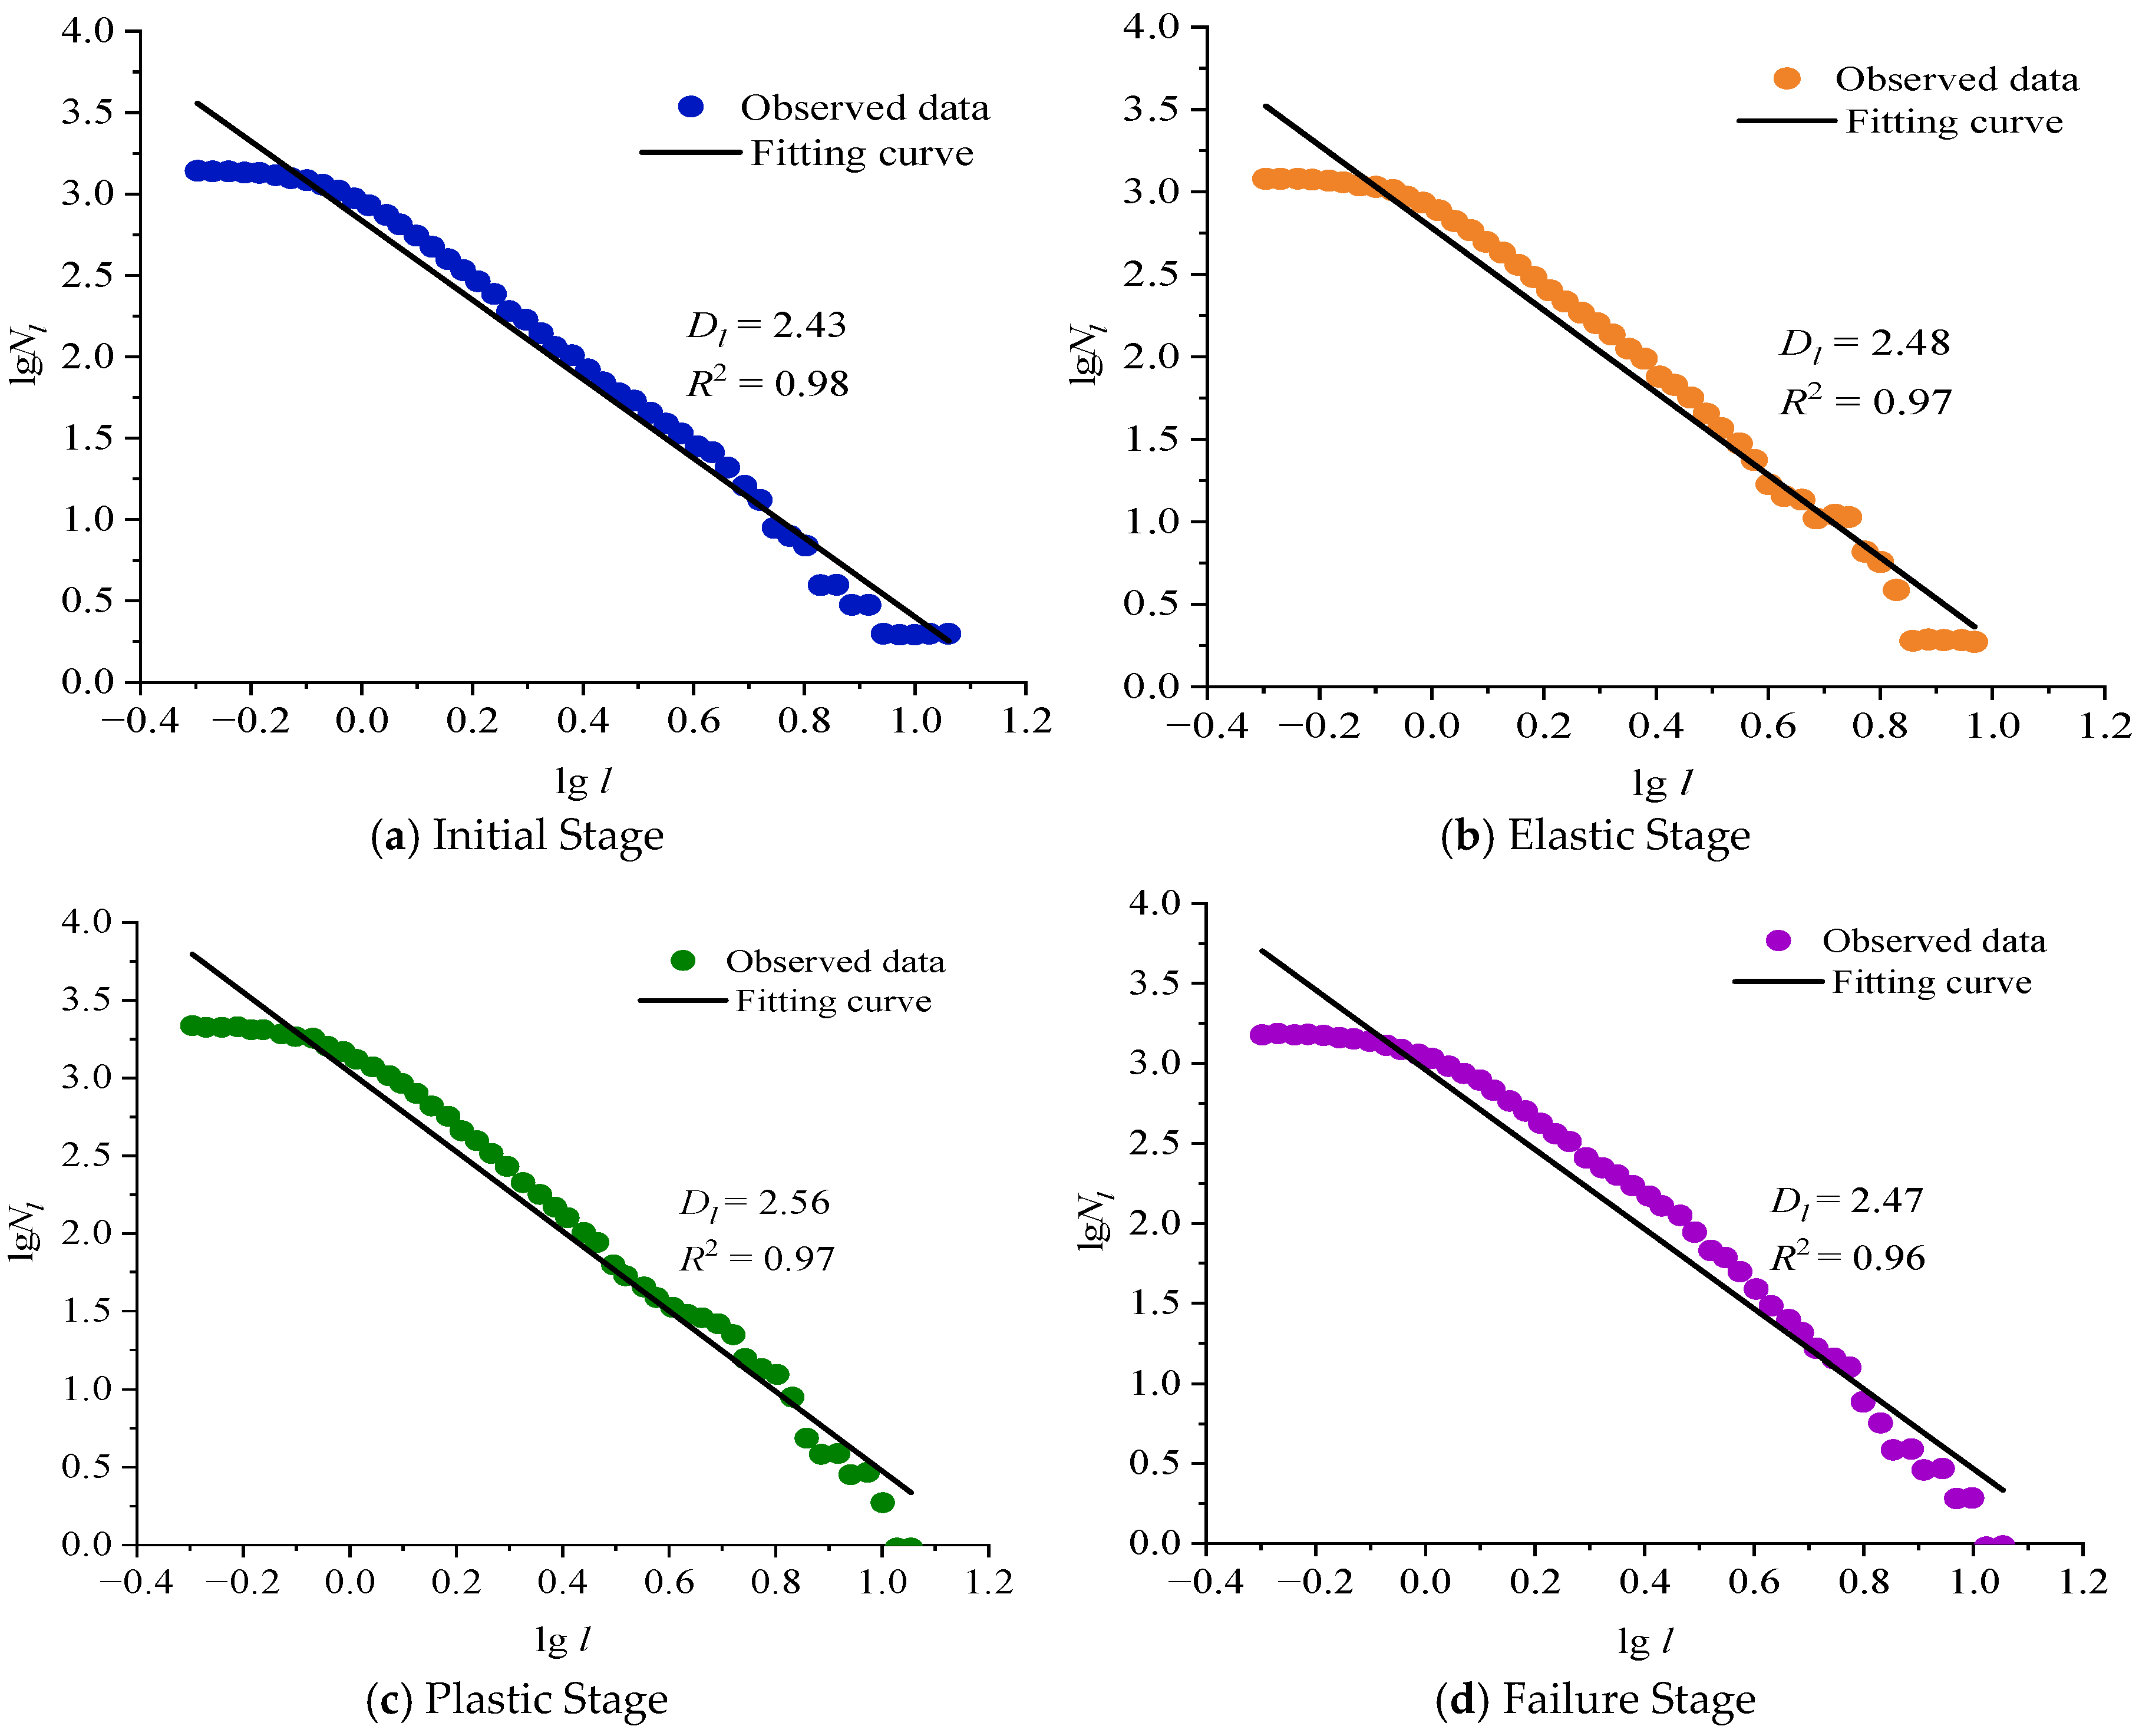
To better analyze the relationship between fracture size and number, the fractal dimension of fracture length was calculated based on the power law relationship between fracture length and number according to fractal theory. Assuming the fracture length is and the number of fractures with a length greater than or equal to is , the relationship satisfies , where is the fractal dimension of fracture length.
Figure 4 shows the calculation curves of the fractal dimension of fracture length at different stress levels. It can be observed that the size distribution of the fracture system exhibits significant fractal characteristics. The fractal dimensions of fracture length in the initial stage, elastic stage, plastic stage, and failure stage are 2.43, 2.48, 2.56, and 2.47, respectively. In the initial stage, the fractal dimension is at a baseline level because the lengths of pre-existing fractures in the coal sample generally range from 0.4 to 2.4 mm, with a lack of extremely short or long fractures, resulting in limited network complexity. In the elastic stage, stress concentration at the tips of pre-existing fractures induces a large number of micro-fractures with lengths less than 1.2 mm; the increased proportion of short fractures enhances the complexity of the fracture network, and the
value increases. Micro-fractures increase explosively, with their lengths covering the full range from 0.4 to 2.4 mm. The dense distribution of “micro-fracture clusters” not only bridges the spatial distribution of the fracture network and optimizes its topological structure but also increases the proportion of micro-fractures, leading to the maximum value. In the failure stage, the sudden release of strain energy causes micro-fractures to coalesce and connect along the stress direction, forming main fractures with lengths greater than 2.4 mm. The proportion of micro-fractures decreases, the length gradient simplifies, the complexity of the fracture network reduces, and the fractal dimension value decreases.
2.5. Variation Law of Fracture Aperture
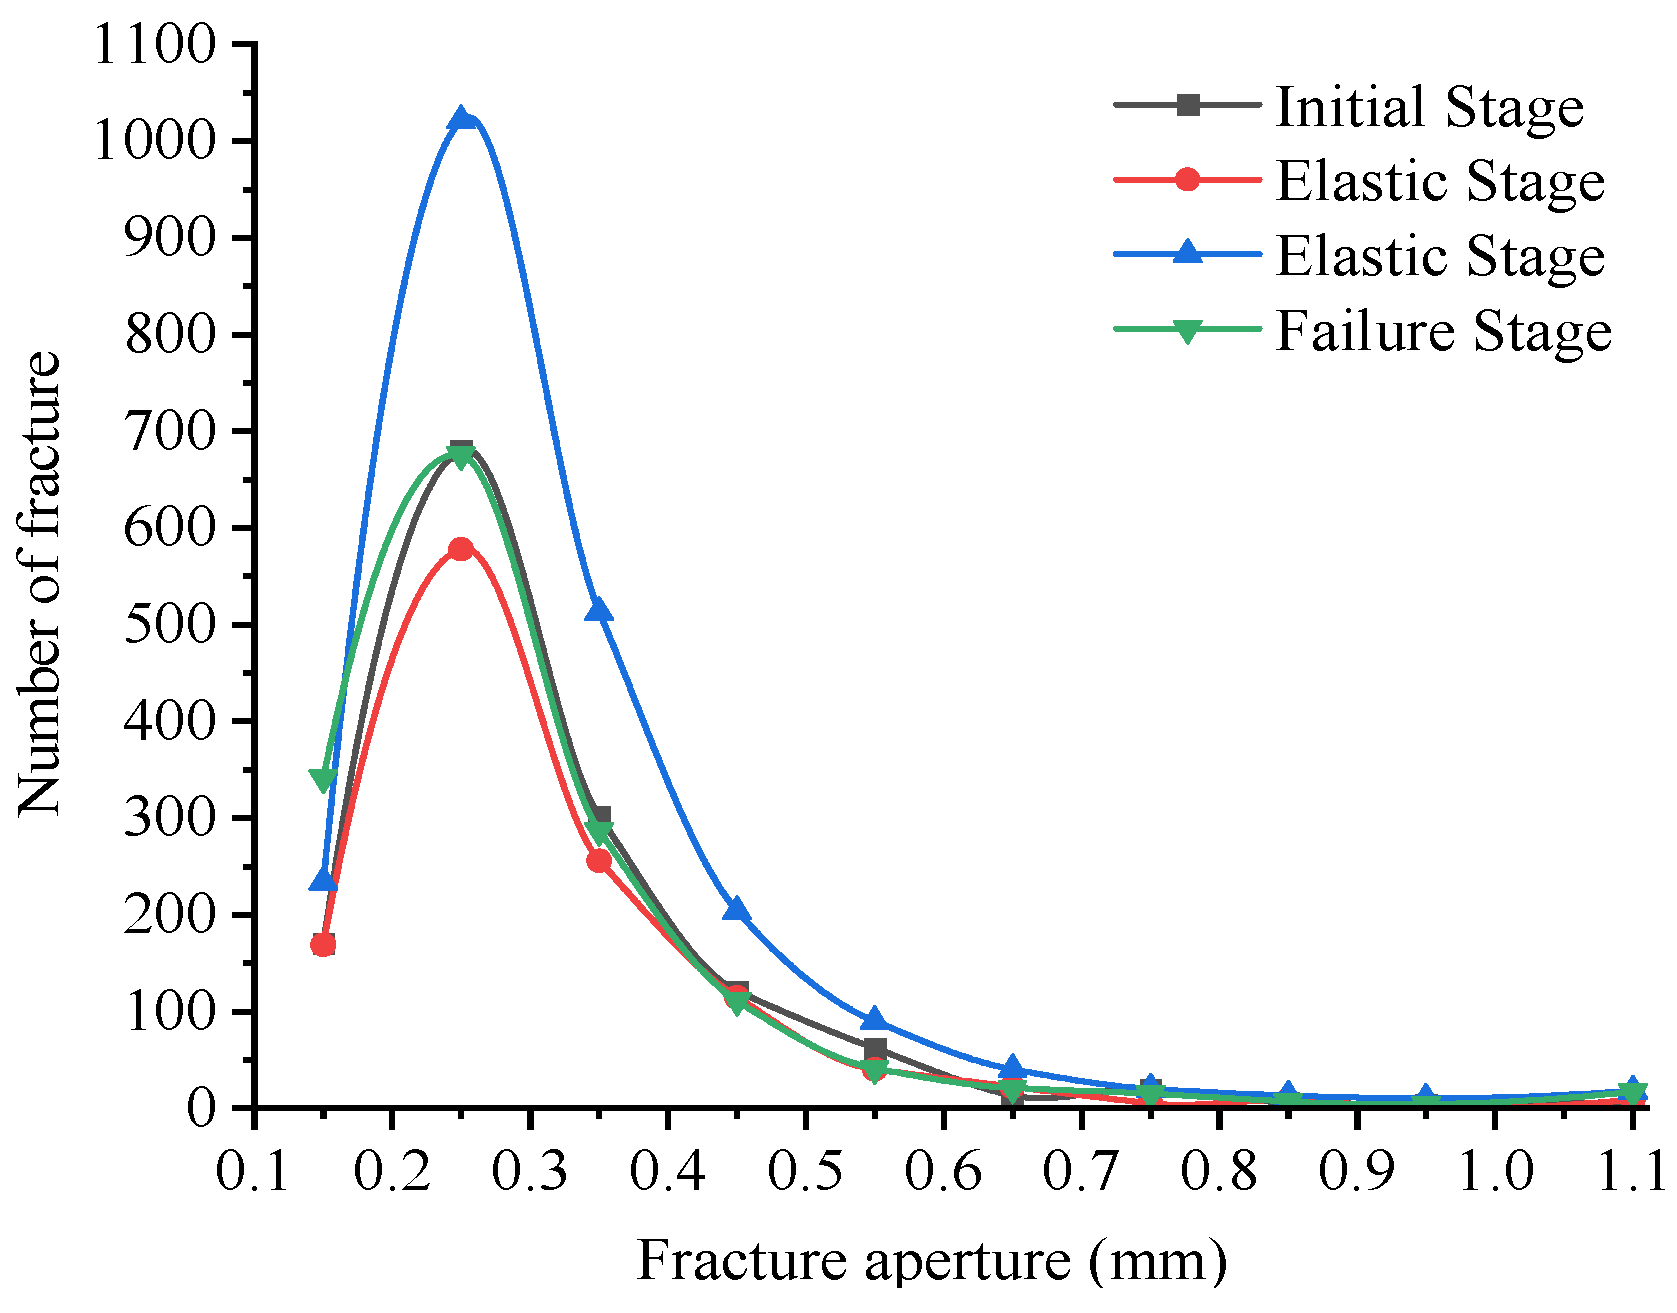
The distribution of fracture aperture versus number in coal samples under different compression stages exhibits a unimodal pattern, as shown in
Figure 5. Under each compression deformation state, the fracture apertures mainly range from 0.15 to 0.6 mm. Among these, the number of fractures with apertures between 0.15 and 0.25 mm increases significantly with increasing aperture, while the number of fractures with apertures between 0.25 and 0.5 mm shows the opposite trend.
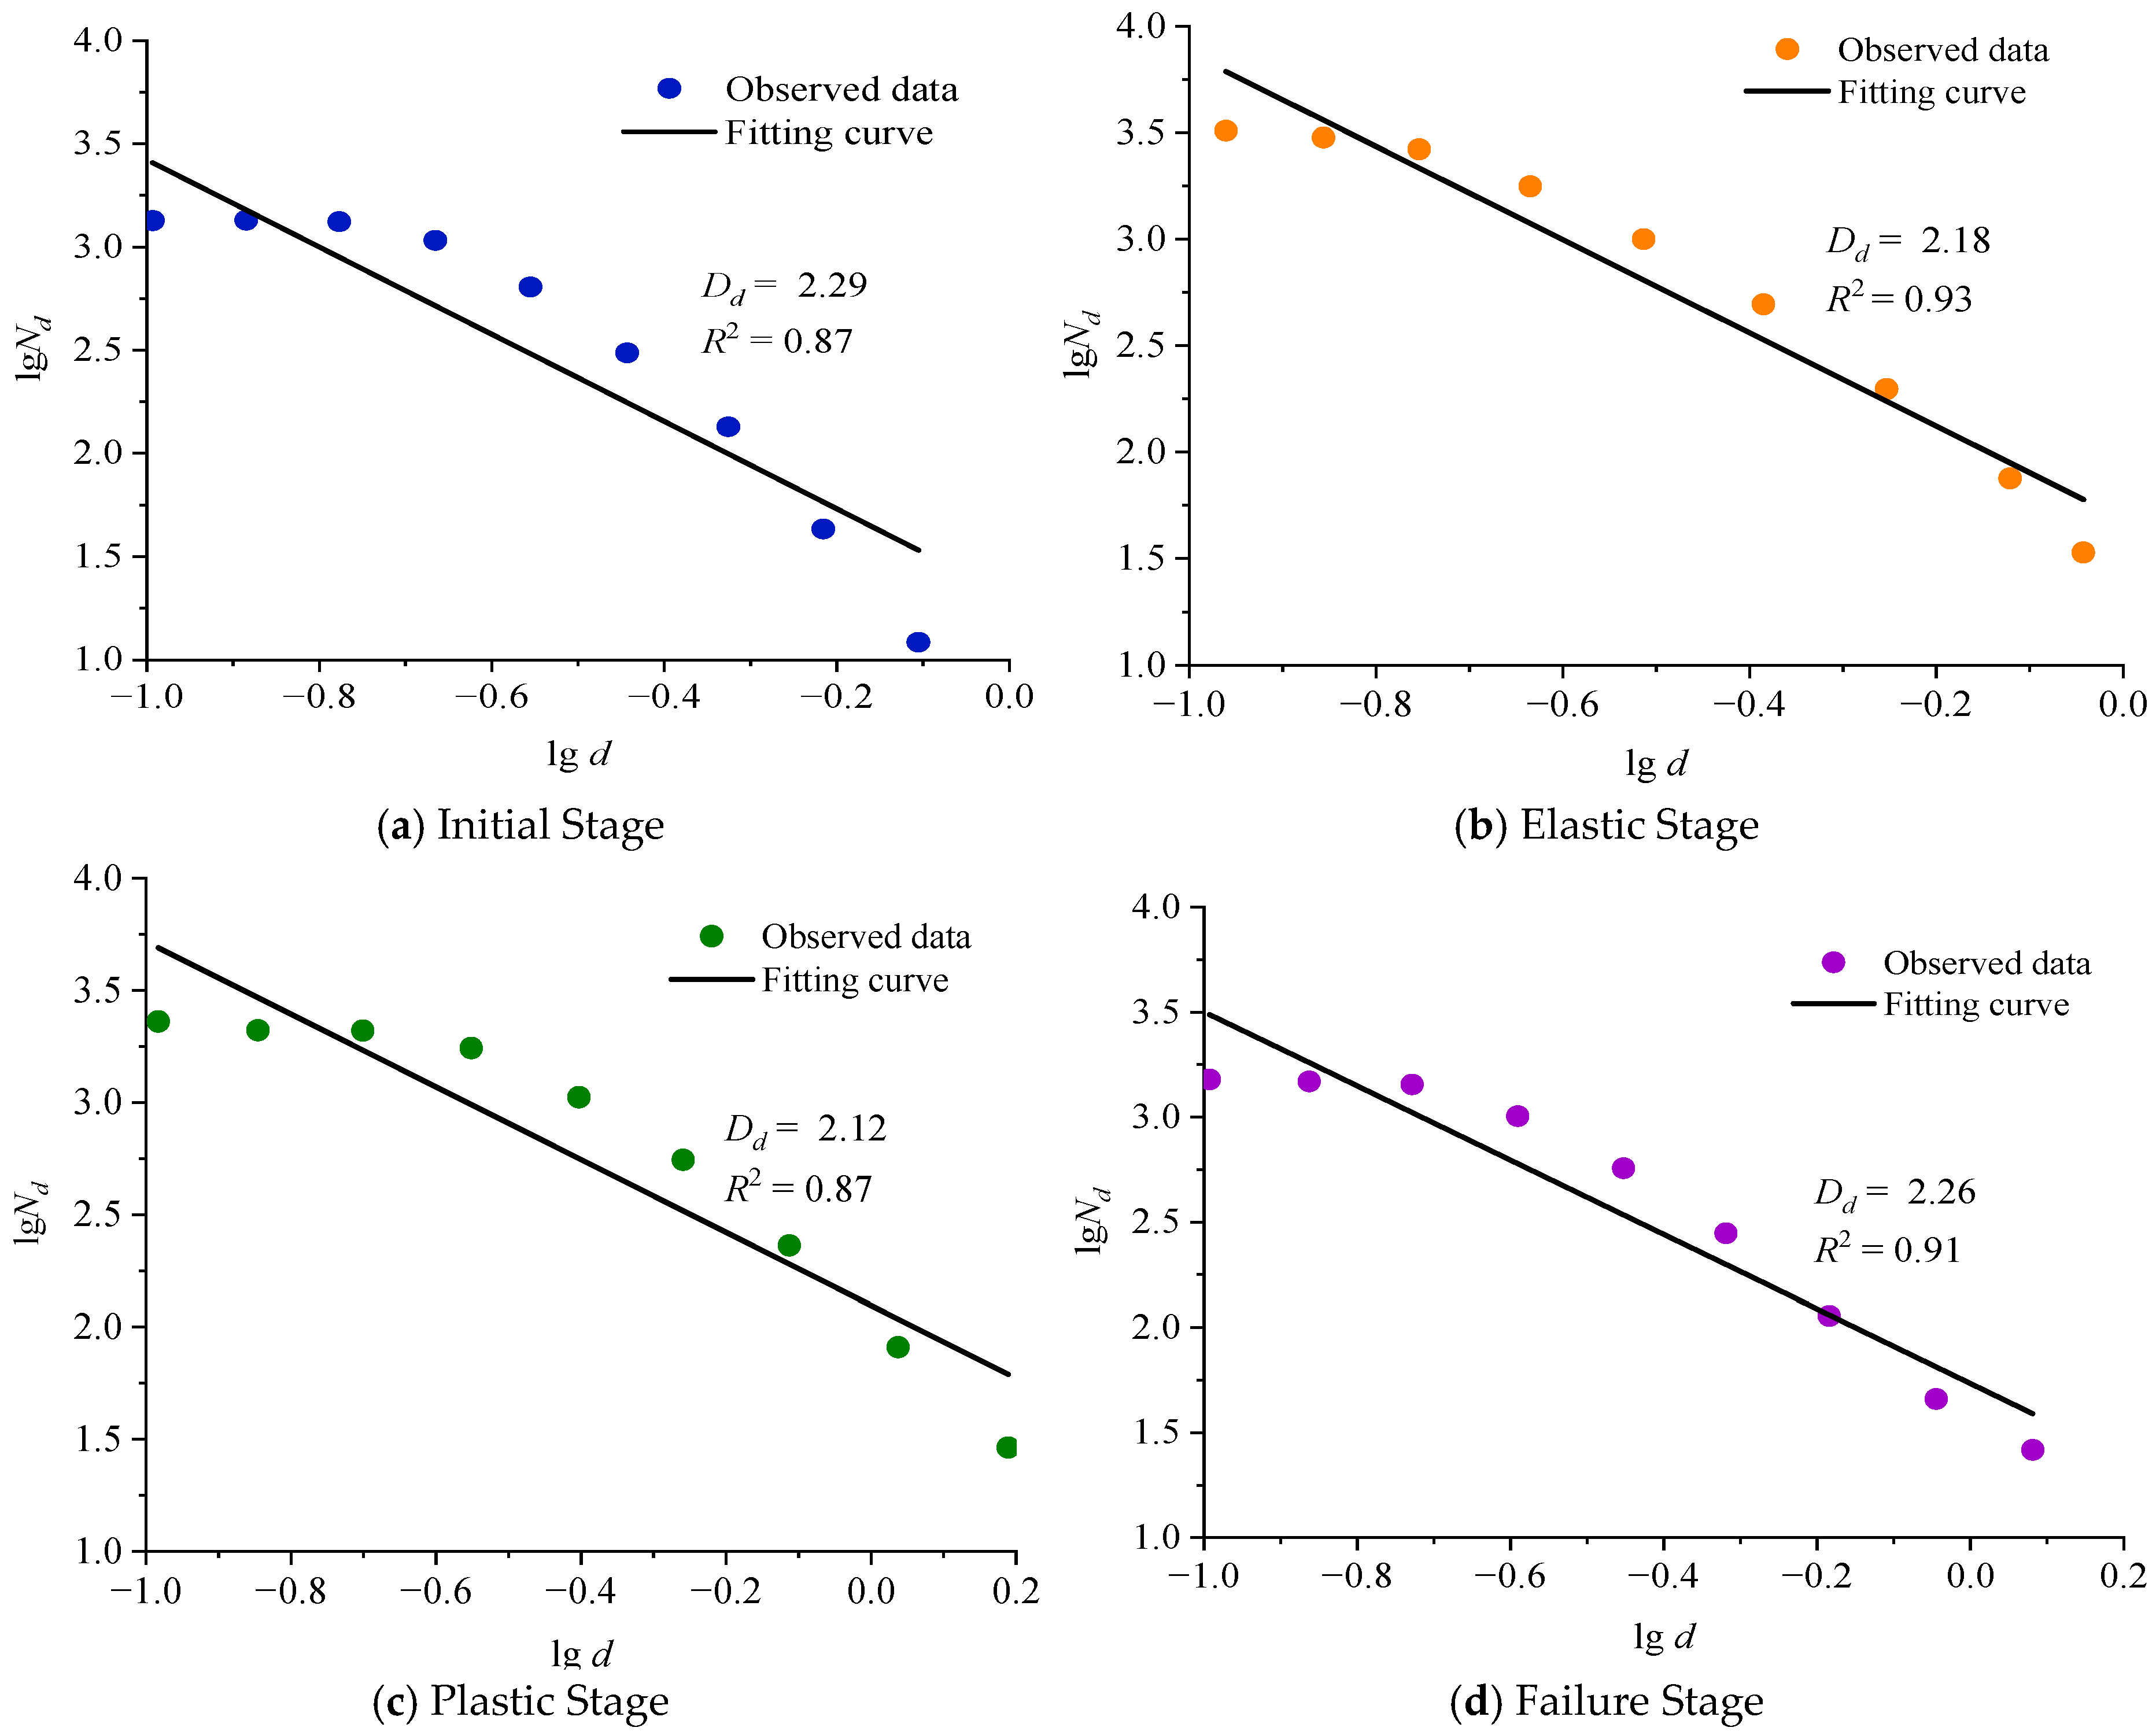
Similarly,
Figure 6 presents the calculation curves of the fractal dimension of fracture aperture. The fractal dimensions of fracture aperture in the initial stage, elastic stage, plastic stage, and failure stage are 2.29, 2.18, 2.12, and 2.26, respectively. In the initial stage, the fractal dimension is the highest because the pre-existing fractures in the coal sample are predominantly of small aperture (<0.25 mm), resulting in a dense aperture gradient and an extremely high proportion of small-aperture fractures, with the network complexity reaching its initial peak. In the elastic stage, the stress exceeds the elastic limit, and elastic compression of the coal matrix causes the closure of some small-aperture fractures. The proportion of small-aperture fractures decreases, the aperture gradient distribution simplifies, and the fractal dimension consequently declines. In the plastic stage, the stress reaches the yield point. Although the total number of fractures increases sharply, the loading preferentially drives the expansion of small-aperture fractures into large-aperture (0.25–0.45 mm) fractures. The proportion of large-aperture fractures increases significantly, while the proportion of small-aperture fractures further decreases, reducing the network complexity to its trough value. In the failure stage, the concentrated release of strain energy induces macroscopic rupture, generating numerous new small-aperture micro-fractures around the main fracture. The proportion of small-aperture fractures rebounds, the aperture gradient distribution becomes dense again, and the fractal dimension bounces back to a peak value.
Due to CT equipment limitations, dynamic permeability could not be measured simultaneously during the uniaxial compression tests; instead, fluid transport properties were evaluated through the derived theoretical model. The primary objective of the experimental phase was to capture the structural evolution of porosity and fractal dimensions under stress to validate the model’s geometric framework. To achieve a more rigorous representation of the fully coupled stress–seepage–failure process, future research will utilize Avizo software to simulate fluid flow and directly compute the dynamic evolution of permeability based on these reconstructed fractured structures.
3. Diffusion in Micropores
The analysis of pore defects in coal reveals the presence of numerous pores or fractures of varying scales within the coal matrix. These heterogeneities generate stress concentrations that facilitate crack initiation under external loading and simultaneously serve as critical pathways for gas migration. In terms of material transport modes, gas migration encompasses both diffusion and seepage processes, each governed by distinct transport laws based on the characteristics of the gas conduits. Importantly, while micro-CT imaging effectively characterizes the macroscopic fracture network at the millimeter scale, its resolution limits preclude the direct observation of sub-micron and nanoscale pores within the coal matrix. Since coal fundamentally behaves as a dual-porosity medium, gas transport inherently couples macro-fracture seepage with micropore diffusion. Therefore, the theoretical analysis of diffusion regimes using the Knudsen number presented in this section is not directly derived from the CT data. Instead, it serves as a micro-scale theoretical complement to describe gas transport within the matrix pores ( nm) that ultimately interconnect with and feed into the macro-fractures observed via CT.
Typically, fluid flow is described using either the continuum or molecular assumption. While the continuum assumption is applicable to many flow conditions, it becomes increasingly inadequate as the system scale decreases. To evaluate the applicability of this assumption, researchers introduced the
(Knudsen number), which serves as a criterion for determining whether continuum-based flow descriptions remain valid.
where
represents the average pore diameter, while
denotes the mean free path of gas molecules, which is the average distance traveled by a molecule between two collisions.
From the definition, we have:
where
represents the average molecular velocity, while
denotes the average collision frequency of the molecules.
Under standard conditions, the average velocity of air molecules is 446 m/s, and the average collision frequency is 6.5 × 10⁹ s−1. Substituting these values into Equation (2), the average mean free path of air molecules under standard conditions is 6.86 × 10⁻⁸ m.
Additionally, when incorporating the ideal gas law and the average effective collision cross-sectional area of gas molecules, Equation (2) can be further expressed in the following form:
where
is the Boltzmann constant,
is the temperature,
is the average effective collision area of gas molecules, and
is the pressure. Equation (3) indicates that, for a given type of gas under constant temperature, the mean free path
is inversely proportional to the gas pressure. When the gas is assumed to be air and the effect of pressure on the average effective collision cross-sectional area of the gas molecules can be neglected, the equation can be expressed as:
By substituting Equation (4) into Equation (1):
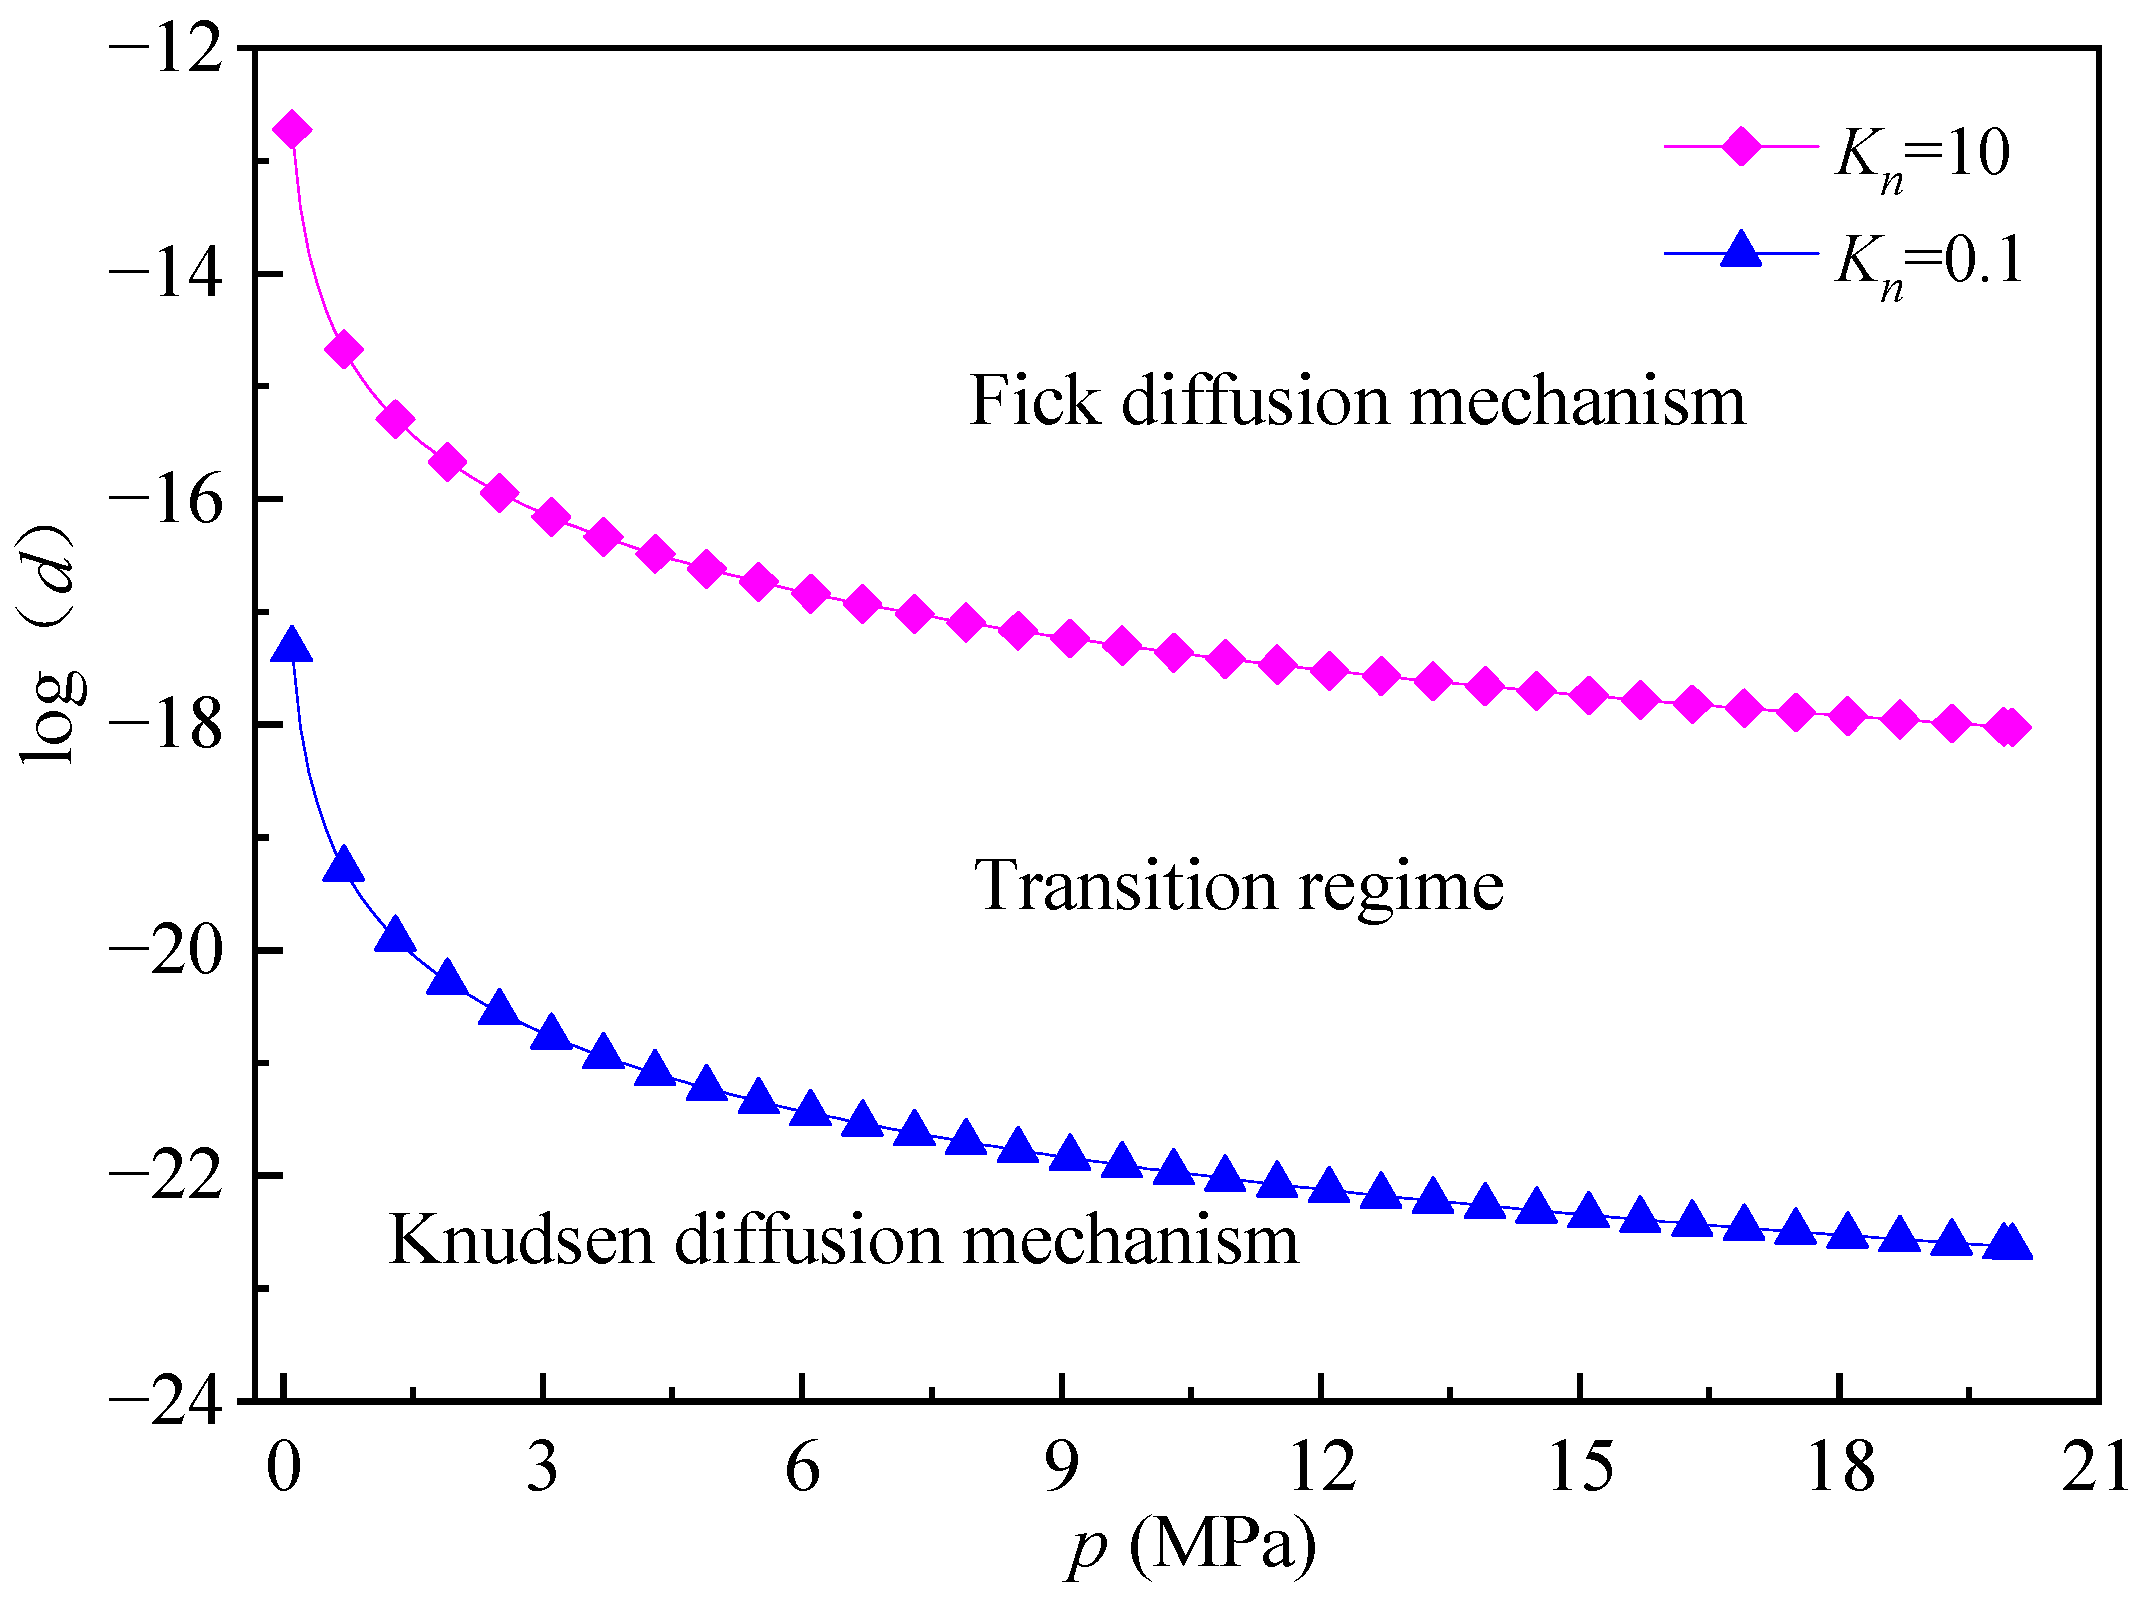
Based on the Knudsen number, different equations are employed to describe fluid flow in various regimes. When →0, the Euler equations are used to describe fluid flow. When ≤ 0.001, the Navier–Stokes equations with a no-slip boundary condition are appropriate. When 0.001 < ≤ 0.1, the Navier–Stokes equations with a slip boundary condition are applied. When 0.1 < ≤ 10, the fluid flow is in the transition regime. When > 10, the molecular assumption becomes necessary, and the Boltzmann equation is used to describe the flow. These regimes can be summarized into three diffusion modes: Fick diffusion ( < 0.01), transition diffusion (0.01 < ≤ 10), and Knudsen diffusion ( > 10).
When the gas pressure and pore size are relatively large, and the mean free path of gas molecules is significantly smaller than the pore size, molecular diffusion is dominated by molecular collisions. In this case, the Fick model is utilized to describe the diffusion process.
where
represents the mass diffusion flux,
is the Fick diffusion coefficient, and
C denotes the gas concentration.
When pore diameter approaches or falls below the molecular mean free path (typically in micropores under reservoir conditions), collisions between gas molecules and pore walls dominate over intermolecular collisions. Under these circumstances, Knudsen diffusion prevails, and the transport process is more accurately described by the Knudsen diffusion mode:
where
represents the Knudsen diffusion coefficient,
is the thermodynamic temperature,
denotes the molar mass of the gas molecules, and
is the average pore radius.
In the transition regime, molecule–molecule and molecule–wall collisions are of comparable significance. Gas transport is therefore best described by a combined model that integrates Fickian and Knudsen mechanisms.
Based on Equation (5), the fracture size requirements corresponding to the three diffusion modes at different gas pressures are shown in
Figure 7.
4. Permeability Characteristics and Modelling
Permeability is a fundamental property of porous media such as coal and rock, and it depends primarily on the distribution and connectivity of internal pores and fractures. For a given fluid, the fracture field and the seepage field in a rock mass maintain a clear correspondence. Owing to the statistical nature of rock damage, the fracture field, damage field, and seepage field are inherently interrelated. The evolution of the internal fracture field drives the development of both the damage and seepage fields, while changes in the seepage field significantly impact the fracture development and damage progression in the rock mass.
Permeability of coal is fundamentally governed by the geometry, connectivity, and scale distribution of its internal pore–fracture network. Extensive experimental evidence obtained from mercury intrusion porosimetry (MIP), low-temperature N2/CO2 adsorption, SEM, and micro-CT imaging has demonstrated that both pore size and spatial arrangement in coal exhibit statistical self-similarity over several orders of magnitude, thereby conforming to fractal scaling laws.
Coal, a complex natural material with seemingly random internal defects, exhibits a similarly unpredictable process of evolution and development. However, extensive research has shown that the scale and spatial distribution of defects in coal exhibit self-similarity, leading to fractal distribution characteristics.
Consider a cylindrical coal sample of cross-sectional area
, length
, subjected to a steady-state pressure difference
applied across its end faces, with fluid flow aligned along the axial direction. The pore space is idealized as a bundle of tortuous capillary tubes of varying diameters. On a cross-section perpendicular to the flow direction (with area significantly larger than individual pore dimensions), the cumulative number of capillaries whose diameter is greater than or equal to λ obeys the power-law scaling relation:
where
represents the characteristic size of the fracture, specifically the diameter of the capillary,
denotes the maximum fracture size, or the largest capillary diameter,
is the fractal coefficient, which responds to the number of fractures of maximum size per unit area,
refers to the total number of pores or capillaries with diameters equal to or greater than
, and
is the fractal dimension of the size distribution of fractures.
By differentiating Equation (9), the number of pores per unit area with sizes distributed between
and
can be obtained as follows:
The volumetric flow rate
of fluid through a capillary tube with diameter
and length
in a porous medium is governed by the Poiseuille equation:
where
is the viscosity coefficient of the fluid and
is the pressure difference between the two ends of the capillary. By integrating over the capillary dimensions, the total flow rate
across the top and bottom cross-sections of the cylindrical coal sample can be obtained as follows:
Considering that the capillary pathways within the coal sample are tortuous and that fluid pressure remains constant across cross-sections parallel to the end faces, there must exist an average capillary length
that ensures equivalent seepage when the capillary diameters and quantities remain constant. Therefore, Equation (12) can be further expressed in the following integral form:
In general, the seepage in coal is laminar and meets the conditions for Darcy’s law. Therefore, by applying Darcy’s formula to the geometric model established above, the effective permeability of the porous medium can be expressed as:
The fracture tortuosity is defined as:
Equation (13) can be rewritten as:
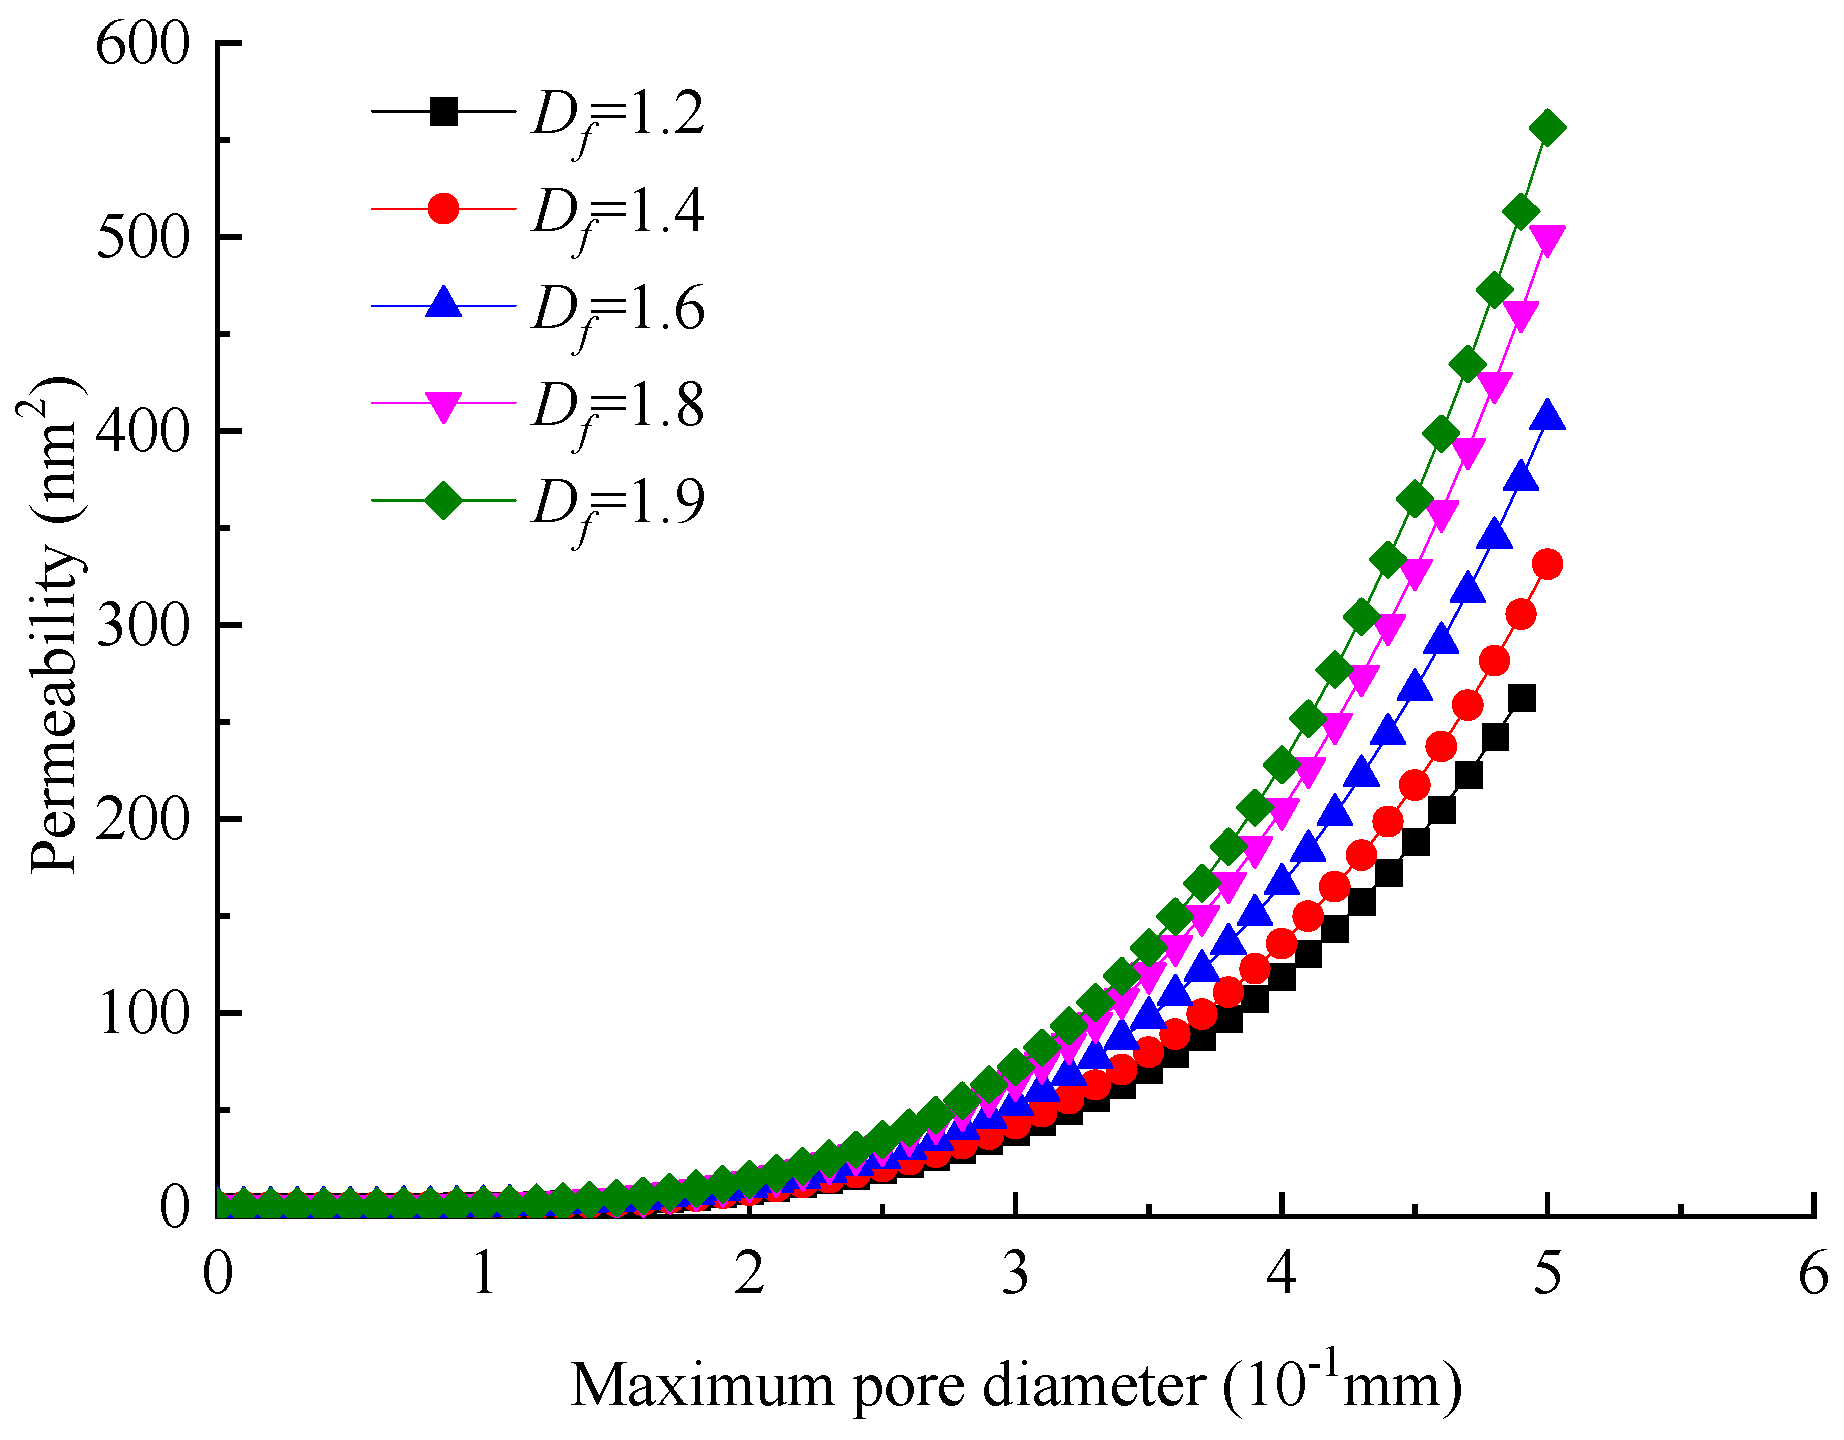
From the above equation, it is evident that the permeability is proportional to the fourth power of the maximum pore diameter, confirming that the largest pores exert a dominant influence on overall permeability. Additionally, the permeability of the rock is influenced by the fractal dimension of the pore structure and the number of pores with maximum size . Higher values of reflect a broader distribution skewed toward larger pores, while larger indicates a greater number of high-conductivity pathways; both factors contribute to enhanced permeability. Conversely, lower or leads to a significant reduction in permeability.
In porous fractal structures such as coal and rock, pore widths are generally within several hundred micrometers. Assuming a maximum pore diameter of 500 µm and only one pore with this maximum diameter (i.e.,
), the fractal dimension is considered within the range of 1.0 to 2.0, with values of 1.2, 1.4, 1.6, 1.8, and 1.9 examined. The tortuosity of coal and rock is generally between 1.5 and 3.5; here, a value of 2.5 is used. Based on Equation (15), the relationship curve between permeability and maximum pore diameter under different fractal dimensions is shown in
Figure 8. The curves clearly demonstrate the strong positive influence of both
and
on permeability.
While the maximum pore diameter () dominates the absolute flow capacity through the main fractures, a simplified analysis focusing solely on maximum aperture is insufficient. The fractal dimension () provides critical complementary information by quantifying the multi-scale geometric complexity of the entire network. Specifically, dictates the peak throughput of the primary conduits, whereas governs the distribution of the surrounding micropores and how efficiently they feed into these main pathways. Therefore, combining both parameters is essential for a comprehensive physical description of fluid transport.
6. Conclusions
This study systematically investigates the microscopic mechanical behavior and seepage properties of porous coal, leading to the following key findings:
(1) Coal porosity increases sequentially from 0.44% to 5.01% under uniaxial compression. The length dimension increases from 2.43 to a peak of 2.56 in the plastic stage and then drops to 2.47 at failure, while the aperture dimension decreases from 2.29 to a trough of 2.12 before rebounding to 2.26.
(2) Under constant pressure conditions, a smaller Knudsen number corresponds to a reduced pore diameter, indicating that pore size is inversely correlated with gas pressure.
(3) By introducing a fractal permeability model that incorporates both fractal dimension and tortuosity, it was revealed that the overall pore size distribution exerts a significant influence on the permeability of coal. Specifically, coal permeability is governed by the fractal dimension of the pore structure and the abundance of the largest pores; a higher fractal dimension combined with a greater number of maximum-sized pores results in enhanced permeability.
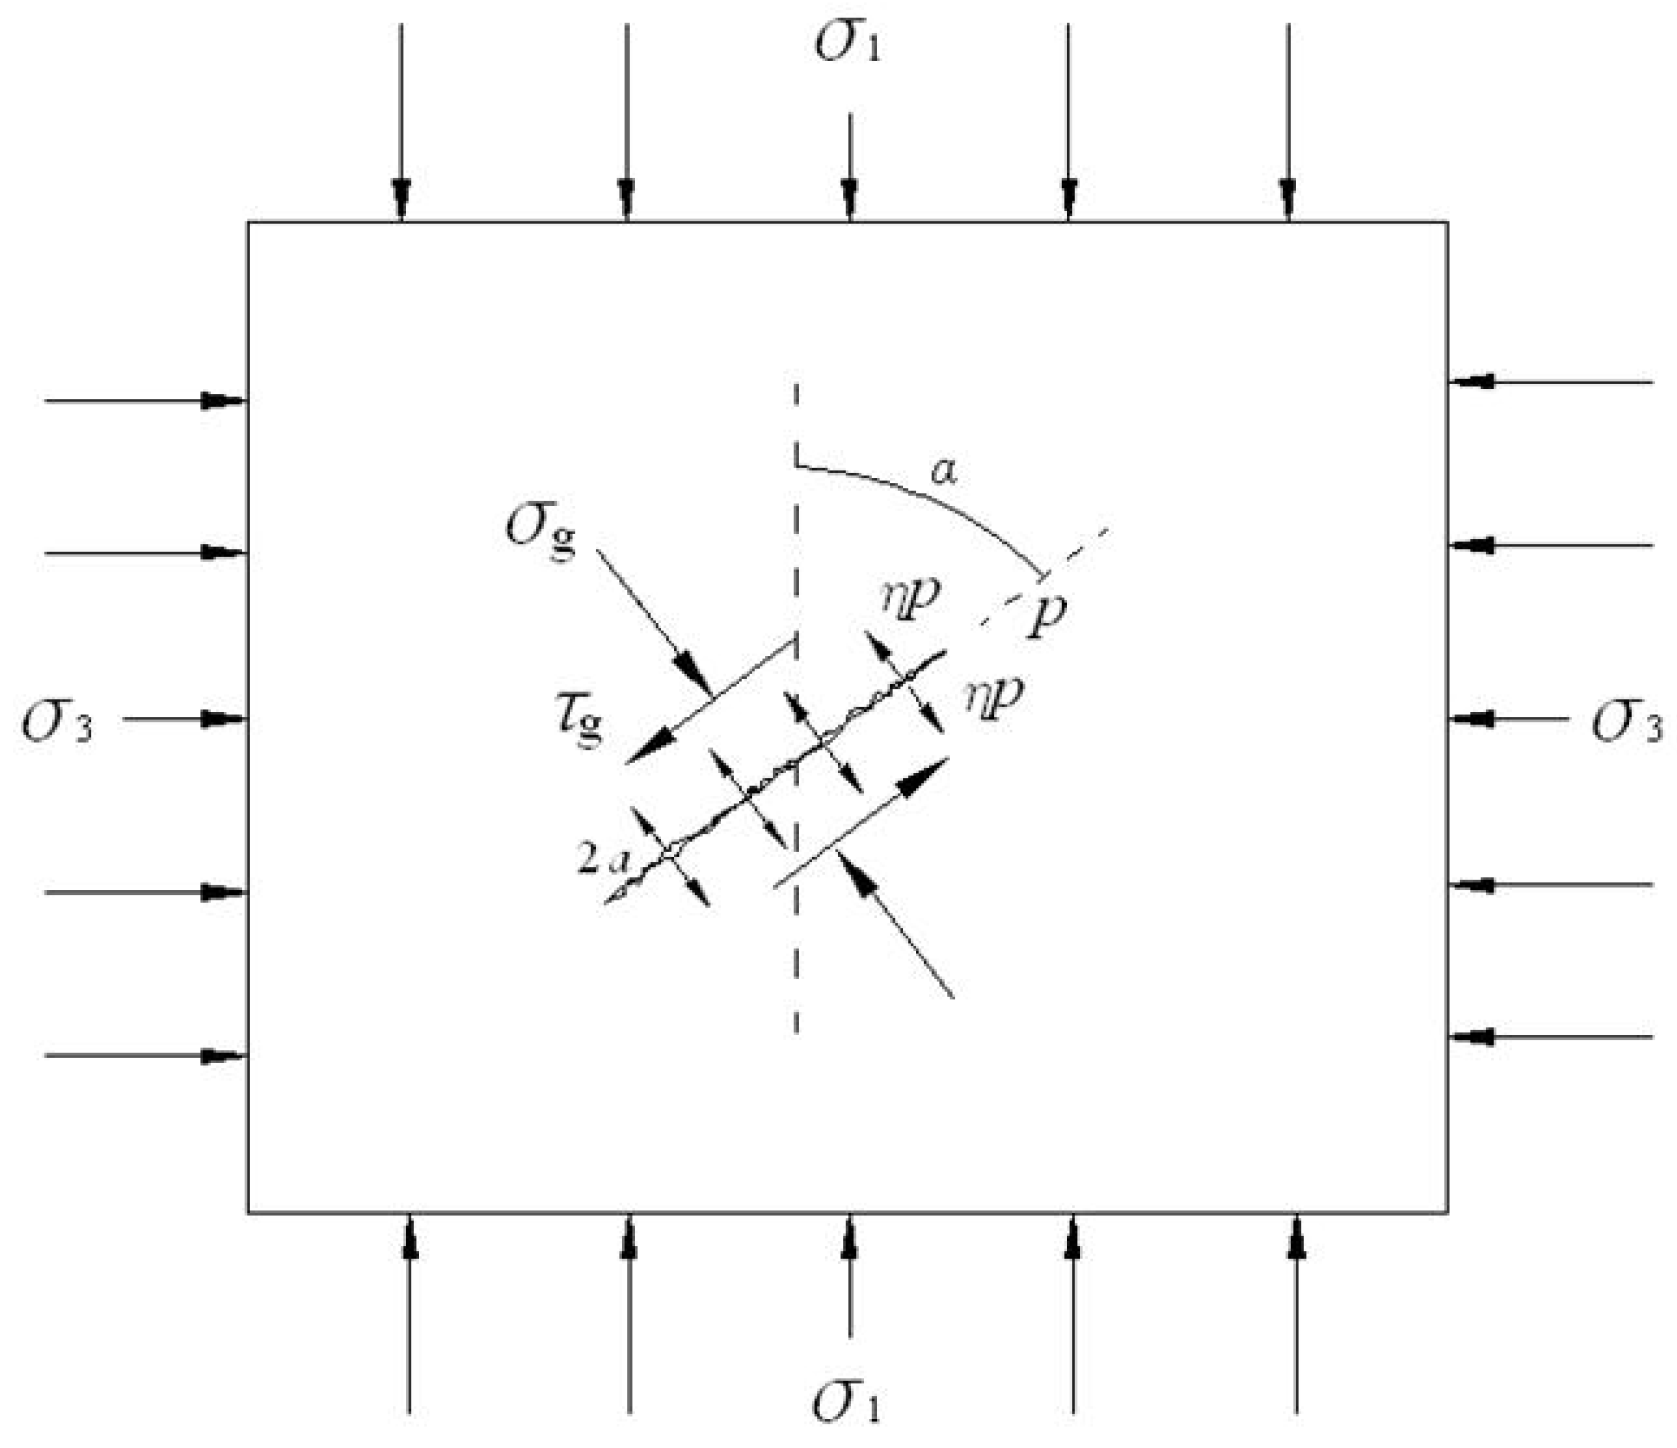
(4) With the incorporation of a fracture strength factor into the seepage–stress coupled model, analysis shows that in Mode I fractures, seepage pressure counteracts a portion of the normal stress, thereby promoting crack propagation via tensile splitting. In contrast, for Mode II fractures, increased pore pressure elevates the fracture strength factor, and seepage pressure further aggravates shear-induced failure.