1. Introduction
The cryptocurrency market, despite its relatively short history, has come to occupy an increasingly important position in the global financial system. With the expansion of the investor base and growth in trading volume, cryptocurrencies have moved beyond mere alternative assets to become an integral component of the financial landscape [
1,
2]. Unlike traditional financial assets, cryptocurrencies are characterized by rapid technological change, unstable participant composition, and significant cross-country regulatory disparities, making them an ideal setting to examine financial efficiency and stability [
3,
4]. In particular, cross-country price discrepancies—most notably the “Kimchi Premium”—demonstrate that capital mobility and efficiency can be constrained by institutional factors [
5,
6], reflecting national market segmentation closely linked to ongoing debates on financial integration.
Prior research suggests that the cryptocurrency market does not consistently exhibit efficiency; rather, efficiency and inefficiency alternate depending on time and circumstances, a phenomenon explicable through dynamic efficiency [
7,
8,
9,
10]. Accordingly, the market cannot be fully captured by static hypotheses such as the Efficient Market Hypothesis (EMH); instead, participant behavior, liquidity, and regulatory environments play decisive roles in shaping price formation over time [
11,
12].
The EMH posits that asset prices fully and immediately reflect all available information, with weak-form efficiency implying that past returns cannot predict future returns. This study examines whether such assumptions, well established for traditional assets like stocks and bonds, can be applied to the highly volatile and rapidly evolving cryptocurrency market—one where technological change is rapid, trading volume and participant composition remain unstable, and regulatory frameworks vary across countries. Under such conditions, it is difficult to argue that market efficiency is consistently maintained.
Accordingly, this study draws on the existing literature to examine cryptocurrency market efficiency through a set of interrelated research questions. The first asks whether cryptocurrencies exhibit persistent weak-form efficiency over the entire sample period, or whether their efficiency patterns fundamentally differ from the relatively stable behavior observed in traditional financial markets. The second examines whether market efficiency is time-varying rather than fixed, and how it responds to regulatory regimes, investor composition, liquidity conditions, and external shocks—a perspective closely aligned with the Adaptive Market Hypothesis (AMH), which allows efficiency to evolve in response to shifting market environments. The third focuses on cross-country differences in efficiency, recognizing that identical cryptocurrencies may exhibit heterogeneous outcomes across jurisdictions due to differences in market structure and regulatory frameworks.
Within this framework, particular attention is devoted to the Kimchi Premium—a persistent price disparity in which cryptocurrencies trade at higher prices on Korean exchanges relative to international markets. This phenomenon serves as a salient empirical illustration of market inefficiency and structural segmentation, arising from regulatory barriers, capital controls, and constraints on cross-border arbitrage. Together, these perspectives provide a multidimensional framework for analyzing cryptocurrency market efficiency, highlighting the extent to which this highly volatile and rapidly evolving market departs from the predictions of traditional efficiency hypotheses.
In this study, we compare the efficiency of the cryptocurrency market from the perspective of different local markets trading the same asset. Specifically, we examine whether the same cryptocurrency exhibits different patterns of market efficiency across multiple local trading markets. In addition, we investigate the time-varying relationship between returns and market efficiency in these local trading markets.
This study examines three major cryptocurrency markets—South Korea, the United States, and Japan, which differ substantially in their institutional settings, market maturity, and efficiency characteristics. The South Korean market is often associated with limited informational efficiency and structural frictions, most notably reflected in the persistent “Kimchi Premium”, which arises from capital controls, exchange-rate dynamics, and investor sentiment, leading to deviations from the law of one price. In contrast, the U.S. cryptocurrency market is relatively more mature and institutionally integrated, where market efficiency appears to be dynamic and asset-specific, shaped by market microstructure, derivatives trading, and high-frequency activity that play a central role in price discovery and volatility adjustment. Japan is considered one of the earliest cases of cryptocurrency institutionalization, supported by a clear regulatory framework under the Payment Services Act and supervision by the Financial Services Agency; however, despite this strong institutional foundation, the Japanese market exhibits distinctive microstructural and behavioral features, such as price clustering and time-varying efficiency. Together, these cross-market heterogeneities highlight the importance of institutional, regulatory, and microstructural factors in understanding cryptocurrency price dynamics and motivate a comparative analysis across markets. These characteristics of the three markets are discussed in greater detail in the following section.
First, we analyze market efficiency in each local cryptocurrency market using multifractal detrended fluctuation analysis (MF-DFA). Long-range autocorrelation properties in financial series are often considered indicators of market inefficiency, and MF-DFA allows us to investigate these properties and describe fractal characteristics to assess the degree of inefficiency. This approach has been widely applied to examine the EMH and multifractality across stock, foreign exchange, commodity, and cryptocurrency markets [
4,
13,
14,
15,
16].
Second, we analyze the dynamic relationship between domestic and global cryptocurrency markets using the Dynamic Conditional Correlation–GARCH (DCC-GARCH) framework [
17]. While MF-DFA identifies long-range dependence within each market, DCC-GARCH captures time-varying correlations and volatility transmission across exchanges—an approach widely applied to study financial spillovers between assets and sectors [
18,
19,
20,
21]. We employ this model to measure evolving correlations between Korean and global cryptocurrency markets, providing insight into how volatility and information flows shape the Kimchi Premium.
This study contributes to the literature on cryptocurrency market efficiency through three key contributions, examining how identical digital assets exhibit different efficiency patterns across institutionally distinct markets and how such efficiency evolves and co-moves over time.
First, we compare the market efficiency of identical cryptocurrencies across three institutionally distinct markets, South Korea, the United States, and Japan. By focusing on the same assets traded in different regulatory and market environments, we provide evidence on cross-market heterogeneity and institutional segmentation in cryptocurrency markets.
Second, rather than treating market efficiency as a static property, we conceptualize it as a time-varying process and measure its evolution using rolling-window MF-DFA. This dynamic perspective is more consistent with the adaptive market view and allows us to capture temporal changes in informational efficiency.
Third, we go beyond conventional return-based correlation analysis by additionally examining efficiency connectedness across markets through DCC–GARCH based on rolling . This contribution is novel in three respects. First, we compare the same cryptocurrency across three institutionally distinct local markets, which allows us to examine how market-specific regulatory and structural conditions are reflected in efficiency dynamics. Second, we explicitly distinguish efficiency-based connectedness from return-based connectedness, thereby introducing a market-quality dimension that has rarely been addressed in previous DCC–GARCH studies of cryptocurrency markets. Third, we reinterpret the Kimchi Premium not merely as a price-gap phenomenon, but as a manifestation of structural heterogeneity in informational efficiency that may remain invisible in return-based analyses alone.
The remainder of the paper is organized as follows.
Section 2 briefly reviews prior studies on cryptocurrency market efficiency.
Section 3 describes the cryptocurrency market data and outlines the MF-DFA and DCC-GARCH methodologies.
Section 4 reports the empirical findings from both approaches.
Section 5 discusses these results and provides further interpretation. Finally,
Section 6 concludes.
2. Literature Review
This section reviews the existing literature on cryptocurrency markets across three thematic groups. The first examines overall market efficiency, primarily testing weak-form efficiency and long-range dependence using return-based methods. The second emphasizes the time-varying nature of efficiency, highlighting how it evolves across market regimes, liquidity conditions, and stress periods. The third focuses on cross-country segmentation and institutional frictions, with particular attention to the Kimchi Premium as a representative case of persistent price deviations driven by regulatory constraints. This subsection also incorporates a comparative examination of market characteristics in South Korea, the United States, and Japan, providing the institutional foundation for interpreting cross-country price deviations.
2.1. Theoretical Framework: EMH and AMH
The Efficient Market Hypothesis (EMH), formalized by Fama [
22], posits that asset prices fully reflect all available historical information, implying that return series follow a random walk. In the MF-DFA framework, a generalized Hurst exponent of
is consistent with weak-form efficiency, whereas
and a wider multifractal spectrum width
both indicate departures from efficiency [
23,
24,
25].
The EMH, however, treats efficiency as time-invariant, an assumption repeatedly challenged in cryptocurrency markets [
3,
8]. The Adaptive Market Hypothesis (AMH) [
26] offers a more flexible framework, arguing that efficiency evolves as market participants adapt to changing regulatory environments, liquidity conditions, and external shocks. This study adopts the AMH as its primary theoretical lens, as it better accommodates the dynamic and heterogeneous efficiency patterns observed across different jurisdictions and time periods.
2.2. Evaluating the Efficiency of Cryptocurrency Markets
Whether Bitcoin returns followed a random walk over August 2010 to July 2016 was examined in [
3], finding that the market was not weak-form efficient over the full sample. However, the second subsample showed signs of randomness, suggesting the market may have been evolving toward greater efficiency despite remaining substantially inefficient overall.
A MF-DFA of daily returns on Bitcoin, gold, equities, and EUR/USD over 2011–2017 was conducted in [
4], revealing that Bitcoin had the highest Hurst exponent among asset classes and the widest multifractal spectrum, indicating strong long-range dependence and statistically significant predictability across time scales—challenging the weak-form EMH assumption.
The relationship between liquidity and efficiency was investigated in [
7] using high-frequency data for 456 cryptocurrencies. More actively traded cryptocurrencies exhibited lower volatility and higher efficiency, whereas low-liquidity assets displayed stronger mean-reverting patterns, suggesting that established cryptocurrencies were gradually becoming more efficient while liquidity-constrained altcoins were not.
The view that cryptocurrency markets experience efficiency fluctuations depending on market conditions was further emphasized in [
8], contrasting with the EMH’s assumption of time-invariant efficiency. This pattern is instead consistent with the Adaptive Market Hypothesis (AMH), under which efficiency evolves dynamically in response to investor behavior, liquidity conditions, and external shocks.
In line with this perspective, the present study adopts the AMH as its primary theoretical lens, motivated by prior findings [
3,
7,
8] consistently showing that cryptocurrency efficiency varied across time and conditions. Taken together, the literature suggests that while efficiency gradually improved as markets matured, structural factors including long-range dependence, liquidity constraints, and regulatory disparities sustained a degree of predictability. Accordingly, this study argues that cryptocurrency markets align more closely with the dynamic efficiency concept of the AMH than with the static assumptions of the EMH.
2.3. Temporal and Conditional Variations in Efficiency
The efficiency of cryptocurrency markets is not a fixed state. While sharing features of traditional finance such as liquidity, volatility, and information asymmetry, their unique microstructure produces alternating patterns of randomness and predictability.
Weak-form efficiency in major cryptocurrencies—Bitcoin, Ethereum, Litecoin, Bitcoin Cash, and Ripple—was examined across different time scales in [
9] using a Fourier Flexible Form (FFF) unit root test. For daily returns, the random walk hypothesis could not be rejected for most assets, suggesting weak-form efficiency; however, weekly returns exhibited consistent predictability across all five assets. These findings indicate that cryptocurrency market efficiency is sensitive to sampling frequency and structural shifts, supporting the view that efficiency varies across time scales and market conditions.
Direct evidence for this argument was provided in [
10], where the Variance Ratio test produced inconsistent conclusions and its Gaussian white noise assumption was violated in Bitcoin data. Employing a Quantum Harmonic Oscillator (QHO) model instead, the study found that efficiency varies with price regimes and liquidity conditions: in high-price and high-liquidity states, information was absorbed more rapidly and predictability diminished, while the opposite pattern emerged under low-price and fragile-liquidity conditions.
The role of institutional arrangements in shaping information incorporation was examined in [
11] using over 68,000 trading days. Assets listed under formal legal frameworks exhibited faster and less distorted price discovery, whereas unregulated and illiquid tokens showed delayed information incorporation that worsened during stress periods. Voluntary compliance mechanisms such as FinCEN MSB registration functioned as “soft regulation,” improving efficiency similarly to reputation mechanisms in traditional markets.
A related perspective in [
12], analyzing 541 cryptocurrencies, showed that high-liquidity and low-volatility assets maintained relatively stable efficiency even during the COVID-19 crisis, while low-liquidity and highly volatile assets experienced substantial increases in price delay post-pandemic.
Together, these studies reinforce the view that market efficiency is adaptive, shifting with time, conditions, and structural contexts, with declines most acute among illiquid and volatile assets during periods of heightened uncertainty.
2.4. Market Characteristics of Cryptocurrency Markets
The South Korean cryptocurrency market is widely regarded as relatively less efficient and institutionally less mature. An analysis of 893 cryptocurrencies in [
27] showed that only a small fraction satisfied weak-form or semi-strong EMH conditions, with exchanges established before the late-2017 boom and those with larger market shares exhibiting comparatively higher efficiency.
A distinctive feature of the Korean market is the Kimchi Premium—persistent price discrepancies between domestic and international markets. A strong association between the premium and cross-border remittances was documented in [
28], suggesting arbitrage activity under capital flow restrictions. Nonlinear dynamics and mean-reverting behavior beyond certain thresholds were reported in [
29], while ref. [
6] showed that exchange rate movements and domestic stock market conditions significantly influence the premium’s magnitude and volatility. Together, these findings indicate that regulatory frictions and capital mobility constraints play a central role in shaping price deviations in the Korean market.
The U.S. cryptocurrency market is generally characterized by greater institutional maturity and deeper global integration, though evidence on efficiency remains mixed. Near-efficient behavior in Bitcoin was documented in [
10], whereas time-varying and asset-specific efficiency patterns were reported in [
30,
31], and ref. [
32] showed that derivatives trading and high-frequency activity contribute importantly to price discovery.
Japan is considered one of the earliest adopters of a comprehensive regulatory framework for cryptocurrencies. The 2017 amendment of the Payment Services Act granted cryptocurrencies legal property status and placed exchanges under Financial Services Agency (FSA) supervision, enhancing regulatory clarity and institutional credibility.
Taken together, South Korea, the United States, and Japan illustrate how differences in regulatory maturity, market infrastructure, and capital mobility shape efficiency in distinct ways, with cross-country institutional differences most visibly reflected in persistent price deviations such as the Kimchi Premium.
2.5. Critical Synthesis and Research Gaps
The three strands of literature reviewed above converge on a shared conclusion: cryptocurrency market efficiency is neither static nor uniform. Early studies establish that inefficiency is pronounced in initial market stages [
3,
4]. Subsequent work shows that efficiency evolves dynamically with market conditions, consistent with the AMH [
8,
10,
11]. The third strand demonstrates that institutional heterogeneity generates persistent cross-market price deviations, of which the Kimchi Premium is the most salient case [
5,
6].
Despite this progress, a critical gap remains. Prior studies have examined either efficiency within individual markets or return-based integration across markets, but no study has directly investigated whether market efficiency itself is integrated across local markets trading the same asset. Even when prices move together globally, the structural quality of information processing may diverge due to differences in regulatory maturity, liquidity, and investor composition—a divergence that return-based DCC analyses cannot detect. This study fills that gap by applying DCC-GARCH to rolling rather than returns.
2.6. Research Hypotheses
Hypothesis 1 (Persistent Inefficiency). Cryptocurrency markets do not satisfy weak-form efficiency over the full sample period, as evidenced by multifractal scaling behavior and .
Hypothesis 2 (Time-varying Efficiency)
. Market efficiency is time-varying rather than fixed, consistent with the AMH [26].
Hypothesis 3 (Efficiency Decoupling). Efficiency-based correlations across local cryptocurrency markets are significantly more heterogeneous than return-based correlations, indicating that market quality integration does not follow from price integration.
2.7. The ‘Kimchi Premium’ Phenomenon
Cryptocurrencies appear to trade as identical assets worldwide, yet their prices differ across countries depending on national regulatory frameworks and market infrastructure. Institutional features such as currency exchange channels, banking access, and foreign exchange regulations determine the cost and difficulty of arbitrage, creating persistent price gaps across markets. This study examines how such institutional barriers create and maintain the so-called “Kimchi Premium” in the Korean won market.
The Korean won market represents the most prominent case of cross-country market segmentation. Evidence in [
5] showed that, during the 2017–2018 boom, the won-denominated Bitcoin price exceeded U.S. or European prices by as much as 40%, occasionally approaching 50%. Cross-country price differences were found to be larger and more persistent than differences between exchanges within the same country, indicating segmentation along national rather than exchange boundaries.
These price differences are primarily driven by capital controls, transfer restrictions, and regulatory constraints that limit arbitrage capital. When cross-border money transfers are costly or delayed, price convergence is impeded, allowing the same asset to trade at persistent price differentials. The Kimchi Premium can therefore be interpreted as a structural outcome of institutional and infrastructural barriers rather than as a purely behavioral anomaly.
In ref. [
6], the Kimchi Premium was defined as the percentage deviation of the exchange-rate-adjusted KRW-denominated Bitcoin price from the international dollar price. Using a bivariate GARCH framework applied to Bitcoin returns from KorBit (Korea) and IntBit (international), the study showed that volatility generally co-moves across markets, while conditional correlations vary across market conditions. During periods of high volatility and large premiums, correlations changed more noticeably, suggesting that cross-market alignment becomes less stable under stress.
Taken together, the evidence indicates that the Kimchi Premium is not a constant mispricing but a situation-dependent outcome shaped by regulatory constraints, exchange-rate movements, and domestic market conditions [
5,
6]. Persistent price differences can exist alongside substantial cross-market co-movement, reflecting institutional segmentation rather than complete market fragmentation.
3. Data Description and Methods
3.1. Cryptocurrency Market
This study collected daily closing prices and returns of major cryptocurrencies from 1 January 2018, to 30 September 2025. The closing price on 31 December 2017, was included as the baseline for return calculations. The sample assets were selected based on market capitalization, trading volume, and market representativeness. The sample consisted of Bitcoin (BTC), Ethereum (ETH), Ripple (XRP), and Bitcoin Cash (BCH). The selected trading pairs were BTC/JPY, XRP/JPY, BCH/JPY (Bitbank), BTC/USD, ETH/USD, XRP/USD (Bitfinex), BCH/USD (Coinbase), and BTC/KRW, ETH/KRW, XRP/KRW, BCH/KRW (Upbit).
The sample period from 1 January 2018 to 30 September 2025 was selected for two main reasons. First, 1 January 2018 is the earliest date from which daily closing prices for the selected cryptocurrency–fiat pairs are consistently available across the three markets considered in this study: Korea (Upbit), the United States (Bitfinex and Coinbase), and Japan (Bitbank). This starting point allows us to construct a balanced and comparable dataset across KRW-, USD-, and JPY-denominated markets.
Second, the sample period covers several economically important cryptocurrency market episodes. These include the post-bubble correction in early 2018, the COVID-19 market shock in March 2020, the 2021 cryptocurrency bull market, the prolonged downturn in 2022 commonly referred to as the “crypto winter”, and the subsequent recovery and increasing institutionalization of cryptocurrency markets during 2024–2025. Covering these distinct market phases enables a more comprehensive assessment of time-varying market efficiency and cross-market correlations under different market conditions.
Beyond the three markets discussed above, cryptocurrency markets also exist in other regions, most notably China. However, this case is deliberately excluded from the present study, as the government’s comprehensive ban on cryptocurrency trading in 2017 effectively terminated legitimate and publicly observable market activity. Consequently, available data are largely derived from unofficial channels or overseas transactions, rendering the Chinese market an unsuitable empirical setting for examining market efficiency.
Regarding Europe, recent academic research has predominantly focused on the Markets in Crypto-Assets Regulation (MiCA) and its policy implications, rather than the empirical characteristics of cryptocurrency market efficiency. Given this divergence in research focus, European cases are likewise excluded from the present study.
Data were obtained through the Bitbank REST API and the CCXT Python 3.13.5 library for other exchanges, with only the closing price (
close) extracted at a daily frequency. All timestamps were standardized to UTC and then converted to each exchange’s local standard time (KST, JST, etc.) for analytical consistency. Simple returns were calculated as follows:
The presence of missing observations varied by exchange. For non-U.S. exchanges such as Upbit (Korea) and Bitbank (Japan), continuous daily closing prices were generally available for the selected pairs included in the final sample. For the U.S. exchange Coinbase, a short four-day gap was identified for the BCH/USD pair from 15 November to 18 November 2018. Since no valid closing prices were available from the data source during this interval, we applied forward-fill interpolation to preserve the daily continuity of the series. This treatment assumes no observable price change during the missing interval and is therefore a conservative adjustment. Given that the gap is limited to four consecutive days, its effect on the MF-DFA estimation is expected to be limited. The number, timing, and proportion of missing observations are reported for transparency.
Descriptive statistics in
Table 1 are computed from daily simple return series excluding exchange rate adjustments. Mean returns are positive but economically small across all assets (0.0008–0.0017), consistent with typical daily financial returns. Standard deviations indicate substantial cross-asset variation in volatility, with BTC exhibiting relatively lower volatility than XRP and BCH, which show the largest standard deviations across markets.
Higher-order moments reveal strong departures from normality. BTC and ETH returns are negatively skewed across the KRW, USD, and JPY markets, whereas XRP and BCH returns are positively skewed—XRP displaying especially strong right-skewness. All return series exhibit large positive excess kurtosis, indicating pronounced leptokurtosis and heavy tails, particularly for XRP and BCH. Jarque–Bera statistics are highly significant at the 1% level for all assets, decisively rejecting normality.
Regarding stationarity, ADF test results show that all return series reject the unit root null hypothesis at the 1% significance level, providing strong evidence of stationarity. This is consistent with a standard stylized fact in financial time series: while price levels may be non-stationary, return series are typically stationary after differencing.
Overall, cryptocurrency markets are characterized by small average daily returns, substantial volatility, asymmetric distributions, and heavy-tailed behavior. Differences across the KRW, USD, and JPY markets suggest that local market conditions, investor composition, and liquidity environments affect the distributional characteristics of returns, providing a useful foundation for the subsequent analysis of volatility spillovers and inter-market linkages.
ETH-JPY was excluded from the final sample because it did not provide sufficient overlap with the common sample period used in this study. In the Bitbank data, valid ETH-JPY observations are available only from 18 May 2020, whereas the common sample period begins on 1 January 2018. This limitation is particularly important because the empirical analysis aims to compare market dynamics across pre-COVID-19, during-COVID-19, and post-COVID-19 periods. Since ETH-JPY observations begin after the onset of the COVID-19 shock, the series does not allow for a comparable pre-COVID-19 analysis. As a result, including ETH-JPY would produce an unbalanced sample and weaken the consistency of the rolling-window MF-DFA and DCC-GARCH analyses across cryptocurrency–fiat pairs. Using a larger rolling window would not resolve this limitation because it would require an even longer continuous series and would further reduce the number of available rolling estimates. Therefore, ETH-JPY was excluded to maintain comparability across markets, assets, and subsample periods.
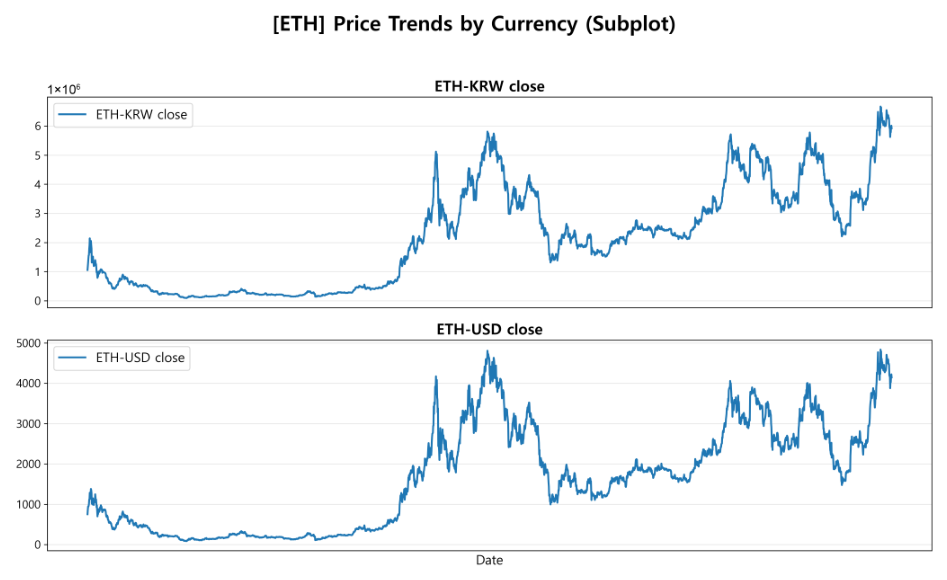
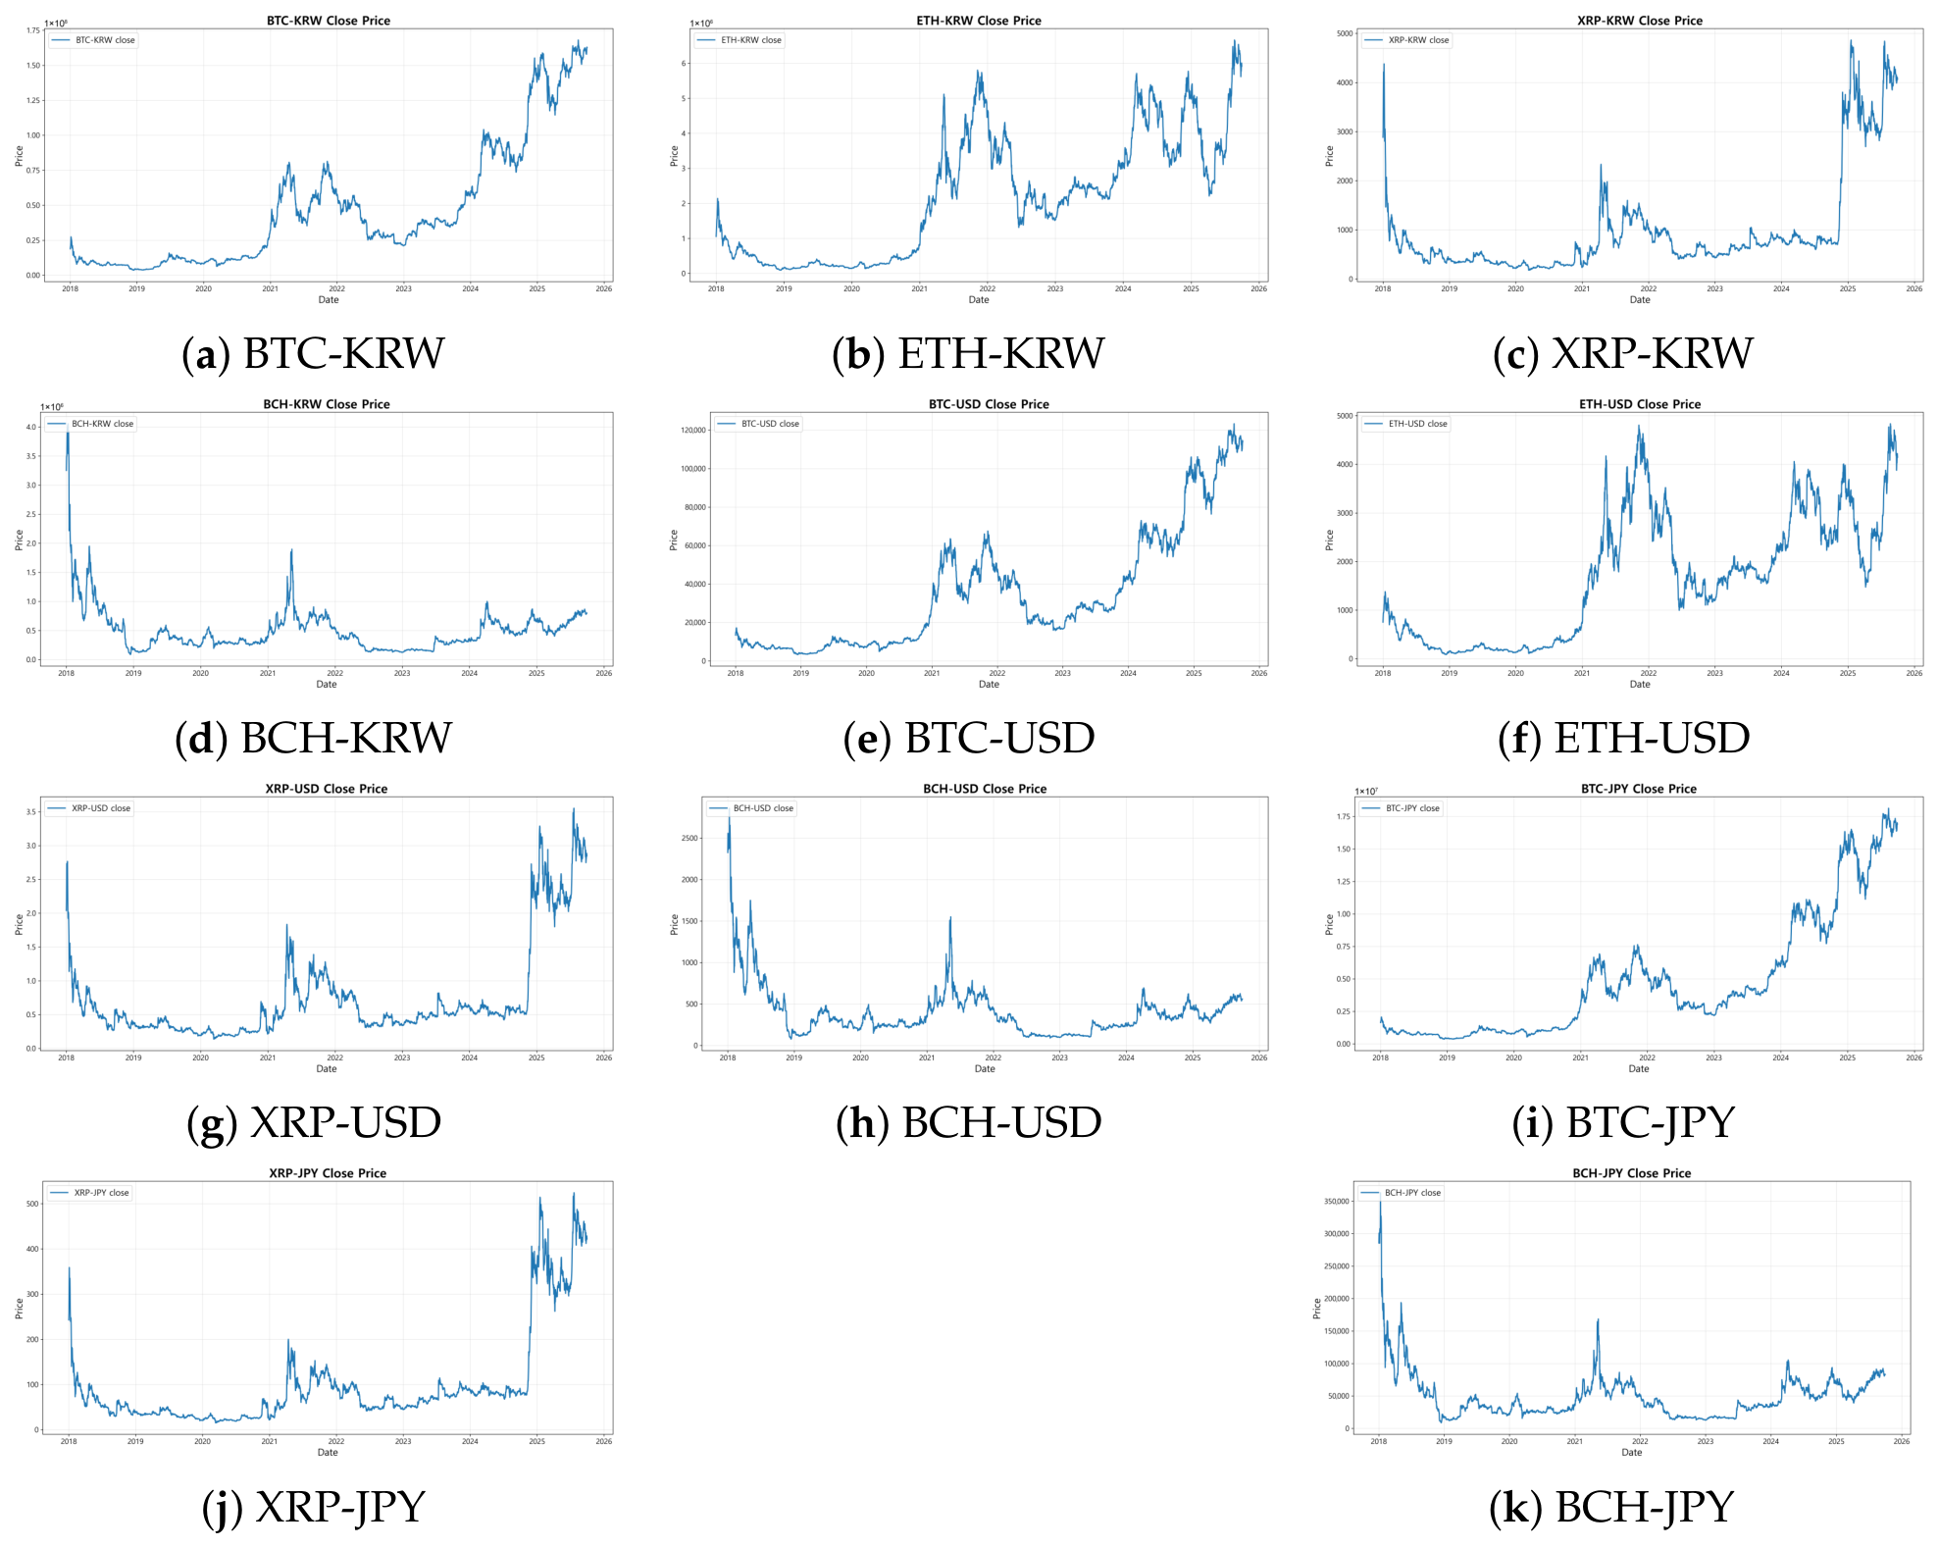
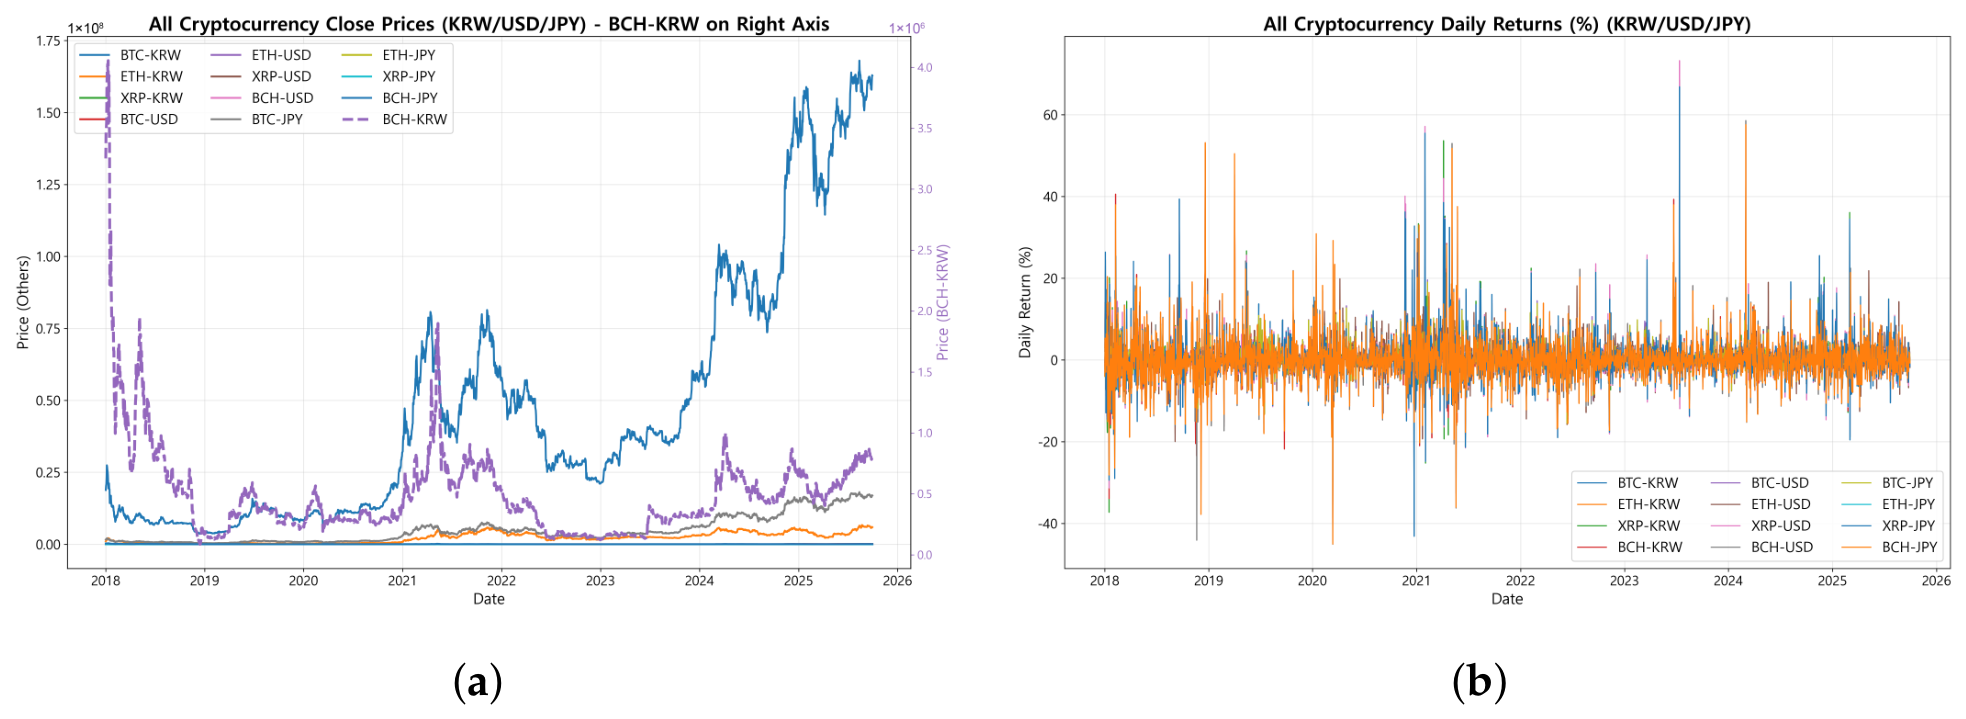
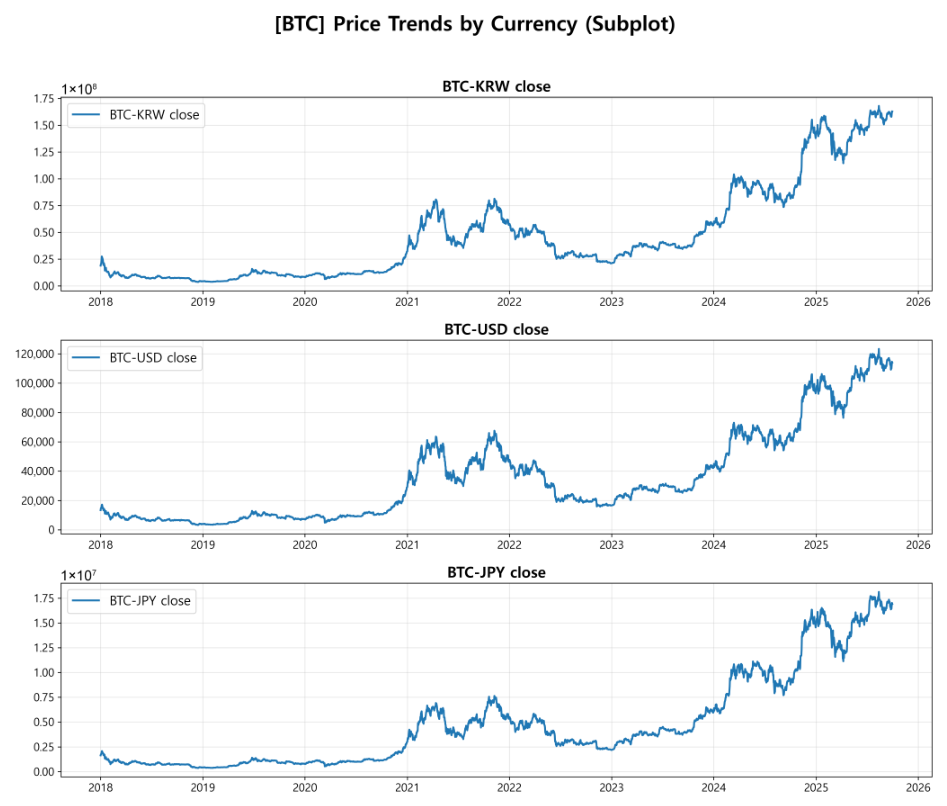
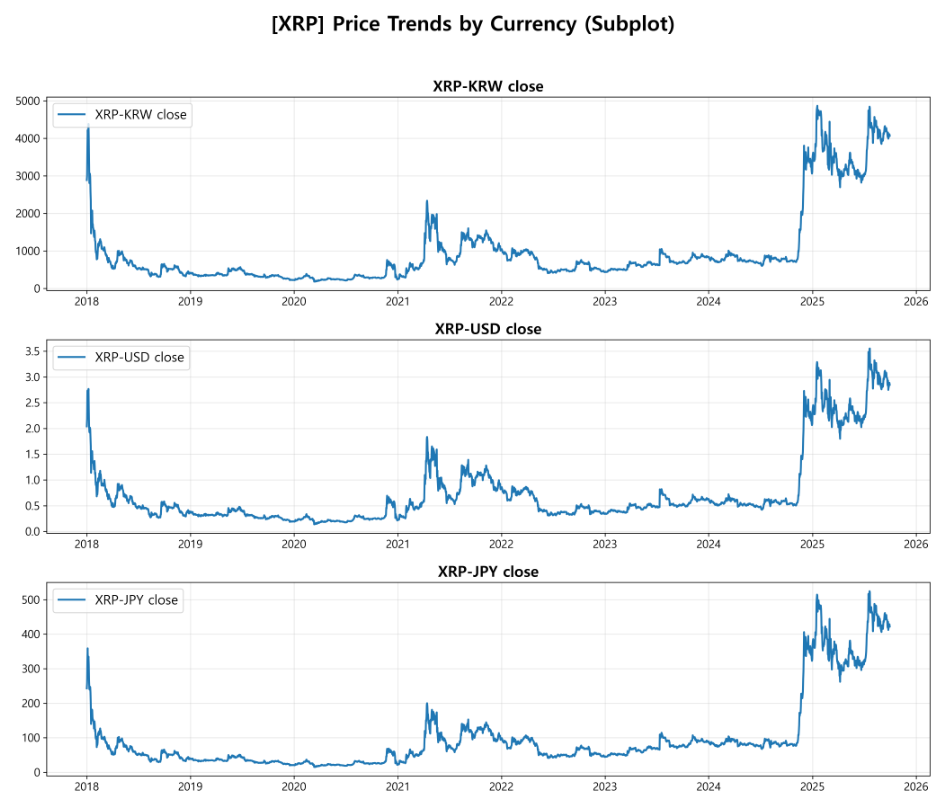
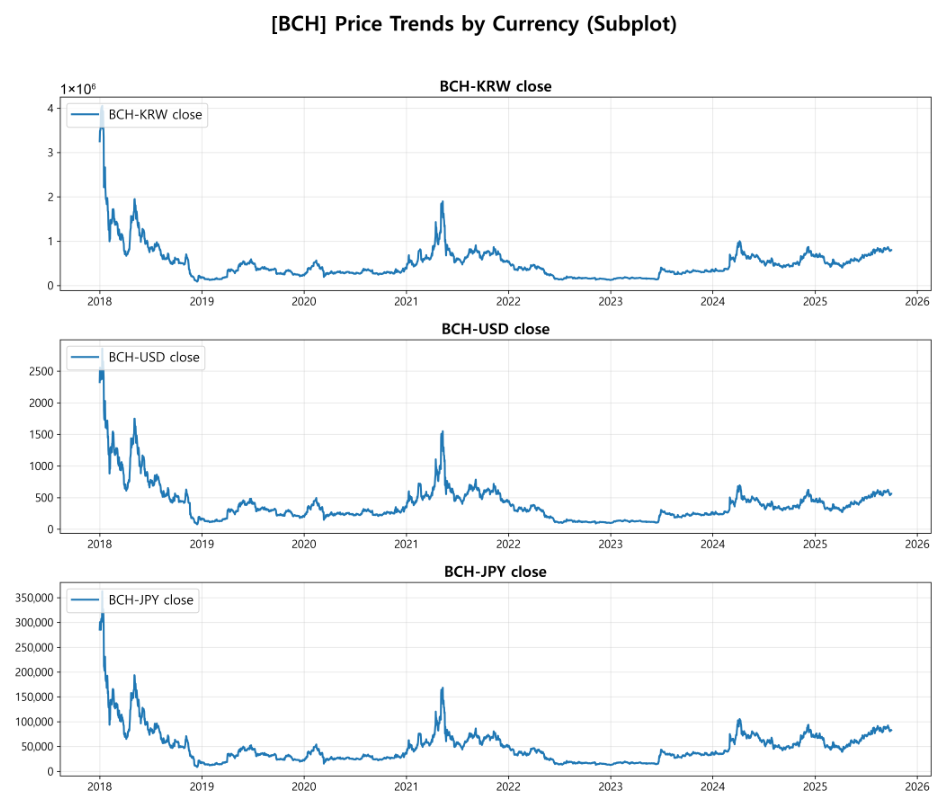
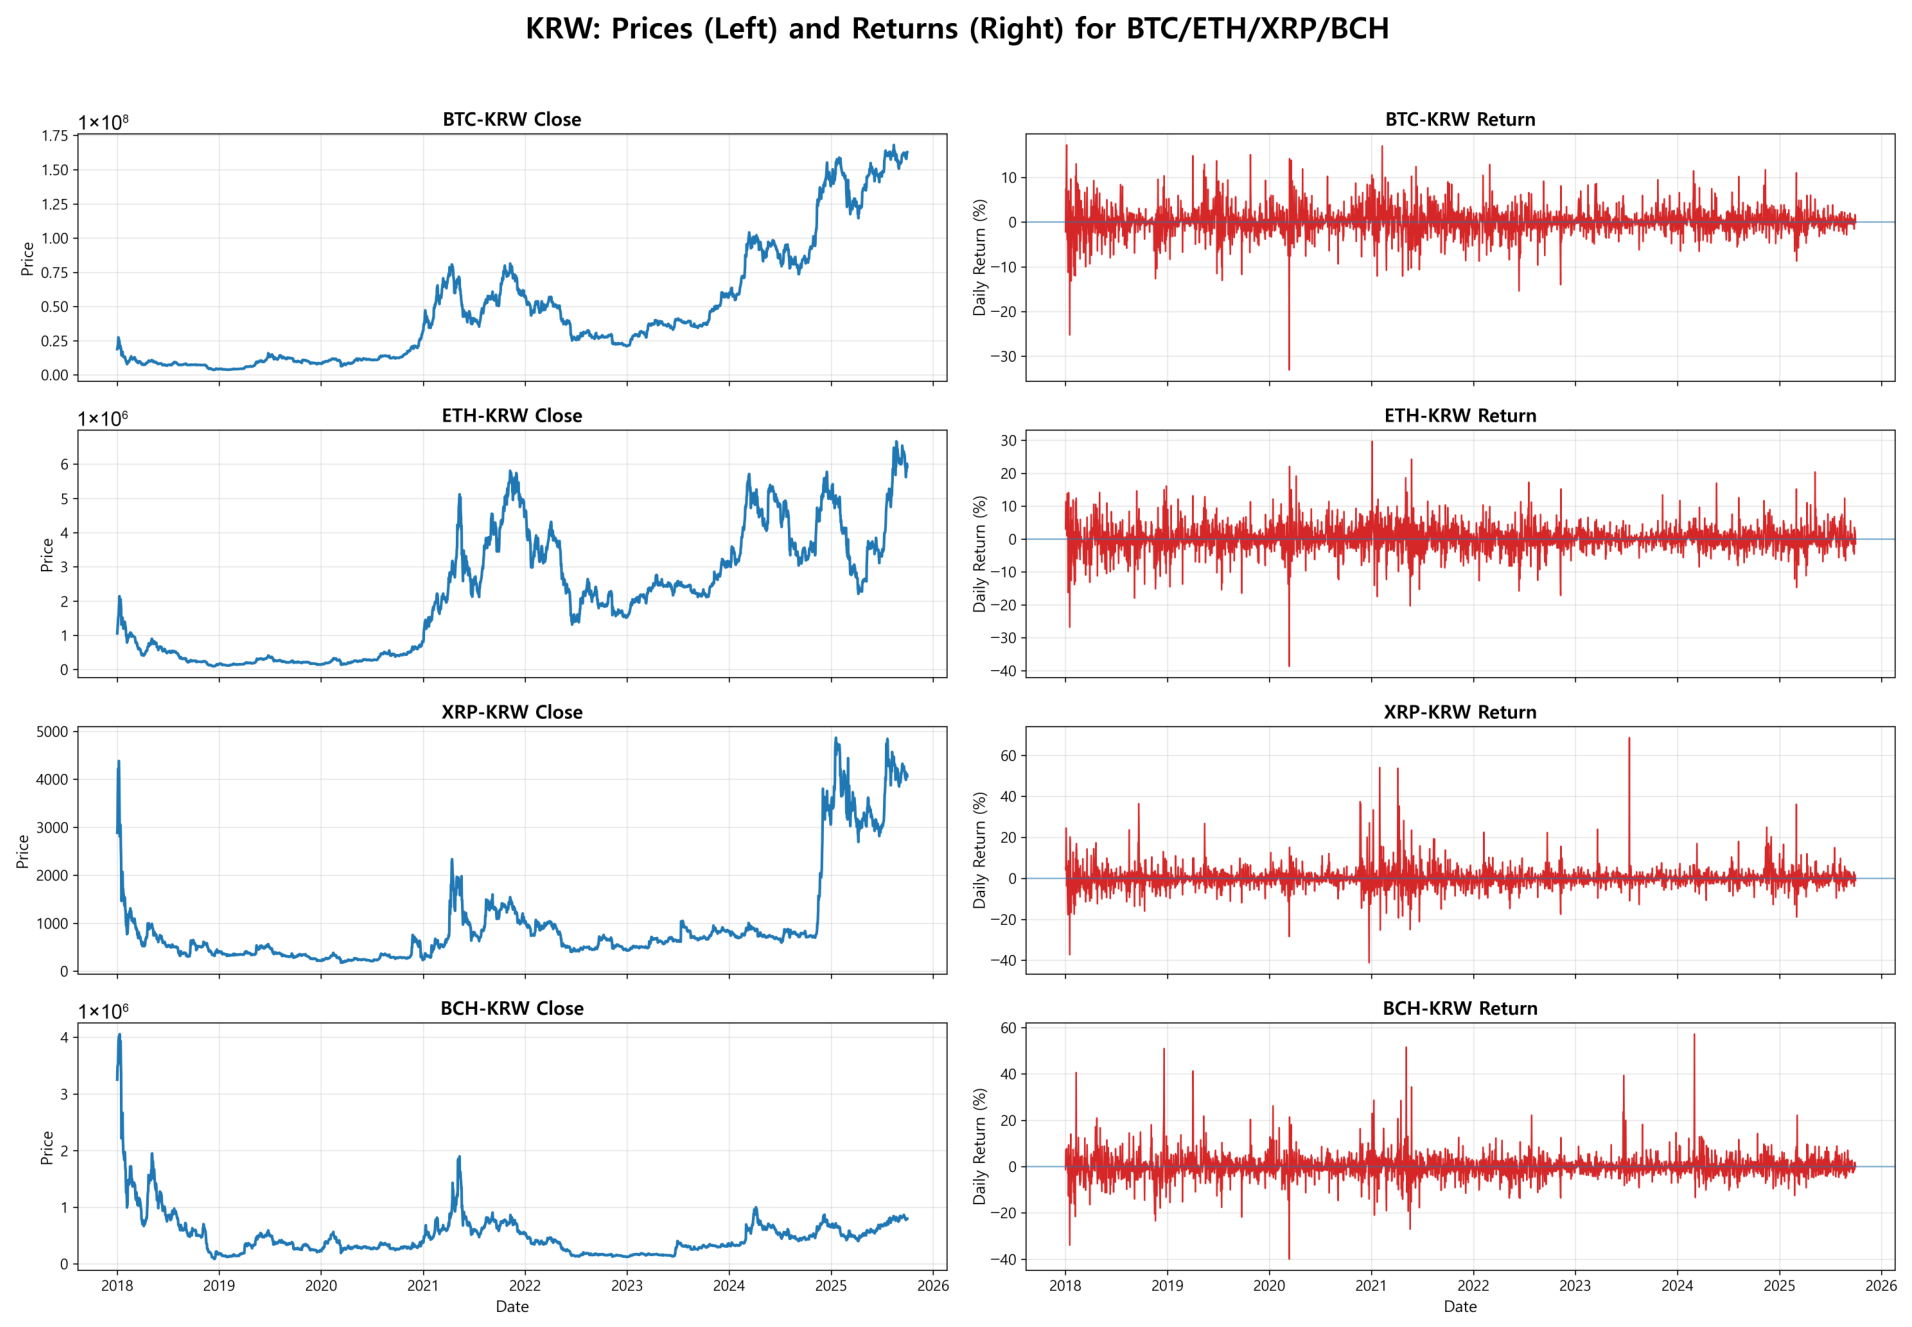
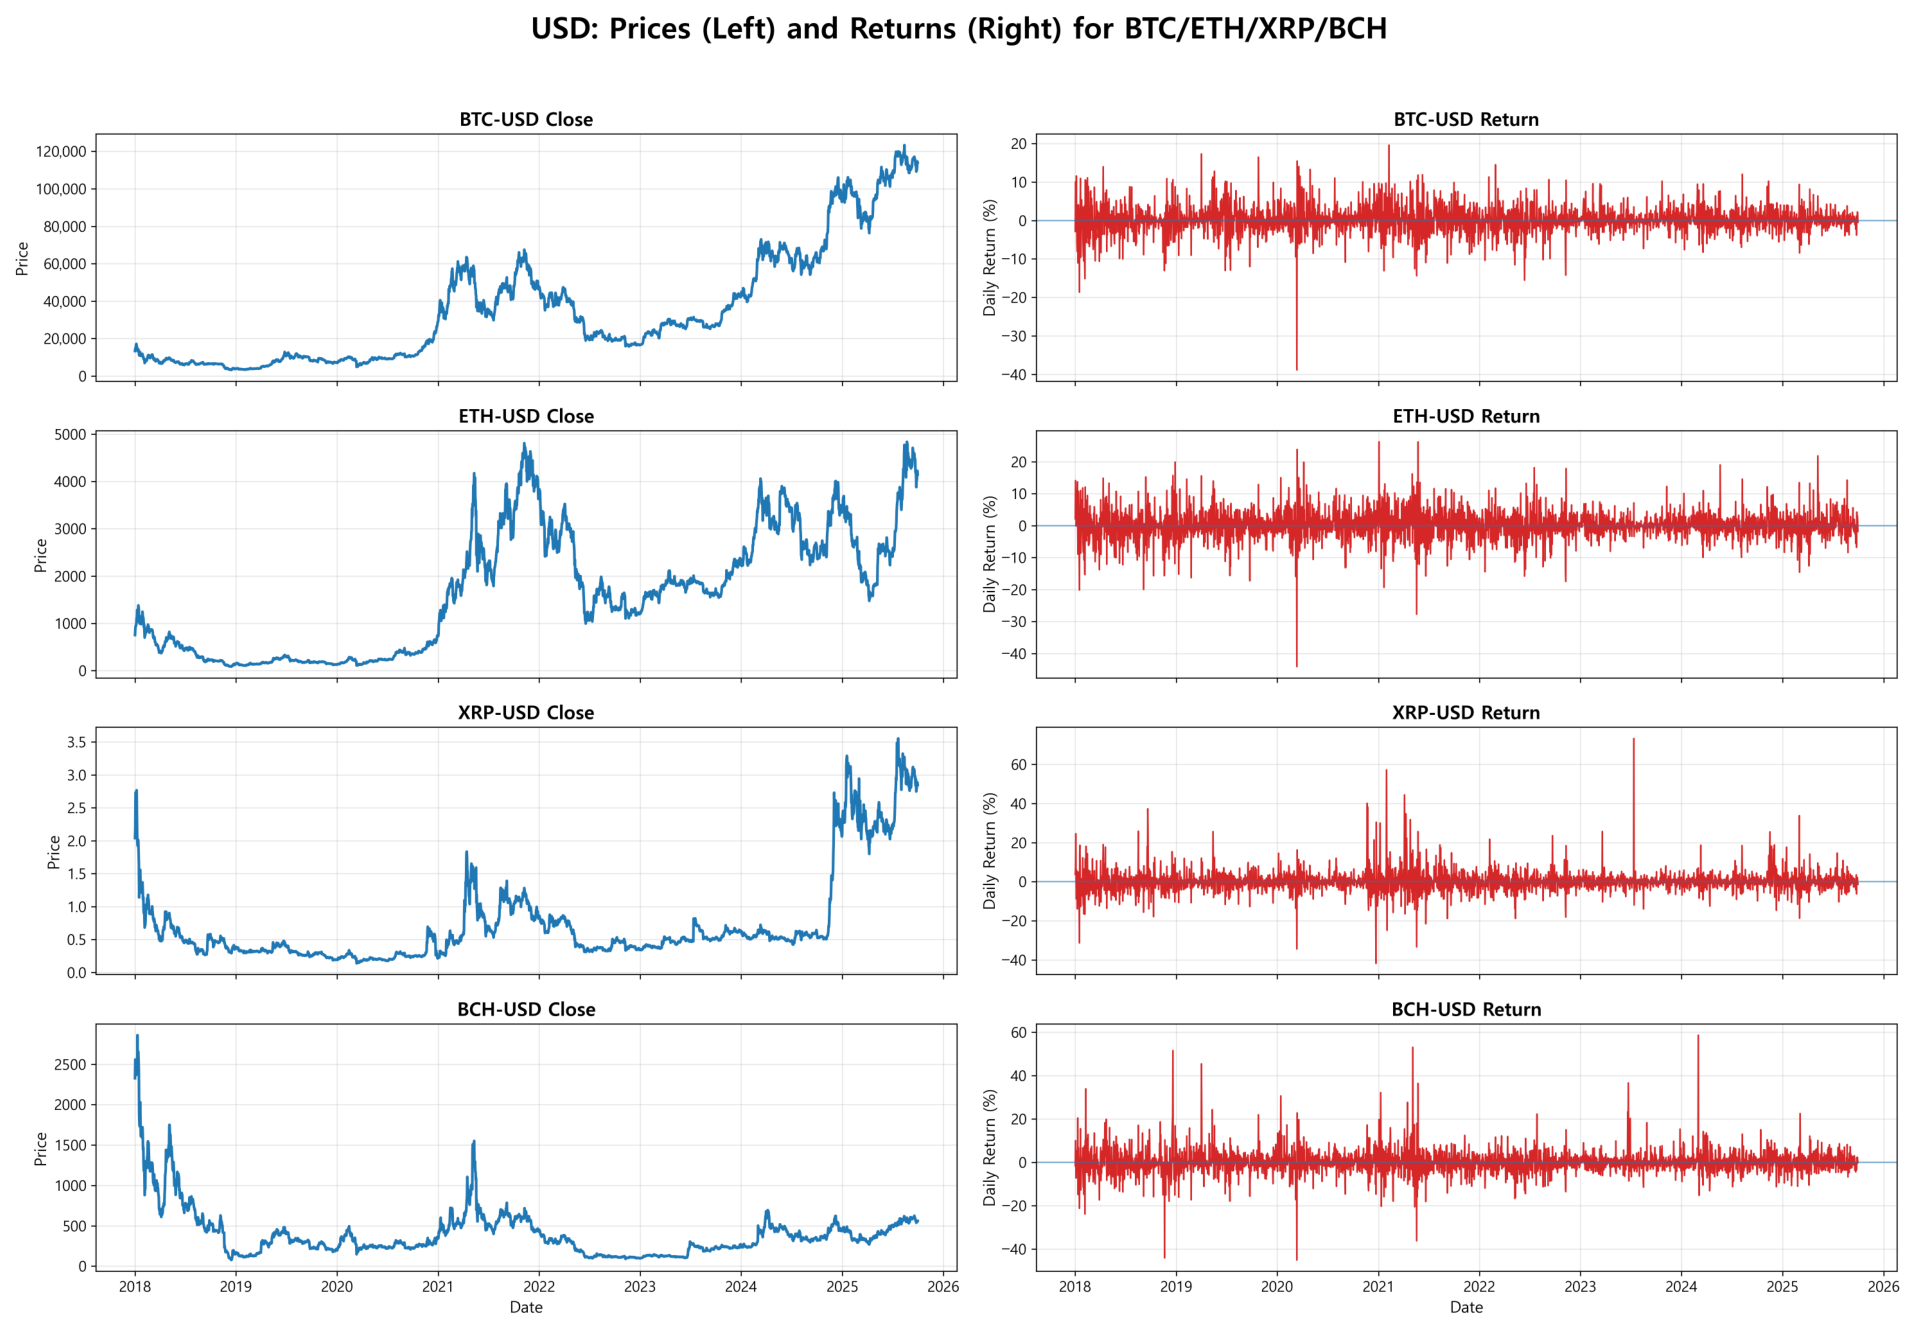
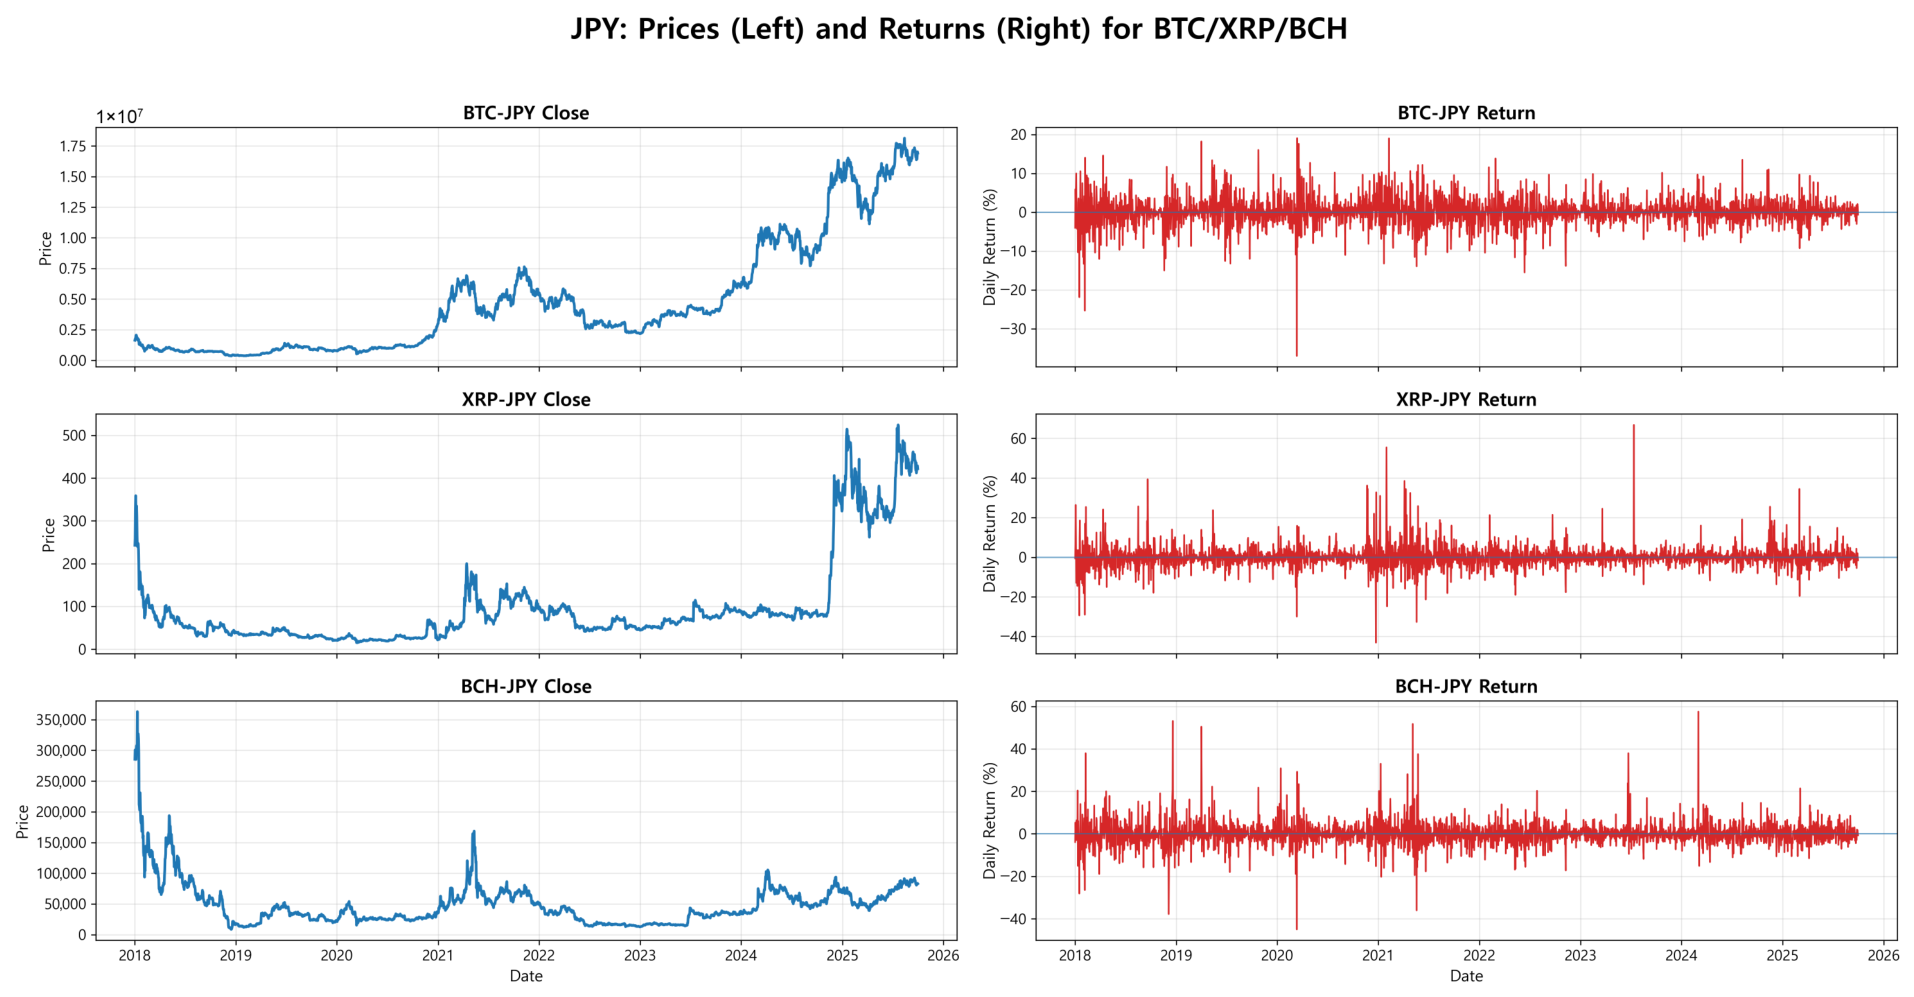
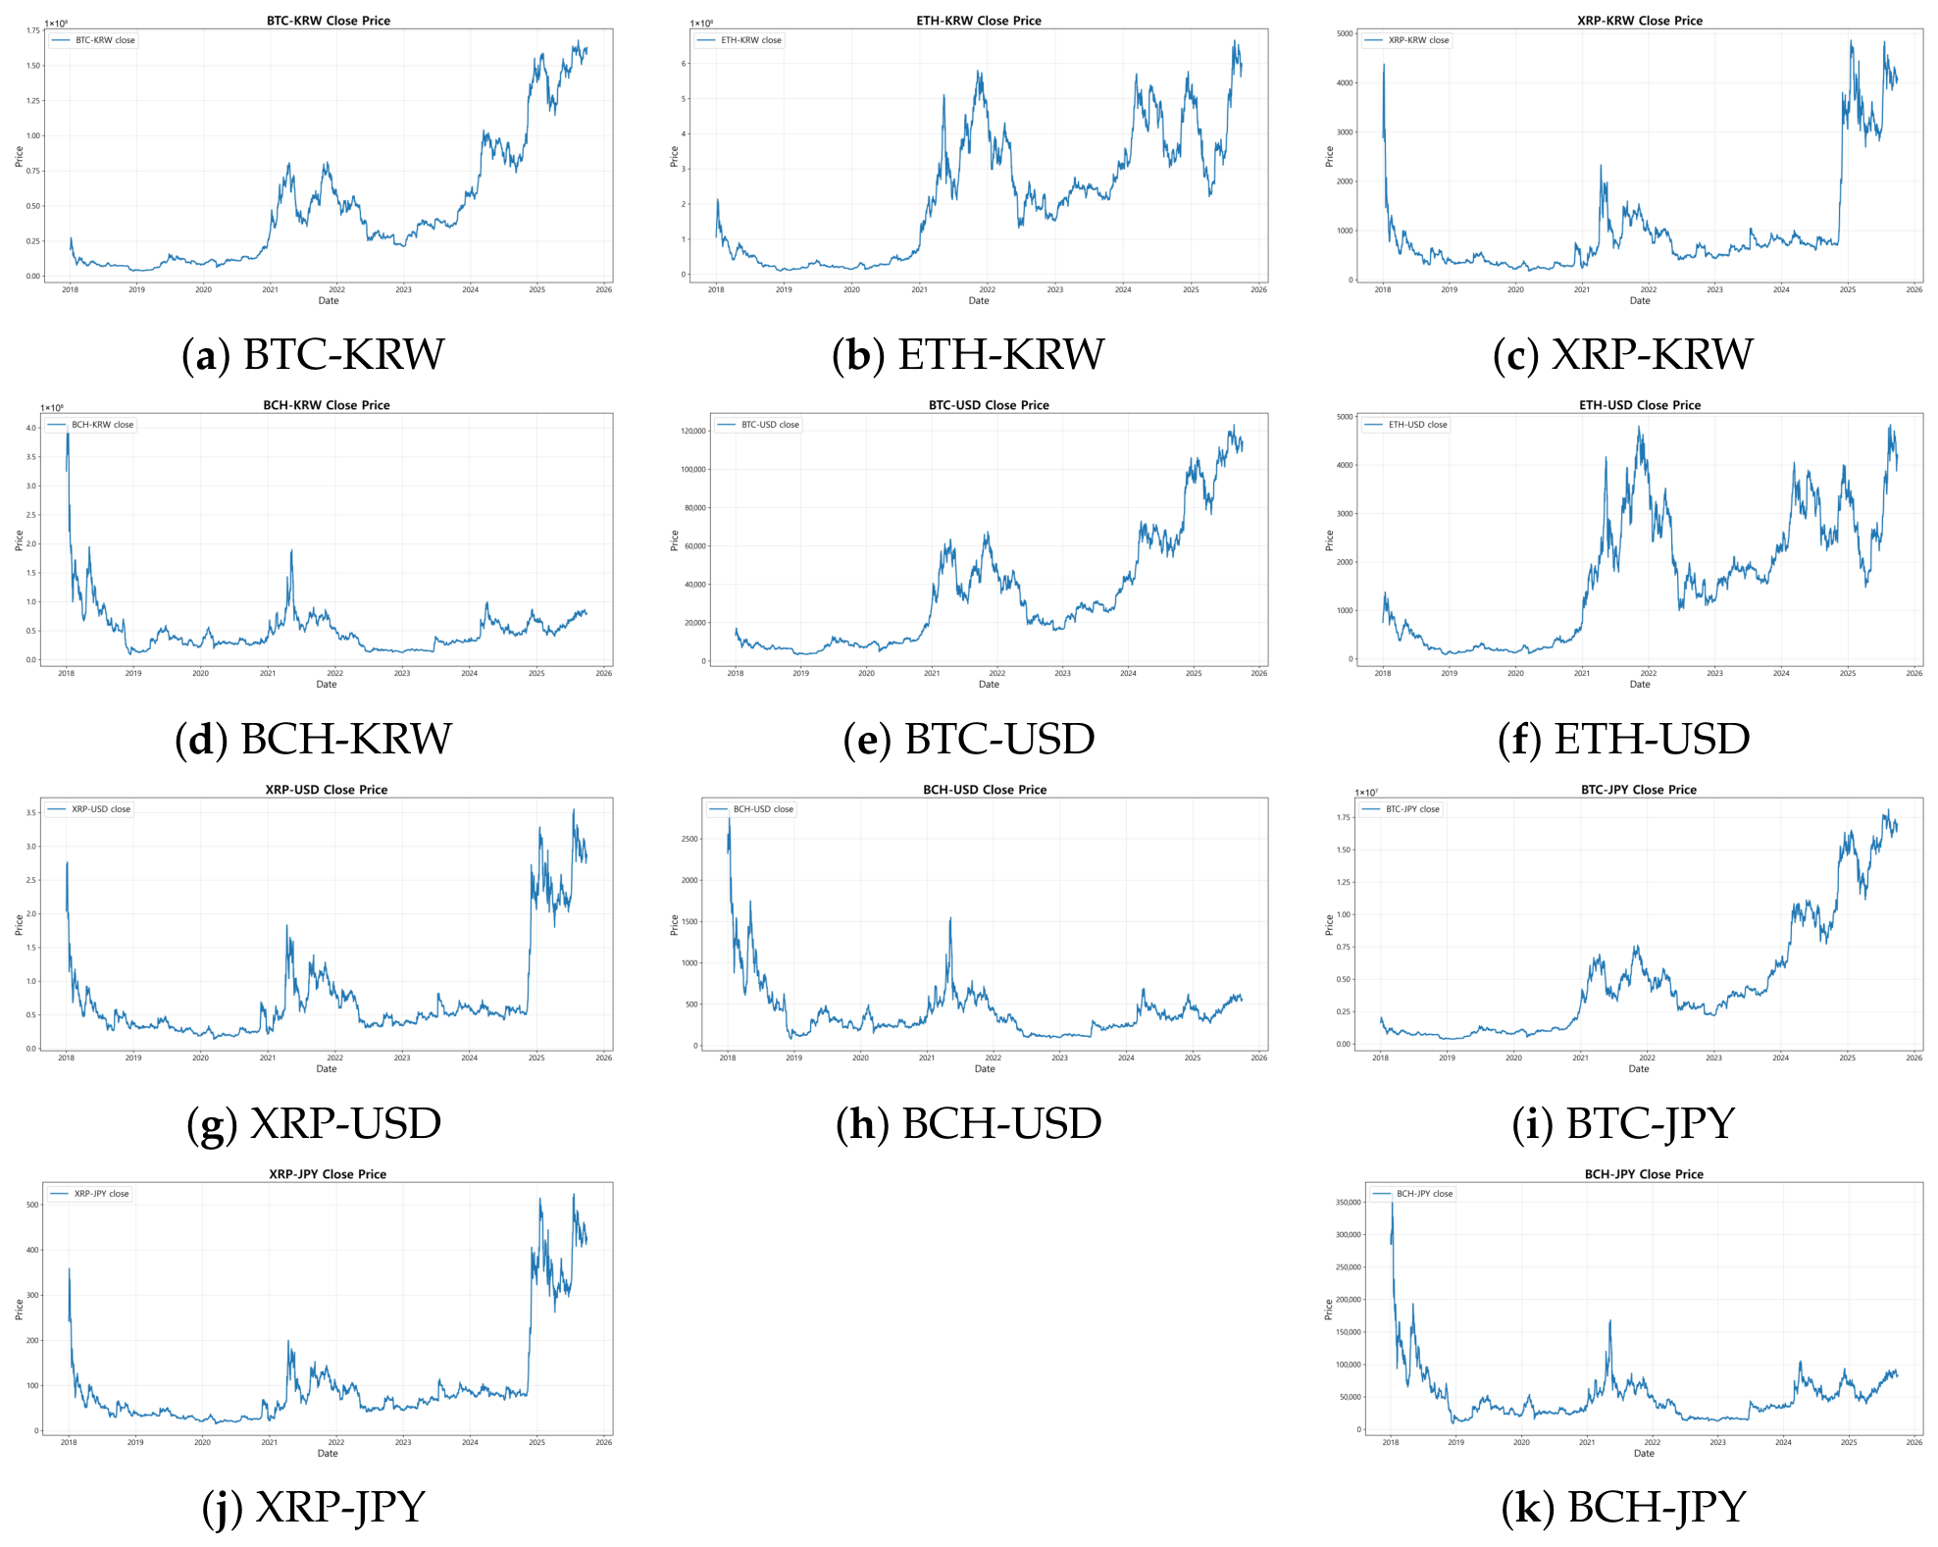
A visual inspection of cryptocurrency price dynamics offers further insight into temporal behavior. As illustrated in
Figure 1a, price trajectories of BTC, ETH, XRP, and BCH reveal distinct yet interconnected cycles over January 2018 to September 2025. Bitcoin maintains the highest nominal price range throughout, while other assets move in tandem with smaller magnitudes. Sharp surges in late 2017–2018 and mid-2021, followed by pronounced corrections, underline the speculative and cyclical nature of these markets. Subtle differences between KRW-, USD-, and JPY-denominated markets suggest localized trading dynamics and exchange rate effects.
Figure A7,
Figure A8,
Figure A9 and
Figure A10 highlight heterogeneous price behaviors across currencies. BTC prices denominated in KRW exhibit visibly greater amplitude and volatility compared to USD and JPY, possibly reflecting stronger speculative participation and varying liquidity structures. Ethereum follows similar cyclical patterns but demonstrates smoother convergence after 2022, while XRP and BCH show synchronized peaks across markets, with absolute levels differing due to regional exchange conditions and currency conversion effects.
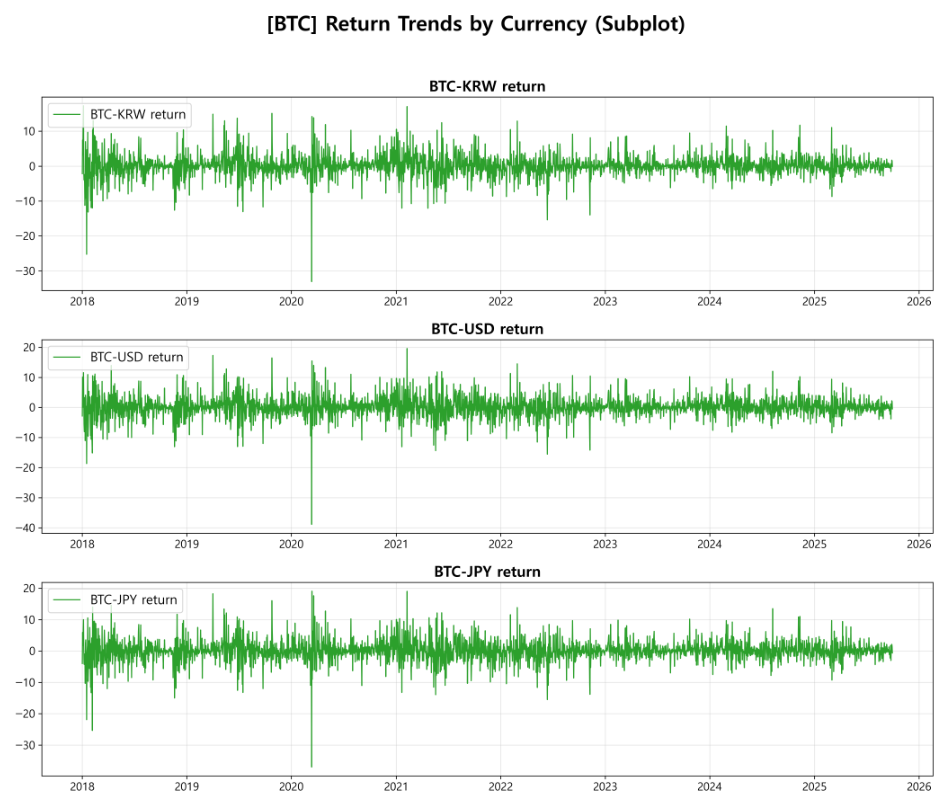
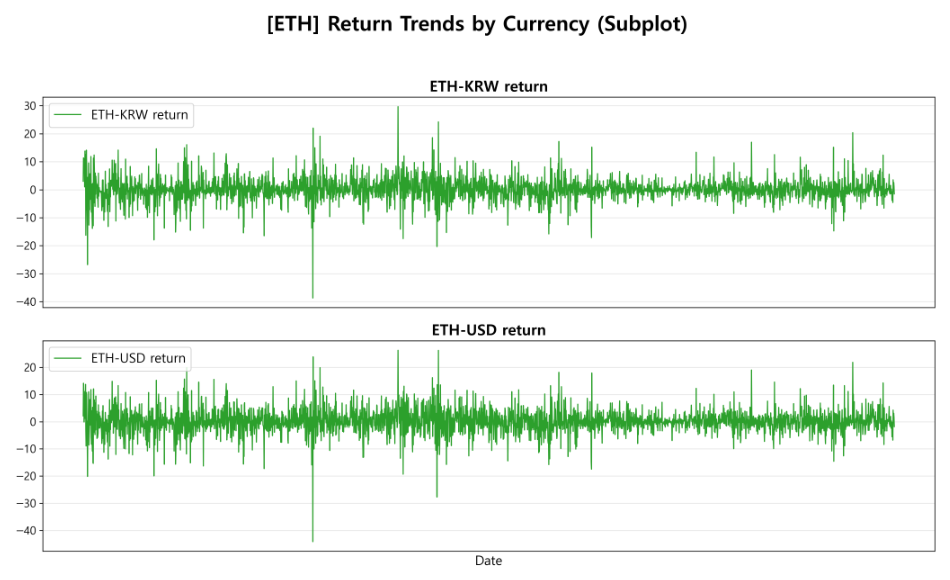
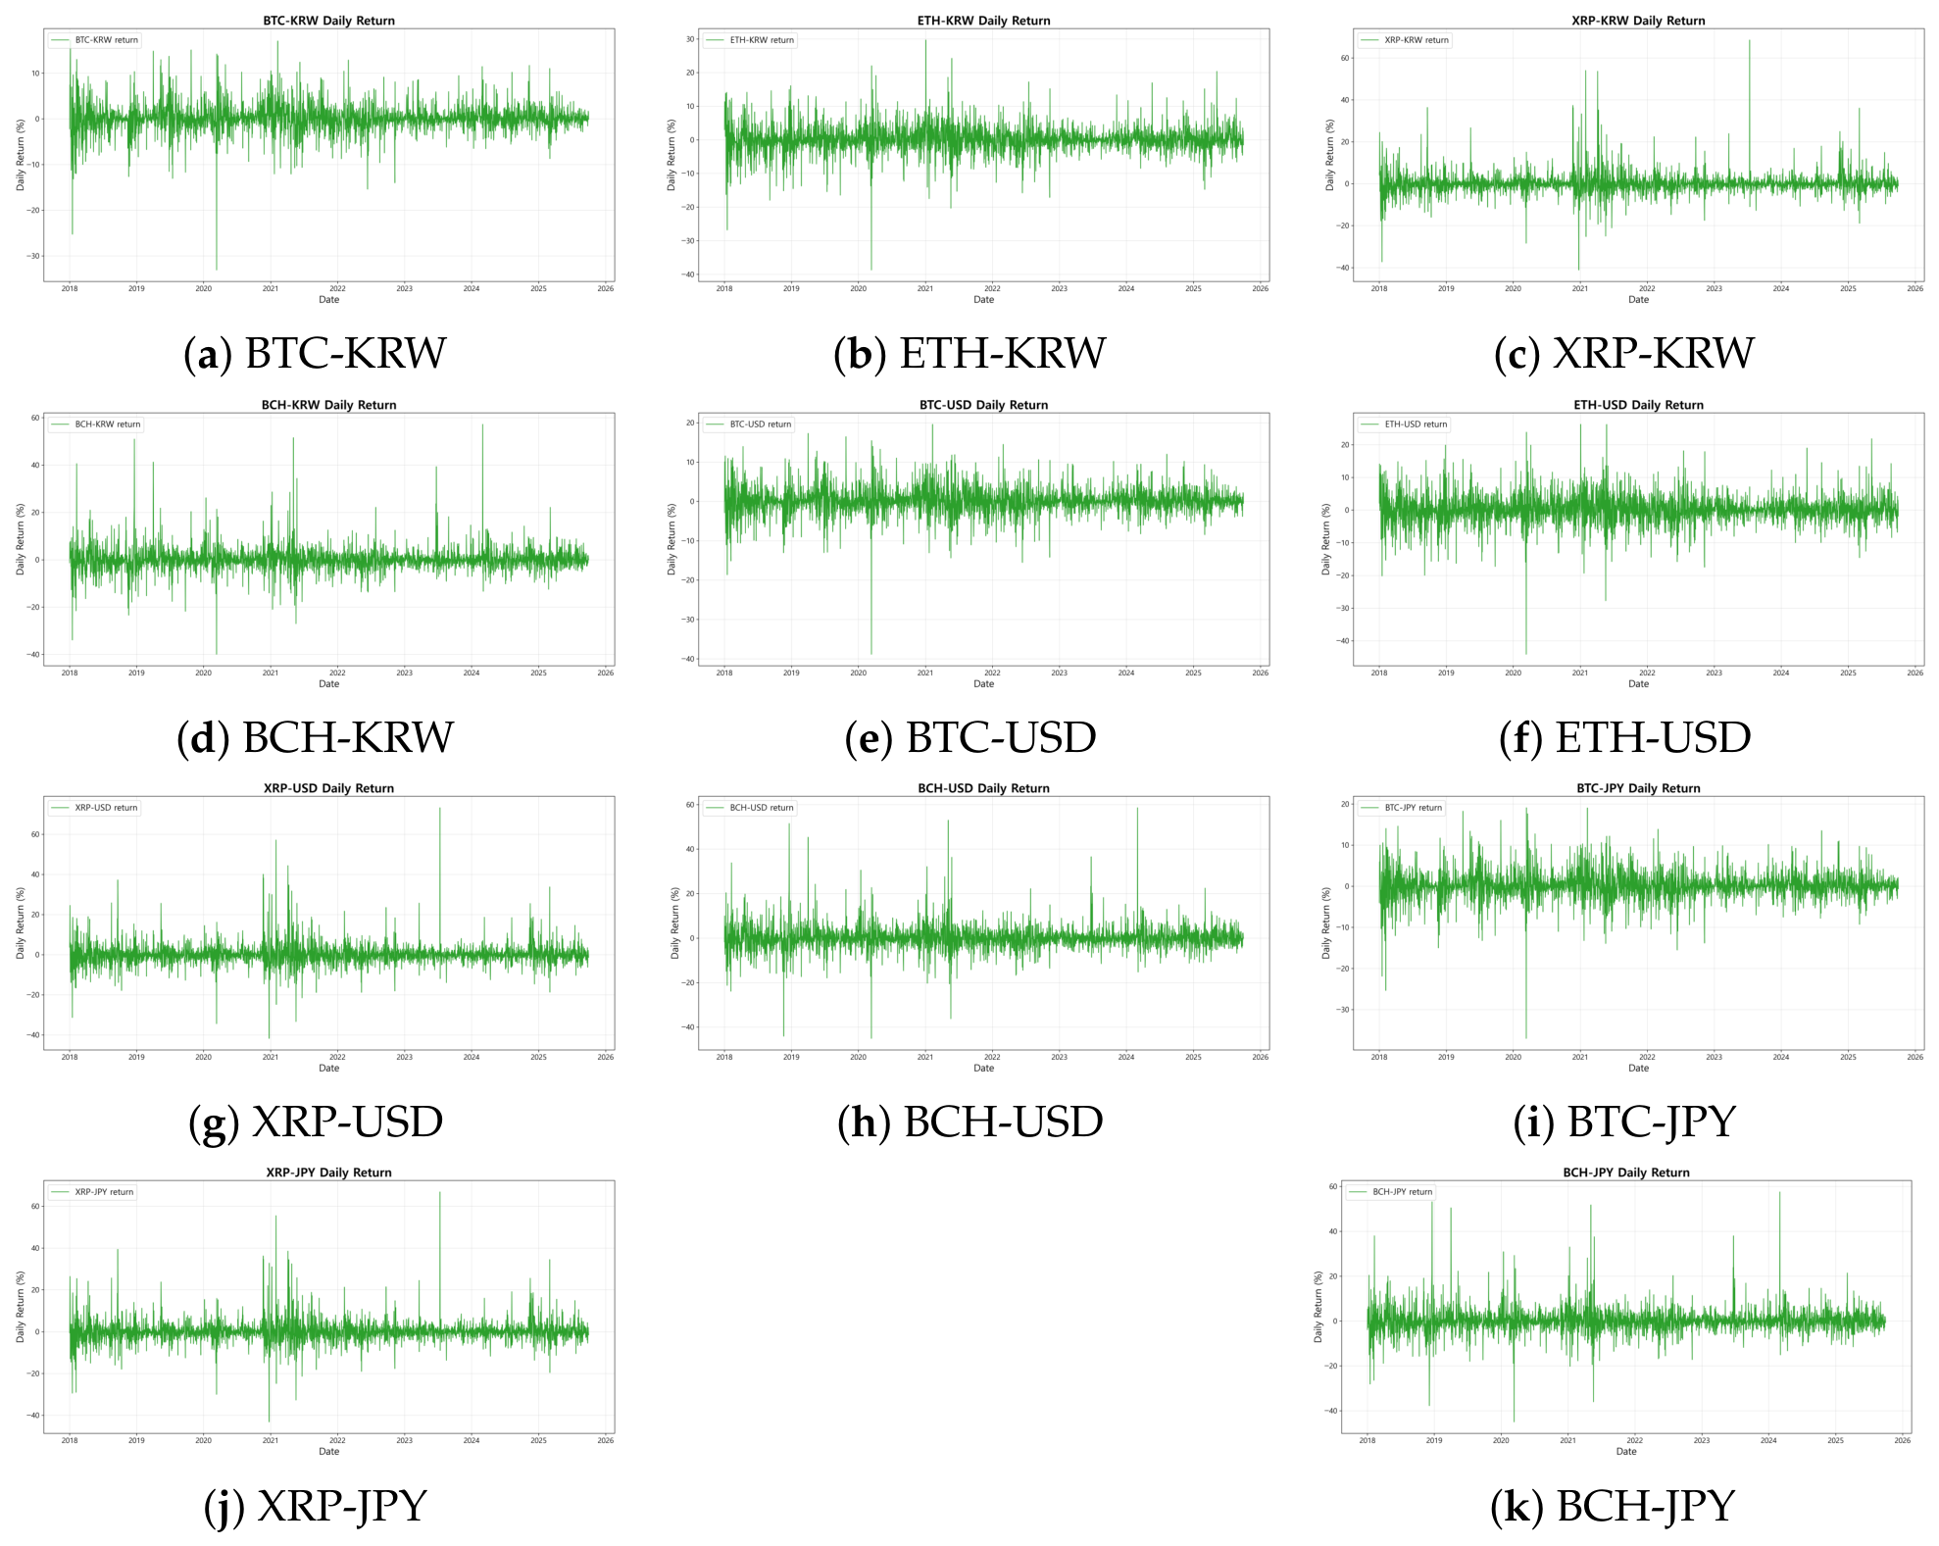
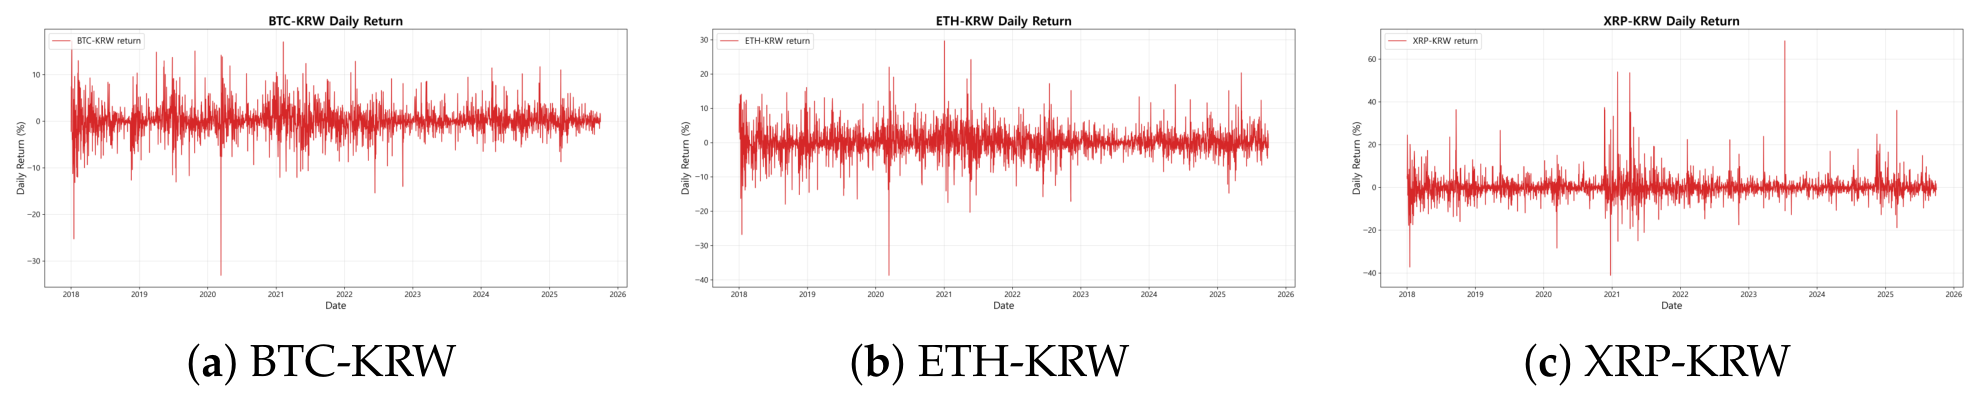
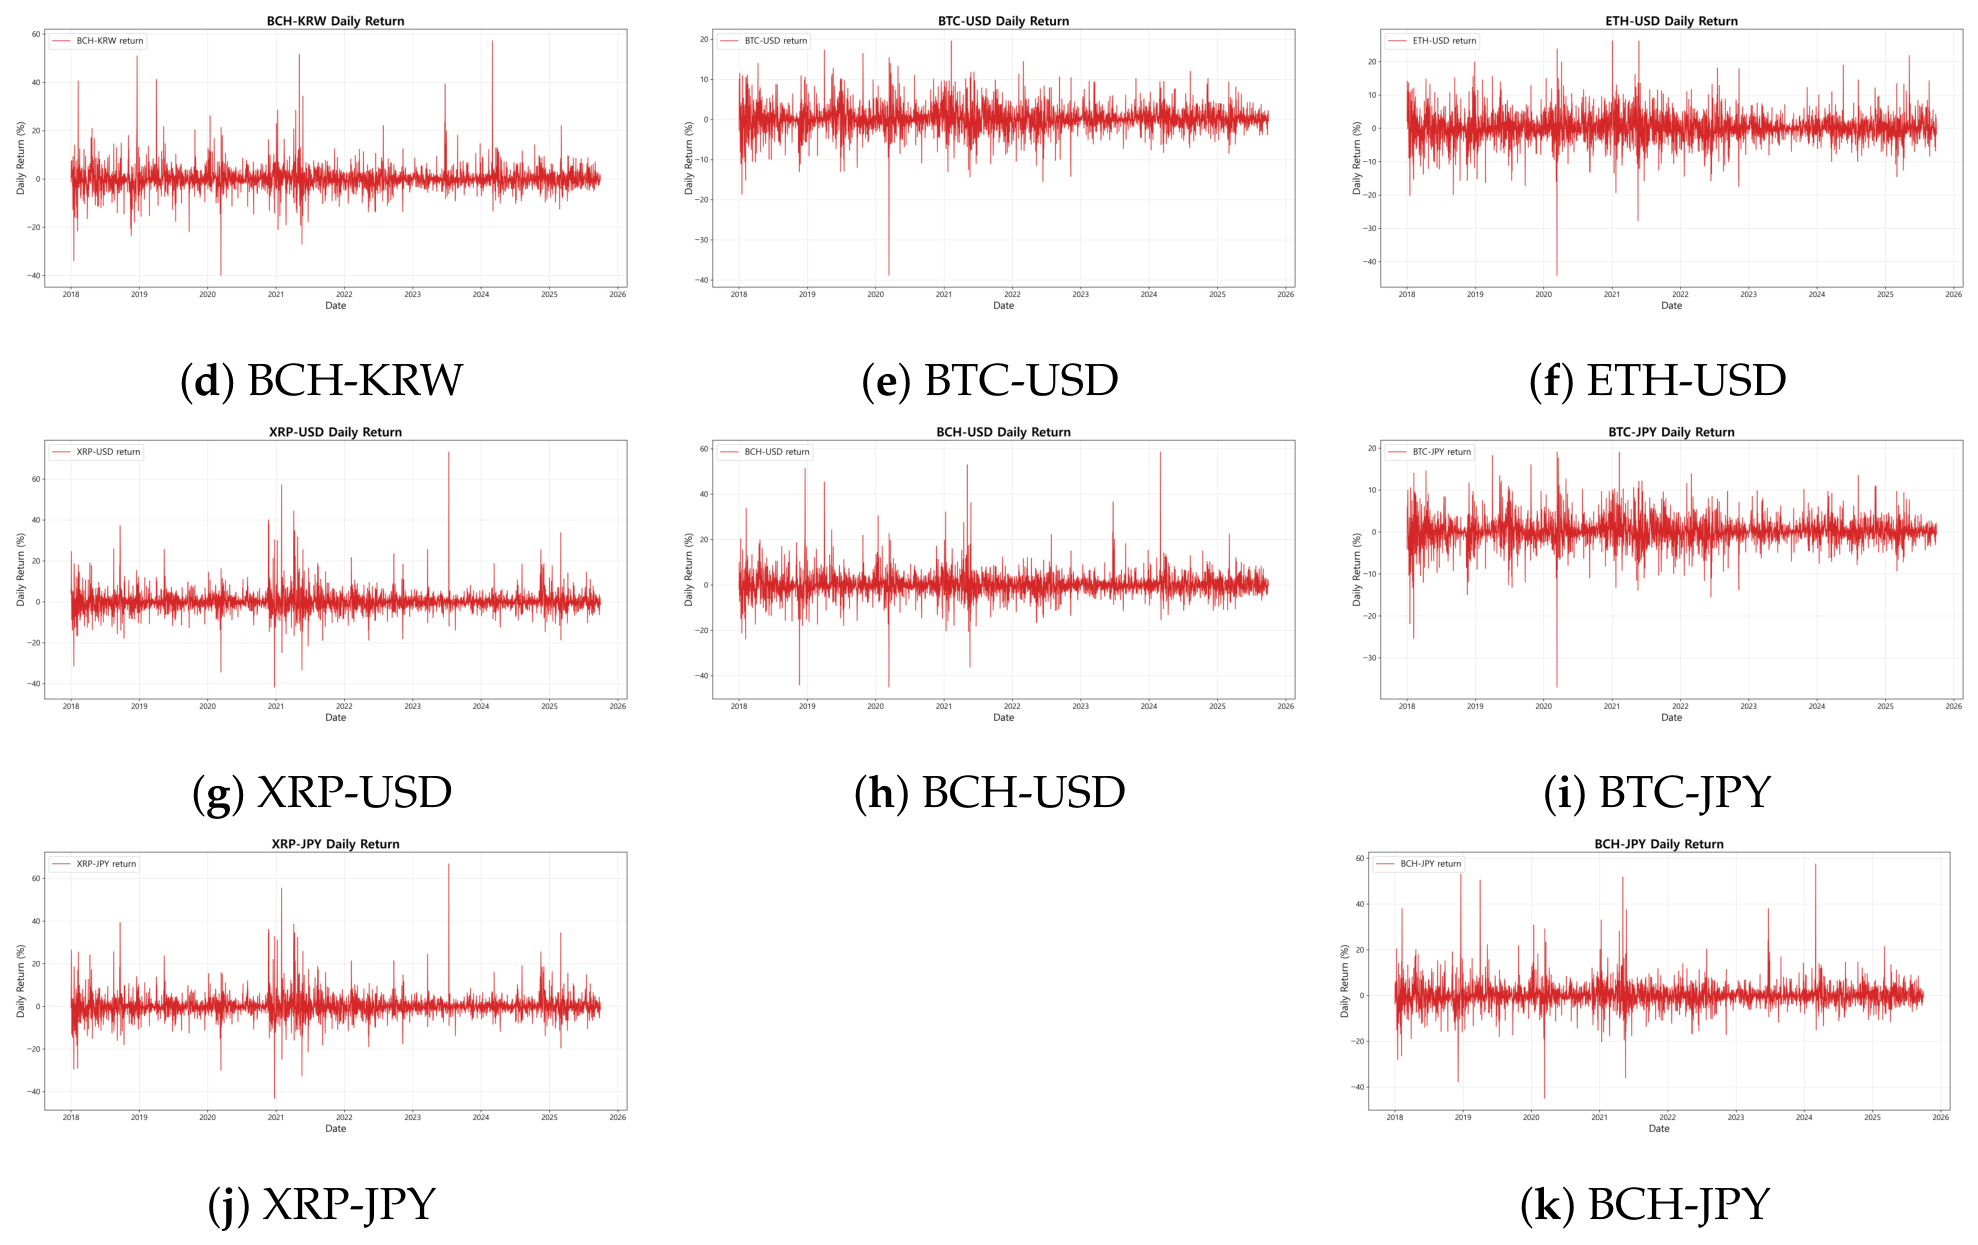
Figure 1b depicts daily return fluctuations across all assets and markets. Dense clustering of return spikes around global events such as the 2020 financial turmoil and 2021 crypto bull run emphasizes the volatile and non-normal nature of cryptocurrency returns, consistent with the leptokurtic distributions reported in the descriptive statistics.
Figure A12,
Figure A13,
Figure A14 and
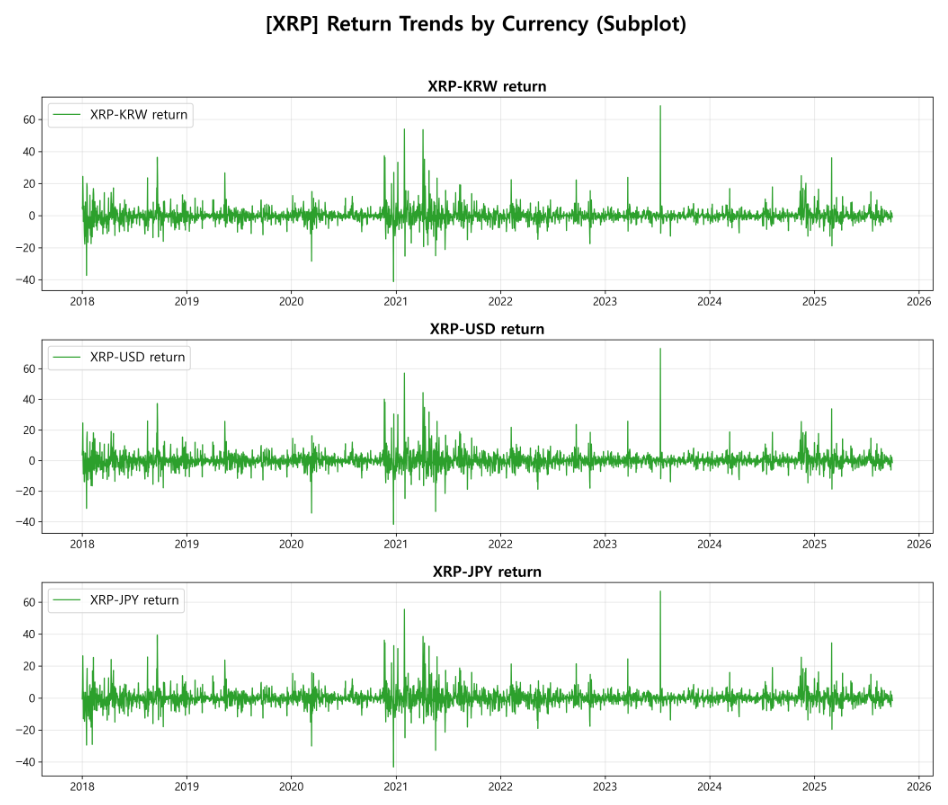
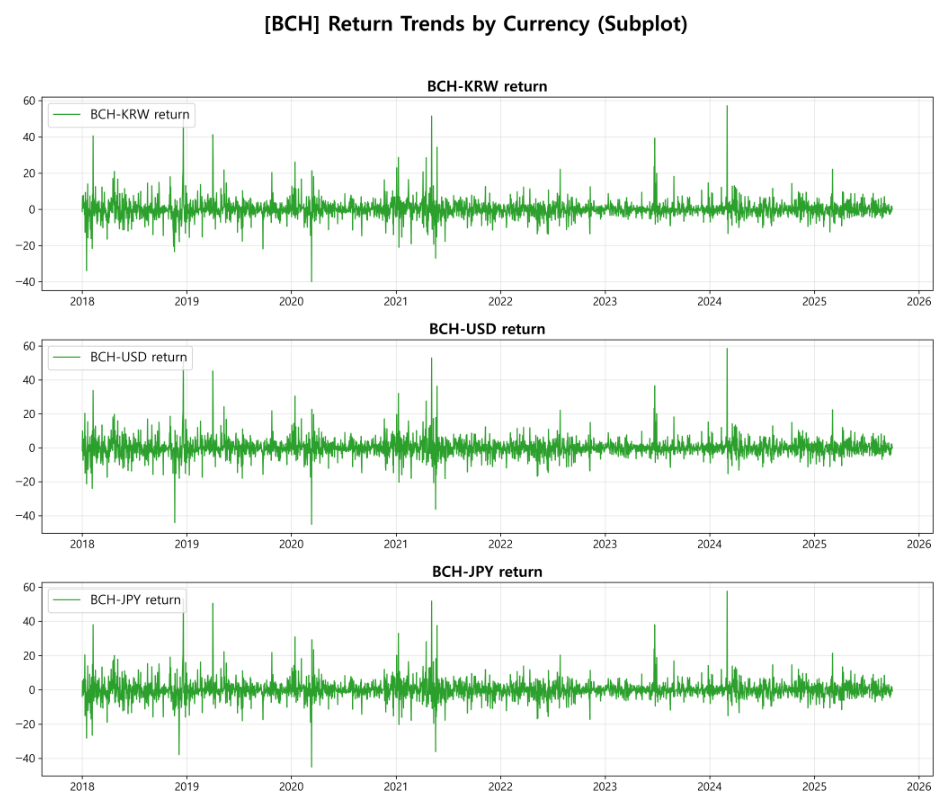
Figure A15 separate returns by market. Bitcoin returns move almost synchronously across KRW, USD, and JPY markets, suggesting rapid information transmission and high cross-market efficiency. Ethereum volatility appears more pronounced in the USD market, consistent with its globally diversified trading base and prevalence of derivatives. XRP and BCH exhibit slightly higher fluctuation intensity in KRW and JPY markets, possibly attributable to thinner liquidity or heightened exchange rate sensitivity.
Taken together, while general cyclical patterns appear globally synchronized, amplitude and volatility behavior vary notably across currencies and asset classes, underlining the relevance of modeling volatility spillovers and dynamic correlations to capture inter-market dependencies and regional heterogeneity.
3.2. MF-DFA
Following the formulation of MF-DFA by Kantelhardt et al. [
33], we evaluate cryptocurrency market efficiency using multifractal detrended fluctuation analysis (MF-DFA), which captures multifractal scaling behavior in financial time series (e.g., [
14,
34,
35]).
Let
denote a series of length
N. MF-DFA proceeds as follows. (1) Construct the cumulative profile
(2) Divide
into
non-overlapping segments of size
s, and repeat the partitioning from the end to obtain
segments. (3) In each segment
, remove the local trend by fitting an
m-order polynomial
(typically
or 3; [
36]) and compute the detrended variance
. (4) Aggregate across segments to form the
q-order fluctuation function
(using the log-averaged form when
). (5) Estimate scaling exponents from the power-law relation
where
is the generalized Hurst exponent obtained from the slope of
on
.
If
is constant in
q, the series is monofractal; otherwise, it is multifractal. In particular,
coincides with the Hurst exponent [
23]:
is consistent with an uncorrelated random walk, whereas
(<0.5) indicates persistent (anti-persistent) dynamics [
23].
Following [
33], the scaling exponent satisfies
. We then apply a Legendre transform to obtain the singularity strength and multifractal spectrum,
and summarize multifractality by the spectrum width
[
34,
35,
37]. A larger
implies stronger heterogeneity in scaling behavior (more pronounced multifractality) and is typically interpreted as lower market efficiency [
24,
25,
38].
Although is widely used as an indicator of market inefficiency, there is no universally accepted numerical cutoff that separates efficient from inefficient markets. The efficient benchmark corresponds to a monofractal random-walk-like process, in which is approximately invariant across q, is close to 0.5, and approaches zero. Therefore, we interpret as a relative and time-varying measure of inefficiency: larger values indicate stronger multifractality and lower market efficiency, while smaller values indicate a market state closer to efficiency.
To empirically estimate the time-varying market efficiency of the selected cryptocurrency pairs, we implemented a rolling-window MF-DFA procedure. This approach allows us to capture the nonlinear complexity and dynamic efficiency of financial markets more comprehensively than standard monofractal methods [
33].
First, regarding the polynomial order for detrending, we employed a second-order polynomial (
). An
m-th order MF-DFA removes trends of order
in the original series, so quadratic detrending is a natural choice for financial return series that may exhibit locally linear drift [
33]. It has been suggested that
–3 is generally adequate when minimum segment sizes are in the range of 10–20 observations [
39], as excessively low orders may leave residual nonstationarity while excessively high orders risk absorbing genuine low-frequency fluctuations into the estimated trend [
40]. This choice therefore removes quadratic trends in the integrated profile, thereby mitigating the spurious detection of long-range correlations induced by nonstationarity and local trends in volatile financial time series [
33,
41].
Second, the fluctuation functions were evaluated over logarithmically spaced scales between and , using 20 scale values. In the rolling-window analysis, where , this corresponds to scales between 10 and 62 observations. This range was chosen to avoid very small scales that may be dominated by short-term noise and very large scales that would leave too few segments for reliable estimation of the scaling relationship.
Third, unlike traditional studies that focus solely on the average fluctuation at
, we examined the scaling behavior across a broad range of moments,
. The
q range and polynomial order
m follow conventions widely adopted in the MF-DFA literature. Ref. [
33] show that
q can take any real value except zero, and that linear, quadratic, and higher-order polynomials are all admissible choices for local detrending. This range is broadly consistent with related studies; Ref. [
42] document that values as wide as
appear in the literature, while narrower ranges such as
have also been employed. The generalized Hurst exponent
was estimated for each
q to observe the multifractality of the return series. The presence of multifractality is confirmed when
is a decreasing function of
q, indicating that small and large fluctuations scale differently.
Fourth, we derive the multifractal spectrum
through the Legendre transform of the mass exponent
. The degree of market inefficiency is quantified by the multifractal spectrum width,
. A larger
signifies a higher degree of complexity and market inefficiency, whereas a narrower spectrum indicates a more efficient state approaching monofractality [
41].
Finally, to observe the evolution of market efficiency over time, we adopted a rolling window approach with a window size of trading days, moving forward by one day at a time. For each window, the MF-DFA algorithm was executed to compute the localized efficiency index, . This procedure generates a continuous time series of efficiency measures, which serves as the primary input variable for the subsequent DCC-GARCH analysis.
3.3. DCC-GARCH Model Specification
To capture time-varying correlations between market efficiencies, we employ the DCC-GARCH model proposed by Engle [
17]. This two-step estimation process allows for a dynamic assessment of how market interdependence evolves over time.
For rolling () series, DCC-GARCH is used as a reduced-form dynamic dependence framework to summarize time-varying co-movement among market-efficiency measures, rather than as a structural model of the MF-DFA estimator itself. This distinction is important because rolling () are constructed from highly overlapping windows, are therefore smoothed, serially dependent, and subject to estimation error. Economically, this specification allows us to examine whether changes in market inefficiency and information-processing complexity move together across local cryptocurrency markets, beyond conventional return-based integration.
In the first step, for each return series and rolling MF-DFA-based efficiency series, we estimate a univariate GARCH(1,1) model with a constant mean specification and Student-
t innovations. Let
denote the input series for market
i, which can be either a return series or a rolling MF-DFA-based efficiency measure. The mean equation is specified as
where
is the constant mean parameter and
is the residual term. The residual is modeled as
where
is the conditional standard deviation and
follows a Student-
t distribution. The conditional variance follows the GARCH(1,1) process:
In this study, while
denotes asset returns, we define
as the vector of rolling MF-DFA-based efficiency measures, where each
corresponds to the multifractal spectrum width
. The conditional covariance matrix
of
is decomposed as
where
is the diagonal matrix of conditional standard deviations derived from the univariate GARCH processes, and
is the time-varying conditional correlation matrix.
In the second step, the dynamic correlation structure is specified using the standardized residuals
. For notational simplicity,
in the DCC recursion is understood as the mean-adjusted vector obtained after the constant mean specification in the univariate GARCH step. The evolution of the pseudo-correlation matrix
is governed by:
where
is the unconditional covariance matrix of the standardized residuals, and
and
are non-negative parameters satisfying
.
It is important to note that while
and
are scalar parameters estimated from the full sample, they govern the speed and persistence of correlation dynamics rather than fixing the level of correlation itself [
17]. The conditional correlation matrix
varies at every time step
t, ensuring that the model captures time-varying co-movements. The constraint
guarantees the stationarity and positive definiteness of
, which is a necessary condition for
to remain a valid correlation matrix at all times [
17,
43].
Finally, the dynamic conditional correlation matrix
is obtained by rescaling
:
This specification ensures that
remains a valid correlation matrix with unit diagonal elements at every time step.
Using this framework, we examine the dynamic relationship between the efficiencies () of domestic and global cryptocurrency markets, specifically within the context of the “Kimchi Premium”. The DCC-GARCH model is particularly well-suited for this analysis as it captures time-varying volatilities and correlations of these efficiency measures. By tracking the conditional correlation of between BTC/KRW and BTC/USD, we can distinguish whether shifts in market complexity are driven by idiosyncratic local trading pressure or by global information shocks.
Building on prior research that has successfully applied DCC-based models to explore volatility connectedness in financial systems-ranging from fintech spillovers [
18] to cryptocurrency and commodity linkages [
19,
20,
21,
44,
45] and recent advances in stochastic volatility modeling that address asymmetry and regime shifts within rigorous theoretical frameworks [
46,
47]—this study utilizes the framework to quantify the evolving correlations between the market efficiencies of Korean and international markets. This approach provides a robust empirical basis for evaluating how information flows and efficiency transmission are associated with the persistent variations in the Kimchi Premium over time.
4. Empirical Results
Initially, we considered a comprehensive set of 12 cryptocurrency–fiat pairs to capture a broad range of market dynamics. However, to ensure the statistical reliability of the GARCH estimations and MF-DFA calculations, the ETH-JPY pair was excluded from the final analysis due to insufficient data observations in the source dataset. Consequently, our final sample consists of the remaining 11 valid pairs, providing a robust basis for dynamic correlation analysis without statistical artifacts.
4.1. Market Efficiency
4.1.1. The Full Period
To evaluate the overall market efficiency of BTC, ETH, XRP, and BCH across different fiat markets, we first estimated the static generalized Hurst exponents
across a range of moments
for the full sample period. As summarized in
Table A4,
for all series exhibits a significant dependency on
q, with values decreasing sharply as
q increases.
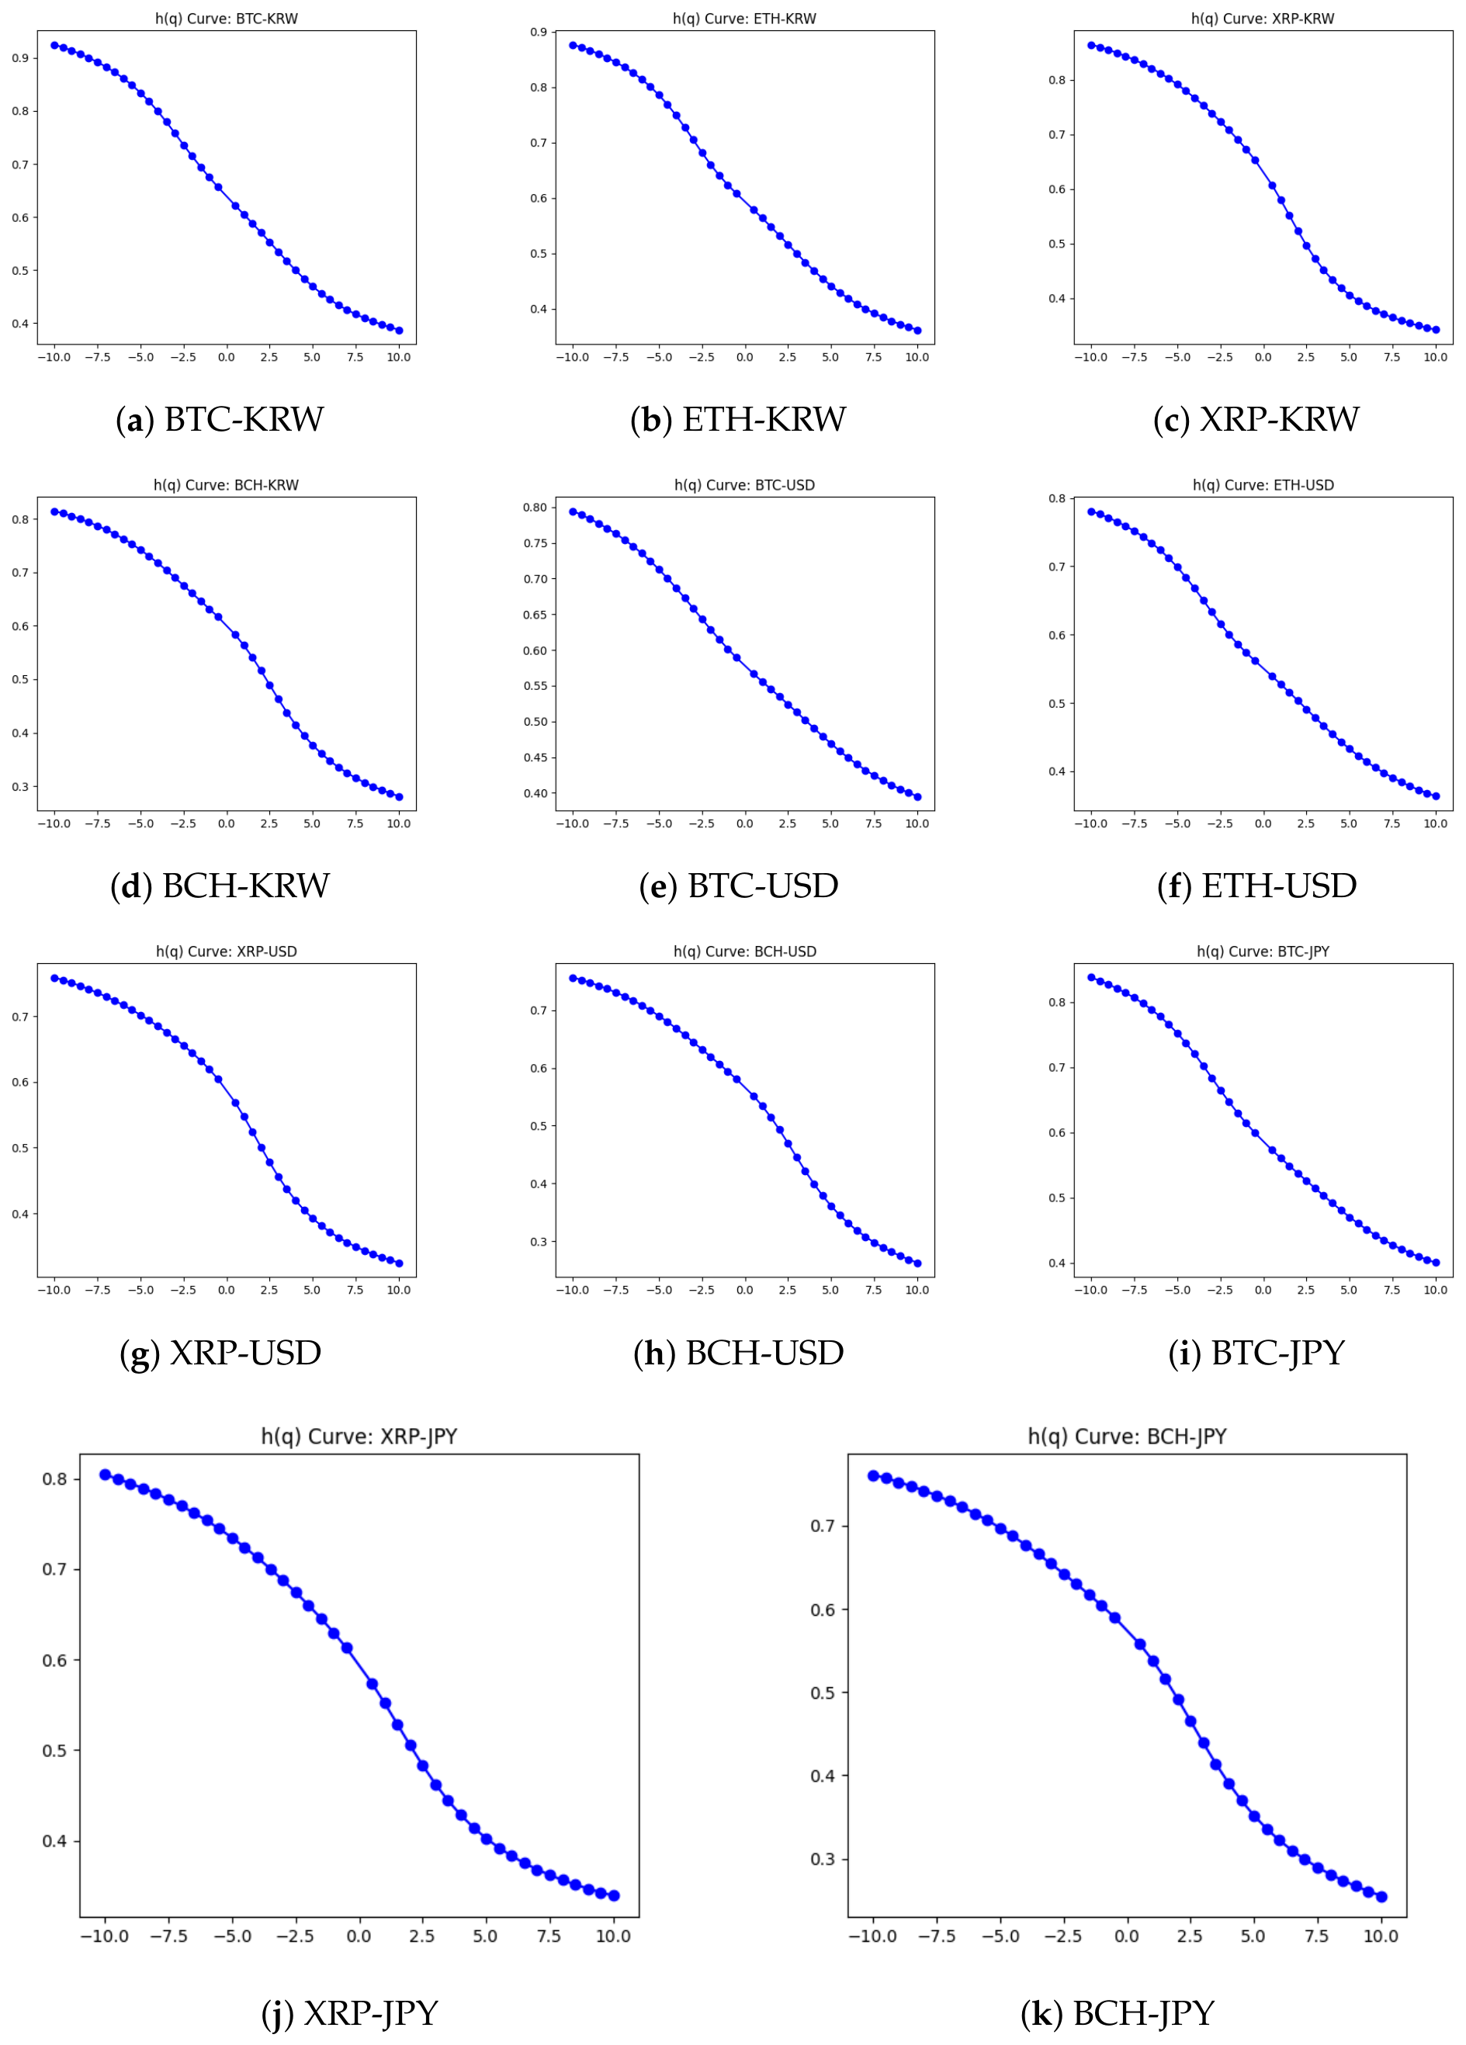
Figure 2 illustrates this scaling behavior across all 11 cryptocurrency–fiat pairs. The distinct downward slope of the
curves provides clear visual evidence of the multifractality of the cryptocurrency market. Specifically, the high values of
at negative
q indicate that small fluctuations follow a persistent power-law, while the significantly lower values at positive
q reflect the scaling behavior of large price shocks. This structural heterogeneity confirms that the return series are governed by complex, nonlinear dynamics rather than a simple random walk where
H would remain constant at 0.5.
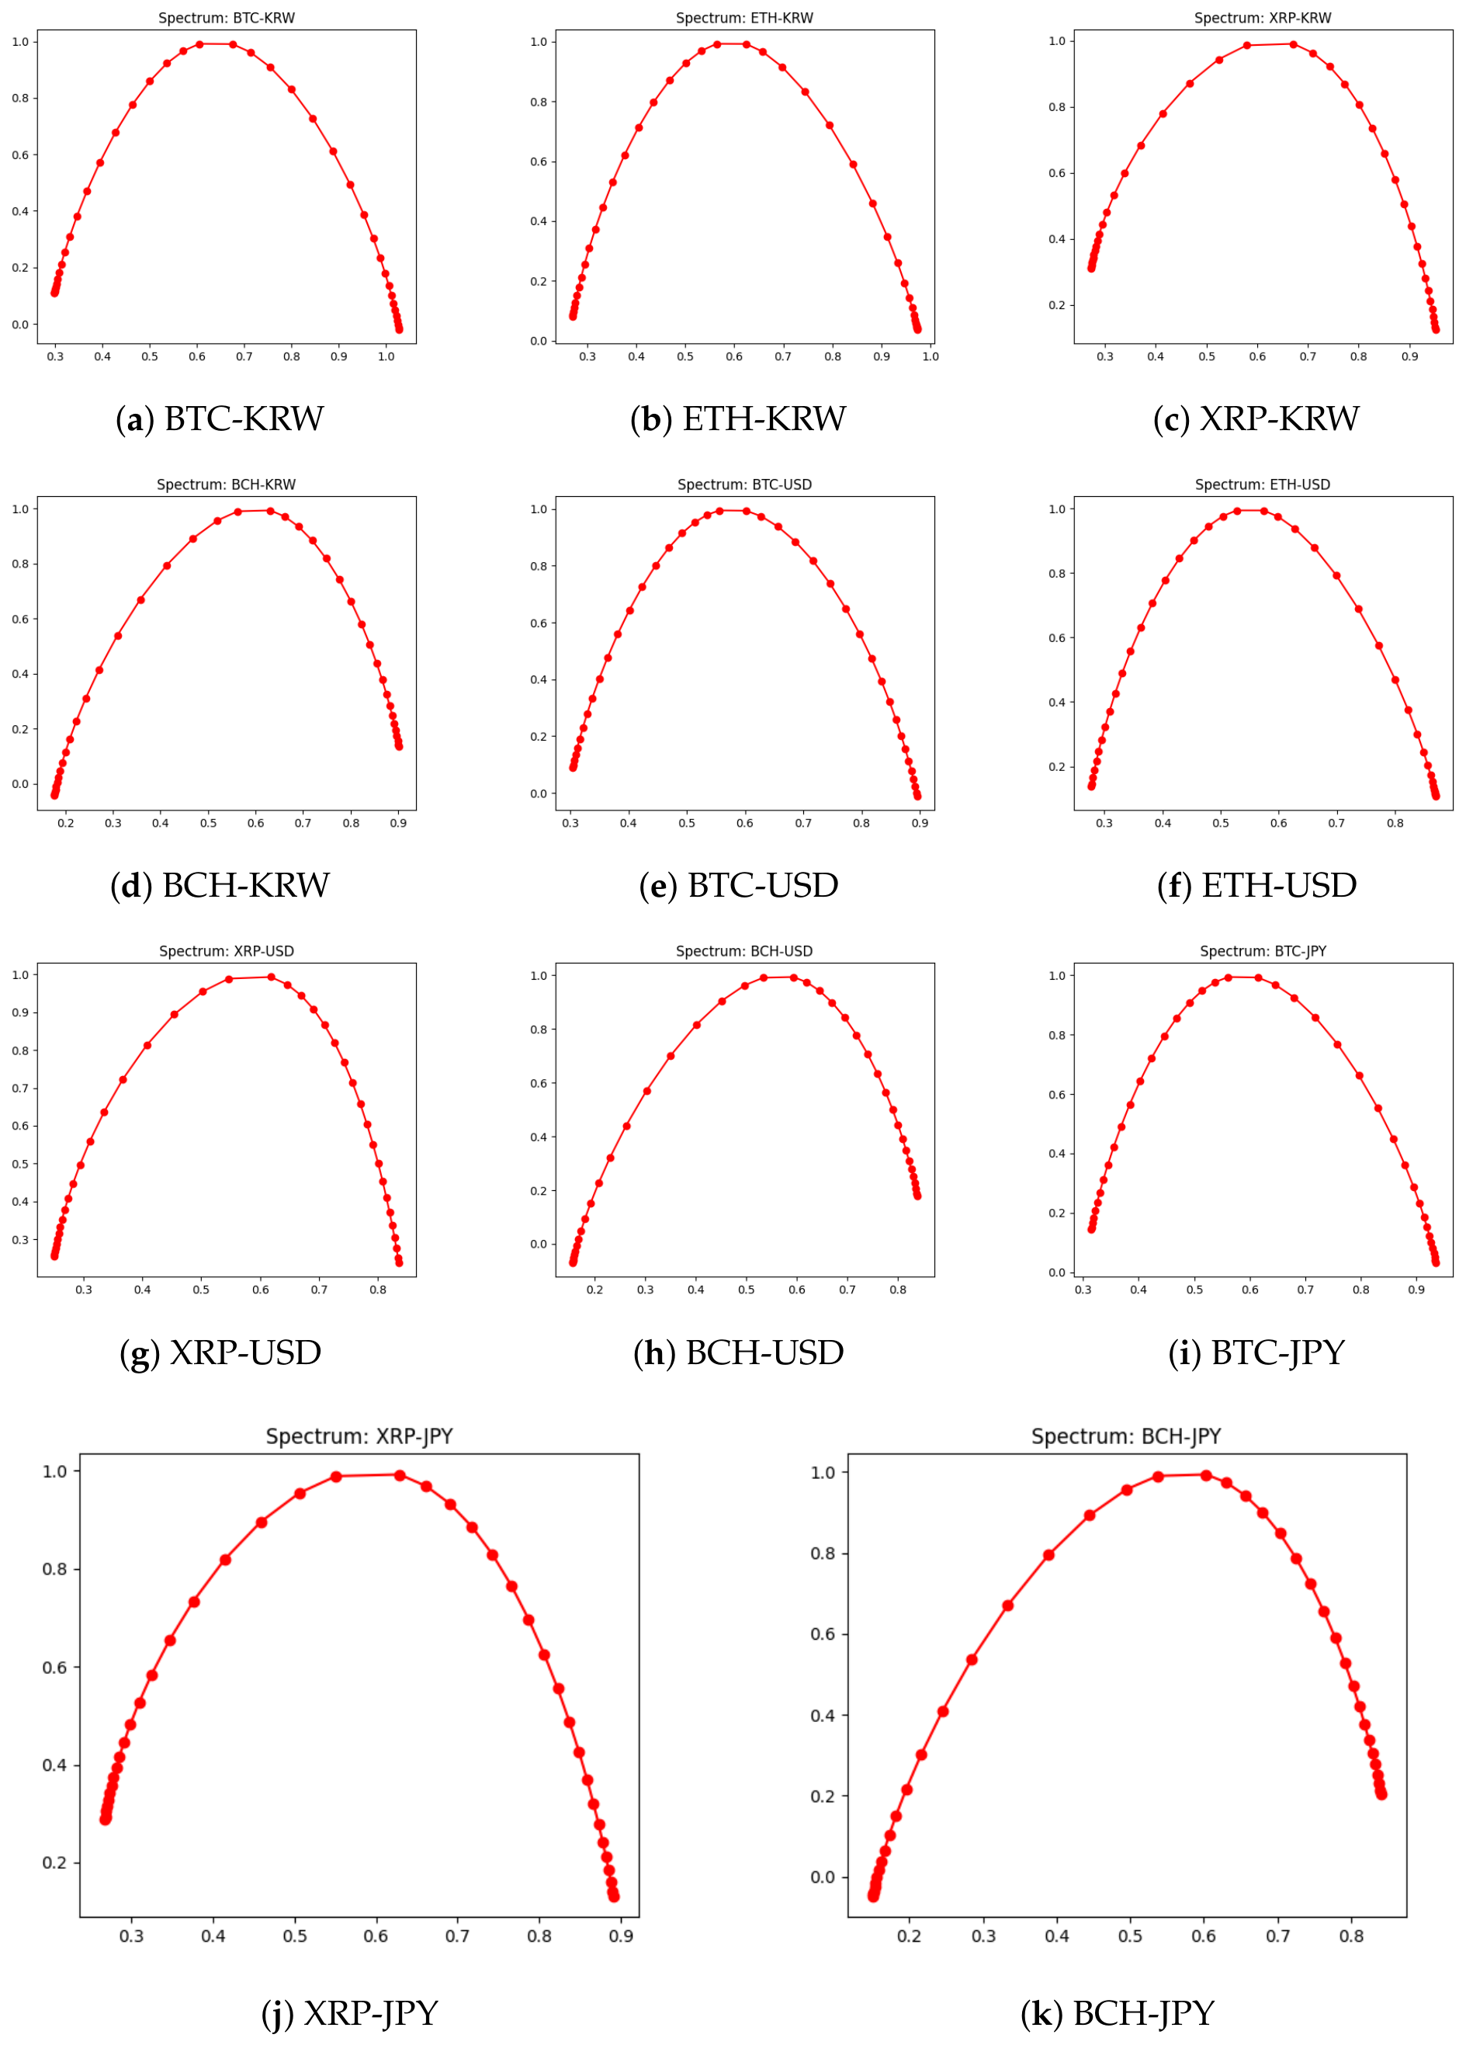
Furthermore, the multifractal spectra
presented in
Figure 3 display a characteristic bell-shaped curve for all examined assets. The width of these spectra,
, serves as our primary proxy for market inefficiency. The wide and often asymmetric shape of the spectra signifies substantial structural complexity and a broad distribution of scaling exponents. Such a wide spectrum suggests that the market is highly sensitive to both small noise and large idiosyncratic volatility shocks, which leads to a deviation from the ideal efficient state. Detailed numerical results for the entire
q range, supporting these visual findings, are provided in
Table A4 of the
Appendix A.
Note that in the MF-DFA framework, corresponds to the conventional Hurst exponent and thus provides a natural benchmark for comparison with the traditional Simple Hurst estimator. In our data, the MF-DFA-based exhibits the closest agreement with the Simple Hurst measure, supporting that the inferred long-memory dynamics are not driven by a method-specific artifact. However, our main inefficiency proxy is the multifractal spectrum width , which requires the full MF-DFA scaling structure across q and cannot be obtained from a single-exponent approach such as Simple Hurst.
4.1.2. Phase-Randomized Surrogate Analysis
To further examine the source of the observed multifractality, we conduct a phase-randomized surrogate analysis following [
33]. For each asset, 99 surrogate series are generated by applying the fast Fourier transform (FFT) to the original return series, randomizing the phase components while preserving the amplitude spectrum, and then applying the inverse transform. This procedure removes the temporal dependence structure while preserving the distributional properties of the original series, including heavy-tailed behavior. If
is substantially larger than
, the observed multifractality can be mainly attributed to long-range dependence. By contrast, if
is close to
, heavy-tailed distributions are likely to be the dominant source.
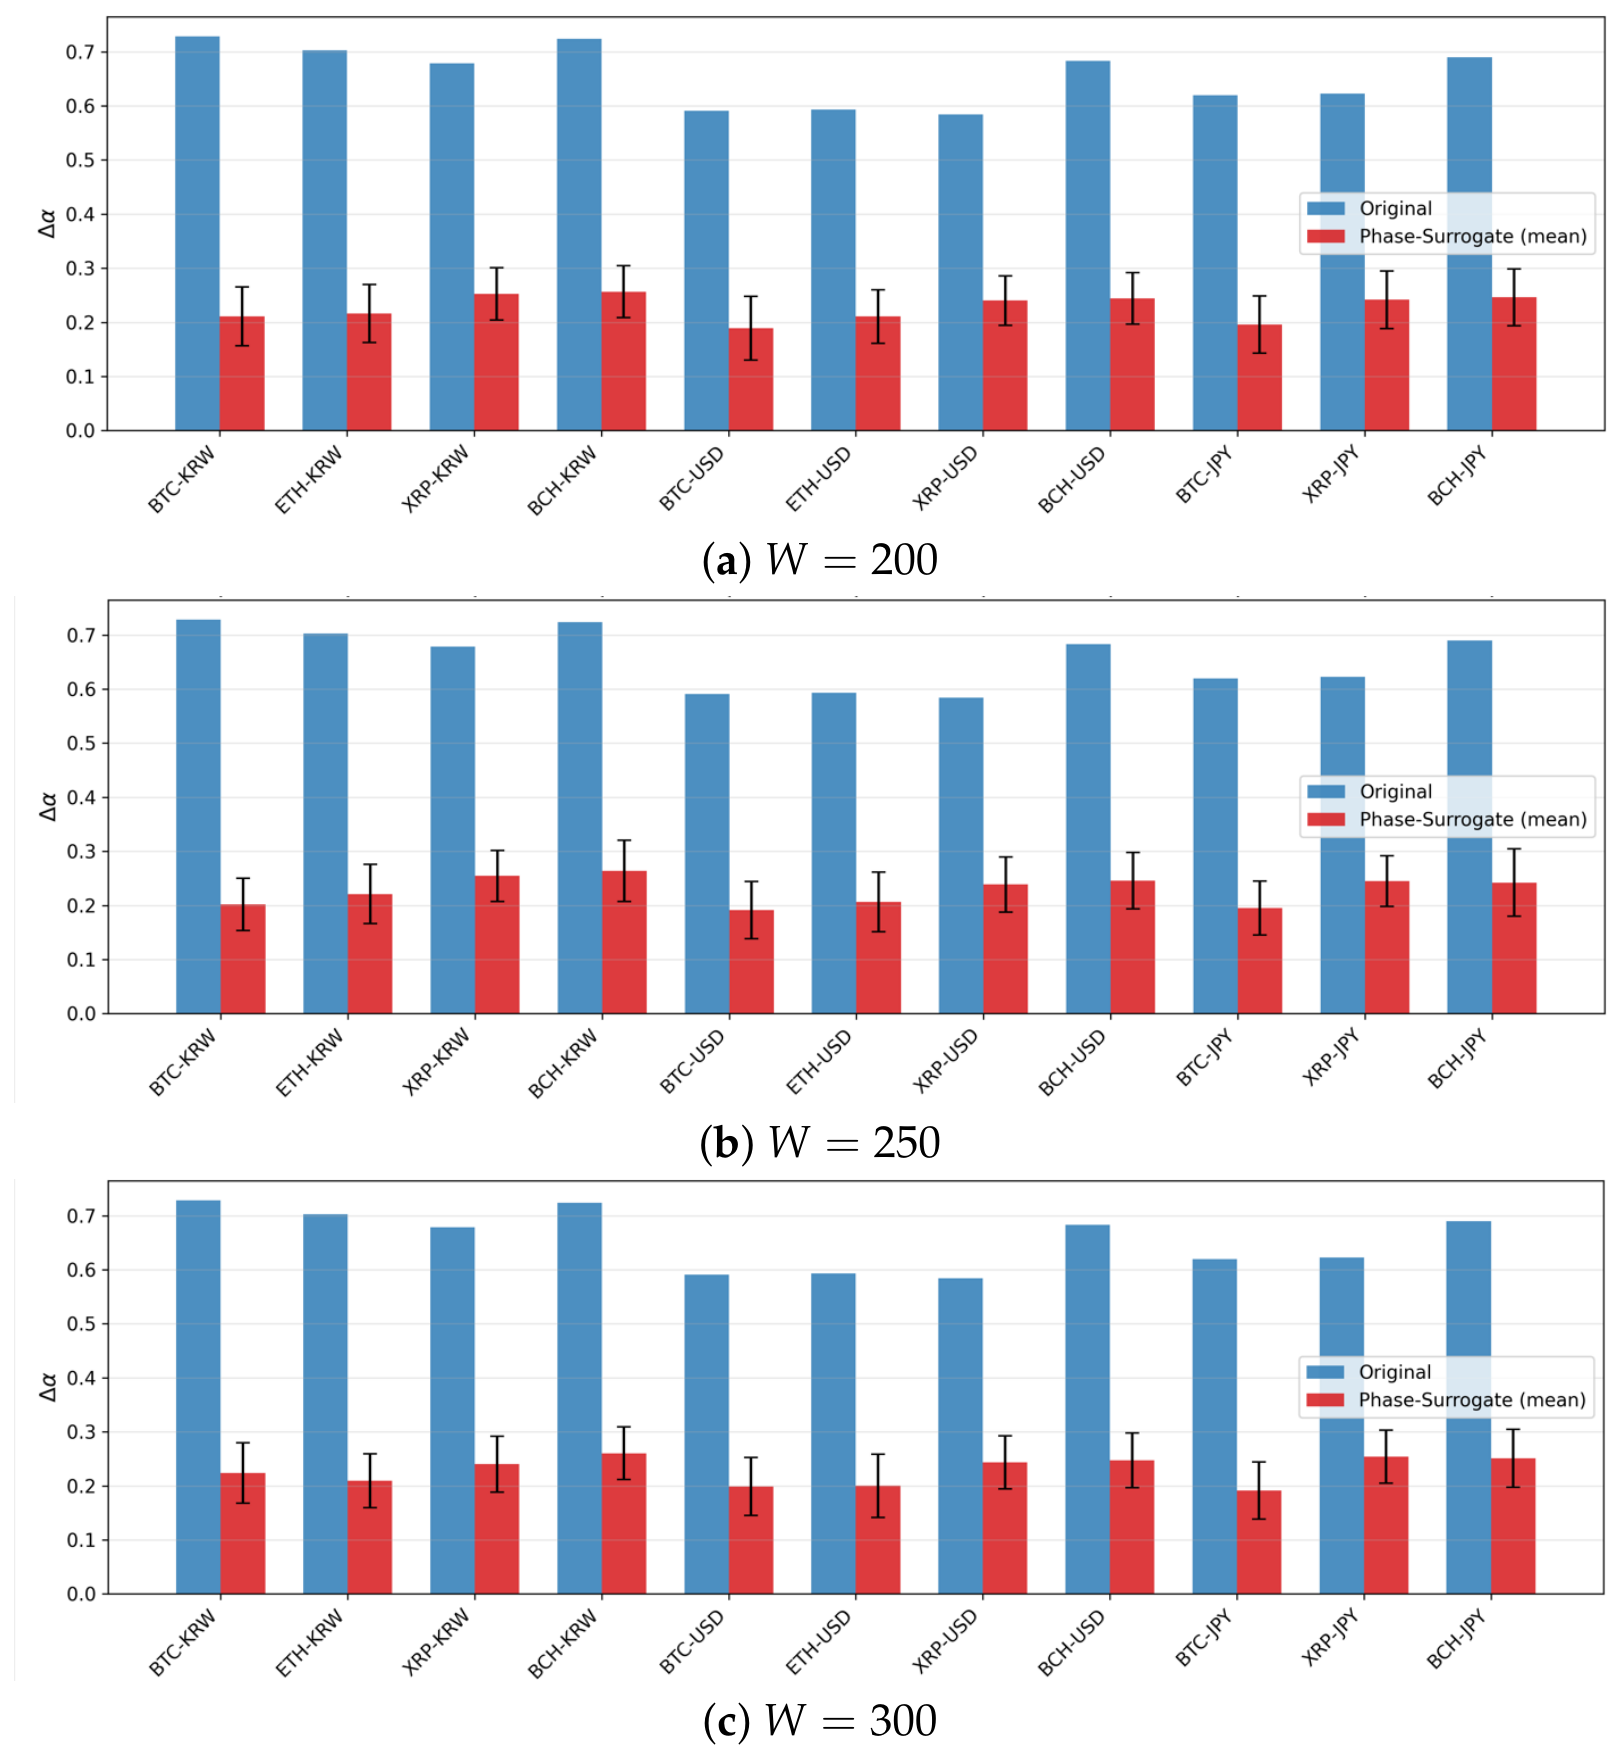
As shown in
Figure 4a–c, the original
values, shown by the blue bars, are substantially larger than the surrogate means, shown by the red bars, for all assets across the three window-size specifications.
Table A5 confirms this pattern quantitatively: the
z-scores range from 6.72 to 10.91, and the rank-based one-tailed
p-values are equal to 0.010 for all assets and all window sizes, which is the minimum attainable value with 99 surrogate series. These results indicate that the multifractality of cryptocurrency return series is driven primarily by long-range dependence rather than by heavy-tailed distributions alone. This conclusion remains robust across all examined window sizes.
4.1.3. The Rolling Window
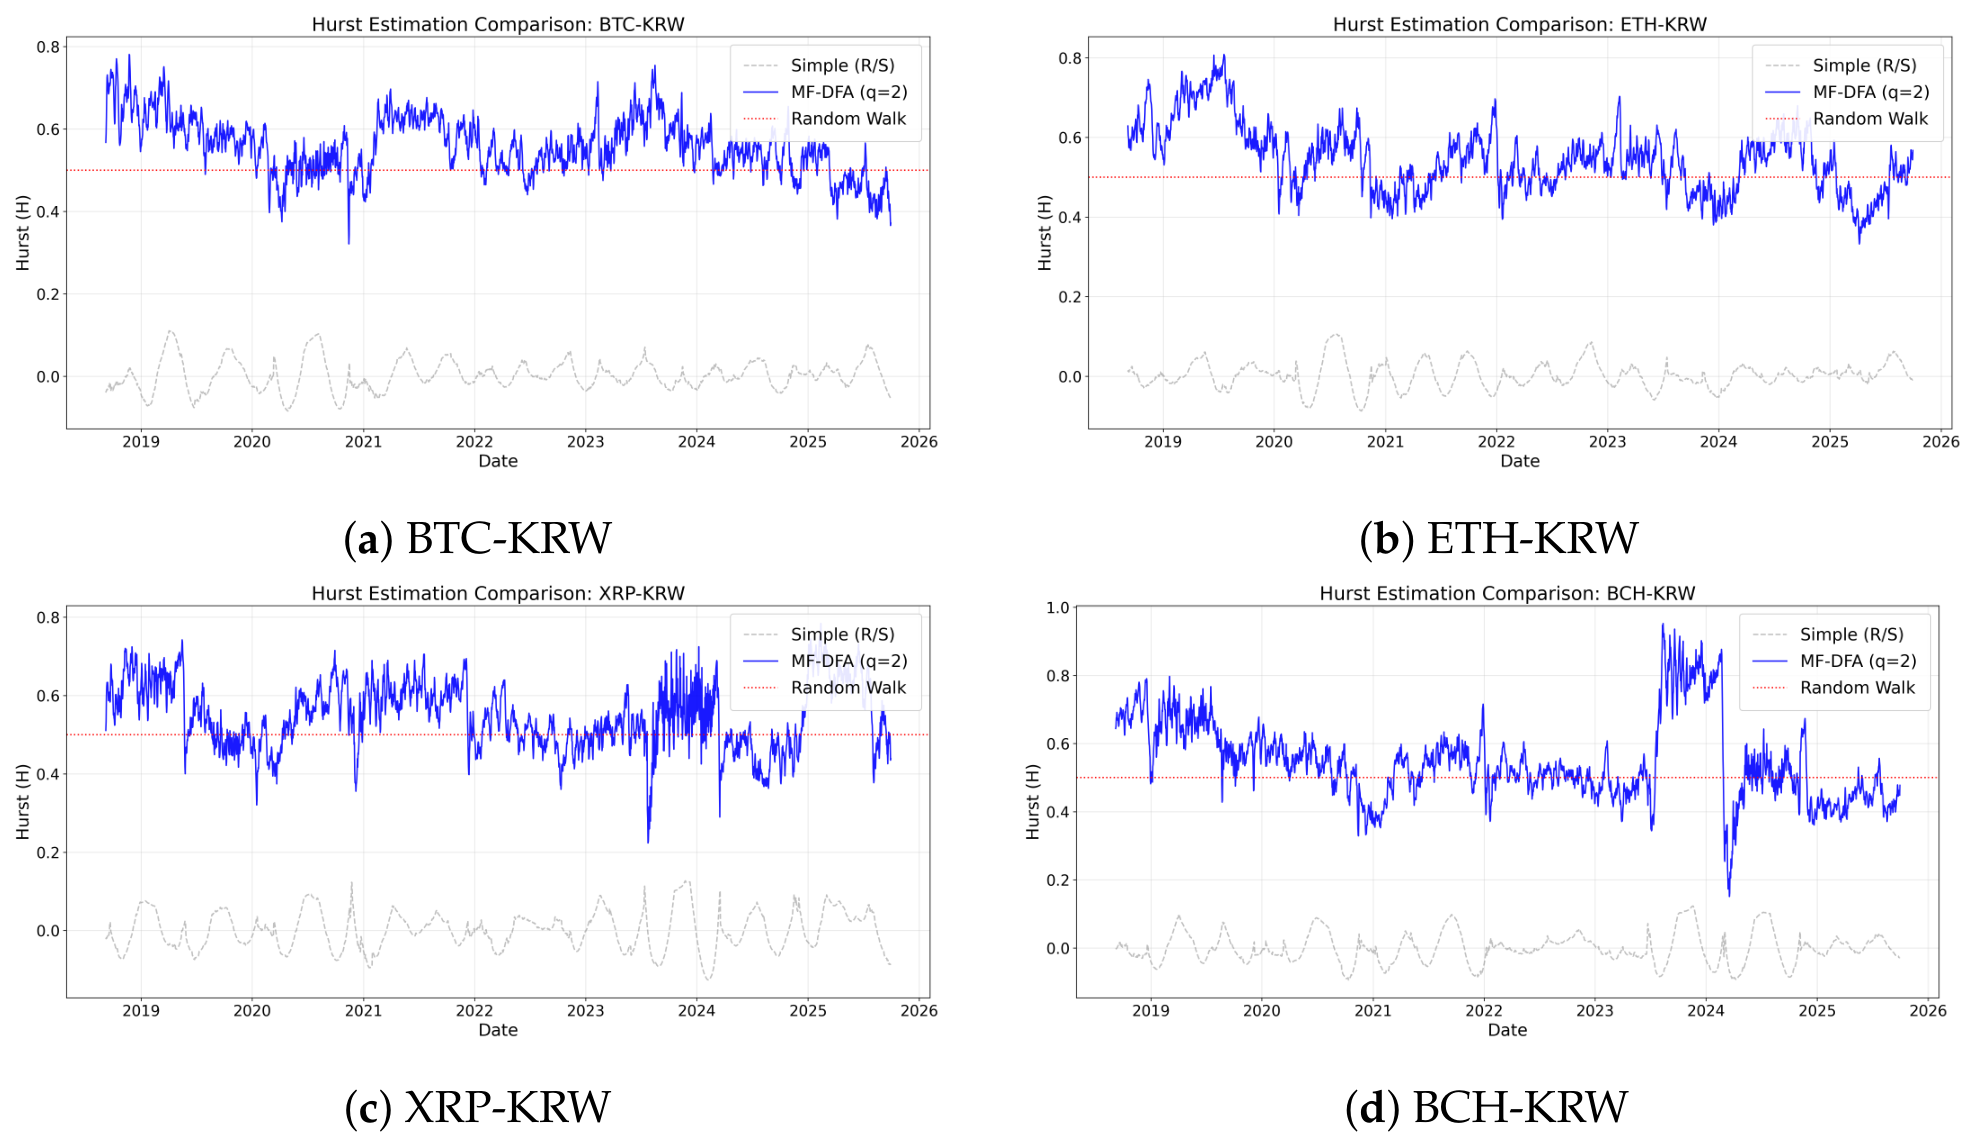
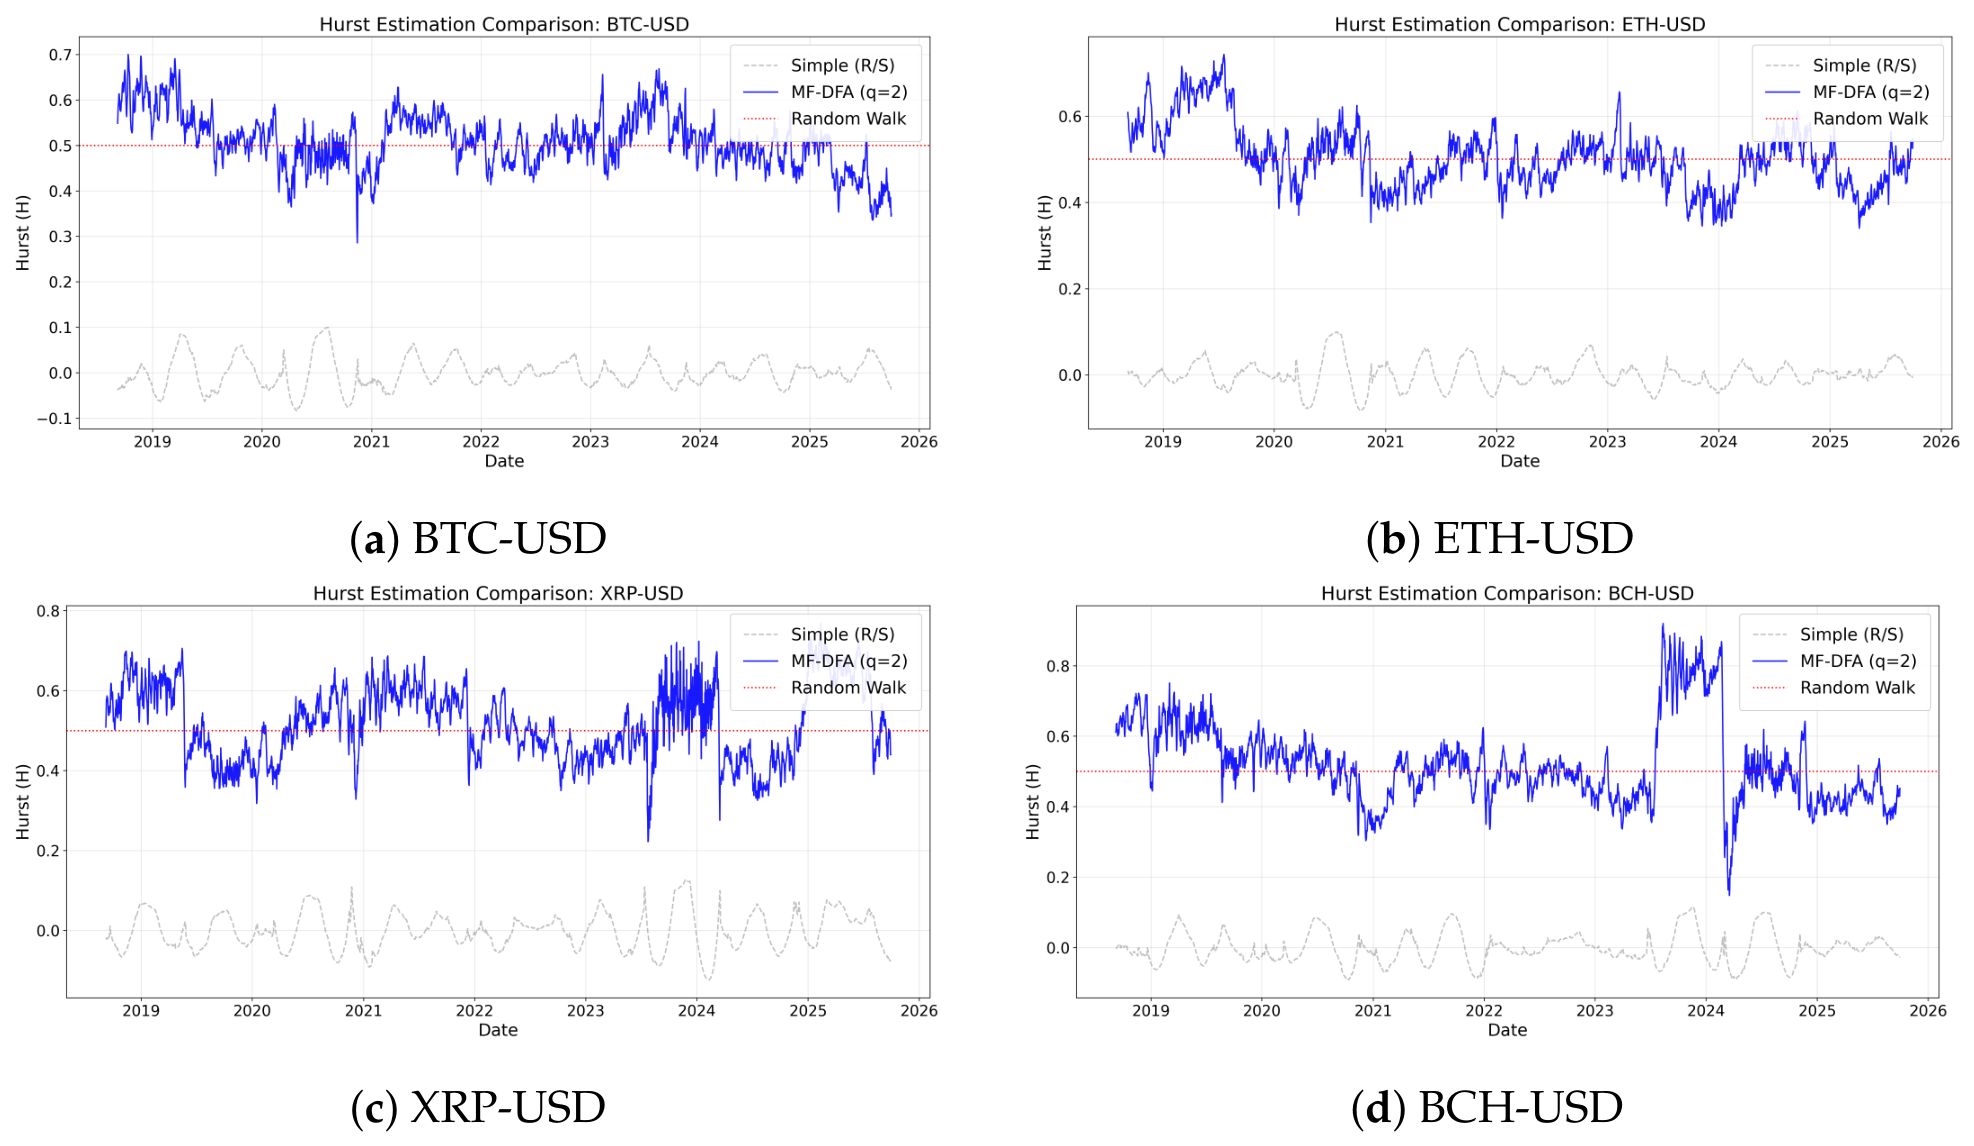
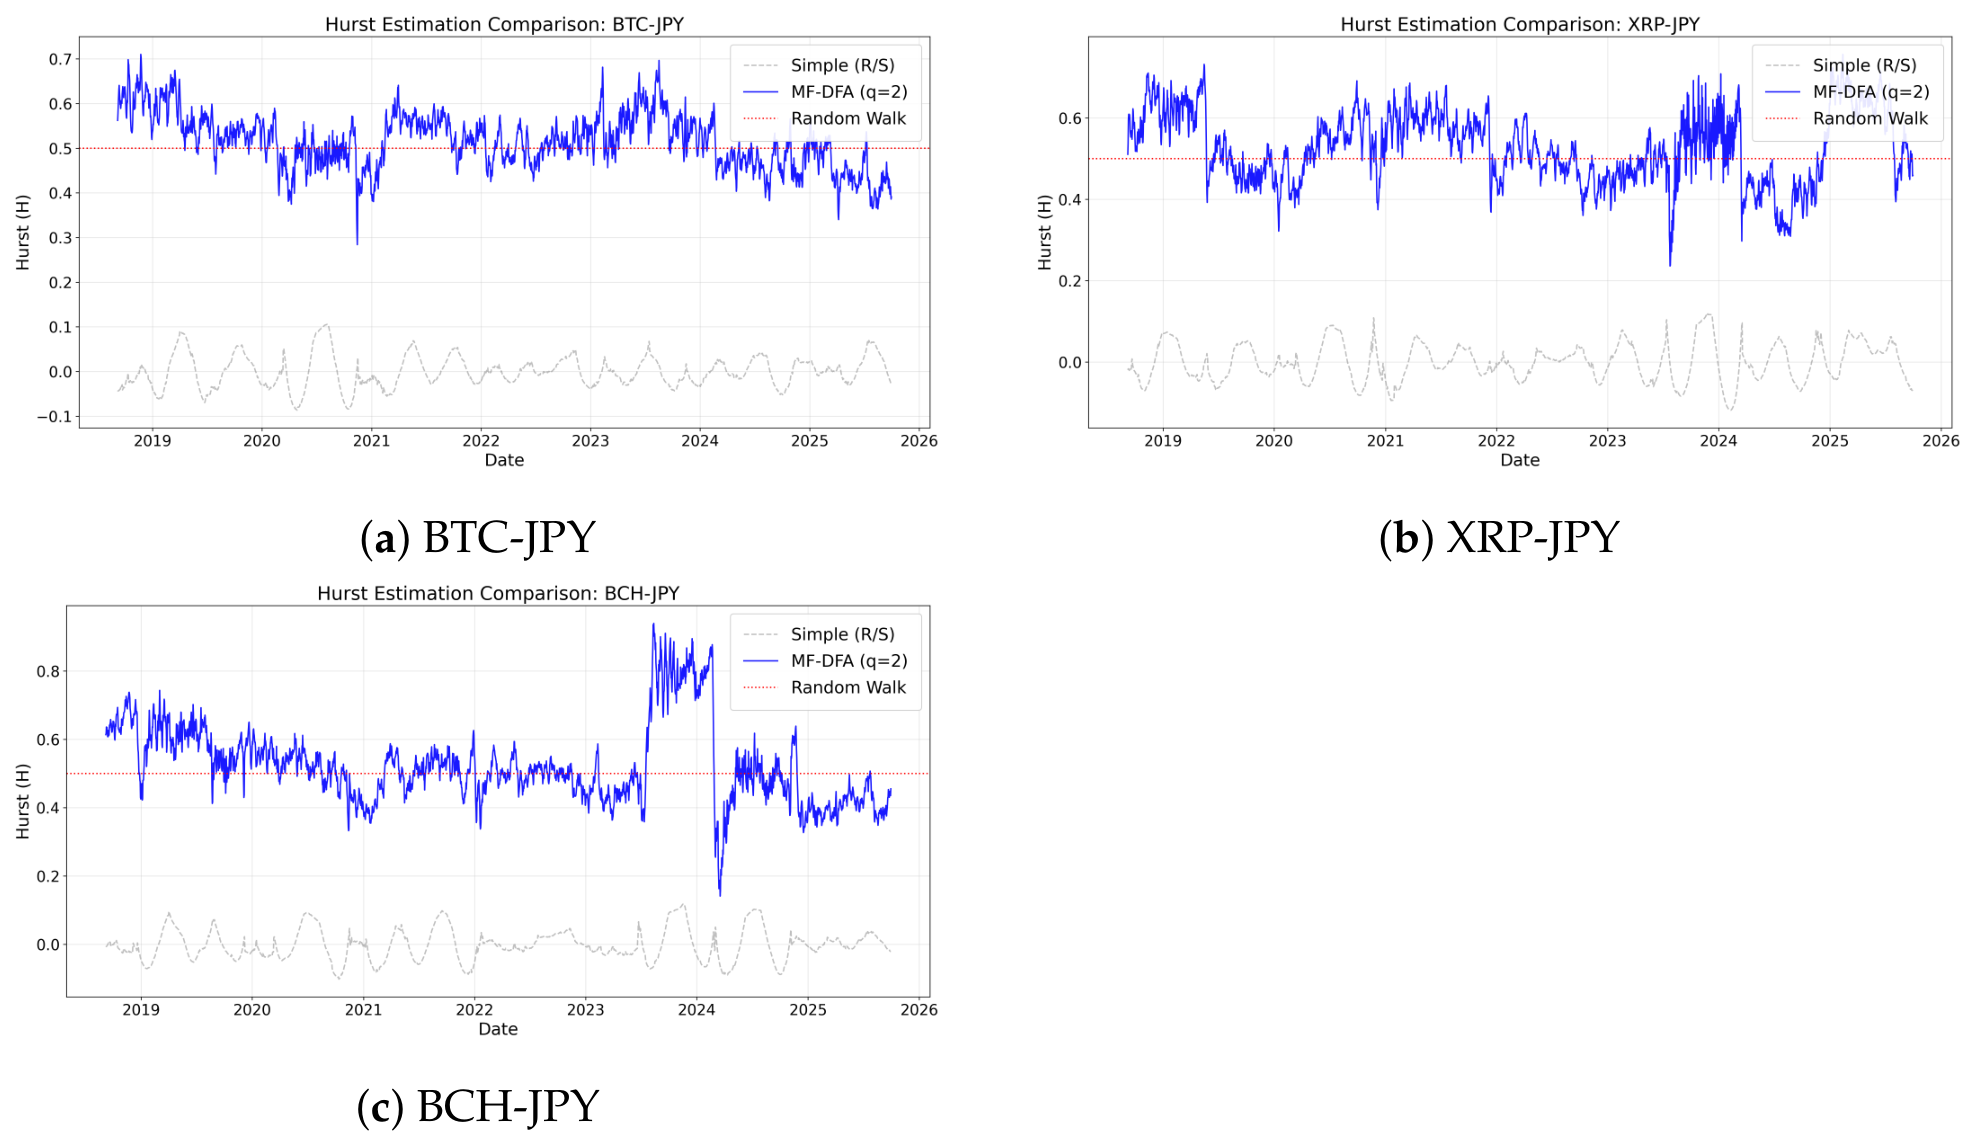
Figure 5,
Figure 6 and
Figure 7 present rolling Hurst estimation results for KRW-, USD-, and JPY-denominated cryptocurrency markets under a 250-day window—approximating one trading year and balancing estimation stability with responsiveness to time variation [
48].
Since in the MF-DFA framework corresponds to the conventional Hurst exponent, we report the rolling MF-DFA-based alongside a simple Hurst benchmark for comparison. Across crypto-fiat pairs, the estimates display substantial time variation around the random-walk benchmark , indicating that persistence dynamics are state-dependent rather than constant. Many series alternate between persistent and anti-persistent regimes, with the magnitude and timing of shifts differing across assets.
A notable feature is the similarity in rolling dynamics across fiat denominations for the same cryptocurrency. BTC-, XRP-, and BCH-based pairs show broadly comparable directional movements across KRW, USD, and JPY markets, suggesting that coin-specific shocks drive common persistence dynamics, though the amplitude of fluctuations differs across fiat markets, leaving room for local trading frictions and market segmentation.
These rolling results provide an intuitive picture of time-varying persistence, but our primary market inefficiency proxy is the rolling multifractal spectrum width , computed from the full MF-DFA scaling across q. Whereas captures persistence at , summarizes the broader degree of multifractality and scaling heterogeneity.
Having established that market efficiency exhibits significant time-varying characteristics via the rolling MF-DFA approach, we now investigate the dynamic interdependence of these efficiency metrics across different markets. While standard correlation analyses focus on price returns (market integration), our study aims to determine whether the quality of markets—specifically their informational efficiency—evolves synchronously.
To achieve this, we employ the DCC-GARCH model using the time series of rolling spectrum widths () as input variables. This approach allows us to quantify the efficiency correlation between domestic (KRW) and global (USD, JPY) markets. High correlations in suggest that markets share structural maturation or deterioration due to global factors. Conversely, low correlations imply that local idiosyncratic factors, such as the Kimchi Premium or specific national regulations, drive the structural quality of individual markets, leading to efficiency decoupling.
4.1.4. Robustness to Rolling Window Size
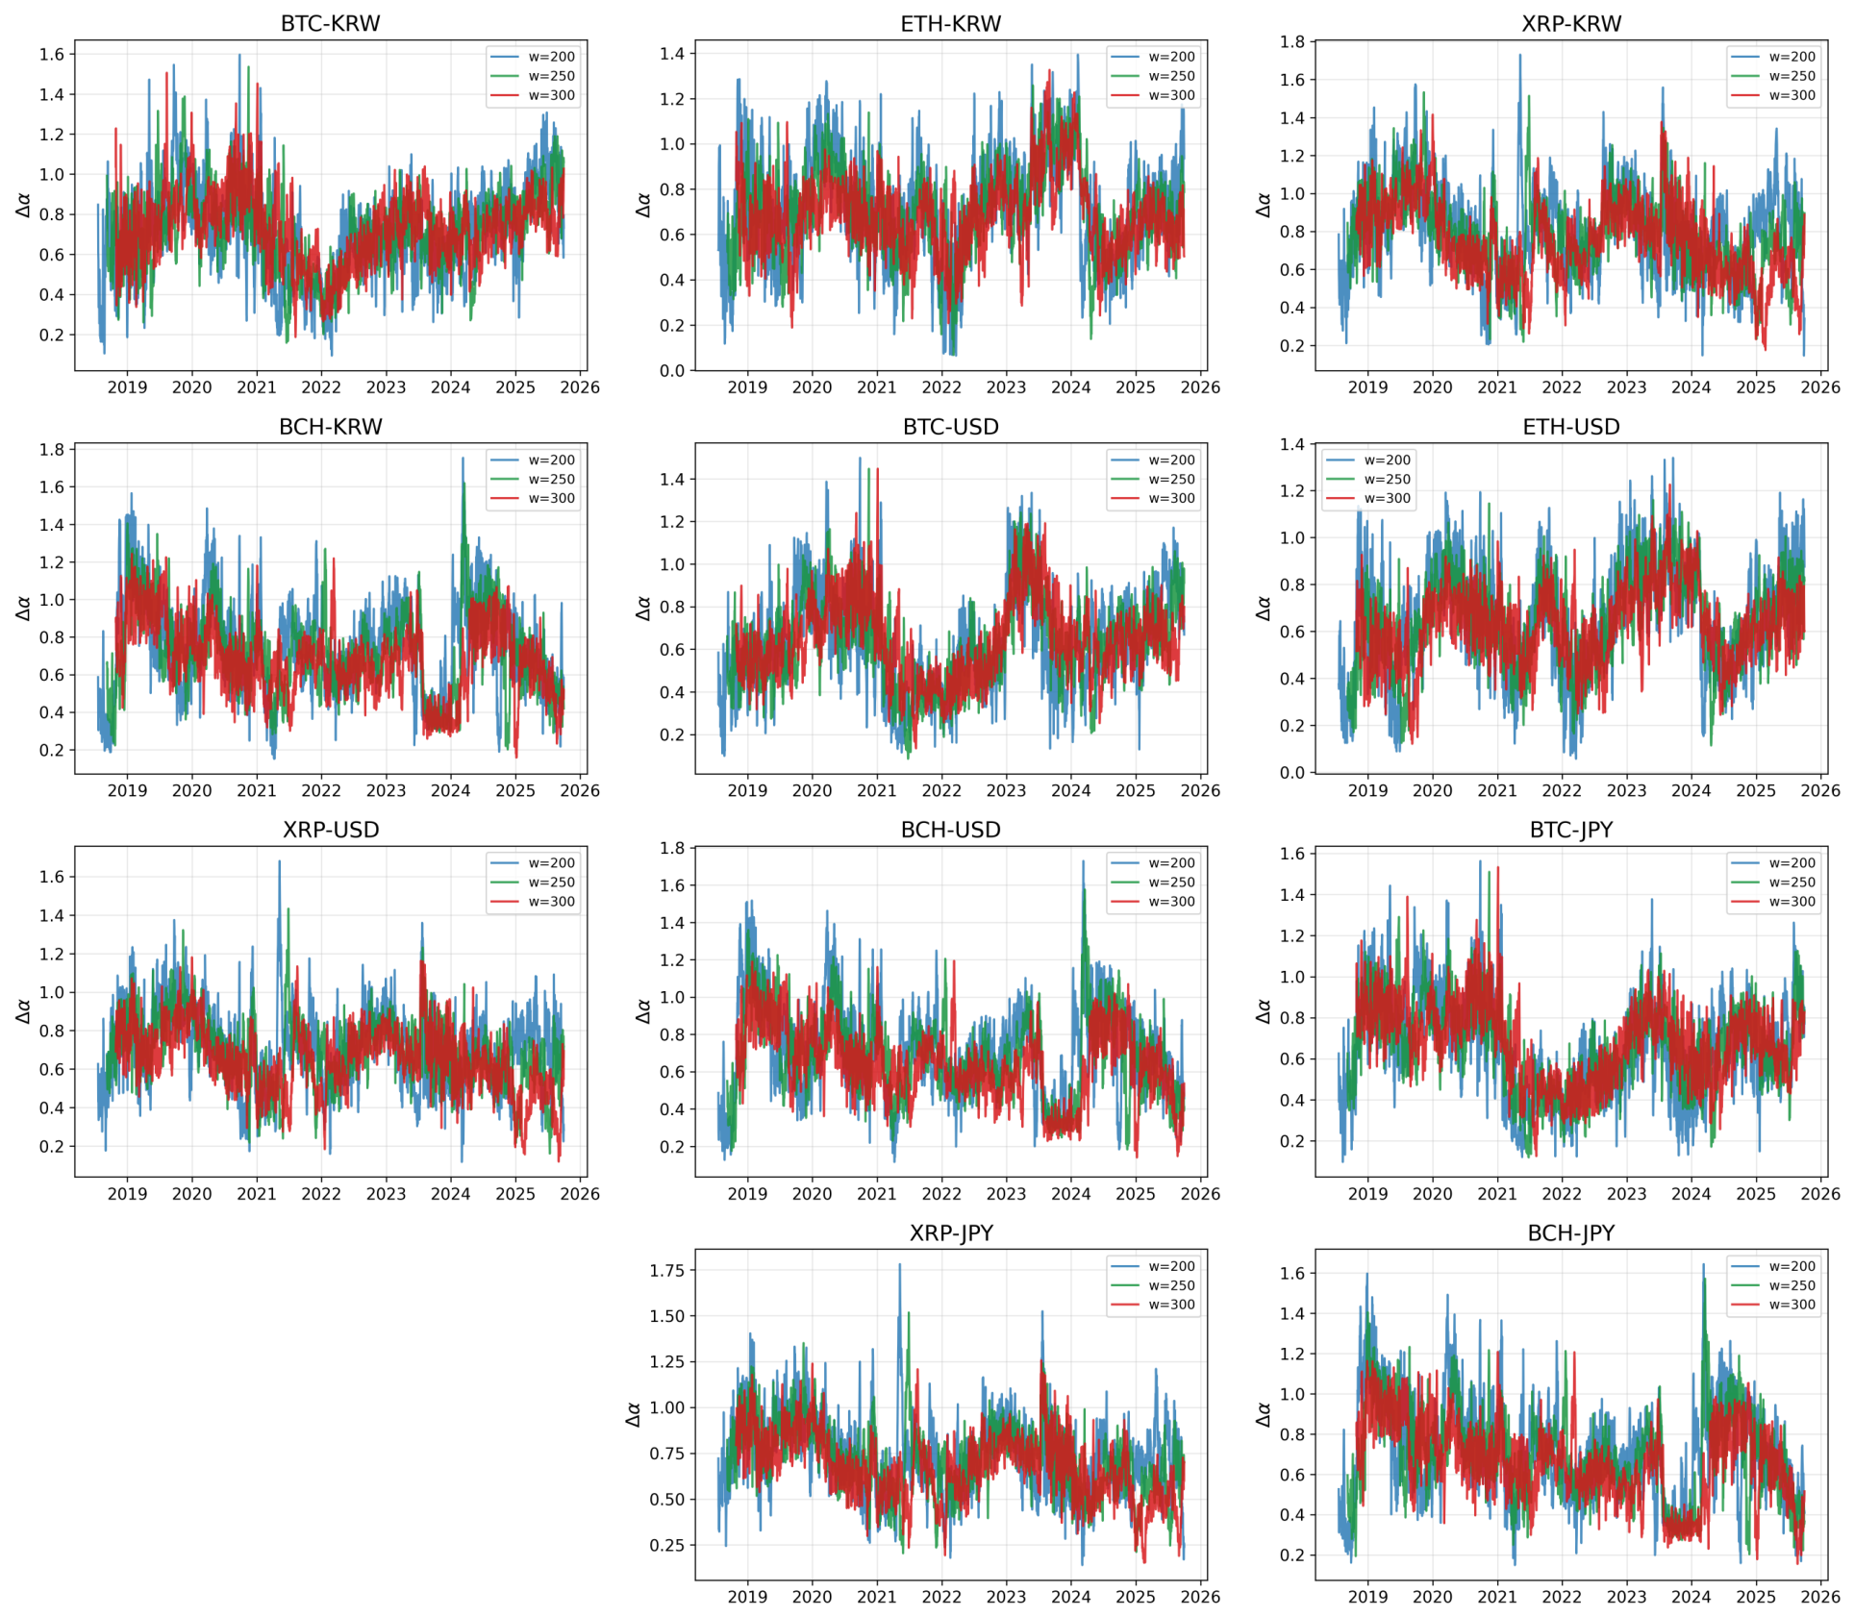
To assess whether the time-varying patterns of market efficiency are sensitive to the choice of rolling-window length, we re-estimate the MF-DFA procedure using
trading days.
Figure 8 presents the rolling
series for all eleven cryptocurrency–fiat pairs under the three window-size specifications.
The three specifications exhibit close co-movement throughout the sample period for every asset. The shorter window, , tends to generate somewhat more volatile estimates because each rolling estimate is based on fewer observations, whereas the longer windows, and , produce relatively smoother trajectories. Nevertheless, the main features of the efficiency dynamics, including the decline in around the 2021 cryptocurrency market cycle, the subsequent recovery, and the cross-market heterogeneity among KRW-, USD-, and JPY-denominated pairs, remain broadly consistent across all three window sizes. These results suggest that the main findings on time-varying market efficiency are not materially sensitive to the rolling-window specification, providing additional support for the robustness of the efficiency dynamics documented in the main analysis.
Subsample Analysis: Pre-, During-, and Post-COVID-19 Periods
To further assess the stability of the empirical findings across structurally distinct market conditions, we re-estimate the MF-DFA procedure separately for three subsamples: the pre-COVID-19 period (January 2018–February 2020), the during-COVID-19 period (March 2020–December 2021, encompassing the COVID-19 shock and the 2021 bull market), and the post-COVID-19 period (January 2022–September 2025, covering the crypto winter and the subsequent recovery). The rolling-window size is fixed at throughout, consistent with the main analysis.
Table 2 reports the full-period
estimates for each subsample. Several patterns are noteworthy. First,
values are generally higher in the pre- and during-COVID-19 periods than in the post-COVID-19 period for most assets, suggesting a relative improvement in market efficiency in the more recent subsample. This pattern is broadly consistent with the growing institutionalization and regulatory development of cryptocurrency markets from 2022 onward. Second, BTC-based pairs (BTC-KRW, BTC-USD, and BTC-JPY) exhibit relatively elevated
values in the during-COVID-19 subsample, reflecting the heightened complexity and irregular dynamics associated with the COVID-19 shock and the subsequent 2021 price surge. Third, the post-COVID-19 subsample yields the lowest
values for most assets and markets, indicating a modest convergence toward monofractality and greater efficiency in recent years. A notable exception is BCH-KRW, for which
is somewhat higher in the post-COVID-19 period than in the during-COVID-19 period, possibly reflecting asset-specific volatility dynamics of Bitcoin Cash in the Korean market. Nevertheless,
remains positive across all assets and subsamples, suggesting that multifractality persists throughout the sample period.
Overall, the subsample results are broadly consistent with the full-period findings and support the view that the time-varying efficiency dynamics documented in the main analysis are not confined to a specific market episode, but reflect a more general structural feature of cryptocurrency markets across different phases.
4.1.5. Lead-Lag Robustness Check
To address the possibility that lead–lag dependence may arise from exchange-specific local closing times in Korea, the United States, and Japan, we conduct a lagged cross-correlation analysis with trading days prior to the main DCC–GARCH estimation. For each cross-market pair, we compute , where indicates that Series A leads Series B by k trading days, denotes contemporaneous correlation, and indicates that Series B leads Series A.
Table 3 reports the lead–lag cross-correlation results. For all ten cross-market pairs, the contemporaneous correlation at
is the largest in absolute value. These correlations range from 0.9510 for BTC-USD/BTC-KRW to 0.9869 for XRP-USD/XRP-JPY, indicating strong same-day dependence across markets. In contrast, the lagged correlations at
are substantially smaller, remaining below 0.10 in absolute value for all pairs. Thus, the maximum absolute correlation occurs at
without exception.
These findings suggest that one-day lead–lag effects are negligible for the cryptocurrency pairs examined in this study. Accordingly, the results support the use of the contemporaneous DCC–GARCH framework in the main analysis.
We acknowledge that a more complete treatment would require reconstructing returns using a common UTC-based cutoff rather than exchange-specific local closing times. However, given the continuous 24 h nature of cryptocurrency trading and the near-zero lagged correlations documented above, exchange-specific local closing times are unlikely to materially affect the main conclusions.
4.2. DCC-GARCH
To examine the dynamic interdependence among cryptocurrency markets, we estimate the DCC–GARCH(1,1) model. We conduct a comparative analysis across three dimensions: (i) return-based co-movements to capture short-term price integration, (ii) efficiency-based co-movements using MF-DFA (our primary methodology) to analyze long-term informational linkages, and (iii) efficiency-based co-movements using the simple Hurst exponent for robustness verification.
4.2.1. Return-Based Dynamic Correlations
This subsection applies the DCC-GARCH(1,1) model to examine the time-varying integration structure of cryptocurrency markets.
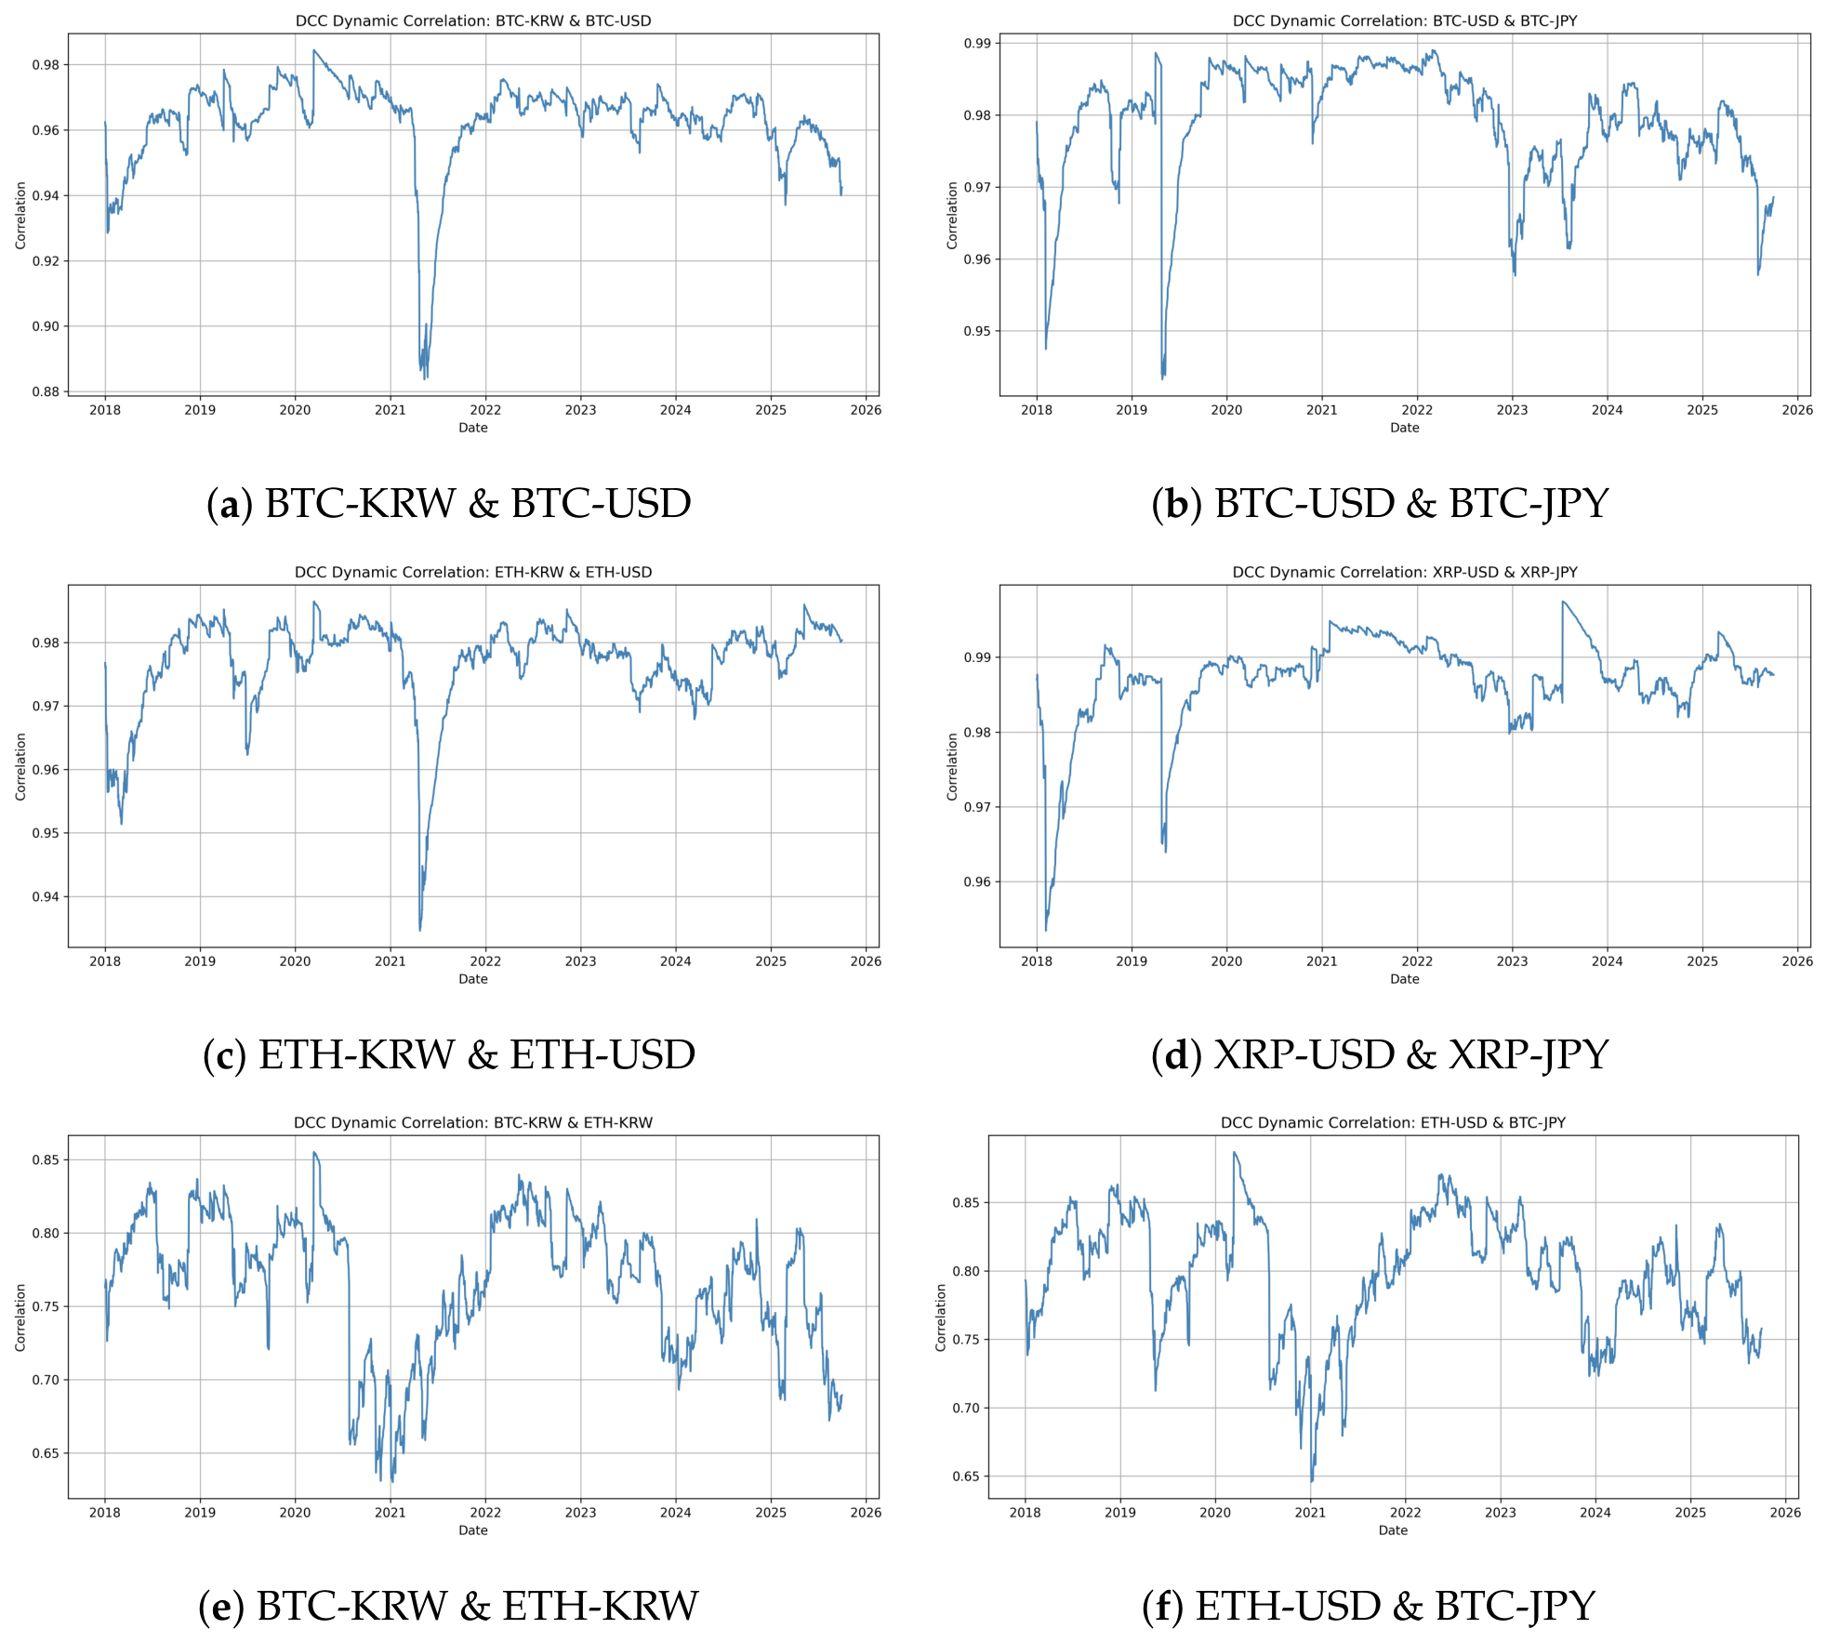
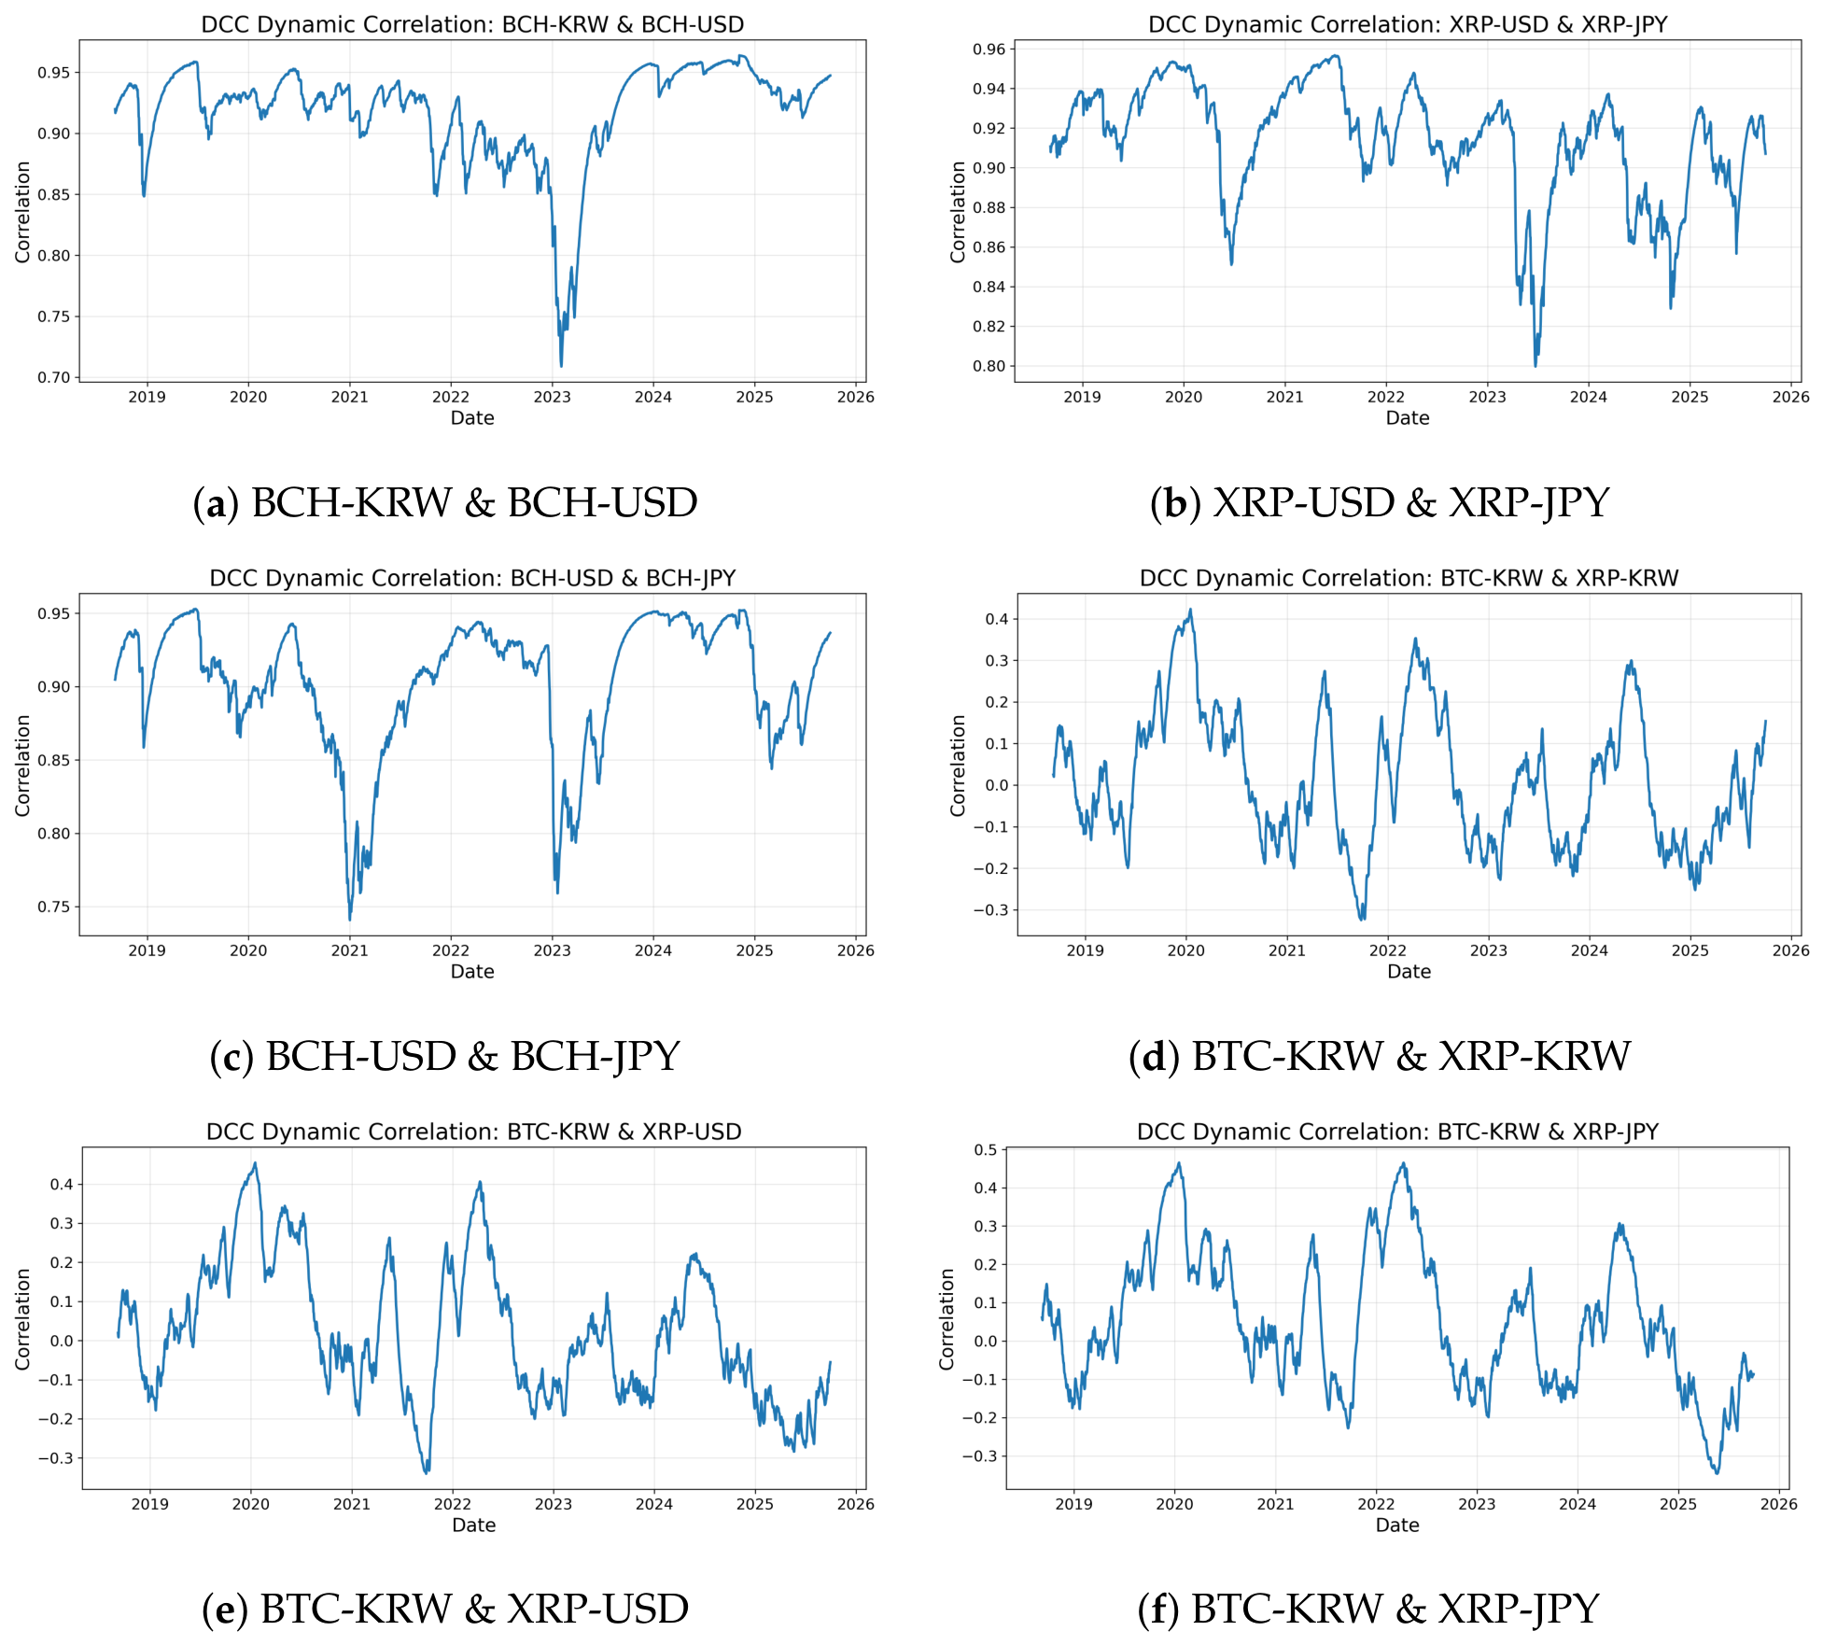
Figure 9 presents dynamic conditional correlation paths for six representative pairs, and
Table 4 summarizes their descriptive statistics.
Cross-currency correlations for the same asset remain exceptionally high throughout the sample period. The average dynamic conditional correlation between BTC-KRW and BTC-USD is 0.9624, while that between BTC-USD and BTC-JPY is 0.9791, with both series rarely falling below 0.95 and converging above 0.97 after 2018. These patterns suggest that Bitcoin returns are largely driven by a common global factor regardless of denomination. Cross-currency correlations for ETH and XRP are similarly high, though with asset-specific differences. The average ETH-KRW/ETH-USD correlation is 0.9768, with temporary declines followed by fast recoveries. The XRP-USD/XRP-JPY pair shows larger fluctuations at certain points despite a high average (0.9871), possibly reflecting asset-specific regulatory and legal uncertainties that temporarily affect cross-market synchronization.
Correlations between different assets within the same exchange display a distinct pattern. The average BTC-KRW/ETH-KRW correlation is 0.7667—clearly lower than cross-currency correlations—and exhibits wider variation, increasing during market upswings and adjusting during downturns. This suggests that cross-asset dependence is state-dependent and evolves across market regimes. Mixed pairs involving both asset and currency differences show intermediate characteristics; for example, the average ETH-USD/BTC-JPY correlation of 0.7977 reflects alternating periods of stable co-movement and greater fluctuation, indicating that asset-specific information processing influences synchronization.
A notable episode is the March 2020 market stress, during which dynamic correlations temporarily declined before recovering quickly, pointing to temporary deviations rather than structural fragmentation.
Overall, the return-based DCC results indicate two coexisting regimes: a high-integration regime in cross-currency pairs where correlations remain persistently high, and a state-dependent regime in cross-asset pairs where correlations vary across market phases and volatility environments.
These findings have direct implications for the interpretation of the Kimchi Premium. Even when price levels remain segmented across countries, volatility transmission and risk dynamics appear to be largely synchronized. Thus, persistent price differentials should not be viewed as evidence of informational isolation, but rather as a reflection of capital flow restrictions operating within an otherwise globally integrated risk structure.
These results are broadly consistent with Makarov and Schoar [
5], who show that a single global factor dominates daily Bitcoin return variation. However, high return integration does not imply efficiency integration: even when same-asset cross-fiat correlations approach unity, cross-asset efficiency correlations collapse to near zero. The lower DCC for XRP pairs aligns with Cheng [
49], while the high synchronization for BCH reflects its structural inheritance from Bitcoin as a hard fork.
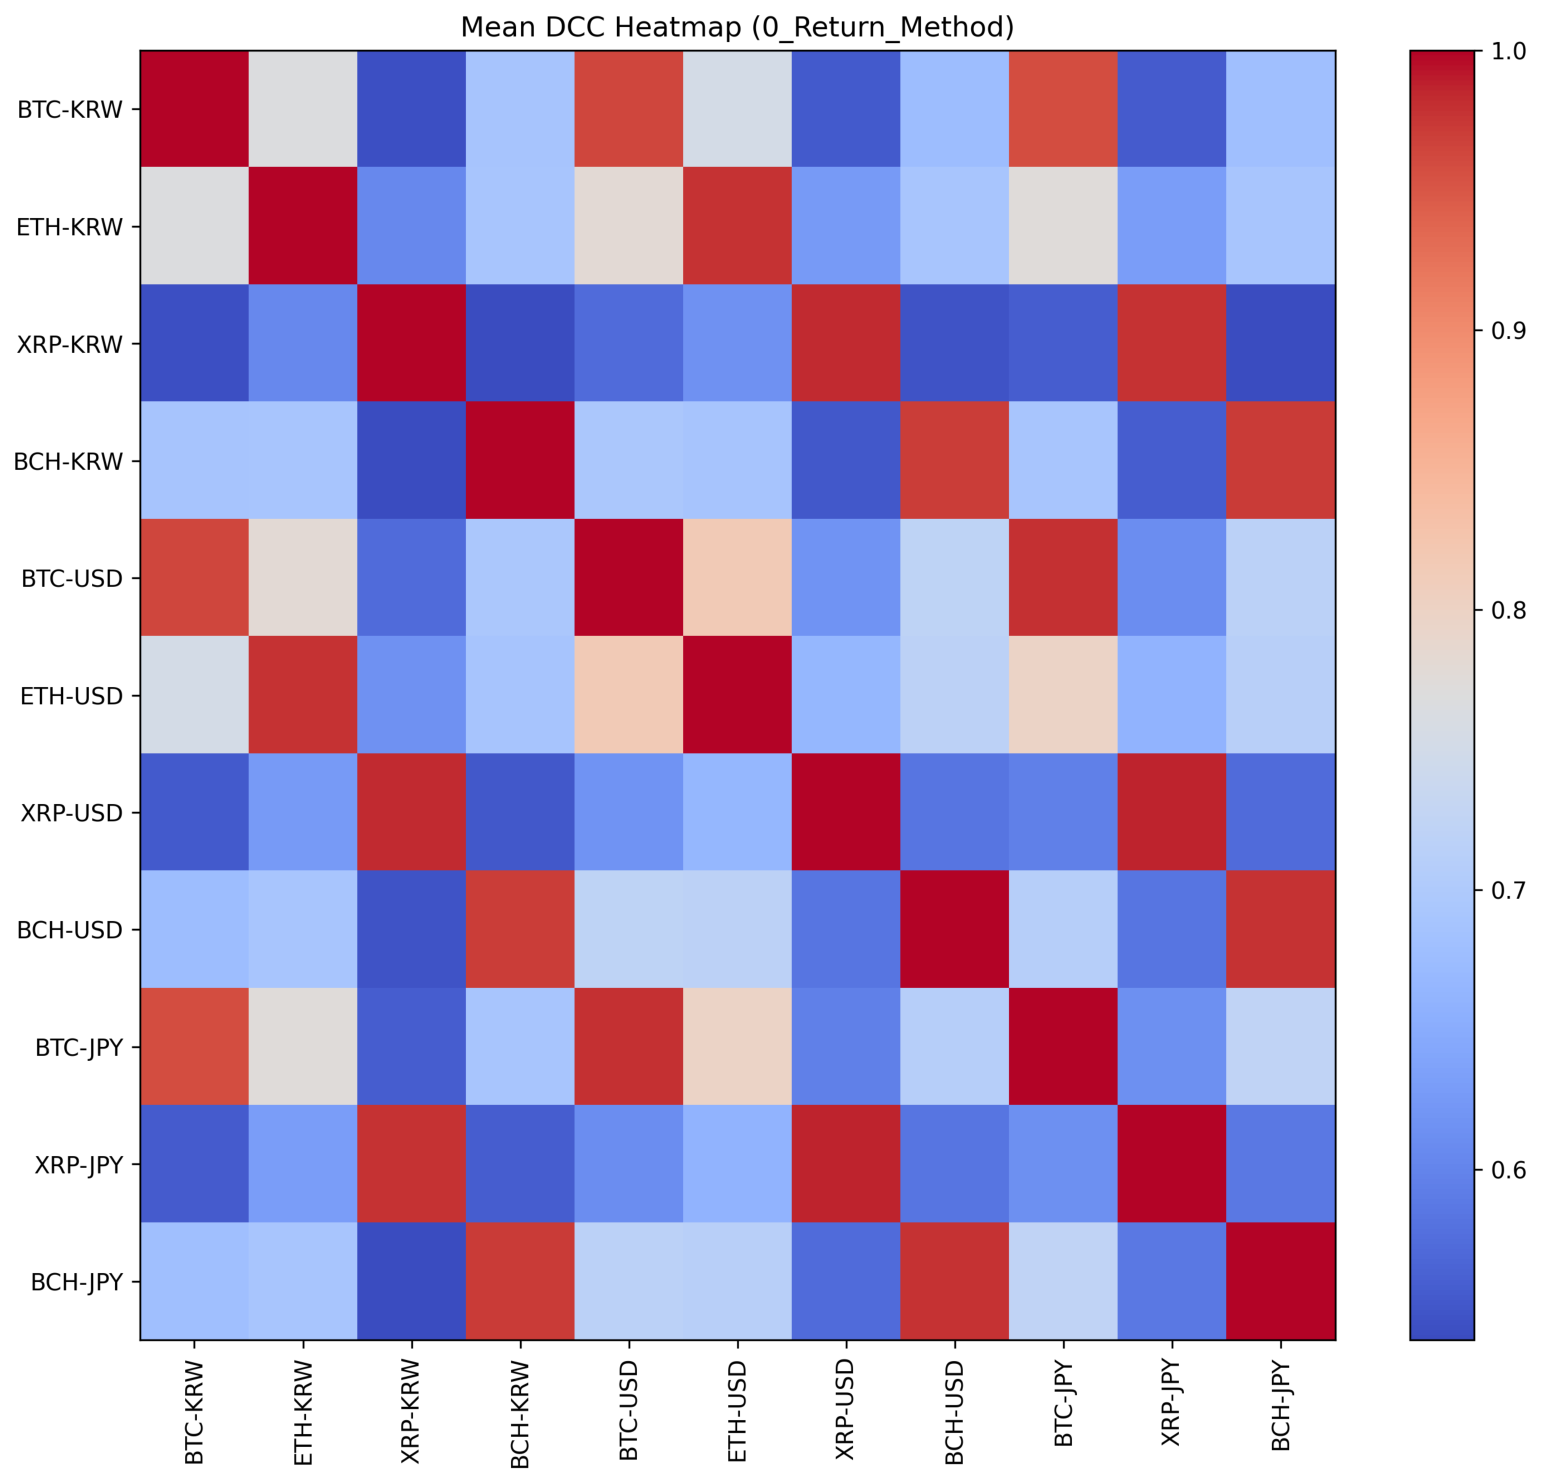
The first model utilizes daily simple returns of BTC, ETH, XRP, and BCH across KRW, USD, and JPY markets to assess the degree of global market integration.
Figure 10 visually displays the mean correlation matrix, while
Table 4 summarizes the statistical properties of the estimated dynamic correlations.
As shown in
Figure 10, the heatmap is dominated by dark red colors, indicating strong positive correlations across all pairs. Correlations between identical assets across different fiat currencies are near unity (e.g., BTC-USD/BTC-JPY: 0.9791; BTC-KRW/BTC-USD: 0.9624), confirming that the Law of One Price holds strongly as arbitrageurs rapidly eliminate price discrepancies. Cross-asset correlations are also remarkably high (ETH-USD/BTC-JPY: 0.7977), suggesting that the market is driven by a single dominant factor, severely limiting portfolio diversification. High kurtosis and Jarque–Bera statistics further indicate that extreme co-movements occur more frequently than under normal market conditions.
4.2.2. Efficiency-Based Dynamic Correlations (MF-DFA)
The second model investigates market efficiency synchronization by applying DCC–GARCH to the rolling multifractal spectrum widths
estimated via MF-DFA. We first confirm multifractality in each return series: as reported in
Table A4, the generalized Hurst exponents
exhibit pronounced
q-dependence and decline substantially as
q increases (e.g., BTC-KRW:
to
), supporting the use of
as a robust proxy for market inefficiency.
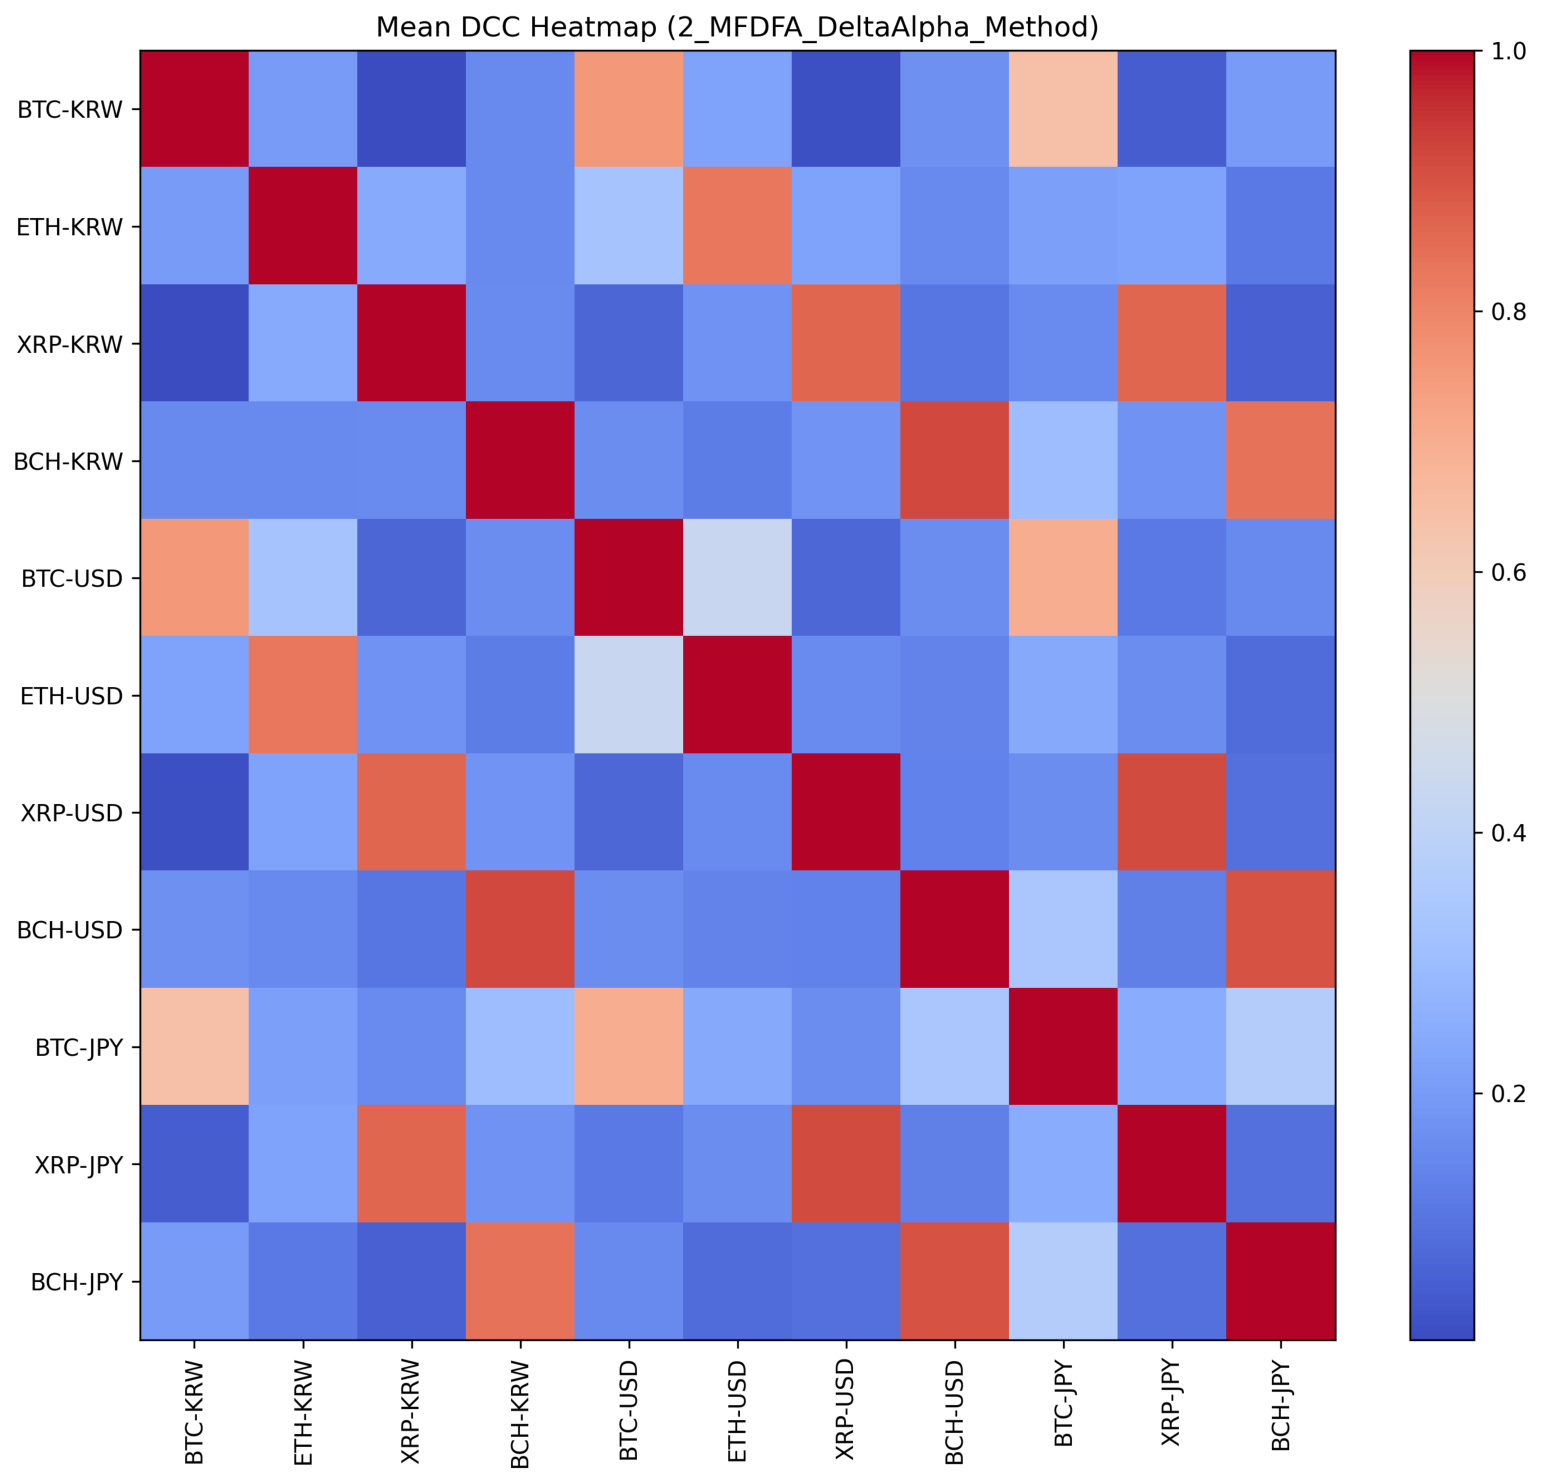
Figure 11 and
Table 5 reveal an efficiency integration structure that differs markedly from return-based findings. Unlike price returns where global integration is dominant, efficiency correlations are more heterogeneous. Same-asset cross-fiat pairs exhibit extremely high synchronization; BCH-KRW and BCH-USD show a mean correlation of 0.9175, while XRP-USD and XRP-JPY show 0.9137, suggesting that asset-specific structural complexity is globally synchronized, with efficiency shocks manifesting almost simultaneously across international counterparts.
In sharp contrast, cross-asset efficiency correlations are remarkably low even within the same domestic exchange—BTC-KRW and XRP-KRW is nearly zero (0.0105), and BTC-KRW to XRP-JPY remains similarly low (0.0504). This indicates that while cryptocurrencies may share price trends, their underlying information processing speeds are governed by idiosyncratic, asset-specific factors: arbitrage enforces global price parity, but the structural quality of each market is determined by local factors such as liquidity and sentiment, affecting assets asymmetrically.
Among the three assets, BTC exhibits the narrowest multifractal spectrum and serves as the efficiency benchmark. XRP deviates most sharply, driven by asset-specific regulatory risk—most notably the SEC lawsuit—while BCH, as a Bitcoin hard fork, displays high efficiency synchronization across fiat markets (mean DCC: 0.9175). Investors should treat XRP as structurally distinct from BTC, while BCH offers limited efficiency-based diversification.
Statistical robustness is confirmed by Jarque–Bera and ADF tests in
Table 5, justifying the use of the DCC-GARCH framework.
4.2.3. Robustness Check: Comparison with Simple Hurst
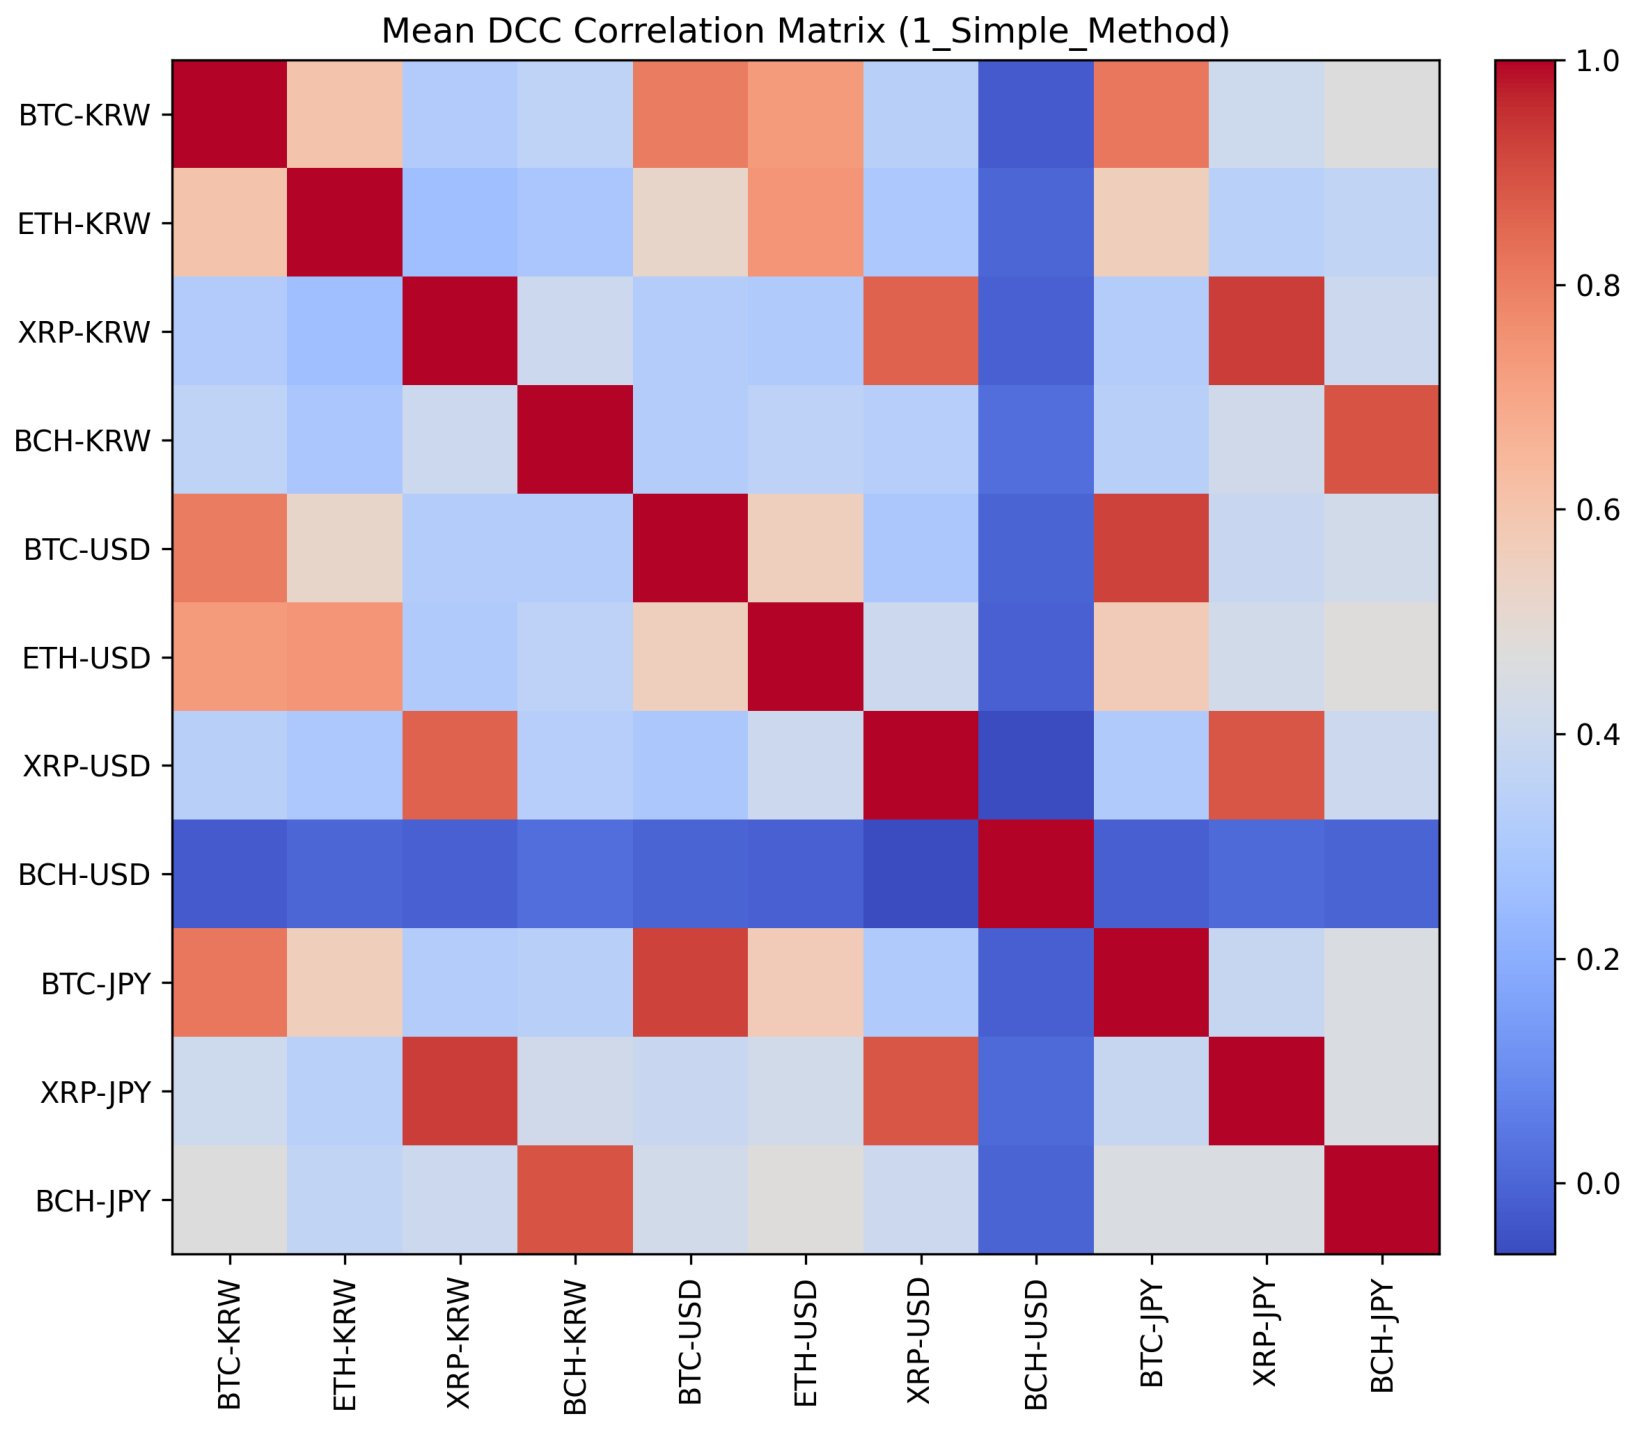
To assess robustness, we re-estimated efficiency-based DCC–GARCH correlations using the traditional R/S-based Simple Hurst exponent.
Figure 12 shows the resulting mean correlation matrix, and
Table 6 reports selected pairs.
Relative to the MF-DFA-based efficiency correlations, the Simple Hurst approach yields substantially different correlation magnitudes across pairs, reflecting its sensitivity to local trends and finite-sample behavior. For some pairs it produces higher correlations (e.g., BTC-KRW and ETH-KRW: 0.6048 versus 0.2018 under MF-DFA), while for others it produces markedly lower correlations (e.g., BCH-KRW and BCH-USD: 0.0239 versus 0.9175 under MF-DFA), indicating that efficiency synchronization levels are method-dependent, particularly when underlying series exhibit heterogeneous scaling properties.
Importantly, the main qualitative conclusion is unchanged: efficiency-based correlations are far more heterogeneous and typically weaker than return-based correlations, implying that market efficiency does not co-move as uniformly as prices. The dispersed synchronization of efficiency is therefore a robust stylized feature of cryptocurrency markets rather than an artifact of a single estimator.
4.2.4. Efficiency-Based Dynamic Correlations
This subsection applies DCC-GARCH(1,1) to the rolling MF-DFA spectrum width series
to examine the time-varying integration structure of market efficiency.
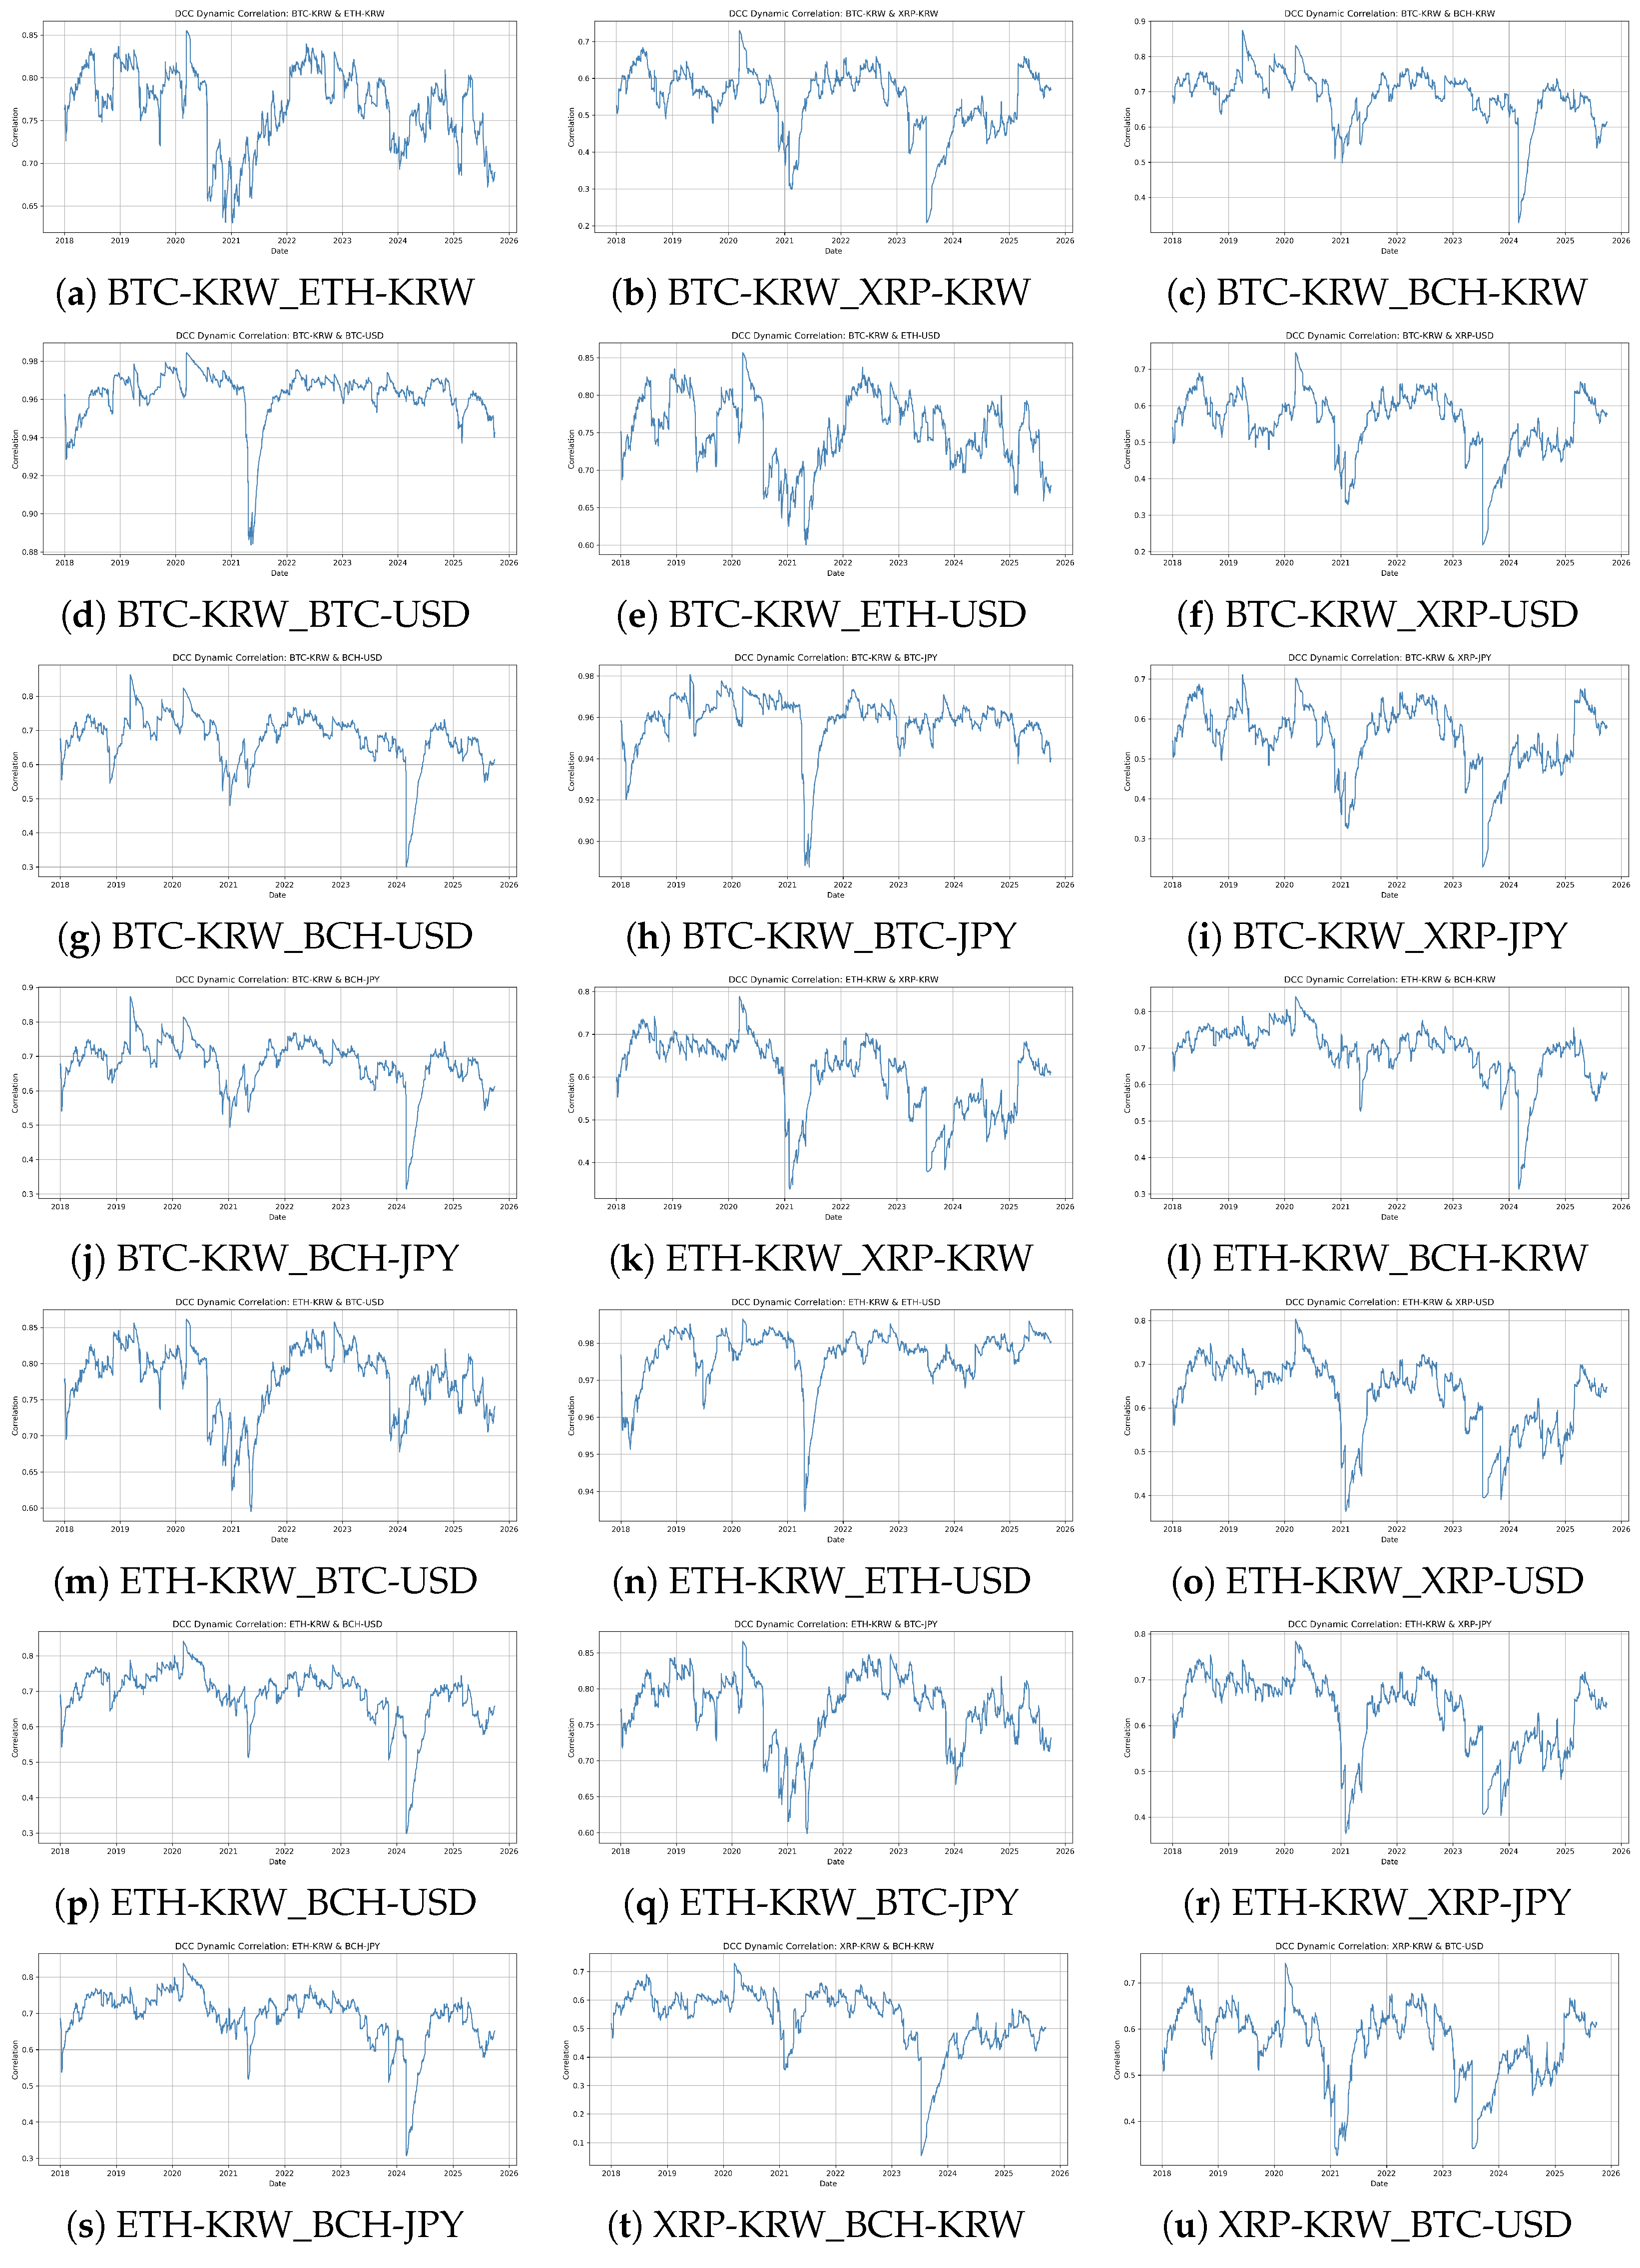
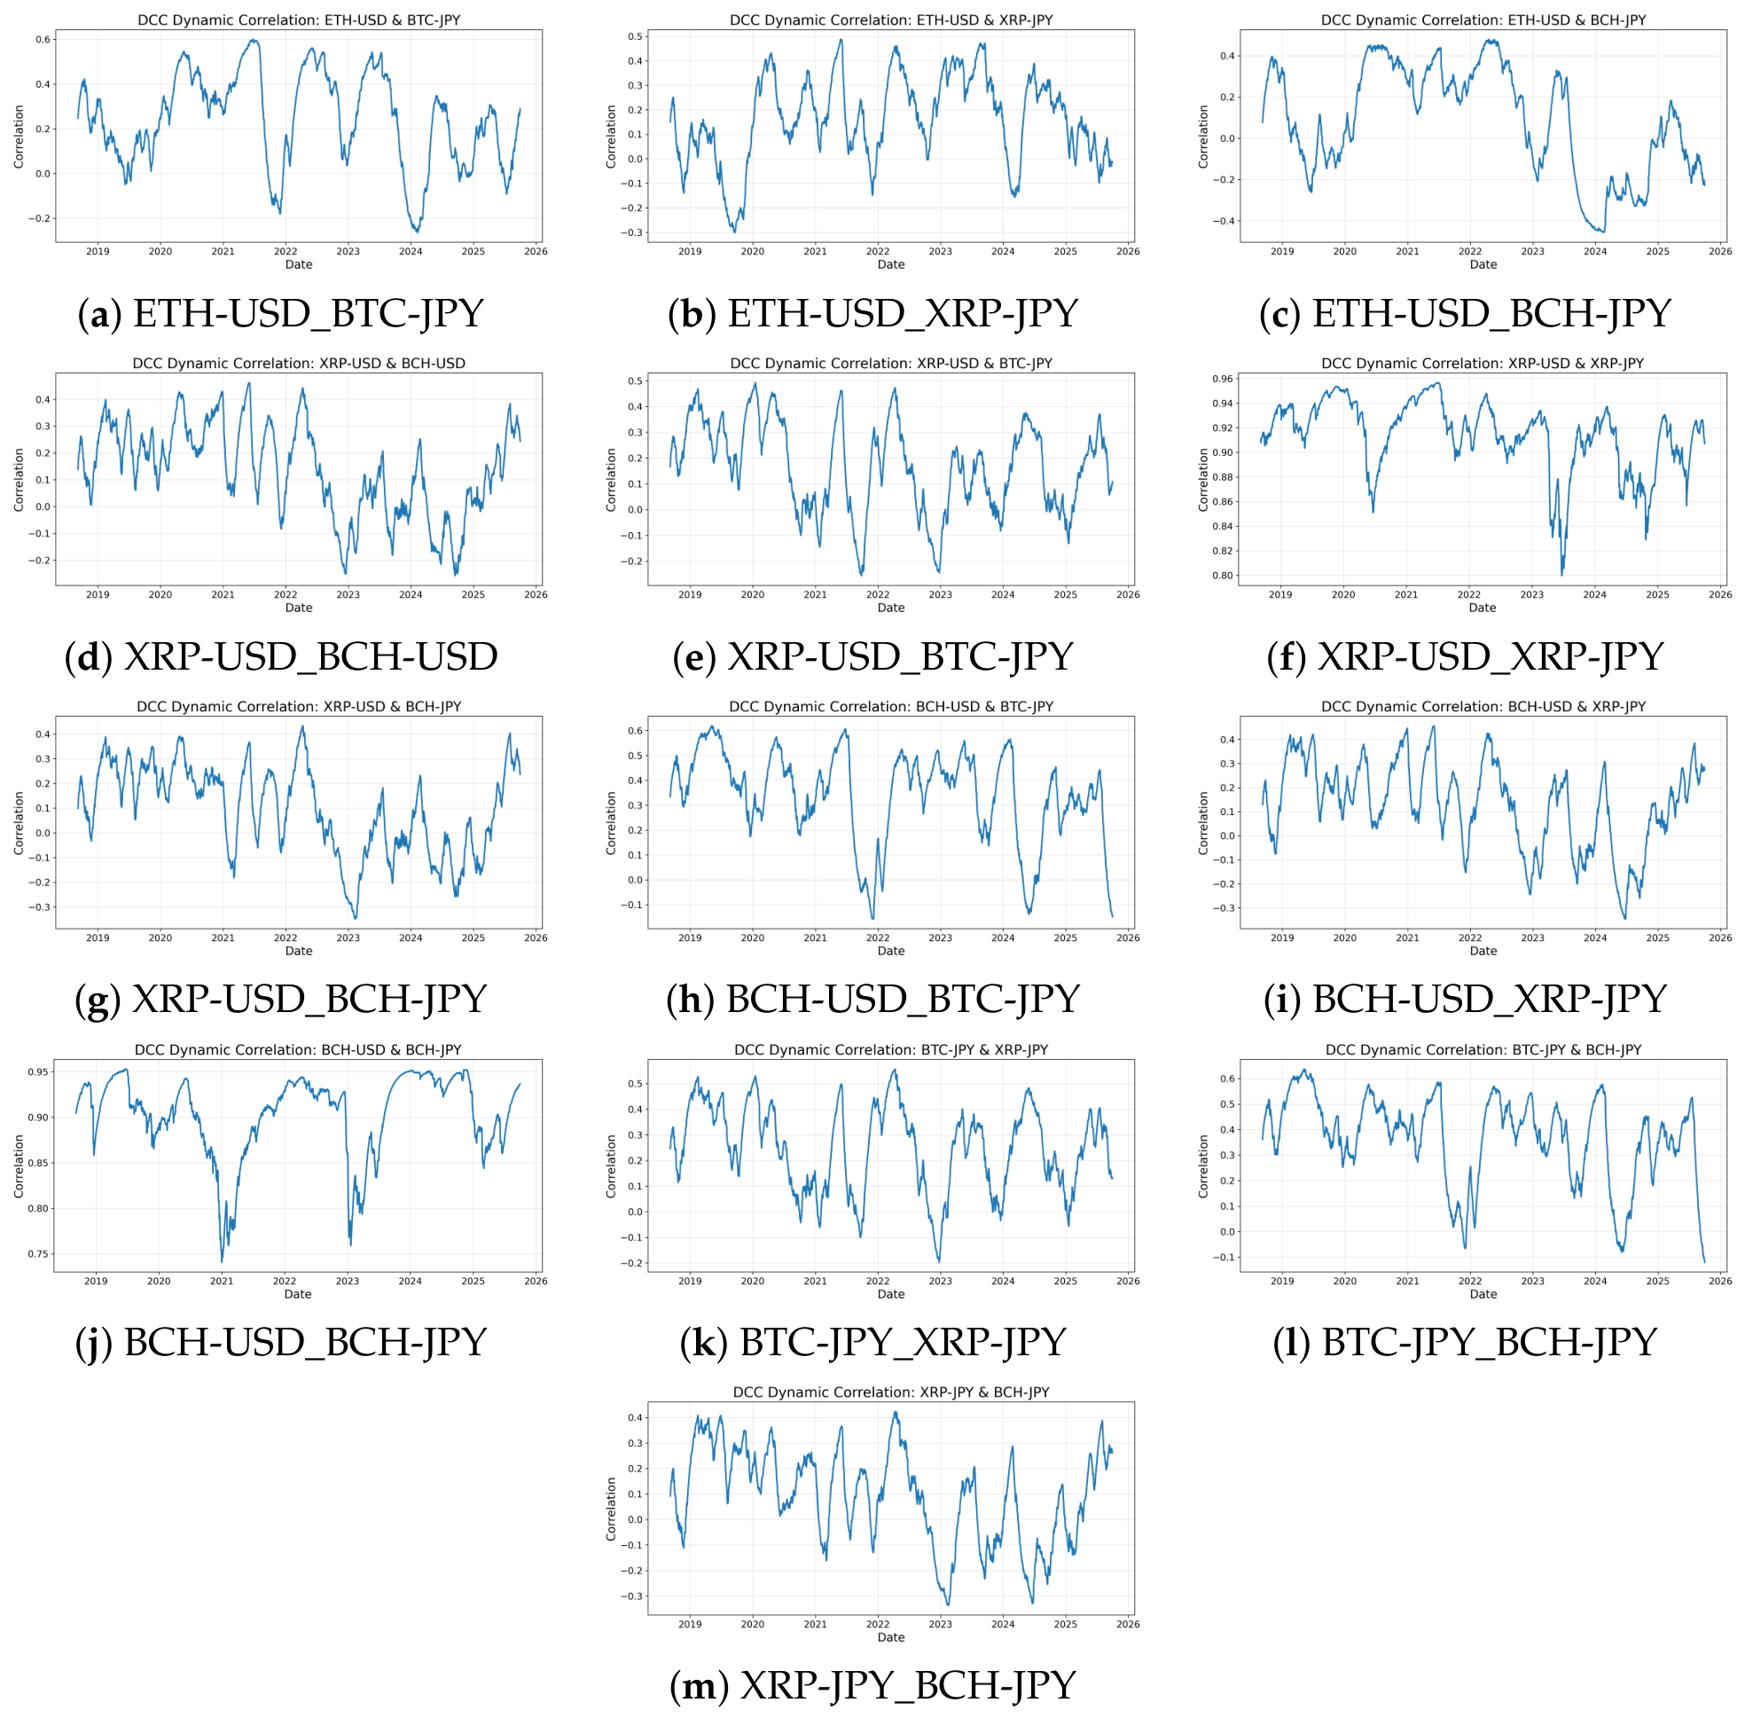
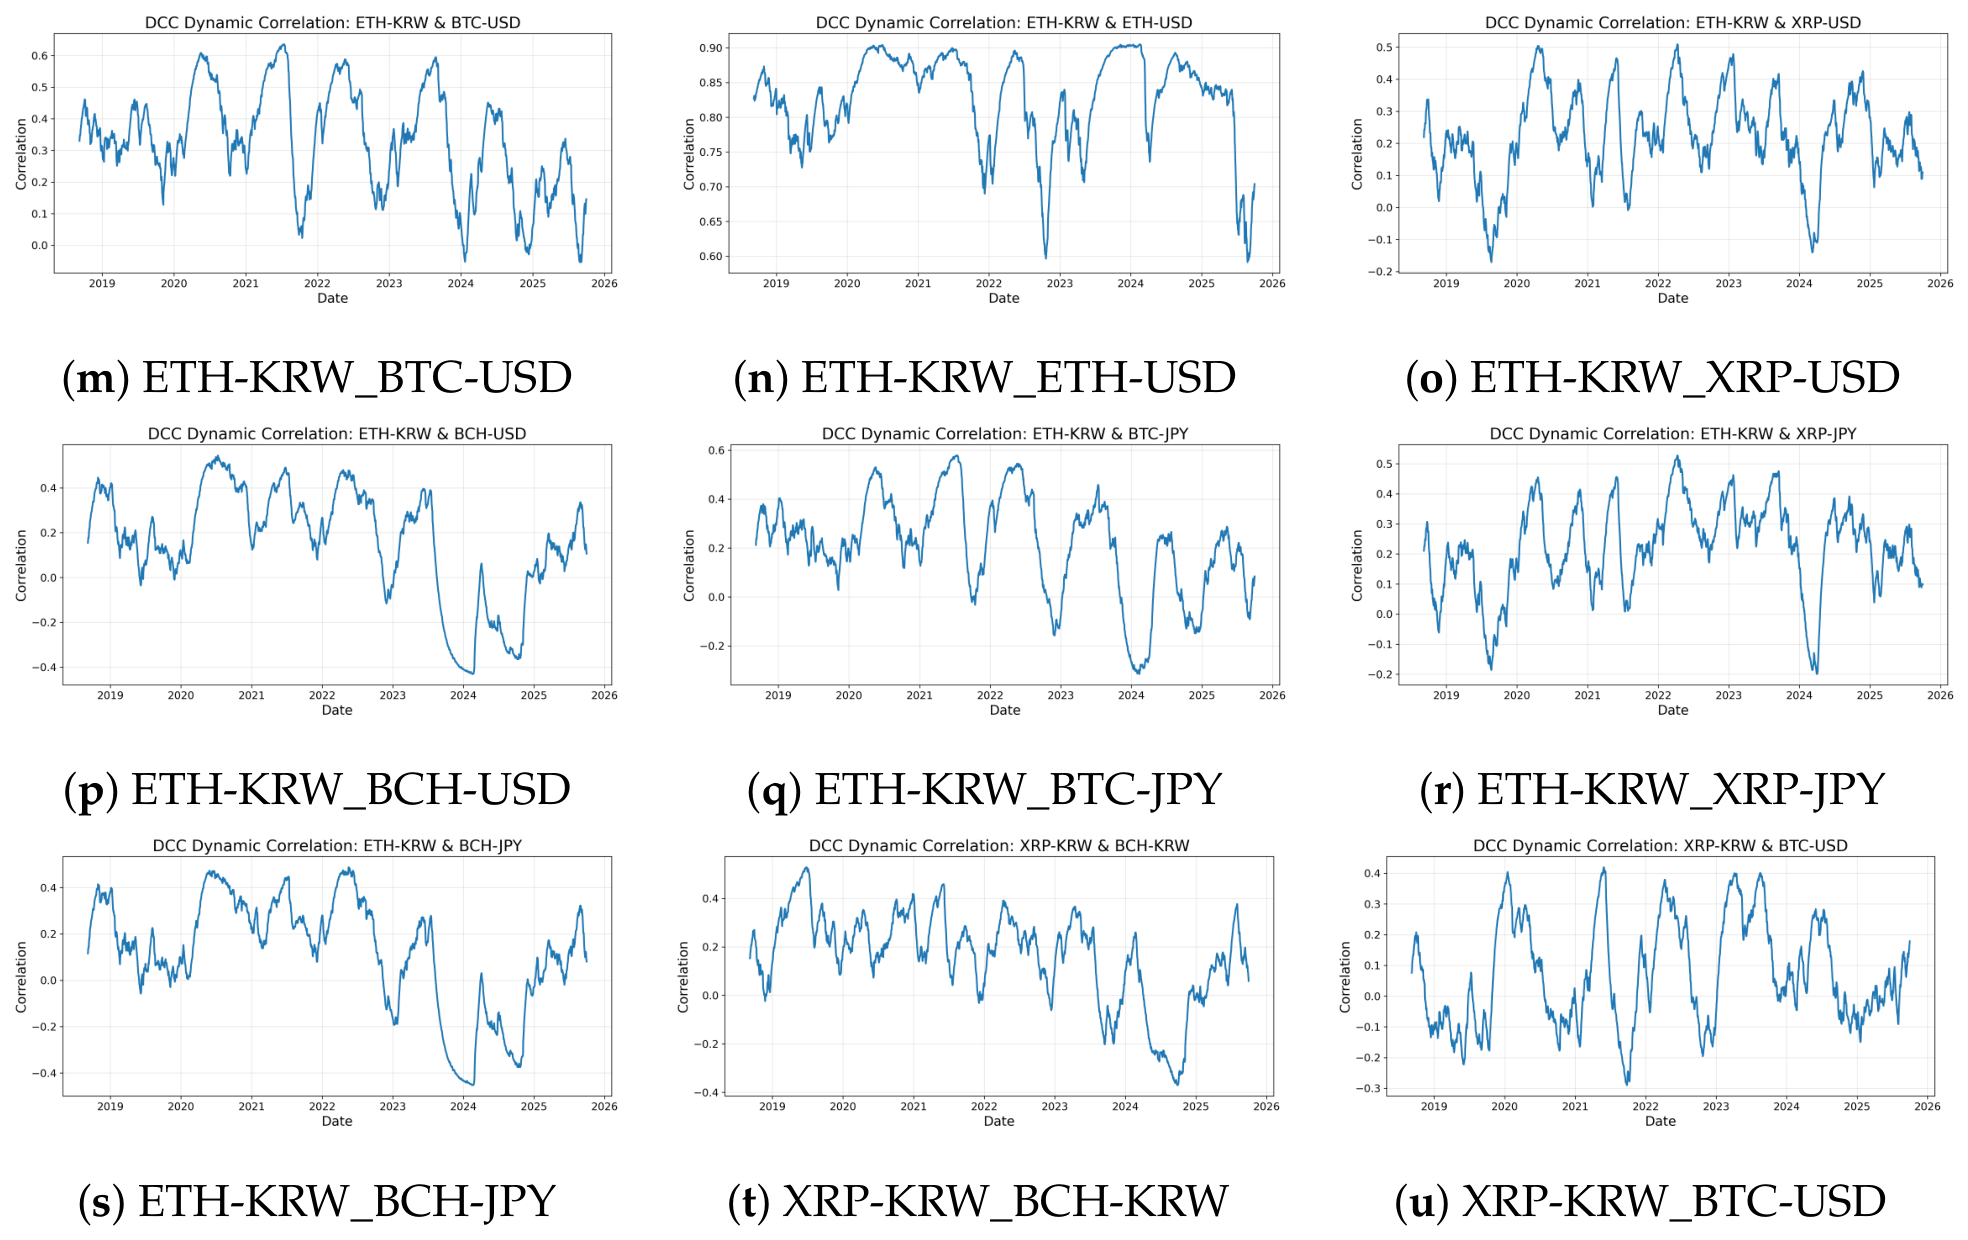
Figure 13 presents dynamic conditional correlation paths for six representative pairs, and
Table 5 summarizes their descriptive statistics.
Cross-currency correlations for the same asset remain persistently high throughout the sample period. The average dynamic conditional correlations between BCH-KRW/BCH-USD, XRP-USD/XRP-JPY, and BCH-USD/BCH-JPY are 0.9175, 0.9137, and 0.9029, respectively. As shown in the upper panels of
Figure 13, these series stay at elevated levels despite temporary fluctuations, confirming strong efficiency synchronization for same-asset cross-fiat pairs and suggesting that inefficiency dynamics of a given cryptocurrency evolve synchronously across fiat markets.
In contrast, cross-asset correlations are substantially weaker and more unstable. The average correlation between BTC-KRW and XRP-KRW is only 0.0106, with BTC-KRW/XRP-USD and BTC-KRW/XRP-JPY at 0.0204 and 0.0504, respectively. As illustrated in the lower panels, these series fluctuate around low positive values and frequently enter negative territory, indicating that inefficiency shocks are not transmitted uniformly across different cryptocurrencies even within the same domestic market, with efficiency dynamics governed by idiosyncratic, asset-specific factors.
The negative values in
Figure 13d–f should not be interpreted as strict “contradictory efficiency”. Since
measures inefficiency, a negative correlation means that inefficiency in one market may temporarily rise while falling in another. However, because these correlations fluctuate around zero and are not persistently negative, they are better viewed as temporary efficiency decoupling rather than a stable inverse relationship. This weak and unstable connectedness may reflect asset-specific news, local liquidity conditions, or heterogeneous investor behavior.
From a time-varying perspective, efficiency-based correlations exhibit pronounced state dependence. Even among same-asset cross-fiat pairs, correlation paths occasionally experience temporary declines, indicating that efficiency synchronization can weaken during periods of market adjustment. Cross-asset pairs show much broader oscillations and repeated sign changes, reflecting the absence of a strong common inefficiency factor across different cryptocurrencies. Such state dependence is consistent with episodes of market stress, during which liquidity shortages, volatility clustering, and herding behavior can amplify inefficiency in some markets while weakening synchronization across others.
Overall, the efficiency-based DCC results reveal a clear contrast between same-asset and cross-asset correlations. The former displays persistently high co-movement in
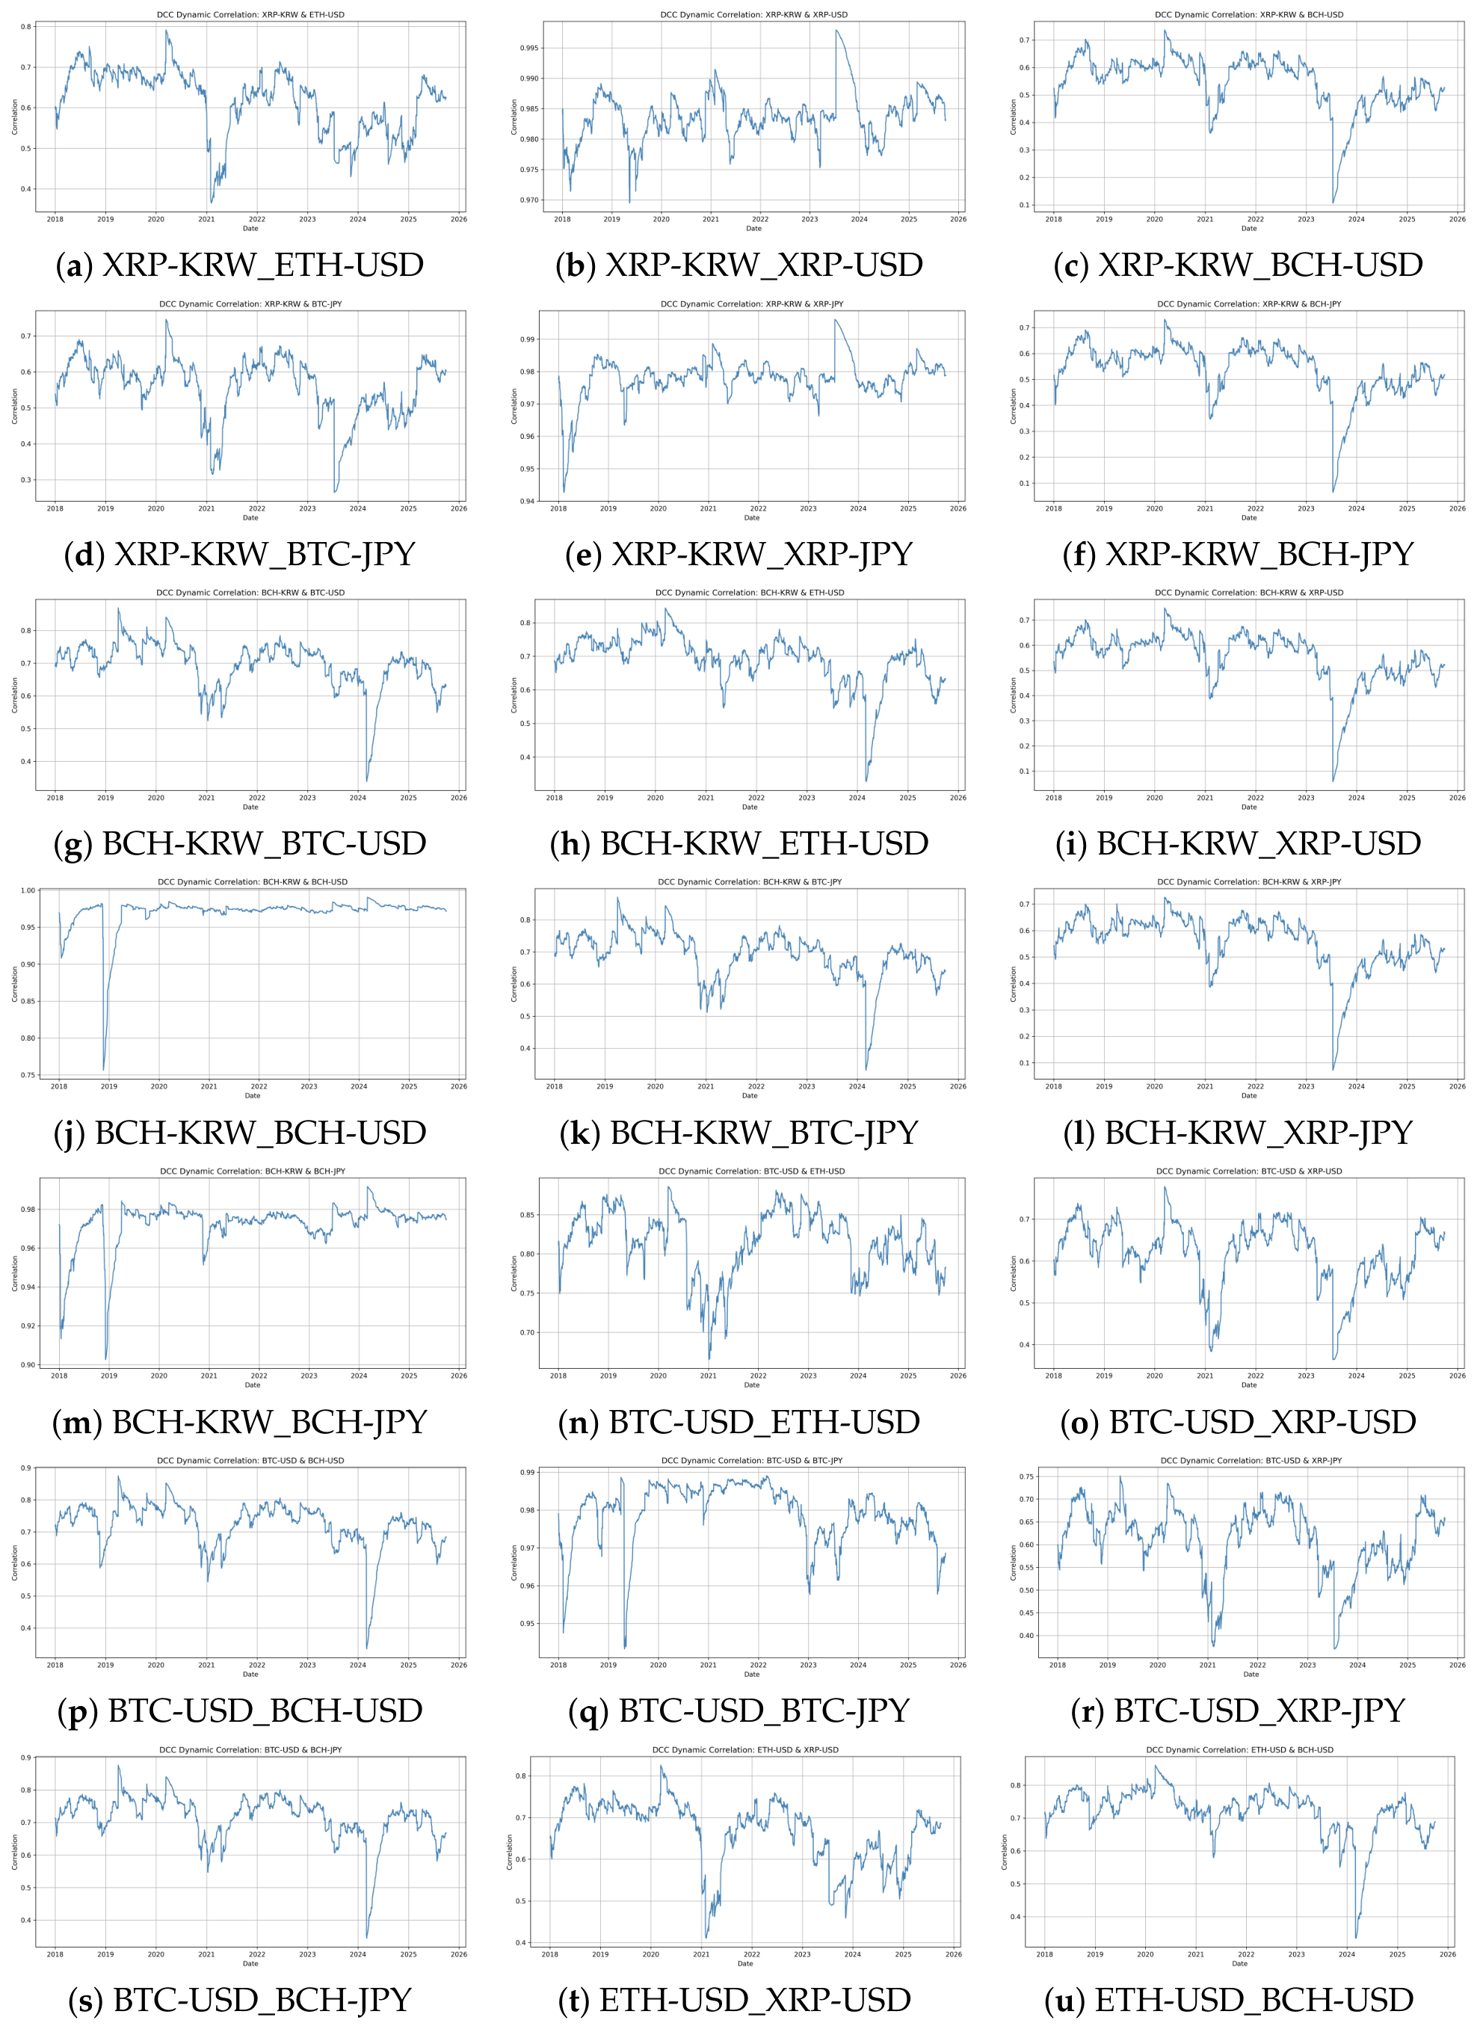
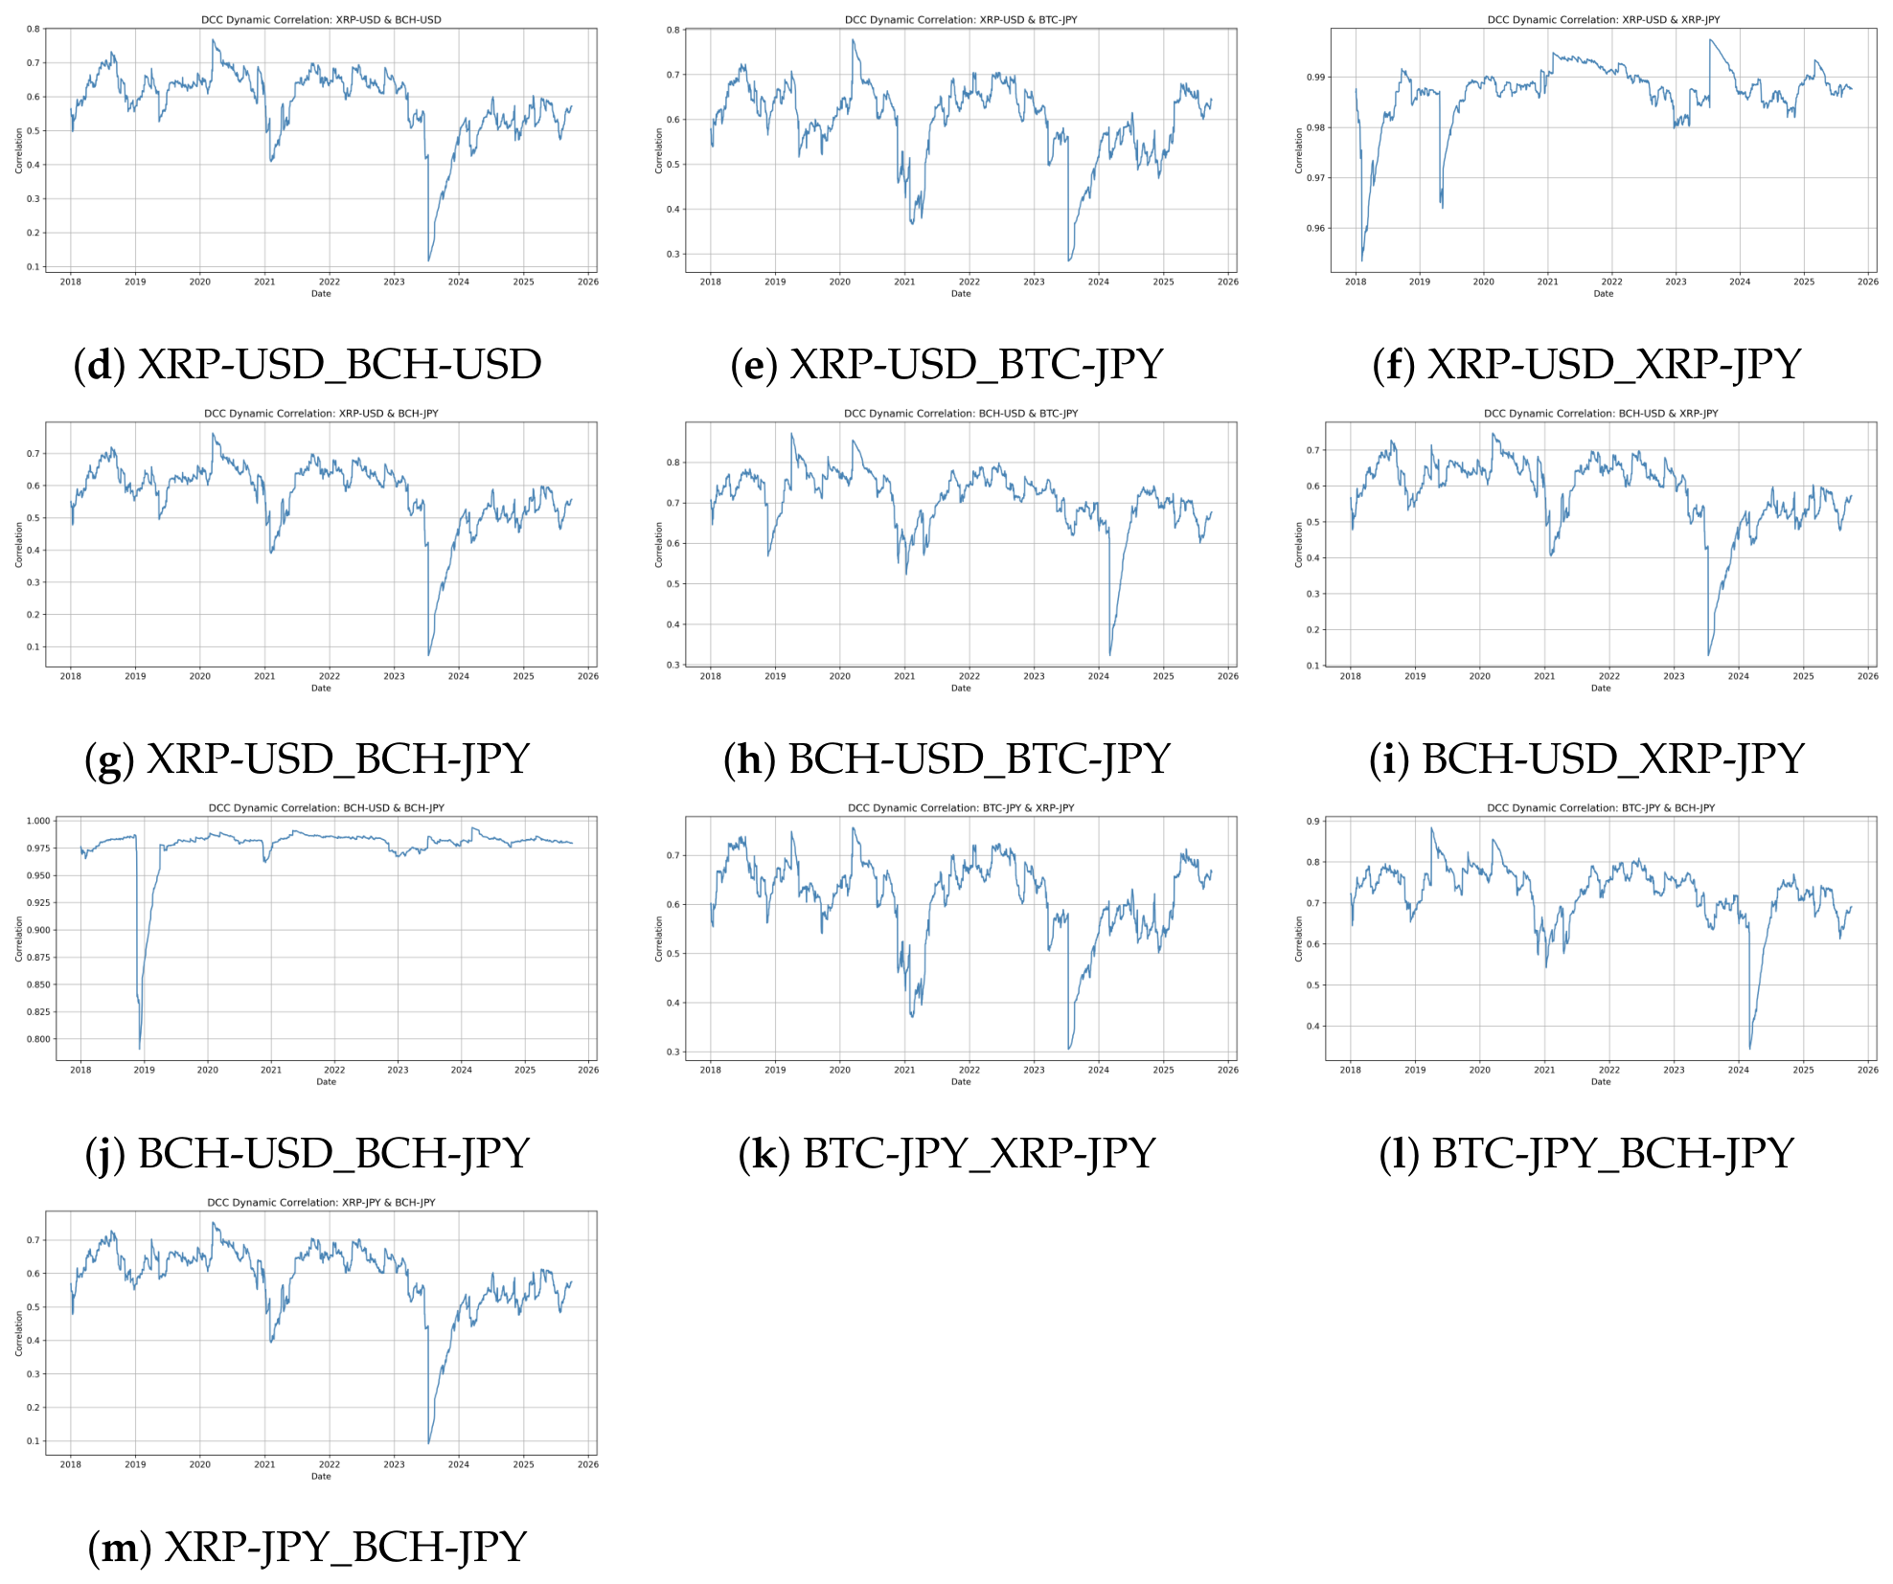
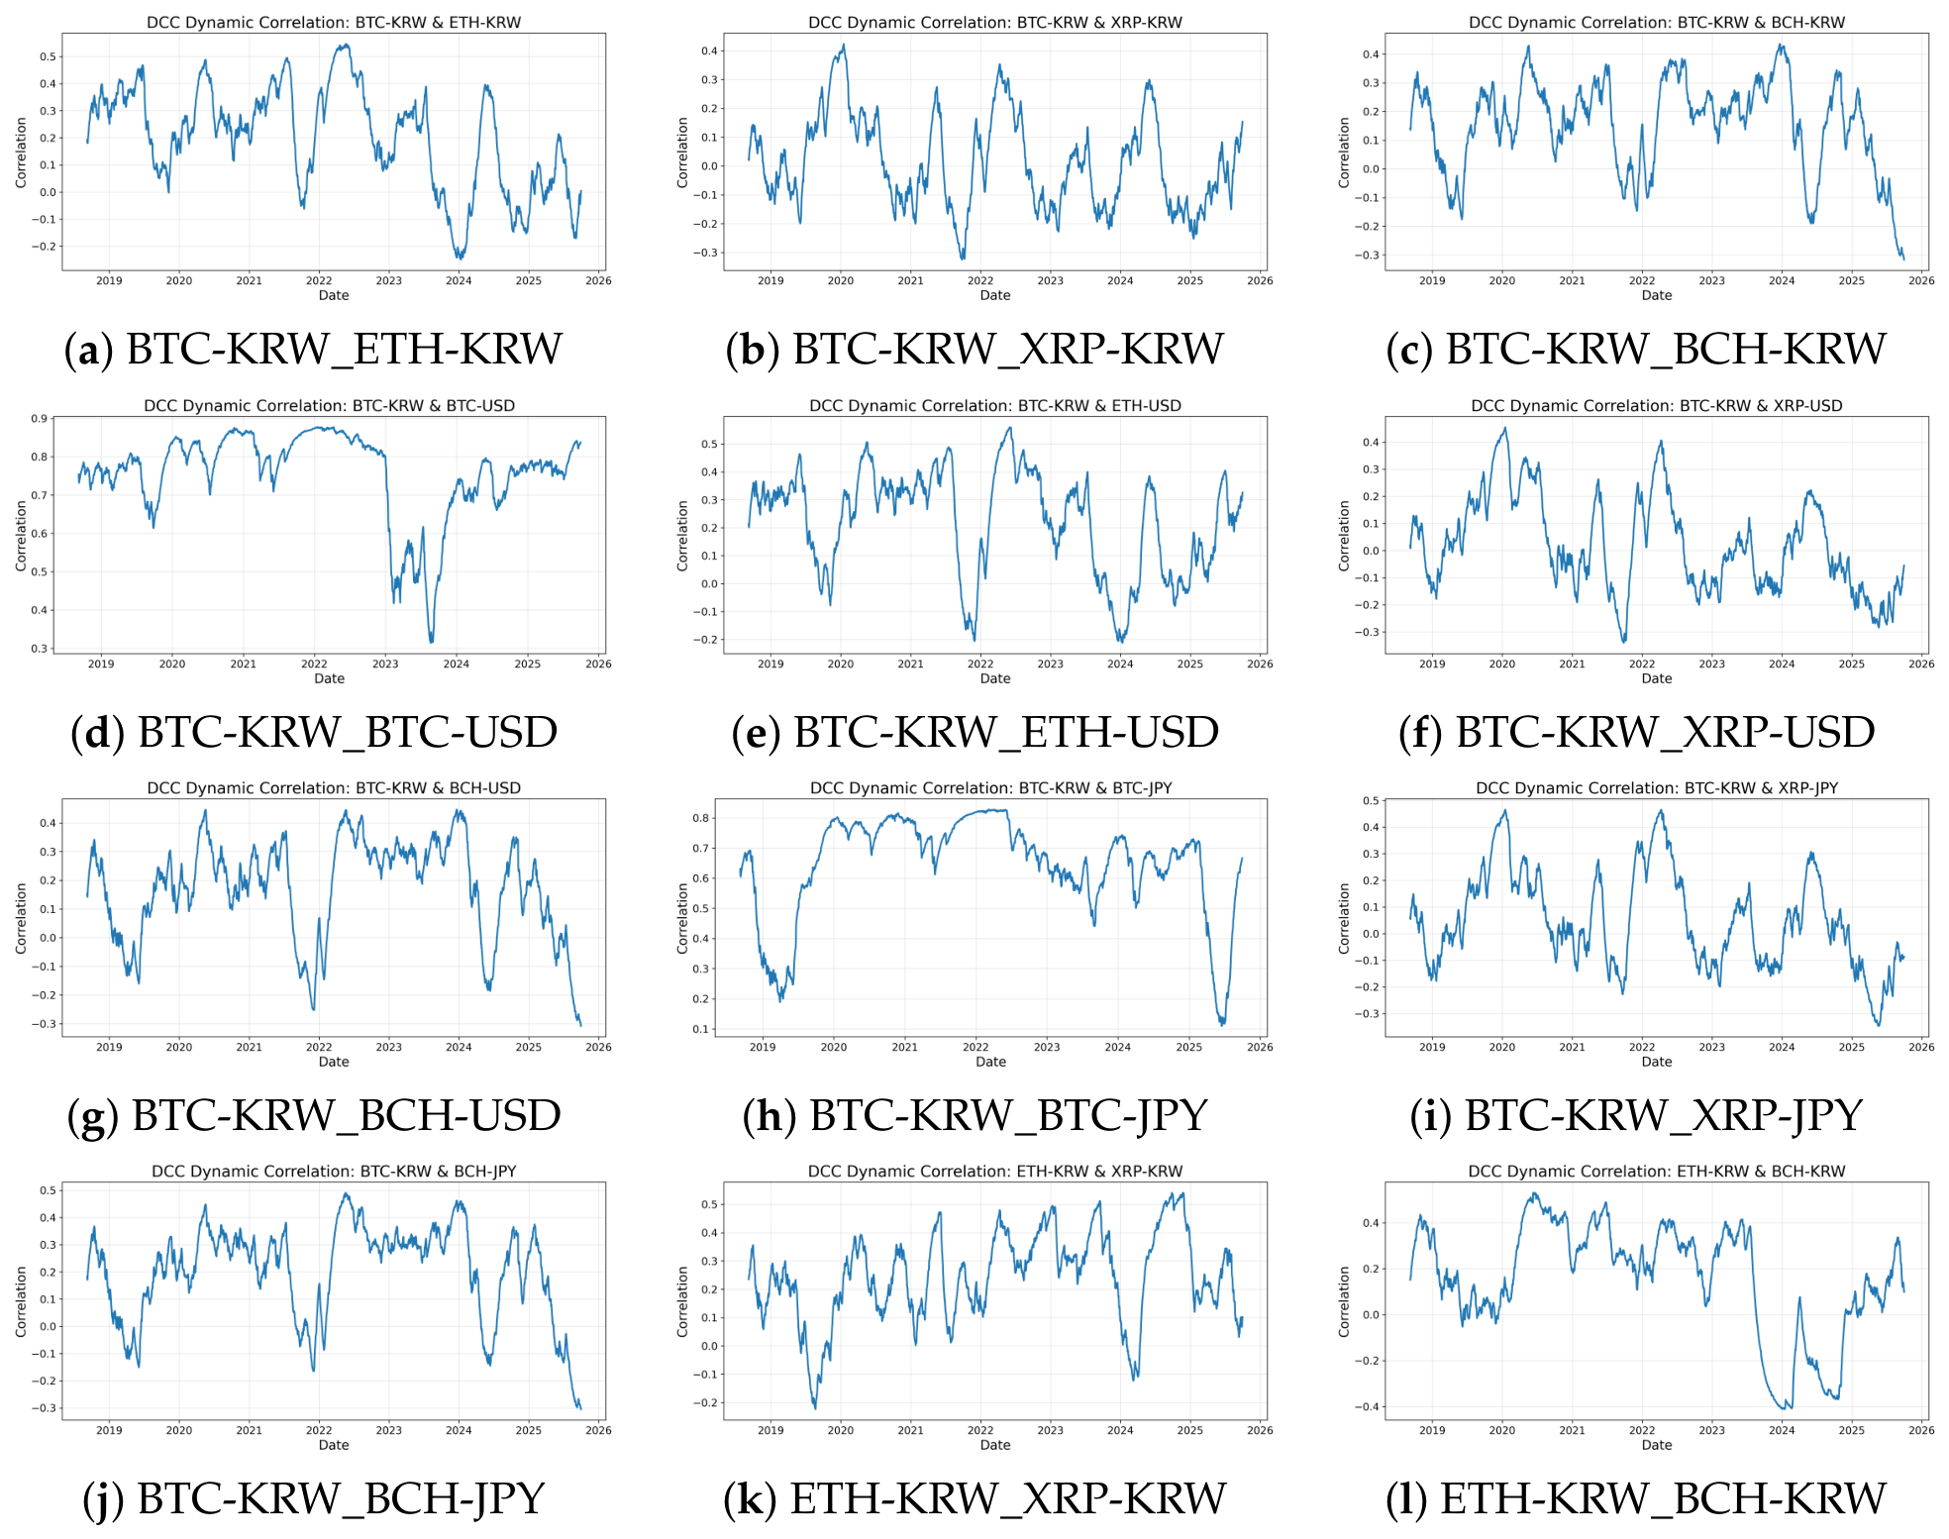
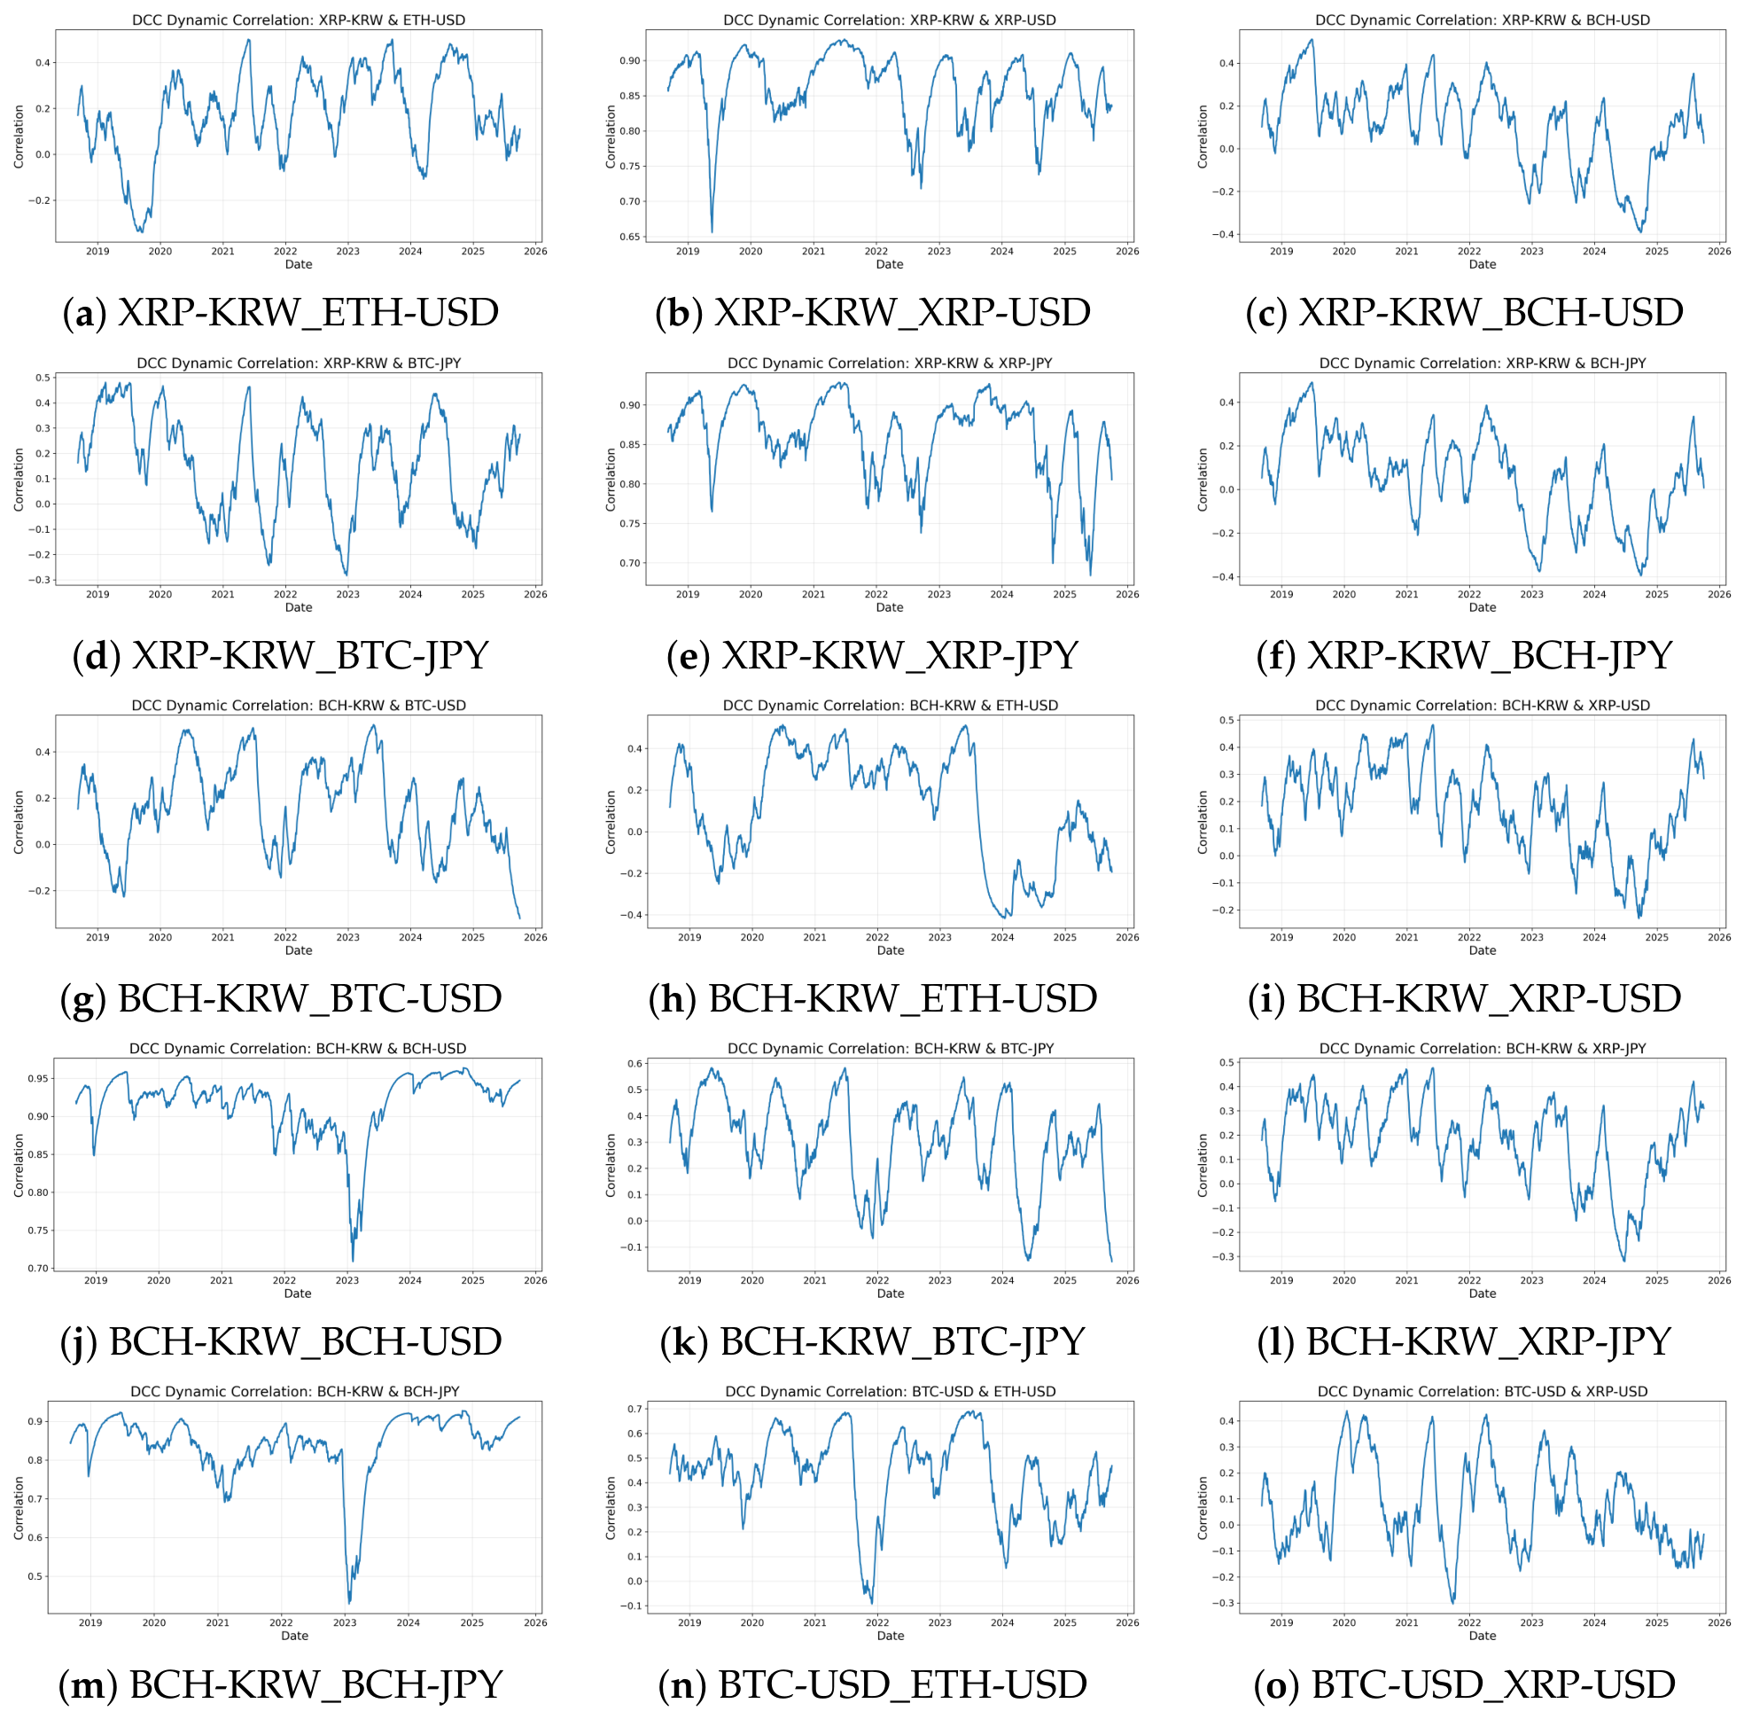
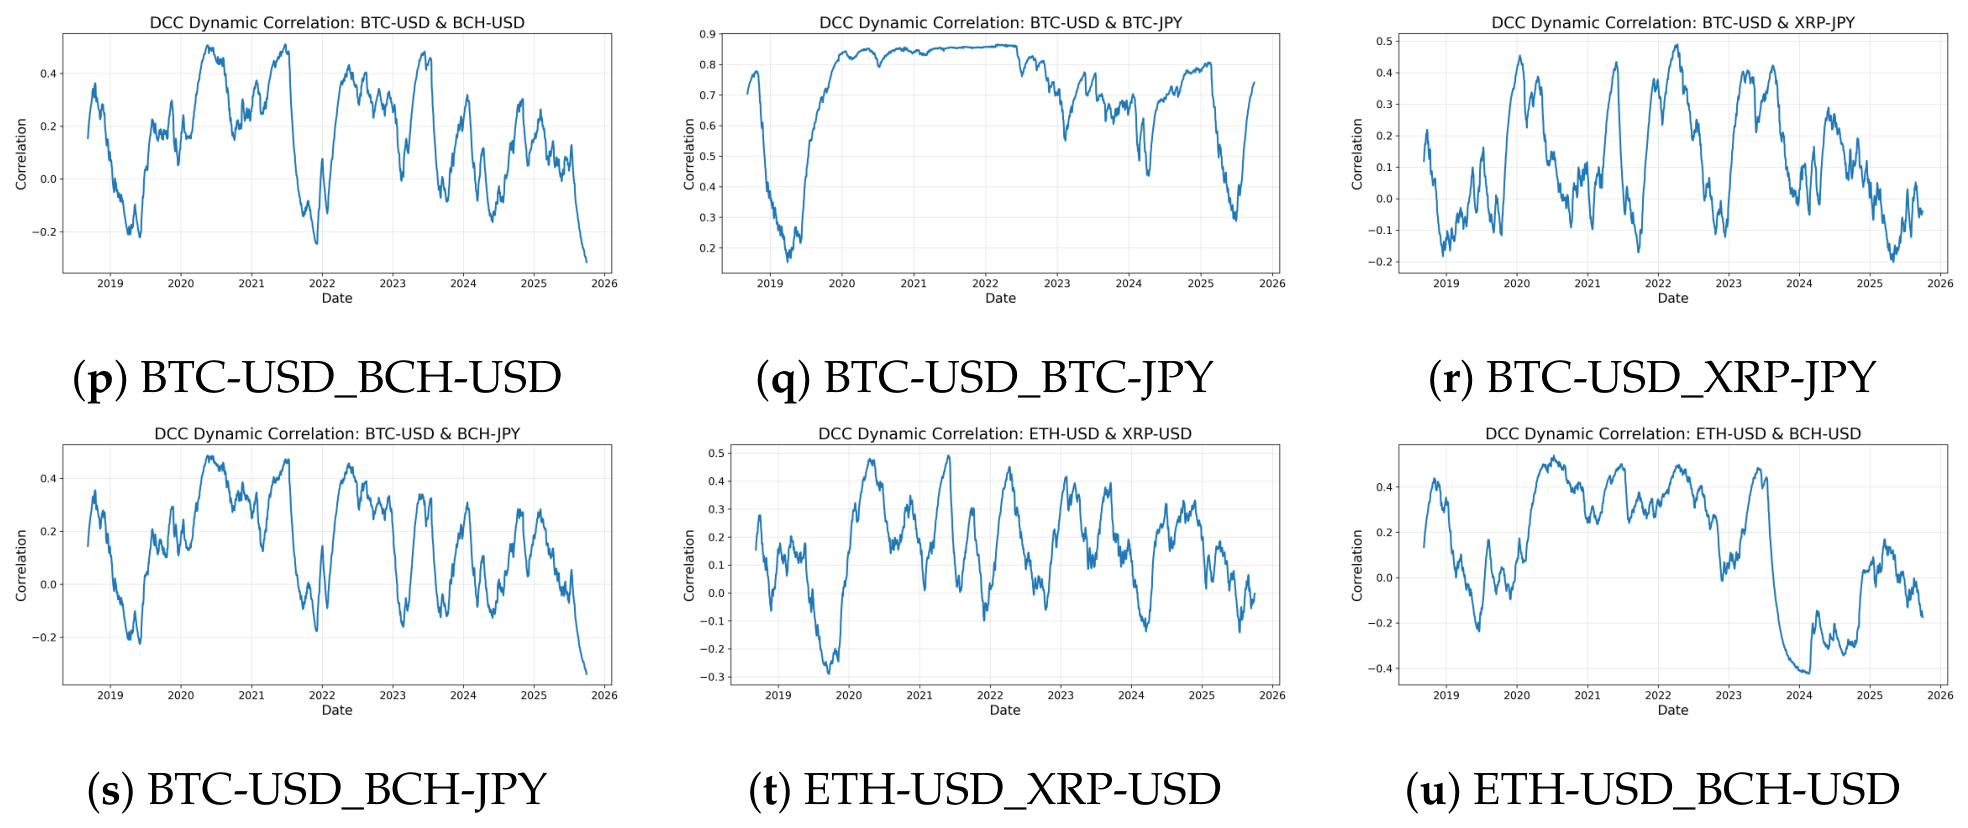
, whereas the latter remains weak, heterogeneous, and often unstable. These findings imply that market efficiency integration differs fundamentally from return integration: while cryptocurrency prices are globally connected through common risk factors and arbitrage activity, the structural quality of the market—as captured by the rolling MF-DFA spectrum width—remains only partially synchronized across assets and regions. The full set of efficiency-based DCC dynamic correlation plots is provided in
Appendix C.
4.3. Return, Volatility, and Market Efficiency
4.3.1. Cross-Currency Volatility Transmission of Bitcoin
We first investigate volatility transmission across currency-denominated Bitcoin markets. Based on the return-based DCC–GARCH(1,1) estimates, the mean dynamic conditional correlations between BTC-KRW and BTC-USD, BTC-KRW and BTC-JPY, and BTC-USD and BTC-JPY are approximately 0.9624, 0.9584, and 0.9791, respectively (
Table 7).
These consistently high correlations indicate that Bitcoin volatility is transmitted almost instantaneously across KRW, USD, and JPY markets. Throughout the sample period, dynamic correlations remain above 0.95 for most observations, suggesting that currency denomination provides little insulation against global Bitcoin volatility shocks.
This finding implies that Bitcoin operates as a unified global market in terms of volatility dynamics [
5]. Makarov and Schoar [
5] decompose exchange-level returns into common and idiosyncratic components, finding that a single global factor dominates Bitcoin’s price discovery—accounting for approximately 80% of return variation at intraday frequencies and exceeding 95% at the daily level. While institutional barriers such as capital controls allow for persistent price differentials across jurisdictions, volatility shocks are transmitted with high synchronicity across global exchanges, suggesting that Bitcoin risk dynamics are driven by a unified global process rather than segmented local factors.
Volatility shocks originating in one market—such as those triggered by global risk-off events, macroeconomic announcements, or regulatory developments in major economies—are rapidly propagated to other currency markets. Consequently, cross-currency arbitrage frictions play a limited role in dampening volatility transmission in the Bitcoin market.
4.3.2. Volatility Transmission from Bitcoin to Altcoins
Next, we examine volatility transmission from Bitcoin to major altcoins in the Korean market. Using BTC-KRW as the reference series, the average DCC correlations with ETH-KRW, BCH-KRW, and XRP-KRW over the full sample period are approximately 0.7667, 0.6897, and 0.5444, respectively (
Table 7).
The results indicate that Bitcoin volatility is strongly transmitted to Ethereum and Bitcoin Cash, which display high and relatively stable correlations with Bitcoin. In contrast, the correlation between Bitcoin and XRP is substantially lower, implying weaker and more unstable volatility transmission.
This heterogeneity suggests that Bitcoin serves as a dominant source of volatility for the broader cryptocurrency market, while the strength of transmission varies by asset.
Ethereum and Bitcoin Cash exhibit strong structural dependence on Bitcoin-driven market conditions, whereas XRP displays a more distinct volatility dynamic, allowing for partial decoupling from Bitcoin shocks. Within the time-varying framework of [
50], cryptocurrency volatility can be decomposed into a common market component and an asset-specific idiosyncratic component. While major assets such as Ethereum are largely governed by the common market factor, XRP is more frequently dominated by idiosyncratic forces, including regulatory and legal developments. As these asset-specific shocks intensify, they weaken the common volatility channel linking XRP to Bitcoin, leading to temporary breakdowns in co-movement.
Moreover, ref. [
50] show that market-wide connectedness is sensitive to investor sentiment, with higher sentiment associated with attenuated spillover effects. In such regimes, XRP’s unique narrative and institutional context allow it to follow a divergent volatility path. Consequently, although XRP remains structurally linked to Bitcoin during systemic crises, it exhibits recurrent partial decoupling in periods dominated by asset-specific information, reflecting a distinct and state-dependent volatility dynamic.
4.3.3. Spillover Effects During Market Stress Events
To assess how volatility transmission intensifies during periods of market stress, we conduct an event-based analysis using dynamic conditional correlations. A notable amplification of spillover effects is observed around the COVID-19 pandemic.
On 13 March 2020, shortly after the World Health Organization declared COVID-19 a global pandemic, multiple market pairs exhibited simultaneous spikes in dynamic correlations. The BTC-KRW and ETH-KRW correlation increased to approximately 0.855, while the BTC-KRW and XRP-KRW correlation increased to around 0.730. Similarly, cross-currency correlations, such as BTC-KRW and BTC-USD, reached levels as high as 0.985 (
Table 7).
These synchronized surges indicate that during global crisis events, volatility shocks originating in the Bitcoin market are strongly transmitted across both currencies and assets. Such periods of global market stress are often accompanied by pronounced flight-to-quality or flight-to-liquidity behavior, in which investors collectively divest risky assets and reallocate toward safer claims. Such behavior has been documented in the financial economics literature as a hallmark of elevated risk aversion and panic selling during crises [
51].
4.3.4. Time-Varying Dynamics and Asset-Specific Decoupling
To examine the time-varying nature of volatility transmission from Bitcoin to altcoins, we analyze the dynamic conditional correlations estimated from the DCC–GARCH model for BTC-KRW paired with ETH-KRW and XRP-KRW. The resulting DCC trajectories reveal substantial heterogeneity in both the level and persistence of cross-asset dependence, indicating that volatility spillovers in cryptocurrency markets evolve in a nonlinear and regime-dependent manner Cheng [
49].
The dynamic correlation between BTC-KRW and ETH-KRW remains persistently high throughout most of the sample period, with a mean of 0.767 and stress-episode peaks around 0.855 (
Table 7), typically fluctuating within a narrow band of 0.7–0.85. During systemic stress episodes—most notably the COVID-19 shock in March 2020 and the market-wide crash in May 2021—the correlation rises sharply toward its upper bound before exhibiting rapid mean reversion, suggesting that the Bitcoin–Ethereum volatility linkage is not only structurally strong but also dynamically resilient [
52]. This pattern is consistent with Ethereum’s role as the dominant secondary asset in the cryptocurrency ecosystem, whose risk structure remains persistently anchored to Bitcoin-centered market conditions. Recent high-frequency evidence further supports this interpretation: Joshi [
53] show that Bitcoin acts as the principal transmitter of shocks to Ethereum, whereas Ethereum functions as a secondary transmitter in high-volatility environments.
By contrast, the BTC-KRW–XRP-KRW correlation exhibits a far more volatile and irregular temporal structure. Its average level is substantially lower, and the DCC trajectory is characterized by large-amplitude fluctuations and extended low-correlation regimes (
Table A1). During systemic crisis episodes, the correlation rises temporarily, reflecting market-wide synchronization; however, it subsequently declines much more sharply and remains considerably more unstable than the BTC–ETH pair.
More notably, during the XRP-specific regulatory episode in July 2023, the BTC–XRP correlation falls to historically low levels and remains depressed for an extended period. These low-correlation regimes coincide closely with heightened legal and regulatory uncertainty surrounding XRP. This pattern is consistent with existing empirical evidence that XRP is particularly sensitive to asset-specific news and legal events. For instance, Cheng [
49] document sharp declines in rolling correlations for BTC–XRP and ETH–XRP pairs during periods associated with Ripple-related regulatory shocks, attributing these decoupling episodes to the SEC lawsuit and the uncertainty it generated.
Taken together, these results indicate that volatility transmission from Bitcoin is inherently time-varying and asset-dependent. For Ethereum, the DCC path exhibits high persistence and rapid post-shock reversion, indicative of a stable and structural dependence on Bitcoin risk. For XRP, the DCC process alternates between periods of synchronization and fragmentation, reflecting shifts in the relative importance of common market factors versus asset-specific information. Consequently, the intensity and durability of spillovers from Bitcoin are not constant but evolve with market regimes and informational environments.
These time-varying patterns imply that the cryptocurrency market features a layered and dynamic dependence structure. Bitcoin functions as a systemic volatility hub, yet the magnitude and persistence of its spillovers fluctuate over time and differ across assets. Global shocks induce temporary convergence in risk dynamics, whereas changes in the informational environment—particularly those driven by asset-specific developments—generate divergence. This evidence supports a state-dependent view of volatility transmission, in which integration and fragmentation coexist as alternating regimes within cryptocurrency markets.
While global shocks and volatility-related information are rapidly transmitted across markets, measures of market efficiency capture a different dimension of information processing that remains locally segmented.
4.3.5. Implications for the Kimchi Premium
The DCC–GARCH results provide important insights into the structural nature of the Kimchi premium. While persistent price differentials between Korean and foreign cryptocurrency markets have often been interpreted as evidence of market segmentation, the volatility dynamics reveal a markedly different picture. Across currency-denominated Bitcoin markets, dynamic conditional correlations remain consistently high, with mean values exceeding 0.9 for most pairs (
Table 7). This indicates that, despite deviations in price levels, volatility shocks are transmitted almost instantaneously across KRW, USD, and JPY markets.
This finding implies that the Kimchi premium reflects segmentation in price levels rather than in risk dynamics. Regulatory frictions, capital controls, and transaction barriers prevent full price convergence through arbitrage, allowing local premiums to persist [
29]. Empirical analysis supports this view, demonstrating that the Kimchi premium for Bitcoin maintains a non-zero, long-run steady-state level of 1.24%, which constitutes a persistent violation of the law of one price. This structural premium is largely sustained by market frictions, such as transaction and miner fees, which deter arbitrageurs until the price deviation exceeds a specific threshold [
29]. However, the DCC evidence suggests that these frictions do not insulate the Korean market from global Bitcoin risk. Shocks originating in major markets are rapidly incorporated into KRW-denominated prices in volatility terms, even when absolute price gaps remain.
These dynamics are also consistent with contemporaneous market evidence. Episodes in which the Kimchi premium widens are frequently triggered by global risk events rather than by purely domestic shocks. Recent market reports document that the premium can surge not only in bullish phases driven by local demand, but also during global sell-offs, when international markets experience sharp liquidations while Korean exchanges exhibit comparatively weaker selling pressure. Such patterns indicate that the Korean market responds to the same global information set and risk environment as offshore markets, even though institutional constraints prevent immediate price convergence. In other words, deviations in price levels arise from frictions in cross-border arbitrage, whereas the underlying volatility process remains globally synchronized.
In this sense, the Kimchi premium coexists with a globally integrated volatility structure. The Korean market may exhibit localized pricing, but it is embedded within a unified global risk environment [
5]. During periods of global stress, this integration becomes even more pronounced, as dynamic correlations surge across both currencies and assets. Consequently, Korean investors are exposed to global cryptocurrency risk in real time, regardless of the existence of domestic price premiums.
Taken together, these results suggest that the Kimchi premium should not be interpreted as evidence of informational isolation. Rather, it reflects institutional and regulatory constraints that impede price-level arbitrage, while leaving the transmission of volatility and risk largely unaffected. Bitcoin therefore operates as a single global market in terms of risk dynamics, even as local market conditions generate persistent cross-country price differentials.
5. Discussion
Based on the rolling MF-DFA and DCC-GARCH findings, we discuss the structural characteristics of the cryptocurrency market, focusing on the persistence of inefficiency and “informational segregation.” Our results show that generalized Hurst exponents () across KRW, USD, and JPY markets remain significantly above 0.5, indicating a rejection of weak-form efficiency despite market growth. In the Korean market, this inefficiency intensifies during bull runs, likely driven by retail-dominated herding and FOMO, whereas institutional liquidity in the US plays a corrective role. This dynamic evolution aligns with the “Adaptive Market Hypothesis” (AMH), suggesting efficiency fluctuates with changing market conditions.
A central contribution of this study is identifying the structural divergence between price integration and efficiency integration. While return-based correlations () confirm the “Law of One Price,” the low efficiency correlations reveal Informational Segregation. This implies that while global shocks drive price levels, local factors determine market quality. The KRW market operates as a distinct “liquidity island” due to capital controls, preventing efficiency spillovers. Furthermore, observed negative correlations suggest a “speculative seesaw” mechanism, where liquidity shifts cause asymmetric efficiency changes across regions.
Consequently, the Kimchi Premium is not merely a price gap but a symptom of structural heterogeneity. Unlike price levels, market memory remains disconnected. During periods of efficiency decoupling—where Korea becomes more inefficient relative to global markets—the premium expands as local noise traders drive prices away from fundamentals without sufficient arbitrage correction. Thus, the premium effectively acts as a “tax” on the domestic market’s structural inefficiency and isolation.
This section examines the main implications of the DCC–GARCH estimates for cross-market integration and the interpretation of the Kimchi Premium. The return-based DCC series indicate strong and time-varying comovement across cryptocurrency markets, with particularly pronounced integration across currency-denominated Bitcoin pairs. As summarized in
Table 7, the mean dynamic conditional correlations for cross-currency Bitcoin markets are consistently close to unity (BTC-KRW–BTC-USD: 0.9624; BTC-KRW–BTC-JPY: 0.9584; BTC-USD–BTC-JPY: 0.9791), suggesting that fluctuations in Bitcoin returns are driven by a largely common global factor rather than by segmented regional dynamics. These magnitudes imply that shocks originating in one major trading venue are rapidly transmitted to others, so that the relevant risk environment for Korean investors is effectively global even when local price premia persist.
A salient feature of the DCC estimates is the stress-state amplification of correlations. Even though the unconditional correlations are already high, the “stress-episode peak” values rise further during systemic turbulence (e.g., COVID-19 in March 2020), approaching near-perfect synchronization across cross-currency Bitcoin markets (
Table 7). This pattern is consistent with the broader literature on correlation breakdowns and flight-to-quality episodes, in which asset co-movements become stronger precisely when diversification is most desired. In the context of cryptocurrency markets, the results indicate that global risk-off events compress cross-market dynamics and intensify volatility spillovers, reinforcing the view that Bitcoin operates as a unified global market in terms of risk transmission.
At the same time, correlations between Bitcoin and major altcoins in the Korean market are materially lower than those observed across currency-denominated Bitcoin pairs, although they remain economically meaningful. The mean DCC values for BTC-KRW–ETH-KRW (0.7667), BTC-KRW–BCH-KRW (0.6897), and BTC-KRW–XRP-KRW (0.5444) indicate that a substantial portion of return variation is shared across cryptoassets, but with greater scope for idiosyncratic movements at the asset level. Notably, these correlations also rise during stress episodes (
Table 7), implying that within-market diversification across cryptoassets weakens in turbulent conditions. This finding supports the interpretation that volatility transmission across assets constitutes an important channel through which global shocks propagate into the Korean cryptocurrency ecosystem, beyond the mechanical linkage induced by exchange-rate denomination.
Taken together, the DCC–GARCH evidence provides a risk-dynamics perspective on the Kimchi Premium. Persistent deviations in price levels across KRW and offshore markets are often interpreted as evidence of segmentation; however, the correlation structure suggests that segmentation operates primarily through arbitrage constraints rather than through informational isolation. In particular, near-unity cross-currency Bitcoin correlations imply that volatility shocks and global information are incorporated into KRW-denominated prices almost contemporaneously, even if regulatory frictions, capital controls, and transaction costs prevent full price convergence. Hence, the Kimchi Premium can coexist with globally integrated risk dynamics: local premia reflect barriers to cross-border arbitrage, whereas the underlying volatility process remains synchronized across regions [
5].
Finally, these findings have direct implications for risk management and policy interpretation. From an investor perspective, the high level of cross-currency integration implies limited hedging benefits from shifting Bitcoin exposure across fiat denominations, while the stress-period correlation spikes underscore that downside risk is intrinsically global. From a market-structure perspective, the results suggest that policies affecting capital mobility or domestic trading constraints may influence the level and persistence of the Kimchi Premium, but are unlikely to meaningfully shield domestic participants from global volatility transmission. Overall, the DCC–GARCH results support the conclusion that Bitcoin markets are globally integrated in risk dynamics, even when local institutional conditions generate persistent cross-country price differentials.
One limitation of the current framework is that the DCC–GARCH model does not formally identify whether correlation shifts are driven by global or localized shocks. However, the DCC trajectories offer indirect evidence: during the COVID-19 shock, correlations spike simultaneously across all pairs, consistent with a global shock, whereas the XRP regulatory episode in July 2023 produces declines concentrated in XRP-related pairs only, consistent with an asset-specific local shock.
The finding that segmentation in price levels can coexist with integrated risk dynamics is not unique to cryptocurrency markets. Rather, it reflects a structural feature that has been repeatedly observed in traditional international financial markets, most notably in the development of non-deliverable forward (NDF) markets for currencies subject to capital controls. Historically, in countries operating under foreign exchange restrictions, offshore trading venues emerged as mechanisms for managing currency risk outside the regulatory perimeter, resulting in persistent dual-pricing structures in which the same underlying asset traded at different prices across jurisdictions.
The Australian dollar market of the 1970s and early 1980s, analyzed by Debelle et al. [
54], provides a representative illustration of this mechanism. Under a comprehensive system of exchange controls and restrictions on capital mobility, deliverable forward transactions were tightly confined to trade-related real transactions. To circumvent these regulatory constraints, market participants developed a non-deliverable forward market (often referred to as a “hedge market”). These institutional barriers generated a structural wedge between regulated and unregulated segments, preventing full price convergence. At the same time, however, the hedge market functioned as a venue in which global risk perceptions and expectations were reflected, thereby facilitating cross-border information flows and the transmission of risk.
A closely parallel and more contemporary example is the onshore–offshore dual pricing structure of the Chinese renminbi (CNY–CNH). Funke et al. [
55] document that persistent pricing differentials between the onshore CNY and offshore CNH markets arise primarily from capital controls, market access restrictions, and regulatory segmentation. Although CNY and CNH represent the same underlying currency and are anchored to identical macroeconomic fundamentals, regulatory borders constrain arbitrage and allow systematic price deviations to persist. Nevertheless, the offshore CNH market rapidly incorporates global information and policy expectations, which are subsequently transmitted to the onshore market despite institutional frictions. Thus, segmentation in price levels coexists with strong integration in risk expectations and information processing.
A similar interpretation applies to the Kimchi Premium observed in the Korean cryptocurrency market. Capital flow restrictions, remittance costs, and trading regulations impede the immediate execution of cross-border arbitrage, allowing price differentials to persist across domestic and offshore Bitcoin markets. Nevertheless, as demonstrated by the DCC–GARCH results in this study, global risk shocks and volatility-related information are transmitted across markets in a near-synchronous manner. In other words, while institutional boundaries constrain price convergence, they do not sever the transmission of risk dynamics.
From this perspective, the Kimchi Premium is consistent with the arguments developed in the preceding subsections on time-varying efficiency and cross-country market segmentation. It should therefore be interpreted not as a market anomaly unique to cryptocurrencies, but as a contemporary manifestation of institutional segmentation long observed in international financial markets. Just as price differentials in the Australian case diminished following the relaxation of capital controls, and as CNY–CNH spreads narrow during periods of regulatory coordination, the Kimchi Premium may likewise decline over the long run as policy clarity improves and market infrastructure becomes more integrated.
6. Concluding Remarks
In summary, this study demonstrates a clear structural divergence between return integration and efficiency correlation in cryptocurrency markets. The return-based DCC–GARCH results show strong global synchronization, particularly for same-asset cross-fiat pairs, whereas efficiency-based results derived from the rolling MF-DFA spectrum width reveal a far more heterogeneous and state-dependent pattern. Market inefficiency is persistent, time-varying, and becomes more pronounced during stress episodes and less stable across assets and regions. These findings imply that although cryptocurrency markets are highly integrated in return and volatility dynamics, the structural quality of information processing remains only partially synchronized. The Kimchi Premium is therefore better interpreted as price-level segmentation under institutional and regulatory frictions, rather than complete disconnection from global market dynamics. Market integration should accordingly be understood as a multidimensional phenomenon encompassing not only common price movements but also differences in efficiency across currencies, assets, and trading environments.
The empirical results show that cryptocurrency markets exhibit strong integration in return dynamics, but much more heterogeneous correlations in market efficiency. In the return-based DCC–GARCH analysis, same-asset cross-fiat pairs remain exceptionally highly correlated throughout the sample period, indicating strong global synchronization in short-run price movements. By contrast, the efficiency-based DCC results using the rolling MF-DFA spectrum width reveal a fundamentally different structure: while same-asset cross-fiat pairs still show high synchronization, cross-asset efficiency correlations are substantially weaker, more unstable, and often close to zero. These findings indicate that return integration and efficiency synchronization represent distinct dimensions of cross-market dependence, implying that globally synchronized price dynamics do not necessarily translate into uniformly synchronized market quality.
The results further show that market inefficiency is not static, but evolves over time in a state-dependent manner. The rolling MF-DFA estimates reveal pronounced time variation in both and , indicating that the degree of inefficiency fluctuates across market conditions rather than remaining constant. In particular, inefficiency tends to cluster over time: once it rises, it often remains elevated for an extended period before gradually reverting. Moreover, periods of market stress are typically associated with a widening of the multifractal spectrum, suggesting that structural complexity intensifies when large shocks dominate price discovery. Taken together, these results imply that inefficiency in cryptocurrency markets is a dynamic and persistent structural feature whose magnitude depends on changing market regimes.
The return-based DCC–GARCH results reveal that Bitcoin operates as a globally unified market in terms of risk dynamics, with mean dynamic conditional correlations across KRW, USD, and JPY markets consistently approaching unity (BTC-KRW–BTC-USD: 0.9624; BTC-USD–BTC-JPY: 0.9791). These near-unity correlations indicate that volatility shocks are transmitted almost instantaneously across currency-denominated markets, suggesting that the Kimchi Premium reflects segmentation in price levels rather than informational isolation. Regulatory frictions and capital controls impede price-level arbitrage, yet the underlying volatility process remains globally synchronized, embedding Korean investors in the same global risk environment as offshore participants. However, this high level of integration does not apply uniformly across all market pairs. The degree of co-movement differs substantially depending on whether pairs share the same asset or the same currency. The return-based DCC analysis reveals that the correlations structure of cryptocurrency markets coexists across two distinct regimes. For cross-currency pairs of the same asset, a high-integration regime is observed in which correlations remain persistently elevated and revert quickly after shocks; the mean dynamic conditional correlation between BTC-KRW and BTC-USD reaches 0.9624, while that between BTC-USD and BTC-JPY stands at 0.9791, with both series rarely falling below 0.95 throughout the sample period (
Table 4;
Figure 9a,b). By contrast, cross-asset pairs exhibit a state-dependent regime in which correlations are clearly lower and display wider variation over time; the mean correlation between BTC-KRW and ETH-KRW is 0.7667, substantially below the cross-currency counterparts (
Table 4;
Figure 9e). Given that asset-level correlations are state-dependent and evolve across different market regimes, these findings imply that price risk cannot be meaningfully reduced through currency substitution, whereas cross-asset dependence remains structurally variable and sensitive to prevailing market conditions.
The findings offer several practical insights for cryptocurrency market participants. First, trading the same cryptocurrency in a different currency does not provide meaningful risk reduction. The average dynamic conditional correlation between BTC-KRW and BTC-USD is 0.9624, meaning that switching between trading currencies is unlikely to serve as an effective hedging strategy.
Second, spreading investments across multiple cryptocurrencies offers less protection than expected during stress periods. During the COVID-19 shock, correlations across most pairs rose sharply simultaneously, demonstrating that diversification within the crypto market tends to break down precisely when it is needed most.
Third, the efficiency-based analysis suggests that investors should look beyond price trends when selecting assets. The case of XRP illustrates this well—when regulatory concerns such as the SEC lawsuit became prominent, the link between XRP and Bitcoin weakened considerably, showing that asset-specific legal risks can significantly affect co-movement with the broader market.
Finally, the Korean market tends to become less efficient during bull markets, as rising investor enthusiasm drives prices by sentiment rather than fundamentals. Investors should therefore exercise particular caution during periods of rapid price increases.
This study helps clarify some common misunderstandings about the Kimchi Premium and offers a clearer picture of why it exists and how it works.
First, the presence of the Kimchi Premium does not mean that the Korean market is cut off from global information. Price movements and volatility in the Korean market move closely with global markets in real time. The premium exists not because Korean investors lack access to global information, but because regulatory barriers—such as capital flow restrictions and foreign exchange controls—prevent arbitrageurs from closing the price gap. Market participants may be well aware of the price difference, yet institutional constraints prevent them from acting on it effectively.
Second, periods when the Korean market becomes less efficient tend to coincide with a wider Kimchi Premium. When efficiency declines, retail investors are more likely to trade on sentiment rather than fundamentals, pushing prices further from fair values and amplifying the gap between domestic and international prices. The Kimchi Premium should therefore be seen not simply as a pricing anomaly, but as a reflection of deeper structural issues in how the Korean market processes information.
Third, from a policy perspective, reducing barriers to capital movement and lowering the costs of cross-border arbitrage could help narrow the premium over time. Similar patterns have been observed in the Australian dollar forward market in the 1970s and in the onshore-offshore Chinese renminbi market, where easing institutional frictions gradually brought prices closer together. Policymakers should also consider how to protect domestic investors already exposed to global market risks when relaxing existing regulations.
Fourth, when global markets experience sharp downturns, the volatility of the Kimchi Premium tends to increase, suggesting that Korean investors who pay a premium domestically are not shielded from global shocks. Financial regulators should therefore account for the strong global linkages of the Korean cryptocurrency market when assessing systemic risks, rather than treating it as a largely domestic issue.
This study has several limitations. First, the empirical analysis is limited to 11 cryptocurrency–fiat pairs, as ETH-JPY was excluded due to insufficient data continuity over the full sample period, weakening the cross-market comparison for Japan and preventing a fully balanced three-currency framework. Second, quantitative results may be sensitive to methodological choices such as rolling-window length, MF-DFA moment range, and DCC-GARCH specification; although these settings were selected to balance stability and time variation, alternative choices could affect the estimated magnitude and persistence of inefficiency and correlation. Third, comparison with the Simple Hurst exponent shows that efficiency correlation estimates vary across methods; while qualitative conclusions remain consistent, the numerical differences suggest that efficiency synchronization is not entirely estimator-invariant and should be interpreted cautiously. Finally, although the framework captures time-varying patterns in returns and market efficiency, it does not explicitly model their economic drivers—factors such as liquidity, investor behavior, and regulation are discussed only as possible explanations, leaving the analysis mainly descriptive rather than causal.
In particular, the DCC–GARCH framework captures time-varying correlations among efficiency measures, but it does not establish causal transmission. Therefore, the observed efficiency connectedness should be interpreted as dynamic co-movement rather than evidence that changes in the efficiency of one local market cause changes in another. Future research may extend this analysis by applying Granger causality or related lead–lag tests to examine whether efficiency changes in the U.S. market predict subsequent efficiency changes in the Korean market.
Furthermore, the model does not formally separate global shocks from localized regulatory events. Future research could construct explicit event windows around identified global shocks (e.g., COVID-19, the May 2021 crash) and local regulatory events (e.g., Korean taxation announcements, FSA licensing changes) to formally assess their differential impact on DCC dynamics.
A further limitation concerns the treatment of daily closing times across exchanges. Although timestamps were standardized to UTC before conversion to local market time, the Korean (KST), U.S. (EST), and Japanese (JST) markets close at different points within the UTC day. As a result, what is recorded as the “same-day” return for each market may reflect partially non-overlapping information sets. This timing mismatch is especially consequential for Bitcoin, which trades around the clock: a price shock absorbed by the Korean market at its daily close may not yet be reflected in the U.S. close of the same calendar date, inflating the apparent contemporaneous correlation or, conversely, causing it to be understated depending on the direction of information flow. Future work could address this by reconstructing returns using a common UTC-based cutoff across all exchanges, or by reporting lagged cross-correlations at one-day offsets to gauge the sensitivity of the DCC estimates to non-synchronous trading.
We suggest several directions for future research. First, expanding the sample to include more cryptocurrencies, exchanges, and fiat markets would help determine whether the contrast between return integration and efficiency synchronization is robust across a broader market universe. Second, future studies could incorporate variables such as liquidity, trading activity, investor attention, and regulatory events to identify the drivers of efficiency synchronization more directly and move toward a more mechanism-based explanation. Third, comparing the DCC-GARCH results with alternative correlation or spillover frameworks, such as spillover indices, time-varying parameter models, or network approaches, would help test the robustness of the transmission structure. Finally, event-based analyses centered on crisis periods or major regulatory shocks could provide deeper insight into how return and efficiency synchronization evolve before, during, and after extreme market disruptions.