1. Introduction
Multimorbidity has become increasingly common among older adults and has created major challenges for health risk identification in elderly health consultation scenarios. In aging populations, chronic diseases rarely occur in isolation, and older users may simultaneously report diabetes, hypertension, chronic kidney disease, medication exposure, and age-related vulnerability. A systematic review by Marengoni et al. showed that multimorbidity is highly prevalent in older adults and is associated with complex care needs [
1]. Disease-specific guidelines may also be difficult to apply directly to individuals with multiple chronic conditions, because recommendations for one disease may conflict with the management of another [
2,
3]. In addition, polypharmacy increases medication-related safety risks and complicates health management for older adults [
4].
Risk identification in elderly health consultation scenarios is challenging because health risk may emerge from interactions among diagnosed diseases, medication exposure, and downstream adverse outcomes rather than from isolated risk factors. An elderly user may appear stable when each condition or medication exposure is considered separately. However, combinations of chronic disease history and medication-related adverse effects may increase overall risk. Therefore, health-oriented intelligent systems need to recognize not only explicit high-risk signals but also latent pathways through which risk may propagate across multiple disease domains. For such systems, interpretability is important because a risk label alone is insufficient without understandable evidence explaining why a case is considered high risk or low risk [
5,
6,
7,
8].
Recent approaches based on large language models (LLMs) and retrieval-augmented generation (RAG) have shown strong potential for medical text understanding, health consultation, and knowledge-grounded explanation generation. RAG improves factual grounding by retrieving external evidence before generation [
9]. Graph-based RAG methods further incorporate graph-structured knowledge into retrieval and generation, supporting relational evidence organization, graph-aware retrieval, and multi-hop reasoning [
10]. Biomedical knowledge graphs also provide a useful way to represent diseases, drugs, risk-related outcomes, and health-related relationships in a structured form [
11,
12]. However, many retrieval strategies still rely mainly on semantic relevance or graph connectivity. As a result, retrieved evidence may be topically related to a user profile but may not form a coherent risk mechanism.
This limitation becomes more evident when risk emerges through causal propagation rather than isolated association. For example, nonsteroidal anti-inflammatory drug use may increase renal risk in chronic kidney disease, persistent hyperglycemia may contribute to microvascular complications, and uncontrolled hypertension may increase the likelihood of cardiovascular events. In these cases, useful risk evidence is better represented as a pathway linking user-specific entities to downstream adverse outcomes. Recent causal retrieval and graph-based reasoning frameworks have attempted to incorporate causal structures into retrieval-augmented generation and complex reasoning [
13]. Nevertheless, user-specific, risk-aware causal path selection remains insufficiently explored for elderly multimorbidity risk identification in health consultation scenarios.
To address this gap, we propose RACPR, a risk-aware causal path re-ranking framework for interpretable multimorbidity risk identification. RACPR changes the retrieval unit from isolated text fragments or unconstrained graph neighborhoods to ordered causal paths. Each candidate path links user-reported diseases or medication exposures to downstream risk-related outcomes, and these paths are re-ranked using user-entity alignment, causal coherence, risk contribution, and path length control. The structured RACPR module determines benchmark-level risk scores and labels, while the LLM is used to transform selected causal evidence paths into readable, path-grounded explanations.
The main contributions of this work are as follows:
We construct a normalized multi-disease causal reasoning benchmark for elderly health consultation scenarios, covering diabetes, hypertension, and chronic kidney disease.
We propose RACPR, a risk-aware re-ranking mechanism that integrates user-entity alignment, causal coherence, risk contribution, and path length control to prioritize user-specific causal paths.
We introduce a constrained generative AI-assisted explanation strategy, in which the LLM converts RACPR-selected causal paths into readable explanations without changing RACPR-derived risk decisions.
We conduct comprehensive experiments, including comparisons with input-only, LLM-only, text-retrieval, graph-retrieval, and causal-retrieval baselines; bootstrap confidence interval analysis; ablation study; per-domain evaluation; explanation quality evaluation; sensitivity analysis; and failure-case analysis. The results provide controlled benchmark evidence that RACPR improves risk ranking and explicit causal-path grounding compared with the evaluated semantic retrieval, graph-based retrieval, causal-path retrieval, and direct LLM-based baselines.
3. Materials and Methods
3.1. Health Consultation Problem Formulation
In elderly health consultation scenarios, older adults may have multiple chronic diseases and concurrent medication exposure, making risk identification more complex than in single-condition settings. The coexistence of diabetes, hypertension, and chronic kidney disease may involve interacting disease processes, medication-related adverse effects, and cascading health risks. Therefore, this study focuses on a controlled formulation in which structured elderly health consultation cases are used for algorithmic risk identification and explanation evaluation.
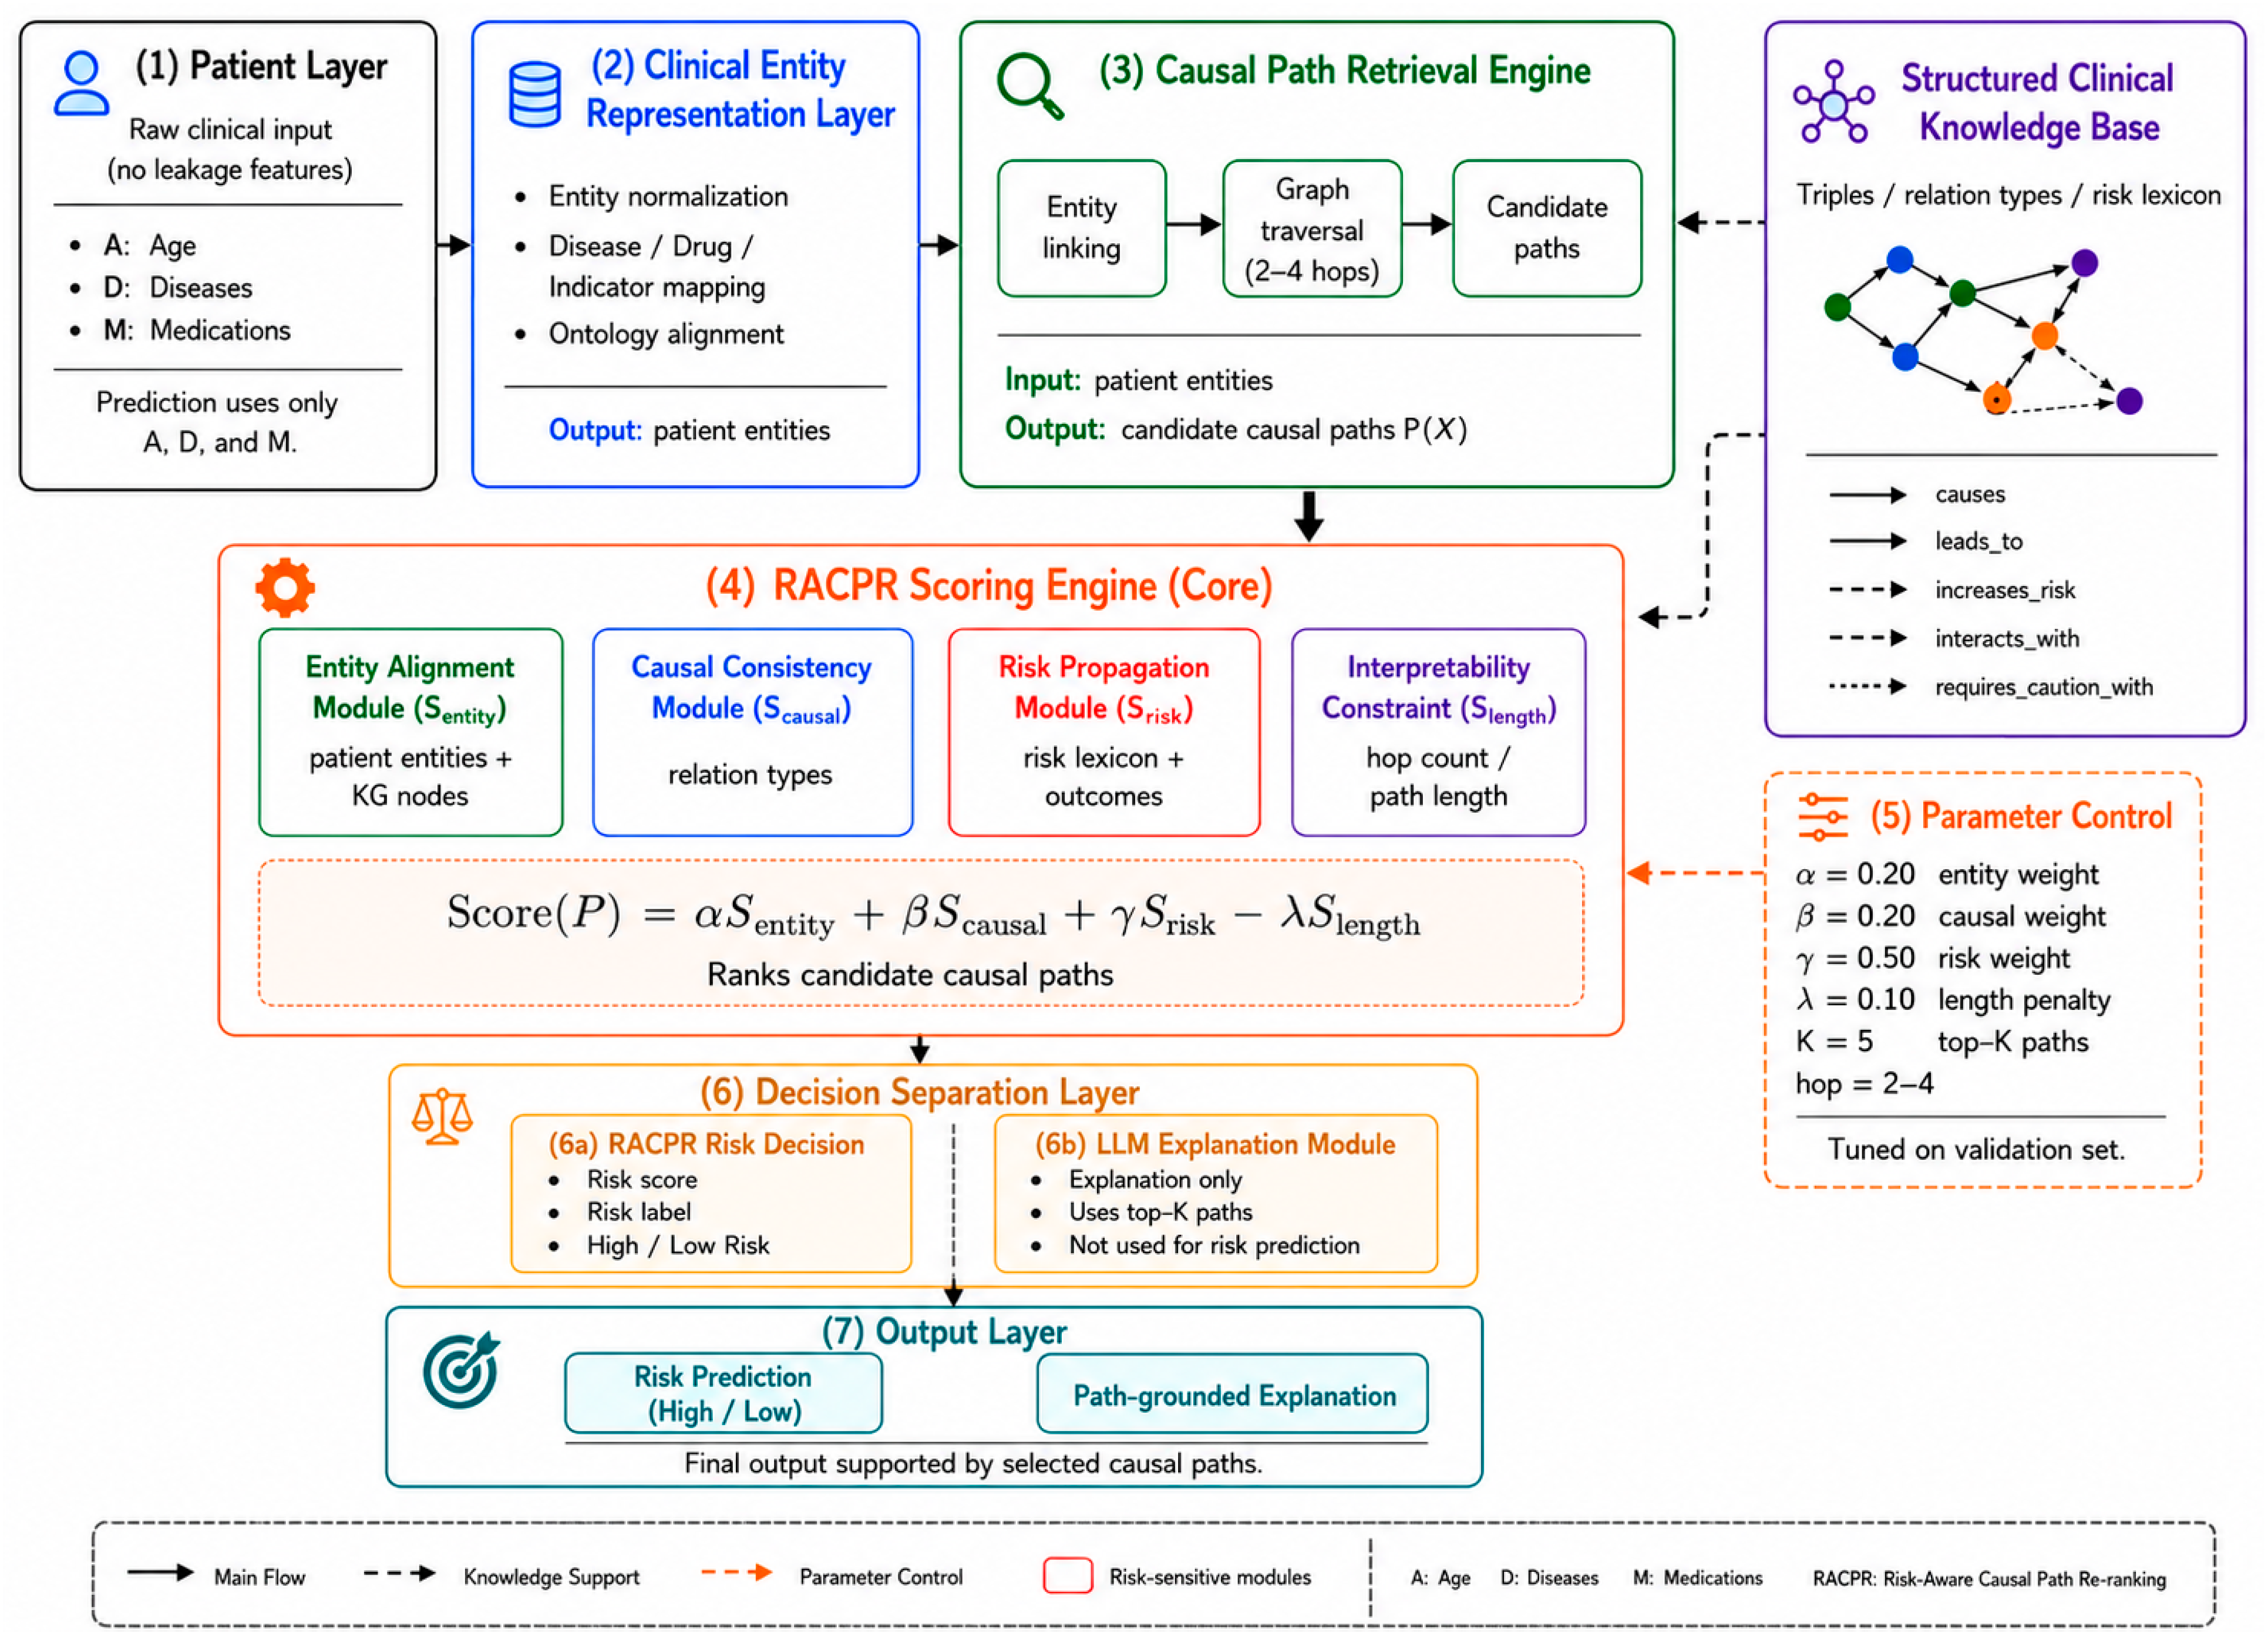
In this study, multimorbidity risk identification is formulated as a binary classification task over structured elderly health consultation cases. Each model-accessible case profile contains only three types of information: age, diagnosed diseases, and medication exposure. Explicit abnormal indicators, binary risk labels, support paths, and path-aligned rationales are stored separately as annotation fields in the benchmark. These annotation fields are withheld from all compared methods during prediction and are used only for label construction, causal-evidence evaluation, and explanation-quality assessment.
The predictive objective can be formulated as:
where
A denotes age,
D denotes the set of diagnosed diseases, and
M denotes the set of medication exposures in the restricted input profile. The objective is to predict a binary risk label
y from
Xreal, where
y = 1 indicates a high-risk consultation case associated with downstream adverse health outcomes, while
y = 0 indicates a relatively low-risk case.
To reflect the characteristics of chronic disease management in elderly health consultation scenarios, the task is defined across three disease domains: diabetes, hypertension, and chronic kidney disease. These domains correspond to metabolic, cardiovascular, and renal risk axes, respectively. This formulation enables the three disease domains to be modeled under a common causal reasoning framework.
Based on this formulation, RACPR predicts the binary risk label and retrieves supporting evidence paths for subsequent explanation, as illustrated in
Figure 1.
3.2. Data Sources and Preprocessing
All data used in this study were collected from publicly available biomedical literature and health information resources. PubMed abstracts related to diabetes, hypertension, and chronic kidney disease were organized into pubmed_abstracts.csv [
30]. Guideline and review passages were collected from publicly available sources and organized into guideline_review_texts.csv. Medication-safety evidence, including adverse effects, contraindications, drug–drug interactions, toxicity-related descriptions, and medication precautions, was collected from DrugBank and organized into drug_risk_texts.csv [
31]. General terminology and health information were supplemented using MedlinePlus and selected publicly available health information resources to support entity standardization and terminology completion [
32]. For traceability, source identifiers, document titles, evidence passages, source names, and source URLs were retained where available.
The source datasets played complementary roles in knowledge construction. The PubMed dataset contained 291 literature-level records, including 115 diabetes-related records, 96 hypertension-related records, and 80 chronic kidney disease-related records. The guideline and review dataset contained 45 document-level records, with 15 records for each target domain. The DrugBank-derived dataset contained 29,370 relation-level evidence records and was mainly used to construct medication-centered risk relations, including adverse effects, contraindications, interactions, toxicity increase, efficacy reduction, treatment relations, causation, and disease worsening.
During preprocessing, duplicate records were removed, disease-domain labels were assigned, biomedical and health-related terms were normalized using the domain-specific entity dictionary, candidate relations were extracted from text passages or evidence records, and relation types were standardized. The processed records were then organized into a domain-specific entity dictionary, a structured triple set, and a risk term lexicon. After automated preprocessing, author-led consistency checks were performed to identify normalization errors, inconsistent relation types, duplicate or implausible triples, and missing evidence-source links. The checked triples were stored in health_kg_clean_full.csv and further used to construct the balanced health-oriented knowledge graph.
The case-level benchmark was constructed using a deterministic, rule-based, and knowledge-graph-guided pipeline. First, seed entities were selected from the domain-specific entity dictionary and the health-oriented knowledge graph. Second, structured case profiles were constructed by combining age, diagnosed diseases, and medication exposure as model-accessible fields. Third, reference support paths were retrieved through deterministic graph matching and short-path expansion. Fourth, case-level risk scores and binary labels were assigned using predefined risk-related relations, outcome categories, medication-safety rules, vulnerability terms, and exposure-related entities.
Support paths and rationales were constructed as benchmark reference fields using deterministic graph retrieval and fixed rule-based templates. For high-risk cases, the reference path connected a model-accessible disease or medication exposure to a risk-related indicator, deterioration process, or downstream adverse outcome. For low-risk cases, the reference path was empty or represented stability-oriented evidence. The path-aligned rationale was constructed using a fixed template conditioned on the assigned risk label and selected support path.
To clarify the respective roles of human curation and automated processing, the workflow consisted of four distinct components. Public biomedical and health information resources were collected and organized as source-level evidence; deterministic and rule-based procedures were used for preprocessing, knowledge construction, benchmark generation, reference-path retrieval, and rationale construction; author-led checks were used to review consistency, plausibility, and evidence-source linkage; and the LLM was used only for post-prediction natural-language explanation generation. The LLM was not used to construct the knowledge graph, assign benchmark labels, generate reference support paths, or determine RACPR predictions.
Consistent with the task formulation in
Section 3.1, only age, diagnosed diseases, and medication exposures were used during prediction. Abnormal indicators, risk labels, support paths, and rationales were retained as annotation-only fields for label construction and evaluation.
Table 1 summarizes the role and accessibility of each field.
The final benchmark contains 1002 structured elderly health consultation cases covering diabetes, hypertension, and chronic kidney disease, with 334 cases in each domain. The dataset is balanced at the label level, containing 501 high-risk cases and 501 low-risk cases. It was divided into training, development, and test sets consisting of 597, 115, and 290 cases, respectively. The development set was used for threshold selection and hyperparameter tuning, whereas the test set was used for final evaluation.
Table 2 summarizes the datasets and knowledge resources used for entity normalization, knowledge construction, benchmark generation, path retrieval, and evaluation.
3.3. Causal Knowledge Representation
In this study, biomedical and health-related knowledge is represented as structured and causally interpretable relationships among diseases, medications, risk-related indicators, health processes, and adverse outcomes. Based on the source datasets described in
Section 3.2, we extracted, normalized, and organized evidence-supported relationships into explicit relational patterns, including medication-related adverse effects, disease progression, risk amplification, medication precautions, and cross-domain associations among chronic conditions.
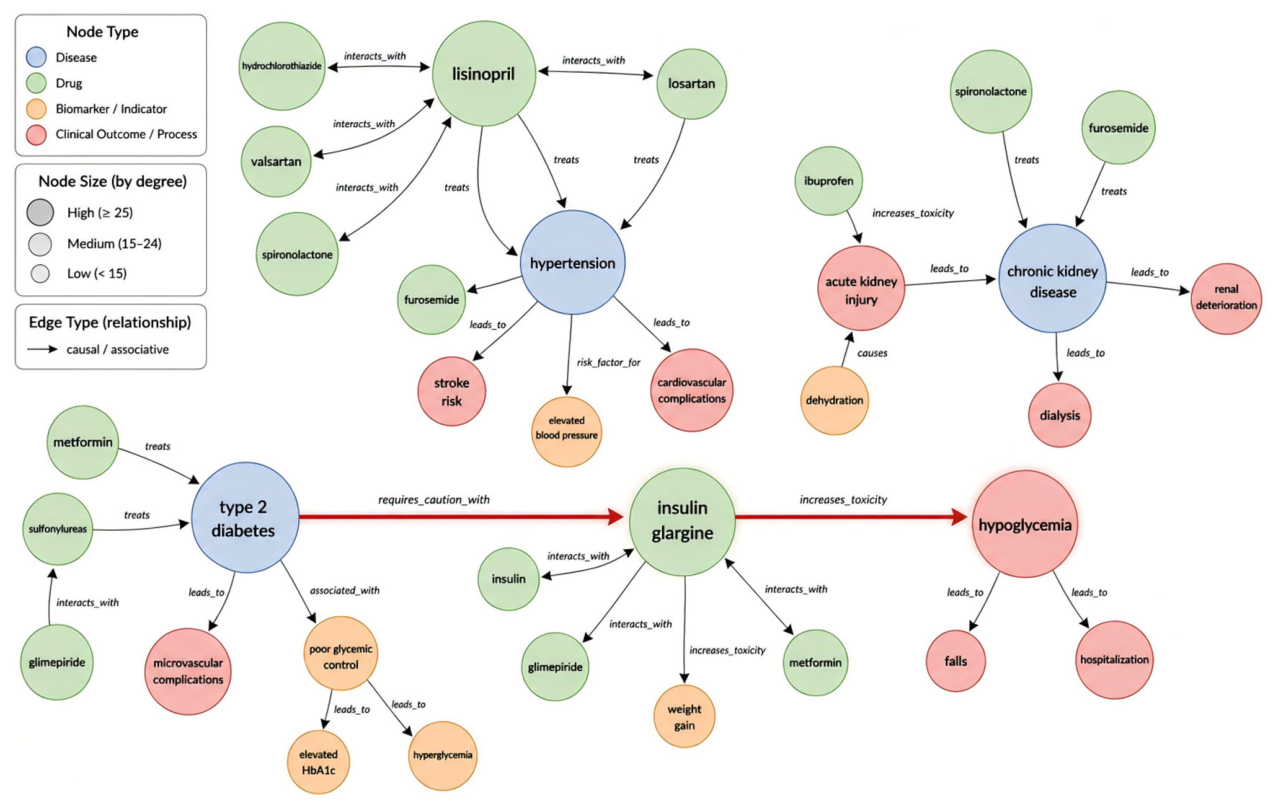
This representation is constructed from the curated triple set developed during knowledge construction. Each triple consists of a head entity, a relation type, and a tail entity, together with source evidence and domain annotations. The entities cover diseases, medications, risk-related indicators, health processes, and adverse outcomes, while the relation types capture interpretable biomedical and health-related associations, including causation, progression, risk amplification, drug interaction, and precautionary relations, such as causes, leads_to, increases_risk, interacts_with, and requires_caution_with.
Within this structured knowledge space, a causal path is defined as an ordered sequence of linked entities that connects a diagnosed disease or medication exposure to a downstream risk-related outcome. Formally, a causal path can be viewed as a sequence of triples linking entities from an upstream condition or exposure to a downstream outcome. For example, the path “NSAID use → acute kidney injury → renal deterioration” represents an evidence chain in which medication exposure is linked to worsening renal risk through an intermediate adverse event. Similar paths can also represent glycemic and cardiovascular risk progression, allowing the same representation framework to support the three target domains.
The purpose of this representation is not to construct a large-scale general medical graph but to provide a compact, task-oriented knowledge base for causal path retrieval and re-ranking.
Figure 2 presents a representative subgraph spanning the metabolic, cardiovascular, and renal risk domains.
3.4. Causal-Path-Based Risk Identification
Risk identification in this study is formulated as path-based evidence retrieval over the structured biomedical and health-oriented knowledge representation. Given a restricted structured input profile, the framework first matches model-accessible entities, including diagnosed diseases and medication exposures, and then retrieves candidate causal paths that connect these entities to downstream risk-related outcomes. Let P(X) denote the set of candidate causal paths retrieved for input X. In this setting, each path serves as an interpretable evidence chain linking upstream diseases or medication exposures to downstream risk outcomes. This formulation provides an intermediate reasoning layer for risk scoring, causal path re-ranking, and path-grounded explanation generation.
In this study, “evidence-supported,” “risk-informative,” and “path-grounded” are used as operational terms under the controlled benchmark setting. An evidence-supported path contains entities and relations represented in the constructed knowledge graph and linked to retained source evidence. A risk-informative path connects model-accessible diseases or medication exposures to risk-related indicators, deterioration processes, or downstream adverse outcomes through predefined risk-related relations. A path-grounded explanation is one whose main risk statement can be traced to the RACPR-selected path, including the relevant input entity, intermediate mechanism, or downstream outcome.
In the initial RACPR design, the candidate path space is constrained to short, evidence-supported, and interpretable evidence chains, allowing paths of up to four hops. This maximum hop depth was selected by the authors as a methodological design choice rather than as a fixed medical or health rule. The purpose of this constraint is to balance three requirements: retaining sufficient intermediate evidence links, preserving the readability of path-grounded explanations, and reducing semantic drift caused by overly long graph paths. Very short paths may capture only direct associations and may miss useful intermediate links related to disease progression or medication-related risk, whereas excessively long paths may introduce weakly relevant links, increase retrieval noise, and reduce interpretability. Therefore, allowing paths of up to four hops is treated as a controllable retrieval constraint in RACPR. Its influence on classification performance and explanation-oriented path coverage is further examined through the multi-hop sensitivity analysis reported in
Section 4.7.
Representative examples include “NSAID use → acute kidney injury → renal deterioration” for chronic kidney disease, “hyperglycemia → poor glycemic control → microvascular complications” for diabetes, and “blood pressure instability → stroke risk → cardiovascular complications” for hypertension. These examples illustrate the use of a common path-based representation across the three risk domains.
The retrieved candidate paths are subsequently scored and re-ranked by RACPR, as described in
Section 3.5.
3.5. Risk-Aware Causal Path Re-Ranking
Given a candidate path set
Pset (
X), RACPR assigns a ranking score to each path according to its relevance to the input profile and its contribution to risk identification.
Here, Sentity quantifies the degree of alignment between path entities and the model-accessible entity set. Higher scores are assigned to paths whose entities are more closely aligned with the restricted structured input, including diagnosed diseases and medication exposures.
Scausal evaluates the causal coherence of the path, reflecting whether the sequence of relations forms a plausible evidence chain related to risk development. Paths composed of evidence-supported relations related to causation, progression, medication precaution, or risk amplification receive higher causal scores. The causal coherence component is designed to reduce the retrieval of fragmented or weakly connected evidence. For each candidate path, RACPR examines whether adjacent relations form a coherent risk mechanism, such as medication exposure → adverse effect → deterioration process; disease → risk-related indicator → complication; or comorbidity → risk amplification → adverse outcome. Relation sequences that indicate causal, progressive, precautionary, or risk-enhancing links are considered more coherent, whereas weak associative or overly generic links are treated as less informative for causal risk propagation.
Srisk aggregates weighted risk terms associated with adverse-outcome nodes, vulnerability-related concepts, risk-related indicator nodes, and exposure-related entities appearing in the retrieved knowledge-graph path. These terms are derived from the risk lexicon and graph structure rather than from the withheld case-level abnormal-indicator field.
Slength penalizes overly long paths in order to preserve interpretability and reduce semantic drift. Longer paths are more likely to introduce weak or noisy connections, and the length penalty therefore encourages compact paths that remain understandable as evidence chains.
The coefficients α, β, γ, and λ control the relative contributions of these four components. The final score is used to rank candidate paths and select the top-K paths for risk scoring and subsequent explanation generation.
3.6. Generative AI-Assisted Path-Grounded Explanation Generation
After RACPR ranks the candidate paths, the selected path set P*(X), model-accessible input entities, and RACPR-derived risk label are provided to the LLM to generate a natural-language explanation. The LLM does not participate in knowledge-graph construction, benchmark-label assignment, reference-path construction, risk scoring, or label determination.
The generated explanation is evaluated by comparing its alignment with the selected paths and the benchmark reference rationale. For comparison, the LLM-only baseline receives only the restricted input profile and does not use RACPR-selected paths.
4. Results
4.1. Experimental Setup and Benchmark Dataset
Experiments were conducted on the normalized RACPR benchmark constructed in this study. The benchmark contains 1002 structured elderly health consultation cases across diabetes, hypertension, and chronic kidney disease, with 334 cases in each domain. It is balanced at the label level, containing 501 high-risk cases and 501 low-risk cases. The dataset was divided into training, development, and test sets consisting of 597, 115, and 290 cases, respectively. The development set was used for threshold selection and hyperparameter tuning, while the test set was used only for final evaluation.
All methods followed the leakage-control protocol defined in
Section 3.1 and
Section 3.2. The health-oriented knowledge graph was constructed independently of the evaluation cases and their labels.
Table 3 summarizes the benchmark and knowledge resources used in the experiments.
All experiments were implemented in Python 3.13.9 using the Python standard library and project-specific code. The LLM-only baseline and the path-grounded explanation module used the gpt-4o-mini model through an OpenAI-compatible HTTP endpoint.
The compared methods were selected to reflect the methodological progression from direct prediction to text retrieval, graph-enhanced retrieval, causal-path retrieval, and risk-aware causal path re-ranking. The Query-only heuristic produced a rule-based risk score directly from the restricted structured input profile. LLM-only used gpt-4o-mini to generate a risk score from the same restricted input, without retrieval augmentation. RAG retrieved textual evidence from the evidence corpus using TF-IDF similarity. GraphRAG-local retrieved deterministic graph community summaries associated with query-matched seed nodes, whereas GraphRAG-global ranked graph community summaries globally with respect to the query. GraphRAG-local and GraphRAG-global were implemented using Microsoft GraphRAG v3.0.9. CausalRAG Retrieval matched input entities to graph nodes, expanded candidate causal paths from seed nodes, and ranked paths according to entity alignment and causal relation strength. CausalRAG Retrieval was implemented locally using project-specific code in Python 3.13.9. RACPR further re-ranked causal paths by jointly considering input-entity alignment, causal coherence, risk contribution, and path length control.
For graph-based methods, model-accessible input entities were matched to graph nodes using lexical retrieval and entity alias expansion. For causal-path-based methods, candidate causal paths were enumerated from retrieved seed nodes within a limited hop range to preserve interpretability and reduce semantic drift. GraphRAG-local and GraphRAG-global used deterministic community summaries constructed from the health-oriented knowledge graph as graph-level retrieval evidence.
The baseline methods were selected according to their compatibility with the case-level risk-identification task and the leakage-controlled input setting. The comparison therefore focuses on methods that can directly process restricted case profiles and produce case-specific retrieval evidence, including input-only prediction, text retrieval, graph-community retrieval, causal-path retrieval, and risk-aware causal path re-ranking. Methods designed primarily for link prediction, node classification, knowledge graph completion, or other graph-supervision tasks were outside the scope of this comparison.
For all score-producing classification methods, continuous risk scores were converted into binary high-risk or low-risk labels using thresholds selected exclusively on the development set. For each method, we performed a deterministic grid search over candidate thresholds derived from the development-set score distribution. The selected threshold maximized F1-score among thresholds satisfying the predefined minimum Recall constraint of 0.85. If no threshold satisfied this constraint, the threshold with the highest development-set recall-aware F1 objective was selected. The resulting method-specific threshold was fixed and applied once to the held-out test set. Test-set labels were not used for threshold selection, hyperparameter tuning, or evidence retrieval and were used only once for final performance evaluation after all configurations had been fixed. RACPR used the development-set configuration
α = 0.20,
β = 0.20,
γ = 0.50, and
λ = 0.10, as defined in
Section 3.5.
The final method comparison was conducted on the test set, followed by bootstrap confidence interval estimation, ablation analysis, per-domain evaluation, explanation quality evaluation, top-n path sensitivity analysis, parameter sensitivity analysis, hop-range sensitivity analysis, and illustrative benchmark examples with failure case analysis.
4.2. Overall Risk Classification Performance
To evaluate the performance of the proposed RACPR framework, we compared it with multiple baseline methods on the held-out test set. The evaluation metrics include Accuracy, Precision, Recall, F1-score, and AUC.
Table 4 summarizes the overall performance of all methods under the leakage-controlled input setting.
Accuracy measures the overall proportion of correctly classified cases. Precision indicates the proportion of cases predicted as high risk that are truly high risk, reflecting the ability to reduce false-positive warnings. Recall measures the proportion of actual high-risk cases successfully identified by the model, reflecting the ability to avoid missing high-risk cases. F1-score provides a balanced measure of Precision and Recall, while AUC evaluates the discriminative ability of each method across different decision thresholds.
As shown in
Table 4, the Query-only heuristic and LLM-only baseline produced identical threshold-based classification results, with an Accuracy of 0.500, a Precision of 0.500, a Recall of 1.000, and an F1-score of 0.667. This indicates that, under the recall-oriented thresholding strategy, both methods classified all or nearly all test cases as high risk. Although this produced perfect Recall, it also resulted in limited specificity and weak threshold-based discrimination. The LLM-only baseline achieved a higher AUC than the Query-only heuristic, increasing from 0.502 to 0.573, suggesting that the LLM provided slightly better continuous risk ranking even when the final binary predictions were similar.
Compared with these input-only baselines, retrieval-augmented methods achieved more balanced performance. The RAG baseline improved Accuracy to 0.562 and F1-score to 0.694, with an AUC of 0.619, indicating that retrieved textual evidence provided additional risk signals beyond the restricted structured input alone. Graph-based retrieval further improved performance. GraphRAG-local and GraphRAG-global achieved F1-scores of 0.722 and AUC values of 0.692 and 0.697, respectively. These results suggest that community-level graph summaries provided more structured evidence than text retrieval alone. The similar performance of GraphRAG-local and GraphRAG-global also indicates that both local seed-centered summaries and global community-summary ranking captured useful graph-level risk information.
CausalRAG Retrieval achieved an Accuracy of 0.659, a Precision of 0.605, a Recall of 0.917, an F1-score of 0.729, and an AUC of 0.685. Compared with GraphRAG-local and GraphRAG-global, it achieved a slightly higher F1-score, indicating that explicit causal path retrieval improved threshold-based classification performance. However, its AUC was slightly lower than those of both GraphRAG variants, suggesting that causal path retrieval alone improved high-risk identification but did not provide the best overall risk ranking.
RACPR achieved the highest F1-score and AUC among all compared methods, with an Accuracy of 0.659, a Precision of 0.602, a Recall of 0.938, an F1-score of 0.733, and an AUC of 0.777. Compared with CausalRAG Retrieval, RACPR improved Recall from 0.917 to 0.938 and AUC from 0.685 to 0.777, while maintaining the same Accuracy of 0.659. Compared with GraphRAG-global, RACPR improved AUC from 0.697 to 0.777. These results indicate that the proposed risk-aware causal path re-ranking strategy improved continuous risk ranking among the compared methods.
Overall, RACPR achieved the strongest continuous risk-ranking performance among the evaluated methods, although its fixed-threshold F1 improvement over CausalRAG Retrieval was modest.
4.3. Statistical Reliability Analysis
To assess the stability of the observed performance differences, we conducted bootstrap confidence interval analysis on the test set. Bootstrap resampling was performed at the case level to estimate the variability of model performance under repeated sampling. Compared with a single point estimate, a bootstrap confidence interval provides a range of plausible values for a performance metric and reflects the uncertainty associated with the finite test set.
In this study, we report 95% confidence intervals for F1-score and AUC. The F1-score was selected because it summarizes the balance between Precision and Recall under the fixed decision threshold, while AUC was selected because it evaluates the risk-ranking ability of each method across different thresholds.
Table 5 reports the bootstrap confidence intervals for all compared methods.
As shown in
Table 5, the Query-only heuristic and LLM-only baseline achieved the same F1-score of 0.667, with identical 95% confidence intervals of 0.616–0.714. This is consistent with their similar high-recall threshold-based prediction behavior. However, LLM-only obtained a higher AUC than the Query-only heuristic, increasing from 0.502 to 0.573, suggesting that the LLM provided slightly better continuous risk ranking even when the final binary predictions were similar.
Retrieval-based methods showed improved performance over the input-only baselines. RAG increased the F1-score to 0.694 and AUC to 0.619, indicating that textual evidence retrieval provided additional risk signals beyond the restricted structured input. GraphRAG-local and GraphRAG-global further improved the F1-score to 0.722, with AUC values of 0.692 and 0.697, respectively. Their confidence intervals were also shifted upward compared with RAG, suggesting that graph community summaries provided more reliable structured evidence than text retrieval alone.
CausalRAG Retrieval achieved a slightly higher F1-score of 0.729, with a 95% confidence interval of 0.669–0.778. This suggests that explicit causal path retrieval improved fixed-threshold classification performance. However, its AUC of 0.685 was slightly lower than those of both GraphRAG variants, indicating that causal path retrieval alone did not provide the best continuous risk ranking.
RACPR achieved the highest F1-score and AUC among all compared methods, with an F1-score of 0.733 and an AUC of 0.777. Although the F1-score improvement over CausalRAG Retrieval was modest, RACPR showed a clearer advantage in AUC, with a 95% confidence interval of 0.730–0.830. This suggests that risk-aware causal path re-ranking improved the ordering of high-risk and low-risk cases across bootstrap samples.
Overall, the reliability analysis supports the conclusion that RACPR’s main advantage lies in improved continuous risk ranking and risk-aware causal evidence prioritization, rather than only in fixed-threshold F1-score gains. These results are consistent with the overall performance analysis in
Section 4.2.
4.4. Ablation Study of RACPR Components
To evaluate the contribution of each scoring component in RACPR, we conducted an ablation study by removing one component at a time. The evaluated variants included the full RACPR model, RACPR without the entity matching component (w/o
Sentity), without the causal strength component (w/o
Scausal), without the risk-aware component (w/o
Srisk), and without the path length penalty (w/o
Slength). Accuracy, F1-score, and AUC are reported as representative metrics. The results are summarized in
Table 6.
As shown in
Table 6, removing any scoring component led to performance degradation, indicating that RACPR benefits from the joint use of input-entity alignment, causal coherence, risk contribution, and path length control. The full RACPR model achieved an Accuracy of 0.659, an F1-score of 0.733, and an AUC of 0.777, outperforming all ablation variants.
Among all variants, removing Srisk caused the largest decline in risk discrimination, with AUC decreasing from 0.777 to 0.428. This result indicates that risk-related signals are essential for identifying risk-informative evidence paths and separating high-risk cases from low-risk cases. Removing Slength also substantially reduced AUC from 0.777 to 0.534, suggesting that path length control helps suppress overly long or weakly connected paths that may introduce noise into the final risk score.
Removing Sentity and Scausal also reduced performance, showing that both input-entity alignment and causal coherence contribute to reliable path selection. Without entity alignment, RACPR is less able to prioritize paths directly related to the restricted input profile. Without causal coherence, selected paths may become less consistent with ordered evidence patterns related to downstream adverse outcomes.
Overall, the ablation results show that RACPR works best as a joint scoring mechanism rather than a single-factor ranking strategy. Srisk plays the most critical role in risk discrimination, while Slength provides important regularization for compact and interpretable causal path retrieval.
4.5. Per-Domain Performance Analysis
To further examine whether RACPR performs consistently across different chronic disease scenarios, we conducted a per-domain performance analysis on chronic kidney disease, diabetes, and hypertension cases.
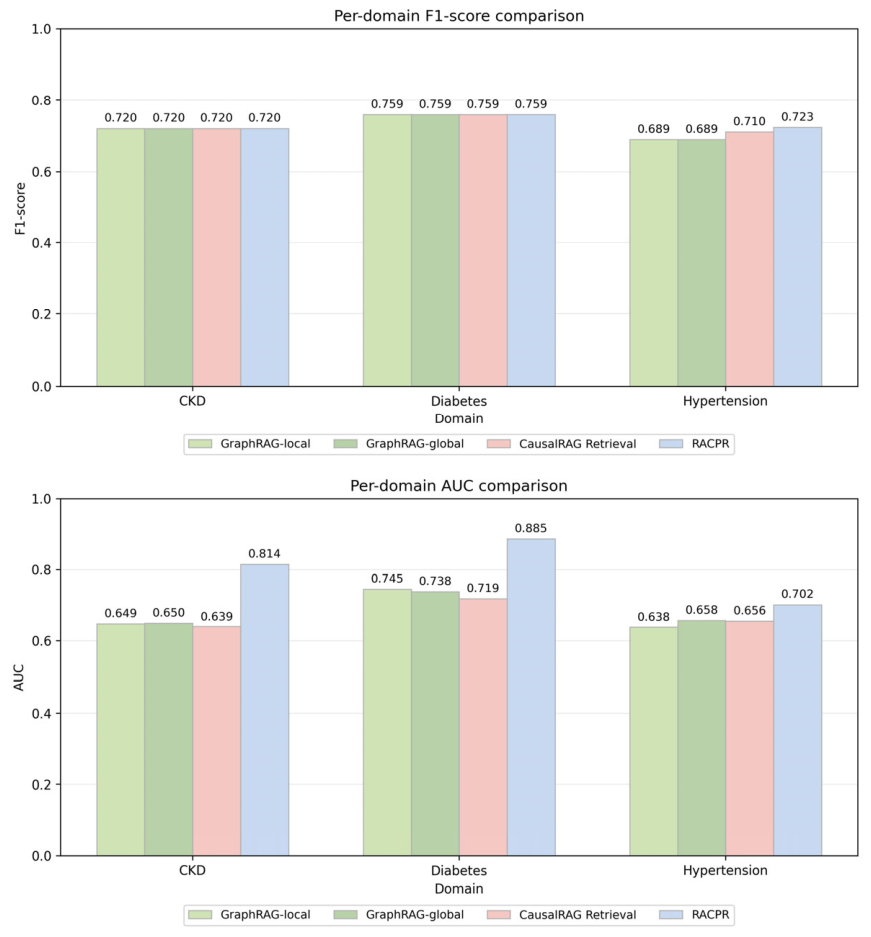
Figure 3 presents the per-domain F1-score and AUC comparison among GraphRAG-local, GraphRAG-global, CausalRAG Retrieval, and RACPR.
As shown in
Figure 3, RACPR achieved competitive or better performance across all three disease domains. The results suggest that RACPR’s main domain-level advantage lies in continuous risk ranking, as reflected by AUC, rather than only in fixed-threshold F1-score.
In the chronic kidney disease domain, all four methods achieved the same F1-score of 0.720. However, RACPR achieved a higher AUC of 0.814, compared with 0.649 for GraphRAG-local, 0.650 for GraphRAG-global, and 0.639 for CausalRAG Retrieval. This indicates that although the methods produced similar binary classification results under the fixed threshold, RACPR ranked high-risk and low-risk CKD cases more effectively. The result suggests that risk-aware causal path re-ranking improved the discriminative quality of risk scores even when threshold-based classification outcomes remained unchanged.
A similar pattern was observed in the diabetes domain. All four methods achieved the same F1-score of 0.759, while RACPR obtained the highest AUC of 0.885. In comparison, GraphRAG-local, GraphRAG-global, and CausalRAG Retrieval achieved AUC values of 0.745, 0.738, and 0.719, respectively. This result indicates that RACPR better captured graded risk differences among diabetes cases. The improvement in AUC suggests that prioritizing risk-informative causal paths related to metabolic deterioration, medication exposure, and downstream complications can improve case-level risk ranking beyond community-summary retrieval or causal path retrieval alone.
In the hypertension domain, RACPR achieved both the highest F1-score and the highest AUC among the compared graph-based and causal-path methods. RACPR improved F1-score to 0.723, compared with 0.689 for both GraphRAG-local and GraphRAG-global and 0.710 for CausalRAG Retrieval. RACPR also achieved an AUC of 0.702, higher than GraphRAG-local, GraphRAG-global, and CausalRAG Retrieval, which obtained AUC values of 0.638, 0.658, and 0.656, respectively. These results suggest that RACPR provided additional benefit in hypertension cases by improving both fixed-threshold classification and continuous risk ranking, although the AUC improvement was smaller than in the CKD and diabetes domains.
Overall, the per-domain results show that RACPR achieved the highest AUC across all three chronic disease domains. In CKD and diabetes, RACPR preserved the same F1-score as the compared graph-based and causal-path methods while improving AUC, indicating better risk ranking under similar binary classification behavior. In hypertension, RACPR improved both F1-score and AUC over the compared methods. These findings suggest that RACPR is relatively stable across disease domains and that its main contribution is risk-aware causal evidence prioritization for improved case-level risk discrimination in elderly health consultation scenarios.
4.6. Explanation Quality Evaluation
To evaluate whether the proposed framework can provide faithful and evidence-grounded explanations, we further assessed the quality of generated rationales and retrieved causal evidence. In the RACPR + GenAI setting, RACPR-selected causal paths were used as structured evidence for generating path-grounded natural-language explanations. Therefore, the evaluation considered both causal evidence selection and generative AI-assisted explanation quality.
Six automatic benchmark-based metrics were used: Path Coverage, Path Hit Rate, Path Consistency, Outcome Coverage, Health-Oriented Plausibility, and Rationale Overlap. Path Coverage measures the proportion of key entities or relations in the benchmark reference support path that are covered by the retrieved or generated evidence. Path Hit Rate measures whether the predicted path hits at least one core node in the benchmark reference support path. Path Consistency evaluates whether the generated explanation remains consistent with the selected evidence path and the predicted risk direction. Outcome Coverage measures whether the explanation or path covers the risk-related outcome described in the benchmark reference rationale. Health-Oriented Plausibility checks whether the selected path follows predefined evidence-supported risk relation patterns. Rationale Overlap measures lexical overlap between the generated explanation and the benchmark reference rationale. Together, these metrics provide a reproducible evaluation of evidence grounding, risk-outcome coverage, and path-based explanation consistency under the constructed benchmark setting.
As shown in
Table 7, LLM-only was marked as not applicable because it did not retrieve external evidence or produce structured causal paths. Therefore, path-based and evidence-grounding metrics could not be computed for this baseline.
RAG achieved zero Path Coverage, Path Hit Rate, Path Consistency, and Health-Oriented Plausibility because it retrieves unstructured textual evidence rather than explicit graph paths. However, it obtained an Outcome Coverage of 0.251 and the highest Rationale Overlap score of 0.182. This suggests that textual retrieval can capture some surface-level rationale terms and outcome-related expressions, but it does not provide explicit causal path grounding.
GraphRAG-local and GraphRAG-global achieved high Path Consistency scores of 0.976 and 0.972, respectively, and higher Outcome Coverage than RAG, with scores of 0.517 and 0.505. These results indicate that graph community summaries can provide coherent and outcome-relevant evidence. However, both methods obtained zero Path Coverage and Path Hit Rate because their retrieved evidence is represented as community summaries rather than explicit causal paths aligned with benchmark reference support paths. Their Health-Oriented Plausibility scores were also zero under the current path-format-based evaluation rule, which requires explicit risk relation paths. Therefore, these zero scores reflect evidence-format differences in the benchmark evaluation rather than the absence of useful graph-level information.
CausalRAG Retrieval produced explicit causal paths and therefore achieved nonzero Path Coverage and Path Hit Rate, with scores of 0.076 and 0.276, respectively. It also achieved a high Health-Oriented Plausibility score of 0.998, indicating that most retrieved causal paths followed predefined evidence-supported risk relation patterns. However, its Path Consistency score of 0.814 and Outcome Coverage score of 0.331 were lower than those of RACPR + GenAI, suggesting that causal path retrieval alone does not always prioritize the most outcome-relevant or consistently grounded evidence.
RACPR + GenAI achieved the strongest explicit path-grounding performance among the path-based methods. It obtained the highest Path Coverage of 0.091, Path Hit Rate of 0.314, Path Consistency of 1.000, and Health-Oriented Plausibility of 1.000. Its Outcome Coverage score was 0.430, lower than the GraphRAG-local and GraphRAG-global scores but higher than those of RAG and CausalRAG Retrieval. This indicates that RACPR + GenAI provided explicit and internally consistent causal-path grounding, while graph community summaries sometimes covered broader outcome-related information at the summary level.
Rationale Overlap showed a different pattern from the path-grounded metrics. RAG achieved the highest Rationale Overlap score, followed by GraphRAG-local, GraphRAG-global, CausalRAG Retrieval, and RACPR + GenAI. This metric is based on lexical overlap with benchmark reference rationales and may assign lower scores to semantically appropriate explanations expressed with different wording. Therefore, Rationale Overlap is interpreted as a surface-level similarity measure rather than as the primary indicator of explanation faithfulness.
Overall, RACPR + GenAI showed the strongest performance on explicit path-grounding metrics, including Path Coverage, Path Hit Rate, Path Consistency, and Health-Oriented Plausibility. GraphRAG-local and GraphRAG-global achieved higher Outcome Coverage, reflecting the broader content coverage of graph community summaries. These results suggest that different explanation metrics capture different aspects of explanation quality. Under the automatic benchmark-based evaluation used in this study, RACPR + GenAI mainly improves explicit causal evidence grounding and consistency, while GraphRAG-based summaries provide broader outcome-level coverage.
4.7. Sensitivity Analysis of Top-n, Parameters, and Hop Range
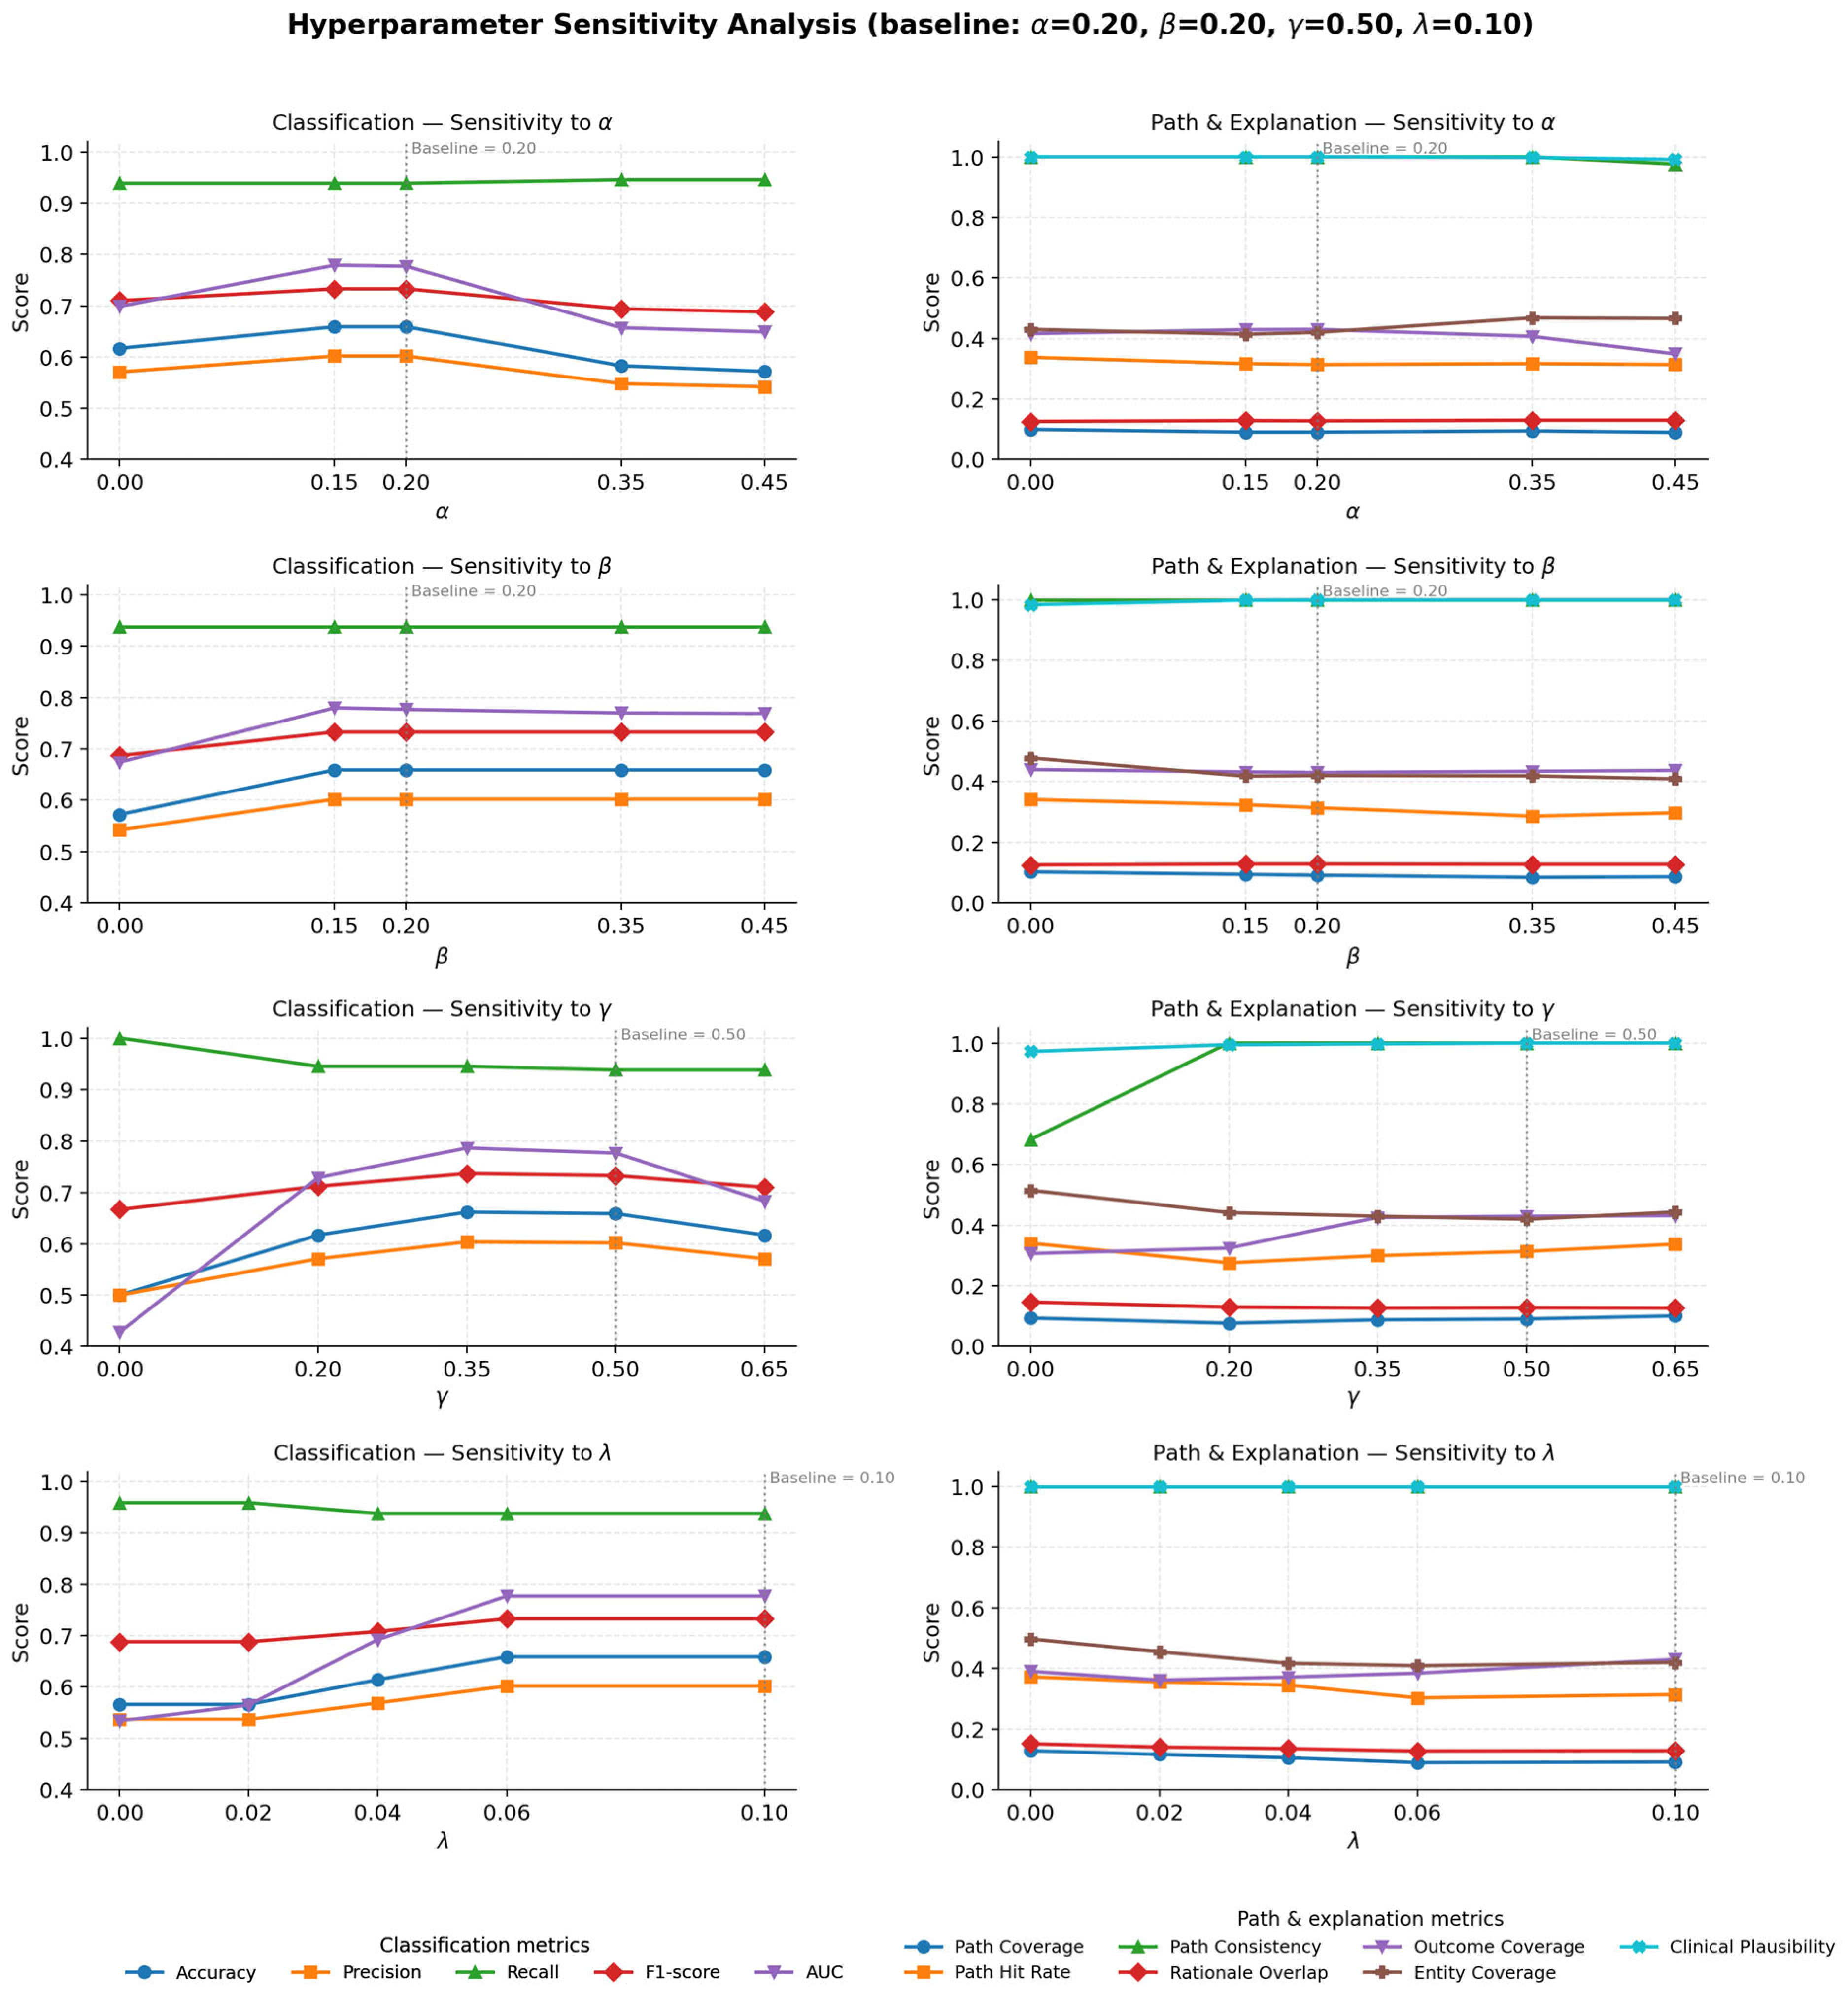
To evaluate the robustness of RACPR, we conducted sensitivity analyses on three key settings: the number of selected causal paths, the main scoring parameters, and the maximum hop range. These analyses examined whether RACPR depended heavily on a single evidence selection setting or parameter configuration. The results are presented in
Figure 4 and
Figure 5 and
Table 8.
4.7.1. Top-n Path Sensitivity Analysis
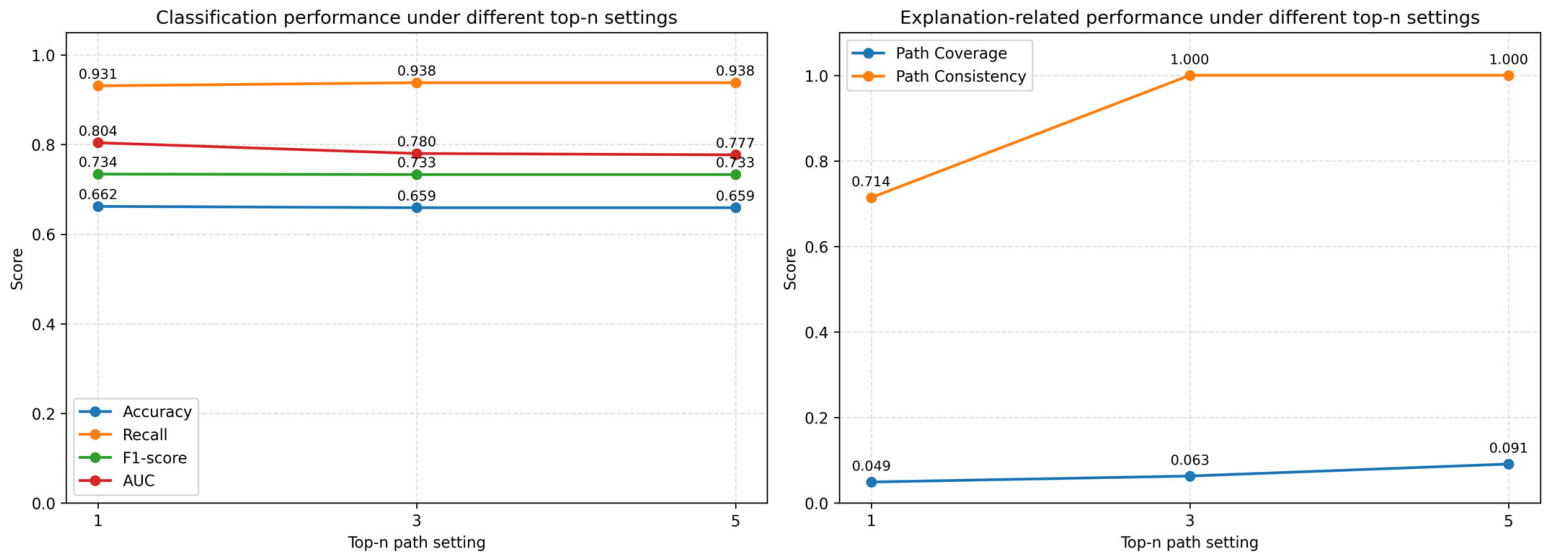
Figure 4 shows the influence of different top-n path settings on RACPR performance. The top-
n value controls how many re-ranked causal paths are retained as structured evidence for risk identification and path-grounded explanation generation.
When top-1 was used, RACPR achieved the highest classification performance, with an Accuracy of 0.662, a Recall of 0.931, an F1-score of 0.734, and an AUC of 0.804. However, this setting produced limited evidence coverage, with a Path Coverage of 0.049 and a Path Consistency of 0.714. When top-3 was used, RACPR maintained similar classification performance, with an Accuracy of 0.659, a Recall of 0.938, an F1-score of 0.733, and an AUC of 0.780, while Path Consistency increased to 1.000. When top-5 was used, classification performance remained stable, with an Accuracy of 0.659, a Recall of 0.938, an F1-score of 0.733, and an AUC of 0.777. At the same time, Path Coverage increased to 0.091, and Path Consistency remained 1.000.
These results indicate that RACPR remained stable across different top-n settings. Although top-1 achieved the highest AUC, it provided lower evidence coverage and weaker path consistency. In contrast, top-5 preserved nearly the same F1-score and Recall while improving causal evidence coverage. These results support the pre-specified top-5 configuration, which was used in the main experiments to balance classification performance and explanation-oriented evidence coverage.
4.7.2. Parameter Sensitivity Analysis
The baseline configuration was α = 0.20, β = 0.20, γ = 0.50, and λ = 0.10. For each parameter, only the corresponding value was varied, while the other three parameters were fixed at the baseline values. The left column reports classification metrics, and the right column reports path and explanation quality metrics. The dashed vertical line indicates the baseline value used in the final RACPR configuration.
Figure 5 presents the parameter sensitivity results of RACPR. The baseline configuration achieved an Accuracy of 0.659, a Precision of 0.602, a Recall of 0.938, an F1-score of 0.733, and an AUC of 0.777. Overall, RACPR remained relatively stable under moderate changes in
α and
β. In particular, when
β varied from 0.15 to 0.45, the F1-score remained 0.733, and AUC only slightly decreased from 0.780 to 0.769. This indicates that the framework was not overly sensitive to moderate perturbations of the causal-strength weight.
By contrast, γ and λ had stronger effects on performance. When γ was set to 0.00, the F1-score decreased to 0.667 and AUC dropped to 0.428, showing that the risk contribution component was essential for risk discrimination. Although γ = 0.35 produced a slightly higher F1-score of 0.737 and AUC of 0.787, the difference from the baseline was small. Therefore, the baseline setting was retained because it provided stable performance while preserving a stronger emphasis on risk contribution. Similarly, when λ was set to 0.00, AUC decreased to 0.534, indicating that the path length penalty helped suppress noisy or weakly connected paths.
For path and explanation quality, Path Consistency and Health-Oriented Plausibility remained close to or equal to 1.000 under most parameter settings. However, Path Consistency decreased to 0.683 when γ = 0.00, suggesting that the risk contribution component also helped maintain consistency between retrieved paths, predicted risk direction, and generated explanations. Overall, the baseline configuration provided a balanced setting for classification performance, risk-aware causal path retrieval, and path-grounded explanation quality.
4.7.3. Hop-Range Sensitivity Analysis
To examine the influence of the hop-range constraint in RACPR, we conducted a hop-depth sensitivity analysis under the default relevance-based ranking strategy. Candidate causal paths were ranked directly according to the RACPR score, and the Top-5 highest-ranked paths were used as the final evidence paths. No additional constraint on hop-depth diversity was imposed. The purpose of this analysis was to evaluate whether increasing the maximum path length would affect risk classification performance or explanation-oriented path coverage.
We evaluated representative classification and path-quality metrics, including Accuracy, F1-score, AUC, Path Coverage, Path Hit Rate, Path Consistency, and Mean Hop. Because Accuracy, F1-score, AUC, Path Hit Rate, and Path Consistency remained unchanged across all hop-depth settings,
Table 8 reports only the two metrics that changed.
As shown in
Table 8, increasing the maximum hop depth from 1 to 2 produced only a marginal increase in Path Coverage from 0.087 to 0.091 and Mean Hop from 1.00 to 1.02. No further change was observed from 2 to 4 hops. This suggests that allowing paths longer than one hop slightly increased evidence coverage, but the final selected paths remained dominated by short and direct health-related relations. Longer path expansion did not improve classification performance under the default relevance-based ranking strategy. Therefore, the up-to-four-hop setting should be interpreted as an interpretability-oriented retrieval boundary rather than as a performance-tuning factor.
To further examine whether the limited use of deeper paths was caused by candidate path enumeration or by final Top-5 selection, we conducted an additional targeted variant analysis. We compared ordinary BFS-based enumeration with hop-wise enumeration, relevance-based selection with depth-balanced Top-5 selection, and different values of the path length penalty parameter λ.
The targeted analysis showed that replacing ordinary BFS enumeration with hop-wise enumeration alone did not change the final selected paths or classification results. Under relevance-based selection with λ = 0.10, both enumeration strategies produced almost entirely short paths in the final Top-5 evidence set. This indicates that the dominance of short paths was not mainly caused by the enumeration method, but by the relevance-based scoring and selection process, which naturally favored compact and high-scoring evidence chains.
Depth-balanced selection successfully promoted deeper paths into the final evidence set. The Mean Hop increased from 1.02 under relevance-based selection to 1.746 with depth-balanced selection, and further to 2.164 when hop-wise enumeration was combined with depth-balanced selection. The proportion of paths with three or more hops also increased, indicating that deeper causal chains can be retrieved when path-depth diversity is explicitly encouraged.
However, this increase in path depth introduced a performance trade-off. Depth-balanced selection reduced AUC compared with the default relevance-based setting. Combining hop-wise enumeration with depth-balanced selection improved the result relative to depth-balanced selection alone, but the AUC still remained lower than the default setting. Reducing the path length penalty λ from 0.10 to 0.04 or 0.00 did not introduce additional deeper paths and further decreased AUC.
Overall, these findings suggest that deeper paths are available and can be algorithmically promoted, but they did not improve final classification performance on the current benchmark. The default relevance-based selection with λ = 0.10 therefore provides a more stable balance between risk discrimination and interpretable evidence compactness. Depth-balanced selection is useful as an explanation-oriented diagnostic setting because it increases the visibility of deeper causal chains, but it should not replace the default relevance-based strategy in the main experiments. Therefore, allowing paths of up to four hops should be interpreted as a controlled retrieval boundary that preserves the possibility of multi-step evidence retrieval, while final evidence selection remains governed by risk-aware relevance ranking.
4.8. Illustrative Benchmark Examples and Failure Case Analysis
To complement the aggregate experimental results, this section presents case-level examples of RACPR reasoning. We first provide an illustrative benchmark example to show how RACPR selects causal evidence paths and uses GenAI to generate a path-grounded explanation. We then analyze representative failure cases from the test set to clarify incorrect predictions and recurrent RACPR error patterns under the leakage-controlled test setting.
4.8.1. Example of GenAI-Assisted Path-Grounded Reasoning
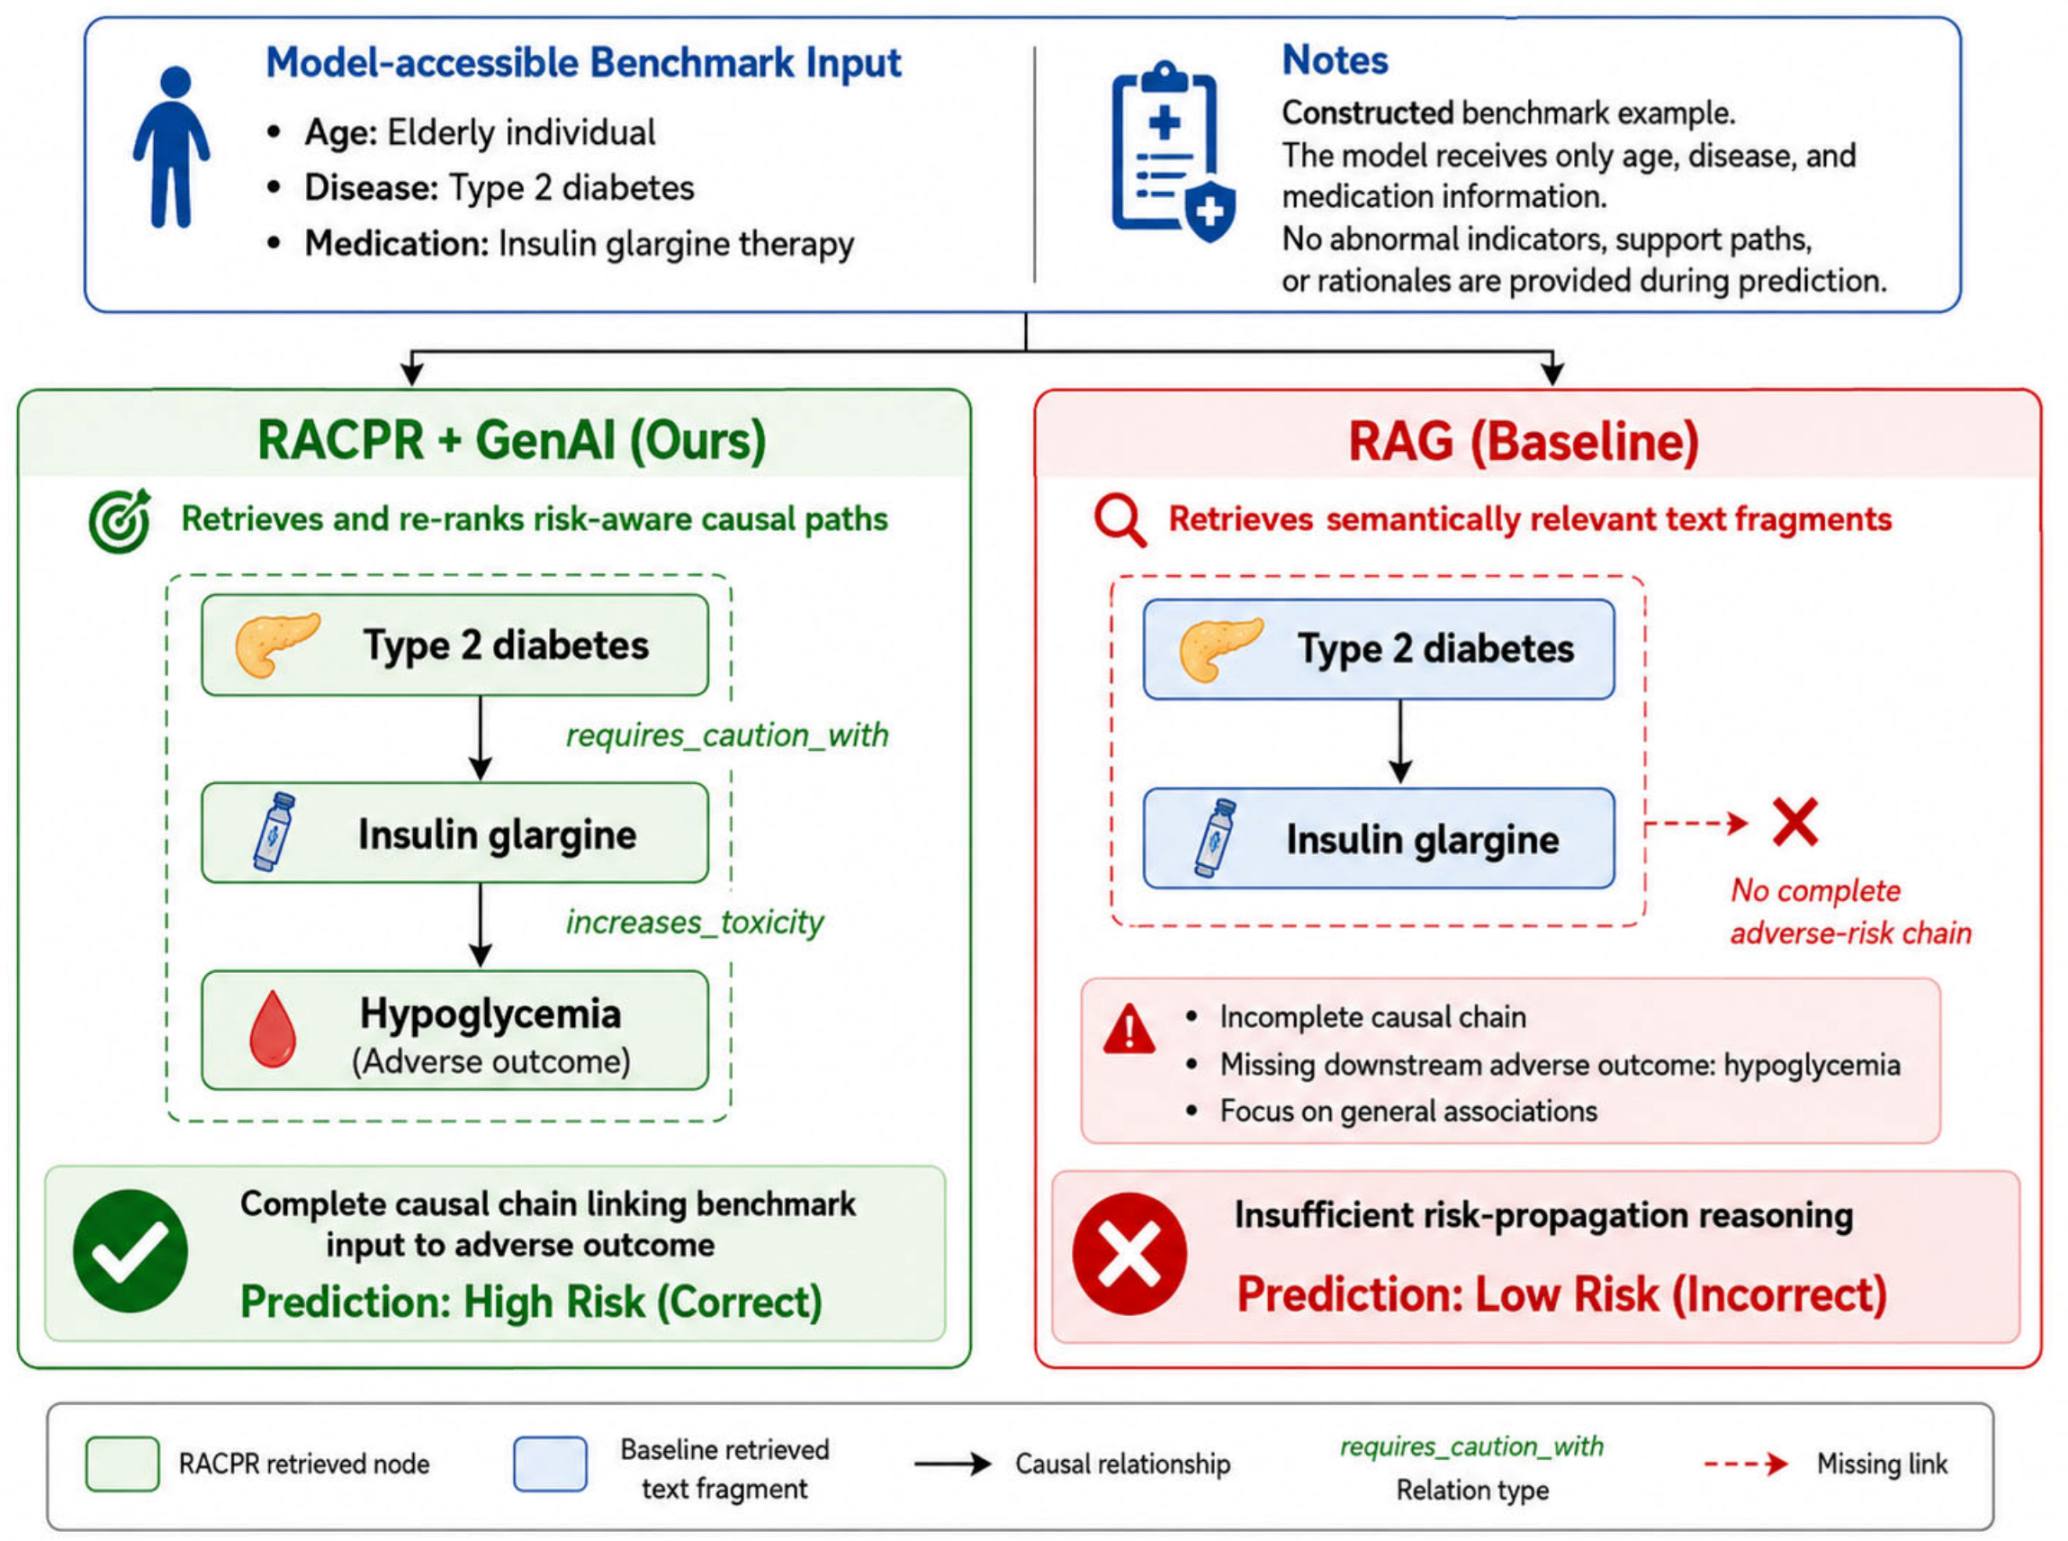
To illustrate how RACPR + GenAI supports interpretable risk identification, we present a benchmark example rather than a real-world case. The example is used only to demonstrate the reasoning process under the controlled evaluation setting. The model-accessible input includes age, diagnosed disease, and medication exposure, while abnormal indicators, support paths, and reference rationales are withheld during prediction.
The example describes an older adult with type 2 diabetes receiving insulin glargine therapy. Under the leakage-controlled input setting, both RACPR + GenAI and the RAG baseline receive the same restricted input, but they differ in how evidence is retrieved and organized.
RACPR + GenAI first matches the input entities, including type 2 diabetes and insulin glargine, to nodes in the health-oriented knowledge graph. It then retrieves candidate causal paths within the predefined hop range and re-ranks them using input-entity alignment, causal coherence, risk contribution, and path length control. In this example, RACPR prioritizes the following path:
type 2 diabetes → requires_caution_with → insulin glargine → increases_toxicity → hypoglycemia.
This path connects the input disease and medication exposure to a risk-related adverse outcome through an ordered causal-risk chain. Based on this selected path, RACPR determines the high-risk label, and the LLM converts the selected evidence into a readable path-grounded explanation.
By contrast, the RAG baseline retrieves semantically relevant text fragments using terms such as type 2 diabetes and insulin glargine. Although these fragments may be related to diabetes treatment or insulin use, they are not required to form an ordered causal path to a downstream adverse outcome. As a result, the generated explanation may reflect general diabetes-management information while missing or underemphasizing the insulin glargine → hypoglycemia risk mechanism.
As shown in
Figure 6, RACPR + GenAI organizes evidence through input-matched causal-path reasoning before explanation generation, whereas the RAG baseline relies on fragment-level semantic retrieval.
4.8.2. Failure Case Analysis of RACPR
Although RACPR achieved the highest F1-score and AUC among the compared methods, it did not perform best on every individual metric. In particular, RACPR showed slightly lower Precision than GraphRAG-global and CausalRAG Retrieval, indicating that some low-risk cases were incorrectly classified as high-risk. To better understand these limitations beyond aggregate metrics, we further inspected representative misclassified cases from the test set, including both false-negative and false-positive predictions.
Table 9 presents four typical examples that illustrate recurrent RACPR error patterns.
As shown in
Table 9, the representative errors mainly arise from the competition between generic risk paths and case-specific evidence paths. In false-positive cases, RACPR sometimes assigns high scores to broad disease-level or medication-caution paths, such as diabetes-related macrovascular complications or hypertension-related cardiovascular-risk evidence, even when the reference annotation indicates stable status or routine monitoring. This reflects a conservative risk-identification tendency under the recall-oriented setting.
In false-negative cases, RACPR may under-rank medication-specific adverse-event paths. For example, cases involving glimepiride- or insulin-related hypoglycemia and frailty risk may receive lower scores when generic diabetes-level paths dominate the retrieved evidence. These observations suggest that future work should better balance generic disease-level evidence, medication-specific risk evidence, and stability-oriented evidence, especially under the leakage-controlled input setting where explicit indicators and reference rationales are withheld during prediction.
5. Discussion
5.1. Interpretation of Findings
The results suggest that RACPR mainly improves multimorbidity risk identification by changing the evidence-selection process from relevance-oriented retrieval to risk-aware causal path re-ranking. Rather than relying only on semantic similarity or graph connectivity, RACPR prioritizes evidence chains that are aligned with case-level input entities, causal coherence, risk contribution, and path compactness. This helps explain why RACPR showed improved risk-ranking performance compared with the evaluated retrieval and graph-based baselines under the leakage-controlled input setting.
The ablation results further indicate that the observed performance of RACPR depends on the combination of its scoring components rather than on a single heuristic. In particular, the risk-aware component and path-length control play important roles in distinguishing risk-informative evidence chains from weakly connected or noisy graph paths. This supports the methodological assumption that causal path retrieval should consider both risk relevance and interpretability constraints.
The per-domain results show that RACPR achieved AUC advantages across chronic kidney disease, diabetes, and hypertension, although the magnitude of improvement was not uniform across domains. The improvement was more pronounced in chronic kidney disease and diabetes, while the hypertension domain showed a smaller but still positive AUC advantage. This suggests that RACPR is generally stable across domains, but the magnitude of benefit may depend on domain-specific risk structures and the availability of medication- or outcome-centered causal paths. This indicates that future versions of the framework may benefit from domain-adaptive weighting between semantic evidence, graph-summary evidence, and causal path evidence.
The explanation evaluation also shows that different explanation metrics capture different dimensions of interpretability. Higher Path Consistency and Health-Oriented Plausibility indicate stronger alignment between selected causal evidence, predicted risk direction, and generated explanation, whereas surface-level Rationale Overlap may favor methods that produce broader textual descriptions. Therefore, path-grounded explanation quality should not be evaluated only by lexical similarity to reference rationales.
Overall, the findings indicate that RACPR’s main advantage lies in risk-aware path prioritization and improved continuous risk ranking, rather than in large gains in fixed-threshold classification metrics.
5.2. Limitations and Future Work
Several limitations should be acknowledged. First, this study was evaluated on a constructed and normalized benchmark rather than on real-world electronic health record data or health consultation logs. Although this benchmark supports controlled algorithmic evaluation, it cannot fully represent missing information, noisy measurements, heterogeneous record structures, longitudinal disease progression, complex comorbidity patterns, or dynamic user descriptions encountered in real-world settings. Therefore, the reported results are limited to RACPR’s performance under the current controlled benchmark setting and should not be generalized to real-world effectiveness or deployment readiness.
Second, the generated explanations have not yet been independently assessed by domain experts. This study used predefined benchmark-based metrics, including Path Coverage, Path Hit Rate, Path Consistency, Outcome Coverage, Health-Oriented Plausibility, and Rationale Overlap, to evaluate explanation quality. These metrics measure evidence grounding and path consistency under the constructed benchmark setting, but expert assessment is still needed to evaluate usefulness, trustworthiness, and actionability in real-world health consultation settings.
Third, the knowledge graph is compact and task-oriented, covering diabetes, hypertension, and chronic kidney disease. It may therefore miss rare diseases, uncommon medication interactions, fine-grained laboratory patterns, and broader multimorbidity combinations. In addition, methodological settings such as maximum hop depth, Top-n path selection, and scoring weights were selected as controllable design parameters. Although sensitivity analyses were conducted, further validation is needed across broader health-related datasets and interaction scenarios.
Fourth, the failure case analysis indicates that RACPR may still produce conservative false positives when generic disease-level or medication-caution paths dominate the ranking and may miss case-specific medication risks when medication-specific adverse-event paths or stability-oriented evidence are under-ranked. Future work should therefore evaluate RACPR on real-world EHR datasets, longitudinal health records, and real health consultation interactions with appropriate ethical approval, data governance, and privacy protection. We also plan to integrate RACPR into an elderly health consultation agent as a retrieval-augmented reasoning module, enabling evaluation in scenarios involving incomplete user descriptions, noisy inputs, multi-turn dialogue, and dynamic evidence retrieval. Independent expert assessment of generated explanations and further evaluation of safety, fairness, and workflow integration are also needed before practical deployment.
6. Conclusions
This study proposed RACPR, a generative AI-enhanced risk-aware causal path re-ranking framework for interpretable multimorbidity risk identification in elderly health consultation scenarios. RACPR uses input-entity alignment, causal coherence, risk contribution, and path-length control to select case-specific causal evidence paths. Generative AI is used only to transform the selected paths into readable natural-language explanations and does not determine the final risk label.
The intended application scenario of RACPR is elderly health consultation and health management, especially in settings where older adults may have multiple chronic conditions and concurrent medication exposure. Potential application contexts include health consultation agents, community-based elderly care systems, and personal health management tools.
Experiments on the constructed elderly multimorbidity benchmark showed that RACPR achieved the highest overall AUC among the compared methods and competitive fixed-threshold classification performance. Compared with text-based retrieval, graph-summary retrieval, and causal-path retrieval baselines, RACPR showed stronger continuous risk discrimination, while the improvement in F1-score was relatively modest. Ablation analysis further confirmed the importance of the risk-aware component and path-length control, indicating that both risk contribution and compact evidence-path selection are important for stable risk identification.
Per-domain analysis showed that RACPR maintained consistent AUC advantages across chronic kidney disease, diabetes, and hypertension cases. Explanation quality evaluation further showed that RACPR + GenAI improved explicit path-grounding performance, especially in Path Consistency and Health-Oriented Plausibility under the automatic benchmark-based evaluation. These results indicate that RACPR improved risk-aware evidence prioritization and path-grounded explanation generation relative to the evaluated baselines under the controlled benchmark setting.
Overall, the findings show that, under the constructed benchmark setting, risk-aware causal path re-ranking improved continuous risk ranking and explicit path grounding compared with the evaluated baselines. Further evaluation on external health records, real-world consultation data, and expert-reviewed cases is required to assess generalizability and practical applicability.