1. Introduction
The global energy landscape is undergoing rapid transformation driven by accelerating renewable deployment, evolving regulatory frameworks, and the persistent influence of geopolitical events on commodity prices [
1]. The ability to assimilate and interpret diverse information streams, structured price series, unstructured news articles, and real-time social discourse has become critical for market participants. Traditional econometric and machine-learning approaches such as AutoRegressive Integrated Moving Average (ARIMA) or Generalized Autoregressive Conditional Heteroskedasticity (GARCH) remain widely used in energy-market forecasting [
2,
3]. However, these methods do not natively absorb qualitative event narratives, multilingual newsflow, or loosely structured analyst commentary without substantial feature-engineering effort.
Recent peer-reviewed energy-domain studies suggest that LLM-based architectures can support power-demand and generation forecasting when carefully adapted [
4] and can produce competitive zero-shot predictions in selected renewable settings [
5,
6]. At the same time, the literature also warns that apparent success in small case studies can mask instability, hallucination, or sensitivity to prompt formulation [
7].
The practical relevance of this question has increased as European energy systems absorb more renewable generation. The REPowerEU agenda, market tightness after the 2022 gas crisis, and the increasing frequency of midday solar surpluses and evening ramp events have changed the information geometry of short-term market analysis. Austria is a useful case study for several reasons. First, it combines ambitious renewable targets with rapid photovoltaic growth, having reached approximately 8.3 GW of installed solar capacity by 2024 [
8]. Second, the country’s heterogeneous meteorological conditions across nine federal states, ranging from Alpine climates in Tyrol and Salzburg to the Pannonian lowlands of Burgenland, create regionally diverse irradiance profiles that challenge any single forecasting approach [
9]. Third, Austrian load patterns exhibit pronounced seasonality and evening balancing pressure driven by the interplay between midday solar surpluses and post-sunset demand ramps, a dynamic well described by the Duck Curve phenomenon [
10]. Finally, high-resolution public data at 15 min granularity are available through Fraunhofer ISE Energy Charts [
11], which provide a transparent and reproducible reference baseline. These properties make Austria a compact but non-trivial test bed that exposes both the strengths and the limits of prompt-engineered LLM forecasting.
This paper addresses the gap through four pilot case studies organised within a single exploratory framework oriented toward fundamental analysis of energy markets, i.e., the interpretation of supply–demand conditions, geopolitical developments, weather-driven generation patterns, and qualitative event context rather than purely technical price-pattern extrapolation. The goal is not to present a large-scale benchmark, a statistically generalisable model comparison, or a head-to-head evaluation against conventional statistical and machine-learning baselines. Instead, the manuscript is positioned as an exploratory feasibility study and scouting report for LLM-assisted energy analytics. Its main contribution is a hybrid workflow blueprint, a reproducible pilot protocol, and a structured identification of promising and problematic pathways for future research. The empirical cases are used to generate preliminary observations about capability patterns, verification requirements, and failure modes, not to establish deployable forecasting superiority.
The main contributions are as follows:
A hybrid reference architecture and scouting blueprint for LLM-assisted commodity market intelligence, distinguishing structured market data, semi-structured news intelligence, web-based evidence collection, social-media monitoring, and GDELT-based geopolitical monitoring.
A documented pilot protocol for evaluating LLM behaviour across heterogeneous energy-analytics tasks, including article summarisation, geopolitical event triage, selected renewable-generation curve estimation, and short-horizon qualitative TTF reasoning.
A small-corpus feasibility evaluation of GPT-4 and Gemini 1.5 Pro for commodity-article summarisation, focused on output-format stability, commodity identification, directional market-impact labelling, and practical verification requirements.
An illustrative case-based solar and load forecasting workflow for Austria, using one detailed benchmark day and two auxiliary case checks to examine plausible curve-following behaviour and limitations, not to establish statistically robust forecasting superiority.
A documented negative result from the Twitter/X monitoring layer, retained as a cautionary example of why informal social-media scraping is weak for reproducible energy-market intelligence.
A synthesis of preliminary capability patterns, verification needs, hidden-constraint risks, and future benchmarking requirements for hybrid LLM-based energy analytics.
The remainder of the paper is organised as follows.
Section 2 reviews architectural foundations, related work in energy forecasting, and news-driven market analytics.
Section 3 describes the methodology and experimental design.
Section 4 presents results for geopolitical monitoring, summarisation, renewable forecasting, and the TTF case study.
Section 5 synthesises preliminary capability patterns, verification risks, reproducibility constraints, and hybrid-architecture implications.
Section 6 states the main limitations explicitly.
Section 7 concludes.
2. Background and Related Work
The development trajectory leading to current LLMs can be traced through several generations of language modelling. Early statistical approaches relied on n-gram models operating under the Markov assumption, where the probability of a word depends only on the preceding
n tokens [
12]. These models were limited by the exponential growth of state spaces and their inability to capture long-range dependencies. Neural language models, beginning with the distributed word representations proposed by Bengio et al. [
13], offered a more expressive alternative by learning continuous-valued embeddings that encoded semantic relationships between words. The subsequent introduction of Word2Vec [
14] made it practical to learn high-quality vector representations at scale, laying the groundwork for embedding-based downstream tasks across Natural Language Processing (NLP).
The transformer architecture [
15] represented a decisive break from recurrent designs by enabling fully parallel computation over input sequences. Unlike Recurrent Neural Networks (RNNs) and Long Short-Term Memory networks (LSTMs), transformers process all positions simultaneously through multi-head self-attention, which identifies critical token-to-token relationships regardless of positional distance. This parallelism, combined with positional encoding, enabled both faster training and better modelling of long-range context. For energy applications, these architectural properties matter less as an abstract deep-learning achievement and more as an interface between diverse evidence types: LLMs can ingest price tables, weather narratives, policy text, and multilingual news within a single prompt, bridging modalities that traditional pipelines handle through separate preprocessing stages.
Modern LLMs are built on the transformer architecture [
15], whose core innovation is the self-attention mechanism: a learned weighting scheme that allows every token in a sequence to attend to every other token regardless of positional distance. This replaced the sequential processing of earlier recurrent architectures and enabled both efficient parallelisation during training and substantially better modelling of long-range dependencies in text [
12].
A critical observation driving the scale-up of these architectures is the scaling law: model performance improves predictably with increases in parameter count, dataset size, and compute budget [
16]. This empirical regularity motivated the development of progressively larger models. GPT-3, with 175 billion parameters, demonstrated that sufficient scale could give rise to emergent abilities, including few-shot and zero-shot task completion without task-specific fine-tuning [
17]. The pre-training and fine-tuning paradigm was further consolidated by BERT [
18], which introduced bidirectional context encoding and achieved strong results across question answering, sentiment analysis, and named entity recognition benchmarks.
Subsequent developments introduced alignment techniques that substantially improved instruction following and factual reliability. Reinforcement Learning from Human Feedback (RLHF), as demonstrated by InstructGPT [
19], showed that even smaller aligned models could be preferred over much larger unaligned ones. GPT-4 extended these capabilities to multimodal inputs and markedly expanded the context window, enabling the processing of longer documents and more complex analytical tasks [
20]. Chain-of-thought reasoning, as formalised in the OpenAI o1 model family, further improved multi-step analytical performance [
21], while open-weight alternatives such as Llama 3 [
22] and DeepSeek-R1 [
23] enable on-premise experimentation and domain adaptation in regulated or data-sovereign environments. A broader survey of LLM architectures, taxonomies, and open challenges is provided by Raiaan et al. [
12].
2.1. LLMs in Energy Forecasting
The application of LLMs to energy systems has expanded rapidly but remains methodologically uneven [
7]. Peer-reviewed studies increasingly suggest that attention-enhanced and prompt-based LLM architectures can support power-demand, generation, and renewable forecasting tasks when carefully constrained [
4,
5,
6]. However, early energy-specific LLM frameworks remain only partially validated, and should therefore be treated as emerging evidence rather than mature operational baselines.
On the generation side, Duan et al. [
6] demonstrated that zero-shot prompting can yield competitive wind-power predictions without task-specific retraining, while Hu et al. [
4] emphasised the value of attention-enhanced representations for interpretability and forecast quality.
Interactive forecasting workflows, where the LLM acts as an analyst interface rather than a black-box predictor, have also been explored [
5]. These studies collectively suggest that LLMs can contribute meaningfully to energy forecasting workflows, but they do not imply that prompt-based approaches have already displaced conventional numerical baselines.
This caution is consistent with recent platform-oriented evidence from energy forecasting, where comparative experiments in modern power systems showed that established machine-learning models such as support vector regression and gradient boosting remained highly competitive in operational forecasting settings [
24].
A recurring limitation across the existing literature is narrow scope. Most studies focus on a single task, a single dataset, or a single model family, which makes it difficult to assess where the operational boundary between text-centric reasoning and numerically sensitive prediction actually lies. That boundary is especially important in energy settings. A model can appear strong on directional reasoning yet still be unusable if its magnitude estimates drift or if its behaviour changes materially with prompt phrasing [
7]. The present study addresses this gap by examining multiple tasks within a single framework, making it possible to compare LLM strengths and weaknesses across task types rather than concluding isolated experiments.
2.2. Traditional Forecasting, Commodity NLP, and Event Signals
Conventional time-series methods remain the backbone of credible energy-market forecasting. ARIMA-type approaches, regime-aware variants, and broader statistical or machine-learning families remain attractive because they can be backtested, stress-tested, and compared under stable evaluation protocols [
2,
3]. In gas and power markets, such models typically outperform more flexible but less disciplined systems when the task depends on precise magnitude estimation over repeated horizons. Commodity markets are inherently volatile and sensitive to a wide range of exogenous variables, from geopolitical developments and climate patterns to macroeconomic indicators, which creates persistent demand for models that can absorb heterogeneous input signals [
25].
At the same time, a separate line of work shows that textual information can materially improve commodity and electricity prediction if it is converted into structured signals [
26]. Financial news fine-tuning work also shows that language models often produce stronger directional narratives than precise numerical estimates [
27]. Social media platforms have also been explored as real-time sentiment sources for commodity markets, although the reliability of such signals remains contested due to noise, bot activity, and the difficulty of separating genuine market intelligence from speculative commentary [
28]. Related work in financial-market NLP further shows that sentiment analysis in such environments is strongly domain-dependent and benefits from models adapted to specialised vocabulary and unstructured market discourse [
29]. This is directly relevant to the presented research: the operational question is not whether LLMs can surpass ARIMA or GARCH in general, but whether they can serve as useful upstream event processors and downstream explanation engines inside hybrid pipelines.
2.3. Retrieval-Augmented Generation and Hybrid Systems
Retrieval-Augmented Generation (RAG) is a particularly natural design pattern for energy analytics because it grounds model outputs in current evidence rather than forcing the full burden onto parametric memory [
30,
31]. Recent systematic evidence likewise frames RAG as a mechanism for reducing hallucinations and stale knowledge by grounding LLM outputs in retrieved evidence, while also highlighting the growing importance of retrieval design, evaluation heterogeneity, efficiency, and security considerations [
31]. In volatile domains such as gas markets, geopolitical developments, and weather conditions change faster than model weights can be updated. RAG therefore offers a pragmatic route to combine fresh market intelligence with LLM reasoning. The underlying principle is that commodity market data must be sourced from multiple heterogeneous channels, including exchanges, public records, media updates, and weather services, and that no single parametric model can remain current across all of them [
25].
Multi-agent forecasting systems extend this logic by decomposing the workflow into specialised stages: for example, retrieval, preprocessing, prediction, and explanation [
5]. In such systems, different LLM instances or conventional models handle distinct subtasks, and coordination logic routes information between stages. The present study is best understood as a pilot step toward such architectures: it evaluates where prompt-engineered LLMs are already useful and where future hybridisation is necessary.
3. Methodology
This study combined architectural design with task-specific evaluation protocols in order to test LLM behaviour across heterogeneous energy-analytics settings. The methodological workflow therefore moved from upstream data acquisition and preprocessing to structured summarisation, renewable forecasting, and an exploratory TTF price-estimation case. Each component is described separately so that the analytical logic, data inputs, and evaluation boundaries remain explicit.
3.1. Reproducibility Protocol and Model Configuration
All LLM-based experiments were conducted as fixed-prompt, single-shot pilot evaluations using GPT-4, GPT-4o, OpenAI o1, and Gemini 1.5 Pro through their provider interfaces; because these are proprietary services, full weights, training data, and low-level decoding parameters were not exposed, and provider-controlled configuration is reported as a limitation rather than inferred post hoc. Outputs were generated once per model-task instance under fixed prompt templates: the article-summarisation prompt enforced a five-field schema (summary, commodity, market impact, direction, rationale); the Austrian forecasting prompt combined ZAMG weather, installed-capacity context, Energy Charts reference data, Duck Curve guidance, efficiency assumptions, and a 15 min tabular output; the TTF prompt combined recent closing prices with curated geopolitical context. Three domain-specialised GPT assistants (Energy Market Insight, AU Solar and Load Energy Forecaster, GasIntelTTF-Analyst) served as prompt-configuration wrappers with persistent task instructions, not as fine-tuned models. Twitter/X monitoring used a TextBlob and keyword-based pipeline as an exploratory negative pathway rather than as a validated component. Because the study was exploratory, these templates should be read as reproducibility aids for a pilot workflow rather than as optimised deployment prompts; future work should repeat each prompt multiple times under fixed seeds or controlled decoding settings.
3.2. Reference Data-Acquisition Architecture
Effective commodity market analysis requires heterogeneous sources with different latency, reliability, and structure profiles [
25]. We therefore defined a four-layer reference architecture. Layers 4a and 4b were implemented as automated pipelines, while Layers 1 and 2 were used manually in the reported experiments.
Layer 1: Structured market data. Exchange platforms such as CME Group and ICE Endex publish official price and settlement data. Commercial systems such as Bloomberg Terminal or Reuters Eikon add depth, curves, and event context, but they carry material licensing costs. For the TTF case study, a 30 day historical closing-price dataset was downloaded from Trading Economics [
32].
Layer 2: Semi-structured news intelligence. Commodity-focused Really Simple Syndication (RSS) feeds from Reuters, Bloomberg, Montel Energy, ICIS, S&P Global Platts, and selected national outlets form the intended automated news-ingestion layer. In this study, these sources were used manually in the article-summarisation experiment rather than through live automated polling.
Layer 3: Web scraping. Compliance-aware scraping of energy portals and regulatory websites is part of the reference architecture, but was not implemented as an automated production layer in the reported experiments.
Layer 4a: Social media monitoring (implemented). Twitter/X posts were collected via NTScraper, focusing on the Montel News account. Each post was cleaned through URL removal, Unicode normalisation, and deduplication, then passed through a three-stage annotation chain: TextBlob-based sentiment labelling, keyword-based commodity identification.
Layer 4b: GDELT geopolitical monitoring. The Global Database of Events, Language and Tone was queried via the GDELT DOC 2.0 Application Programming Interface (API) using TTF-relevant keywords. Each call used 24 h windows with configurable
startdatetime and
enddatetime parameters. The API returned article-level fields including title, URL, date, domain, and a continuous sentiment score in [−1, 1] or, in timeline mode, daily counts and average sentiment. These outputs were consumed by the GasIntelTTF-Analyst assistant to produce structured geopolitical summaries [
33].
3.3. Social-Media Layer: Methodological Lessons from a Negative Result
The Twitter/X layer was included because it mirrors a common temptation faced by market practitioners: social media offers high-frequency signals and a large volume of informal commentary that appears to provide an early-warning advantage [
28]. Reporting negative results is important for guiding future work and avoiding duplication of unproductive research directions [
34]. In practice, however, this layer proved methodologically weak along three dimensions: annotation quality, reproducibility, and signal value.
The first dimension, sentiment labels and commodity tags produced by the TextBlob and keyword-based pipeline were often plausible at the surface level, but price-direction extraction was unstable and systematically biased upward. No analysed record simultaneously matched ground truth across all three annotation categories (sentiment, commodity, direction). The second dimension, NTScraper, was an unofficial scraping interface without authenticated API access, which weakened reproducibility and made the layer unsuitable for production deployment [
35]. The third dimension, the volume-to-signal ratio, was poor: most retrieved posts were restatements of already-published news rather than genuinely novel market intelligence.
For these reasons, the social-media layer is treated here as an exploratory negative result rather than as a validated component of the proposed architecture. Its inclusion serves two purposes: it documents a pathway that future researchers can avoid or improve upon, and it provides a direct contrast with the GDELT layer (
Section 4.1), which proved materially more defensible for geopolitical intelligence extraction. In the final interpretation of the study, the Twitter/X layer should therefore be read as a cautionary exclusion candidate and methodological lesson, not as evidence of a mature social-media-based market-intelligence module.
3.4. Article Summarisation Protocol
To evaluate LLM performance on commodity-intelligence summarisation, we designed a structured prompt requesting five fields: a one-sentence summary, affected commodity, market impact, expected price direction, and rationale. The prompt was applied identically to OpenAI’s GPT-4 and Google’s Gemini 1.5 Pro for a corpus of 20 manually selected commodity market articles from Reuters, Bloomberg, Montel News, S&P Global Platts, Argus Media, Handelsblatt, and Le Monde. The rationale field was retained deliberately because it makes the causal chain auditable and reduces the practical uselessness of purely directional outputs [
36].
The 20-article corpus size follows the logic of focused pilot evaluations in applied NLP, where the goal is to identify qualitative capability patterns rather than to estimate population-level performance with narrow confidence intervals. While larger corpora would permit more precise effect-size estimation, the present design prioritises diversity of commodity coverage and source heterogeneity over sheer volume. Articles were selected to cover natural gas, LNG, crude oil, electricity, and renewables across supply disruptions, regulatory shifts, geopolitical events, and demand-side developments. Article selection followed a purposive sampling logic appropriate for an exploratory study. The goal was not to construct a statistically representative corpus of commodity market news, but to cover heterogeneous market situations across natural gas, LNG, crude oil, electricity, and renewables. The corpus was selected to include different source types, event categories, and expected market-direction signals, including supply disruptions, regulatory developments, geopolitical events, demand-side shifts, and renewable-generation context. This design supports qualitative capability scouting, but not population-level claims about model accuracy.
The corpus selection followed three explicit criteria. First, all candidate articles had to discuss a primary commodity within the target set (natural gas, LNG, crude oil, electricity, or renewables); articles covering broad multi-commodity market commentary without a clear primary subject were excluded. Second, candidate articles had to describe a concrete event, decision, or development with an identifiable expected market direction; pure opinion pieces and editorials without a directional implication were excluded. Third, the corpus had to contain a balanced mix across commodities and across the four expected market-direction labels (up, down, neutral, mixed) to avoid label imbalance in the small-corpus evaluation. The articles were drawn from a one-month window of European energy-market reporting in late 2024.
The composition of the resulting 20-article corpus across commodity, source, language, event category, and expected direction is summarised in
Table 1.
The annotation workflow proceeded as follows. The reference labels were prepared by the authors before the LLM outputs were generated, by reading each article in full and recording the affected commodity and the expected directional market impact together with a one-sentence rationale. After the labels were finalised, the LLM outputs from GPT-4 and Gemini 1.5 Pro were generated independently. A partial validation pass was then performed on a subset of the corpus to identify obvious disagreements and ambiguous cases; flagged labels were resolved through source re-inspection and discussion among the authors. Because the corpus was small and the validation procedure was partial rather than a fully independent double-annotation protocol on the entire corpus, no formal inter-annotator agreement statistic (Cohen’s
or equivalent) is reported. This is acknowledged explicitly as a methodological limitation in
Section 6 and a priority for future large-corpus evaluation. Full prompt templates and the complete annotation procedure are reported in
Appendix A. To support transparency and reproducibility, the prompts, manual reference labels, evaluation outputs, and supporting materials are made available in a public companion repository at
https://github.com/AlexKrempasky/Large-Language-Models-for-Energy-Market-Analytics (accessed on 10 May 2026). The original article texts are not redistributed in the repository due to source-publisher copyright restrictions; they can be reconstructed from the article-level metadata provided.
3.5. Solar Power and Grid-Load Forecasting Design
Austria is a useful test bed for LLM-based renewable forecasting because it combines rapid photovoltaic growth with heterogeneous weather conditions, non-trivial regional variation, and load profiles shaped by seasonal demand and evening ramping [
8,
10]. Solar forecasting in general remains a challenging task due to cloud variability, regional irradiance differences, and the nonlinear relationship between installed capacity and actual generation [
37]. ZAMG weather forecasts for all nine Austrian federal states and Osttirol were collected from the public portal and manually inserted into the prompt [
9]. Ground-truth generation and load data at 15 min resolution were exported from Fraunhofer ISE Energy Charts [
11]. The six-component forecasting prompt provided:
regional ZAMG weather conditions;
installed solar capacity by region;
comparable historical Energy Charts data;
explicit Duck Curve instructions;
technology-specific efficiency parameters for the Austrian panel mix;
a strict 15 min output format without interpolation.
This structured prompt design follows established prompt-engineering principles where task decomposition, explicit formatting constraints, and domain-specific context injection have been shown to reduce hallucination and improve output consistency [
38]. The choice to provide all six components simultaneously rather than through multi-turn dialogue was motivated by the need for reproducible, single-shot evaluation.
Mean Absolute Error (MAE) measures the average magnitude of prediction errors over
N intervals:
To enable comparison across tasks with different output scales, we also report the normalised Mean Absolute Error (nMAE), defined as:
where
C is a task-specific scaling constant.
For solar power forecasting,
GW represents the total installed photovoltaic capacity in Austria [
8]; for load forecasting,
GW represents the average daily peak load. Solar metrics were computed only over intervals with non-zero realised generation; load metrics were computed over all available intervals. For completeness, Root Mean Square Error (RMSE) is also reported for the additional cases.
3.6. TTF Exploratory Price-Estimation Design
The TTF is the main benchmark for European gas trading and an appropriate setting for testing whether LLMs can integrate qualitative geopolitical context with recent price dynamics [
1]. For the reported exploratory case study, the prompt combined 30 days of historical TTF closing prices from Trading Economics [
32] with manually curated qualitative context from recent market reporting.
To keep the reported experiment chronologically clean, only directly time-aligned developments preceding the prediction window were treated as explicit prompt inputs: the Österreichische Mineralölverwaltung (OMV) arbitration award against Gazprom and the resulting concern about possible supply disruption [
39], and a pilot supply agreement between a Central European gas utility and an Azerbaijani state energy company as a precautionary diversification signal [
40]. GPT-4o and OpenAI o1 were then asked to estimate the closing prices for 14 and 15 November 2024. This design should be read as an exploratory two-day illustration of qualitative-context integration, not as a statistically validated gas-forecasting study.
4. Results
The reported results are organised by task rather than by model family, because the central aim of the study is to identify where LLMs provide practical analytical value across different types of energy-market work. The sequence begins with geopolitical event monitoring and article summarisation, then it moves to renewable forecasting and the exploratory TTF case. This ordering makes it possible to contrast text-centric strengths with numerically sensitive settings in a way that is directly relevant to the study’s preliminary capability-pattern argument.
4.1. GDELT-Based Geopolitical Event Monitoring
The GasIntelTTF-Analyst assistant was queried over a representative 48 h monitoring window covering Russian-gas-related developments in the European market. The assistant retrieved multilingual GDELT-indexed articles and synthesised them into a structured market-intelligence report, separating actionable signals from peripheral noise. Four thematically distinct event clusters emerged from the aggregated coverage:
U.S. and Europe gas diplomacy. Reports from Russian-language outlets claimed U.S. pressure on European countries to resume Russian gas imports. These reports were unverified by Western sources, and the assistant correctly flagged them as low-credibility signals requiring corroboration before operational use.
Nord Stream restart speculation. Euractiv and several regional European outlets covered renewed technical feasibility discussions around restarting the Nord Stream pipeline. The assistant assessed this as politically infeasible in the near term, consistent with the prevailing regulatory and geopolitical environment.
Germany’s fossil-fuel exit reaffirmation. The German legislature reaffirmed its commitment to a permanent exit from Russian fossil fuels, a structurally bearish signal for Russian gas transit revenues and a long-term support factor for European Liquefied Natural Gas (LNG) demand.
Nord Stream investigation. U.S. official remarks on The Nord Stream sabotage investigation was identified as a secondary signal, with limited immediate price relevance but potential for longer-term geopolitical escalation.
Peripheral signals also included a reported freeze in U.S.–China LNG trade and environmental opposition to a proposed Baltic LNG terminal. The assistant correctly deprioritised these as indirectly TTF-relevant at the observed horizon.
The analytical value of this workflow lies precisely in this structured triage. Rather than returning a single numeric sentiment score, the pipeline produced an ordered, source-traceable narrative distinguishing high-credibility from low-credibility signals, which can be directly embedded as qualitative context in TTF price-prediction prompts (
Section 4.4). Compared with the social-media layer described in
Section 3.3, the GDELT approach proved materially more defensible: it preserved multilingual breadth, attached continuous sentiment scores in [−1, 1], and provided source-level traceability. The present paper does not attempt a historical sentiment-price correlation study because that requires an extended observation window, but the pipeline is operationally well-aligned with such future work.
4.2. Article Summarisation Pilot Observations
Both models produced structured outputs for all 20 articles. Based on the manual reference key and the partial validation described in
Section 3.4, the commodity and directional market impact were correctly identified in 17 of 20 cases (85%) under Gemini 1.5 Pro and 14 of 20 cases (70%) under GPT-4. Output-format adherence was full in the GPT-4 outputs (20/20), while Gemini outputs showed non-standard field ordering or missing fields in 4 of 20 cases. These percentages are reported as case-level observations on a 20-article pilot corpus, not as population-level model rankings. The results are summarised in
Table 2.
The case-level pattern is operationally suggestive: under the schema used here, Gemini 1.5 Pro produced more accurate commodity-direction labels in this corpus, while GPT-4 produced more reliable structured-format adherence. This is consistent with a workflow trade-off rather than a generalisable model ranking, and should not be interpreted as evidence that one model is preferable across deployment contexts.
4.3. Solar Power and Grid-Load Forecasting
This section reports the results of prompt-engineered LLM forecasting for Austrian solar power generation and grid load, evaluated against the Fraunhofer ISE Energy Charts reference. One detailed benchmark day is presented first, followed by auxiliary representative cases covering different seasons and conditions.
4.3.1. Detailed Benchmark Day: 15 October 2024
ZAMG weather inputs for the detailed benchmark day are summarised in
Table 3. Conditions ranged from partly cloudy (Carinthia, Tyrol, Vienna) to mainly cloudy (Burgenland, Lower Austria, Salzburg) with light rain in Ennstal/Ausseerland.
Forecasting accuracy for 15 October 2024 is reported in
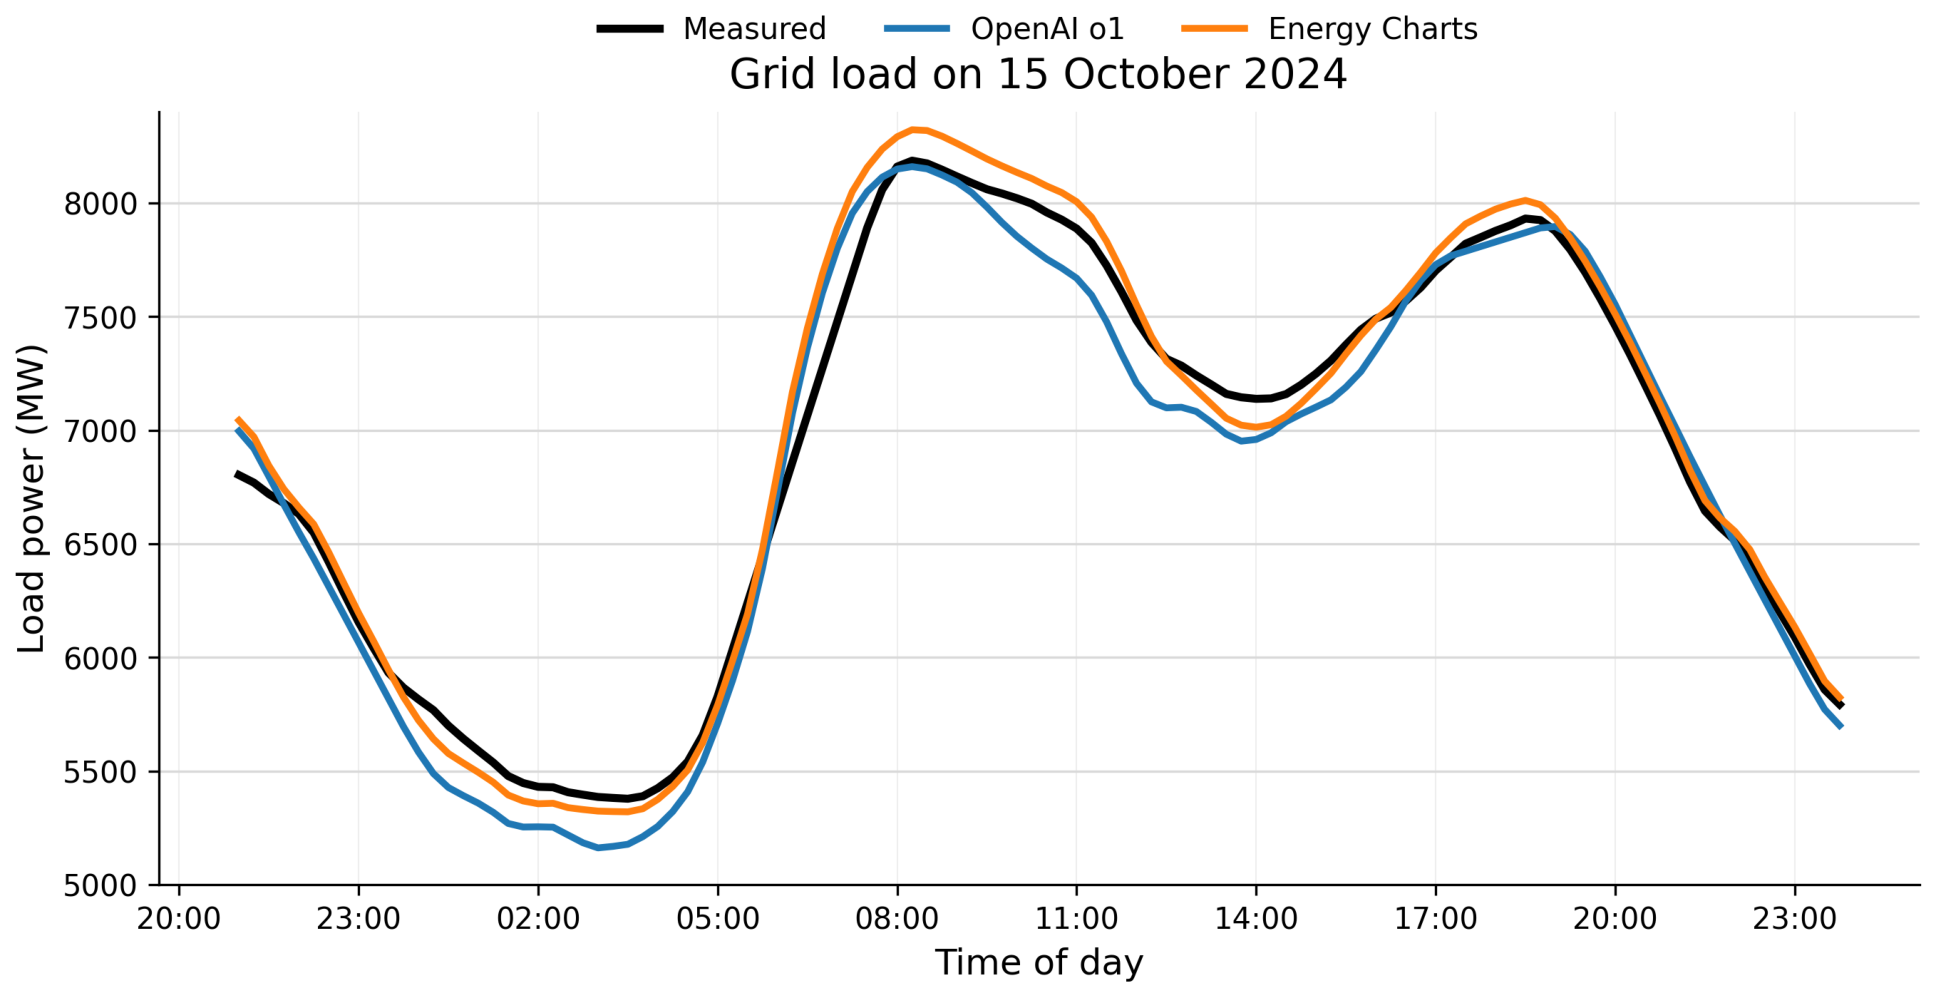
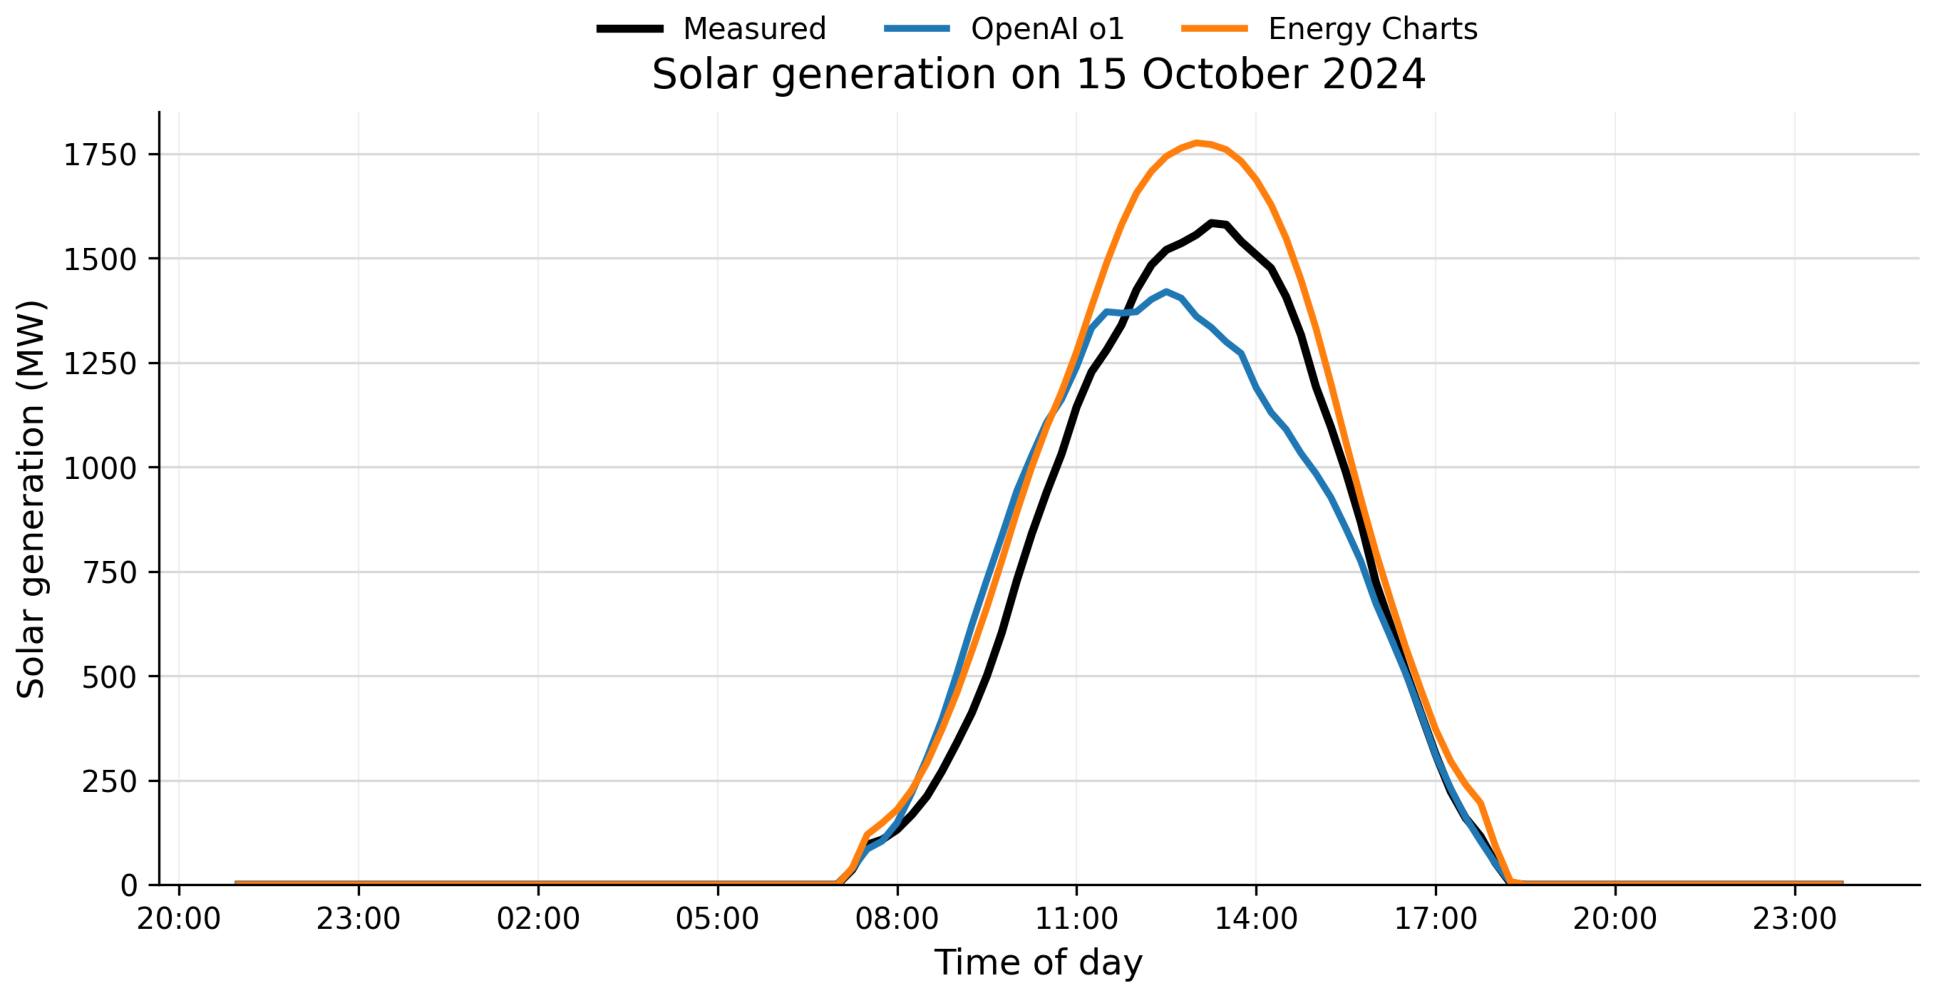
Table 4. On this benchmark day, OpenAI o1 and the Energy Charts reference produced very similar solar-generation errors in absolute terms. The observed MAE difference was only 1.48 MW, which is too small to support a meaningful claim of model superiority in a single-day pilot comparison. The normalised error (nMAE) indicates that both solar estimates deviated by less than 1.5% of Austria’s total installed photovoltaic capacity. Energy Charts retained a small advantage for aggregate load, with both approaches maintaining an nMAE below 0.7% relative to peak demand.
Figure 1 and
Figure 2 show all three trajectories (OpenAI o1 prediction, measured values, Energy Charts reference) over the full benchmark window at 15 min resolution.
The important point is not that OpenAI o1 “won” by 1.48 MW on one day. That margin is too small to carry any strong statistical meaning by itself. The value of the benchmark day is instead diagnostic: the model reproduced the overall solar curve plausibly and produced solar-generation errors close to the Energy Charts reference on one mixed-cloud autumn profile, while the Energy Charts reference was more accurate for aggregate load on this case day.
4.3.2. Additional Representative Cases
To reduce over-reliance on a single benchmark day, two additional uploaded cases were analysed. On 26 May 2024 (evening decline segment, 19:00–20:45), GPT-4o achieved solar MAE of 34.50 MW and RMSE of 48.60 MW, compared to the Energy Charts baseline of 54.00 MW and 72.97 MW, respectively. This auxiliary case indicates that the LLM could reproduce a selected evening decline pattern, but it does not establish generalisable forecasting performance outside the October benchmark date.
The May case suggests that plausible LLM solar curve-following was not restricted to the single autumn benchmark day. The January verification confirms that the model can follow a winter low-irradiance curve plausibly, but it does not justify any cross-season superiority claim in the absence of a baseline counterpart.
Overall, the evidence supports a cautious task-specific observation rather than a global performance claim: prompt-engineered LLMs produced plausible solar-generation curves in selected case settings, while the available load comparisons show that the Energy Charts reference retained an accuracy advantage.
4.4. TTF Natural Gas Price Estimation
The reported TTF experiment was intentionally narrow. It was a two-day exploratory case study designed to test whether an LLM can combine short historical price context with immediately relevant geopolitical developments. The two prompt inputs most directly aligned with the prediction window were OMV’s arbitration win against Gazprom [
39] and a pilot supply agreement between a Central European gas utility and an Azerbaijani state energy company [
40]. Forecasts and realised values are shown in
Table 5.
GPT-4o deviated from reality by 0.375 EUR/MWh on 14 November and 0.674 EUR/MWh on 15 November. Both models captured the general upward direction on the first day, which was consistent with the qualitative market pressure implied by the OMV–Gazprom dispute. However, the continuation day exposed the main caution: both models overestimated the magnitude of the move, predicting roughly 3.0–3.4% versus the realised 0.71%. This is useful as an observed example of narrative-driven amplitude overshoot, not as evidence that LLMs provide deployable gas-price forecasts.
Accordingly, the TTF section should be read as a demonstration of short-horizon qualitative-context integration in a tightly curated two-day illustration. The experiment suggests that LLMs can produce directionally plausible reasoning when supplied with curated event narratives, but it does not provide evidence of reliable TTF price-forecasting capability.
4.5. Domain-Specialised GPT Assistants
Three domain-specialised GPT assistants were developed on the OpenAI GPTs platform. Energy Market Insight operationalised the five-field summarisation schema, AU Solar and Load Energy Forecaster preserved persistent Austrian-domain instructions for forecasting prompts, and GasIntelTTF-Analyst integrated GDELT-derived event streams into a structured TTF-context workflow. These assistants do not constitute a separate benchmark contribution, but they demonstrate how the study’s prompts and decision logic can be translated into re-usable analyst-facing tools.
5. Discussion
Taken together, the individual case studies reveal a consistent pattern: LLMs are most useful when the task depends on linguistic compression, contextual interpretation, or structured reasoning over heterogeneous evidence, and they are less reliable when stable numerical precision becomes the dominant requirement. The subsections below draw out that pattern, identify the main observed failure modes, and clarify what these findings imply for future hybrid energy-analytics system design.
5.1. Preliminary Capability Pattern: Text-Centric Reasoning vs. Numerical Precision
Across the reported case studies, a preliminary capability pattern emerged. LLMs were most useful when the primary value lay in linguistic compression, structured summarisation, event-context aggregation, or analyst-facing interpretation. They were less accurate when the task demanded stable and precise magnitude forecasting over numerical time series, as indicated by the Energy Charts reference retaining an advantage for load estimation on the benchmark day. The article summarisation study, the GDELT workflow, and the structured assistant designs all fit the first category. Aggregate load forecasting and the continuation-day TTF estimate sit in the second.
The limited multi-case solar evidence is consistent with this pattern. The May solar case suggests that plausible LLM solar curve-following was not limited to the single autumn benchmark day, while the October benchmark demonstrates plausible curve reproduction under mixed-cloud conditions. At the same time, the load comparison shows that the Energy Charts reference was more accurate than the LLM on the available benchmark day. The literature suggests that LLMs generally excel at tasks requiring contextual reasoning but struggle with tasks demanding stable numerical precision [
7,
41]; the load result observed in this study is consistent with that pattern, although a direct comparison with dedicated statistical baselines was not conducted here. The correct interpretation is preliminary task-specific complementarity, not general superiority or deployable forecasting capability.
5.2. Observed and Anticipated Failure Modes
Three failure modes are relevant to deployment;
Table 6 distinguishes between
directly observed effects and
anticipated operational risks.
5.3. Verification and Hidden-Constraint Risks
A central deployment issue is that LLM outputs cannot be assumed to be correct in the same way as outputs from deterministic rule-based systems or fully specified statistical models. For operational use, they should therefore be treated as provisional analytical artefacts requiring verification. Practical safeguards include grounding outputs in explicit retrieved evidence, enforcing structured machine-checkable schemas, checking numerical estimates against physical, historical, and market constraints, and retaining human or independent-model review for high-impact conclusions.
This verification logic explains why the present study treats LLMs as components of a hybrid analytical pipeline rather than as autonomous forecasters. In the summarisation experiment, manual reference labels and output-format checks provided lightweight verification. In the GDELT workflow, source-level traceability helped distinguish higher-credibility signals from peripheral or weakly supported signals. In the forecasting cases, comparison against Fraunhofer ISE Energy Charts exposed both plausible case-specific estimates and cases where the conventional reference remained stronger.
A related limitation is that proprietary LLMs may be affected by hidden constraints, alignment rules, safety policies, or provider-side behaviour changes that are not fully visible to the researcher. These factors can influence emphasis, causal framing, refusal behaviour, cautious wording, or market-impact classification, especially in geopolitical and commodity market analysis. Future work should therefore preserve raw prompts, raw outputs, retrieved source metadata, and independent verification for market-critical labels such as commodity, direction, and rationale.
The observed behaviours should therefore be interpreted as candidate failure modes and design signals for future benchmarking, not as established or universal capability boundaries.
5.4. Implications for Hybrid Architectures
The results argue for a hybrid design rather than an all-in replacement. A credible energy-analytics workflow can be split into three stages. First, the LLM processes incoming articles, regulatory signals, weather narratives, and geopolitical developments into structured features. Second, a conventional forecasting engine, statistical, machine-learning, or transformer-based, handles the numerically sensitive prediction task using those structured features as exogenous inputs. Third, the LLM is re-engaged to explain the output, summarise anomalies, and present decision support in natural language. This aligns with emerging hybrid evidence in electricity and commodity markets [
26].
Within such pipelines, prompt engineering remains a relevant discipline. The six-component Austrian forecasting prompt performed materially better than looser natural-language variants, and the domain-specialised assistants reduced prompt-assembly overhead. This is not glamorous, but it is operationally real: much of the value of LLM systems comes from disciplined workflow design rather than from model choice alone [
38].
5.5. Reproducibility Challenges with Proprietary LLMs
A structural challenge for any LLM-based energy-analytics study is reproducibility. The models used in this work—GPT-4, GPT-4o, OpenAI o1, and Gemini 1.5 Pro—are proprietary systems whose weights, training data, and inference-time behaviour are controlled by their providers and may change without notice through silent updates [
42]. This means that repeating the same experiment six months later with nominally the same model identifier could yield different results, a problem that does not exist with conventional forecasting models whose parameters are fixed after training. The empirical findings should therefore be interpreted as a snapshot of service behaviour at the time of experimentation rather than as a reproducible evaluation of a fixed model artefact.
Three practical mitigations are available for future work. First, versioned model snapshots (e.g.,
gpt-4-0613) can be specified via API to reduce temporal drift, although providers eventually deprecate older snapshots. Second, open-weight alternatives such as Llama 3 [
22] or DeepSeek-R1 [
23] allow full parameter freezing and deterministic inference, which is essential for regulated energy-market applications. Third, prompt-level documentation, as practised in this study through the six-component prompt design, ensures that the experimental protocol is replicable even if model outputs vary across versions. The tension between proprietary model capability and open-model reproducibility is not yet resolved in the literature and represents a significant consideration for energy-sector deployment [
43].
6. Limitations
This manuscript remains a pilot study with several limitations that should be stated explicitly to guide interpretation and future work.
Sample size and statistical power.
The forecasting evidence rested on a small number of case days. The primary solar benchmark covered one detailed day with two auxiliary case checks, and the TTF experiment spanned only two days. This was sufficient to identify qualitative capability patterns, workflow issues, and candidate failure modes, but insufficient for formal significance testing, statistically robust model ranking, or deployable forecasting claims. The observed solar MAE difference of 1.48 MW was too small to support a claim of superiority for either system on the available data. Future work should prioritise multi-month backtesting with rolling-window evaluation to establish whether the pilot patterns are robust.
Summarisation corpus scale. The 20-article evaluation corpus was adequate for a focused pilot comparison but did not support strong claims about population-level model performance.
Annotation reliability. The commodity-direction labels were manually prepared by the authors, but the study did not implement a fully independent double-annotation protocol. No Cohen’s kappa or other inter-annotator agreement statistic was therefore reported. This limited the strength of claims that could be made about model accuracy in the summarisation task. Future work should use larger corpora, independent annotators, explicit adjudication rules, and agreement statistics before drawing stronger conclusions.
Reproducibility of proprietary models. As discussed in
Section 5.5, the proprietary models used in this study may change behaviour across versions. Results obtained with GPT-4 or Gemini 1.5 Pro in late 2024 may not be exactly replicable in subsequent periods [
42]. Prompt-level documentation partially mitigates this, but does not fully resolve the issue.
Social-media layer. The Twitter/X layer was included primarily as a documented negative result. Its methodological weaknesses, including unauthenticated scraping, upward directional bias, and poor volume-to-signal ratio, limited its utility beyond illustrating a common analytical pitfall.
Baseline availability and benchmark completeness. The January 2024 winter solar case lacked a corresponding Energy Charts baseline, which prevented comparative evaluation. The May 2024 case covered only an evening-decline segment rather than a full day. These constraints reduced the scope of cross-seasonal conclusions that could be drawn from the available evidence. The forecasting experiments compared LLM outputs against the Energy Charts reference only; dedicated statistical and machine-learning baselines such as ARIMA, SARIMA, gradient boosting, recurrent neural architectures, or transformer-based time-series models were not included. Consequently, the forecasting component should be interpreted as an illustrative case-based evaluation rather than as a complete comparative benchmark. Direct baseline comparisons remain a necessary direction for future work.
7. Conclusions
This paper presented an exploratory feasibility study of LLM use across four energy-analytics tasks within a unified hybrid workflow perspective. The central conclusion is not that LLMs have already displaced conventional forecasting systems or that their capability boundaries have been conclusively established. Rather, the study shows where LLMs appear promising as supporting components in energy-market analytics and where their use remains fragile, difficult to verify, or insufficiently reproducible.
The GDELT and article-summarisation experiments suggest that LLMs are useful for compressing multilingual text, extracting structured market intelligence, triaging geopolitical signals, and making qualitative event narratives usable for analysts. The solar forecasting cases show that LLMs can produce plausible solar-generation curves in selected case settings, including an evening decline segment on 26 May 2024, while the Energy Charts reference was more accurate for load estimation on the available benchmark day. These results should be interpreted as preliminary case observations, not as robust evidence of general forecasting capability. The two-day TTF experiment demonstrated that LLMs can integrate qualitative geopolitical context into short-horizon reasoning, but it did not establish reliable gas-price forecasting performance. The Twitter/X layer provided a documented negative pathway, illustrating why informal social-media scraping is weak as a reproducible market-intelligence source.
Taken together, the evidence cautiously supports a complementary role for LLMs within hybrid architectures that combine upstream event processing, structured textual reasoning, verification layers, and downstream explanation with conventional numerical forecasting engines. The main contribution of the manuscript is therefore a scouting report and hybrid workflow blueprint, rather than a conclusive empirical benchmark. The results identify promising pathways, problematic pathways, candidate failure modes, and methodological requirements for future large-scale evaluation.
The forecasting experiments should be extended through systematic multi-month backtesting with rolling evaluation windows, formal statistical tests, and direct comparison with dedicated statistical and machine-learning baselines such as ARIMA, SARIMA, gradient boosting, recurrent neural architectures, and transformer-based time-series models. The summarisation task should be extended using larger corpora, independent annotation, adjudication rules, and inter-annotator agreement statistics. Future work should also evaluate open-weight models under fixed inference settings to reduce the reproducibility limitations of proprietary LLM services.
Several directions follow from this study. The GDELT pipeline could be extended into a longitudinal sentiment–price correlation framework operating over multi-month observation windows. A natural next step on the retrieval side is the integration of live Retrieval-Augmented Generation over commodity-intelligence corpora, enabling LLMs to operate on continuously updated market evidence rather than manually curated prompt inputs. Extending the current metadata-based workflow toward full-text article reconstruction from GDELT-derived resources may improve retrieval, summarisation, and event-context modelling [
44]. Comparative evaluation of open-weight models such as DeepSeek-R1 against proprietary systems would help establish reproducibility baselines for LLM-based energy analytics. Finally, expanding the benchmark set to include numerically atypical regimes, including negative-price events, would test the robustness boundaries of prompt-engineered forecasting under conditions not covered by the current pilot material.