Article

Domestic Factors Influencing Perceived Interference in Distance Learning: A Machine Learning Approach in Residential Built Environments


by
Virginia Puyana-Romero
1,*,
Angela María Díaz-Márquez
2,
Christiam Santiago Garzón-Pico
1 and
Giuseppe Ciaburro
3
1
Department of Sound and Acoustic Engineering, Universidad de Las Américas, Quito 170516, Ecuador
2
Information Intelligence Directorate, Universidad de Las Américas, Quito 170516, Ecuador
3
Department of Engineering, Faculty of Engineering and Informatics, Pegaso University, 80143 Naples, Italy
*
Author to whom correspondence should be addressed.
Big Data Cogn. Comput. 2026, 10(5), 165; https://doi.org/10.3390/bdcc10050165
Submission received: 4 March 2026 / Revised: 29 April 2026 / Accepted: 17 May 2026 / Published: 19 May 2026

Abstract

The change in learning methods to online/distance learning, catalyzed by recent health pandemics/social distancing requirements, has significantly changed how teaching occurs and what students experience in their learning spaces in regard to interference. New forms of interference exist, and they are related to the domestic setting of the student’s life. This study examined how factors of domestic life influence what students find in regard to interference in their online learning spaces through a Likert-scale defined answer process to a 29-question predictor variable inventory that also includes two outcome variables that address the amount of acoustic interference experienced in learning spaces. Moreover, through regression models and various applications of machine learning science, this research aims to reveal crucial indicators that influence student experiences regarding disturbances. In this respect, these findings highlight crucial roles that housing density and internal interactive actions within residential contexts have on disturbances. Furthermore, this research reveals critical understandings of perceptual inequalities present within distance learning student populations and indicates significant cultural and social consequences related to digital technologies. This is crucial, understood within foundational perspectives that are necessary to address psychosocial challenges and human–building interaction present within distance learning science and policies aimed at reducing noise.

1. Introduction

In recent years, distance learning (DL) has assumed an increasingly important role in the global education landscape [1], emerging as a teaching method capable of ensuring educational continuity even in times of emergency or limited physical accessibility to school and university spaces [2]. The pandemic experience resulting from the spread of the SARS-CoV-2 virus has significantly accelerated this process, leading many students to attend lessons and learning activities at home and resulting in significant changes in teaching practices and learning conditions [3,4]. All of this has provided a decisive impetus to the digitalization of education and has made DL no longer an experimental option, but a concrete and structural necessity [5].
Online universities have reshaped higher education by redefining access, delivery, and participation. Based on the principle that educational access should be universal, they embed openness as a foundational element rather than a corrective measure. In this model, physical distance is no longer a limiting factor, and distance learning becomes a primary mode of education rather than an alternative option [6,7]. This transformation has expanded opportunities for a more diverse student population, supported by digital platforms that enable flexible, often asynchronous learning experiences. These systems rely on multimedia tools that allow continuous monitoring, assessment, and interaction, fostering greater autonomy in learning processes. However, the rapid shift from traditional classroom settings to online education has also introduced important contextual changes. Learning is increasingly relocated from structured academic environments to domestic spaces, which are not always designed to support study activities [8,9]. As noted in the literature, this transition may influence concentration, engagement, and learning quality, highlighting the growing importance of the home environment in shaping educational outcomes.
This is because when learning is brought home, “all of those elements—home spaces, home noise levels, home families—become immediately consequential to learning experience.” Students’ focal points, interactions, and psychological status at home seem to change on center stages [10]. However, there is no such thing as a perfect home. Homes differ based on financial status, cultural differences, and family settings. In traditional classrooms, various elements are manageable. However, when learning takes place at home, there is limited control. There is no guarantee that there is a separate room for individual learning, and access to high-quality internet is not assured [11].
All that chaos at home sums up and makes the environment untidy and unpredictable, and that really disrupts focus, motivation, and learning ability. Among all the factors at home, the most outstanding are noise and acoustic distractions, as they impair the ability to focus and process spoken language—a basic input during any live class or online discussion. The tricky part is that these noises are not only from outside, such as traffic or neighbors, but they are all over the place. You have chatter, buzzing, playing, and noise at home. Honestly, trying to manage all this is hardly possible. But here is the moot point: how much these sounds disturb someone is not just about their intensity or steadiness. It depends upon individual perception, which itself depends upon senses, mood, and the surrounding context [12]. Throughout investigations of noise in conventional classrooms, several findings have remained steady: chronic noise or constant disturbance reduces comprehension of speech, interferes with the development of reading and memory, and dampens motivation and academic performance [13]. However, studies on noise in home learning environments remain limited and fragmented. The lack of standardized noise control makes each home unique, and the perception of interference can vary significantly depending on the spatial configuration, family habits, and the degree of exposure to external distractions [14].
In addition to cognitive effects, noise exposure has significant non-auditory implications: it causes sleep disturbances, increased stress and fatigue, and can alter physiological indicators of stress (e.g., cortisol levels, blood pressure), with possible repercussions on general well-being and the ability to concentrate of students [15]. These results indicate that the impact of noise should be considered not only in terms of immediate acoustic perception, but also as a factor that interacts with the health and emotional regulation capacity of individuals [16].
It is important to emphasize that the perception of interference does not always directly correspond to physical measurements of noise: subjective factors such as individual tolerance, expectations, the nature of the cognitive task, and the family context modulate the reaction to the same acoustic stimulus. Therefore, to understand the effect of noise on distance learning, it is necessary to integrate objective measures with subjective findings and investigate the mediating role of family workloads (child or elder care, shared space, activity schedules) and household organizational practices (e.g., shifts in space use, separation of living spaces). Recent studies on the relationship between sound perception in domestic environments and work/study activities during the pandemic highlight that the perceived quality of domestic “soundscapes” influences comfort and productivity during remote activities, suggesting that similar dynamics are also relevant in the context of distance learning [17,18]. In this case, checking how home duties—like chores or personal tasks people handle—affect how distracting remote classes feel really matters. Taking care of kids or older relatives, using shared rooms, handling everyday routines, or juggling school with housework can all play a role. On top of that, things like room setup or having someone to rely on shape whether a learner stays focused and keeps their thoughts flowing during virtual sessions.
Thus, the perceptual dimension lies at the heart of this discussion, since people do not react the same to identical noise or disturbance conditions [19]. Acoustic sensitivity, expectations, stress tolerance, and adaptability are variables influencing subjective interference perception. As a result, two students exposed to the same level of noise may have radically different experiences, one of which potentially compromises the effectiveness of learning. Understanding this subjectivity, therefore, requires going beyond the mere physical measurement of noise and adopting a psychoacoustic and sociological approach that takes into account individual experience and family context.
The primary aim of this study is to investigate how family responsibilities and domestic environmental conditions shape students’ subjective perception of interference during distance learning activities, with a specific focus on perceived noise-related disruption [20,21,22]. To address this objective, a structured questionnaire based on a 5-point Likert scale was developed and administered, collecting data on 29 variables describing family roles, household composition, spatial characteristics, technological conditions, and study habits within the home environment. The study adopts a combined analytical framework integrating traditional statistical methods with machine learning techniques. This hybrid approach enables not only the identification of the most relevant predictors of perceived interference, but also the exploration of nonlinear relationships and complex interactions among socio-environmental variables [23,24,25,26,27]. In this way, the analysis moves beyond simple linear associations, providing a more comprehensive understanding of the factors shaping students’ perceptual experience in home-based learning contexts.
A key research gap addressed by this work lies in the limited consideration given in the existing literature to the domestic environment as a determinant of learning quality in distance education. While previous studies have extensively examined technological readiness, pedagogical design, and student motivation in online learning contexts, relatively little attention has been devoted to the role of household structure, caregiving responsibilities, and shared living conditions in shaping perceived cognitive and environmental interference. In particular, the interaction between family obligations and spatial constraints within the home remains underexplored, despite its increasing relevance in hybrid and remote education systems. By focusing on these dimensions, this study contributes to filling this gap by systematically modeling how domestic and organizational factors influence perceived interference during learning activities. The integration of multiple analytical approaches allows for a more nuanced interpretation of hidden patterns and interdependencies that are often overlooked in conventional analyses.
From an applied perspective, the findings provide useful insights for educational institutions and policymakers. Understanding the drivers of perceived interference can inform the development of targeted interventions aimed at improving home learning conditions, including strategies for noise mitigation, space organization, and support mechanisms for students with high family-related burdens. Furthermore, the results may support the design of more inclusive digital learning frameworks that account for socio-environmental disparities. Overall, this research reframes the concept of educational space in distance learning contexts, highlighting how the home environment becomes an active component of the learning process. It emphasizes that learning quality is not solely determined by digital tools or pedagogy, but also by the interaction between individual conditions, family dynamics, and environmental constraints.

2. Materials and Methods

2.1. Study Population and Sample Characteristics

To check how living conditions affect distance studying, we ran a poll with students across every program at Universidad de Las Américas in Quito, Ecuador. Also, we were not able to launch it right away. Instead, we tested early drafts on twenty people to see if they could point out confused spots or phrase problems to make the questionnaire compilation easier for users. This helped us refine the tool to make sure its purpose would be as clear as possible in the long run. Once we had refined this draft, we tested again with ten students to make sure everything would go smoothly in a clickable form online.
After reviewing compliance with current legislation and national and international standards on the matter, the Human Research Ethics Committee of the Universidad de Las Américas (CEISH-UDLA) approved the protocol, research instruments, and informed consent for this study, with approval code VPR-201113-001. All students gave their consent to participate in the research.
The survey sample consisted of university students who voluntarily completed the questionnaire. A total of approximately 2477 participants responded to the request for participation, providing a statistically significant set of data for evaluating the phenomenon under investigation. Regarding gender distribution, 44.53% of participants identified as male, 55.35% as female, and 0.12% as another gender category. The questionnaire integrated closed-ended questions using a 5-point Likert scale to assess perceptions, judgments, and levels of agreement regarding different aspects of the distance learning experience. The scale ranged from 1 (“no interference”) to 5 (“high interference”), with intermediate values (2–4) indicating progressively increasing degrees of interference. This coding approach ensures a consistent interpretation of responses, where higher scores correspond to a greater perceived impact on the investigated aspects. Although the Likert data were treated as numerical values for statistical analysis, they remain inherently ordinal and were interpreted accordingly throughout the study. It also included yes/no questions (e.g., about caregiving responsibilities), as well as items on the number of children, household composition, the days devoted to income-generating activities, the number of hours spent studying, or the locations where academic activities took place [28,29].
The target population of this study consists of students enrolled at the university campus, representing individuals engaged in blended and distance learning activities. Participants were recruited through institutional email invitations sent via official university mailing lists, ensuring direct access to the relevant academic community. The recruitment process was voluntary and based on self-selection, with incentives provided for participation (a prize draw for gift cards). Inclusion criteria required respondents to be actively enrolled students at the time of data collection and to have experience with online or hybrid learning modalities. Only fully completed questionnaires were considered valid for analysis, ensuring data consistency and reliability across the final sample.

2.2. Survey Instrument and Measurement Design

The questions are designed according to guidelines for creating soundscape assessment tools, as specified in international regulations such as ISO 12913-3:2025 [30], which details the conceptual model, methods of data collection, and analysis to be used in soundscape assessment. International regulations provide a methodical approach to understanding the views, interpretation, or responses to sounds or soundscapes in a defined setting or environment, including in the context of people’s homes or houses [31]. The question design was based upon an overview of recent scientific publications regarding domestic soundscapes and how they influence concentration or general well-being when indoors, particularly in regard to assessing sound quality with multidimensional perceptual scale methods or pleasantness/annoyance in various studies [32,33].
The wording of the questions followed the principles of clarity, neutrality and specificity, as recommended by Dillman et al. [34]. Each item was designed to avoid linguistic ambiguity or social desirability bias. Direct wording and familiar terms were preferred, minimizing semantic complexity to ensure the questionnaire’s accessibility to students from diverse backgrounds and educational levels.
In accordance with the ISO 12913-2 methodology [35], the questions were grouped into thematic sections: (i) household members and personal responsibilities towards sensitive family members; (ii) description of the home educational environment; (iii) evaluation of interference caused by changes in the home environment; (iv) evaluation of interference caused by discomfort/pain caused by the use of distance learning.
Particular attention was paid to the construction of perceptual scales for the evaluation of acoustic comfort, inspired by the psychoacoustic metrics of annoyance and pleasantness described by Zwicker and Fastl [36]. The rating scale was calibrated through a preliminary pilot testing phase with a small group of students, in order to verify the comprehensibility of the items and the internal consistency of the responses.
Finally, questions regarding acoustic interference during distance learning were integrated with indicators of perceived well-being and cognitive performance, following the multidimensional approach proposed by Basner et al. [15] and Dockrell & Shield [37] for the study of the impact of noise on learning. In this way, the questionnaire was able to explore not only the physical characteristics of the domestic soundscape but also its psychological and behavioral implications, ensuring a complete evaluation consistent with international soundscape standards.

2.3. Data Collection Procedure and Study Design

The first sections of the survey collected information regarding household composition, with particular attention to the presence of children, elderly people, or people with disabilities, as they could be sources of interference or caregiver burden. A second section explored students’ domestic responsibilities toward cohabitants and the impact these commitments had on participation in synchronous lessons and independent study activities. A further set of questions explored the role of household furnishings and available technologies—such as internet connection quality, availability of personal devices, and spatial configuration—in influencing the effectiveness of online learning. The final section addressed perceptual and physical aspects of learning, investigating both any disorders or discomforts associated with study activities and the perception of noise interference within the home, in relation to both synchronous lessons and individual learning activities.
The questionnaire development followed an iterative design process grounded in existing literature on learning environments, family responsibilities, and perceived interference in academic activities. The initial 29-item instrument was subjected to a pilot study involving a subset of students from the target population, aimed at evaluating clarity, relevance, and comprehensibility of the items. Based on feedback from this phase, minor revisions were implemented to improve wording consistency and conceptual alignment. Internal consistency was assessed using Cronbach’s alpha, which indicated satisfactory to excellent reliability across the main constructs. Overall, the instrument demonstrates adequate face and content validity, supported by its theoretical grounding and expert-informed design process.
The analysis began with an exploratory phase to understand the distribution of the main variables being studied [38]. The target variable relating to the perception of acoustic interference was examined, with this variable divided into two dimensions: during synchronous teaching activities (real-time online lessons) and during independent tasks. The distribution of responses for both variables was analyzed to identify any central tendencies, asymmetries or dispersion that could suggest different levels of sensitivity to domestic noise among participants [39]. Subsequently, the distribution of the predictor variables was analyzed, including the main family and household factors that could be associated with the perception of interference. These factors included family size, the presence of children or elderly people in the home, the availability of a dedicated study space, the quality of the internet connection, the type of housing, and any physical ailments that interfered with sitting down to study. Descriptive analyses of these variables were conducted using graphical representations and summary statistics (frequencies, means and standard deviations), which were useful for identifying recurring patterns and potential noise or distraction conditions. Finally, the variables were analyzed in relation to the gender of the respondents to verify the presence of systematic differences in the perception of interference and the distribution of domestic factors [40]. This comparison enabled us to identify potential disparities relating to the different management of family roles or household responsibilities, and to highlight any gender-related differences in the perception of acoustic comfort and the sustainability of distance learning activities.
The next step was to look closely at the dataset to see if there were any important links between the things that were measured (the predictors) and the things that were measured (the target variables) in relation to the perception of acoustic interference. To this end, a Spearman correlation matrix was calculated to represent the nonparametric measure of monotonic association between pairs of variables [41]. This methodological choice was made because many of the variables under consideration do not follow a normal distribution and may have non-uniform ordinal scales or intervals. The resulting correlation diagram provides a visual representation of the relationships between all variables, highlighting positive or negative coefficients through color coding [42]. This allowed us to spot groups of predictors with similar behaviors in relation to the target variable, suggesting the presence of structural patterns or indirect relationships [43]. Additionally, the matrix was useful in highlighting possible redundancies or interdependencies among the variables. These variables could have an effect on the next statistical modeling stage. This “exploratory correlation analysis” created a rock-solid basis for a “data-driven direction” to choose features which are most relevant in future analyses, allowing us to understand “the underlying relational structure hidden in the data” [44].
For deeper insight into relations between each predictor variable and the target variable, we used bivariate analysis with Kruskal–Wallis [45] and Jonckheere-Terpstra [46]. These two methods allow us to analyze relations between two different variable groups in detail. With this analysis, we gain deeper insight into certain relations between the variable and the way it reflects changes in the variable used in the analysis. Bivariate analysis allowed us to gain deeper insight into relations and to identify important trends, even in nonlinear models. It provided a more nuanced and more subtle picture of the relations between the variable and the variable used in the analysis. On the one hand, this phase of analysis plays an important role in identifying the most significant variable and increasing the ability of the analysis to explain the phenomenon. On the other hand, it enabled us to gain deeper insight into the variable that shapes our perceptions of acoustic interference in distance learning.
The next step was to examine how well this model predicts outcomes and to find non-linear relationships between all factors. The Random Forest classifier was used to check this dataset, which has many variables of type ‘categorical.’ The Random Forest classifier is especially good for use with datasets containing many ‘categorical-type’ variables [47]. It is also known to be particularly good for use in situations where there are many variables or when outcomes occur non-linearly with all factors of a dataset, and no inflexible theory of what constitutes ‘normal distribution’ is needed [48], which it was and thus was good to check.
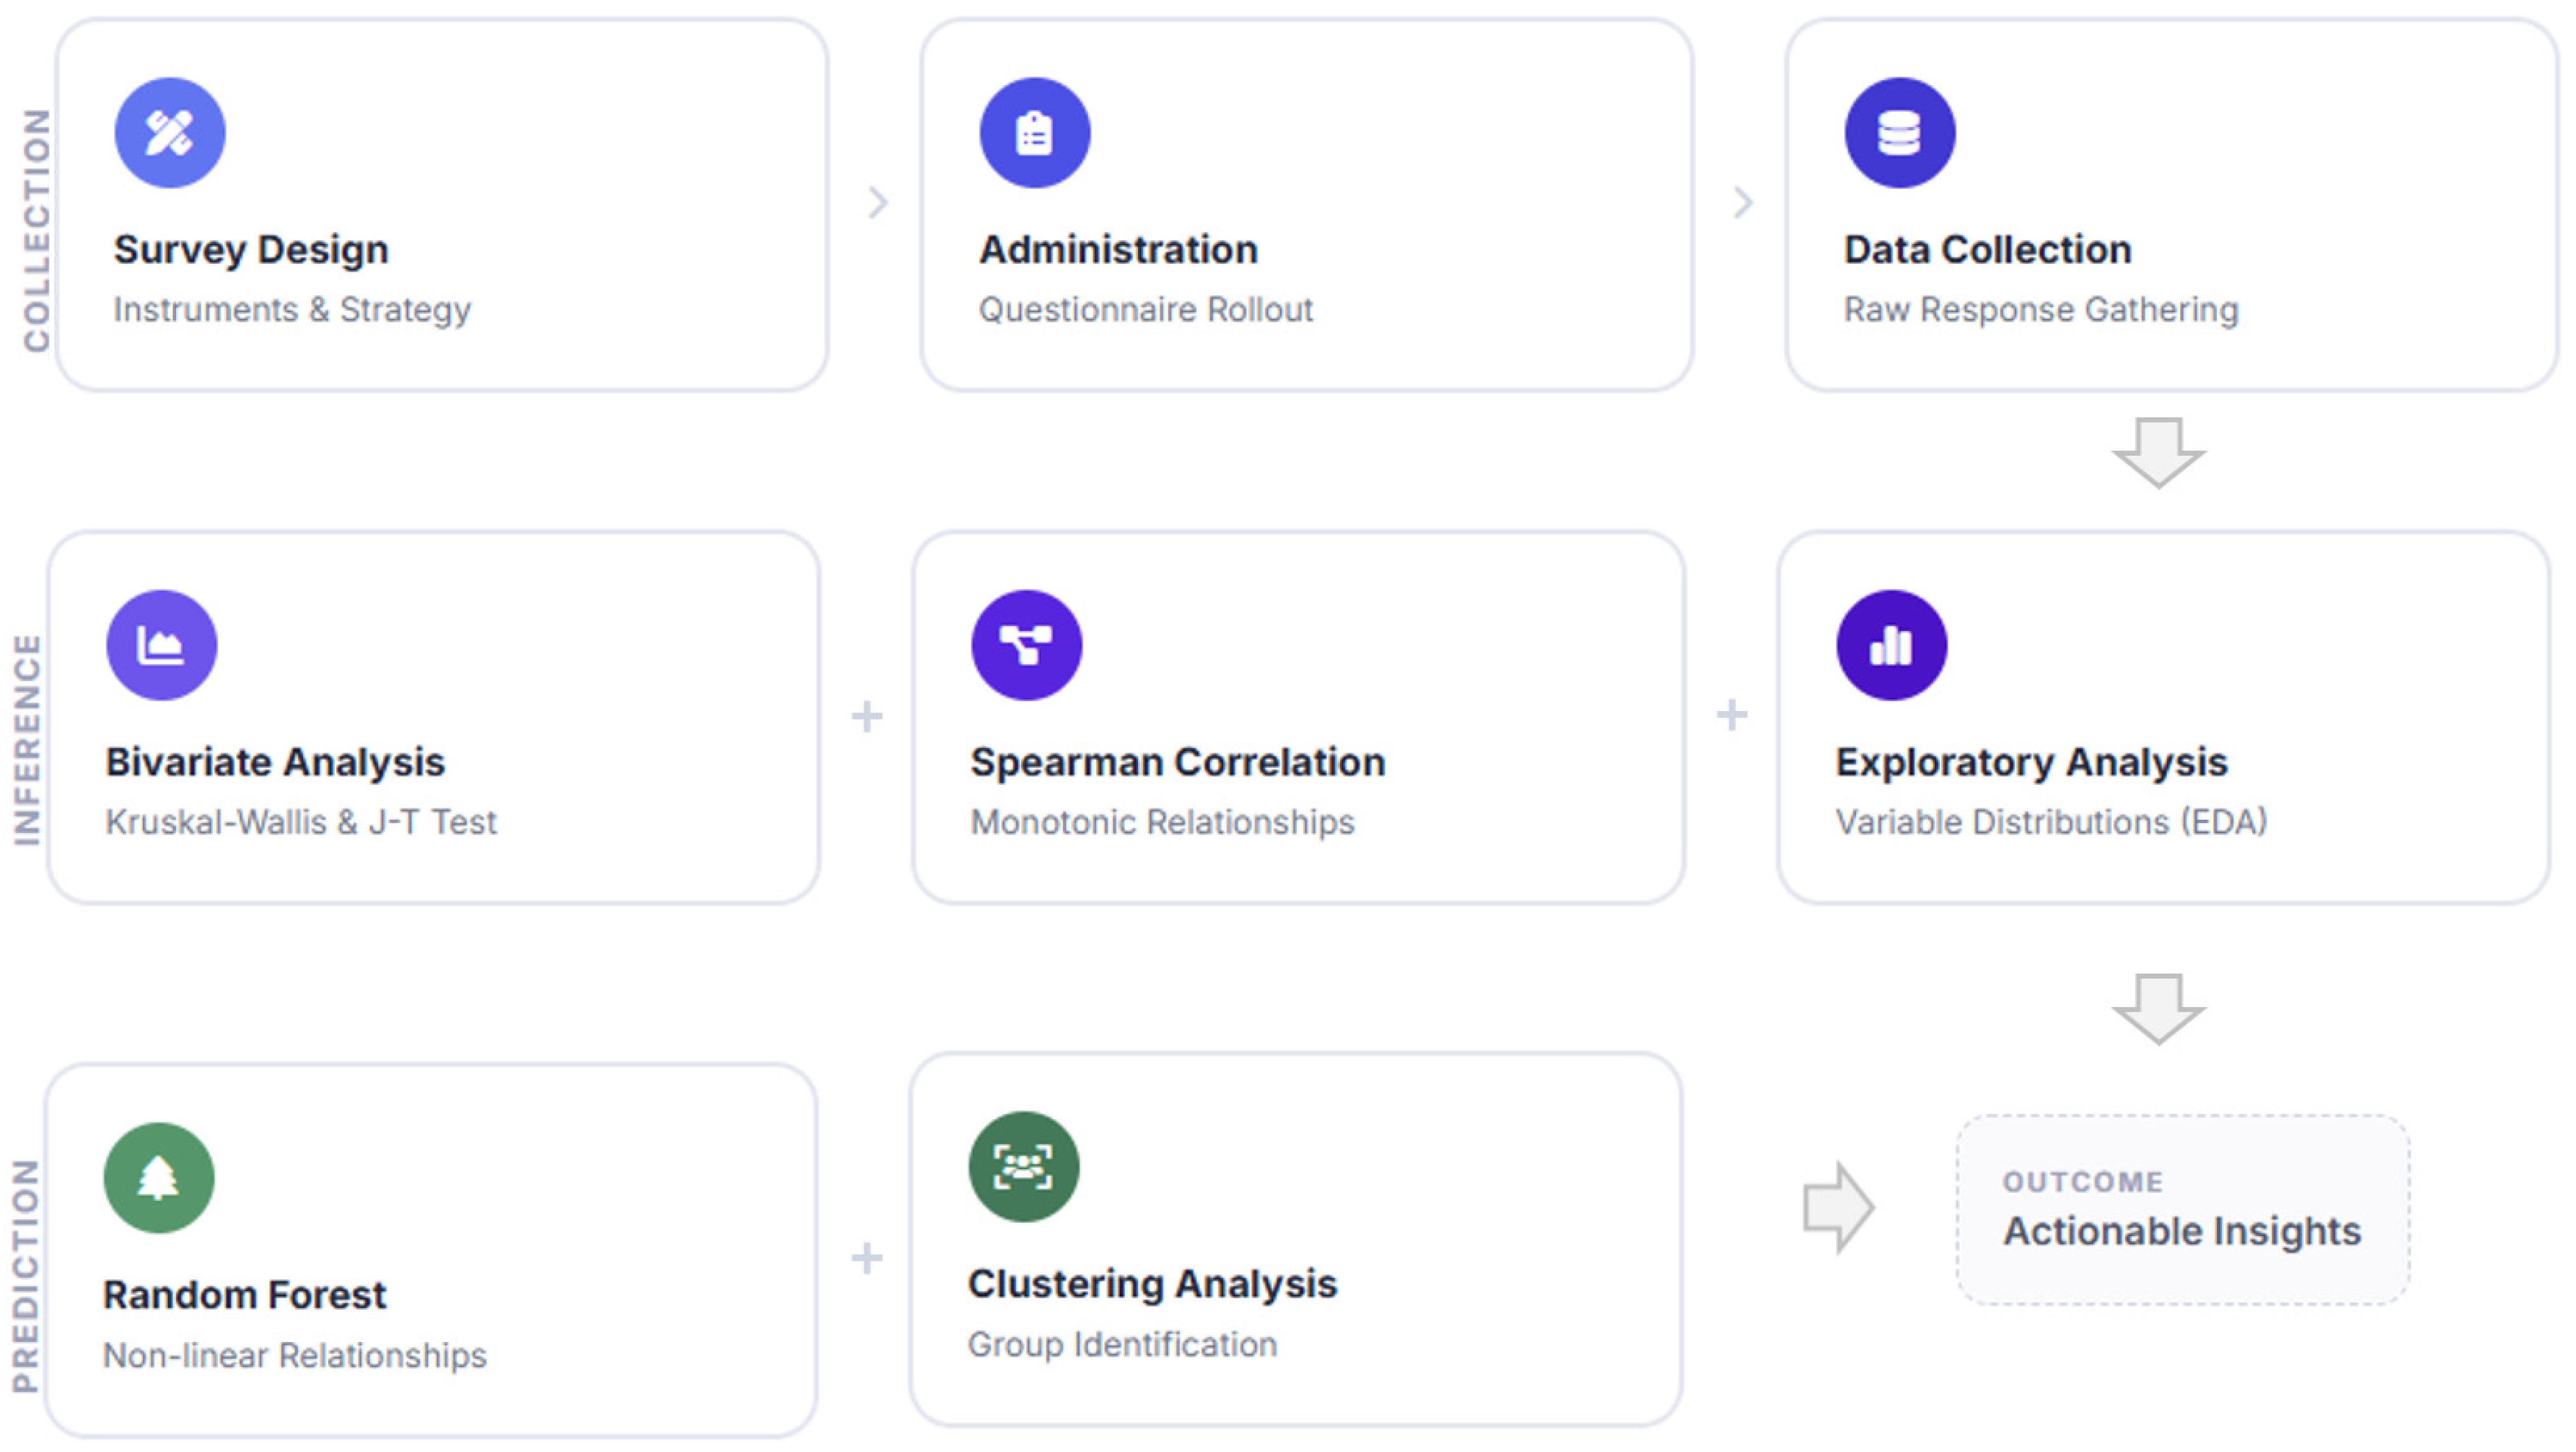
As shown in Figure 1, the methodological workflow is organized into distinct analytical stages that structure the overall research process. The diagram provides a concise overview of the sequence of analyses and their logical arrangement within the study framework.
Finally, clustering techniques were applied to the dataset to explore the presence of recurring patterns and homogeneous groups within the student population [49]. This unsupervised learning approach allows natural aggregations between individuals to be identified based on similarities found between predictive variables, without the need for predefined labels or categories [50]. The analysis aimed to identify subgroups of students with similar characteristics in terms of domestic factors, family responsibilities, housing conditions and perception of noise interference. Clustering revealed latent structures in the dataset that would not emerge through traditional univariate or bivariate analyses. Depending on the considered variables and the chosen distance for the similarity measure, the obtained clusters represent sets of students who share comparable contextual conditions or behaviors. By interpreting the results, we were able to ascertain distinct student types based on the intensity of the experience of facing disturbances at home and their respective styles in tackling online studies. These findings have significant practical value in that they could be used to inform interventions that could be tailored to particular types of students. The ability to identify distinct groups in this manner could help us understand how students cope in ways that are strong in online study settings; hence, the door is opened to future research that could help improve their wellness, their academic outcomes in online studies, etc.
The diagram in Figure 1 highlights the different analytical stages and their logical organization, without necessarily implying a direct dependency between the outcomes of individual analyses, but rather presenting an overall structured framework of the research workflow.

3. Results

The results presented in this section are based on data collected from a sample of 2477 university students, as anticipated in Section 2. The sample shows a balanced gender distribution, with 44.53% male, 55.35% female, and 0.12% identifying as another gender category, providing a solid basis for the subsequent statistical analyses and findings. The questionnaire demonstrated a very high level of internal consistency, with a Cronbach’s alpha coefficient of 0.94, indicating excellent reliability of the measurement instrument. These results confirm that the survey items are highly coherent in capturing the intended constructs and support the robustness of the dataset used for subsequent analyses. Overall, the sample size and reliability metrics ensure a solid empirical basis for the statistical and machine learning procedures applied in this study.
To ensure the reliability of the survey instrument, internal consistency was assessed using Cronbach’s alpha for each identified construct (Table 1). The survey variables were organized into four coherent constructs to ensure a structured and interpretable analysis of students’ home study conditions. The Household and Family Context captures domestic responsibilities and their impact on academic activities. The Study Environment and Infrastructure reflects the quality and adequacy of physical and technological resources. The Physical Well-being and Discomfort addresses ergonomic and health-related factors affecting study performance. Finally, the Study Conditions and Social Interference describes study habits, shared spaces, and external disturbances. This construct-based organization enhances the conceptual clarity of the model and supports a more robust assessment of reliability and subsequent analyses.
As shown in Table 1, all constructs exhibited good to excellent reliability, with Cronbach’s alpha values ranging from 0.84 to 0.91, and an overall scale reliability of 0.94.
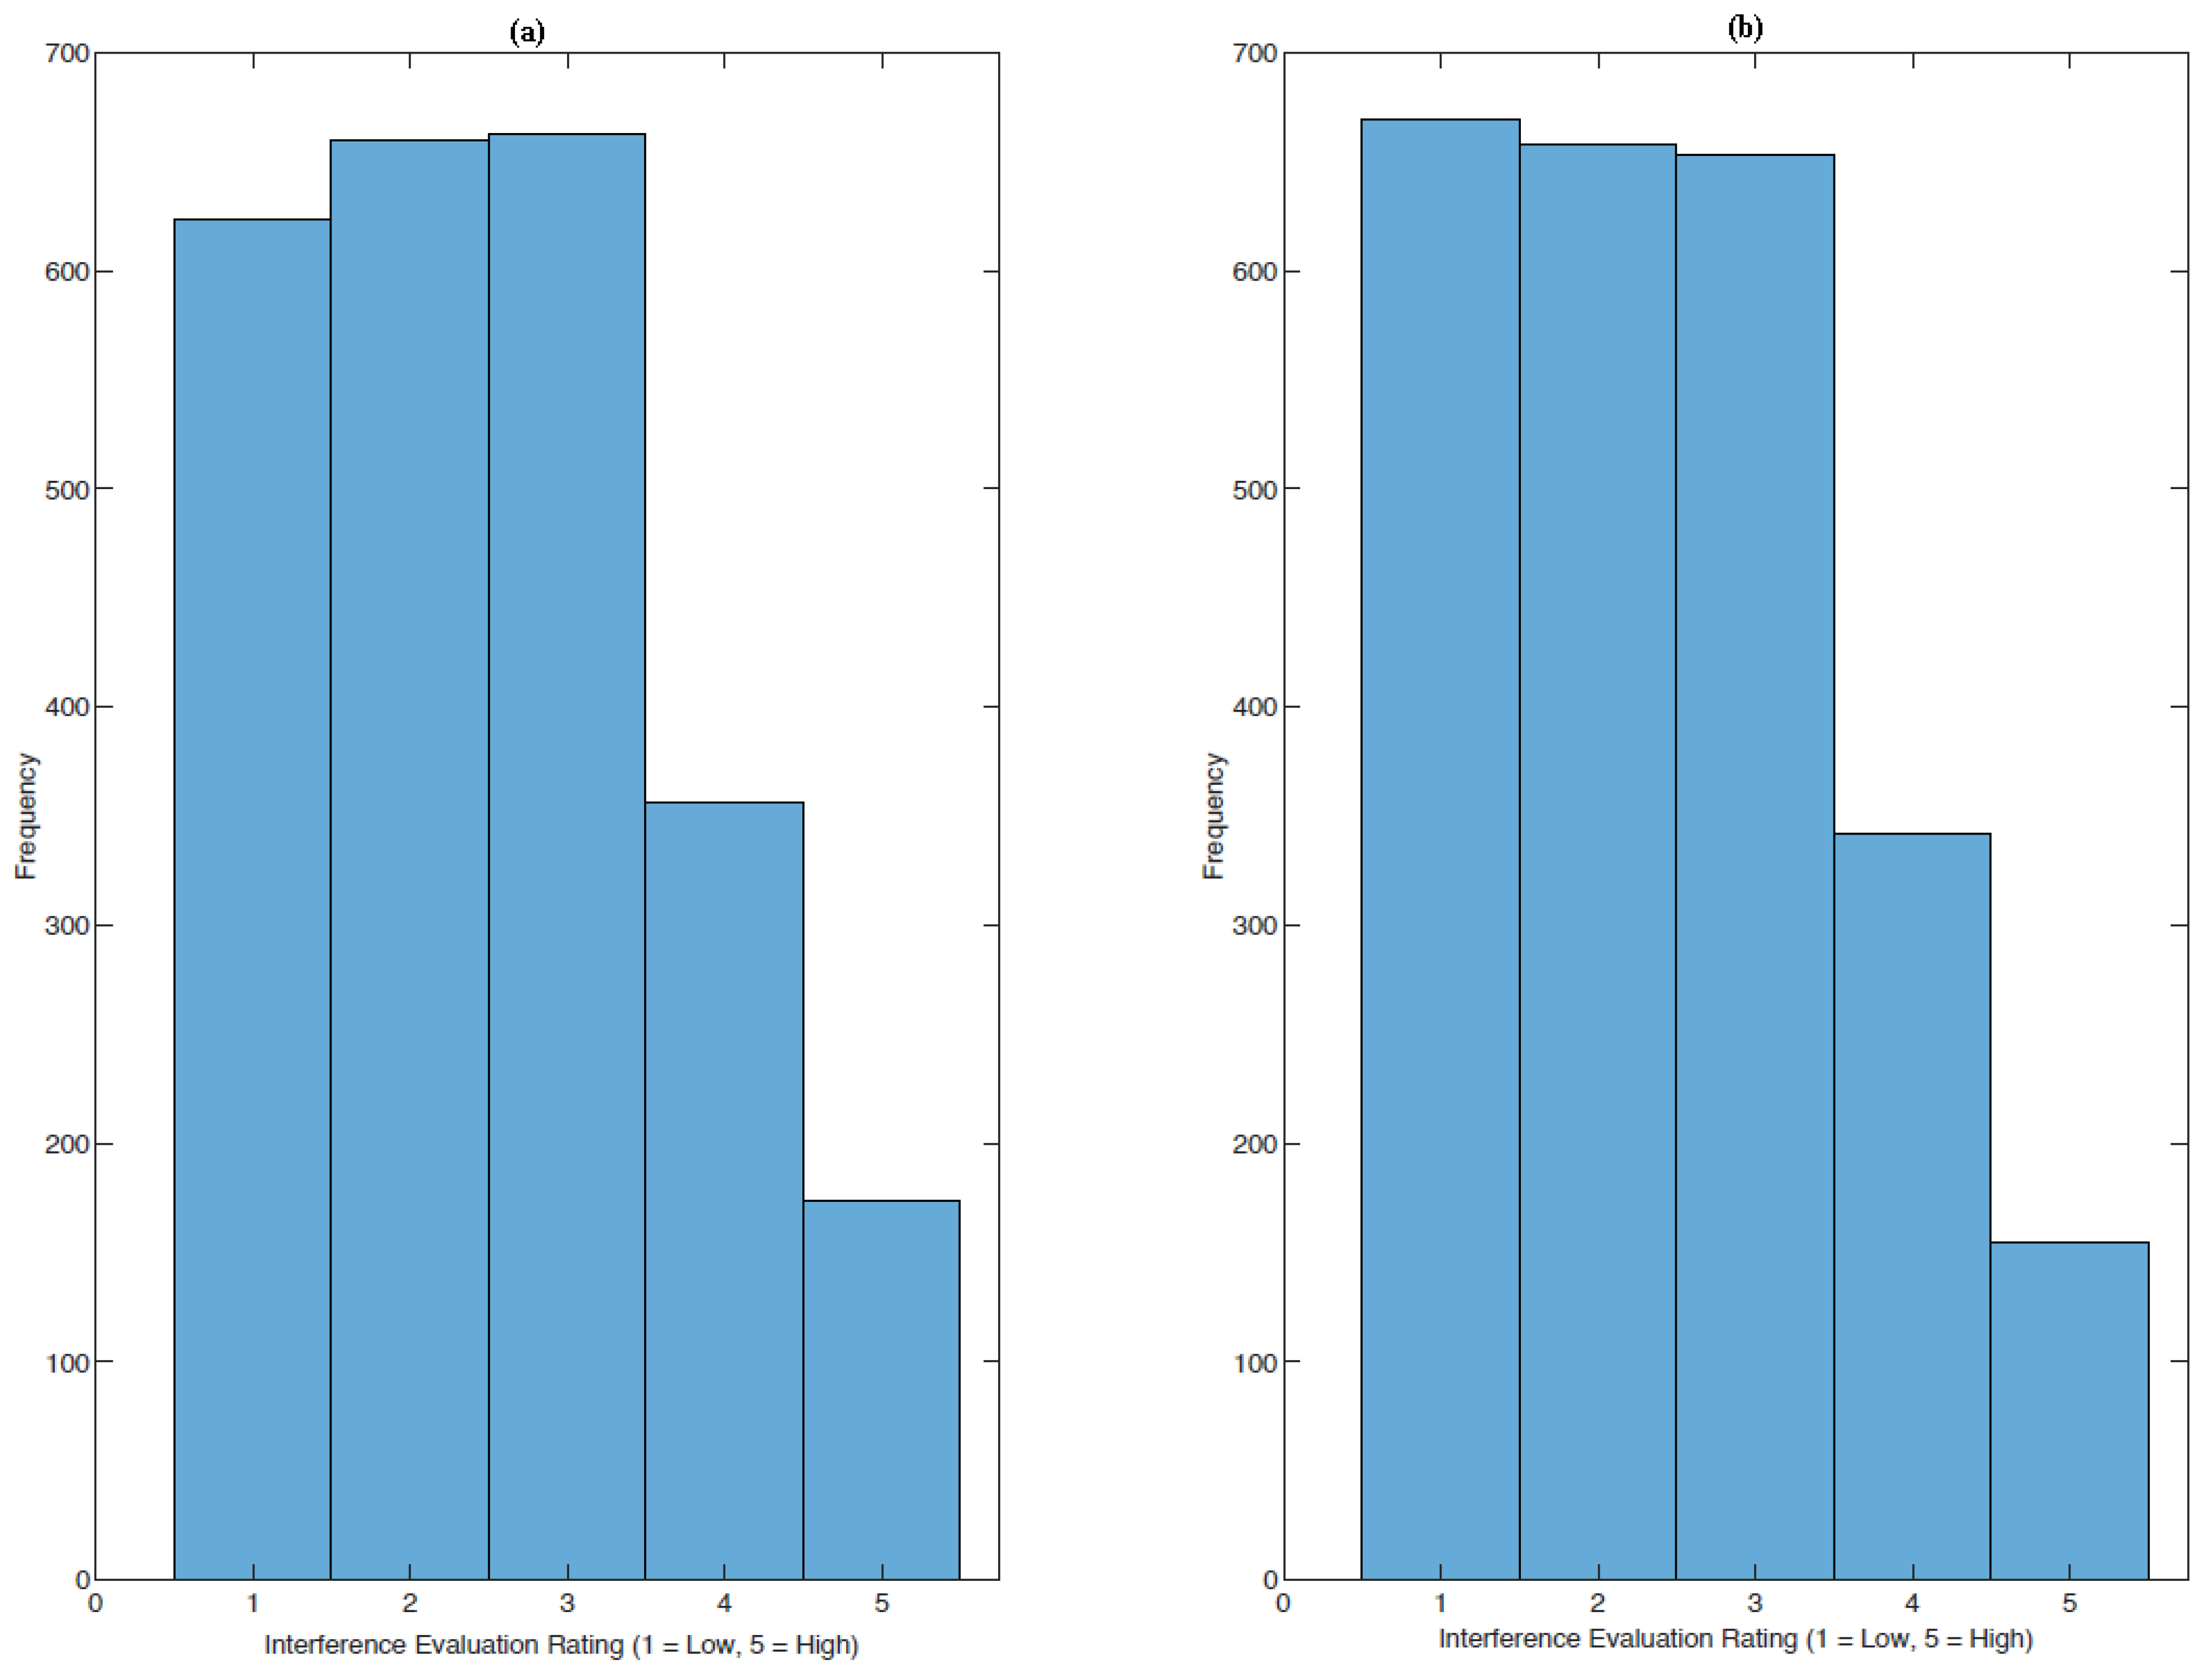
The first findings of exploratory analysis concern how the target variables are distributed. Here, in particular, it is important to consider how a person perceives acoustic interference in synchronized teaching or during independent task performance. The distribution diagrams of perception of acoustic interference during synchronous and autonomous activities show a prevalence of responses between 1 and 3, corresponding to low or medium levels of perceived interference (Figure 2).
Overall, this analysis provides an initial quantitative overview of the phenomenon, demonstrating that acoustic interference is perceived differently but tends to be limited within the analyzed sample. These results form the basis for further investigation in subsequent sections on relationships with predictive factors and differences between student subgroups.
As Figure 2 illustrates, for a considerable number of students, the acoustics of their home environment do not pose a major hindrance to distance learning, whether during synchronous teaching or independent study. Many students appear to have a relatively quiet environment or one that is adequate for maintaining a sufficient level of concentration, as suggested by the concentration of values in the lowest disturbance bands. There are a number of reasons for this. These include the organization of family spaces, the availability of a dedicated study room, and the awareness of family members in reducing noise during online lessons.
The problem is relevant for a significant portion of the student population, even if it is not widespread. This is indicated by the presence of a significant number of participants reporting moderate levels of acoustic interference. This suggests that the experience is not homogeneous and that noise can become a critical factor for some individuals. The reasons for these higher levels of disturbance may be many and varied, including small homes, shared environments, the presence of children or elderly people who require constant attention, or domestic activities that inevitably generate noise. The quality of sound insulation in buildings can also have an impact, especially in urban contexts or older homes.
The asymmetric distribution towards lower values, therefore, confirms a high degree of heterogeneity in the initial conditions. This heterogeneity can be interpreted as the result of socio-economic, cultural and spatial differences influencing the perception of acoustic comfort. It is also plausible that some students have developed coping strategies despite living in noisy situations, such as using headphones, choosing less crowded times, or developing greater tolerance of background noise. Overall, the results highlight the need to consider the home environment as a crucial variable in analyses of distance learning, as disparities in acoustic conditions can influence the learning experience to varying degrees.
Subsequently, the analysis focuses on predictive variables, including main family, domestic and personal factors that are potentially associated with the perception of noise interference during distance learning. Table 2 summarizes the set of variables considered in this study, providing a concise overview of their definitions and conceptual meaning. In order to better understand how the data is structured, the variables were gathered into four constructs: Household and Family Context, Study Conditions and Social Interference, Study Environment and Infrastructure, and Physical Well-being and Discomfort.
The variables capture multiple dimensions of the analysis, including family responsibilities, study environment characteristics, technological conditions, and physical discomfort, which together support a comprehensive assessment of students’ academic experience. The questionnaire integrated closed questions with a 5-point Likert scale to assess perceptions, judgments, and levels of agreement with various aspects of the distance learning experience, alongside with yes/no questions, (relating to caring for others), questions about the number of children, the people living in the household, the days on which tasks are carried out to support the family’s finances, the hours spent studying, or the places where academic activities took place.
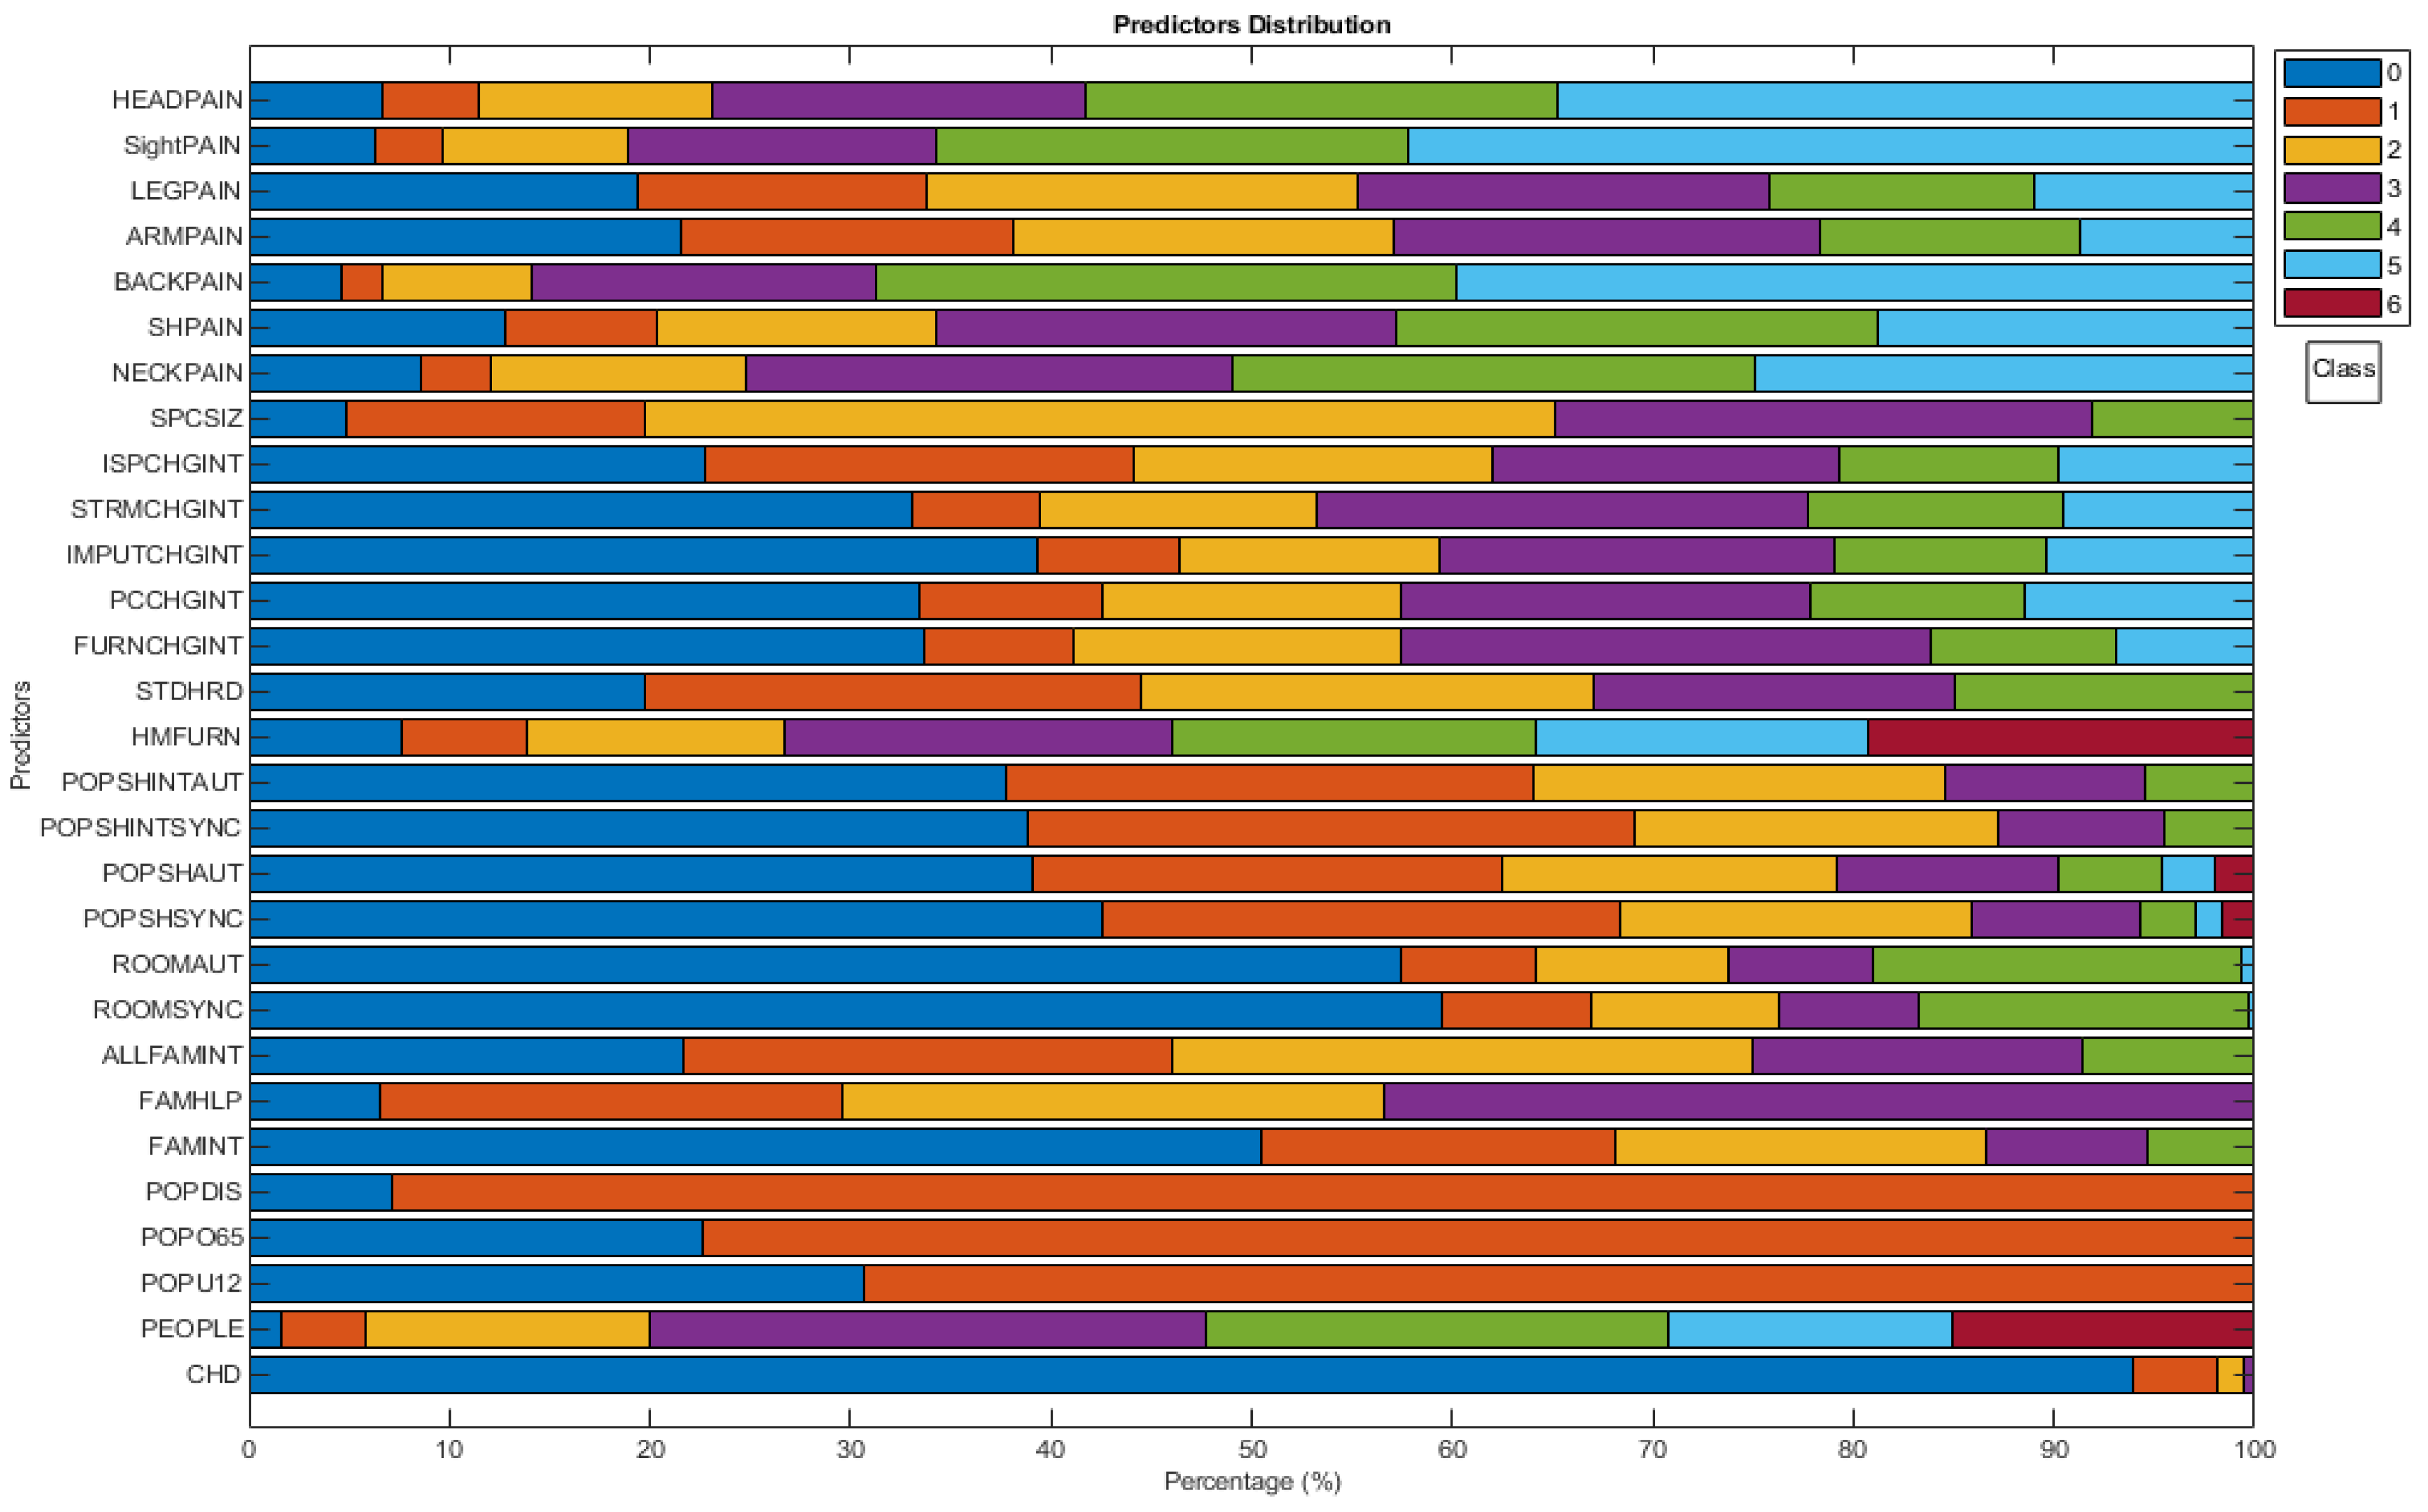
Figure 3 presents the distribution of the key predictive variables describing the main dimensions of family context, study environment, and organizational conditions, providing an overview of the factors potentially influencing perceived noise interference during academic activities and daily learning routines.
Figure 3 shows that almost all of the students (about 95%) do not have children, and family size varies from 2 to 6 members, with 3 or 4 people (1 or 2 children) being the most common household size. However, the data also reveals a significant presence of large households, with approximately 15% of students coming from families with five or six members. Family responsibilities have a varied impact: those related to caring for others are generally limited, while the overall burden of responsibility seems to have a greater impact on academic activities.
As for learning spaces, about 60% of students attended classes in individual rooms, while 20% shared a room with others. About half of the respondents said they studied alone, while 20% shared the space with another person, and small percentages shared it with five or more people. Interference due to the presence of other family members was perceived as absent by 40% of students, mild by 30%, and high by the remaining 30%.
With regard to the comfort of the furniture, the responses are distributed across the entire Likert scale, while the daily hours of study are evenly distributed between 4 and 11 h. Regarding infrastructural changes (e.g., furniture, computers and internet connection) that occurred during the pandemic, approximately 30% of students reported no changes, while 20% reported a moderate effect on their academic activities. Furthermore, approximately 45% of students undertook their studies in confined spaces, with 50% experiencing significant physical discomfort (e.g., back and neck pain) due to prolonged sitting.
Overall, these results provide an insight into the complex relationship between domestic and postural conditions and the distance learning experience, emphasizing the importance of environmental and physical factors in perceived comfort and teaching effectiveness.
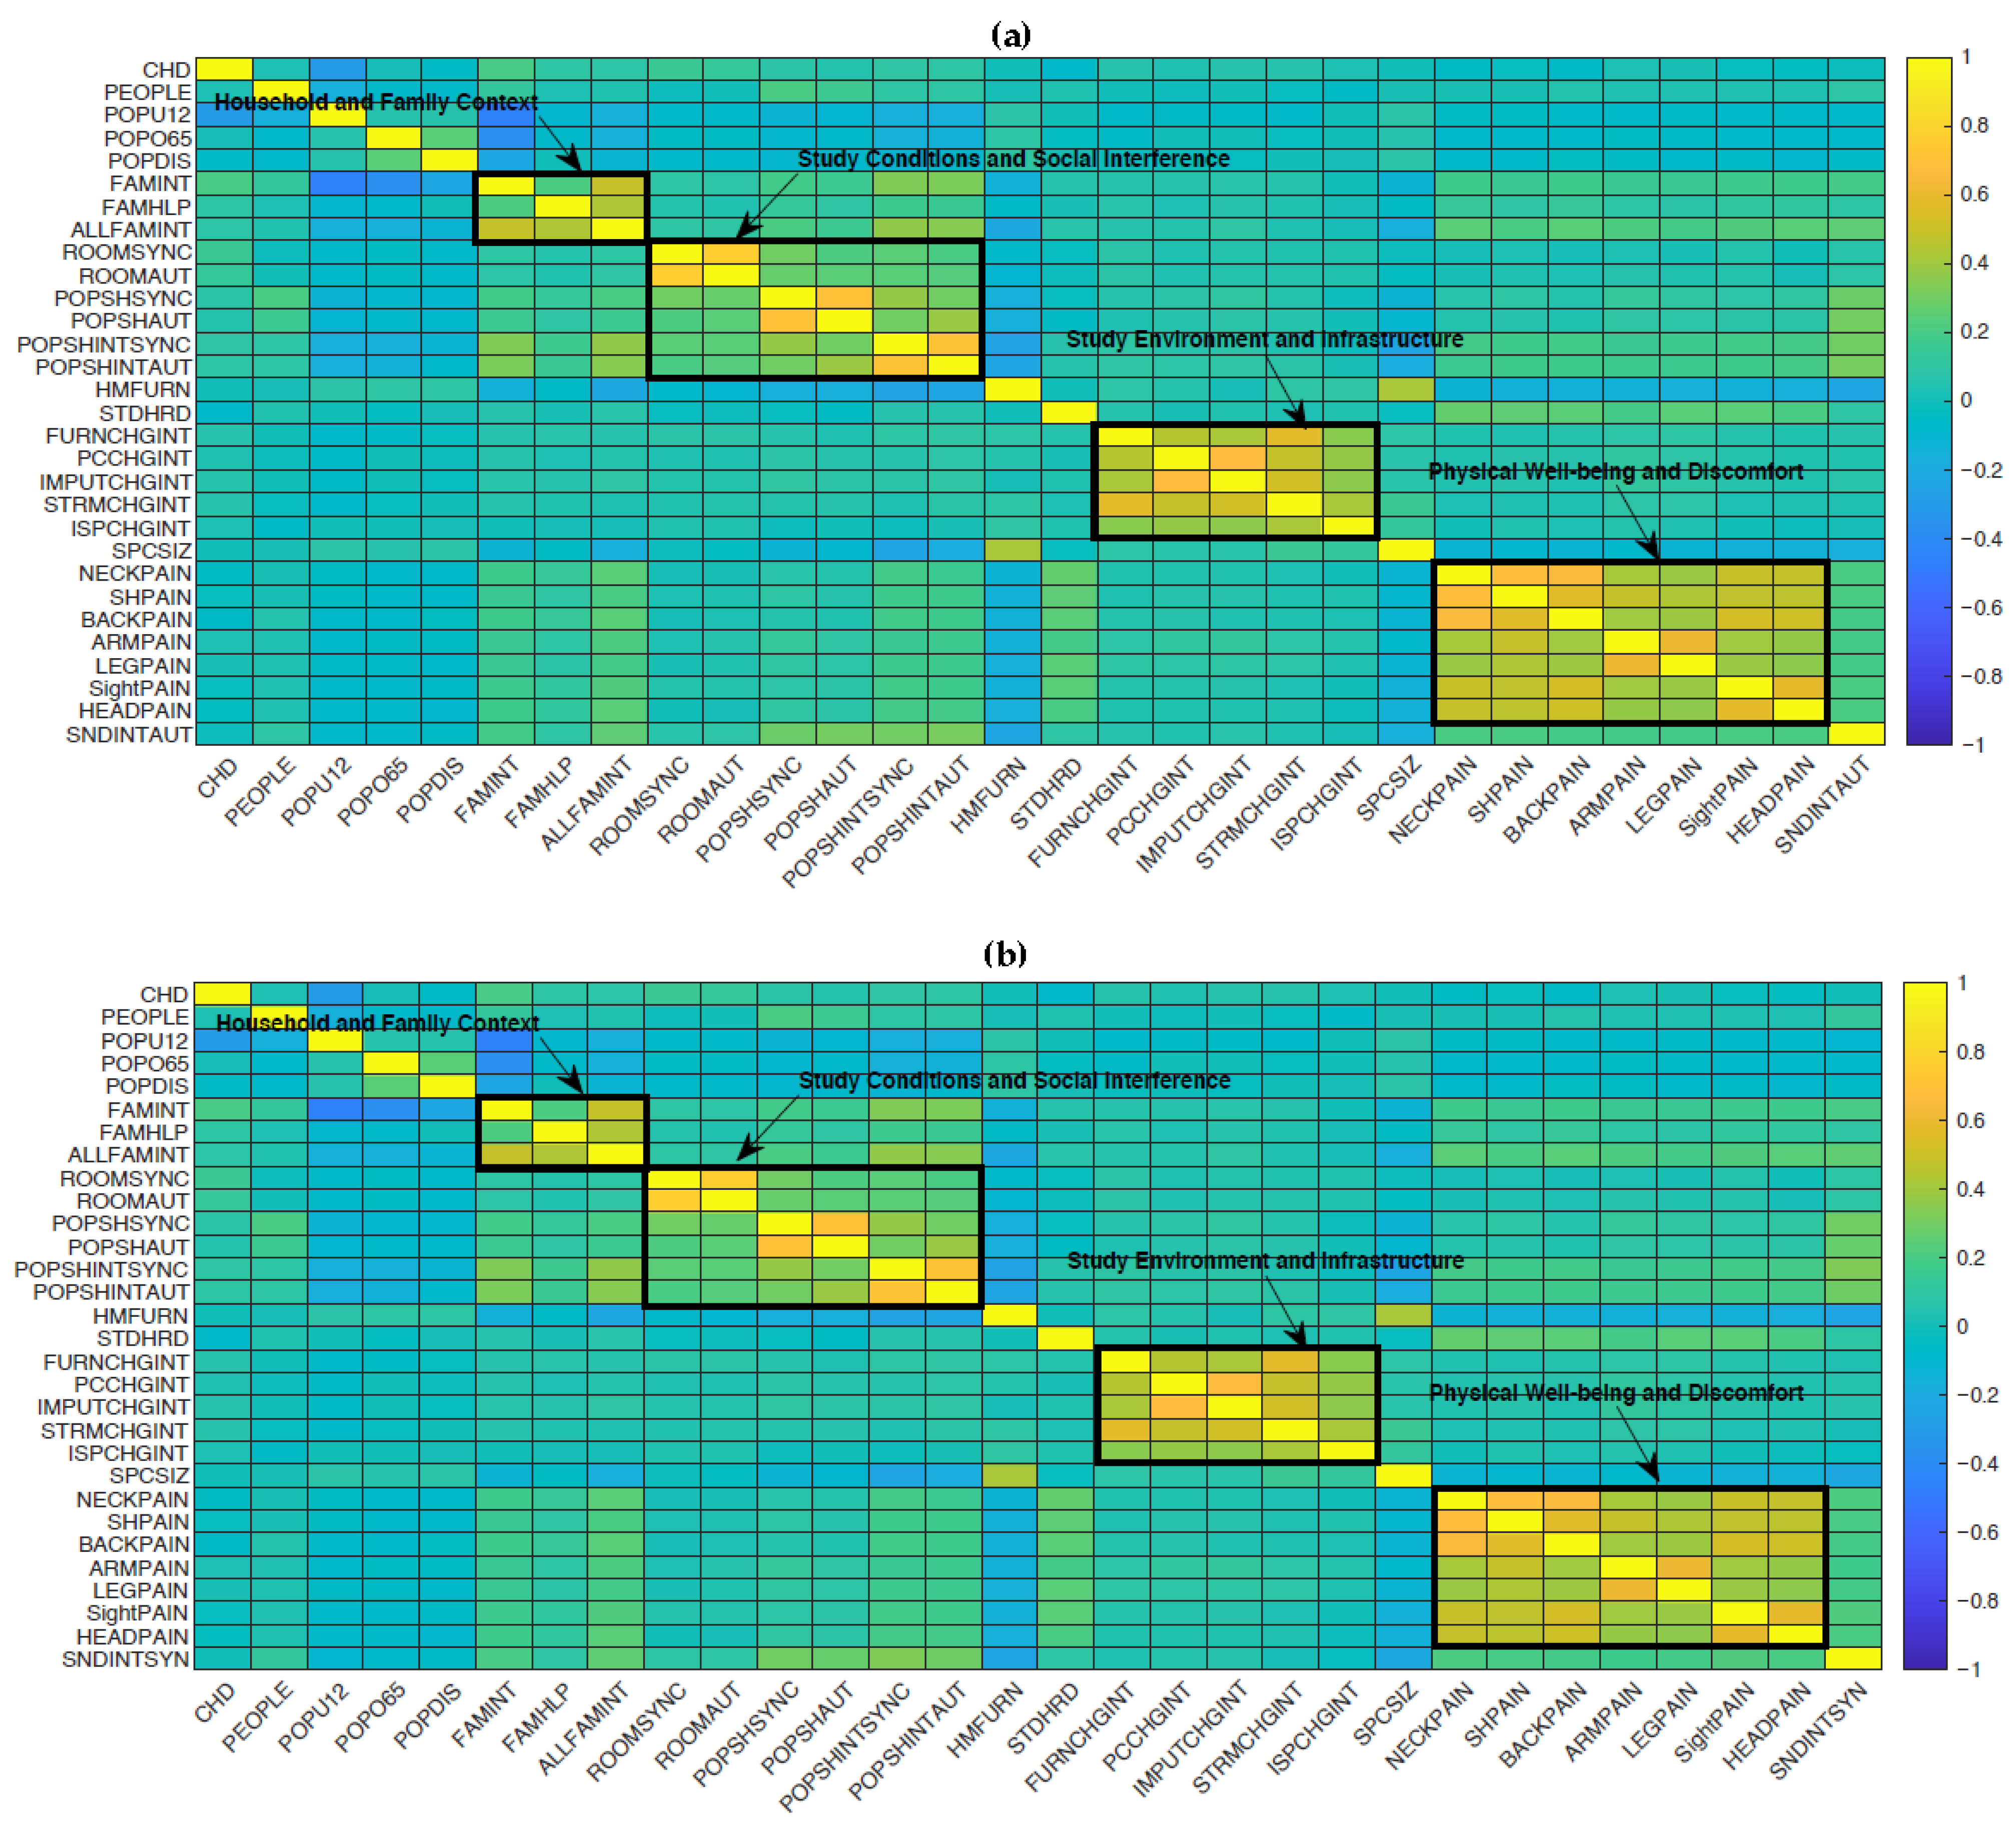
Analyzing Spearman’s correlation matrix was crucial in exploring the relationships between the predictive and target variables related to the perception of interference in distance learning (Figure 4). This non-parametric measure was particularly well-suited to our dataset as it enabled us to identify monotonic relationships even when variables did not follow Gaussian distributions or had ordinal scales. Using Spearman’s correlation enabled us to overcome the limitations imposed by any deviations from normality, providing a robust and reliable representation of the associations between the different dimensions explored.
Investigating the Spearman Matrix (Figure 4) was necessary to gain insight into the relationship between the predictor variables and the target variable—the perception of interference in the distance learning aspect. This was made possible by the Spearman matrix’s ability to be used with any type of data set since it measures the relation between the data sets, even if the variables are not normally distributed or the data set is not normally measured on an ordinal scale. Such a correlation map will produce a high-level overview of how the family/domestic variables correlate to the interference perception. Such an overview presents the cluster formed by the correlated values with respect to the target variable. It even hints at possible thematic groups to summarize the data into specific domains. It can be appreciated that the matrices corresponding to the interferences in synchronous (Figure 4a) and autonomous activities (Figure 4b) are very similar.
There are four basic clusters, pointing to four dimensions of the home and familial environment that play a role in shaping the perception of interference. The first cluster concerns the presence of members of the affected families who have some type of disability. The connection in this case is very strong, implying that the experience of tackling the difficulties that may be present in managing the disability may play a significant role in shaping the experience of interference in the context of distance learning.
The second group identified concerns about family responsibilities and the availability of dedicated learning spaces. The correlations highlight how the lack of adequate physical space and the high number of family responsibilities (caring for young children or elderly relatives, managing domestic activities) contribute significantly to increasing the perceived level of interference. The coexistence of these conditions creates a context of distraction and overlapping roles, which can reduce concentration and the effectiveness of participation in educational activities.
A third group was identified from questions relating to the impact of domestic changes during the pandemic on academic activities, particularly regarding the availability and quality of material and infrastructural resources. The variables included in this group refer to the presence and adequacy of study furniture, computers, mice, and/or keyboards, the existence of a dedicated study room, and the quality of the Internet connection, with specific reference to the provider and network speed.
Correlation analysis shows that these elements had a significant impact on the perception of interference in distance learning. In fact, deficiencies in technological equipment or the physical organization of the home have led to difficulties in concentration, ergonomic discomfort and interruptions to learning continuity. At the same time, an unreliable or slow internet connection has created a structural barrier, hindering participation in online lessons and exacerbating frustration. These factors, therefore, emphasize the importance of adequate material and digital resources in the study environment for successful distance learning, and highlight the need for equitable access to these resources to ensure an effective and inclusive learning experience.
The fourth group of correlations was finally revealed to be related to variables indicating physical discomfort resulting from substandard domestic and posture-related issues. As the connection to the target variable makes plain, factors such as ergonomics or environmental conditions, such as lighting, time spent sitting, or even conditions of the workstation itself, broaden the perception of discomfort within the equation above. The physical dimension of online lessons is an important part of it, though it can be an aspect to overlook at times, as is being addressed by this group in highlighting its importance to the entire equation of well-being.
Thus, in brief summary, the correlation matrix provided by Spearman’s test enabled the researchers to identify the pattern clearly: the interplay between family, space, and physical conditions accounts for the way in which the respondents perceive the issue of interference in distance learning.
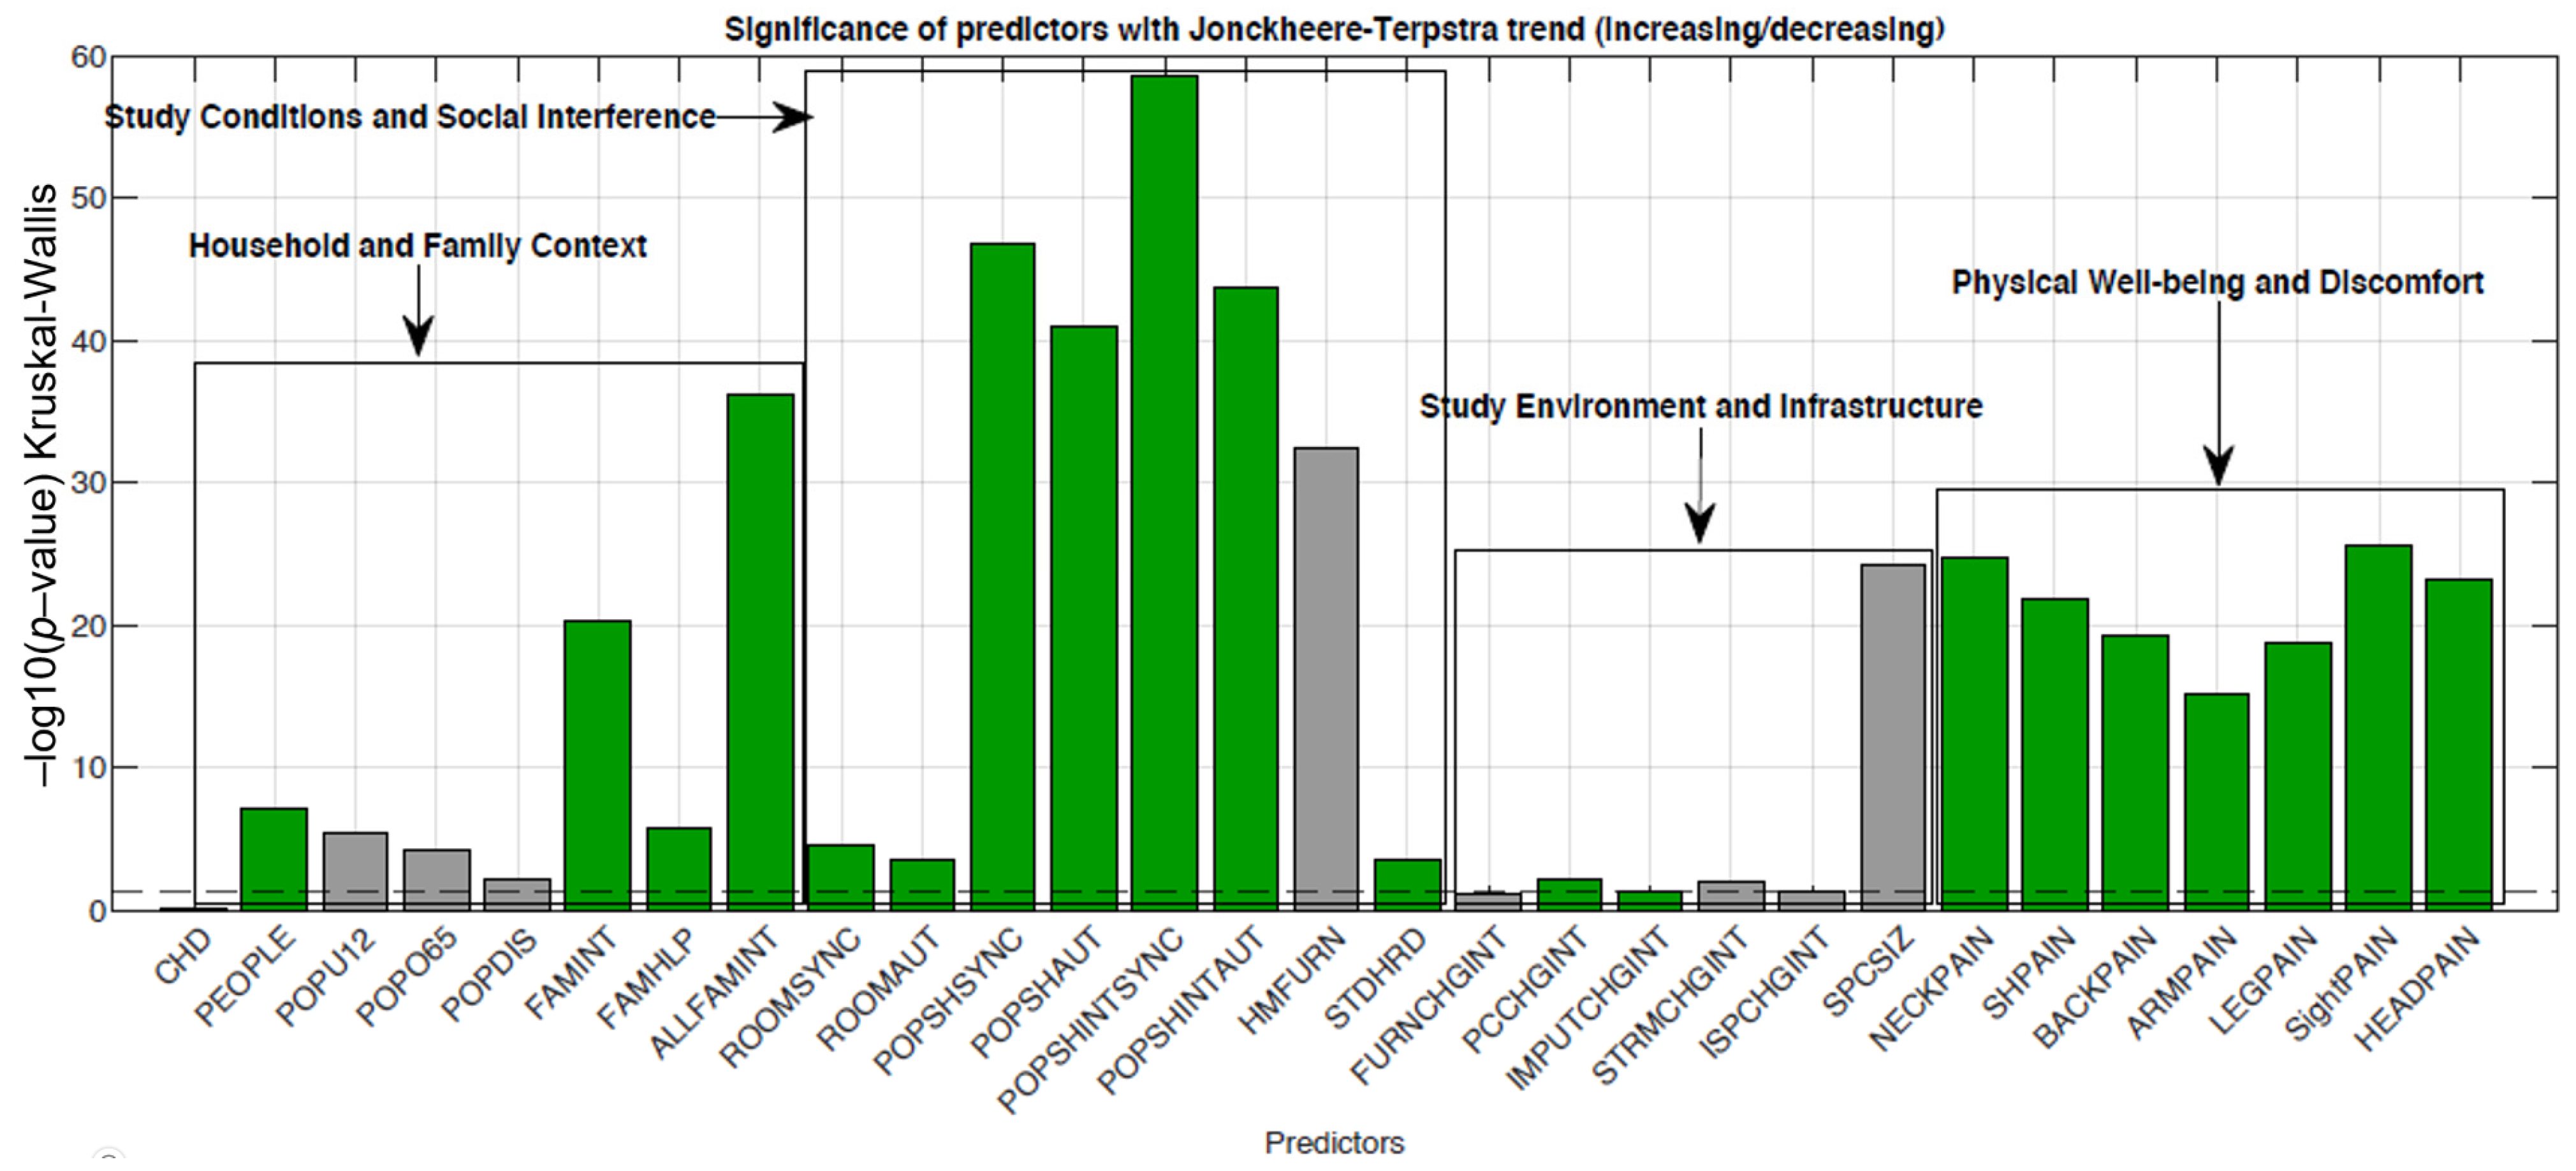
To examine each of our predictors’ particular relationship with our target variable in even more detail, we chose to perform a bivariate analysis using the Kruskal–Wallis and Jonckheere-Terpstra tests (See Figure 5). This will allow us to examine each of these pairwise relationships and examine more closely any particular correlations between movements in each of these variables. By using this approach, it is possible to not only detect any kinds of linear relationships but also any kinds of possible nonlinear relationships as well.
The bivariate analysis conducted using the nonparametric Kruskal–Wallis and Jonckheere–Terpstra tests made it possible to identify with greater precision the predictive variables most closely associated with the perception of acoustic interference during distance learning activities. These methods, which are particularly suitable in the presence of ordinal variables and non-Gaussian distributions, provided robust evidence both in terms of statistical significance and trend direction, allowing for a more accurate assessment of the relationship between each predictor and the target variable. This analysis has provided insights not visible through a less sophisticated investigation. With this, there is a better chance of fine-tuning the whole model of interpretation. Among the notable findings is that those variables associated with the sharing of space within the home have the greatest explanatory capacity. To note is that being surrounded by other people within the environment of the investigation, such as family members, roommates, or even kids, is associated with a rise in acoustic interference. This effect appears consistent with the very nature of distance learning, which requires prolonged concentration, continuity in lesson attendance, and reduction in sensory distractions. Shared and dynamic environments, where daily activities, conversations, family needs, or simple background noises overlap, can easily generate disturbances that affect attention and the quality of the learning experience.
The presence of a growing trend highlighted by the Jonckheere–Terpstra test also suggests that perceived discomfort does not increase randomly, but follows an orderly progression: as the density or frequency of domestic interactions increases, so does the perception of interference. Similarly, the Kruskal–Wallis test confirmed significant differences between groups, indicating that housing conditions are not a homogeneous factor in the student population, but an element of high variability. These results allow us to formulate some possible interpretations. On the one hand, they show that domestic acoustic comfort is not evenly distributed and reflects socio-housing disparities, such as the availability of dedicated rooms, the size of spaces, or the presence of adequate sound insulation. On the other hand, they highlight how relational and organizational aspects of family life—often overlooked in analyses of e-learning—can have a direct impact on students’ perceived performance. Overall, the bivariate analysis provides a useful quantitative basis for selecting the most relevant predictors and guiding future strategies, such as educational interventions, technological solutions, or support programs aimed at improving the environmental conditions of distance learning.
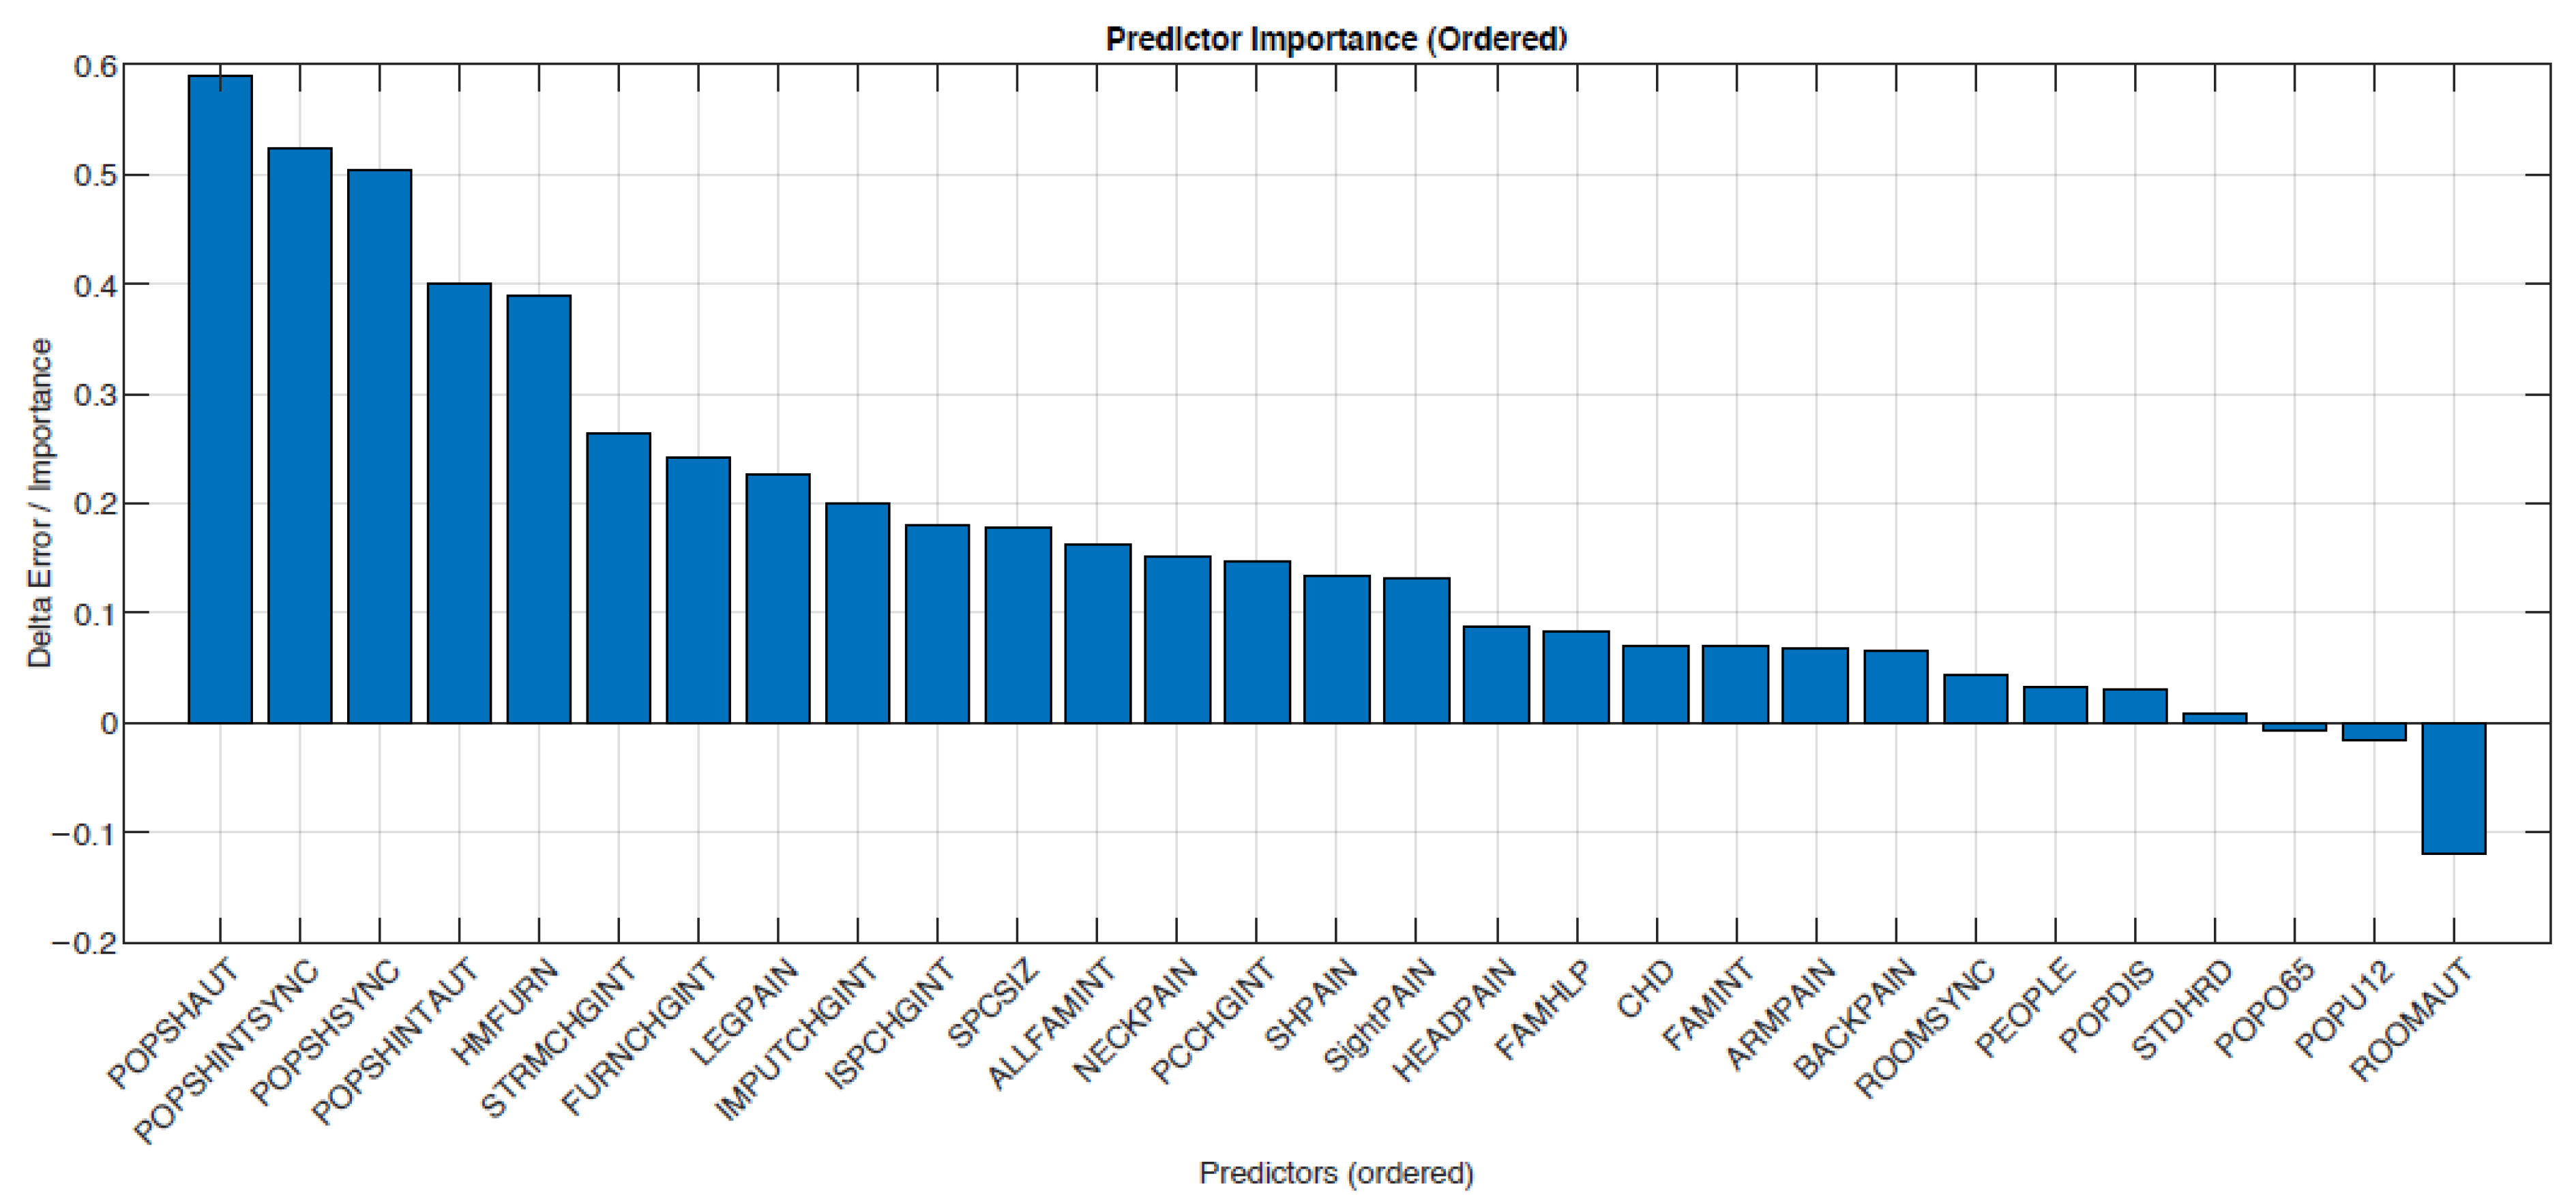
To evaluate the model’s predictive performance in the presence of nonlinear relationships between variables, a Random Forest classifier was applied to the dataset containing exclusively categorical predictors (Figure 6). This algorithm was chosen because of its ability to effectively handle complex and nonlinear data, while reducing the risk of overfitting through the combination of multiple decision trees. Unlike other parametric models, the Random Forest does not require prior assumptions about the data distribution or the shape of the relationships between variables, making it particularly suitable for contexts in which the phenomena studied depend on heterogeneous and potentially nonlinearly correlated factors.
Training the model made it possible to obtain a stable and interpretable classification thanks to the analysis of feature importance. This indicator provides a quantitative measure of each predictor’s contribution to the correct prediction of the target variable. The resulting graph clearly showed that the most influential variables in determining the model’s response were those related to sharing the workspace and the degree of perceived interference with educational activities [51]. In particular, individuals who reported sharing their home environment with other people—such as family members, partners, or roommates—tended to report significantly higher levels of interference in their study or teaching activities [52].
The relative importance of the variables shows that the four factors that contribute the most to the conformation of the model (POPSHAUT; POPSHINTSYNC; POPSHSYNC and POSPSHINTAUT) belong to the group of Study Conditions and Social interference, highlighting the role of these factors for a healthy acoustic environment that promotes students’ relationships with their family and mates. Consequently, factors related to sharing the workspace with other members of the family, or their presence in synchronous or autonomous activities, are closely related to the noise interference. The contribution of the following variables is remarkably smaller; however, it is worth highlighting that HMFURN, STRMCHGINT, FURNCHGINT, IMPUTCHGINT, ISPCHGINT, SPCSIZ belong to the group denominated Study Environment and Infrastructure, and occupy positions 5, 6, 7, 9, 10 and 11, in the relative importance of the variables. This illustrates how factors related to, for example, the size of the study space, or to students’ resilience in improving furniture, the study room, or the internet access provided to achieve better acoustic conditions for studying at home, play a significant role.
This result is consistent with the literature on well-being and productivity in domestic environments during periods of remote working or teaching [53]. It is well known that sharing spaces, especially in small homes or homes with poor acoustic and visual separation between work areas, can compromise concentration, generate stress, and negatively affect the effectiveness of the activities performed. Consequently, the model’s ability to identify this variable as highly predictive provides empirical confirmation of the importance of environmental and social factors in people’s cognitive and operational performance.
Another variable that has shown high predictive importance concerns the perception of the comfort of home furnishings. This result is also fully justifiable from an ergonomic and psychological point of view: the quality and suitability of furniture (in particular chairs, desks, lighting, and working posture) directly influence the level of physical well-being and, consequently, the ability to maintain attention and productivity over time [54,55,56,57]. Previous studies have shown that the lack of an ergonomic environment can lead to musculoskeletal disorders [58,59], fatigue, and decreased motivation, all of which can result in reduced effectiveness in academic activities [60,61].
Random Forest was applied as a non-parametric, exploratory machine learning technique to investigate potential nonlinear relationships and complex interactions among the variables. The aim of the analysis was not to estimate linear effects or to develop predictive regression models, but rather to identify underlying patterns and dependencies within a high-dimensional dataset. Consequently, the approach does not rely on traditional regression assumptions, instead emphasizing data-driven pattern recognition and the assessment of variable importance as a means to reveal hidden structures. Given the exploratory nature of the study, predictive validation procedures such as train–test splitting, hyperparameter tuning, and cross-validation for performance optimization were not the primary focus. Instead, greater emphasis was placed on the interpretability of model outputs and the identification of the most influential factors shaping perceived interference.
Factors such as shared space and overall living comfort appear to play a central role, indicating that efforts to enhance remote learning and working should incorporate measures to improve home environments, particularly in terms of layout and ergonomics [62,63]. These results, in addition to providing an empirical basis for policies to improve living well-being, confirm the validity of the non-linear approach in capturing complex interactions between social and environmental dimensions that are difficult to model using traditional methods [64].
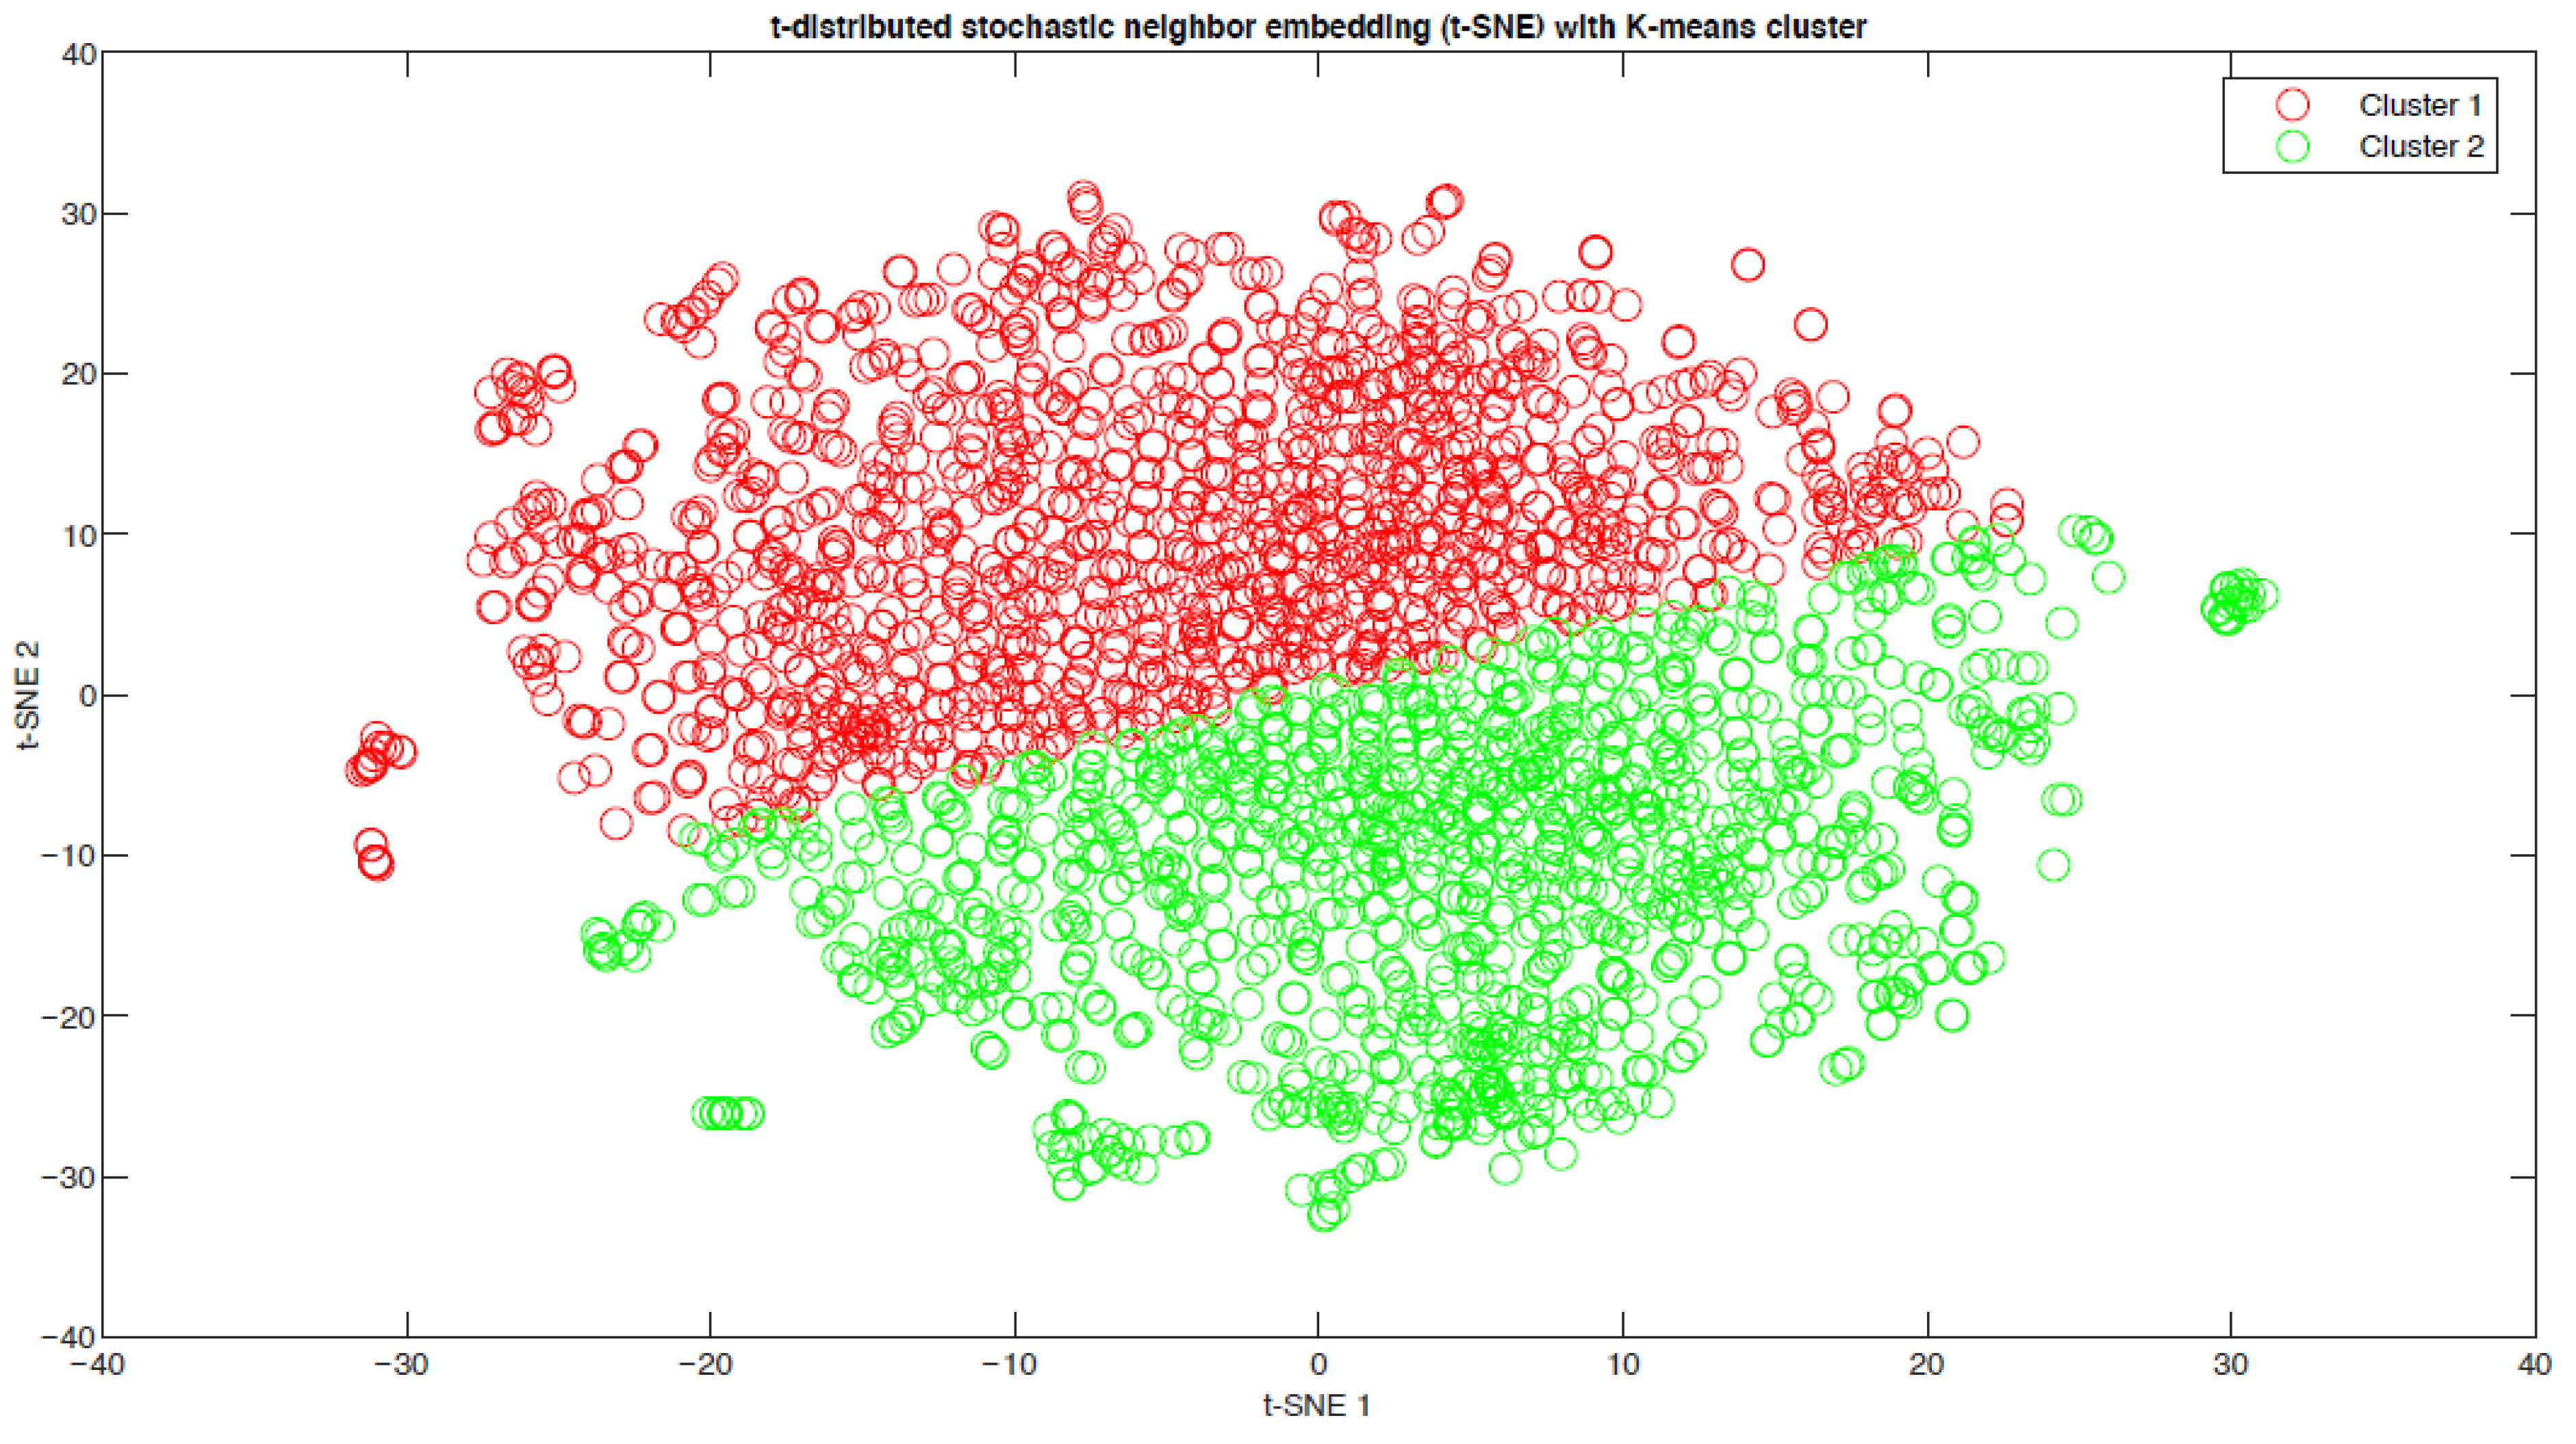
To gain a deeper understanding of the differences within the student population and identify any recurring patterns, a clustering technique was applied to the available dataset (Figure 7). This unsupervised learning approach allows subjects to be grouped based on multidimensional similarities between predictors, without the need to use a target variable or predefined labels. The goal is to reveal latent structures in the data, which often remain hidden in traditional descriptive analyses, and to outline homogeneous student profiles based on shared behaviors, environmental conditions, and perceptions.
From an interpretative standpoint, the presence of two distinct groups can be explained by considering a series of contextual and psychological factors (Figure 8). Students in the first cluster, characterized by a higher perception of interference, may live in home environments less suitable for studying, for example, with shared spaces, background noise, or a lack of privacy [65,66,67]. Additionally, the absence of a properly designed workstation or inadequate internet quality may have intensified feelings of discomfort and hindered concentration [68]. Relational factors, such as the presence of family members or roommates during online lessons, may also have had a negative impact, creating frequent interruptions or distractions [4].
On the contrary, the second group—the one with lower interference—seems to represent students who were able to count on more favorable environmental conditions and a better ability to adapt to distance learning [43,69]. In some cases, the availability of a dedicated space and the ability to organize their own time independently reduced the negative effects of the home environment. It is also plausible that these students had higher levels of autonomy and self-regulation, skills recognized as fundamental to academic success in remote learning contexts.
These results suggest that differences in the perception of interference do not depend solely on structural variables but reflect a complex interaction between environmental, behavioral, and psychological factors [70]. Cluster analysis has therefore made it possible to translate this complexity into a concise but meaningful representation of the student population, highlighting the presence of homogeneous but distinct subgroups in terms of experiences and study conditions.
From a practical point of view, it is particularly important in planning targeted support strategies [68]. The development of targeted intervention strategies, such as specific ergonomics resources or time management/tutoring strategies, can be undertaken to satisfy the requirements of particularly high-risk groups. The value of clustering in student diversity has thus been demonstrated to be sound in providing a basis for improving inclusivity in teaching in hybrid and online instruction settings.
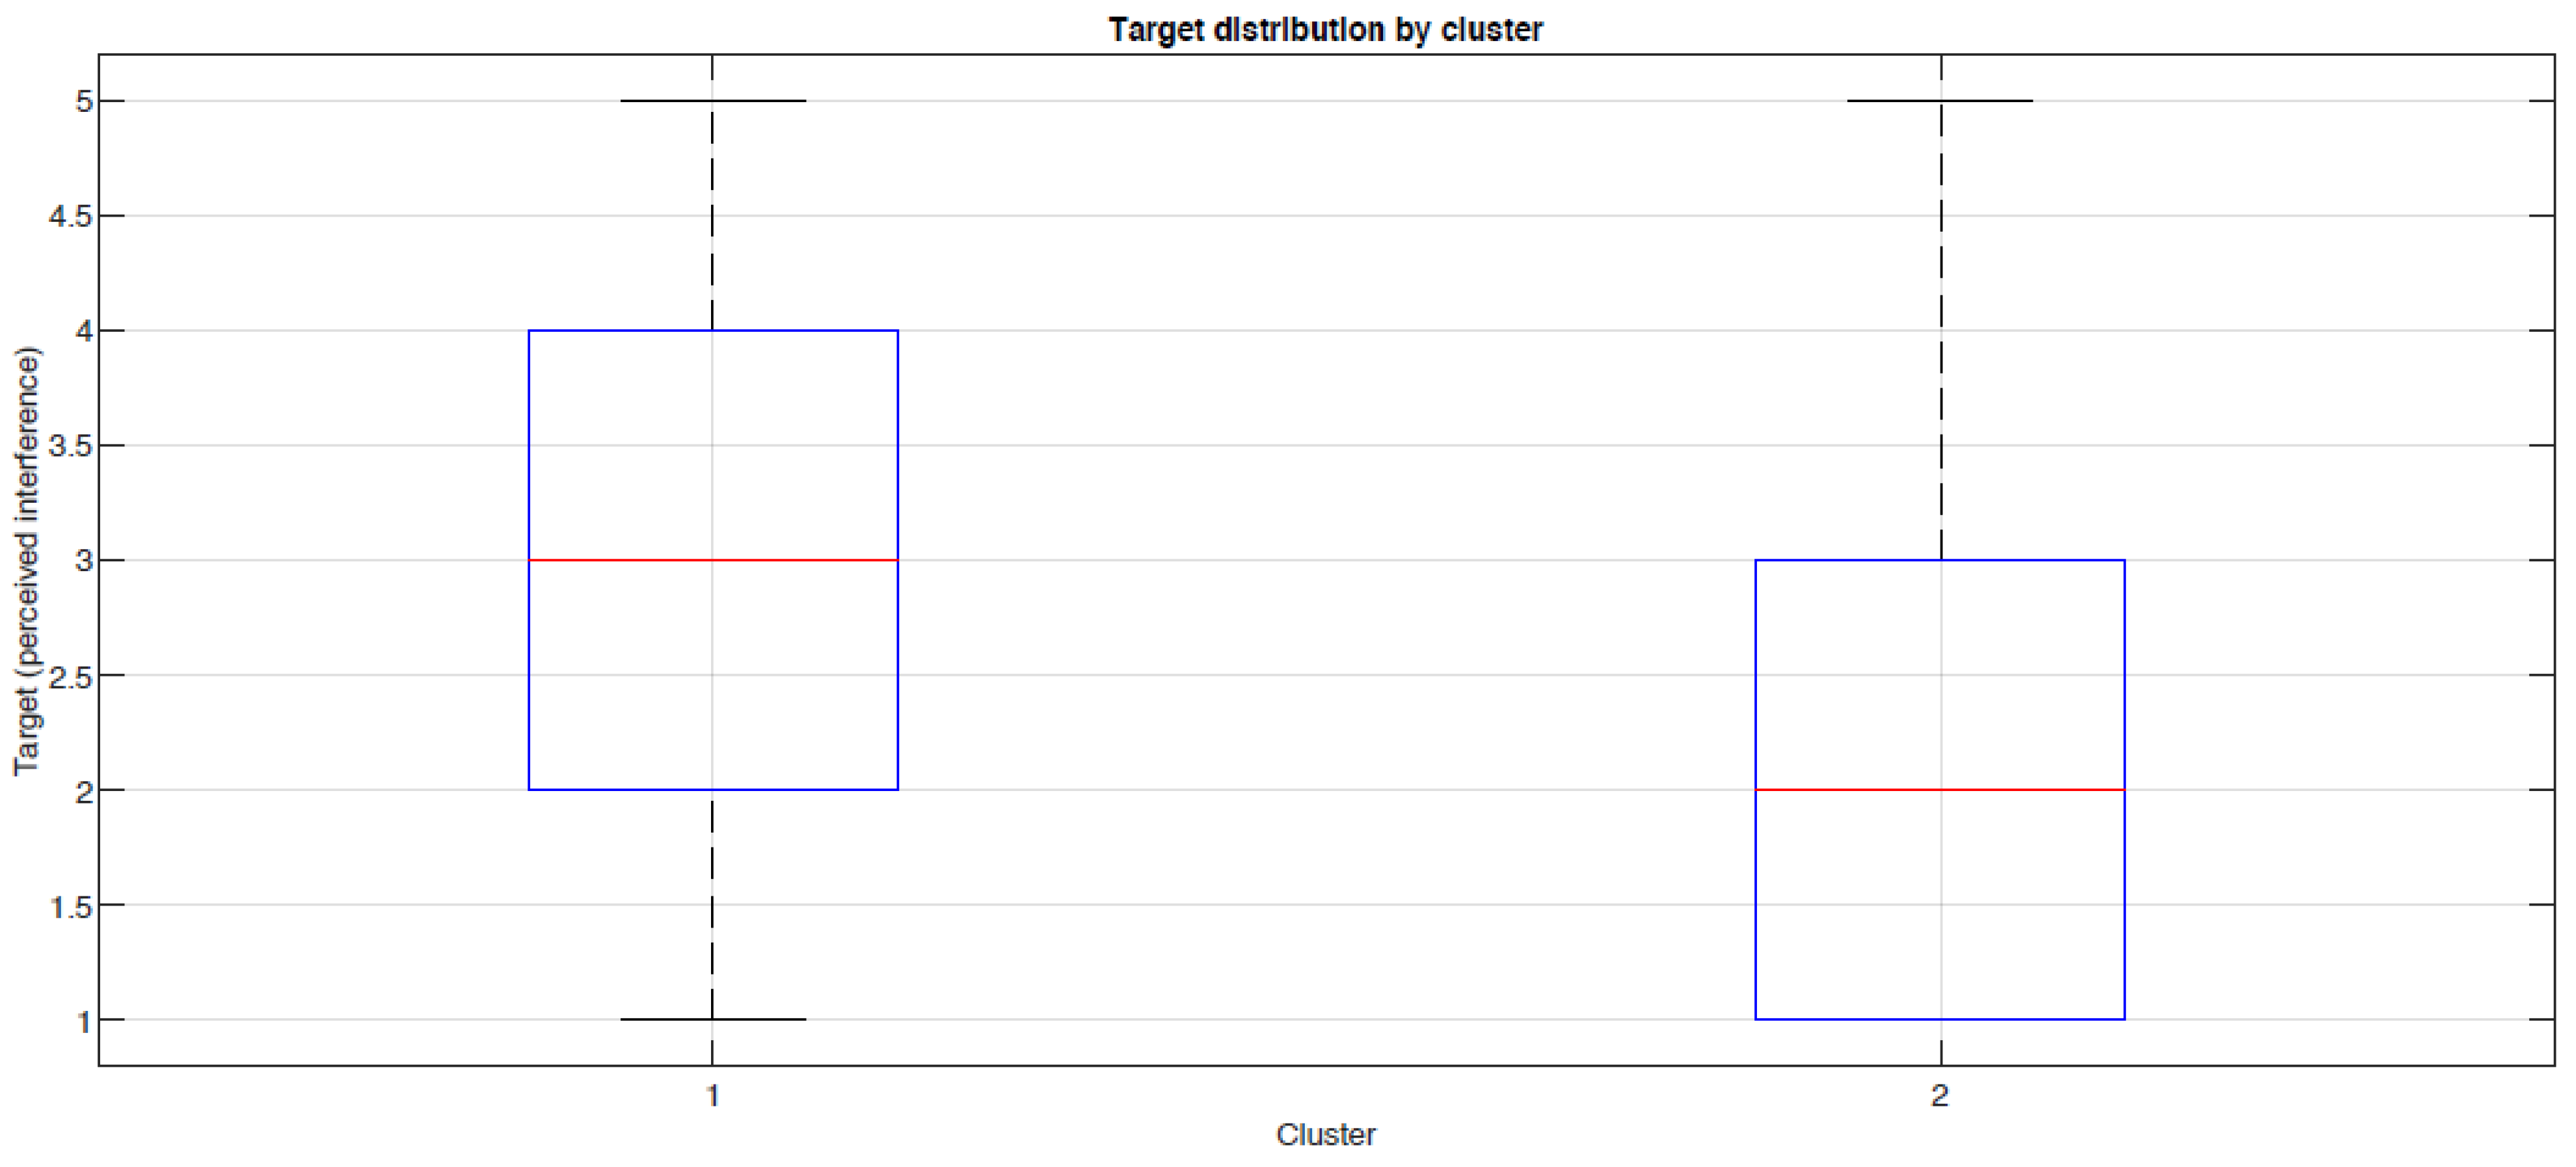
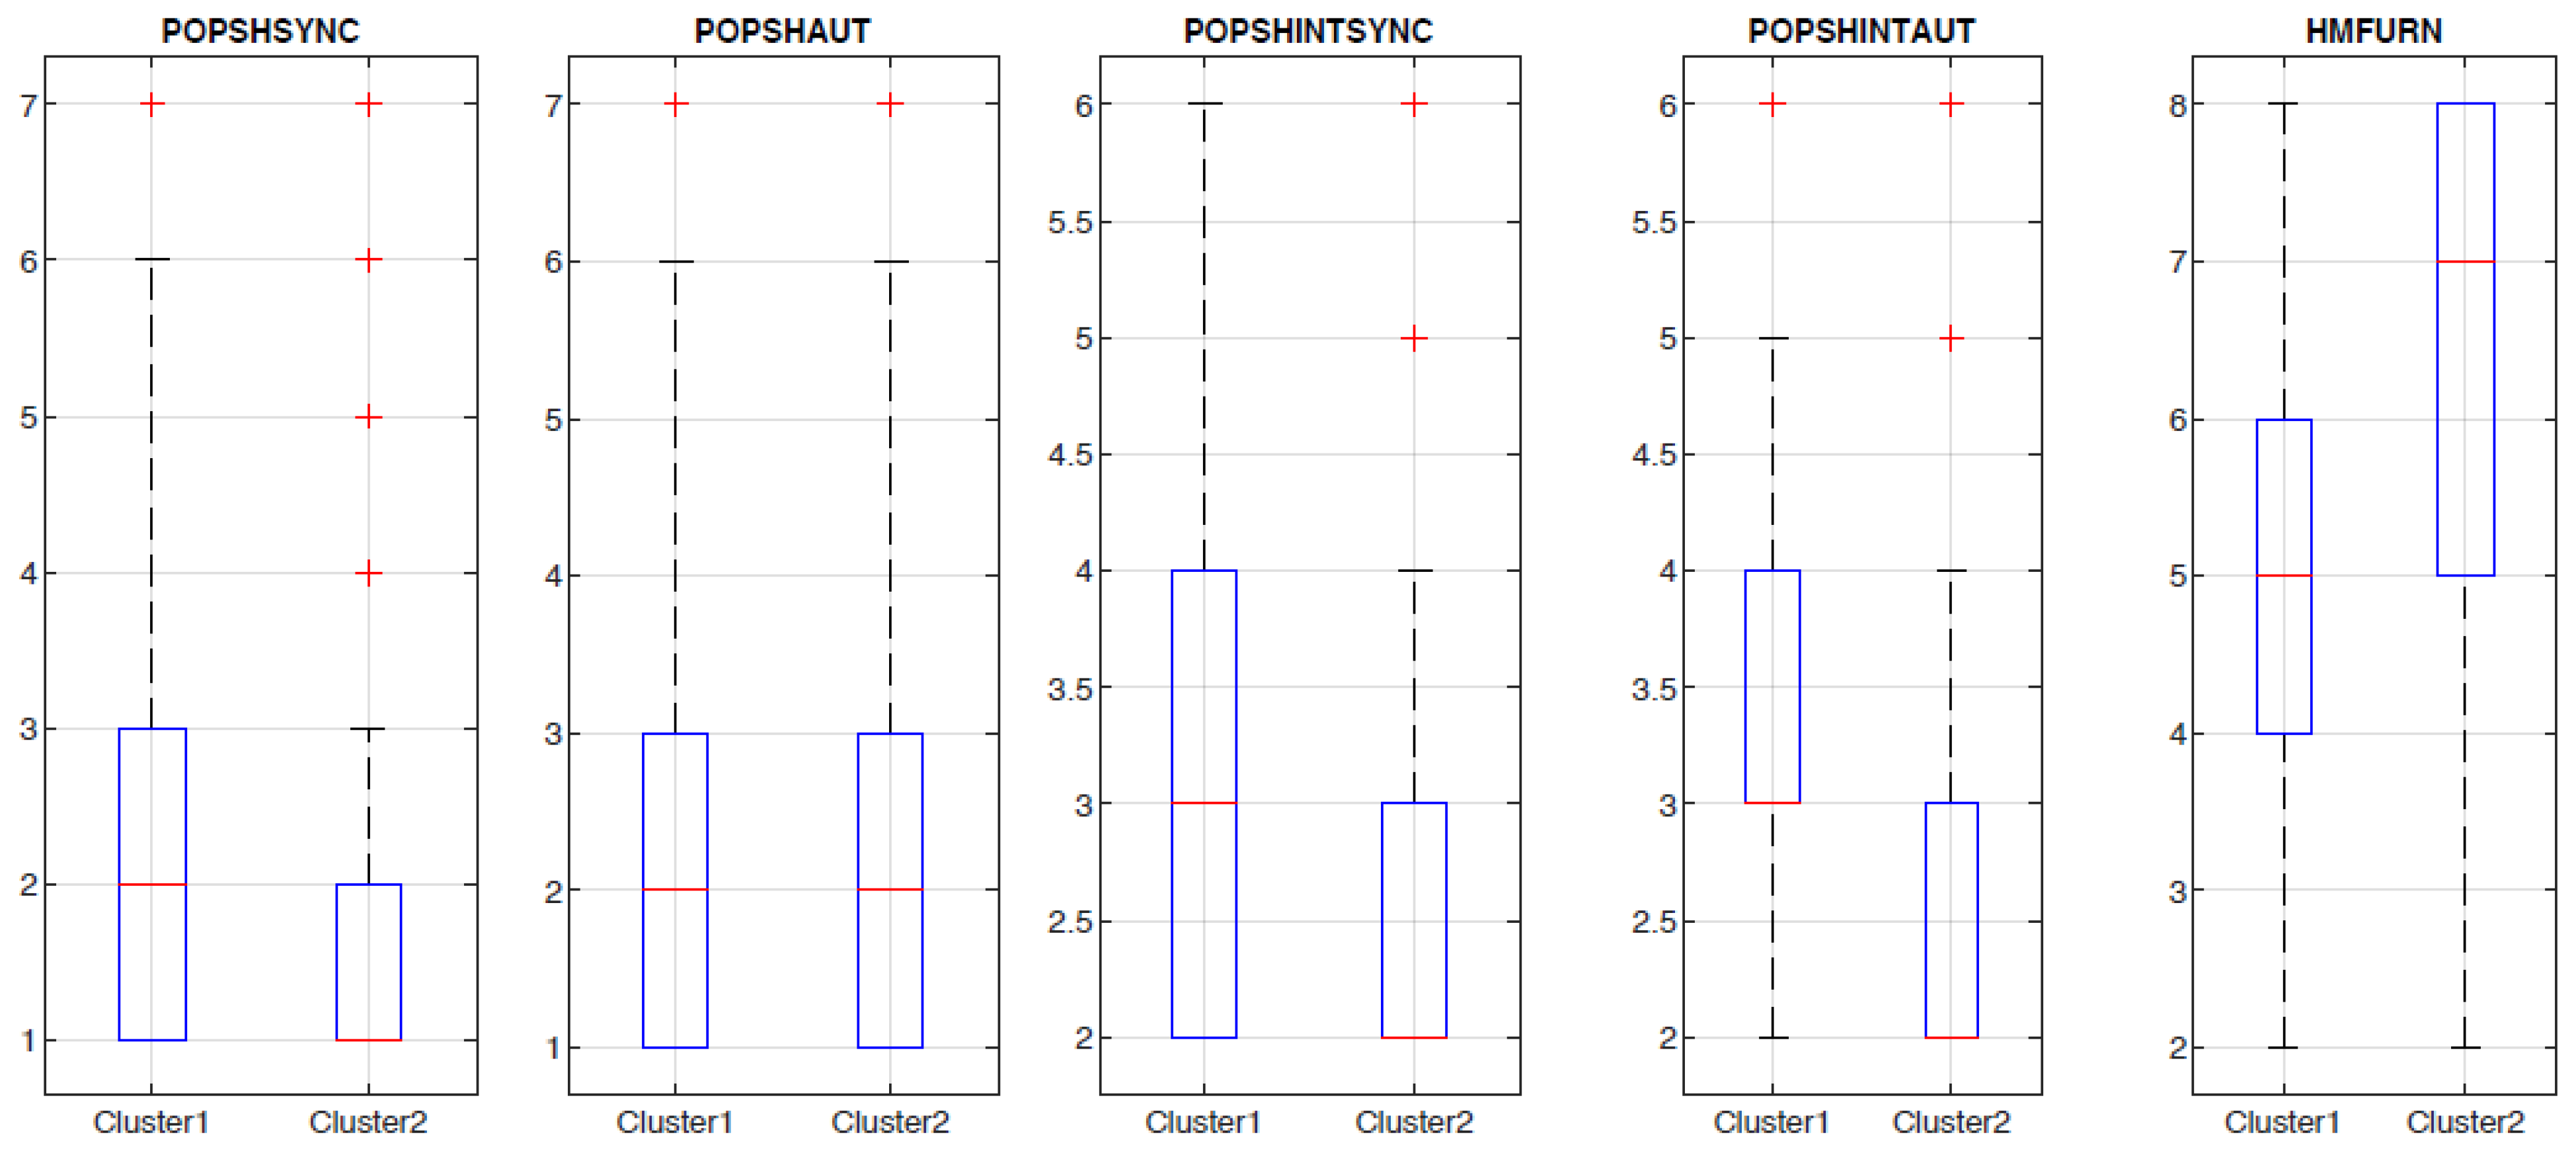
In order to have a better understanding of how these two clusters, identified through clustering, differ, we chose to have a comparative examination of how these clusters differ with regard to how these primary elements have been spread out within these clusters. In this respect, we have picked our top five elements and checked how these elements have varied within these clusters. Through a Random Forest model, we have managed to rank these elements based on their importance.
This method also makes it possible to view the comparisons visually, side by side, with the nature of each predictor as it differs between clusters. For instance, variations in the position of the median or the width of the interquartile range may indicate substantial differences in response patterns between the two groups.
The aim of this analysis is twofold: descriptive and interpretative. By observing how clusters are distributed with respect to the most influential variables, it is possible to formulate hypotheses about the behavioral or perceptual characteristics that distinguish them. This makes the boxplot a key tool for translating the results of clustering into information that helps to understand the phenomenon under study, providing a solid basis for further investigation and discussion. Figure 9 shows the boxplots for the top five predictors in order of importance, comparing their distribution in the two clusters identified. The aim is to highlight the differences in responses and understand the distinctive characteristics of the groups.
The first boxplot (POPSHSYNC) concerns the number of people with whom students shared their workspace during synchronous lessons. Cluster 1 has higher mean and median values than Cluster 2, indicating that students in this group lived in larger households. This result is consistent with the hypothesis that more crowded environments can influence the perception of interference and comfort while studying. The greater variability of the data in Cluster 1 also suggests greater heterogeneity in housing conditions.
The second boxplot (POPSHAUT) analyzes the number of people present in the workspace during independent tasks. In this case, the distributions of the two clusters are very similar, with almost identical medians. This data indicates that, regardless of the group to which they belonged, sharing space during individual activities did not undergo significant changes. One possible explanation is that, during independent tasks, students had greater flexibility in choosing their place of study, reducing the differences between clusters.
The third and fourth boxplots (POPSHINTSYNC, POPSHINTAUT) refer to the interference caused by people present in the workspace, respectively, during synchronous lessons and independent activities. In both cases, Cluster 1 shows higher values, confirming that students in this group experienced more distractions. This result is consistent with the larger family size observed in the first boxplot: more people present increase the likelihood of interruptions and noise, negatively affecting the quality of the study experience [71,72,73].
Finally, the fifth boxplot (HMFURN) concerns the level of comfort of the furniture used for studying at home [74,75,76]. Lower values indicate less comfortable environments, and again, Cluster 1 stands out with lower medians than Cluster 2. This would suggest that students in Cluster 1 had to study not only in more crowded conditions but also in spaces with less ergonomic comfort. Such a combination, it is likely, would dampen their study experiences. In other words, results indicate that housing conditions are related to the perceived difficulty of studying remotely. Whereas Cluster 1 is characterized by students who reside in larger households with more noise and less comfort, Cluster 2 is typically composed of students in quieter, more comfortable settings. These differences provide a pragmatic understanding of how specific environmental factors influence distance learning and can be used to develop targeted interventions aimed at enhancing the home study environment.

4. Discussion

The aim of this paper was to explore how different factors related to the family and home affect students’ perceived interference while engaging in distance learning. The results obtained offer an integrated approach to the problem in question, proving that interference cannot be explained by one factor but represents the result of the combination of several variables. Combining the tools of correlation analysis, non-parametric statistical methods, machine learning algorithms, and cluster analysis allows one to obtain both empirical and theoretical conclusions about the determinants of students’ learning experience at home.
As follows from the analysis of the Spearman correlation matrix, four major clusters of variables were identified, namely: (i) responsibilities associated with household care and taking care of children; (ii) infrastructure and learning environment; (iii) ergonomic and physical health factors; (iv) interference related to social and spatial environment. These clusters coincide with the conceptual model used in the research and prove once again the intimate connection between distance learning and the domestic environment.
Of these variables, those linked with the concept of sharing space and interpersonal interference proved to be the most decisive ones. Notably, in both univariate tests, namely, Kruskal–Wallis and Jonckheere-Terpstra, as well as in the Random Forest analysis, the fact that other people were present in the study environment and that their actions caused interference turned out to be one of the most powerful determinants of disturbance. The findings were corroborated by the cluster analysis, revealing two distinctive clusters of students: those suffering from increased interference and poor environmental conditions, and those having reduced disturbance and positive study settings.
Furthermore, it should be noted that in addition to personal qualities, material and infrastructural factors turned out to have a significant effect on the perception of the study experience. Specifically, the availability of comfortable furniture, various technologies, and access to the internet made a difference. Moreover, physical discomfort, such as musculoskeletal pain and visual fatigue, played an important part.
All this implies that any attempt to comprehend distance learning requires taking into account its interplay with the surrounding psychophysical environment. The high correlation between shared spaces and the sense of interference is the result of the inherently contradictory nature of learning processes and the dynamics of daily life. The presence of multiple activities in one and the same environment—from childcare and housework to recreation—makes it harder to maintain focus and causes fatigue.
From a practical standpoint, these insights call for significant changes in terms of educational policy. On the one hand, they indicate the necessity of shifting from technical approaches to distance learning toward a more holistic attitude toward the students’ living conditions. While access to technological devices is an essential condition for efficient education at a distance, it does not suffice when students lack physical space or are constantly interrupted. On the other hand, the results suggest that ergonomic factors should receive much greater attention in educational contexts. Given the strong link between furniture comfort and interference, relatively small adjustments in ergonomics may yield a noticeable effect.
The recognition of the existence of these two different groups of students also highlights the fact that the learning environment is highly uneven. The high-interference cluster of students seems to be experiencing disadvantages because of living in densely populated homes, encountering high amounts of noise, and having uncomfortable learning environments. This indicates that distance learning could possibly heighten the socio-economic divide and the gap in the housing situation between the socio-economically disadvantaged and those who are economically well-off.
The outcomes of this study generally support the current literature review on home-based learning and work settings. Prior research demonstrates that shared spaces and background noise significantly reduce focus, efficiency, and overall well-being in circumstances when mental engagement is necessary [77,78]. The current findings corroborate these insights in terms of the statistical significance and the highest predictive value of those factors.
The issue of ergonomics has been sufficiently elaborated in the relevant literature as well. Studies confirm that uncomfortable workspaces and unsuitable furniture contribute to the emergence of various health problems (e.g., musculoskeletal and vision issues) and negatively influence one’s ability to effectively function [79,80]. The high level of furniture comfort’s predictive value demonstrated in the current study can be considered additional evidence in favor of the need for incorporating ergonomic aspects into the organization of home learning spaces. Overall, in light of the rapid switch to home-based learning amid the ongoing pandemic, the impact of ergonomics and environment on one’s physical and psychological well-being should be highlighted [81].
Moreover, the results obtained in the present research are consistent with those conducted in the field of e-learning within higher education and stress the obstacles faced during the process of implementing digital technology, engagement, and adaptation [82,83]. Specifically, the current research supports the idea that the lack of technological facilities and unstable internet connections could negatively impact the participation and continuity of the learning process.
On the other hand, the contribution of this study to the existing literature is related to the importance of examining the influence of family characteristics on the learning experience of university students. In this regard, the high correlations between the factors related to caregiving and family structure are particularly valuable as they expand the existing body of knowledge regarding learning environments. As indicated by the previous studies, the environment within families played an essential role during the pandemic period [84].
Nevertheless, there are several inconsistencies that should be mentioned. Although the previous research tends to focus on personal factors like motivation and self-regulation as major factors contributing to the successful educational outcomes [85], the findings of this study indicate that, in some circumstances, environmental barriers might outweigh personal characteristics. For example, in a very restricted household environment, even an organized and highly motivated learner might find it difficult to establish a proper learning environment.
Lastly, the findings of this research prove that distance learning might enhance social, economic, and housing inequalities among different learners, as those who lack sufficient space, resources, and a silent environment might face a greater degree of interference in their learning activities [85,86].
These findings have significant theoretical as well as practical implications. Theoretically, the research has reinforced the theory that learning is a part of an ecological approach, which comprises physical, social, and psychological aspects. In particular, the application of non-linear and exploratory methods such as Random Forest and cluster analysis was successful in revealing the complex dynamics of these aspects; accordingly, it would appear that linear methods can no longer explain the phenomenon.
In terms of practical implications, the findings underscore the importance of taking a multi-dimensional approach to enhancing students’ performance in distance learning programs. In this regard, educational institutions need to include guidelines regarding effective home study environments within distance learning programs, with special attention paid to the organization of space, sound insulation, and ergonomics. On a broader scale, structural inequality needs to be tackled from the policy perspective in order to facilitate remote learning.

5. Limitations and Future Research

The current study, however, suffers from certain limitations that must be addressed in future research endeavors. The first issue is related to the methodology employed for collecting the data, which included self-reports and, therefore, could suffer from response bias and might fail to reflect actual objective parameters such as noise exposure, spatial configurations, or ergonomics. Another limitation refers to the lack of causal relationships that can be inferred from the findings, since the results demonstrate associations between various factors but not causal relations. Finally, while the present study confirms the reliability of the variables analyzed, psychometric validation has not been conducted, which includes, for instance, factor analysis of the constructs examined.
It is important to emphasize one more limitation, related to the characteristics of the sample involved in this study. Specifically, the participants attended one particular university located in Quito, Ecuador. As a result, the findings cannot be generalized to other samples of learners in different environments because they have been obtained under specific circumstances. For instance, the urban environment might influence domestic space availability, thus shaping households differently in comparison with other cities in which the same population might participate in distant education.
However, some other contextual variables that could be pertinent were left out of the database. Socioeconomic status, housing conditions, access to digital gadgets, and stable internet connectivity could have a crucial effect on students’ experience and increase the model’s accuracy, so their exclusion from the analysis is one of the limitations of this study.
Longitudinal approaches should be utilized in order to deal with the limitations of the study. It would be better to combine objective data on the environment that students study in. This will include measuring sound levels, distance to the window, and other parameters. Furthermore, psychometric tools should be used for the improvement of the measurement model.
Additional research is required to examine the significance of psychological factors such as resilience and adaptability in mediating the connection between limitations in the environment and interference. Conducting research within different cultures and regions will result in a better understanding of this problem as well as a wider applicability of the results. In turn, this information will prove valuable when developing distance learning solutions that account for cultural diversity and other contextual issues.

6. Conclusions

Yet the analysis has helped us uncover certain significant points regarding the areas of primary importance in the way that one might interpret the angle of interference in teaching and, more generally, of adjustment to unusual modes of study such as distance; by combining nonlinear forecasting methods with those of an exploratory nature, we managed to obtain a rich picture of the importance of environmental settings and conditions of living, and especially interpersonal relationships. By employing a Random Forest classifier, we included yet another verification of our model’s exceptional ability to consider the interrelation between categorized data, gaining insight into the area of importance of the result. The results on the importance of the variables showed that sharing domestic space and the quality of furnishings are key elements in determining the perception of interference. This evidence is perfectly consistent with recent scientific literature, which recognizes the central role of the physical and social environment in shaping concentration, productivity, and psychological well-being in situations of studying or working from home. Students who have dedicated, adequately soundproofed, and comfortable spaces show a lower level of interference, while those who have to share the environment with others or work in chaotic contexts tend to perceive a negative impact on their educational activities.
At the same time, the use of clustering techniques has made it possible to identify two distinct groups of students, differentiated precisely on the basis of their level of perceived interference. This distinction reflects not only environmental differences but also psychological and behavioral differences. The group with the highest level of interference seems to represent students who are more vulnerable to the effects of distractions and environmental stress, probably due to a lower availability of material resources or less effective self-regulation strategies. Conversely, the group with the lowest level of interference seems to be characterized by greater adaptability, more favorable study environments, and more structured habits.
These findings offer insights of great relevance to educational and university policies. The ability to identify subgroups of students with similar characteristics allows for the design of personalized interventions: for example, providing ergonomic guidelines for setting up home study stations, promoting time and cognitive load management strategies, or creating support programs for students living in difficult housing conditions. Furthermore, the machine learning-based approach can be extended to other educational contexts to monitor student well-being and performance over time, identifying situations of distress or risk of dropout at an early stage.
From a methodological standpoint, combining predictive analytics with unsupervised exploratory forms has proven to be an effective way to address increasingly complex behaviors, particularly when relationships between these dimensions are not necessarily linear or obvious. This is a much more flexible and attainable model than traditional statistical approaches.
Ultimately, the study provides proof toward the notion that making use of interpretive AI technologies with educational data analysis will clearly have the potential to facilitate the deepening of our understanding of the needs of students. Student well-being and productivity depend not only on the curriculum or pedagogy itself. Rather, in more essential ways than the latter, it seems to depend on the environmental circumstances in which learning takes place.

Author Contributions

Conceptualization. V.P.-R. and G.C.; methodology. V.P.-R. and G.C.; software. V.P.-R. and G.C.; validation. V.P.-R. and G.C.; formal analysis. V.P.-R. and G.C.; investigation. V.P.-R. and G.C.; resources. V.P.-R. and G.C.; data curation. V.P.-R. and G.C.; writing—original draft preparation. V.P.-R. and G.C.; writing—review and editing. V.P.-R., A.M.D.-M., C.S.G.-P. and G.C.; visualization. V.P.-R. and G.C.; supervision. V.P.-R., A.M.D.-M., C.S.G.-P. and G.C.; project administration. V.P.-R., A.M.D.-M. and C.S.G.-P.; funding acquisition. V.P.-R., A.M.D.-M. and C.S.G.-P. All authors have read and agreed to the published version of the manuscript.

Funding

This research was funded by the Universidad de Las Américas (UDLA) and carried out under the research project SOA.VPR.20.03. COVID-19 modification.

Institutional Review Board Statement

The study was conducted in accordance with the Declaration of Helsinki, and the Human Research Ethics Committee of the Universidad de Las Americas (CEISH-UDLA) approved the protocol, research instruments, and informed consent for this study, with approval code VPR-201113-001 and approval date 3 November 2020. All information was fully anonymised before analysis to ensure confidentiality and compliance with ethical research standards.

Informed Consent Statement

Informed consent was obtained from all subjects involved in the study.

Data Availability Statement

The data used in this study cannot be made publicly accessible at this time, as they form part of an ongoing research project. Access may be granted upon reasonable request to the corresponding author, although it is subject to prior authorization from Universidad de Las Américas.

Conflicts of Interest

The authors declare no conflicts of interest.

References

  1. Edwards-Fapohunda, M.O.; Adediji, M.A. Sustainable development of distance learning in continuing adult education: The impact of artificial intelligence. IRE J. 2024, 8, 113–114. [Google Scholar]
  2. Li, K.C.; Wong, B.T.; Chan, H.T. Teaching and learning innovations for distance learning in the digital era: A literature review. Front. Educ. 2023, 8, 1198034. [Google Scholar] [CrossRef] [Scilit]
  3. Dyrek, N.; Wikarek, A.; Niemiec, M.; Owczarek, A.J.; Olszanecka-Glinianowicz, M.; Kocełak, P. The perception of e-learning during the SARS-CoV-2 pandemic by students of medical universities in Poland—A survey-based study. BMC Med. Educ. 2022, 22, 529. [Google Scholar] [CrossRef] [Scilit] [PubMed]
  4. Puyana-Romero, V.; Díaz-Márquez, A.M.; Ciaburro, G.; Hernández-Molina, R. The Acoustic Environment and University Students’ Satisfaction with the Online Education Method during the COVID-19 Lockdown. Int. J. Environ. Res. Public Health 2022, 20, 709. [Google Scholar] [CrossRef] [Scilit]
  5. Hamdan, K.M.; Al-Bashaireh, A.M.; Zahran, Z.; Al-Daghestani, A.; Al-Habashneh, S.; Shaheen, A.M. University students’ interaction, Internet self-efficacy, self-regulation and satisfaction with online education during pandemic crises of COVID-19 (SARS-CoV-2). Int. J. Educ. Manag. 2021, 35, 713–725. [Google Scholar] [CrossRef] [Scilit]
  6. Means, B.; Toyama, Y.; Murphy, R.; Baki, M. The effectiveness of online and blended learning: A meta-analysis of the empirical literature. Teach. Coll. Rec. 2013, 115, 1–47. [Google Scholar] [CrossRef] [Scilit]
  7. Anderson, T. (Ed.) The Theory and Practice of Online Learning; Athabasca University Press: Athabasca, AB, Canada, 2008. [Google Scholar]
  8. Aristeidou, M.; Cross, S. Disrupted distance learning: The impact of COVID-19 on study habits of distance learning university students. Open Learn. J. Open Distance e-Learn. 2021, 36, 263–282. [Google Scholar] [CrossRef] [Scilit]
  9. Sutiah; Supriyono. Enhancing online learning quality: A structural equation modeling analysis of educational technology implementation during the COVID-19 pandemic. Telemat. Inform. Rep. 2024, 16, 100175. [Google Scholar] [CrossRef] [Scilit]
  10. Davidavićiene, V.; Rymaniak, J.; Lis, K. Remote workplaces as a determinant of working conditions in education during COVID-19. Econ. Sociol. 2023, 16, 123–138. [Google Scholar] [CrossRef] [Scilit]
  11. Peimani, N.; Kamalipour, H. Online education in the post COVID-19 era: Students’ perception and learning experience. Educ. Sci. 2021, 11, 633. [Google Scholar] [CrossRef] [Scilit]
  12. Brachtl, S.; Ipser, C.; Keser Aschenberger, F.; Oppl, S.; Oppl, S.; Pakoy, E.K.; Radinger, G. Physical home-learning environments of traditional and non-traditional students during the COVID pandemic: Exploring the impact of learning space on students’ motivation, stress and well-being. Smart Learn. Environ. 2023, 10, 7. [Google Scholar] [CrossRef] [Scilit] [PubMed]
  13. Shield, B.M.; Dockrell, J.E. The effects of noise on children at school: A review. Build. Acoust. 2003, 10, 97–116. [Google Scholar] [CrossRef] [Scilit]
  14. Klatte, M.; Bergström, K.; Lachmann, T. Does noise affect learning? A short review on noise effects on cognitive performance in children. Front. Psychol. 2013, 4, 578. [Google Scholar] [CrossRef] [Scilit] [PubMed]
  15. Basner, M.; Babisch, W.; Davis, A.; Brink, M.; Clark, C.; Janssen, S.; Stansfeld, S. Auditory and non-auditory effects of noise on health. Lancet 2014, 383, 1325–1332. [Google Scholar] [CrossRef] [Scilit]
  16. Evans, G.W.; Lercher, P.; Meis, M.; Ising, H.; Kofler, W.W. Community noise exposure and stress in children. J. Acoust. Soc. Am. 2001, 109, 1023–1027. [Google Scholar] [CrossRef] [Scilit]
  17. Torresin, S.; Albatici, R.; Aletta, F.; Babich, F.; Oberman, T.; Stawinoga, A.E.; Kang, J. Indoor soundscapes at home during the COVID-19 lockdown in London–Part I: Associations between the perception of the acoustic environment, occupantś activity and well-being. Appl. Acoust. 2021, 183, 108305. [Google Scholar] [CrossRef] [Scilit] [PubMed]
  18. Park, S.H.; Shin, H.K.; Kim, K.W. Relationship between indoor noise perception and remote work during the COVID-19 pandemic. PLoS ONE 2023, 18, e0286481. [Google Scholar] [CrossRef] [Scilit]
  19. Shepp, B.E. From perceived similarity to dimensional structure: A new hypothesis about perceptual development. In Cognition and Categorization; Routledge: London, UK, 2024; pp. 135–167. [Google Scholar]
  20. Candido, G.; Lins, R.; Amorim, A.N.; Jeon, L.; Albuquerque, E.X.S.; Silva, V.C.; Vinícius, F.; Pinheiro, A.L.A.; Nunes, J.P.J.R.; Souza, X.M.G.D.S. Assessing Reading Fluency in Elementary Grades: A Machine Learning Approach. Comput. Educ. Artif. Intell. 2025, 8, 100411. [Google Scholar] [CrossRef] [Scilit]
  21. Al-zawqari, A.; Peumans, D.; Vandersteen, G. A Flexible Feature Selection Approach for Predicting Students’ Academic Performance in Online Courses. Comput. Educ. Artif. Intell. 2022, 3, 100103. [Google Scholar] [CrossRef] [Scilit]
  22. Hu, Y.; Ferreira, R.; Ga, D. Automatic Analysis of Cognitive Presence in Online Discussions: An Approach Using Deep Learning and Explainable Artificial Intelligence. Comput. Educ. Artif. Intell. 2021, 2, 100037. [Google Scholar] [CrossRef] [Scilit]
  23. Nano, J.P.; Catterall, W.A.; Chang, M.L.; Ghaly, M.H. “I Wish I Could Work on School Stuff.” Investigating the Impact of Remote Learning on Undergraduate Students’ Academic Success and Mental Health during the COVID-19 Lockdown. J. Affect. Disord. Rep. 2025, 21, 100918. [Google Scholar] [CrossRef] [Scilit]
  24. Brandford, B.; Justice, K.A.; Dickson, O.M.; Nana Akwasi, P.S.; Nagaletchimee, A. Behavioural intentions toward information communication technology integration in secondary education: Modelling the effects of students’ attitudes. Telemat. Inform. Rep. 2025, 18, 100193. [Google Scholar] [CrossRef] [Scilit]
  25. George, S.D.; Thamilvanan, N.T.; Nil Singh, K.L.B.; Jaspal Singh, K.S.; Isyraqiah, F. View of Gender and Ethnic Differences in Stress and Lifestyle Factors Post COVID-19 Lockdown Among Medical Students. IIUM Med. J. Malays. 2025, 24, 107–115. [Google Scholar] [CrossRef] [Scilit]
  26. Ma, F. Learning Behavior Analysis and Personalized Recommendation System of Online Education Platform Based on Machine Learning. Comput. Educ. Artif. Intell. 2025, 8, 100408. [Google Scholar] [CrossRef] [Scilit]
  27. Zhang, W.; Guan, Y.; Hu, Z.; Wang, C.; Lu, D.; Lu, H. Interplay of Student Characteristics Multidimensional Engagement and Influencing Factors in Online Computer Science Education. Sci. Rep. 2025, 15, 6976. [Google Scholar] [CrossRef] [Scilit]
  28. Payne, S.R. The production of a perceived restorativeness soundscape scale. Appl. Acoust. 2013, 74, 255–263. [Google Scholar] [CrossRef] [Scilit]
  29. Davies, W.J.; Adams, M.D.; Bruce, N.S.; Cain, R.; Carlyle, A.; Cusack, P.; Hall, D.A.; Hume, K.I.; Irwin, A.; Jennings, P.; et al. Perception of soundscapes: An interdisciplinary approach. Appl. Acoust. 2013, 74, 224–231. [Google Scholar] [CrossRef] [Scilit]
  30. ISO/TS 12913-3:2025; Acoustics—Soundscape—Part 3: Data Analysis. International Organization for Standardization: Geneva, Switzerland, 2025.
  31. Aletta, F.; Oberman, T.; Kang, J. Associations between positive health-related effects and soundscapes perceptual constructs: A systematic review. Int. J. Environ. Res. Public Health 2018, 15, 2392. [Google Scholar] [CrossRef] [Scilit] [PubMed]
  32. Aletta, F.; Kang, J. Towards an urban vibrancy model: A soundscape approach. Int. J. Environ. Res. Public Health 2018, 15, 1712. [Google Scholar] [CrossRef] [Scilit]
  33. Cain, R.; Jennings, P.; Poxon, J. The development and application of the emotional dimensions of a soundscape. Appl. Acoust. 2013, 74, 232–239. [Google Scholar] [CrossRef] [Scilit]
  34. Dillman, D.A.; Smyth, J.D.; Christian, L.M. Internet, Phone, Mail, and Mixed-Mode Surveys: The Tailored Design Method; John Wiley & Sons, Inc.: Hoboken, NJ, USA, 2014; Volume 17, p. 154. [Google Scholar]
  35. ISO/TS 12913-2:2018; Acoustics—Soundscape—Part 2: Data Collection and Reporting Requirements. International Organization for Standardization: Geneva, Switzerland, 2025.
  36. Zwicker, E.; Fastl, H. Psychoacoustics: Facts and Models; Springer Science & Business Media: Berlin/Heidelberg, Germany, 2013; Volume 22. [Google Scholar]
  37. Dockrell, J.E.; Shield, B. Children’s perceptions of their acoustic environment at school and at home. J. Acoust. Soc. Am. 2004, 115, 2964–2973. [Google Scholar] [CrossRef] [Scilit] [PubMed]
  38. Fabrigar, L.R.; Wegener, D.T. Exploratory Factor Analysis; Oxford University Press: Oxford, UK, 2012. [Google Scholar]
  39. Komorowski, M.; Marshall, D.C.; Salciccioli, J.D.; Crutain, Y. Exploratory data analysis. In Secondary Analysis of Electronic Health Records; Springer: Cham, Switzerland, 2016; pp. 185–203. [Google Scholar]
  40. Howard, M.C. A review of exploratory factor analysis decisions and overview of current practices: What we are doing and how can we improve? Int. J. Hum.-Comput. Interact. 2016, 32, 51–62. [Google Scholar] [CrossRef] [Scilit]
  41. De Winter, J.C.; Gosling, S.D.; Potter, J. Comparing the Pearson and Spearman correlation coefficients across distributions and sample sizes: A tutorial using simulations and empirical data. Psychol. Methods 2016, 21, 273. [Google Scholar] [CrossRef] [Scilit] [PubMed]
  42. Ali Abd Al-Hameed, K. Spearman’s correlation coefficient in statistical analysis. Int. J. Nonlinear Anal. Appl. 2022, 13, 3249–3255. [Google Scholar]
  43. Puyana-Romero, V.; Díaz-Márquez, A.M.; Garzón, C.; Ciaburro, G. The Domestic Acoustic Environment in Online Education—Part 1: Differences by Gender, Perceived Academic Quality, and Self-Rated Performance. Buildings 2024, 15, 84. [Google Scholar] [CrossRef] [Scilit]
  44. Puyana-Romero, V.; Díaz-Márquez, A.M.; Garzón, C.; Ciaburro, G. The Domestic Acoustic Environment in Online Education—Part 2: Different Interference Perception of Sound Sources and While Conducting Academic Tasks. Buildings 2024, 15, 93. [Google Scholar] [CrossRef] [Scilit]
  45. Ostertagova, E.; Ostertag, O.; Kováč, J. Methodology and application of the Kruskal-Wallis test. Appl. Mech. Mater. 2014, 611, 115–120. [Google Scholar] [CrossRef] [Scilit]
  46. Vock, M.; Balakrishnan, N. A Jonckheere–Terpstra-type test for perfect ranking in balanced ranked set sampling. J. Stat. Plan. Inference 2011, 141, 624–630. [Google Scholar] [CrossRef] [Scilit]
  47. Parmar, A.; Katariya, R.; Patel, V. A review on random forest: An ensemble classifier. In International Conference on Intelligent Data Communication Technologies and Internet of Things; Springer International Publishing: Cham, Switzerland, 2018; pp. 758–763. [Google Scholar]
  48. Rodriguez-Galiano, V.F.; Ghimire, B.; Rogan, J.; Chica-Olmo, M.; Rigol-Sanchez, J.P. An assessment of the effectiveness of a random forest classifier for land-cover classification. ISPRS J. Photogramm. Remote Sens. 2012, 67, 93–104. [Google Scholar]
  49. Saxena, A.; Prasad, M.; Gupta, A.; Bharill, N.; Patel, O.P.; Tiwari, A.; Er, M.J.; Ding, W.; Lin, C.T. A review of clustering techniques and developments. Neurocomputing 2017, 267, 664–681. [Google Scholar] [CrossRef] [Scilit]
  50. Ciaburro, G. An ensemble classifier approach for thyroid disease diagnosis using the AdaBoostM algorithm. In Machine Learning, Big Data, and IoT for Medical Informatics; Academic Press: Cambridge, MA, USA, 2021; pp. 365–387. [Google Scholar]
  51. Hughes, C.; Ronchi, L.; Foley, S.; Dempsey, C.; Lecce, S.; I-Fam COVID Consortium. Siblings in lockdown: International evidence for birth order effects on child adjustment in the COVID 19 pandemic. Soc. Dev. 2023, 32, 849–867. [Google Scholar] [CrossRef] [Scilit]
  52. Cortés-Albornoz, M.C.; Ramírez-Guerrero, S.; García-Guáqueta, D.P.; Vélez-Van-Meerbeke, A.; Talero-Gutiérrez, C. Effects of remote learning during COVID-19 lockdown on children’s learning abilities and school performance: A systematic review. Int. J. Educ. Dev. 2023, 101, 102835. [Google Scholar] [CrossRef] [Scilit]
  53. Gumasing, M.J.J.; Cruz, I.S.V.D.; Piñon, D.A.A.; Rebong, H.N.M.; Sahagun, D.L.P. Ergonomic factors affecting the learning motivation and academic attention of SHS students in distance learning. Sustainability 2023, 15, 9202. [Google Scholar] [CrossRef] [Scilit]
  54. Bai, Y.; Kamarudin, K.M.; Alli, H. A systematic review of research on sitting and working furniture ergonomic from 2012 to 2022: Analysis of assessment approaches. Heliyon 2024, 10, e28384. [Google Scholar] [CrossRef] [Scilit]
  55. Tan, C.Y.; Jang, S.T.; Lam, S.M.; An, A.Q.; Lo, U.K.V. Teaching and learning challenges due to the COVID-19 pandemic: A systematic review. Educ. Res. Rev. 2025, 47, 100667. [Google Scholar] [CrossRef] [Scilit]
  56. Lagahid, N.M.; Salazar, N.; Villeta, R.; Lagahid, P.A. The Impact of Ergonomics Factors on Learning Motivation and Academic Attention. In Proceedings of the 15th Annual International Conference on Industrial Engineering and Operations Management, Singapore, 18–20 February 2025. [Google Scholar]
  57. Barkmann, C.; Wessolowski, N.; Schulte-Markwort, M. Applicability and efficacy of variable light in schools. Physiol. Behav. 2012, 105, 621–627. [Google Scholar] [CrossRef] [Scilit]
  58. Obinna, F.P.; Sunday, A.A.; Babatunde, O. Ergonomic assessment and health implications of classroom furniture designs in secondary schools: A case study. Theor. Issues Ergon. Sci. 2021, 22, 1–14. [Google Scholar] [CrossRef] [Scilit]
  59. Hashim, A.M.; Dawal, S.Z.M.; Yusoff, N. Ergonomic evaluation of postural stress in school workshop. Work 2012, 41, 827–831. [Google Scholar] [CrossRef] [Scilit] [PubMed]
  60. Cayubit, R.F.O. Effect of expressive writing on the subjective well-being of university students. Stud. Asia 2017, 25, 60–68. [Google Scholar] [CrossRef] [Scilit]
  61. Walker, R.; Jansz, J.; Bay, J.H.; Paudel, N.; Swapan, A.Y.; Smith, R. How do ergonomic factors affect perceptions of student online learning in tertiary education? World Saf. J. 2018, 26–33. Available online: https://www.researchgate.net/publication/326328180_How_do_Ergonomic_Factors_Affect_Perceptions_of_Student_Online_Learning_in_Tertiary_Education/link/5b46271245851519b4af2794/download?_tp=eyJjb250ZXh0Ijp7ImZpcnN0UGFnZSI6InB1YmxpY2F0aW9uIiwicGFnZSI6InB1YmxpY2F0aW9uIn19 (accessed on 3 March 2026).
  62. Kowaltowski, D.C.C.K.; Deliberador, M.S.; Pereira, P.R.P. Designing the positive public-school environment: A Brazilian perspective. In Noise and Ergonomics in the Workplace; Nova Publishers: New York, NY, USA, 2013; pp. 1–33. [Google Scholar]
  63. Thompson, J.J.; Porto, S.C. Supporting wellness in adult online education. Open Prax. 2014, 6, 17–28. [Google Scholar] [CrossRef] [Scilit]
  64. Sharma, S.; Ruud, A. On the path to sustainability: Integrating social dimensions into the research and practice of environmental management. Bus. Strategy Environ. 2003, 12, 205–214. [Google Scholar] [CrossRef] [Scilit]
  65. Goudeau, S.; Sanrey, C.; Stanczak, A.; Manstead, A.; Darnon, C. Why lockdown and distance learning during the COVID-19 pandemic are likely to increase the social class achievement gap. Nat. Hum. Behav. 2021, 5, 1273–1281. [Google Scholar] [CrossRef] [Scilit]
  66. Fernandes, B.; Uzun, B.; Aydin, C.; Tan-Mansukhani, R.; Vallejo, A.; Saldaña-Gutierrez, A.; Biswas, U.N.; Essau, C.A. Internet use during COVID-19 lockdown among young people in low-and middle-income countries: Role of psychological wellbeing. Addict. Behav. Rep. 2021, 14, 100379. [Google Scholar] [CrossRef] [Scilit]
  67. Puyana-Romero, V.; Larrea-Álvarez, C.M.; Díaz-Márquez, A.M.; Hernández-Molina, R.; Ciaburro, G. Developing a Model to Predict Self-Reported Student Performance during Online Education Based on the Acoustic Environment. Sustainability 2024, 16, 4411. [Google Scholar] [CrossRef] [Scilit]
  68. Maniyan, S.; Ghousi, R.; Haeri, A. Data Mining-Based Decision Support System for Educational Decision Makers: Extracting Rules to Enhance Academic Efficiency. Comput. Educ. Artif. Intell. 2024, 6, 100242. [Google Scholar] [CrossRef] [Scilit]
  69. Liu, M. Paying Attention to the Online Learning Environment: The Importance of a Low-Noise Environment. Lect. Notes Educ. Psychol. Public Media 2023, 32, 1–6. [Google Scholar] [CrossRef] [Scilit]
  70. Aletta, F.; De Coensel, B.; Lindborg, P.M. Editorial: Human Perception of Environmental Sounds. Front. Psychol. 2021, 12, 10–12. [Google Scholar] [CrossRef] [Scilit]
  71. Alqattan, D.; Turner, P. The Effect of Background Noise on Speech Perception in Monolingual and Bilingual Adults with Normal Hearing. Noise Health 2021, 23, 67–74. [Google Scholar] [CrossRef] [Scilit]
  72. Mercugliano, A.; Corbani, A.; Bigozzi, L.; Vettori, G.; Incognito, O. The Effects of Classroom Acoustic Quality on Student Perception and Wellbeing: A Systematic Review across Educational Levels. Front. Psychol. 2025, 16, 1586997. [Google Scholar] [CrossRef] [Scilit]
  73. Fujita, R. Effects of Speech Rate and Background Noise on EFL Learners’ Listening Comprehension of Different Types of Materials. J. Asia TEFL 2017, 14, 638–653. [Google Scholar] [CrossRef] [Scilit]
  74. Ermert, C.A.; Ehret, J.; Mohanathasan, C.; Andrea, B.; Kuhlen, T.W.; Schlittmeier, S.J.; Fels, J. Influence of (Non-) Intelligible Background Speech on Memory and Listening Effort in Conversational Situations. In Proceedings of the DAS|DAGA 2025, Copenhagen, Denmark, 17–20 May 2025; pp. 159–160. [Google Scholar]
  75. Alary, G. The Role of Interior Design in Enhancing Happiness and Comfort at Educational Institutions in Saudi Arabia: A Case Study of Girls’ College of Science and Arts in Mahayel Aseer, at King Khalid University. Multidiscip. Sci. J. 2022, 5, 455–469. [Google Scholar] [CrossRef] [Scilit]
  76. Obeidat, A.M. Interior Design Strategies for Improving Quality of Life: How Can Residential Spaces Reflect a Healthy Lifestyle and Psychological Comfort? Int. J. Hous. Sci. Its Appl. 2024, 45, 71–86. [Google Scholar] [CrossRef] [Scilit]
  77. Ng, C.F. The Physical Learning Environment of Online Distance Learners in Higher Education—A Conceptual Model. Front. Psychol. 2021, 12, 635117. [Google Scholar] [CrossRef] [Scilit]
  78. Sundstrom, E.; Town, J.P.; Rice, R.W.; Osborn, D.P.; Brill, M. Office noise, satisfaction, and performance. Environ. Behav. 1994, 26, 195–222. [Google Scholar] [CrossRef] [Scilit]
  79. Allen, T.D.; Golden, T.D.; Shockley, K.M. How effective is telecommuting? Assessing the status of our scientific findings. Psychol. Sci. Public Interest 2015, 16, 40–68. [Google Scholar] [CrossRef] [Scilit]
  80. Hedge, A. Ergonomic Workplace Design for Health, Wellness, and Productivity; CRC Press: Boca Raton, FL, USA, 2016. [Google Scholar]
  81. Xiao, Y.; Becerik-Gerber, B.; Lucas, G.; Roll, S.C. Impacts of working from home during COVID-19 pandemic on physical and mental well-being of office workstation users. J. Occup. Environ. Med. 2021, 63, 181–190. [Google Scholar] [CrossRef] [Scilit]
  82. Oakman, J.; Kinsman, N.; Stuckey, R.; Graham, M.; Weale, V. A rapid review of mental and physical health effects of working at home: How do we optimize health? BMC Public Health 2020, 20, 1825. [Google Scholar] [CrossRef] [Scilit]
  83. Bao, W. COVID-19 and online teaching in higher education: A case study of Peking University. Hum. Behav. Emerg. Technol. 2020, 2, 113–115. [Google Scholar] [CrossRef] [Scilit]
  84. García-Morales, V.J.; Garrido-Moreno, A.; Martín-Rojas, R. The transformation of higher education after COVID disruption: Emerging challenges in an online learning scenario. Front. Psychol. 2021, 12, 616059. [Google Scholar] [CrossRef] [Scilit]
  85. Aristovnik, A.; Keržič, D.; Ravšelj, D.; Tomaževič, N.; Umek, L. Impacts of the COVID-19 pandemic on life of higher education students: A global perspective. Sustainability 2020, 12, 8438. [Google Scholar] [CrossRef] [Scilit]
  86. Zimmerman, B.J. Becoming a self-regulated learner: An overview. Theory Pract. 2002, 41, 64–70. [Google Scholar] [CrossRef] [Scilit]
Figure 1. Flowchart of the methodological analyses adopted in the study, illustrating the sequence of data processing and evaluation procedures.
Bdcc 10 00165 g001
Figure 2. Distribution of target variables relating to the perception of acoustic interference during synchronous teaching activities. (a) Perceived Interference of Domestic Sounds in synchronous lessons; (b) Perceived Interference of Domestic Sounds in autonomous tasks.
Bdcc 10 00165 g002
Figure 3. Distribution of predictive variables used to characterize the main family, environmental, and organizational factors associated with the perception of noise interference. Predictor codes are reported as abbreviations for readability; the full names, detailed descriptions, and corresponding thematic groupings of all variables are provided in Table 2.
Bdcc 10 00165 g003
Figure 4. Spearman correlation matrix, developed for examining the association between the predictors and how the students experience acoustic interference in distance learning. As such, we see in panel (a) the correlation of predictors with synchronization learning interference as well as independence learning interference in panel (b). Predictor codes are reported as abbreviations for readability; the full names, detailed descriptions, and corresponding thematic groupings of all variables are provided in Table 2.
Bdcc 10 00165 g004
Figure 5. Bivariate analysis conducted using the nonparametric Kruskal–Wallis and Jonckheere–Terpstra tests to assess differences and ordered trends between groups. The figure graphically represents the results, distinguishing increasing trends (green), and no significant trend (gray). The dashed line marks the variable with the lowest significance. Predictor codes are reported as abbreviations for readability; the full names, detailed descriptions, and corresponding thematic groupings of all variables are provided in Table 2.
Bdcc 10 00165 g005
Figure 6. Evaluation of the importance of the variables obtained from the Random Forest model, aimed at identifying the predictors with the greatest weight in predicting the levels of perceived acoustic interference during distance learning activities. Predictor codes are reported as abbreviations for readability; the full names, detailed descriptions, and corresponding thematic groupings of all variables are provided in Table 2.
Bdcc 10 00165 g006
Figure 7. Cluster analysis of predictor variables in relation to levels of perceived noise interference is used to identify homogeneous groups of factors and understand the combinations of domestic and organizational conditions most associated with perceived disturbance.
Bdcc 10 00165 g007
Figure 8. Boxplot of perceived noise levels in the groups obtained from cluster analysis, useful for evaluating internal variability within clusters and systematic differences between the identified profiles.
Bdcc 10 00165 g008
Figure 9. Boxplot of the distributions of the top five most important predictors in the two identified clusters. Predictor codes are reported as abbreviations for readability; the full names, detailed descriptions, and corresponding thematic groupings of all variables are provided in Table 2.
Bdcc 10 00165 g009
Table 1. Reliability analysis of survey constructs.
ConstructItems (n)Cronbach’s αMean Inter-Item Correlation
Household and Family Context80.860.44
Study Environment and Infrastructure70.880.49
Physical Well-being and Discomfort70.910.55
Study Conditions and Social Interference70.840.42
Overall scale290.940.48
Table 2. Description of the variables included in the study and their grouping into the four identified constructs.
VariableDescriptionConstruct
CHDNumber of children Household and Family Context
PEOPLENumber of people living in the home environment Household and Family Context
POPU12Responsibility for children under 12 years oldHousehold and Family Context
POPO65Responsibility for people over 65 years oldHousehold and Family Context
POPDISResponsibility for people with disabilitiesHousehold and Family Context
FAMINTDegree of interference of family care on academic activitiesHousehold and Family Context
FAMHLPParticipation in household chores or family support activitiesHousehold and Family Context
ALLFAMINTOverall interference of family-related activities on academic performanceHousehold and Family Context
ROOMSYNCUsual location for attending synchronous classesStudy Conditions and Social Interference
ROOMAUTUsual location for autonomous (self-directed) studyStudy Conditions and Social Interference
POPSHSYNCNumber of people sharing workspace during synchronous classesStudy Conditions and Social Interference
POPSHAUTNumber of people sharing workspace during autonomous studyStudy Conditions and Social Interference
POPSHINTSYNCInterference from others during synchronous study sessionsStudy Conditions and Social Interference
POPSHINTAUTInterference from others during autonomous study sessionsStudy Conditions and Social Interference
STDHRDAverage daily hours spent studying at homeStudy Conditions and Social Interference
HMFURNPerceived comfort of home study furnitureStudy Environment and Infrastructure
FURNCHGINTImpact of furniture changes on academic activitiesStudy Environment and Infrastructure
PCCHGINTImpact of computer changes on academic activitiesStudy Environment and Infrastructure
IMPUTCHGINTImpact of changes in mouse/keyboard on academic activitiesStudy Environment and Infrastructure
STRMCHGINTImpact of changes in study room on academic activitiesStudy Environment and Infrastructure
ISPCHGINTImpact of internet provider/speed changes on academic activitiesStudy Environment and Infrastructure
SPCSIZPerceived size of the study spaceStudy Environment and Infrastructure
NECKPAINInterference of neck pain during/after studyPhysical Well-being and Discomfort
SHPAINInterference of shoulder painPhysical Well-being and Discomfort
BACKPAINInterference of back painPhysical Well-being and Discomfort
ARMPAINInterference of arm painPhysical Well-being and Discomfort
LEGPAINInterference of leg painPhysical Well-being and Discomfort
SIGHTPAINInterference of visual discomfort/eye strainPhysical Well-being and Discomfort
HEADPAINInterference of headachePhysical Well-being and Discomfort
Disclaimer/Publisher’s Note: The statements, opinions and data contained in all publications are solely those of the individual author(s) and contributor(s) and not of MDPI and/or the editor(s). MDPI and/or the editor(s) disclaim responsibility for any injury to people or property resulting from any ideas, methods, instructions or products referred to in the content.