Article

Performance of Rim-Seals in Upstream and Downstream Cavities over a Range of Flow Coefficients †

Department of Mechanical Engineering, Turbomachinery Research Centre, University of Bath, Claverton Down, Bath BA1 5NU, UK
*
Author to whom correspondence should be addressed.
This paper is an extended version of our paper published in Proceedings of the European Turbomachinery Conference ETC12 2017, Paper No. 287.
Int. J. Turbomach. Propuls. Power 2017, 2(4), 21; https://doi.org/10.3390/ijtpp2040021
Submission received: 26 September 2017 / Revised: 4 December 2017 / Accepted: 4 December 2017 / Published: 18 December 2017

Abstract

:
This paper presents measurements of CO2 concentration and pressure in a new, highly instrumented and versatile, 1.5-stage gas turbine facility. The rig, which has been specifically designed for investigations related to hot gas ingestion, features interchangeable rim-seals, blading configurations, and the capability to operate at a wide range of flow coefficients. The turbine section includes an upstream and a downstream wheel-space on either side of a rotor disc featuring turned blades. Measurements of CO2 concentration and steady static pressure were used to assess the pressure field in the turbine annulus and to investigate the performance of a radial clearance rim seal in both wheel-spaces. The wealth of data presented will be of great significance for computational fluid dynamics (CFD) validation studies considering downstream cavities. Pressure measurements were made at various locations in the turbine annulus for a range of flow coefficients. In the annulus upstream of the rotor blades the square root of the peak-to-trough pressure difference was shown to increase linearly with the flow coefficient. The radial variation in concentration effectiveness in the upstream and downstream wheel-spaces is provided for a range of sealing flow rates at an operating point near the design condition for the stage. In both cases, the concentration on the stator walls was virtually invariant with the radius and equal to that in the rotating core. The results also showed that for the same effectiveness, a smaller value of non-dimensional sealing flow is required in the downstream wheel-space, indicating a weaker driver for ingress. Off-design measurements of the value of the sealing flow parameter when the concentration effectiveness is 95% in both wheel-spaces are also provided for a range of flow coefficients. In the upstream wheel-space, the sealing flow parameter, and hence ingress, is shown to increase linearly with flow coefficient and be proportional to the square root of the peak-to-trough difference of the circumferential pressure variation in the annulus. Downstream of the blades, both the sealing flow parameter and the square root of the peak-to-trough pressure difference reach a minimum near the operating point, indicating that ingress is affected by the vane pressure field immediately downstream of the seal clearance.

1. Introduction

Gas turbines are widely employed in applications ranging from aircraft propulsion to the generation of electrical power. Faced with increasing fuel costs and ever more stringent environmental legislation, engine manufacturers must design machines with improved efficiency in order to compete on the global stage. One way of increasing engine efficiency is to raise the turbine entry temperature (TET). Modern gas turbines operate with TETs substantially above the melting temperature of the materials used in their construction. In order to operate at these elevated temperatures gas turbines are air-cooled, i.e., air is bled from the compressor and reintroduced within the turbine to cool critical components. There exists an intricate balance between effective cooling and superfluous use, which must be optimised in order to avoid unnecessary performance penalties.
A key challenge facing the designer is the ingestion of hot mainstream gases within the disc cavities formed between adjacent stationary (stator) and rotating (rotor) discs. Rim seals, such as that shown in Figure 1, are fitted at the periphery of the disc cavity (or wheel-space). These seals can vary greatly in their geometry and configuration; typical high-pressure gas turbines feature rim-seals designed to be appropriate for each disc face and stage (Figure 1 illustrates a characteristic seal arrangement).
Engine manufacturers use advanced computational fluid dynamic (CFD) simulations to design increasingly complex rim-seals; CFD simulations of the unsteady and three-dimensional flow present in the mainstream gas-path and cooling systems of gas turbines are computationally expensive. Simulations rely heavily on the insight and validation provided by experimental work, often conducted in test rigs operating in controlled conditions. Experimental facilities range from near-engine representative stages to rigs operating at relatively benign conditions. The latter offers the benefit of improved instrumentation capability, accuracy, flexibility, and expediency.
This paper presents the performance capability of a new, versatile, and highly instrumented 1.5-stage turbine experimental facility specifically built for investigations of hot gas ingestion. The annulus pressure field is examined at various operating conditions with regards to its effect on ingestion; experimental measurements of rim-seal effectiveness are presented to support the conclusions.

2. Rotor-Stator Systems

Hot gas ingestion occurs as a result of a pressure difference between the gas turbine annulus and that in the wheel-space. The vanes and blades create an unsteady circumferential distribution of pressure radially outward of the rim-seals; ingress occurs where the pressure in the annulus is higher than in the wheels-space, and egress occurs vice-versa. This was described by Owen as externally-induced (EI) ingress [1].
The flow structure found in the wheel-space is governed by separate boundary layers on both the stator and rotor, between which exists a rotating inviscid core. The rotating fluid creates a radial pressure gradient, whereby the pressure increases towards the rim seal. Owing to the pressure gradient, fluid can be drawn into the wheel-space even in the absence of any external pressure asymmetry. This form of ingestion was coined rotationally-induced (RI) ingress by Owen et al. [2]. In certain circumstances, the effects of EI and RI are both significant; this is termed combined ingress (CI).

2.1. Fluid Structure in the Wheel-Space

Figure 2 shows the flow structure in the upstream and downstream wheel-spaces for the case in which there is a superposed sealing flow, with swirl, together with ingestion through the rim-seal.
Consider first the upstream wheel-space. The discs are wide enough apart that separate boundary layers evolve on each of them, both of which start at entry to the wheel-space. Fluid moves radially outward in the boundary layer on the rotor and inward in the boundary layer on the stator. Over much of the wheel-space, fluid is entrained axially across the rotating inviscid core from stator to rotor. Owing to the Taylor-Proudman theorem (documented by Childs [4]), all radial flow is confined to the boundary layers on the rotor and stator discs. The sealing flow is introduced to the system in an inner region (shown in Figure 2 between two dashed lines), by which point all the available flow will have become entrained into the rotor boundary layer. In the outer region (radially outward of the outmost dashed line on Figure 2), some fluid flows from the rotor to the stator, while the remainder leaves the system as egress through the rim seal.
An extensive review of computational, theoretical, and experimental modelling of hot gas ingestion—including those works relating to flow structure—is provided by Scobie et al. [5]. The majority of these studies focus on ingress in the upstream wheel-space of a gas turbine; far fewer investigators have conducted detailed studies downstream of the rotor.
Patinios et al. presented the first experimental data from the test facility used in this paper [3]. The authors were able to investigate the expected flow structure in the downstream wheel-space and draw comparisons with the established structure widely accepted upstream of the rotor. The study concluded that the flow structure was broadly similar in both wheel-spaces; however, an important difference was noted in the vicinity of the rim-seal.
In the downstream wheel-space, the ingested fluid has to cross an axis-symmetric “curtain” of egress before entering the wheel-space (shown in Figure 2). The subsequent exchange of angular momentum between the two streams is expected to attenuate any pressure asymmetries and result in an increased sealing effectiveness downstream of the rotor. Experimental measurements conducted by the authors using double radial-clearance seals provided supporting evidence for this theory; this paper continues the investigation with single radial-clearance seals.
The experimental measurements presented in this paper were restricted to the wheel-space and the stator platforms. Scobie et al. [6] traversed a miniature concentration probe across the annulus and into the seal clearance to provide a link between the internal and external flows.

2.2. Governing Non-Dimensional Parameters for Ingress

The ingress of fluid through the rim-seal is an inertial phenomenon driven by differences in pressure, whereas the flow inside the wheel-space is controlled by the boundary-layers on the rotor and stator (Scobie et al. [5]). Defined below are two non-dimensional flow rates (Φ0 and λT), which, respectively, govern these inviscid and viscous phenomena.
The sealing flow parameter, Φ0, combines the effects of Cw,0, Gc, and Reφ into a single variable:
Φ 0 = C w , 0 2 π G c R e ϕ = U Ω b
where U is the bulk mean radial velocity of sealing air through the seal clearance. As both Reφ and Cw,0 include viscous terms which cancel, Φ0 is therefore an inertial parameter. Note that Φmin, the minimum flow rate to seal the wheel-space can (in principle) be scaled to the engine if the appropriate non-dimensional pressures driving ingress are known [1].
The structure of the flow in the wheel-space is determined by the turbulent flow parameter, which is defined as:
λ T = C w , 0 R e ϕ 0.8

3. The 1.5-Stage Gas Turbine Test Facility

3.1. Facility Overview

A component view of the test facility is shown in Figure 3. Compressed air from a coaxial inlet pipe is supplied to the gas turbine annulus through a radial diffuser. The radial diffuser features 32 flow guides (one per vane), in which the flow transitions through an increase in radius, while promoting an equal flow distribution. The mainstream flow subsequently passes through 32 removable inlet pipes before entering an annular transition; carbon fibre inserts within the transition piece create an axisymmetric inlet to the turbine stage.
The turbine assembly consists of an upstream stator with 32 vanes, a rotor with 48 turned blades, and a downstream stator with a further 32 vanes. The stators are manufactured as bladed rings, or blings, allowing for the installation of radial-assembly seals; the rotor is manufactured as a blisc. The rotor disc can be rotated at speeds up to 4000 rpm by a 34 kW drive-and-brake dynamometer, required to absorb the power generated from the rig. The downstream stator assembly is supported on a cantilevered bearing housing, and a hydraulic coupling was used to mount the rotor to the driveshaft. A flexible coupling between the driveshaft and dynamometer is used to isolate the turbine assembly from vibrations.
Sealing flow is supplied axially to the upstream and downstream wheel-spaces at low radius, through inlet seals (shown in Figure 3, inset). In the case of the upstream wheel-space, the sealing flow is supplied through a 2-inch pipe, and in the case of the downstream wheel-space through a manifold. The two supply lines are independent from each other and are used in isolation to ensure sealing flow supply only to the wheel-space under investigation. Thermal mass-flow meters and close-coupled control valves were used to control the mass flows to the test rig; all mass-flows were measured to an accuracy of ±1% of the full-scale range.
For a more comprehensive description of the experimental facility, the reader is directed to Patinios et al. [3] and Scobie [7].

3.2. Operating Conditions

Table 1 shows the operating conditions of the 1.5-stage test facility. In this study experiments were performed at a maximum speed of 4000 rpm, creating a rotational Reynolds number Reφ = 1.0 × 10⁶. Despite the maximum Reφ being an order of magnitude smaller than that typically found in engines, the flow structure in rotor-stator systems is principally governed by the turbulent flow parameter λT and depends only weakly on Reφ (Owen and Rogers [8]). In modern engines, λT is typically less than 0.22 (Scobie et al. [5]); λT < 0.22 in all experiments presented in this study.
The mass-flow rate supplied to the turbine annulus can be controlled so that a wide range of flow coefficients, CF, can be achieved. The operating flow coefficient for the test facility is CF = 0.29, which was near the design point for the stage; off-design is used to describe experiments where CF ≠ 0.29. The operating condition resulted in a maximum axial Reynolds Number, Rew = 2.9 × 10⁵, and a corresponding Mach number at the exit of the upstream stator vanes of M = 0.32. The degree of reaction for all experiments is 17.4%.

3.3. Experimental Measurements and Instrumentation

Measurements of CO2 concentration, static, and total pressure can be taken at various locations in the annulus and in the upstream and downstream wheel-spaces, as shown in Figure 3.
The variation of steady static pressure with non-dimensional vane pitch was measured at ten discrete locations in the turbine annulus: four axial locations on the hub (A1 to A4) and six further locations on the outer shroud (B1 to B6), shown in Figures 5–7. Dimensioned positions of each location are shown in Figure 6. At each location there were 15 pressure taps across a vane pitch, with a duplicate set positioned at 180° around the azimuth in each case in order to assess repeatability (a total of 300 sampling locations). All static pressure measurements were made using four, 48-channel Scani-Valves, fitted with ESI (Wrexham, UK) differential pressure transducers. The range of the transducers was 0–80 mbar, with an accuracy of ±0.3% of the measurement range.
The degree of ingress, and subsequently the sealing effectiveness, εc, of rim-seals was determined using measurements of CO2 concentration. The sealing flow was seeded with 1% CO2 prior to entry into either wheel-space, c0, while the mainstream flow in the annulus (measured directly upstream of the first row of stator vanes) was kept unseeded and monitored as ca. The relative dilution of the seeded sealing flow could be measured at 20 radial positions on each stator disc; the concentration of CO2 on the stator wall, cs, was then used to define the concentration effectiveness, εc, as follows:
ε c = c s c a c 0 c a
The concentration in the rotating core, c, was measured in both wheel-spaces, at ten discrete radial locations, using pitot tubes as sampling inlets (shown in Figure 3); the pitot tubes were positioned axially at z/S = 0.25 and aligned tangentially to the oncoming flow. Concentration measurements were made using a two-channel Signal Group (Camberley, UK) 9000MGA gas analyser operated at a range of 0–1% with repeatability and linearity better than 1% and 0.5% of the full-scale range, respectively.
A complete uncertainty analysis for concentration and pressure is given in Scobie [7].

3.4. Geometry of Single Radial-Clearance Seals

The geometric configuration of the single radial-clearance rim-seals is shown in Figure 2; key parameters are annotated in the figure. The single radial-clearance seal consists of a rotor-side lip that forms an axial overlap underneath the stator hub, soverlap, of 1.86 mm. The seal creates a radial-clearance with the stator hub, sc,rad, of 1.28 mm. At the two operating speeds, 3000 rpm and 4000 rpm, this clearance reduces by 0.0325 mm and 0.0587 mm, respectively. The axial clearance between the rim at the periphery of the wheel-space, sc,ax, is 2 mm. All nominal seal clearances were measured under static conditions within ±0.05 mm. The radius of the seal (b = 190 mm) and the axial clearance between the discs (S = 20 mm) provided a gap ratio, G = 0.1, that ensures a turbulent flow structure and separated boundary layers in the wheel-spaces (Daily and Nece [9]). The height of the annulus, h, is 25 mm and is large enough for secondary flow features typical to turbine vane/blade passages to develop (Scobie et al. [10]).

4. Experimental Results and Discussion

4.1. Annulus Pressure Measurements

The circumferential distribution of Cp,a across two non-dimensional vane pitches is shown in Figure 4 at location A1 (upstream vane platform) and A4 (downstream vane platform). The measurements were made for the case of no sealing flow, i.e., Φ0 = 0. The asymmetry in pressure at location A1 is caused by the potential field of the upstream vane. In contrast, the A4 measurements demonstrate the influence of the bow-wave that propagates forward from the downstream vane leading edge. It can be seen that the non-dimensional peak-to-trough pressure difference, ΔCp,a (defined in the figure), is greater upstream than that downstream.
Figure 5 shows how ΔCp,a varies in the annulus at all of the measurement locations. Upstream of the rotating blades at both the vane platform (A locations) and outer shroud (B locations), ΔCp,a decreases with axial distance, x. The difference in peak-to-trough pressure decays with axial distance from the upstream vane trailing edge. The downstream measurements show ΔCp,a increases as the vane leading edge is approached and the effect of the bow-wave is intensified. For both the upstream and downstream measurements, a difference in ΔCp,a can be observed when comparing the results taken at the same axial location on the vane platform and outer shroud, e.g., A1 with B1 and A3 with B5. Swirl in the annulus causes a radial pressure gradient, which results in larger ΔCp,a values at the outer locations. Figure 5 highlights that ΔCp,a depends on where in the annulus it is measured.
Figure 6 shows the variation of ΔCp,a1/2 with flow coefficient CF in the annulus upstream of the rotating blades at locations A1, A2, B1, B2, and B3. For all measurement locations, ΔCp,a1/2 increases linearly with CF. The amount of ingestion of mainstream flow in the upstream wheel-space is therefore expected to increase as CF increases. The variation of ΔCp,a1/2 with CF was correlated by
Δ C p , a 1 / 2 = k a C F
where ka is an empirical constant representing the gradient of the straight lines. The values of ka at the various measurement locations are provided in the table within the figure. Also shown in Figure 6 is the variation of non-dimensional pressure, Cp,a, across one vane pitch at the operating point where CF = 0.29 for locations A2, B1, and B3.
Figure 7 shows the variation of ΔCp,a1/2 with CF in the annulus downstream of the rotating blades, at locations A3, A4, B4, B5, and B6; unlike the upstream variation, the relationship is clearly not linear. For all locations, ΔCp,a1/2 reaches a minimum at a flow coefficient close to the operating point, where the flow velocity triangles are aligned with inlet angle of the downstream vane. Either side of this, the blockage increases as the flow impinges on the vane causing an increase in pressure. The outer shroud locations will also be affected by the blade tip clearance and the corresponding leakage flow. Once again, a selection of Cp,a variations across one downstream vane pitch is also shown for locations A3, B4, and B6.

4.2. Wheel-Space Concentration Measurements

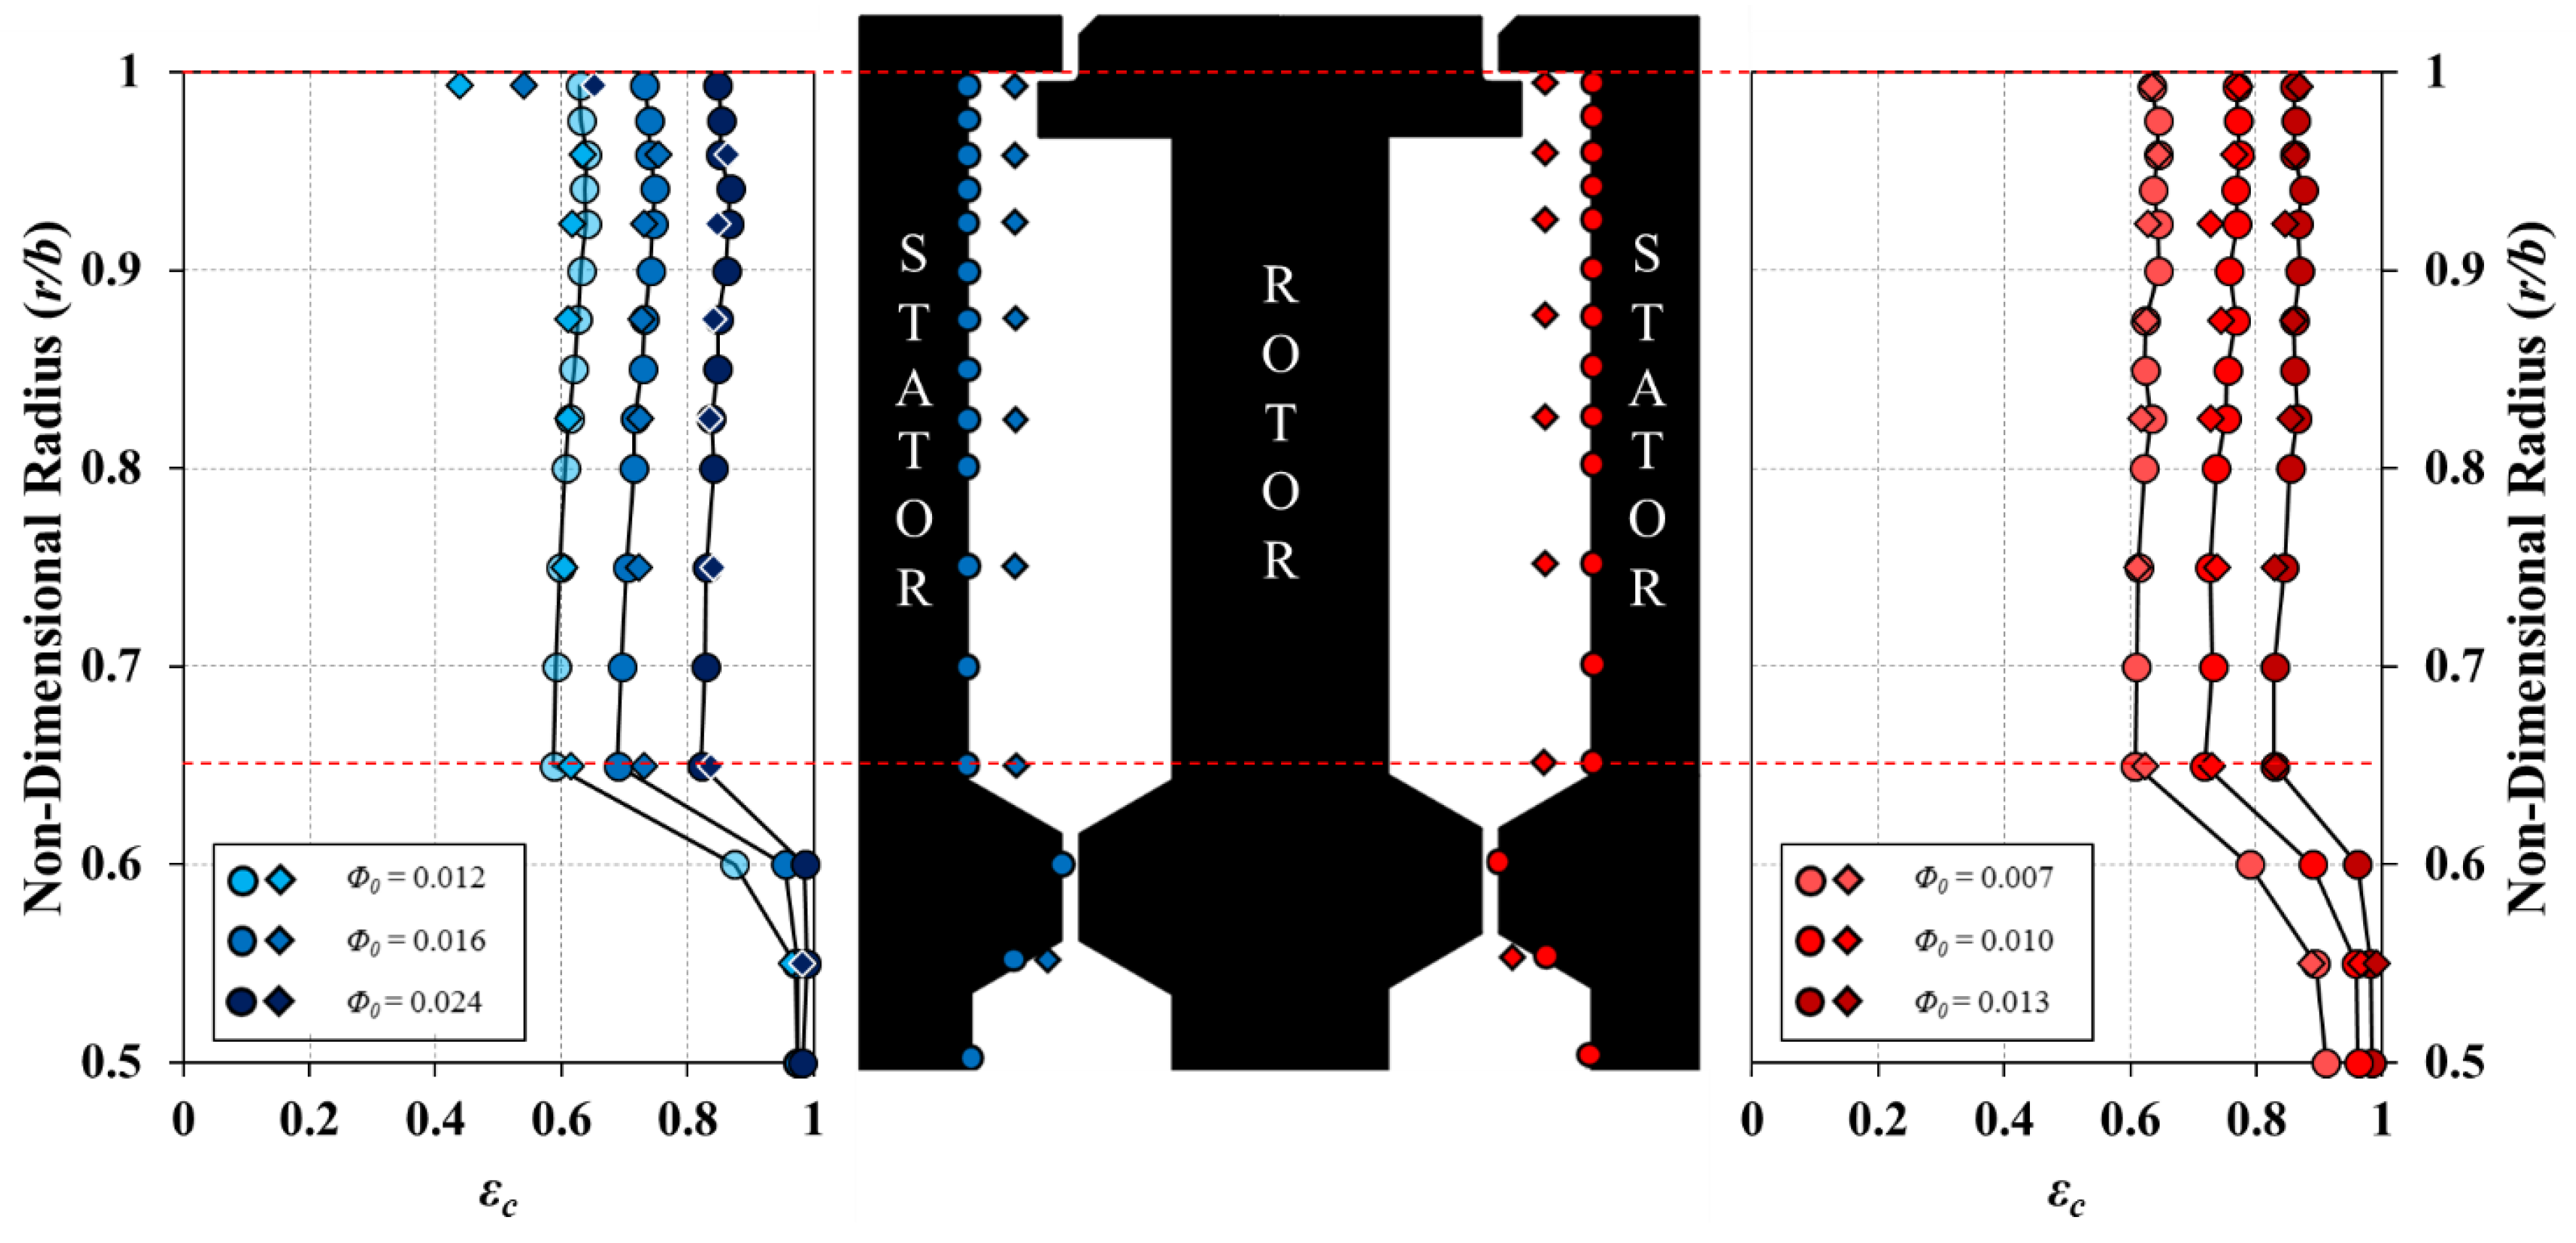
4.2.1. Radial Distribution of Effectiveness

Figure 8 shows the radial variation of εc in the upstream and downstream wheel-spaces for the single radial-clearance seal. The measurements were taken on the stator surfaces (circle symbols) and in the rotating-core (diamond symbols) at z/S = 0.25 using sampling probes. The experiments were conducted for several values of Φ0 and hence λT; in all cases, ingress occurred. In both wheel-spaces, εc on the stator wall and in the core increases as Φ0 increases, and the sealing flow raises the pressure in the wheel-space relative to the annulus.
For all sealant flow rates, the effectiveness in the stator boundary layer and in the rotating core is broadly invariant with radius for r/b ≥ 0.65. Measurements of the variation of sealing effectiveness εc with non-dimensional sealing flow rate Φ0 are expected to be independent of radial location, as the stator side boundary layer is non-entraining. In all cases, the effectiveness in the rotating core is found to be equal to that of the stator boundary layer with the exception of r/b = 0.993 in the upstream wheel-space. This region is characterised by intense mixing of angular momentum and concentration. The egress will be pumped up through the rotor boundary layer (with high εc) and the ingress will enter the wheel-space on the stator side (with low εc). All of the results are in agreement with the findings of Patinios et al. [3] and provide evidence for a similar flow structure in the two wheel-spaces.
Comparing the radial distributions obtained in the upstream and downstream wheel-spaces, it can be seen that despite the conditions chosen for the experiments resulting in virtually the same εc, the values of Φ0 are very different. For example, for a value of εc ≈ 0.6 (light colour symbols), the non-dimensional sealing flow rate supplied to the downstream wheel-space is significantly less than that required for the same effectiveness value upstream. In other words, the performance of the same seal geometry (in terms of axial and radial clearances) in the downstream wheel-space is more effective than in the upstream side; this suggests that a weaker driver for ingress exists downstream.

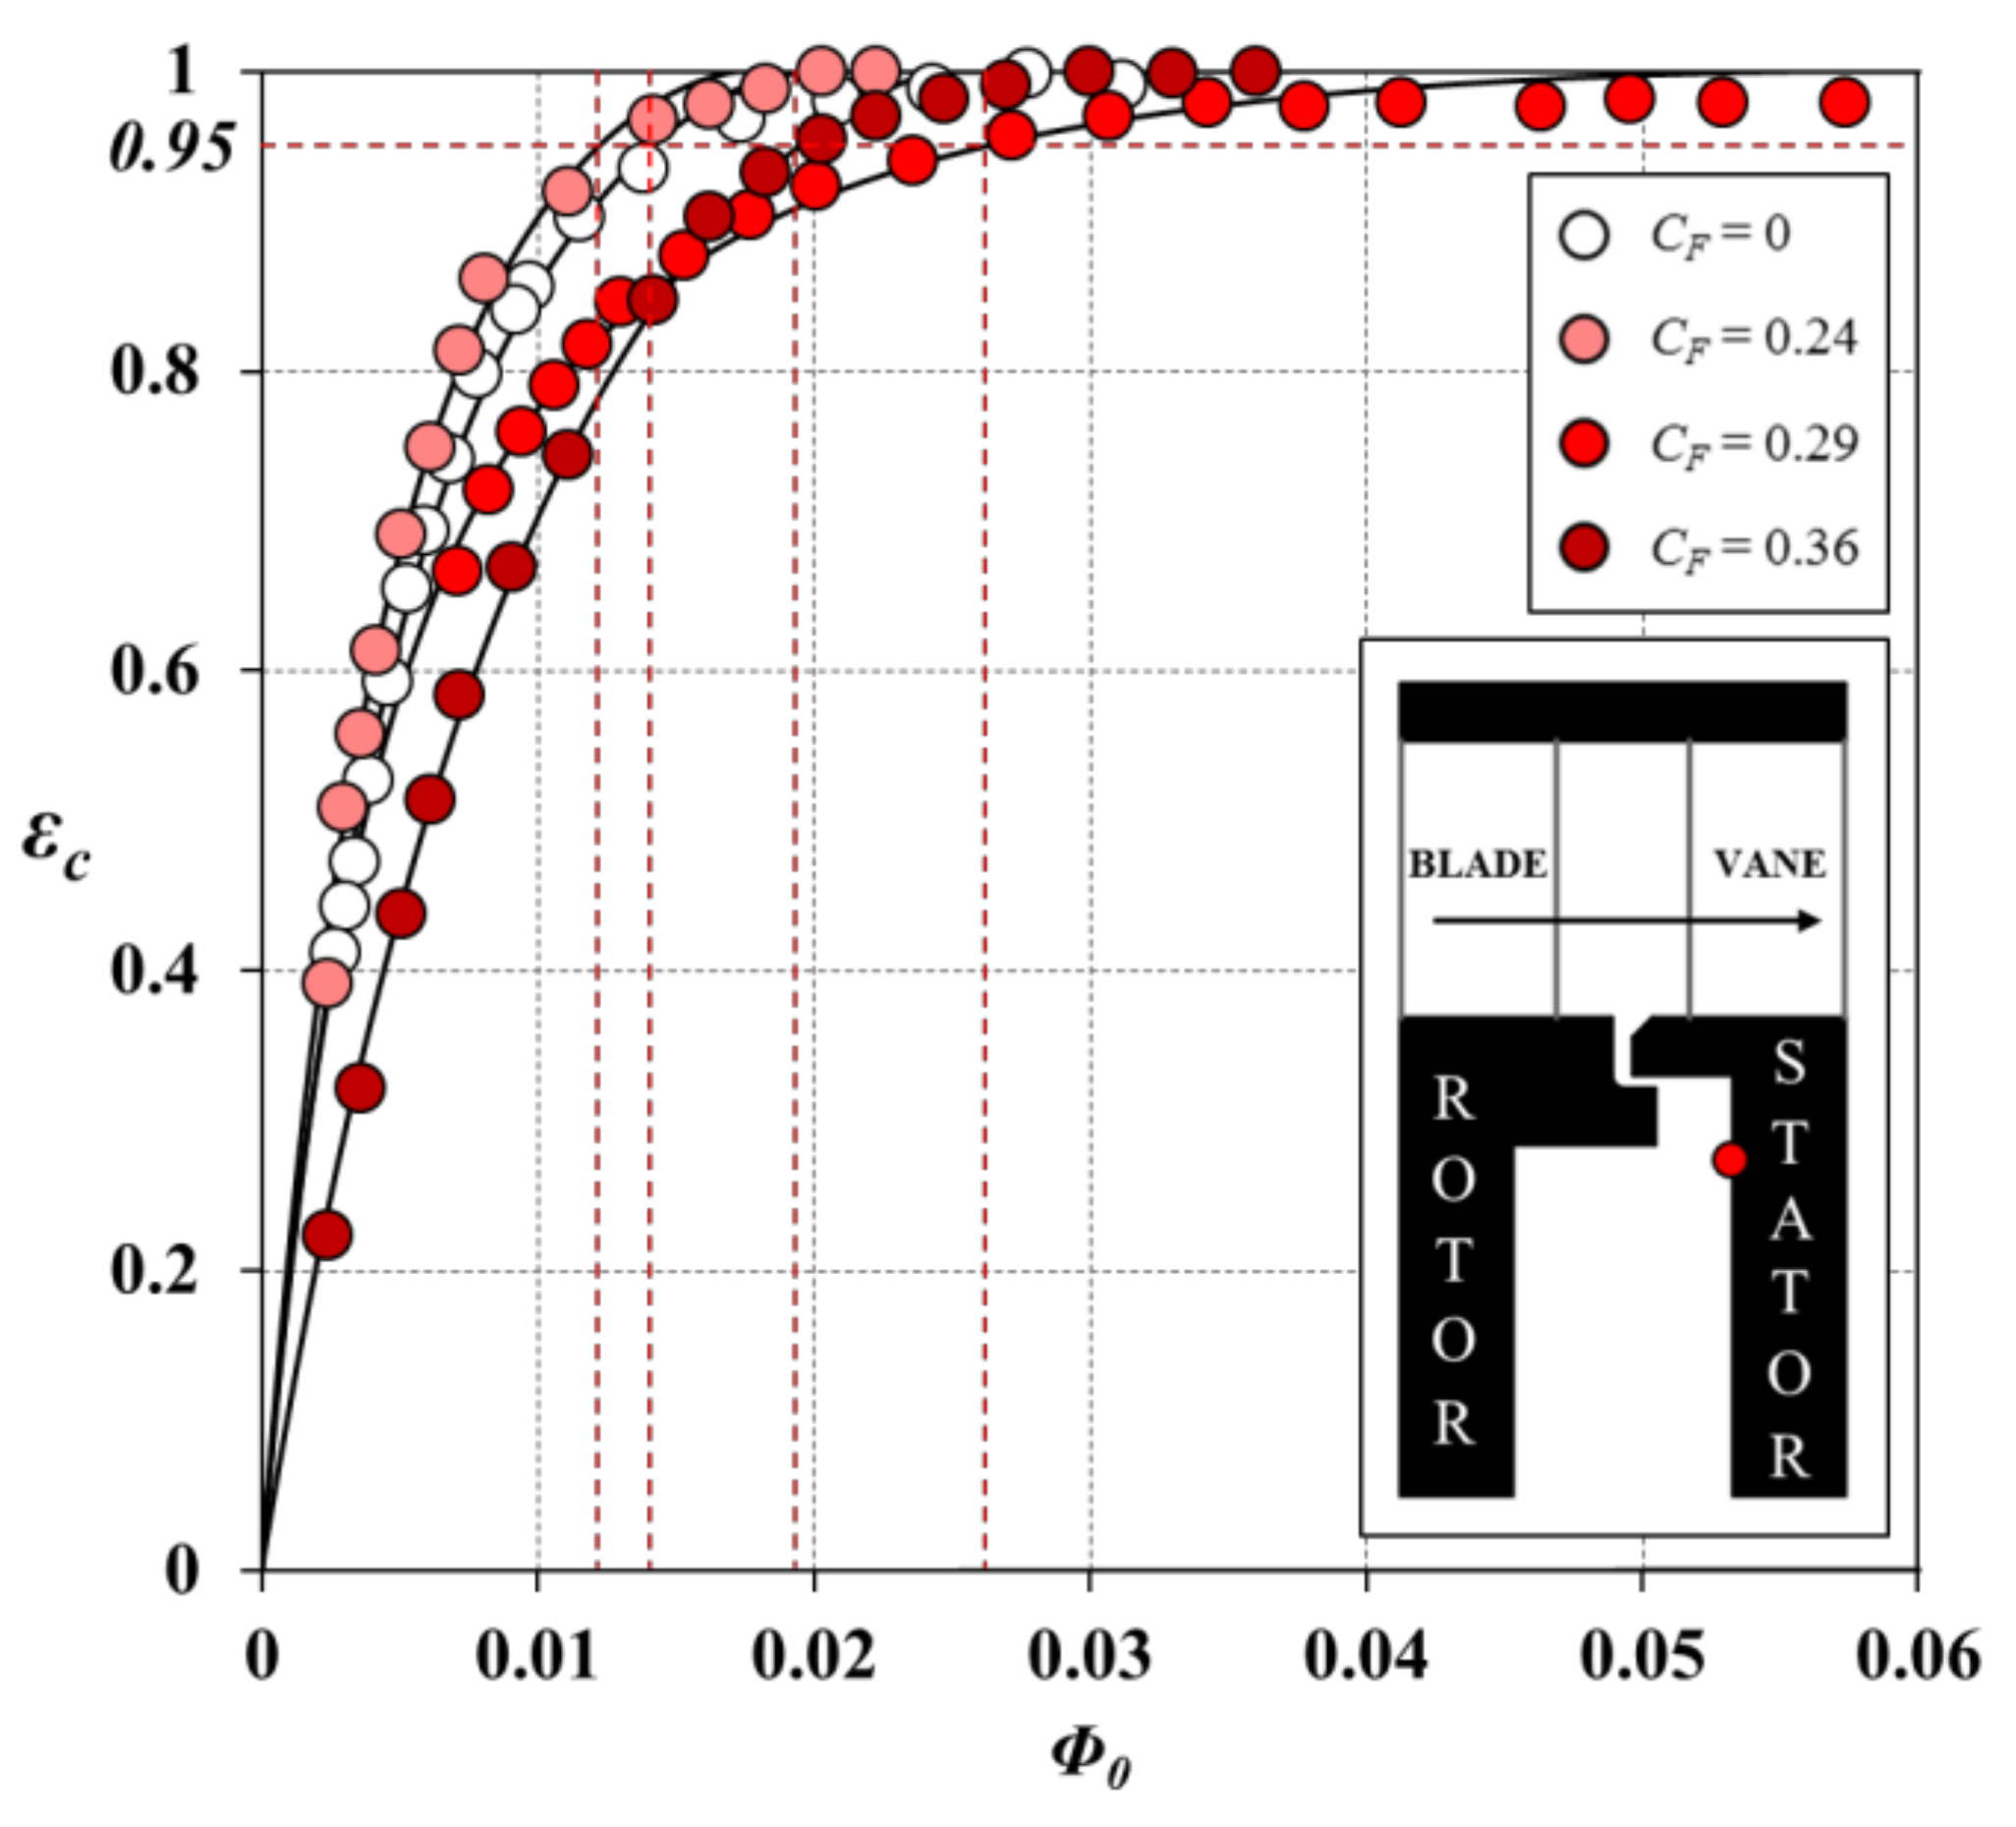
4.2.2. Variation of Concentration Effectiveness with Sealing Flow

The variation of effectiveness εc, with Φ0 for the single radial-clearance seal in both the upstream and downstream wheel-spaces, is shown in Figure 9. The concentration measurements were made on the stator surfaces at r/b = 0.958 and 0.85. In both wheel-spaces, εc increases with increasing Φ0, as the sealing flow pressurises the wheel-space and reduces ingestion through the rim-seal. The data collapse onto single curves, which are independent of rotational Reynolds number Reφ. As shown in Figure 9, the effectiveness at r/b = 0.958 (dark symbols) and 0.85 (light symbols) is virtually identical. For any value of Φ0, the effectiveness in the downstream wheel-space is higher than that upstream; this indicates a weaker driver for ingress downstream.
The experimental data are fitted with the theoretical effectiveness equations from Sangan et al. [11] using the maximum likelihood method described by Zhou et al. [12]. All sets of experimental measurements demonstrate good agreement with the theoretical values. This is a significant result, as it shows that the simple orifice model from Owen [1] can qualitatively predict ingress not only to an upstream wheel-space where the externally-induced ingress is dominated by the steady-state pressure asymmetry from the vanes, but also downstream where ingress is the result of a less powerful driving mechanism.

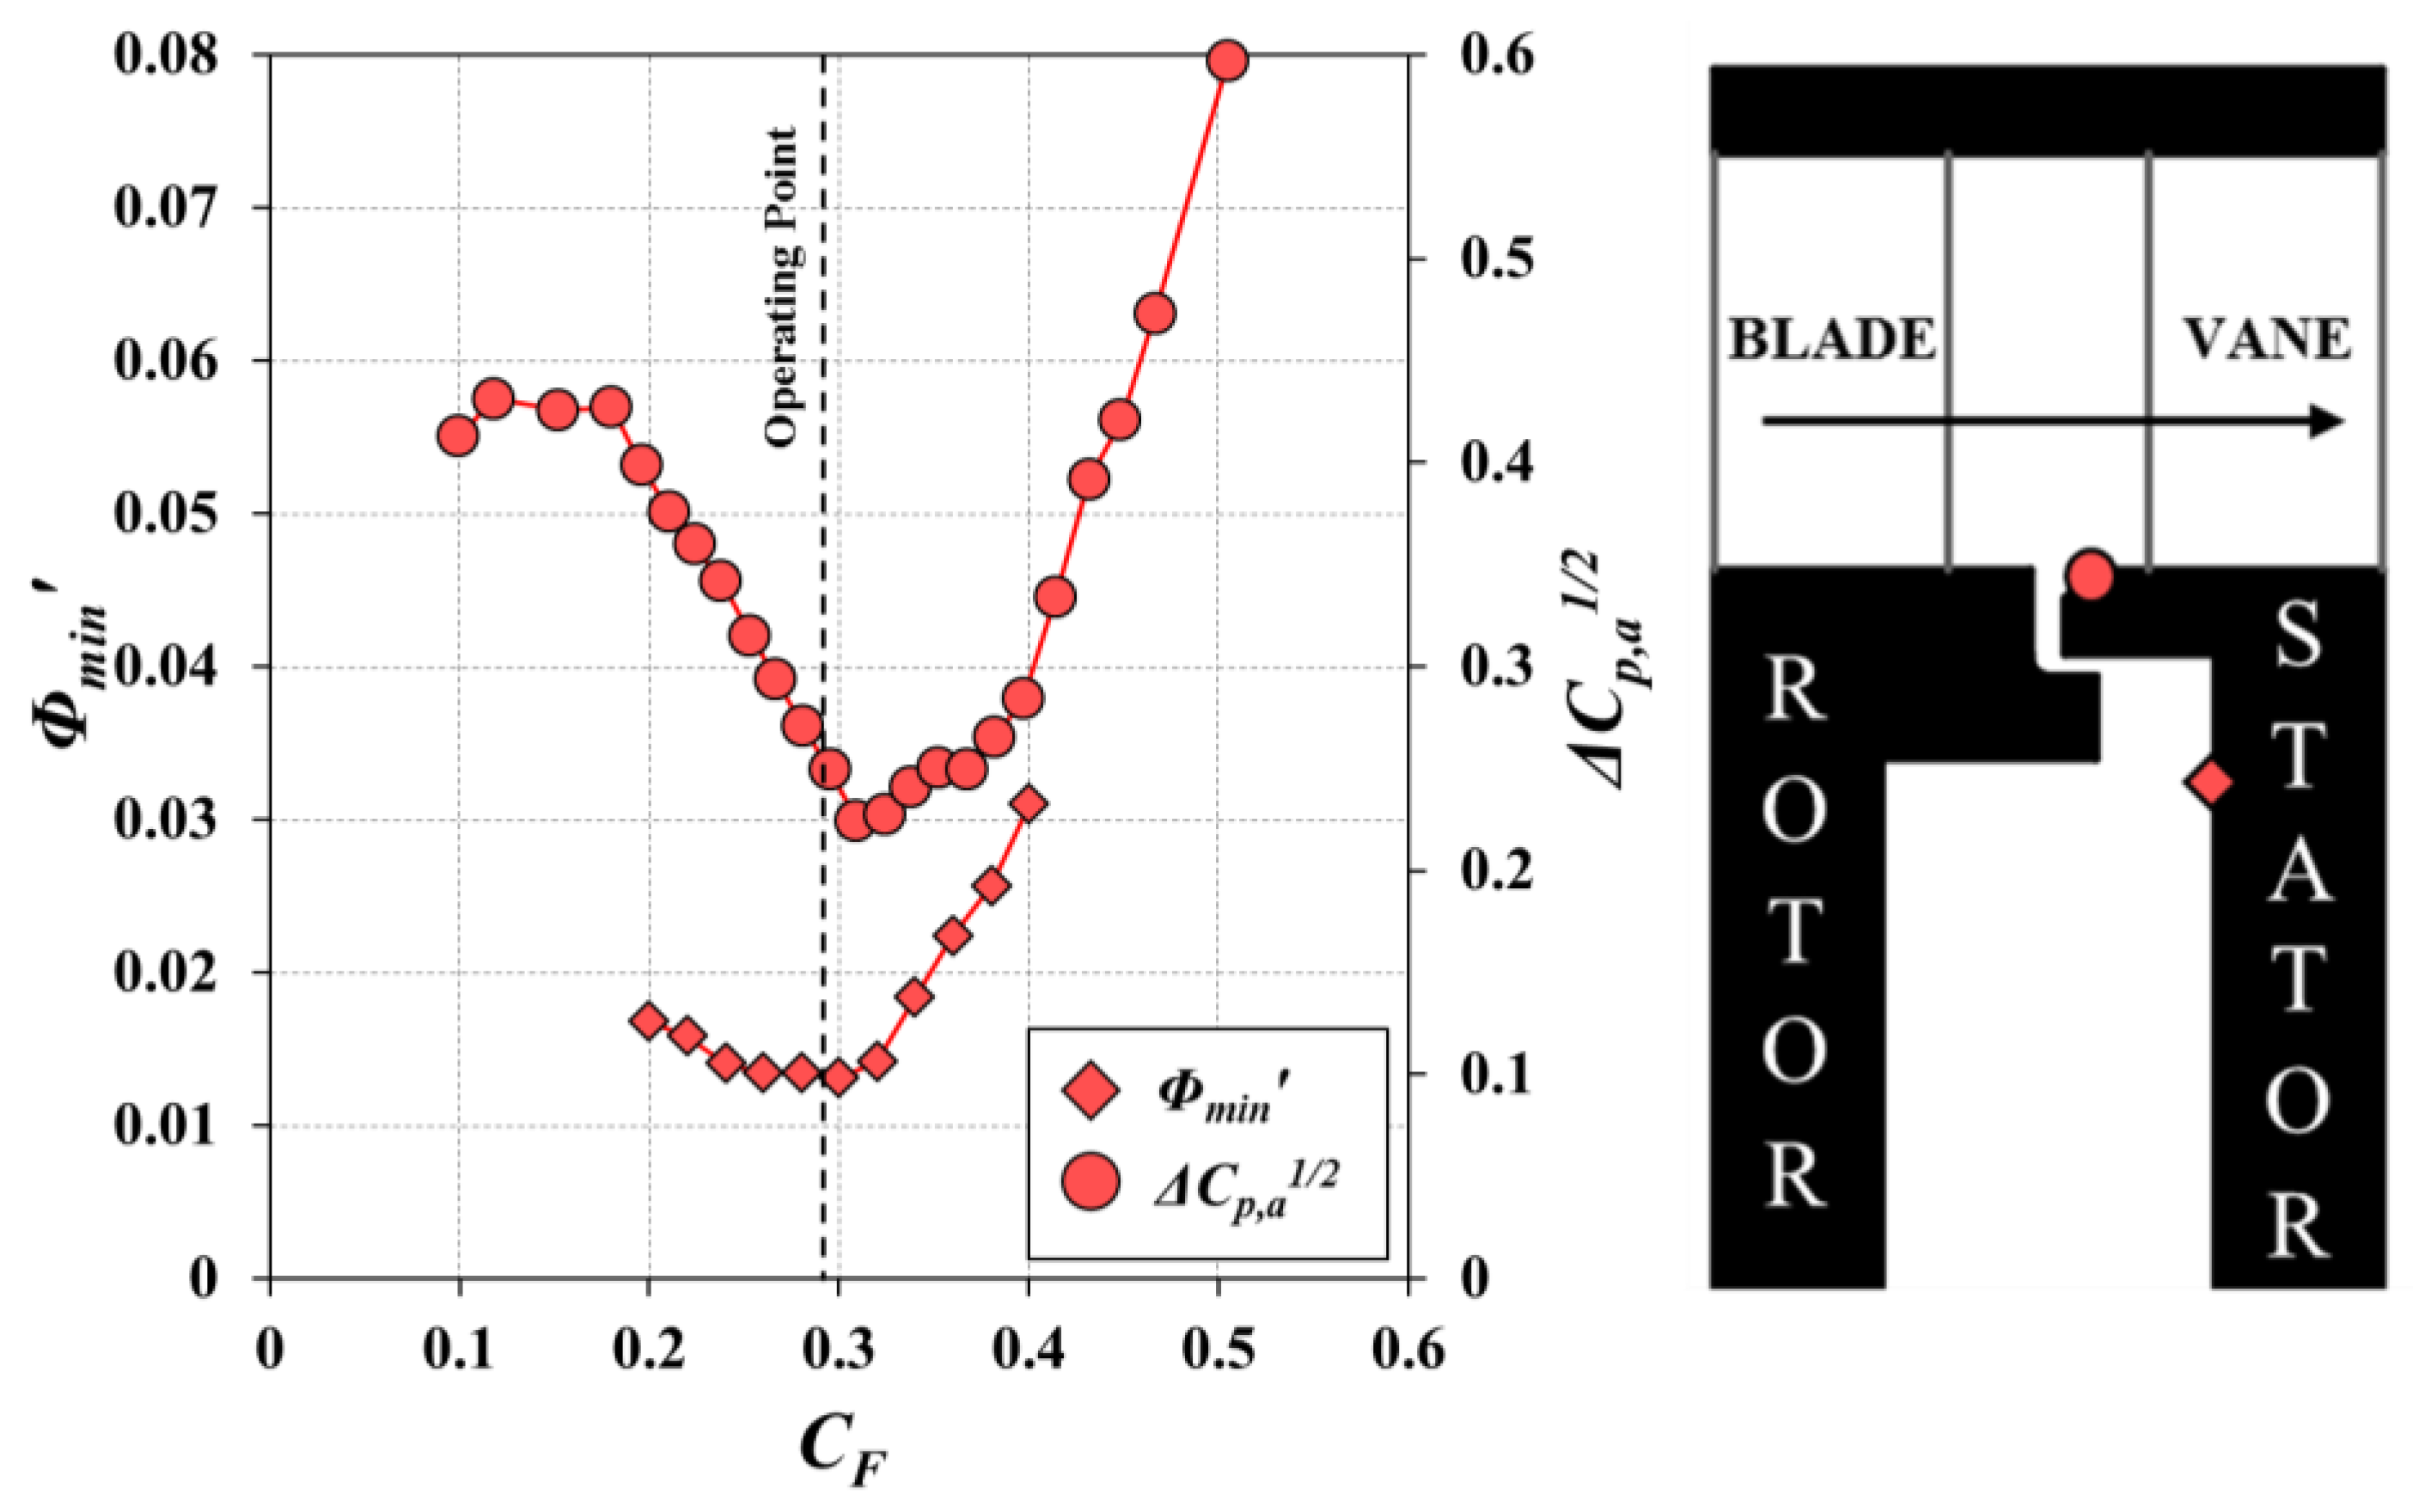
4.3. Measurements of Ingress at Off-Design Conditions

Figure 10 shows the effect of four flow coefficients, CF = 0, 0.24, 0.29, and 0.36, on the variation of εc with Φ0 in the upstream wheel-space. Τhe measurements were taken on the stator surface at r/b = 0.958 ( blue circle in the silhouette). For the case of CF = 0, no annulus flow was supplied to the turbine and rotationally-induced (RI) ingress occurred due to the “pumping” effect of the rotor. The other three flow coefficients were achieved by varying the annulus flow rate while maintaining a constant rotational Reynolds number of Reφ = 7.2 × 10⁵. Combined ingress is present for small CF and, as shown below, externally-induced ingress dominates for CF > 0.2. In all cases, εc increases with Φ0 as the sealing flow pressurises the wheel-space and prevents ingress. However, the amount of sealing flow required to achieve the same εc varies significantly between the different cases. To emphasise this, vertical and horizontal red dashed lines are added to the figure to indicate Φmin′, the minimum amount of sealing flow required for εc = 0.95; it can be seen that Φmin′, and the degree of ingress, increases as CF increases.
The theoretical effectiveness equations are fitted to the experimental data using the maximum likelihood method described by Zhou et al. [12]. All sets of measurements demonstrate good agreement with the theoretical curves, with the exception of data for CF = 0.36; here, the effectiveness data demonstrate an inflected curve or ‘kink’ in the range of intermediate flow rates, and agreement with the theoretical form exists only at low and high values of Φ0.
Similar behaviour was also observed by Scobie et al. using an axial-clearance seal [13]. It was speculated that the kink may have been caused by the interaction between the sealing and mainstream flows.
Figure 11 shows the effect of the flow coefficient on the variation of εc with Φ0 in the downstream wheel-space. Τhe measurements were taken on the stator surface at r/b = 0.958 (red circle in the silhouette) and at Reφ = 7.2 × 10⁵. Similar trends to the upstream wheel-space are observed, though the magnitude of the variation of Φmin′ with CF is diminished due to its weaker influence on the circumferential pressure variation in the downstream annulus.
Figure 12 and Figure 13 show the variation of Φmin′ (plotted on the left-hand vertical axis) with CF in the upstream and downstream wheel-space, respectively. The measurements were taken at r/b = 0.958 and for Reφ = 7.2 × 10⁵ by adjusting the amount of sealing flow supplied into the wheel-spaces until a concentration effectiveness εc = 0.95 was achieved. Also shown in the figures is the variation of ΔCp,a1/2 (plotted on the right-hand vertical axis) with CF at locations A2 and A3 in the annulus on the vane platforms, upstream and downstream of the rotor blades, respectively. Τhis variation was also shown in Figure 6 and Figure 7 and is repeated here for convenience.
Consider, firstly, the measurements shown in Figure 12. Both Φmin′ and ΔCp,a1/2 increase linearly with CF, indicating EI ingress in agreement with the theoretical orifice model of Owen [1]. Now, consider Figure 13: in the downstream wheel-space, both Φmin′ and ΔCp,a1/2 reach a minimum near the operating point and increase for flow coefficients either side of this value. For CF, which is larger than the operating point, the linear behaviour between Φmin′ and ΔCp,a1/2 returns, showing that ingress in the downstream wheel-space is influenced by the vane pressure field immediately downstream of the seal clearance.

5. Conclusions

This paper describes a highly versatile, 1.5-stage axial-turbine research facility used to experimentally model ingress into both upstream and downstream wheel-spaces. The rig was specifically designed for detailed instrumentation access in a fluid-dynamically-scaled environment offering an efficient, flexible, and relatively inexpensive means of assessing new rim-seal design concepts.
Steady static pressure measurements were made in the annulus at various axial positions both upstream and downstream of the rotor blades for a range of CF conditions. The upstream locations showed that ΔCp1/2 increases linearly with CF, whereas downstream ΔCp1/2 reached a minimum at a flow coefficient close to the operating point.
Measurements of CO2 tracer gas concentration in both wheel-spaces showed that the effectiveness in the core was equal to that on the stator wall and all distributions were virtually invariant with radius. The sealing flow rate required to seal the downstream wheel-space was found to be significantly lower than that required upstream; this indicates that a weaker driver for ingress exists downstream of the rotor blades.
Off design measurements of the variation of εc with Φ0 in the upstream and downstream wheel-spaces were taken for a range of flow coefficients and the variation of Φmin′ with CF was investigated. In the upstream wheel-space, Φmin′ was found to increase linearly with CF, itself proportional to ΔCp1/2. In the downstream wheel-space, the variation of Φmin′ with CF reaches a minimum near the operating CF. For CF larger than the operating point, the linear behaviour between Φmin′ and ΔCp,a1/2 returns, showing that ingress in the downstream wheel-space is influenced by the vane pressure field immediately downstream of the seal clearance.

Acknowledgments

The authors would like to thank Andrew Langley for his assistance with the manufacture and assembly of the test rig. The research described here was supported by the Engineering and Physical Sciences Research Council (EPSRC). Data access: Due to confidentiality agreements with research collaborators, supporting data can only be made available to bona fide refreshers subject to a nondisclosure agreement. Details of how to request access are available at the University of Bath data archive website (http://dx.doi.org/10.15125/BATH-00116).

Author Contributions

M. Patinios (Postgraduate student) and J.A. Scobie (Research Fellow) conducted the experimental work; C.M. Sangan and G.D. Lock oversaw the data analysis and supervised M. Patinios’ Ph.D.; the paper was co-written by all authors.

Conflicts of Interest

The authors declare no conflict of interest. The founding sponsors had no role in the design of the study; in the collection, analyses, or interpretation of data; in the writing of the manuscript, and in the decision to publish the results.

Nomenclature

bradius of seal (m)
cconcentration of tracer gas
CFflow coefficient [=W/Ωb]
Cp,apressure coefficient in annulus [=pa p ¯ aρΩ2b2]
Cw,0non-dimensional sealing flow rate [=/μb]
Ggap ratio [=S/b]
Gcseal-clearance ratio [=sc,ax/b]
mass flow rate (kg/s)
kaempirical constant
MMach number
pstatic pressure (Pa)
rradius (m)
Rewaxial Reynolds number in annulus based on radius [=ρWb/μ]
Reφrotational Reynolds number [=ρΩb2/μ]
scseal clearance (m)
Saxial clearance between rotor and stator (m)
Ubulk mean radial seal velocity [=0/2πρbsc]
Waxial velocity in annulus (m/s)
zaxial coordinate in wheel-space (m)
εcconcentration effectiveness
Φ0non-dimensional sealing parameter [=U/Ωb]
Φminminimum value of Φ0 to seal wheel-space
Φmin'value of Φ0 when εc = 0.95
λTturbulent flow parameter [=Cw,0 Reϕ−0.8]
μdynamic viscosity (kg/ms)
ρdensity (kg/m3)
Ωangular speed of rotating disc (rad/s)
Subscripts
aannulus
axaxial
minminimum
radradial
0sealing flow
sstator surface

References

  1. Owen, J.M. Prediction of Ingestion through Turbine Rim Seals—Part II: Externally Induced and Combined Ingress. ASME J. Turbomach. 2011, 133, 031006. [Google Scholar] [CrossRef]
  2. Owen, J.M. Prediction of Ingestion through Turbine Rim Seals—Part I: Rotationally Induced Ingress. ASME J. Turbomach. 2011, 133, 031005. [Google Scholar] [CrossRef]
  3. Patinios, M.; Scobie, J.A.; Sangan, C.M.; Owen, J.M.; Lock, G.D. Measurements and Modeling of Ingress in a New 1.5-Stage Turbine Research Facility. ASME J. Eng. Gas Turbines Power 2016, 139, 012603. [Google Scholar] [CrossRef]
  4. Childs, P.R.N. Rotating Flow; Butterworth-Heinemann: Oxford, UK, 2011. [Google Scholar]
  5. Scobie, J.A.; Sangan, C.M.; Owen, J.M.; Lock, G.D. Review of Ingress in Gas Turbines. ASME J. Eng. Gas Turbines Power 2016, 138, 120801. [Google Scholar] [CrossRef]
  6. Scobie, J.A.; Hualca, F.P.; Sangan, C.M.; Lock, G.D. Egress Interaction through Turbine Rim Seals. In Proceedings of the ASME Turbo Expo 2017: Turbomachinery Technical Conference and Exposition, Charlotte, NC, USA, 26–30 June 2017. Paper No. GT2017-64632. [Google Scholar] [CrossRef]
  7. Scobie, J.A. An Experimental Study of Gas Turbine Rim Seals. Ph.D. Thesis, University of Bath, Bath, UK, May 2014. [Google Scholar]
  8. Owen, J.M.; Rogers, R.H. Flow and Heat Transfer in Rotating-Disc Systems, Vol. 1: Rotor-Stator Systems; Research Studies Press LTD: Taunton, Somerset, UK, 1989. [Google Scholar]
  9. Daily, J.W.; Nece, R.E. Chamber Dimension Effects on Induced Flow and Frictional Resistance of Enclosed Rotating Discs. J. Basic Eng. 1960, 82, 217–232. [Google Scholar] [CrossRef]
  10. Scobie, J.A.; Hualca, F.P.; Patinios, M.; Sangan, C.M.; Owen, M.J.; Lock, G.D. Re-Ingestion of Upstream Egress in a 1.5-Stage Gas Turbine Rig. In Proceedings of the ASME Turbo Expo 2017: Turbomachinery Technical Conference and Exposition, Charlotte, NC, USA, 26–30 June 2017. Paper No. GT2017-64620. [Google Scholar] [CrossRef]
  11. Sangan, C.M.; Pountney, O.J.; Zhou, K.; Wilson, M.; Owen, J.M.; Lock, G.D. Experimental Measurements of Ingestion through Turbine Rim Seals—Part 1: Externally-Induced Ingress. ASME J. Turbomach. 2013, 135, 021012. [Google Scholar] [CrossRef]
  12. Zhou, K.; Wood, S.N.; Owen, J.M. Statistical and Theoretical Models of Ingestion through Turbine Rim Seals. ASME J. Turbomach. 2012, 135, 021014. [Google Scholar] [CrossRef]
  13. Scobie, J.A.; Sangan, C.M.; Owen, J.M.; Wilson, M.; Lock, G.D. Experimental Measurements of Hot Gas Ingestion Through Turbine Rim Seals at Off-Design Conditions. IMechE J. Power Energy 2014, 228, 491–507. [Google Scholar] [CrossRef] [Green Version]
Figure 1. A typical gas turbine stage; rim-seals, highlighted in black, are shown inset (red highlight: stationary discs; blue highlight: rotating discs).
Ijtpp 02 00021 g001
Figure 2. Flow structure expected in the upstream and downstream wheel-spaces (based on Patinios et al. [3]).
Ijtpp 02 00021 g002
Figure 3. Component view of the experimental facility (some of the inlet pipes and the annulus casing are removed for the purpose of clarity); details of the stage and salient instrumentation are shown inset.
Ijtpp 02 00021 g003
Figure 4. Non-dimensional pressure coefficient in the annulus, Cp,a, at locations A1 and A4 (CF = 0.29, Reφ = 7.2 × 10⁵, Φ0 = 0).
Ijtpp 02 00021 g004
Figure 5. Variation of the circumferential pressure asymmetry in the annulus with respect to the axial positions of the upstream and downstream seal clearance and vane and blade leading edge (L.E) and trailing edge (T.E) (CF = 0.29, Reφ = 7.2 × 10⁵, Φ0 = 0).
Ijtpp 02 00021 g005
Figure 6. Variation of ΔCp,a1/2 with flow coefficient CF in the annulus upstream of the rotor blades and selected circumferential distributions of non-dimensional pressure coefficient Cp,a at the operating point (Reφ = 7.2 × 10⁵, Φ0 = 0).
Ijtpp 02 00021 g006
Figure 7. Variation of ΔCp,a1/2 with flow coefficient CF in the annulus downstream of the rotor blades and selected circumferential distributions of non-dimensional pressure coefficient Cp,a at the operating point (Reφ = 7.2 × 10⁵, Φ0 = 0).
Ijtpp 02 00021 g007
Figure 8. Effect of sealing flow rate on radial distribution of effectiveness for the single radial-clearance seal in the upstream (left) and downstream (right) wheel-space—circles: stator-wall measurements; diamonds: rotating-core measurements (Reφ = 7.2 × 10⁵, CF = 0.29).
Ijtpp 02 00021 g008
Figure 9. Variation of εc with Φ0 for single radial-clearance seal in the upstream (blue symbols) and downstream wheel-space (red symbols) at r/b = 0.958 (dark symbols) and 0.85 (light symbols) (CF = 0.29) (symbols denote data; lines are theoretical curves).
Ijtpp 02 00021 g009
Figure 10. Effect of flow coefficient CF on the variation of εc with Φ0 for the single radial-clearance seal in the upstream wheel-space (symbols denote data; black lines are theoretical curves; red dashed lines indicate the values of Φmin′) (Reφ = 7.2 × 10⁵, r/b = 0.958).
Ijtpp 02 00021 g010
Figure 11. Effect of flow coefficient CF on the variation of εc with Φ0 for the single radial-clearance seal in the downstream wheel-space (symbols denote data; lines are theoretical curves red dashed lines indicate the values of Φmin′) (Reφ = 7.2 × 10⁵, r/b = 0.958).
Ijtpp 02 00021 g011
Figure 12. Effect of flow coefficient CF on Φmin′ and ΔCp,a1/2 for the single radial-clearance seal in the upstream wheel-space at r/b = 0.958 and annulus at location A2 (Reφ = 7.2 × 10⁵) (blue, dashed line denotes correlation based on Equation (4) and ka = 1.55).
Ijtpp 02 00021 g012
Figure 13. Effect of flow coefficient CF on Φmin′ and ΔCp,a1/2 for the single radial-clearance seal in the downstream wheel-space at r/b = 0.958 and annulus at location A3 (Reφ = 7.2 × 10⁵).
Ijtpp 02 00021 g013
Table 1. Test rig operating conditions.
ParametersDisc Speed (rpm)
30004000
Rotational Reynolds Number (Reφ)7.2 × 1051.0 × 106
Axial Reynolds Number (Rew)2.1 × 1052.9 × 105
Flow Coefficient (CF)0.29
Vane Exit Mach Number (M)0.230.32

