Article

CFD Investigation of Sediment Transport Effects on Pelton Nozzle Performance Using an Eulerian Multiphase Approach †

by
Francesco Nascimben
*,
Giacomo Zanetti
and
Giovanna Cavazzini
Department of Industrial Engineering, University of Padova, Via Venezia 1, 35131 Padova, Italy
*
Author to whom correspondence should be addressed.
This paper is an extended version of our paper published in the Proceedings of the 16th European Turbomachinery Conference, Hannover, Germany, 24–28 March 2025.
Int. J. Turbomach. Propuls. Power 2026, 11(2), 25; https://doi.org/10.3390/ijtpp11020025
Submission received: 25 February 2026 / Revised: 27 April 2026 / Accepted: 11 May 2026 / Published: 1 June 2026

Abstract

Sediment management represents a key challenge for hydropower plants, as it requires balancing river continuity preservation with the mitigation of erosion-related damage. To identify admissible sediment loads that ensure acceptable wear levels, reliable numerical tools are required for the prediction of multiphase flow behavior under different sediment transport conditions. In this framework, the present study applies a steady-state inhomogeneous Eulerian approach to investigate the three-phase flow (water–air–sediment) inside a Pelton nozzle under different needle-opening conditions and high sediment volume fractions. The CFD model is first validated under clear water–air conditions by comparing the predicted discharge coefficient with the literature data for the same nozzle geometry. Subsequently, the validated framework is extended to sediment-laden configurations, and the resulting injector performance and jet characteristics are compared with the corresponding clear-water case. The results highlight that the presence of sediments leads to increased pressure losses and modifications of the jet structure, which may adversely affect the hydraulic performance of the downstream Pelton runner.

1. Introduction

Climate change is increasingly impacting hydrological systems worldwide, leading to glacier melting and enhanced erosion phenomena, which are expected to increase sediment loads in rivers over the coming decades [1,2,3]. This gradual alteration of the environmental balance [4,5] presents additional challenges for hydropower plants, which must develop strategies to manage sediment flows. A balance must be found between fully blocking sediment upstream—reducing erosion but potentially affecting coastal sediment transport [6,7,8], altering sediment properties [9,10], and impacting aquatic life [11,12,13]—and allowing sediments to flow freely through the plant [14,15,16], which minimizes environmental impact but exposes hydropower components to wear, increases maintenance frequency, and reduces energy production and profitability [6].
Among hydraulic machinery types, Pelton turbines are particularly susceptible to erosion, despite being less widespread than Francis turbines [17]. Experimental studies and literature reviews have documented the damaging effects of solid particles on both Pelton nozzles [18,19,20] and buckets [21,22,23,24,25,26,27,28], resulting in reduced turbine efficiency and decreased hydropower output. Nozzle opening has been identified as a key factor influencing erosion patterns: full openings typically generate circumferential ripples on the needle surface, whereas partial openings lead to deep grooves at the needle tip due to combined particle impingement and hydrodynamic cavitation [18,19]. For Pelton buckets, experimental investigations have characterized erosion zones, highlighting the roles of particle concentration and size: coarse particles affect the splitter and depth regions, while fine particles damage the outlet zone [21,22,23,24,25]. Chitrakar et al. [18] and Zhang [27] reported that erosion-induced geometric changes can reduce turbine efficiency by up to 20% relative to the baseline geometry.
To mitigate erosion and extend turbine life, higher-hardness materials [29,30,31,32], coatings, and surface treatments [33,34,35,36] have been proposed. However, effective mitigation requires accurate predictive tools to identify performance changes and erosion hotspots. Computational Fluid Dynamics (CFD) plays a crucial role in simulating sediment-laden flows within hydraulic turbines.
One widely used approach is the Eulerian–Lagrangian method [37], modeling the fluid as a continuous phase and the solid particles as discrete. Combined with erosion models (e.g., Finnie [38], Tabakoff and Grant [39]), this approach has been applied extensively to Pelton turbines, investigating bucket erosion [40,41,42,43,44,45,46,47], nozzle erosion [48,49,50,51,52,53,54,55], and the influence of injector geometry [56]. While accurate, this method is computationally expensive and best suited for low sediment concentrations, limiting its industrial applicability.
An alternative is the Eulerian–Eulerian approach [37], in which all phases—including solids—are treated as continuous. This method is computationally efficient and capable of modeling high solid fractions, but requires careful tuning and lacks widely validated erosion models, limiting its use in hydraulic machinery studies. To date, only one paper reporting the application of Eulerian–Eulerian model to study the sediment flow through Pelton nozzles has been published according to the Authors’ knowledge. Han et al. [57] have analyzed low-solid-content sediment-laden flows in a Pelton turbine using this approach, revealing nozzle discharge imbalances and reduced turbulence at bifurcations. However, their model did not account for wall-friction effects in the solid phase, leaving additional pressure losses unmodeled.
The present study aims to address these limitations by investigating sediment-laden flows in a Pelton nozzle under different opening conditions and high sediment volume fraction (10%). Solid-phase interactions with the nozzle walls are modeled using no-slip boundary conditions, making this the first study to combine high sediment concentrations with wall interaction modeling in a Pelton nozzle [58]. The three-phase flow (air–water–sediment) is simulated using an inhomogeneous Eulerian–Eulerian framework coupled with the Kinetic Theory of Granular Flow (KTGF) to model interactions between particles, while turbulence phenomena are reproduced using the homogeneous k–ω SST model.
The numerical setup is first validated in clear water–air conditions by comparing predicted discharge coefficients with the literature data for the same nozzle geometry. Subsequently, sediment-laden simulations are performed on the same geometry, and injector performance and jet morphology are analyzed and compared with the clear-water case to assess the impact of sediment presence on nozzle efficiency.
Section 2 describes the numerical setup, including the mathematical model, operating conditions, and grid generation. Section 3 presents and compares results for both clear-water and sediment-laden cases, and Section 4 summarizes the main findings and outlines potential future research directions.

2. Materials and Methods

2.1. Nozzle Geometry and Numerical Grid

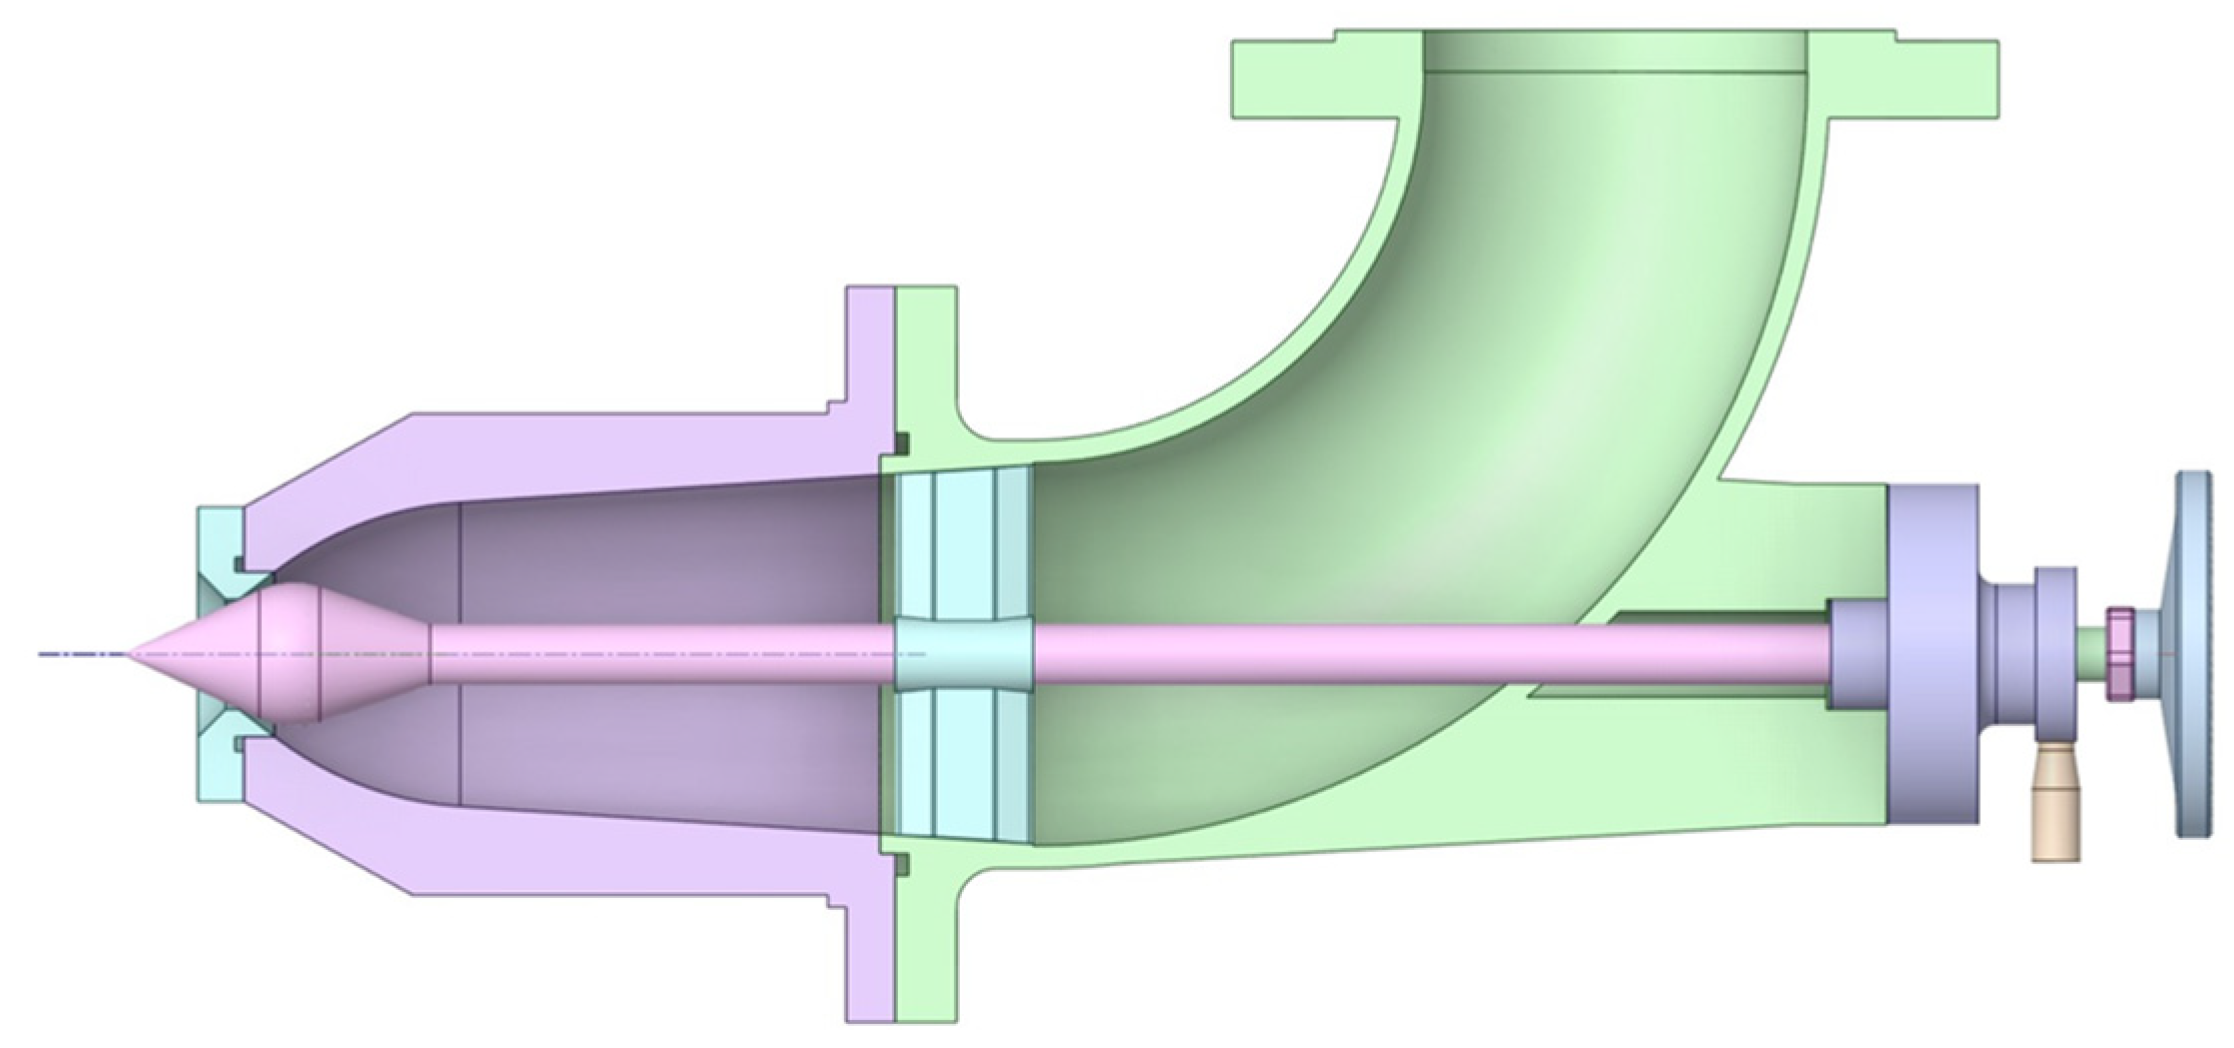
All numerical simulations were performed considering the Pelton nozzle installed at the Hydropower Laboratory of the Department of Industrial Engineering of the University of Padova (Figure 1). The main geometric parameters of the injector are: nozzle outlet diameter d 0 = 36   m m , inlet pipe diameter D = 125   m m , needle tip angle α N E E D L E = 50 °   and nozzle seat angle α S E A T = 75 ° . Since the present investigation represents a first attempt to simulate sediment-laden flows at relatively high solid volume fractions within this configuration, several geometric simplifications were introduced in order to reduce model complexity while preserving the relevant flow physics. In particular:
  • The upstream fins and pipe curvature were neglected;
  • The inlet pipe was extended to a total length L P I P E = 1250   m m (10D) to ensure fully developed flow conditions upstream of the nozzle;
  • A cylindrical extension with length and diameter equal to 360 mm (10 d 0 ) was added downstream of the nozzle exit in order to minimize the influence of outlet boundary conditions on jet development;
  • Owing to the geometrical symmetry of the system with respect to the z-y plane, only half of the fluid domain was modeled.
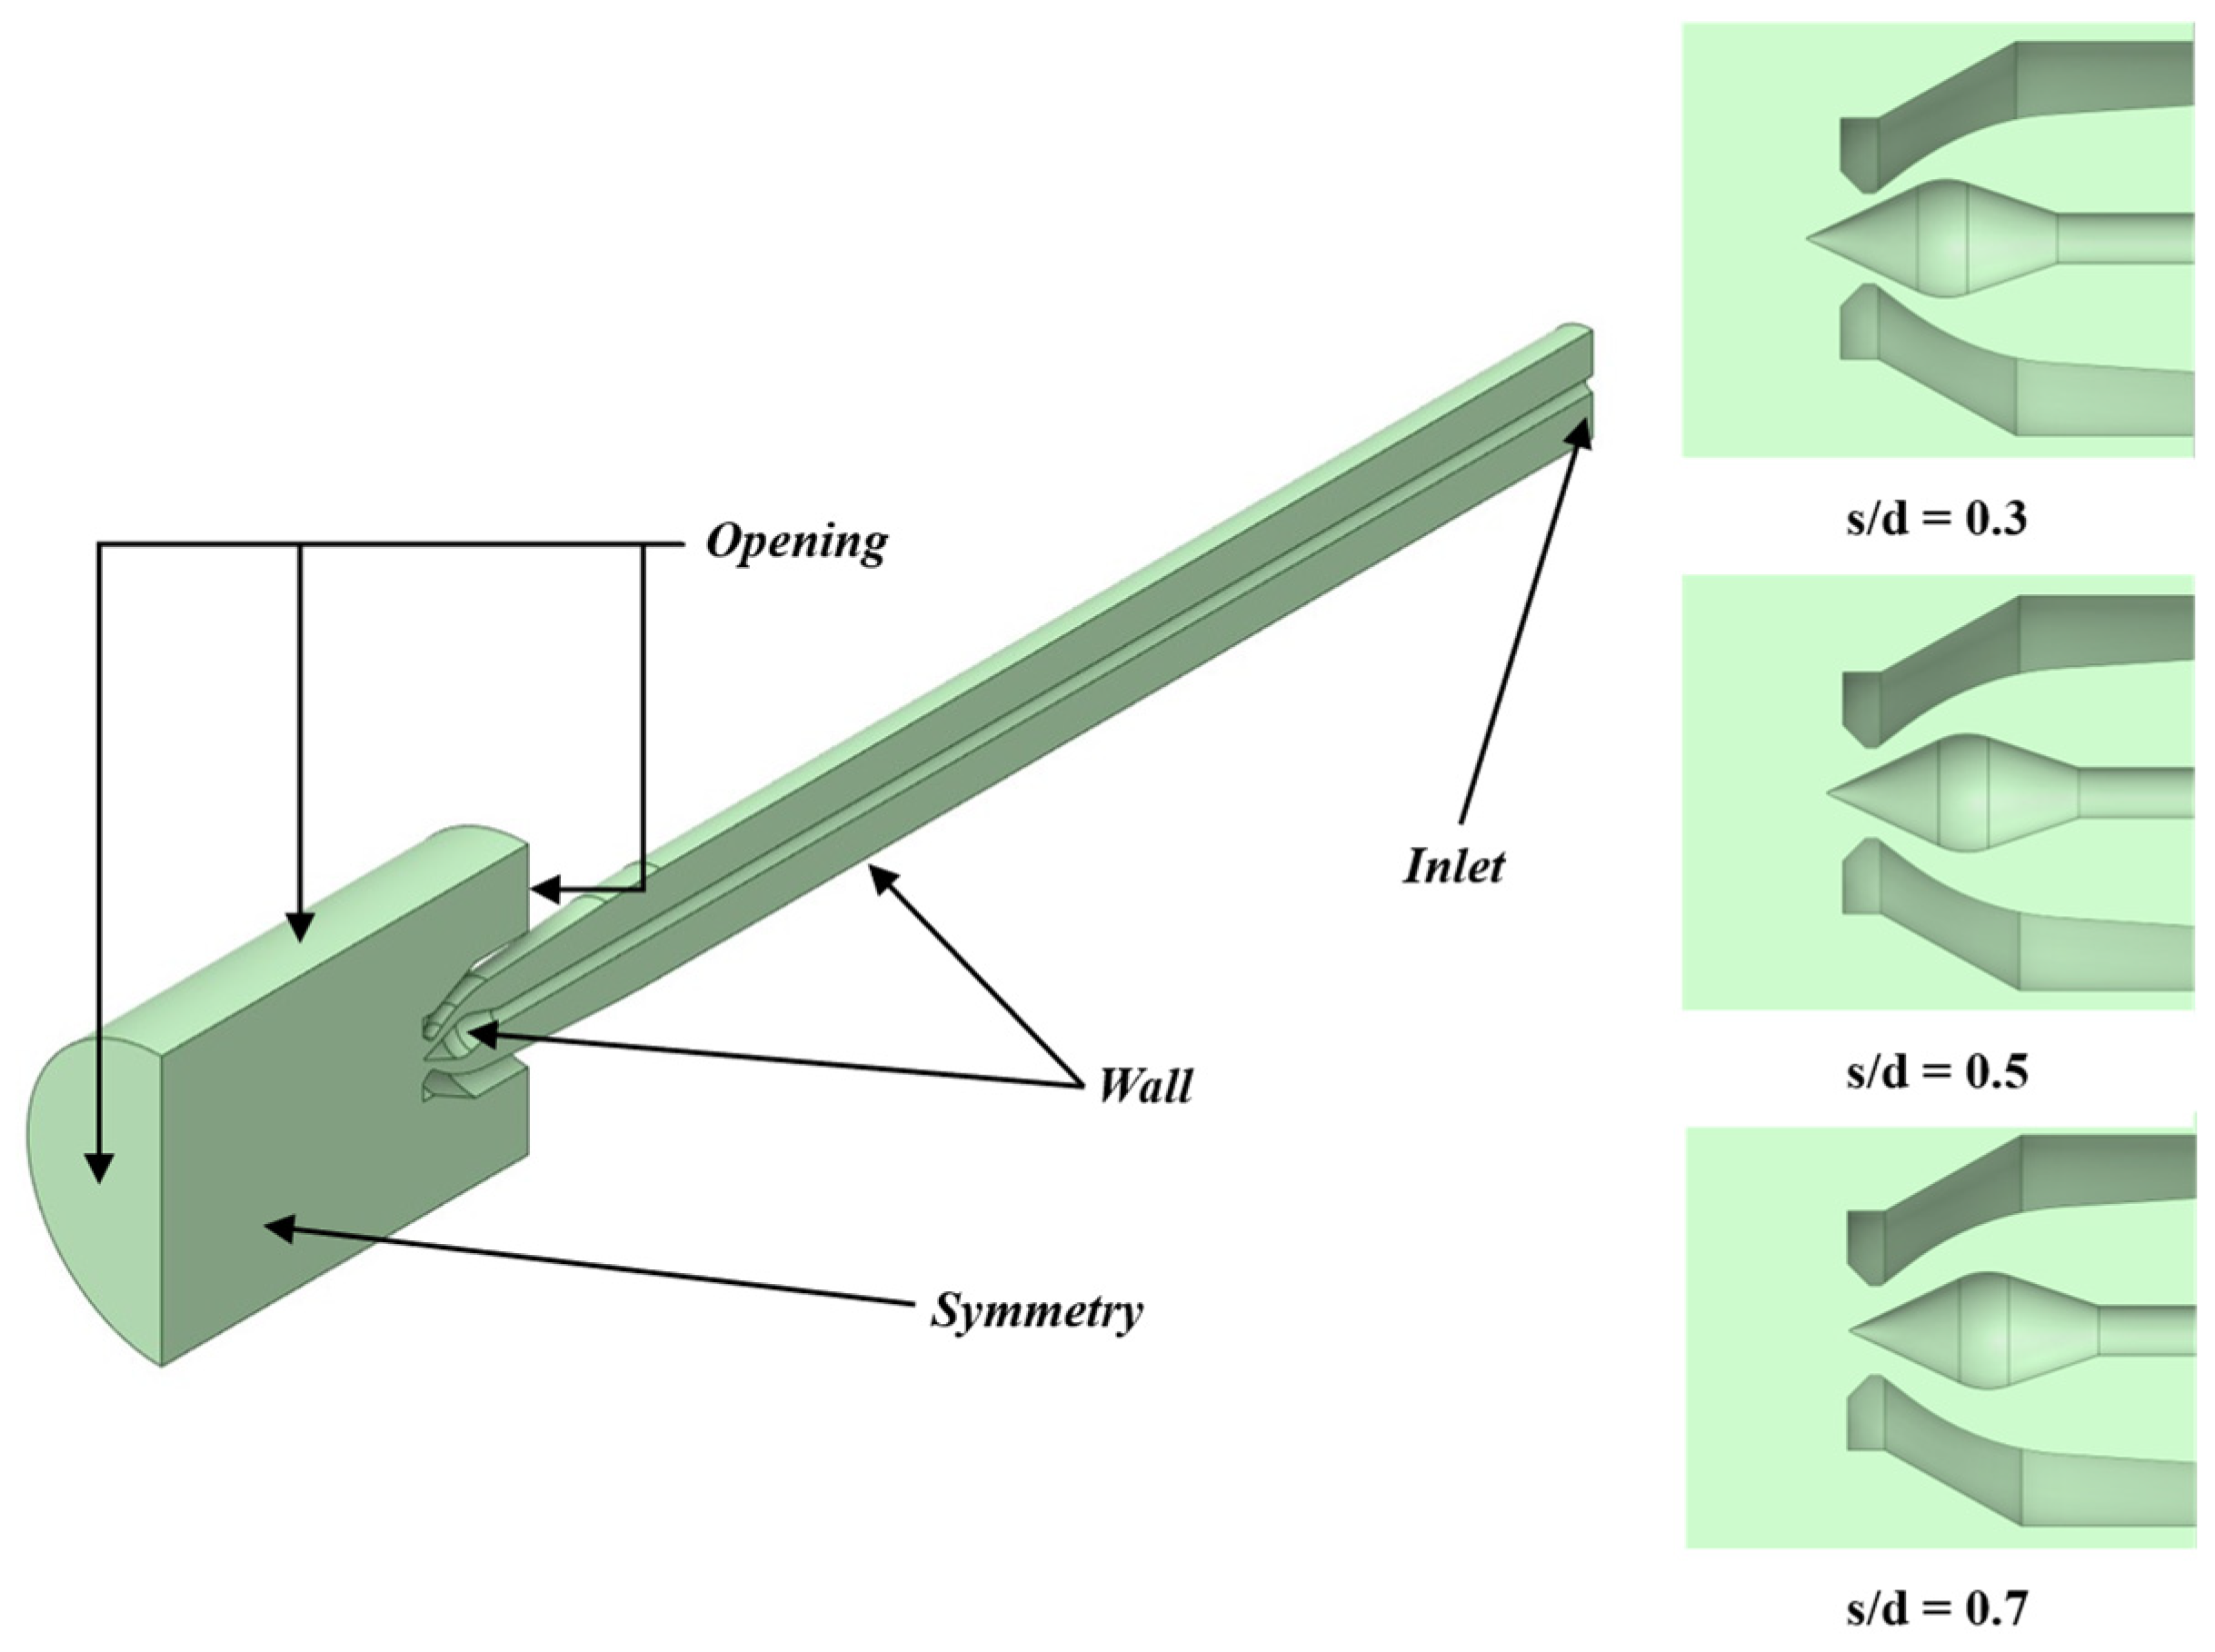
The resulting computational domain is shown in Figure 2.
Three different opening conditions were analyzed (Figure 2), defined as the ratio between the needle stroke s and the nozzle diameter d 0 . This parameterization allows a consistent comparison of injector performance under different operating conditions and enables the assessment of sediment influence at partial and large openings.
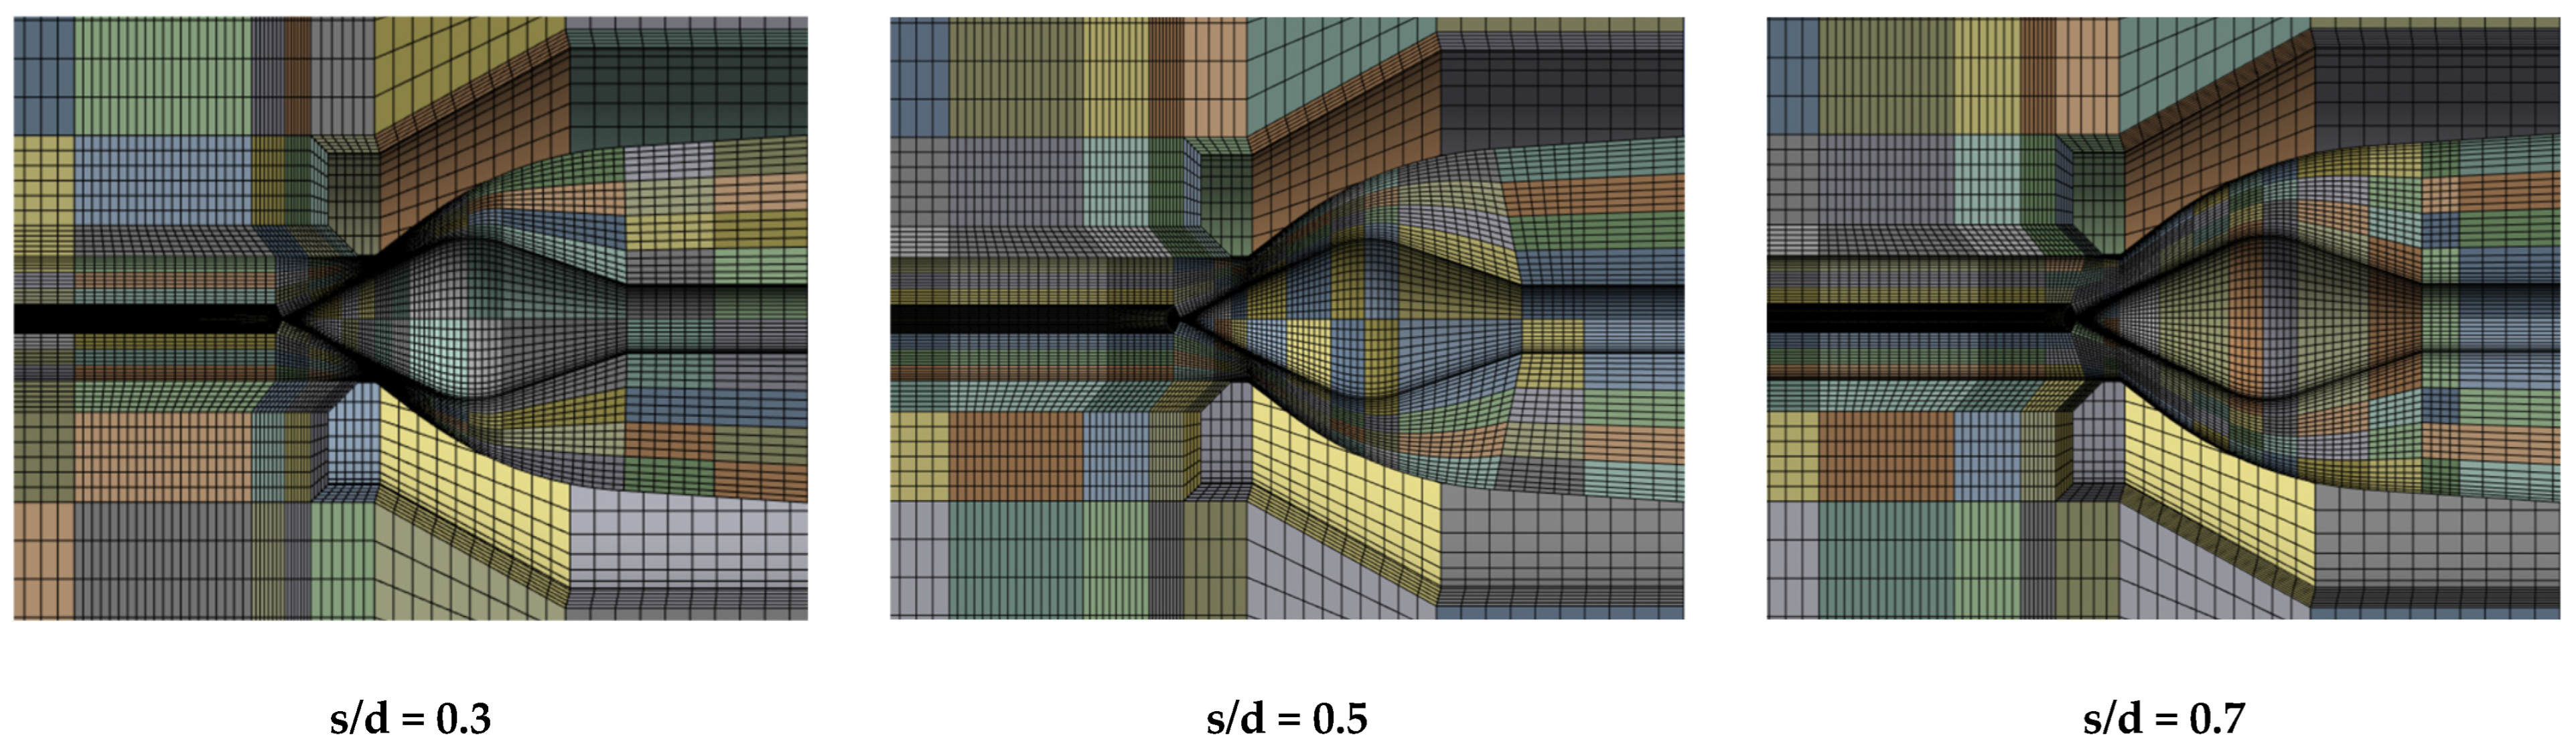
For each opening configuration, three unstructured hexahedral-dominant meshes (coarse, medium, and fine) were generated. The number of elements was approximately doubled between successive grid levels in order to apply the grid convergence methodology proposed by Celik et al. [59]. Representative mesh details are shown in Figure 3, while the complete mesh statistics are reported in Table 1, including the number of nodes and elements, as well as the average y + values at the nozzle outlet.

2.2. Numerical Model

A steady inhomogeneous Eulerian approach was adopted to simulate the three-phase flow occurring within the investigated Pelton nozzle configurations.
It is well known that transient CFD simulations generally provide a more detailed representation of complex multiphase phenomena compared to steady-state analyses.
However, due to the limited availability of experimental data concerning sediment-laden flows in hydraulic machinery, even Eulerian–Lagrangian approaches may suffer from limited predictive accuracy, as they require appropriate tuning of empirical coefficients.
This limitation becomes even more pronounced for unsteady simulations based on the Eulerian framework, which has only rarely been applied to sediment-laden flows.
The objective of the present study is to propose a multiphase model suitable for rapid CFD assessments of Pelton turbines operating under sediment transport conditions, providing timely indications of flow behavior and potential erosion patterns without relying on computationally expensive Lagrangian simulations.
In this context, adopting an unsteady Eulerian formulation would significantly increase computational cost compared to a steady approach. Therefore, a steady-state framework was selected in order to simplify the numerical procedure and reduce computational time, pending the availability of dedicated experimental validation data.
With this intention, all the simulations have been performed using Ansys CFX 2024 R2, where the continuity equations ruling steady flows involving no source terms and phase changes are defined relying on the following expression:
· α i ρ i v i = 0
where α i denote the i-th phase volume fraction, ρ i denote the i-th phase density and v i denote the i-th phase velocity. For every cell involved in the three-phase flow, the sum of the single-phase volume fractions has to be equal to 1 in order to guarantee the volume fraction conservation:
i = 1 N p α i = 1
where N p denotes the number of phases. The momentum conservation equation for the steady three-phase flow is defined by the following expression:
· α i ρ i v i v i = α i p + · τ ̿ i + α i ρ i g + M i
where p is the pressure value, τ ̿ i is the stress–strain tensor associated with the i-th phase, g denotes the gravity acceleration vector and M i represents the interphase force acting on the i-th phase.
The interphase transfer between water and air was modeled using the Free Surface model, with the surface tension coefficient set to 0.072 N/m. The drag coefficient adopted for the evaluation of the interfacial drag at the water–air interface was fixed at 0.44 [60].
With reference to the interaction between the sediment phase and the surrounding fluids (water and air), the Particle Model was employed. The interphase momentum exchange accounts for the drag force F D R A G , lift force F L I F T , virtual mass force F V M , and turbulence dispersion force F T D . The drag coefficient K i s , representing the interaction between the i-th fluid phase and the solid phase (subscript s), was evaluated according to the Gidaspow model [61]. The lift and virtual mass force coefficients were both set equal to 0.5, in accordance with the ANSYS CFX 2024 R2 recommendations for spherical particles [60].
The turbulence dispersion force F T D was modeled using the Favre-averaged formulation [62], which allows accounting for the attenuation of turbulence induced by the presence of solid particles. The turbulence dispersion coefficient C T D was set equal to 1.
To account for particle–particle collisions and the motion of solid particles within the solid-phase shear stress tensor τ ̿ s , the Kinetic Theory of Granular Flow (KTGF) was adopted for the solid phase. Originally proposed by Gidaspow et al. [63,64], this theory is conceptually derived from the Kinetic Theory of Ideal Gases. Within this framework, solid particles suspended in a fluid are treated as slightly inelastic, non-perfectly rigid spheres that interact through collisions during their motion. The kinetic energy associated with particle velocity fluctuations is described through the so-called granular temperature Θ s , defined as:
Θ s = 1 3 u s , i u s , i
where u s , i denotes the i-th component of the fluctuating solid particle velocity.
In principle, the granular temperature can be obtained by solving an additional transport equation. However, in ANSYS CFX 2024 R2, only the simplified algebraic formulation proposed by Gidaspow [63] is available.
The evaluation of the granular temperature is required for the computation of the solid pressure, p s , which contributes to the solid stress–strain tensor. According to Gidaspow’s formulation [63,64], the solid pressure is expressed as:
p s α s = ρ s Θ s + 2 ρ s 1 + e s s α s 2 g 0 , s s Θ s
where α s denotes the solid phase volume fraction, ρ s denotes the solid phase density, e s s is the restitution coefficient (set equal to 0.9 in all the simulated configurations [60]) and g 0 , s s is the radial distribution function, defined according to Gidaspow et al. [61] model as follows:
g 0 , s s = 1 α s α s , m a x 1 3 1
where α s , m a x represents the solid phase packing limit, i.e., the maximum volume fraction that can be reached by the solid phase before starting to behave as an “incompressible” phase. Its value was set equal to 0.63 in all simulations involving sediments, in accordance with the recommendation provided in the CFX User Guide [60].
Particle–particle collision effects are incorporated within the KTGF framework through the evaluation of the solid viscosity, which is generally expressed as the sum of three contributions: kinetic, collisional, and frictional. However, in ANSYS CFX 2024 R2, only the collisional viscosity term μ s , c o l is considered. This term is evaluated according to Gidaspow’s model [61], reported below:
μ s , c o l = 4 5 α s 2 ρ s d p g 0 , s s 1 + e s s Θ s π 1 2 g 0 , s s
where d p denotes the particle diameter. The other viscosity contribution to the solid phase stress–strain tensor is defined by the solid phase bulk viscosity λ s , defined by the following expression following Lun et al. [65] model:
λ s = 4 3 α s 2 ρ s d p g 0 , s s 1 + e s s Θ s π 1 2
To account for turbulence effects, the steady-state homogeneous k–ω SST model (proposed for the first time by Menter [66] in 1993) was employed. The governing transport equations are:
x i ρ k u i = x i Γ k k d x J   + G k + G b Y k + S k
x i ρ ω u i = x i Γ ω ω d x J   + G ω + G ω b Y ω + S ω
where k denotes the turbulent kinetic energy and ω the specific dissipation rate. The terms G k and G ω represent the production of k and ω , respectively; Γ k and Γ ω are their effective diffusivities; Y k and Y ω account for dissipation; S k and S ω are source terms; and G b and G ω b include buoyancy effects.
A standard wall function was adopted to model the near-wall region, yielding the average y + values reported in Table 1. These values fall within the validity range recommended by Ansys CFX 2024 R2 for the selected wall treatment ( 30 y + 300 ) [60]. Gravitational effects on the mixture phases were included by imposing a gravitational acceleration of g = 9.81   m / s 2 along the y -direction.
Regarding the numerical setup, a High Resolution advection scheme was used for the continuity and momentum equations, whereas a First-Order scheme was applied to the turbulence equations. Convergence was considered achieved when residuals dropped below 10−4 RMS for all equations, except for the volume fraction equations, for which a threshold of 10−3 RMS was adopted due to the complexity of the multiphase system. Similar convergence criteria for high-concentration slurry flows in straight pipes have been reported by Kaushal et al. [67], Li et al. [68], and Liu et al. [69].
In addition to residual monitoring, convergence was also assessed based on the stabilization of key integral quantities (nozzle head and flow rate), which were observed to reach stable values in all the considered cases.

2.3. Boundary Conditions

A velocity-inlet boundary condition was applied at the domain inlet, specifying both the inlet velocity (based on the flow rate conditions reported in Table 1) and the volume fractions of the three phases. In particular, for simulations involving a solid-phase inlet volumetric concentration of 10%, the volume fractions were set as follows: α s = 0.1 for the solid phase, α w = 0.9 for water, and α a = 0.0 for air.
For the initial simulations under pure water–air conditions, no solid phase was specified, and the water volume fraction at the inlet was set to 1.
At the three outlet surfaces, an opening boundary condition was applied, with the opening pressure set to 0 Pa and a zero-gradient condition imposed for both volume fractions and turbulence quantities. A no-slip wall condition was enforced at all domain walls for all three phases, including the solid phase.
Finally, a symmetry condition was applied along the system’s symmetry plane, coinciding with the z–y plane.
A graphical representation of the boundary conditions adopted for the Pelton nozzle simulations is provided in Figure 2.

2.4. Phase Properties

For each of the three materials considered in the simulations, the density and dynamic viscosity values were specified (Table 2). Since viscosity is inherently a fluid property, defining a viscosity for the solid phase required special consideration. The literature provides several correlations to compute the dynamic viscosity of a solid–liquid mixture, μ m , expressed as:
μ m = α s μ s + 1 α s μ l
where μ s and μ l are the dynamic viscosities of the solid and liquid phases, respectively. Among these correlations, the one proposed by Thomas et al. [70] was adopted:
μ m μ l = 1 + 2.5 α s + 10.05 α s 2 + 0.00273 e 16.6 α s
This formulation allows the determination of the mixture dynamic viscosity once the solid-phase volume fraction and liquid-phase viscosity are known. By inverting Equation (11), the dynamic viscosity of the solid phase can then be calculated. For α s = 0.1 and μ l = 0.00089   P a · s , the resulting solid-phase dynamic viscosity is μ s = 0.00414   P a · s .
A solid-phase density of ρ s = 2470   k g / m 3 was assigned based on quartz properties reported by Gao et al. [71]. The mean particle diameter of the sediments was set to 125 µm, following Neopane et al. [72] and Tomczyk et al. [73], who report this size as typical in hydropower plants.
The assumption of a constant particle diameter was made to align with the study’s objective of proposing a simplified numerical approach for simulating sediment flows in Pelton nozzles, avoiding additional complexity from particle size distributions.
This assumption is supported by previous numerical studies on Pelton nozzles operating under sediment-laden conditions, which similarly adopt a constant particle diameter (e.g., Huang et al. [45], Han et al. [46], Messa et al. [48]).
Finally, water and air properties were specified using the default values provided by Ansys CFX 2024 R2.

2.5. Mesh Sensitivity Study and Numerical Model Validation

Before performing the simulations of the Pelton injector under sediment-laden flow conditions, a grid convergence study was carried out following the method proposed by Celik et al. [59], considering the nozzle operating in pure water–air conditions.
For this sensitivity analysis, the discharge coefficient φ d was selected as the primary study parameter, since it represents a key characteristic of Pelton nozzle performance. It is defined as:
φ d = η N d j d 0 2
where η N is the nozzle efficiency and d j is the jet diameter. From Equation (13), it can be observed that, under ideal conditions ( η N = 1 ), this parameter corresponds to the ratio of the jet cross-sectional area A j to the nozzle outlet area A 0 for a given opening, indirectly providing information on the ratio between the jet and nozzle diameters. The nozzle efficiency was computed using:
η N = c j 2 g h
where c j is the jet velocity and h is the available head at the nozzle. Both d j and c j were determined by extracting an iso-clip of the water volume fraction α w 0.99 at a distance of 36 mm from the nozzle outlet along the z-axis (equal to d 0 ). The jet diameter was then calculated as:
d j = 4 A i s o c l i p π
The jet velocity c j was computed as the area-averaged axial velocity of water, while the available head h was obtained from the area-averaged inlet total pressure p i n l e t 0 as:
h = p i n l e t 0 ρ w g
The discharge coefficient results from the pure water–air simulations are reported in Table 3, alongside the corresponding mesh statistics and the grid convergence analysis, expressed in terms of the extrapolated value and the Grid Convergence Index (GCI). Since all fine mesh configurations yielded GCI values below 1%, the results were considered converged. This conclusion is further supported by the near-identical results obtained with medium and fine meshes across all opening conditions.
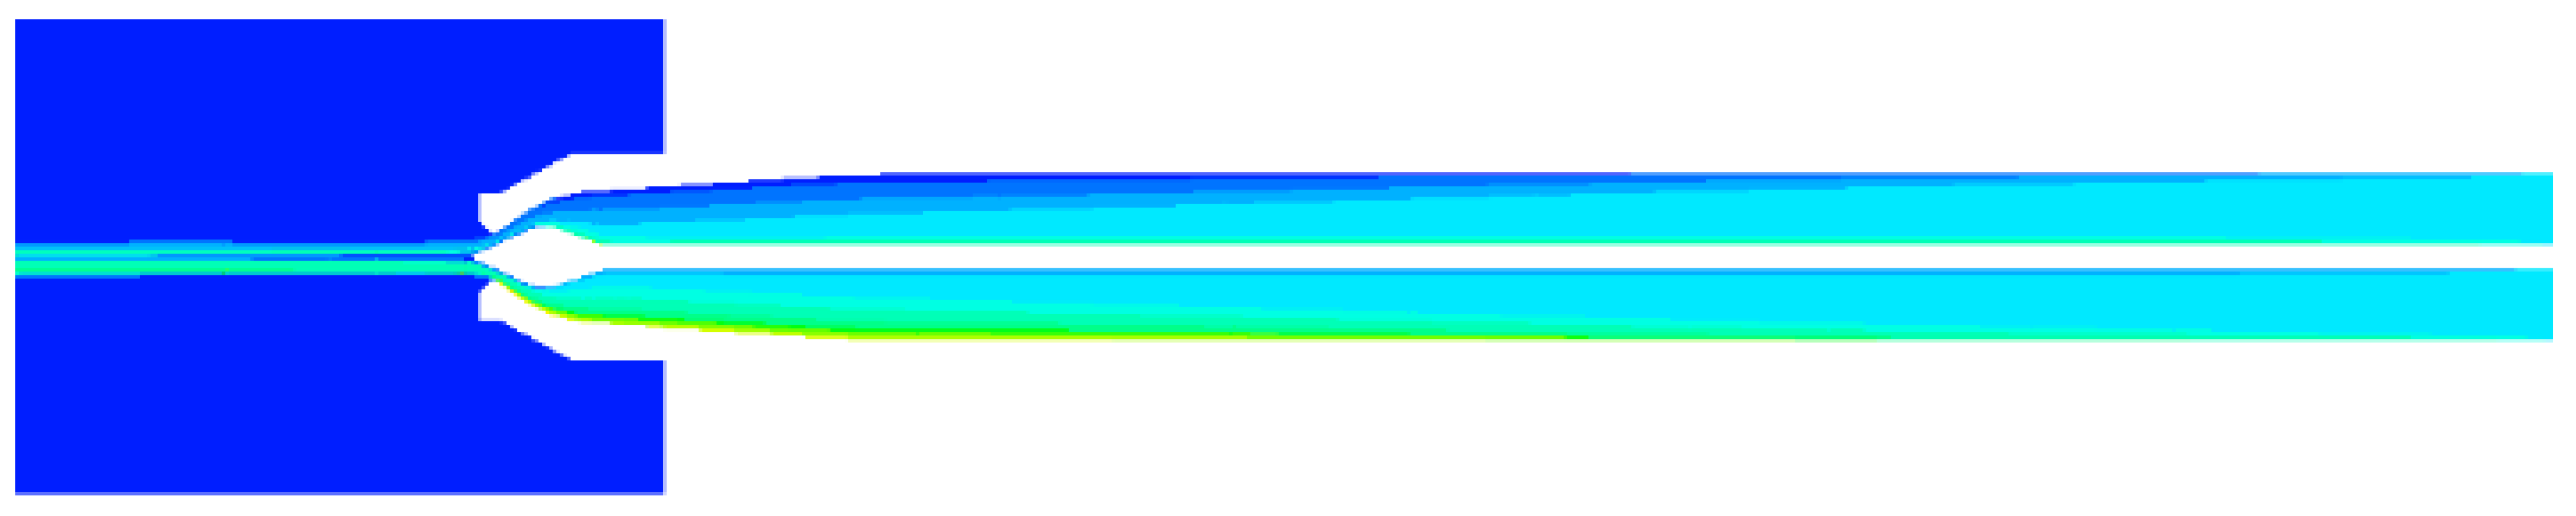
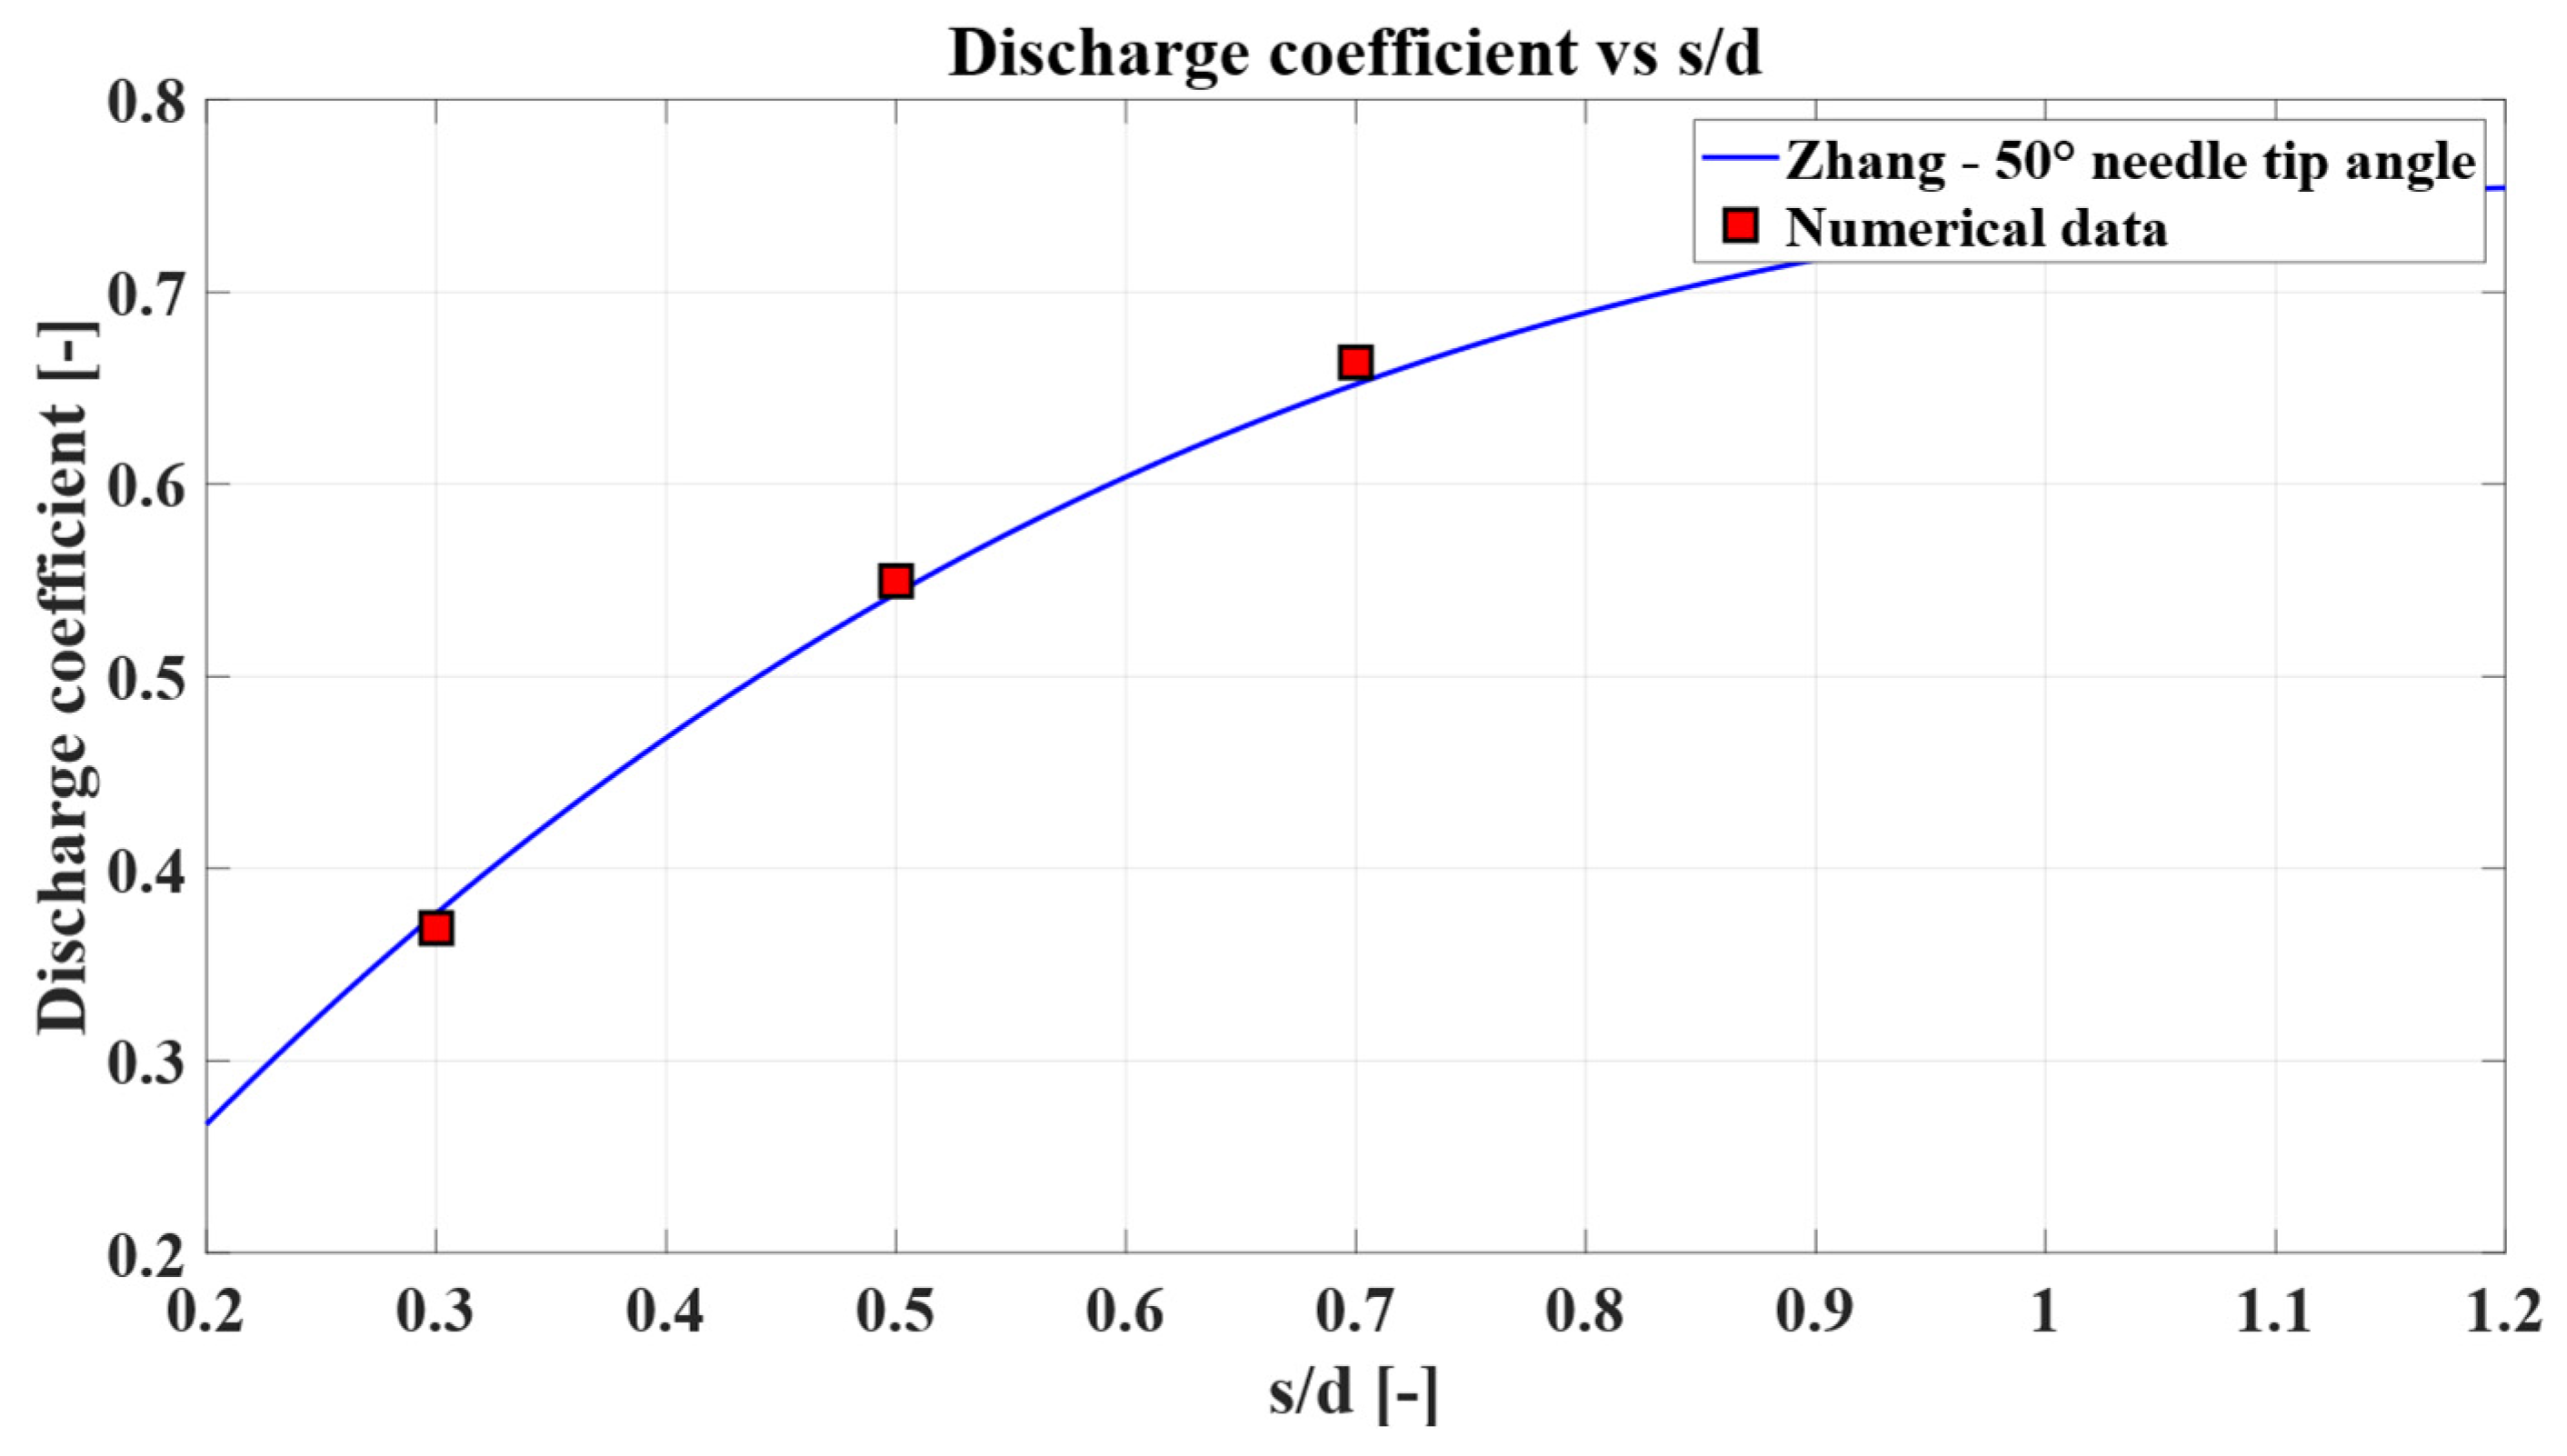
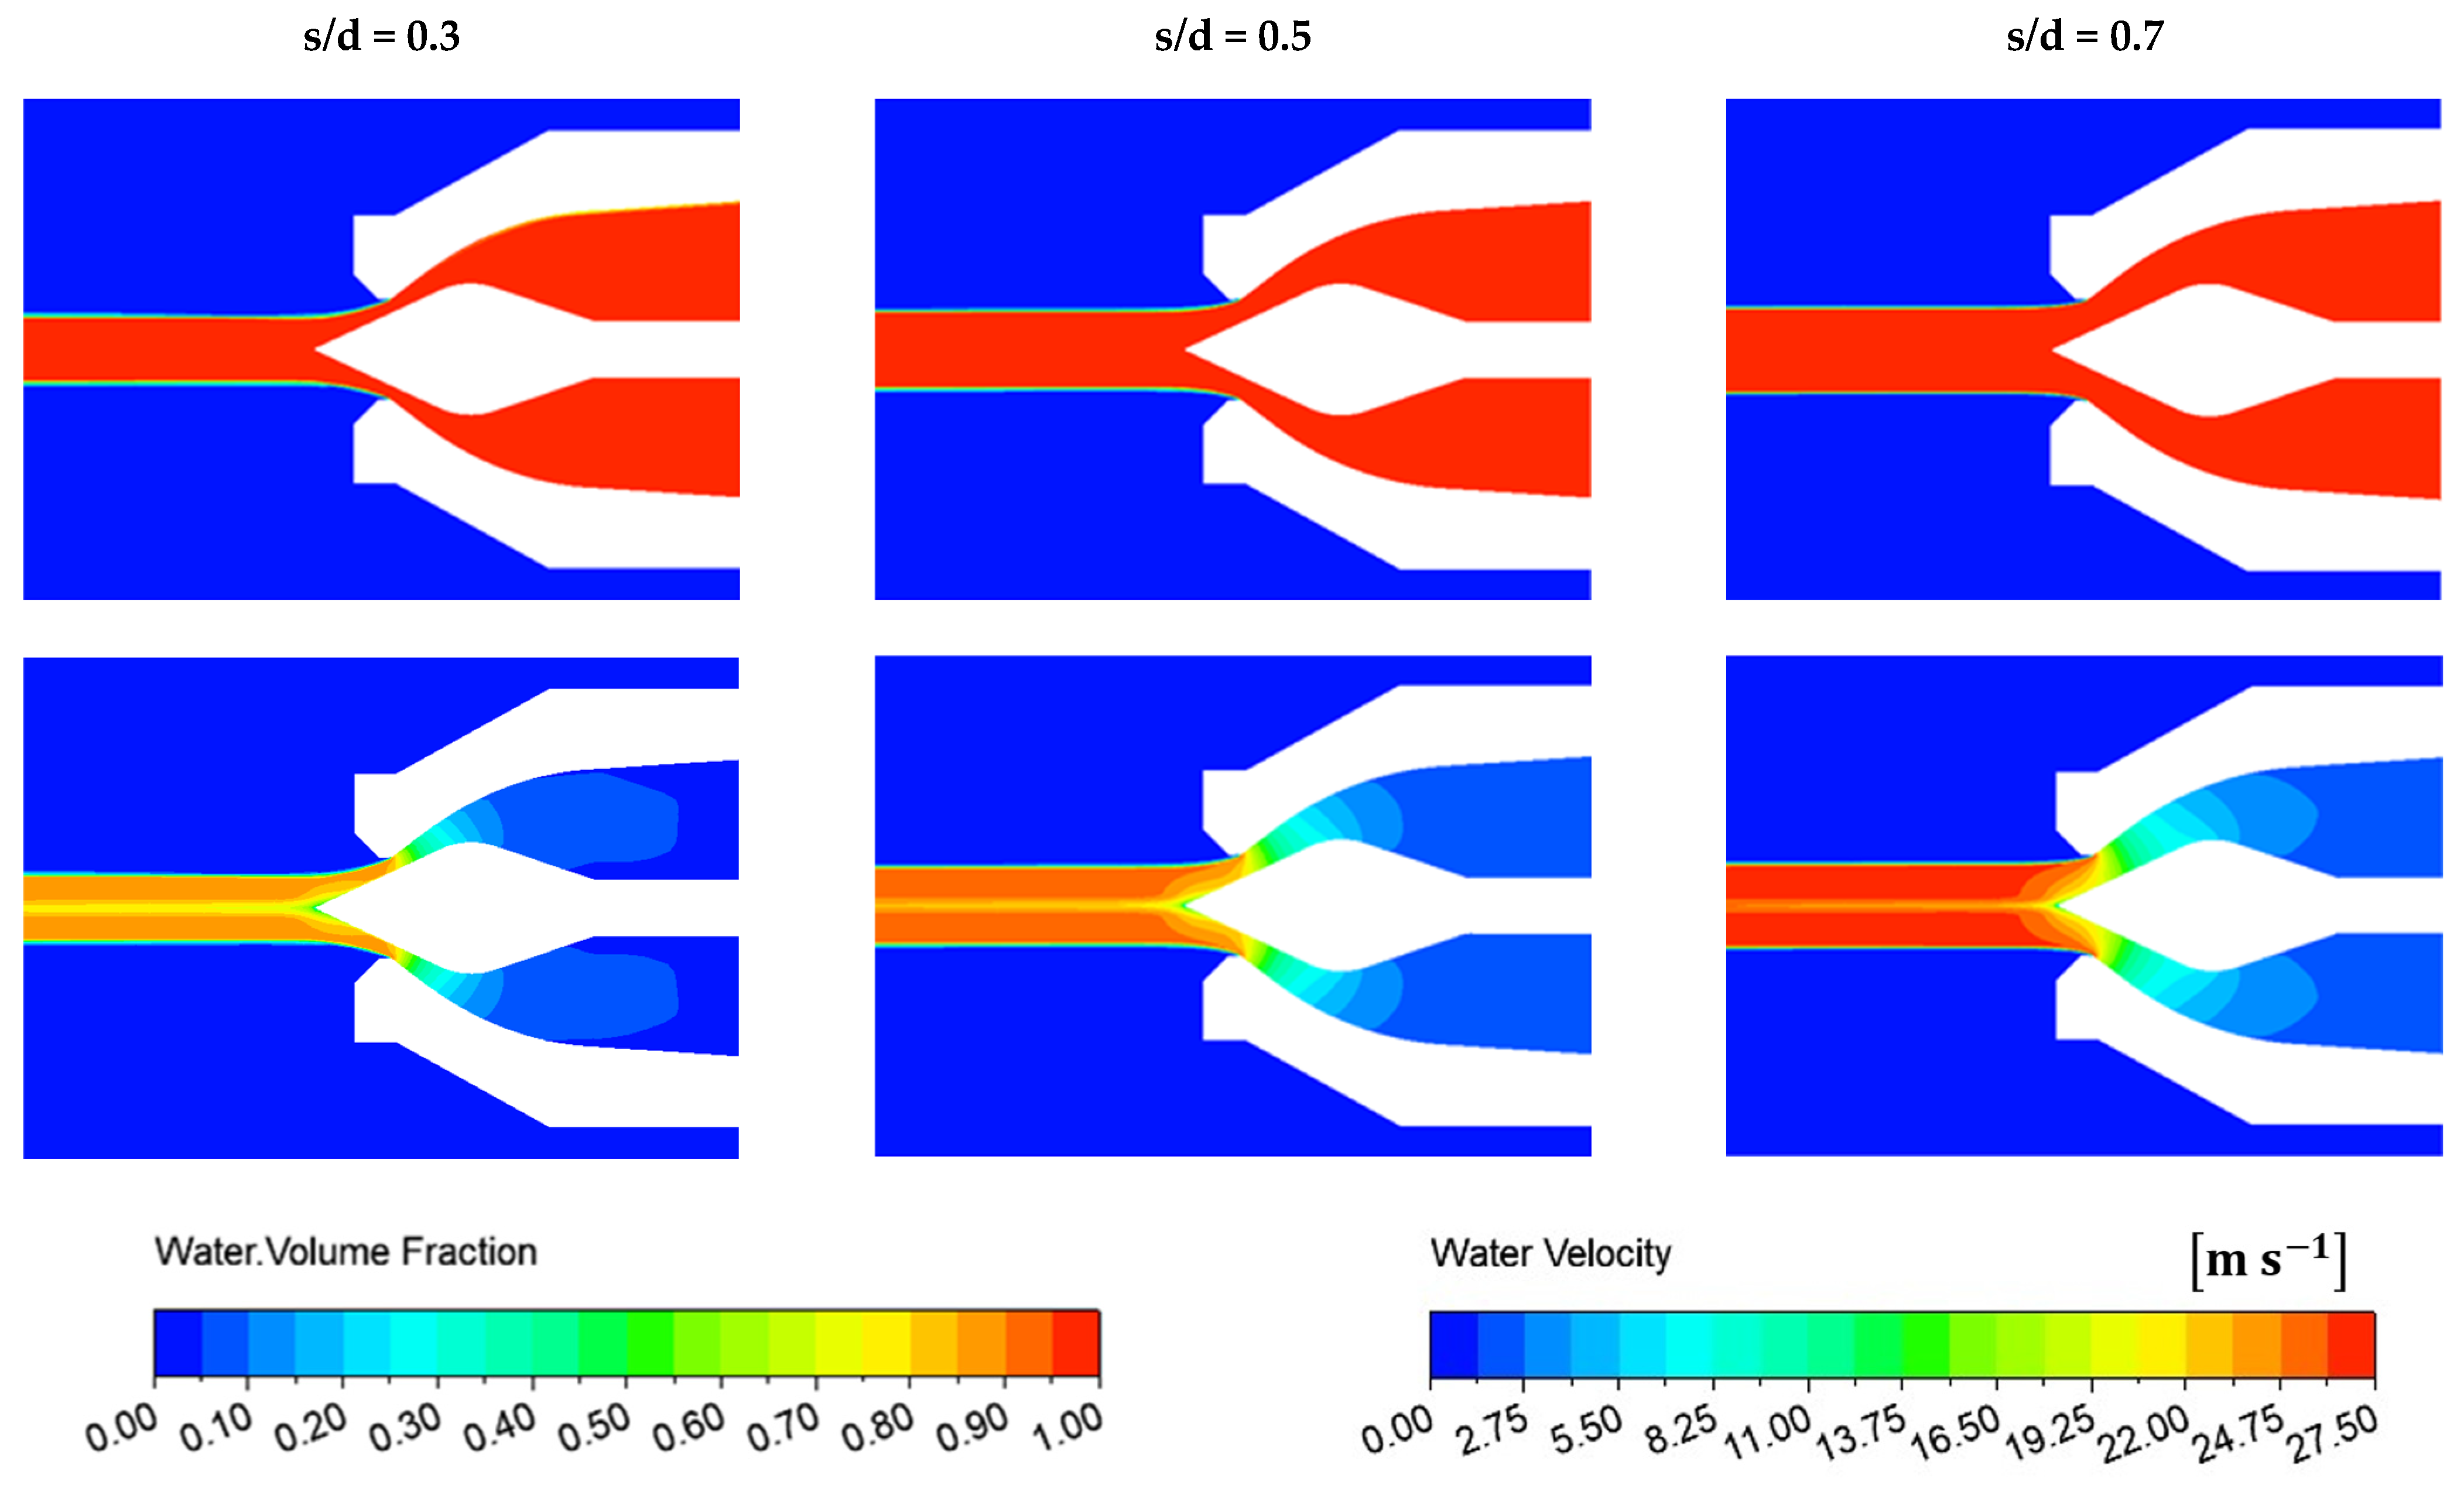
The numerical setup was also validated by comparing the simulated discharge coefficients against the needle stroke to nozzle diameter ratio s / d 0 with the experimental trend reported by Zhang [27] for nozzles with a tip angle of 50°. As shown in Figure 4, the pure water–air simulation results exhibit good agreement with the literature. The typical air–water flow fields for the three opening conditions are illustrated in Figure 5.
Since convergence was confirmed for the fine mesh configurations, these meshes were selected for the final simulations of the sediment-laden flow, which will be discussed in the following section.

3. Results

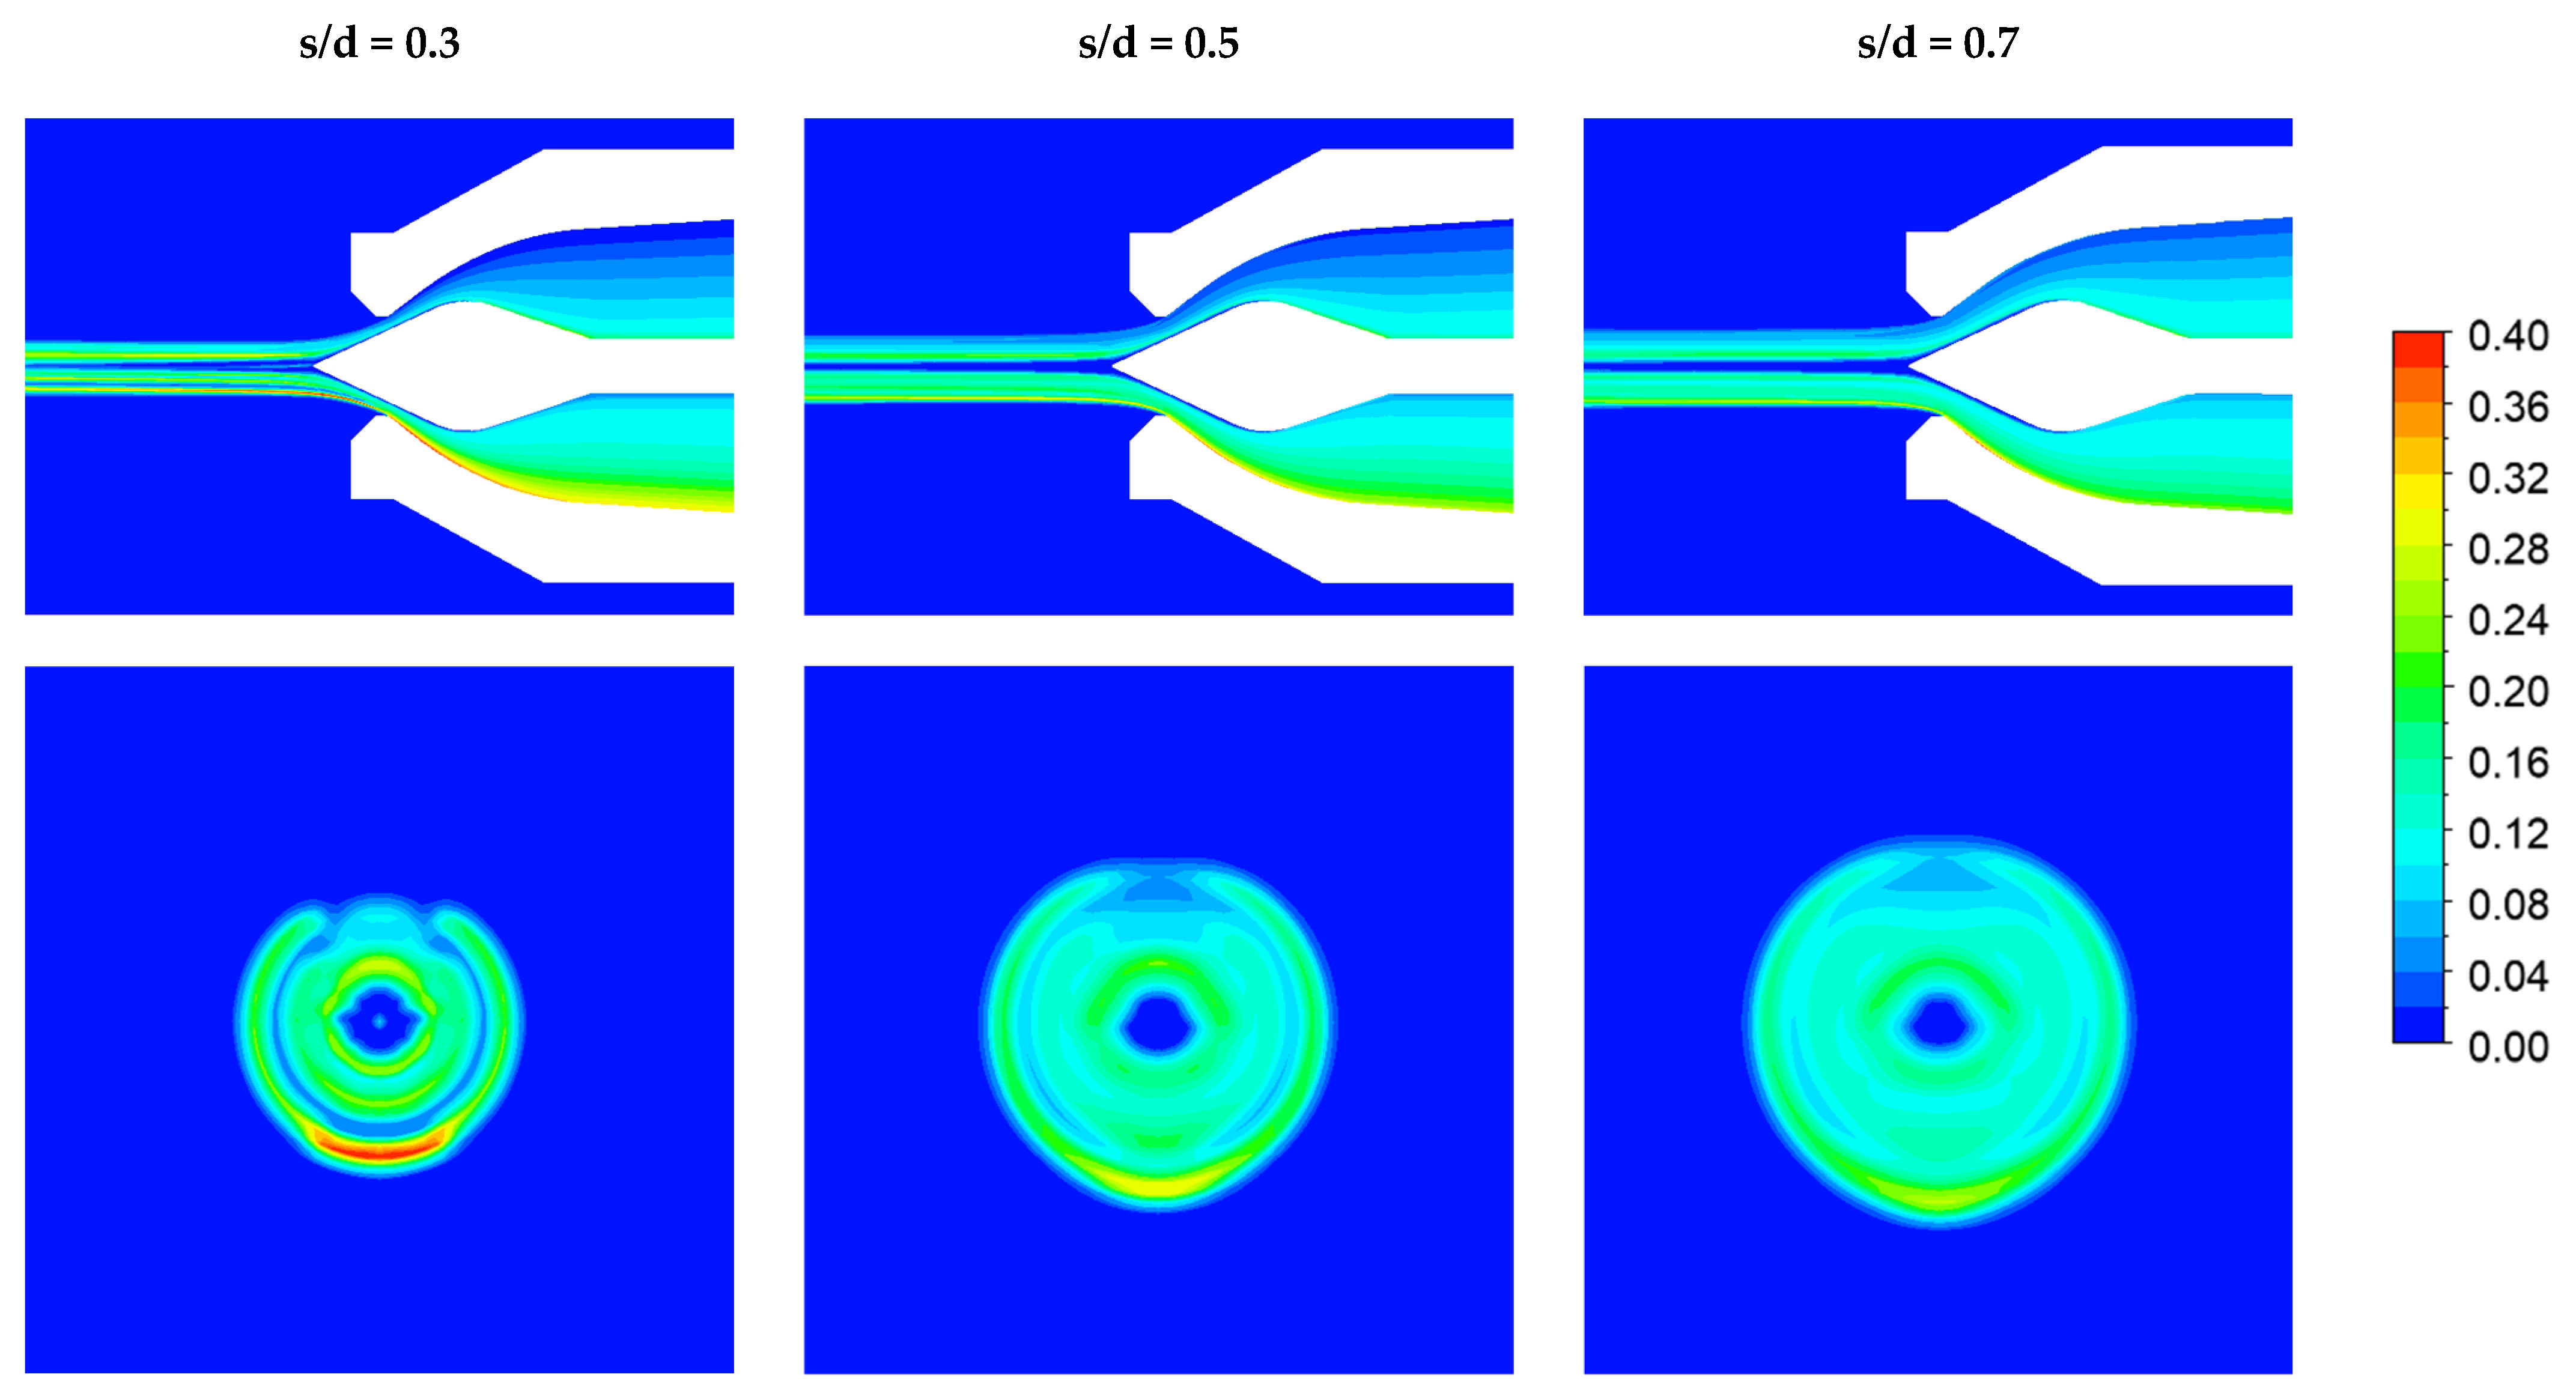
As a first step, the contour plots of sediment volume fraction were examined for all investigated configurations, both on the symmetry plane and on a plane parallel to the x–y plane located 36 mm downstream of the nozzle outlet.
As shown in Figure 6 and Figure 7, gravity leads to an evident non-uniform phase distribution, with concentration hotspots forming along the lower region of the Pelton nozzle and jet. This pronounced inhomogeneity may also be attributed to the relatively low turbulence levels within the inlet pipe, which are not sufficient to effectively maintain the particles in suspension.
A particularly interesting feature is the sediment concentration deficit along the jet axis for all opening conditions. This behavior is likely related to prior interactions between the particles and the needle walls.
A similar phenomenon has been reported by Huang et al. [45] and Shristava et al. [54] in Eulerian–Lagrangian simulations involving particle diameters of 0.1 mm and 0.2 mm, respectively—values comparable to the 0.125 mm particles considered in the present study.
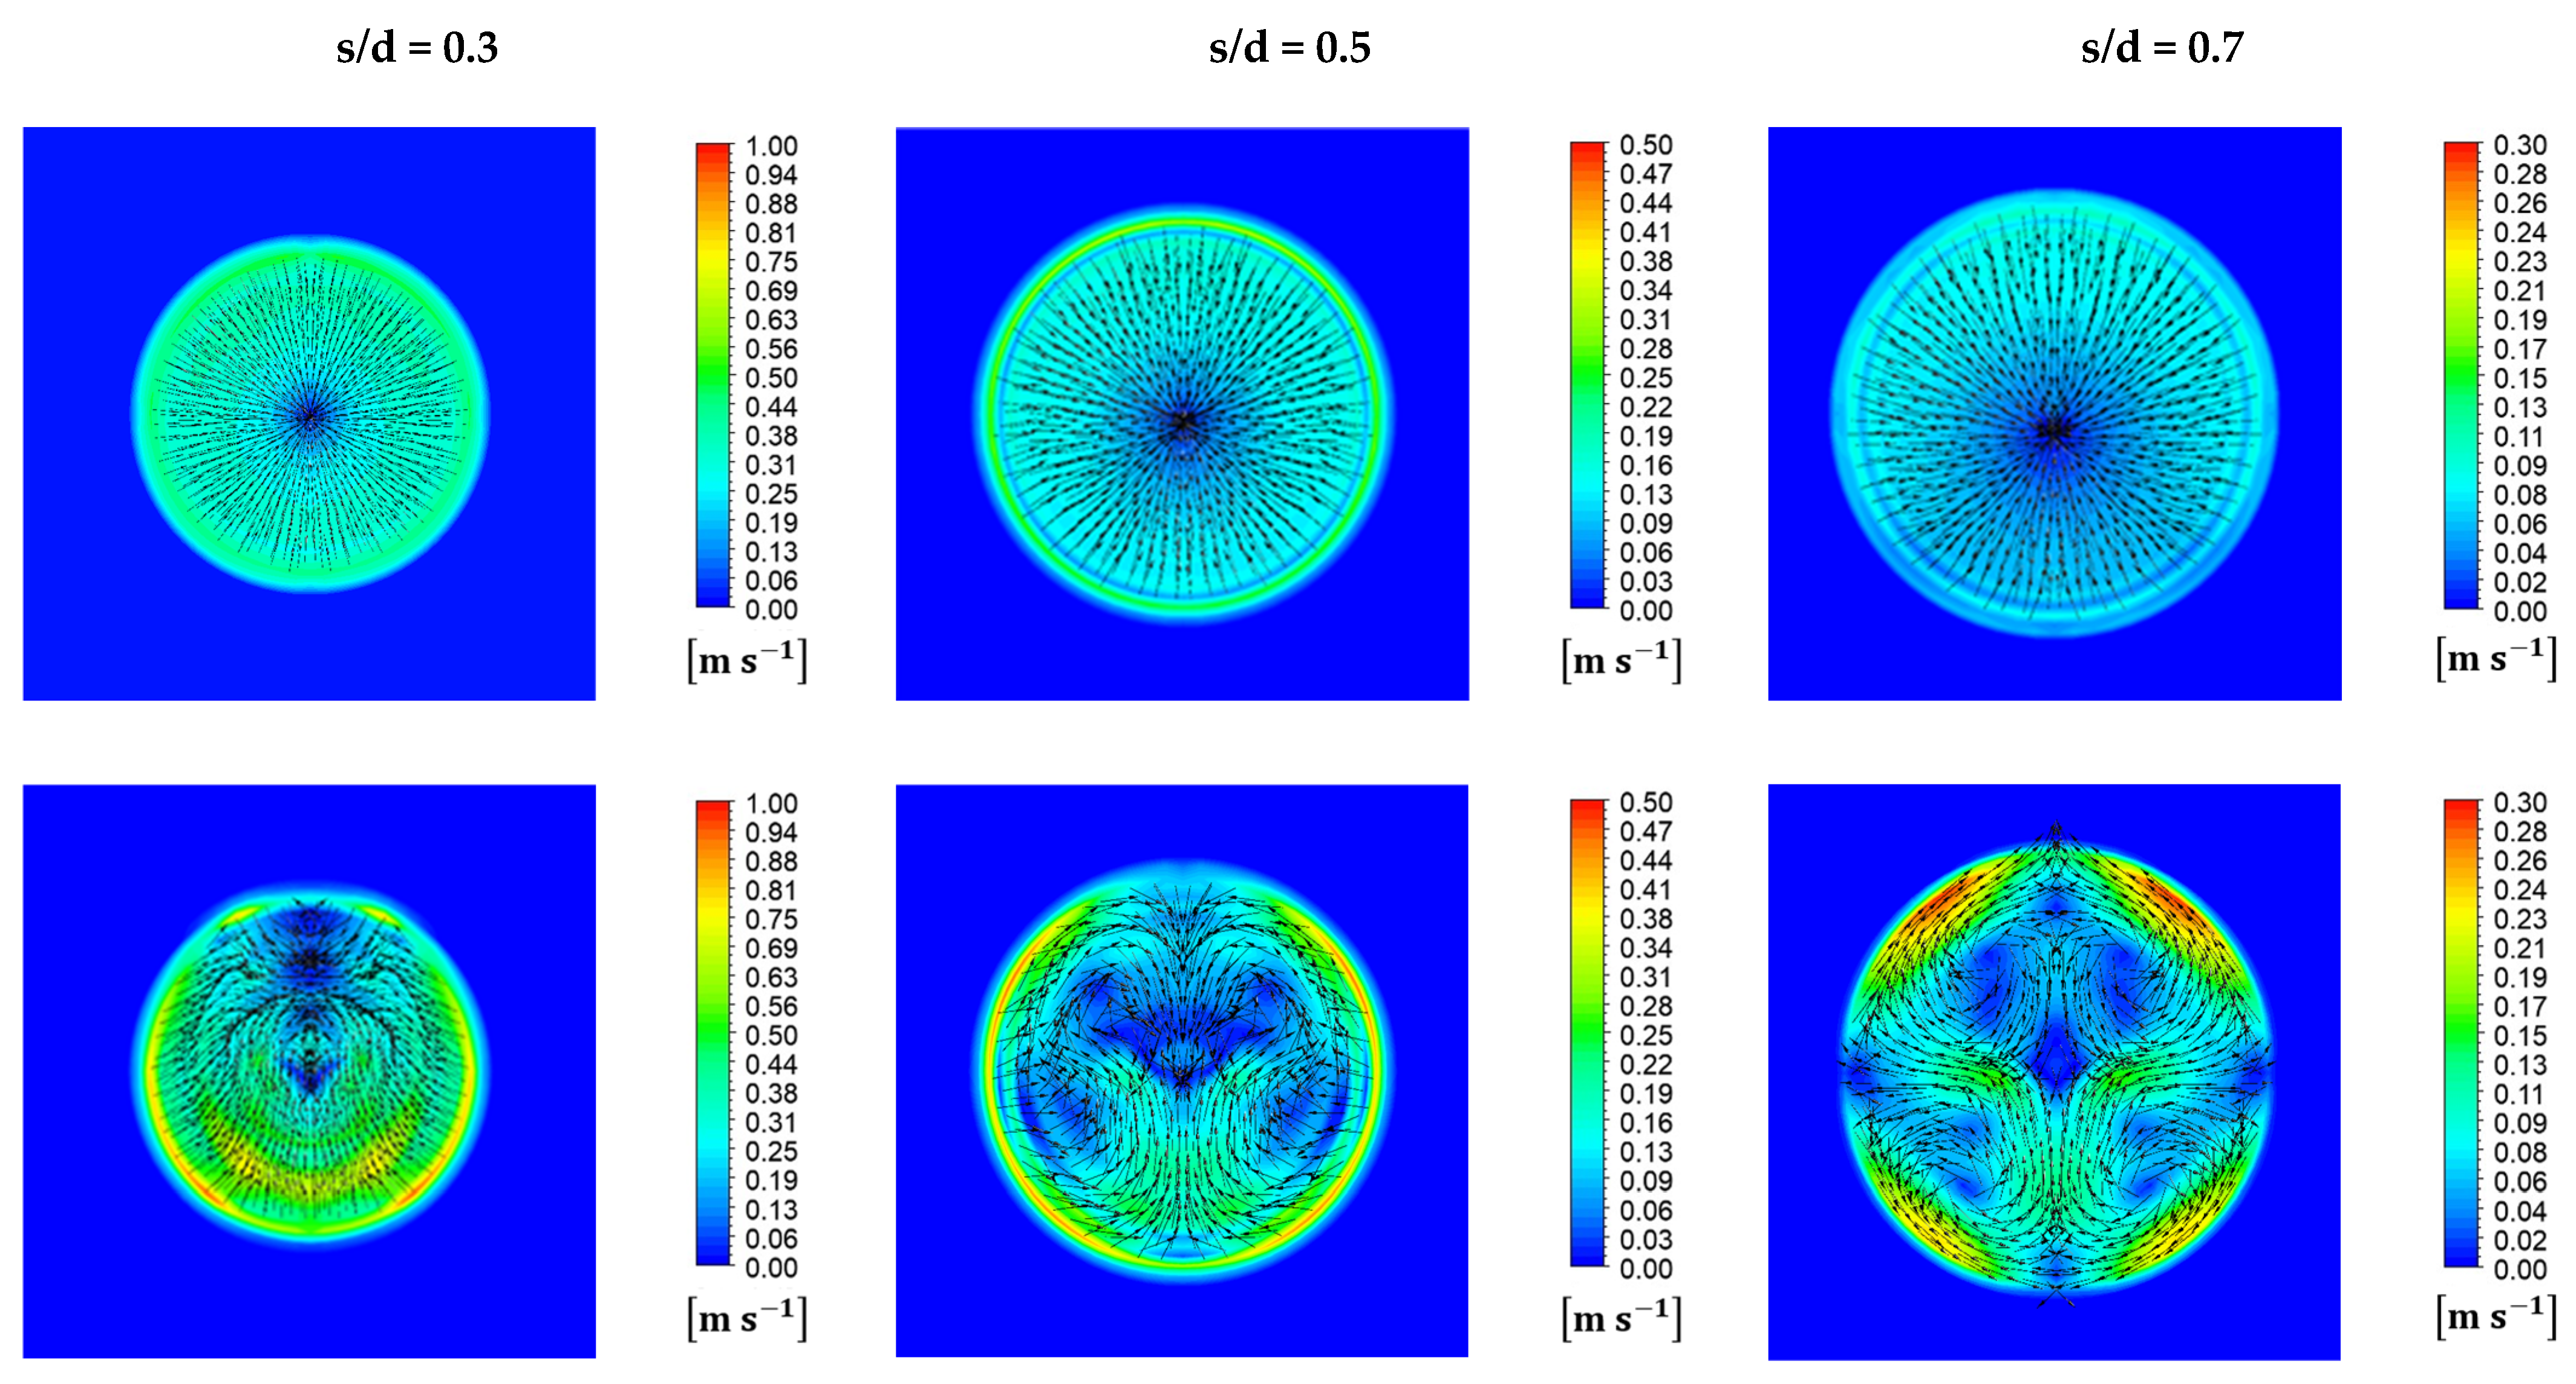
An additional analysis was conducted to assess the possible onset of secondary flows within the jet. The water secondary flow velocity c w , s f was defined according to the method proposed by Semlitsch [74] as:
c w , s f = c w , x 2 + c w , y 2
where c w , x and c w , y are the water velocity components along the x-axis and y-axis, respectively. Figure 8 compares the secondary flow velocity contours obtained for pure water and sediment-laden operating conditions, together with tangential velocity vectors.
The uneven sediment distribution within the jet appears to promote the development of internal secondary flows and vortical structures under sediment-laden conditions.
These flow distortions are likely to affect the subsequent interaction between the jet and the Pelton buckets downstream of the injector, potentially contributing to a further reduction in overall turbine efficiency.
Conversely, the jet under pure water conditions does not exhibit significant internal secondary structures, apart from minor radial velocity components associated with the residual contraction of the jet.
Performance variations in terms of available head, nozzle efficiency, and discharge coefficient were also evaluated for sediment-laden conditions. The head was computed using Equation (16), replacing water density ρ w with the mixture density ρ m calculated as:
ρ m = α s ρ s + 1 α s ρ w
Nozzle efficiency and discharge coefficient were determined as described in Section 2.5, with the only difference consisting of the computation of the iso-clip area, which is determined for combined water and sediment volume fractions greater than 0.99.
The results are summarized in Table 4 and compared with those obtained for pure water–air conditions. For identical flow rate conditions, an increase in the required head was observed for all openings under sediment-laden operation.
This increase can be attributed to the additional pressure losses induced by the presence of solid particles within the liquid phase. Experimental investigations on slurry flows in pipes [75,76,77] consistently show that pressure drops in solid–liquid mixtures exceed those in pure water at the same flow velocity.
Consequently, to maintain the same outlet velocity, a higher inlet energy—and thus a larger head—is required to compensate for the additional losses along the nozzle. This effect also explains the reduction in discharge coefficient under sediment-laden conditions.
The alternative formulation of the discharge coefficient, derived from Equation (13), is:
φ d = 4 Q V π d 2 2 g h
As indicated by Equation (19), if a larger head is required to ensure the same volumetric flow rate—as observed in the present sediment-flow simulations—the discharge coefficient necessarily decreases.
Alternatively, if the upstream system provides the same head, the lower discharge coefficient associated with sediment-laden operation implies a reduced flow rate through the nozzle. This finding is consistent with experimental evidence describing a “choking” effect induced by sediments when the available energy difference between upstream and downstream conditions is fixed, resulting in a decrease in discharge.

4. Discussion

The present study provides a performance comparison for three different opening configurations of the same Pelton nozzle operating under both pure water–air and sediment-laden flow conditions. For the first time, the numerical investigation of a Pelton injector handling sediment-laden flows has been carried out at high solid volume fractions using an inhomogeneous Eulerian framework coupled with the homogeneous k–ω SST turbulence model.
After validating the numerical setup under pure water–air conditions, simulations were extended to sediment-laden operation. In this case, the Kinetic Theory of Granular Flows (KTGF) was adopted for the solid phase, no-slip boundary conditions were imposed at the walls for all phases—including the solid phase—and the solid dynamic viscosity was defined according to the correlation proposed by Thomas [70].
The comparison between sediment-laden and pure water simulations revealed a slight increase in the required nozzle head for all opening configurations. This behavior can be attributed to the higher-pressure losses typically associated with solid–liquid mixtures flowing through ducts compared with single-phase water flows.
The discharge coefficient was also negatively influenced by the presence of particles, showing a consistent reduction across all investigated conditions. This confirms that, under fixed head conditions, the inclusion of solids within the flow leads to a decrease in the achievable discharge.
Regarding phase distribution, the solid volume fraction within the nozzle and the resulting jet exhibited marked inhomogeneity. This uneven distribution was associated with the development of secondary flow structures, which may adversely affect the jet–bucket interaction and consequently contribute to a further reduction in overall turbine efficiency. Future investigations will focus on assessing the influence of particle size and particle size distribution on the flow behavior within Pelton injectors.

Author Contributions

Conceptualization, G.C. and F.N.; methodology, F.N.; software, F.N.; validation, F.N. and G.Z.; formal analysis, F.N. and G.Z.; investigation, F.N. and G.Z.; resources, G.C.; data curation, F.N.; writing—original draft preparation, F.N. and G.Z.; writing—review and editing, G.C.; visualization, F.N. and G.Z.; supervision, G.C.; funding acquisition, G.C. All authors have read and agreed to the published version of the manuscript.

Funding

This research received no external funding.

Data Availability Statement

The raw data supporting the conclusions of this article will be made available by the authors on request.

Acknowledgments

During the preparation of this manuscript, the authors used ChatGPT-5 for the purposes of rephrasing some sentences. The authors have reviewed and edited the output and take full responsibility for the content of this publication.

Conflicts of Interest

The authors declare no conflicts of interest.

Nomenclature

The following nomenclature and symbols are used in this manuscript:
sneedle stroke
d 0 nozzle diameter
Q V Volumetric flow rate
h Head
h w Head in pure water conditions
h s Head in sediment conditions
y + Non-dimensional wall distance
α w Water volume fraction
α a Air volume fraction
α s Solid phase volume fraction
α s , m a x   Packing limit
μ m Mixture dynamic viscosity
μ l Liquid phase dynamic viscosity
μ s Solid phase dynamic viscosity
ρ w Water density
ρ s Solid phase density
p s Solid pressure
Θ s Granular temperature
e s s Restitution coefficient
d p Particle diameter
φ d Discharge coefficient
φ d W Discharge coefficient in pure water conditions
φ d S Discharge coefficient in sediment conditions
η N Nozzle efficiency
η N W Nozzle efficiency in pure water conditions
η N S Nozzle efficiency in sediment conditions
c j Jet velocity
c j W Jet velocity in pure water conditions
c j S Jet velocity in sediment conditions
c w , s f Water secondary flow velocity inside the jet
c w , x Water velocity along the x-axis
c w , y Water velocity along the y-axis
d j Jet diameter
d j W Jet diameter in pure water conditions
d j S Jet diameter in sediment conditions

Abbreviations

The following abbreviations are used in this manuscript:
GCIGrid Convergence Index
KTGFKinetic Theory of Granular Flows
KTIGKinetic Theory of Ideal Gases
CFDComputational Fluid Dynamics
SSTShear Stress Transport

References

  1. Lu, X.X.; Ran, L.; Liu, S.; Jiang, T.; Zhang, S.; Wang, J. Sediment Loads Response to Climate Change: A Preliminary Study of Eight Large Chinese Rivers. Int. J. Sediment Res. 2013, 28, 1–14. [Google Scholar] [CrossRef] [Scilit]
  2. Hirschberg, J.; Fatichi, S.; Bennett, G.; McArdell, B.; Peleg, N.; Lane, S.; Schlunegger, F.; Molnar, P. Climate Change Impacts on Sediment Yield and Debris-Flow Activity in an Alpine Catchment. J. Geophys. Res. Earth Surf. 2020, 126, e2020JF005739. [Google Scholar] [CrossRef] [Scilit]
  3. Neverman, A.; Donovan, M.; Smith, H.; Ausseil, A.-G.; Zammit, C. Climate Change Impacts on Erosion and Suspended Sediment Loads in New Zealand. Geomorphology 2023, 427, 108607. [Google Scholar] [CrossRef] [Scilit]
  4. Hauer, C.; Leitner, P.; Unfer, G.; Pulg, U.; Habersack, H.; Graf, W. The Role of Sediment and Sediment Dynamics in the Aquatic Environment. In Riverine Ecosystem Management; Schmutz, S., Sendzimir, J., Eds.; Aquatic Ecology Series; Springer: Cham, Switzerland, 2018; Volume 8, pp. 151–169. [Google Scholar] [CrossRef] [Scilit]
  5. Scheurer, K.; Alewell, C.; Bänninger, D.; Burkhardt-Holm, P. Climate and Land-Use Changes Affecting River Sediment and Brown Trout in Alpine Countries—A Review. Environ. Sci. Pollut. Res. Int. 2009, 16, 232–242. [Google Scholar] [CrossRef] [Scilit] [PubMed]
  6. Botelho, A.; Ferreira, P.; Lima, F.; Pinto, L.; Sousa, S. Assessment of the Environmental Impacts Associated with Hydropower. Renew. Sustain. Energy Rev. 2016, 70, 896–904. [Google Scholar] [CrossRef] [Scilit]
  7. Ezcurra, E.; Barrios, E.; Ezcurra, P.; Ezcurra, A.; Vanderplank, S.; Vidal, O.; Villanueva-Almanza, L.; Aburto-Oropeza, O. A Natural Experiment Reveals the Impact of Hydroelectric Dams on the Estuaries of Tropical Rivers. Sci. Adv. 2019, 5, eaau9875. [Google Scholar] [CrossRef] [Scilit]
  8. Goudge, T.; Swartz, J.; Dong, T.; Mohrig, D. Characterizing the Response of the Coastal Rio Grande to Upstream Damming. Geomorphology 2023, 426, 108604. [Google Scholar] [CrossRef] [Scilit]
  9. Klaver, G.; Van Os, B.; Négrel, P.; Petelet-Giraud, E. Influence of Hydropower Dams on the Composition of the Suspended and Riverbank Sediments in the Danube. Environ. Pollut. 2007, 148, 718–728. [Google Scholar] [CrossRef] [Scilit] [PubMed]
  10. Tomczyk, P.; Wiatkowski, M.; Gałka, B.; Gruss, Ł. Assessing the Impact of a Hydropower Plant on Changes in the Properties of the Sediment of the Bystrzyca River in Poland. Front. Environ. Sci. 2022, 10, 795922. [Google Scholar] [CrossRef] [Scilit]
  11. Crosa, G.; Castelli, E.; Gentili, G.; Espa, P. Effects of Suspended Sediments from Reservoir Flushing on Fish and Macroinvertebrates in an Alpine Stream. Aquat. Sci. 2010, 72, 85–95. [Google Scholar] [CrossRef] [Scilit]
  12. Anderson, D.; Moggridge, H.; Warren, P.; Shucksmith, J. The Impacts of ‘Run-of-River’ Hydropower on the Physical and Ecological Condition of Rivers. Water Environ. J. 2014, 29, 268–276. [Google Scholar] [CrossRef] [Scilit]
  13. Schmutz, S.; Moog, O. Dams: Ecological Impacts and Management. In Riverine Ecosystem Management; Schmutz, S., Sendzimir, J., Eds.; Aquatic Ecology Series; Springer: Cham, Switzerland, 2018; Volume 8, pp. 111–127. [Google Scholar] [CrossRef] [Scilit]
  14. Kondolf, G.M.; Gao, Y.; Annandale, G.; Morris, G.; Jiang, E.; Zhang, J.; Cao, Y.; Carling, P.; Fu, K.; Guo, Q.; et al. Sustainable Sediment Management in Reservoirs and Regulated Rivers: Experiences from Five Continents. Earth’s Future 2014, 2, 256–280. [Google Scholar] [CrossRef] [Scilit]
  15. Wild, T.; Loucks, P.; Annandale, G.; Kaini, P. Maintaining Sediment Flows through Hydropower Dams in the Mekong River Basin. J. Water Resour. Plan. Manag. 2015, 141, 04014072. [Google Scholar] [CrossRef] [Scilit]
  16. Hauer, C.; Wagner, B.; Aigner, J.; Holzapfel, P.; Flödl, P.; Liedermann, M.; Tritthart, M.; Sindelar, C.; Pulg, U.; Klösch, M.; et al. State of the Art, Shortcomings and Future Challenges for a Sustainable Sediment Management in Hydropower: A Review. Renew. Sustain. Energy Rev. 2018, 98, 40–55. [Google Scholar] [CrossRef] [Scilit]
  17. Han, L.; Guo, C.; Osman, F.K.; Li, D.; Wang, H.; Liu, Y.; Qin, D. Effect and Mechanism of Erosion in Pelton Turbine and Case Studies—A Review. Phys. Fluids 2024, 36, 031301. [Google Scholar] [CrossRef] [Scilit]
  18. Chitrakar, S.; Neopane, H.P.; Dahlhaug, O.G. A Review on Sediment Erosion Challenges in Hydraulic Turbines; IntechOpen: London, UK, 2018; pp. 1–20. [Google Scholar] [CrossRef] [Scilit]
  19. Parray, M.; Harmain, G. Assessment of Erosive Wear of Pelton Turbine Injector: Nozzle and Spear Combination—A Study of Chenani Hydro-Power Plant. Eng. Fail. Anal. 2020, 116, 104695. [Google Scholar] [CrossRef] [Scilit]
  20. Ge, X.; Sun, J.; Chu, D.; Liu, J.; Zhou, Y.; Zhang, H.; Zhang, L.; Chen, H.; Kan, K.; Maxime, B.; et al. Sediment Erosion on Pelton Turbines: A Review. Chin. J. Mech. Eng. 2023, 36, 64. [Google Scholar] [CrossRef] [Scilit]
  21. Padhy, M.; Saini, R.P. Effect of Size and Concentration of Silt Particles on Erosion of Pelton Turbine Buckets. Energy 2009, 34, 1477–1483. [Google Scholar] [CrossRef] [Scilit]
  22. Padhy, M.; Saini, R.P. Study of Silt Erosion Mechanism in Pelton Turbine Buckets. Energy 2012, 39, 286–293. [Google Scholar] [CrossRef] [Scilit]
  23. Rai, A.; Kumar, A.; Staubli, T. Hydro-Abrasive Erosion in Pelton Buckets: Classification and Field Study. Wear 2017, 392, 8–20. [Google Scholar] [CrossRef] [Scilit]
  24. Rai, A.; Kumar, A.; Staubli, T. Analytical Modelling and Mechanism of Hydro-Abrasive Erosion in Pelton Buckets. Wear 2019, 436–437, 203003. [Google Scholar] [CrossRef] [Scilit]
  25. Rai, A.; Kumar, A.; Staubli, T. Effect of Concentration and Size of Sediments on Hydro-Abrasive Erosion of Pelton Turbine. Renew. Energy 2019, 145, 1272–1282. [Google Scholar] [CrossRef] [Scilit]
  26. Acharya, N.; Abregu, J. Review on Erosion Phenomenon, Maintenance, and Financial Calculation of Lifetime as an Asset for Pelton Turbines. J. Phys. Conf. Ser. 2023, 2629, 012008. [Google Scholar] [CrossRef] [Scilit]
  27. Zhang, Z. Pelton Turbines; Springer: Cham, Switzerland, 2016. [Google Scholar] [CrossRef] [Scilit]
  28. Abgottspon, A.; Staubli, T.; Felix, D.; Albayrak, I.; Boes, R. Hydro-Abrasive Erosion of Pelton Buckets and Suspended Sediment Monitoring. J. Hydraul. Res. 2013, 51, 123–135. [Google Scholar]
  29. Manisekaran, T.; Kamaraj, M.; Shariff, S.; Joshi, S.V. Slurry Erosion Studies on Surface Modified 13Cr4Ni Steels: Effect of Angle of Impingement and Particle Size. J. Mater. Eng. Perform. 2007, 16, 567–572. [Google Scholar] [CrossRef] [Scilit]
  30. Javaheri, V.; Porter, D.; Kuokkala, V.-T. Slurry Erosion of Steel—Review of Tests, Mechanisms and Materials. Wear 2018, 408–409, 82–105. [Google Scholar] [CrossRef] [Scilit]
  31. Quaranta, E.; Davies, P. Emerging and Innovative Materials for Hydropower Engineering Applications: Turbines, Bearings, Sealing, Dams and Waterways, and Ocean Power. Engineering 2021, 8, 527–548. [Google Scholar] [CrossRef] [Scilit]
  32. Singh, J.; Nath, S.K. Surface and Bulk Modification Techniques to Mitigate Silt Erosion in Hydro Turbines: A Review of Techniques and Parameters. Surf. Eng. 2022, 38, 288–302. [Google Scholar] [CrossRef] [Scilit]
  33. Liu, X.; Kang, J.; Yue, W.; Fu, Z.; Zhu, L.; She, D.; Liang, J.; Wang, C. Performance Evaluation of HVOF Sprayed WC-10Co4Cr Coatings under Slurry Erosion. Surf. Eng. 2019, 35, 816–825. [Google Scholar] [CrossRef] [Scilit]
  34. Sharma, V.; Kaur, M.; Bhandari, S. Micro and Nano Ceramic-Metal Composite Coatings by Thermal Spray Process to Control Slurry Erosion in Turbine Steel: An Overview. Eng. Res. Express 2019, 1, 015001. [Google Scholar] [CrossRef] [Scilit]
  35. Prashar, G.; Vasudev, H.; Thakur, L. Performance of Different Coating Materials against Slurry Erosion Failure in Hydrodynamic Turbines: A Review. Eng. Fail. Anal. 2020, 115, 104622. [Google Scholar] [CrossRef] [Scilit]
  36. Sharma, S.; Gandhi, B. Erosion Wear Behavior of Martensitic Stainless Steel under the Hydro-Abrasive Condition of Hydropower Plants. J. Mater. Eng. Perform. 2020, 29, 7544–7554. [Google Scholar] [CrossRef] [Scilit]
  37. Yeoh, G.H.; Tu, J.Y. Computational Techniques for Multiphase Flows; Elsevier: Amsterdam, The Netherlands, 2010. [Google Scholar] [CrossRef] [Scilit]
  38. Finnie, I. Some Observations on the Erosion of Ductile Metals. Wear 1972, 19, 81–90. [Google Scholar] [CrossRef] [Scilit]
  39. Grant, G.; Tabakoff, W. Erosion Prediction in Turbomachinery Resulting from Environmental Solid Particles. J. Aircr. 1975, 12, 471–478. [Google Scholar] [CrossRef] [Scilit] [PubMed]
  40. Leguizamón, S.; Alimirzazadeh, S.; Jahanbakhsh, E.; Avellan, F. Multiscale Simulation of Erosive Wear in a Prototype-Scale Pelton Runner. Renew. Energy 2019, 151, 204–215. [Google Scholar] [CrossRef] [Scilit]
  41. Ge, X.; Sun, J.; Zhou, Y.; Cai, J.; Zhang, H.; Zhang, L.; Ding, M.; Deng, C.; Maxime, B.; Zheng, Y. Numerical Simulation of Opening and Velocity Influence on Sediment Erosion of Pelton Turbine Buckets. Renew. Energy 2021, 173, 1294–1308. [Google Scholar] [CrossRef] [Scilit]
  42. Li, L.; Lu, J.; Gong, Y.; Zhao, H.; Liu, X.; Zhu, B. Sediment Erosion Characteristics of Pelton Turbine Runner: Effects of Sediment Concentration and Diameter. Renew. Energy 2024, 220, 119679. [Google Scholar] [CrossRef] [Scilit]
  43. Guo, B.; Xiao, Y.X.; Rai, A.; Liang, Q.; Liu, J. Analysis of the Air-Water-Sediment Flow Behavior in Pelton Buckets Using an Eulerian-Lagrangian Approach. Energy 2020, 218, 119522. [Google Scholar] [CrossRef] [Scilit]
  44. Xiao, Y.X.; Guo, B.; Rai, A.; Liu, J.; Liang, Q.; Zhang, J. Analysis of Hydro-Abrasive Erosion in Pelton Buckets Using an Eulerian-Lagrangian Approach. Renew. Energy 2022, 197, 1061–1077. [Google Scholar] [CrossRef] [Scilit]
  45. Huang, Y.; Deng, F.; Deng, H.; Qing, Q.; Qin, M.; Liu, J.; Yu, Z.; Pang, J.; Liu, X. Study on Internal Flow Characteristics and Abrasive Wear of Pelton Turbine in Sand Laden Water. Processes 2023, 11, 1570. [Google Scholar] [CrossRef] [Scilit]
  46. Han, L.; Guo, C.; Wang, Y.; Wang, H.; Liu, Y.; Qin, D. Effects of Sediment Characteristics on the Erosion of Pelton Turbine. J. Hydraul. Res. 2024, 62, 236–252. [Google Scholar] [CrossRef] [Scilit]
  47. Han, L.; Gao, Y.; Li, D.; Wang, H.; Liu, Y.; Iranzo, A.; Qin, D. Investigation on the Effect of Particle Parameters on the Erosion and Erosion Prediction Model of the Pelton Turbine. Phys. Fluids 2024, 36, 019707. [Google Scholar] [CrossRef] [Scilit]
  48. Messa, G.; Mandelli, S.; Malavasi, S. Hydro-Abrasive Erosion in Pelton Turbine Injectors: A Numerical Study. Renew. Energy 2018, 130, 474–488. [Google Scholar] [CrossRef] [Scilit]
  49. Guo, B.; Xiao, Y.X.; Rai, A.; Zhang, J.; Liang, Q. Sediment-Laden Flow and Erosion Modeling in a Pelton Turbine Injector. Renew. Energy 2020, 162, 1970–1985. [Google Scholar] [CrossRef] [Scilit]
  50. Fan, W.; Guo, P.; Sun, L.; Zheng, X. Numerical Assessment of Erosion Wear in Pelton Turbine Injectors. J. Phys. Conf. Ser. 2024, 2707, 012067. [Google Scholar] [CrossRef] [Scilit]
  51. Li, F.; Li, C.; Sun, S. The Influence Mechanism of Asymmetric Distribution Characteristics of Erosion in the Injector of Pelton Turbines. J. Phys. Conf. Ser. 2024, 2707, 012069. [Google Scholar] [CrossRef] [Scilit]
  52. Liu, J.; Pang, J.; Liu, X.; Huang, Y.; Deng, H. Analysis of Sediment and Water Flow and Erosion Characteristics of Large Pelton Turbine Injector. Processes 2023, 11, 1011. [Google Scholar] [CrossRef] [Scilit]
  53. Liu, J.; Zhu, Y.; Liang, Q.; Xiao, Y.; Liu, Z.; Li, H.; Ye, J.; Yang, N.; Deng, H.; Du, Q. Analysis of Sediment Erosion in Pelton Nozzles and Needles Affected by Particle Size. Energies 2024, 17, 1635. [Google Scholar] [CrossRef] [Scilit]
  54. Shrivastava, N.; Rai, A.K.; Abbas, A.; Xiao, Y. Analysis of Hydro-Abrasive Erosion in a High-Head Pelton Turbine Injector Using a Eulerian-Lagrangian Approach. Proc. Inst. Mech. Eng. Part A J. Power Energy 2024, 238, 495–514. [Google Scholar] [CrossRef] [Scilit]
  55. Tarodiya, R.; Khullar, S.; Levy, A. Particulate Flow and Erosion Modeling of a Pelton Turbine Injector Using CFD-DEM Simulations. Powder Technol. 2022, 399, 117168. [Google Scholar] [CrossRef] [Scilit]
  56. Tarodiya, R.; Khullar, S.; Levy, A. Assessment of Erosive Wear Performance of Pelton Turbine Injectors Using CFD-DEM Simulations. Powder Technol. 2022, 408, 117763. [Google Scholar] [CrossRef] [Scilit]
  57. Han, L.; Zhang, G.F.; Wang, Y.; Wei, X.Z. Investigation of Erosion Influence in Distribution System and Nozzle Structure of Pelton Turbine. Renew. Energy 2021, 178, 1413–1426. [Google Scholar] [CrossRef] [Scilit]
  58. Nascimben, F.; Zanetti, G.; Cavazzini, G. Influence of the sediment transportation on the performance of a Pelton nozzle: A novel Eulerian approach for a CFD-based comparison. In Proceedings of the 16th European Conference on Turbomachinery Fluid Dynamics and Thermodynamics, Hannover, Germany, 24–28 March 2025. [Google Scholar]
  59. Celik, I.; Ghia, U.; Roache, P.J.; Freitas, C.; Coloman, H.; Raad, P. Procedure of Estimation and Reporting of Uncertainty Due to Discretization in CFD Applications. J. Fluids Eng. 2008, 130, 078001. [Google Scholar] [CrossRef] [Scilit]
  60. Ansys, Inc. ANSYS CFX-Solver Theory Guide Release 2020-R1; ANSYS, Inc.: Canonsburg, PA, USA, 2020. [Google Scholar]
  61. Gidaspow, D.; Bezburuah, R.; Ding, J. Hydrodynamics of Circulating Fluidized Beds, Kinetic Theory Approach. In Proceedings of the 7th Engineering Foundation Conference on Fluidization, Brisbane, Australia, 3–8 May 1992; pp. 75–82. [Google Scholar]
  62. Burns, A.; Frank, T.; Hamill, I.; Shi, J.-M. The Favre Averaged Drag Model for Turbulent Dispersion in Eulerian Multi-Phase Flows. In Proceedings of the 5th International Conference on Multiphase Flow (ICMF 2004), Yokohama, Japan, 30 May–4 June 2004; pp. 392–400. [Google Scholar]
  63. Gidaspow, D. Multiphase Flow and Fluidization: Continuum and Kinetic Theory Descriptions; Academic Press: New York, NY, USA, 1994. [Google Scholar]
  64. Gidaspow, D.; Bacelos, M. Kinetic Theory Based Multiphase Flow with Experimental Verification. Rev. Chem. Eng. 2018, 34, 299–318. [Google Scholar] [CrossRef] [Scilit]
  65. Lun, C.K.K.; Savage, S.B.; Jeffrey, D.J.; Chepurniy, N. Kinetic Theories for Granular Flow: Inelastic Particles in Couette Flow and Slightly Inelastic Particles in a General Flow Field. J. Fluid Mech. 1984, 140, 223–256. [Google Scholar] [CrossRef] [Scilit]
  66. Menter, F. Two-Equation Eddy-Viscosity Turbulence Models for Engineering Applications. AIAA J. 1994, 32, 1598–1605. [Google Scholar] [CrossRef] [Scilit]
  67. Kaushal, D.R.; Thinglas, T.; Tomita, Y.; Kuchii, S.; Tsukamoto, H. CFD Modeling for Pipeline Flow of Fine Particles at High Concentration. Int. J. Multiph. Flow 2012, 43, 85–100. [Google Scholar] [CrossRef] [Scilit]
  68. Li, M.; He, Y.; Liu, Y.D.; Huang, C. Effect of Interaction of Particles with Different Sizes on Particle Kinetics in Multi-Sized Slurry Transport by Pipeline. Powder Technol. 2018, 338, 120–134. [Google Scholar] [CrossRef] [Scilit]
  69. Liu, W.; He, Y.; Li, M.; Liu, Y.; Huang, C. Effect of Specularity Coefficient on Hydrodynamic Behaviors of Slurry Flows in Horizontal Pipes. Ocean Eng. 2022, 246, 110617. [Google Scholar] [CrossRef] [Scilit]
  70. Thomas, D.G. Transport Characteristics of Suspension: VIII. A Note on the Viscosity of Newtonian Suspensions of Uniform Spherical Particles. J. Colloid Sci. 1965, 20, 267–277. [Google Scholar] [CrossRef] [Scilit]
  71. Gao, Q.; Zhao, J.; Yin, Z.; Yang, D.; Zhang, C. Experimental Study on Methane Hydrate Formation in Quartz Sand under Tri-Axial Condition. J. Nat. Gas Sci. Eng. 2020, 85, 103707. [Google Scholar] [CrossRef] [Scilit]
  72. Neopane, H.; Sujakhu, S. Particle Size Distribution and Mineral Analysis of Sediments in Nepalese Hydropower Plant: A Case Study of Jhimruk Hydropower Plant. Kathmandu Univ. J. Sci. Eng. Technol. 2013, 9, 29–36. [Google Scholar] [CrossRef] [Scilit]
  73. Tomczyk, P.; Gałka, B.; Wiatkowski, M.; Buta, B.; Gruss, Ł. Analysis of Spatial Distribution of Sediment Pollutants Accumulated in the Vicinity of a Small Hydropower Plant. Energies 2021, 14, 5935. [Google Scholar] [CrossRef] [Scilit]
  74. Semlitsch, B. Effect of Inflow Disturbances in Pelton Turbine Distributor Lines on the Water Jet Quality. Int. J. Multiph. Flow 2024, 174, 104786. [Google Scholar] [CrossRef] [Scilit]
  75. Kaushal, D.R.; Sato, K.; Toyota, T.; Funatsu, K.; Tomita, Y. Effect of Particle Size Distribution on Pressure Drop and Concentration Profile in Pipeline Flow of Highly Concentrated Slurry. Int. J. Multiph. Flow 2005, 31, 809–823. [Google Scholar] [CrossRef] [Scilit]
  76. Gillies, R.G.; Shook, C.A.; Xu, J. Modelling Heterogeneous Slurry Flow at High Velocities. Can. J. Chem. Eng. 2004, 82, 1060–1065. [Google Scholar] [CrossRef] [Scilit]
  77. Gillies, R.G.; Shook, C.A. Modelling High Concentration Settling Slurry Flows. Can. J. Chem. Eng. 2000, 78, 709–716. [Google Scholar] [CrossRef] [Scilit]
Figure 1. Pelton nozzle 3-D model.
Ijtpp 11 00025 g001
Figure 2. Fluid domain, opening conditions, and boundary conditions representation.
Ijtpp 11 00025 g002
Figure 3. Hexahedral mesh details for the three different opening configurations.
Ijtpp 11 00025 g003
Figure 4. Comparison between numerical and theoretical discharge coefficients.
Ijtpp 11 00025 g004
Figure 5. Water volume fraction (above) and jet velocity (below) deriving from Pelton nozzle simulations conducted in pure water-air conditions.
Ijtpp 11 00025 g005
Figure 6. Sediment volume fraction distribution obtained for the 50% opening configuration in sediment-laden flow conditions along the whole simulation domain.
Ijtpp 11 00025 g006
Figure 7. Sediment volume fraction distributions obtained for the 30%, 50%, and 70% opening configurations in sediment-laden flow conditions.
Ijtpp 11 00025 g007
Figure 8. Secondary velocity contour plots and vector field obtained in pure water (above) and sediment-laden flow conditions (below), computed 36 mm away from the nozzle outlet for 30%, 50%, and 70% opening conditions.
Ijtpp 11 00025 g008
Table 1. Mesh statistics and flow rate boundary conditions, together with y + information computed as the area—averaged y + value close to the nozzle outlet.
s/d Q V MESHELEMENTS NUMBER y A V E +
[-][l/s][-][-][-]
0.310.7COARSE0.223 M56.0
MEDIUM0.450 M44.1
FINE0.910 M39.2
0.515.7COARSE0.253 M63.3
MEDIUM0.511 M59.3
FINE1.023 M49.3
0.719.2COARSE0.271 M56.8
MEDIUM0.541 M54.5
FINE1.098 M49.4
Table 2. Material properties.
MATERIALρμ
[-][ k g / m 3 ][ P a · s ]
Air1.1851.813 × 10−5
Water9978.9 × 10−4
Sand24700.00414
Table 3. Mesh independence study results according to the Celik et al. [59] method.
s/dMESH φ d W φ d , e x t W GCI
[-][-][-][-][%]
0.3COARSE0.36380.3690-
MEDIUM0.36880.046
FINE0.36900.001
0.5COARSE0.54770.5501-
MEDIUM0.54902.089
FINE0.54961.004
0.7COARSE0.64190.6634-
MEDIUM0.66280.072
FINE0.66340.035
Table 4. Comparison between results derived from Pelton nozzle simulations conducted in pure water-air conditions and in sediment-laden flow conditions.
s/d h W h S Δh c j W c j S d j W d j S η N W η N S φ d W φ d S Δ φ d
[-][m][m][%][m/s][m/s][mm][mm][%][%][-][-][%]
0.331.433.36.0524.2124.9022.1421.7597.6097.420.36900.3555−3.66
0.534.435.42.9125.6725.9726.8426.6198.8598.580.54960.5384−2.04
0.736.037.23.3326.3926.7329.4229.0999.3298.990.66340.6464−2.56
Disclaimer/Publisher’s Note: The statements, opinions and data contained in all publications are solely those of the individual author(s) and contributor(s) and not of MDPI and/or the editor(s). MDPI and/or the editor(s) disclaim responsibility for any injury to people or property resulting from any ideas, methods, instructions or products referred to in the content.