
Prevalence and Characteristics of Malaria and Influenza Co-Infection in Febrile Patients: A Systematic Review and Meta-Analysis


Abstract
:1. Background
2. Methods
2.1. Protocol and Registration
2.2. Search Strategy
2.3. Eligibility Criteria
2.4. Study Selection and Data Extraction
2.5. Risk of Bias
2.6. Data Syntheses
3. Results
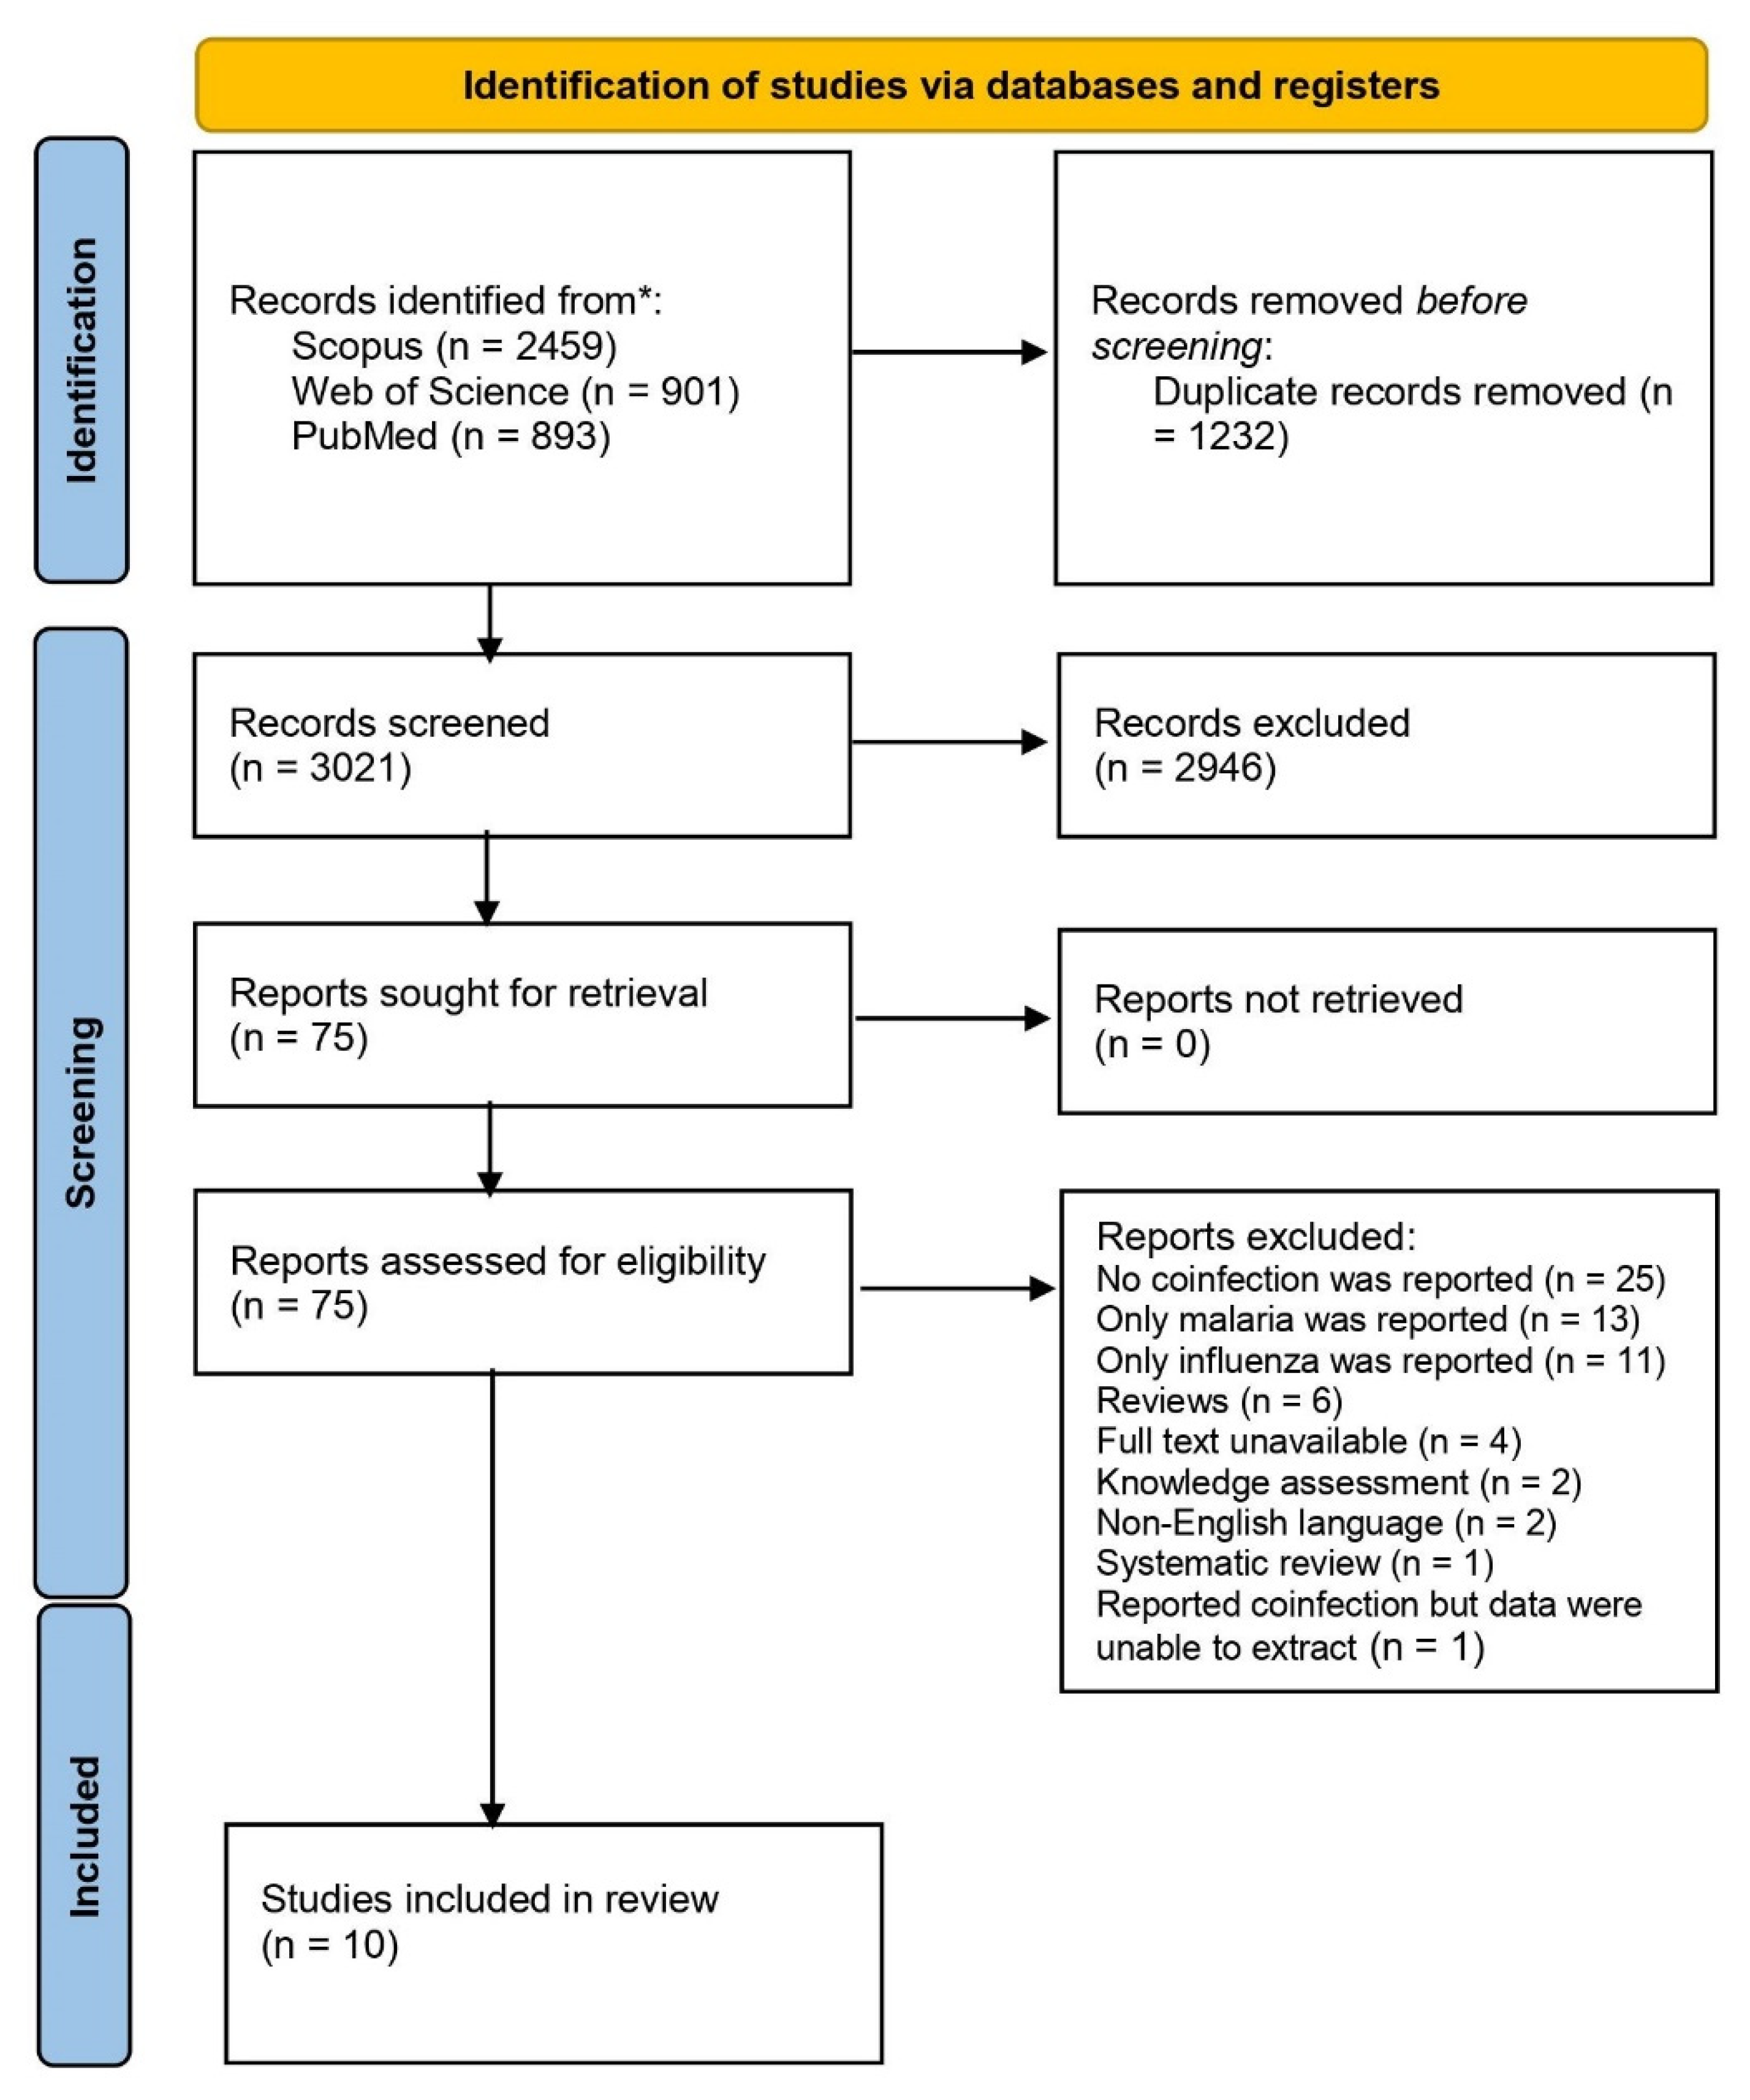
3.1. Search Results
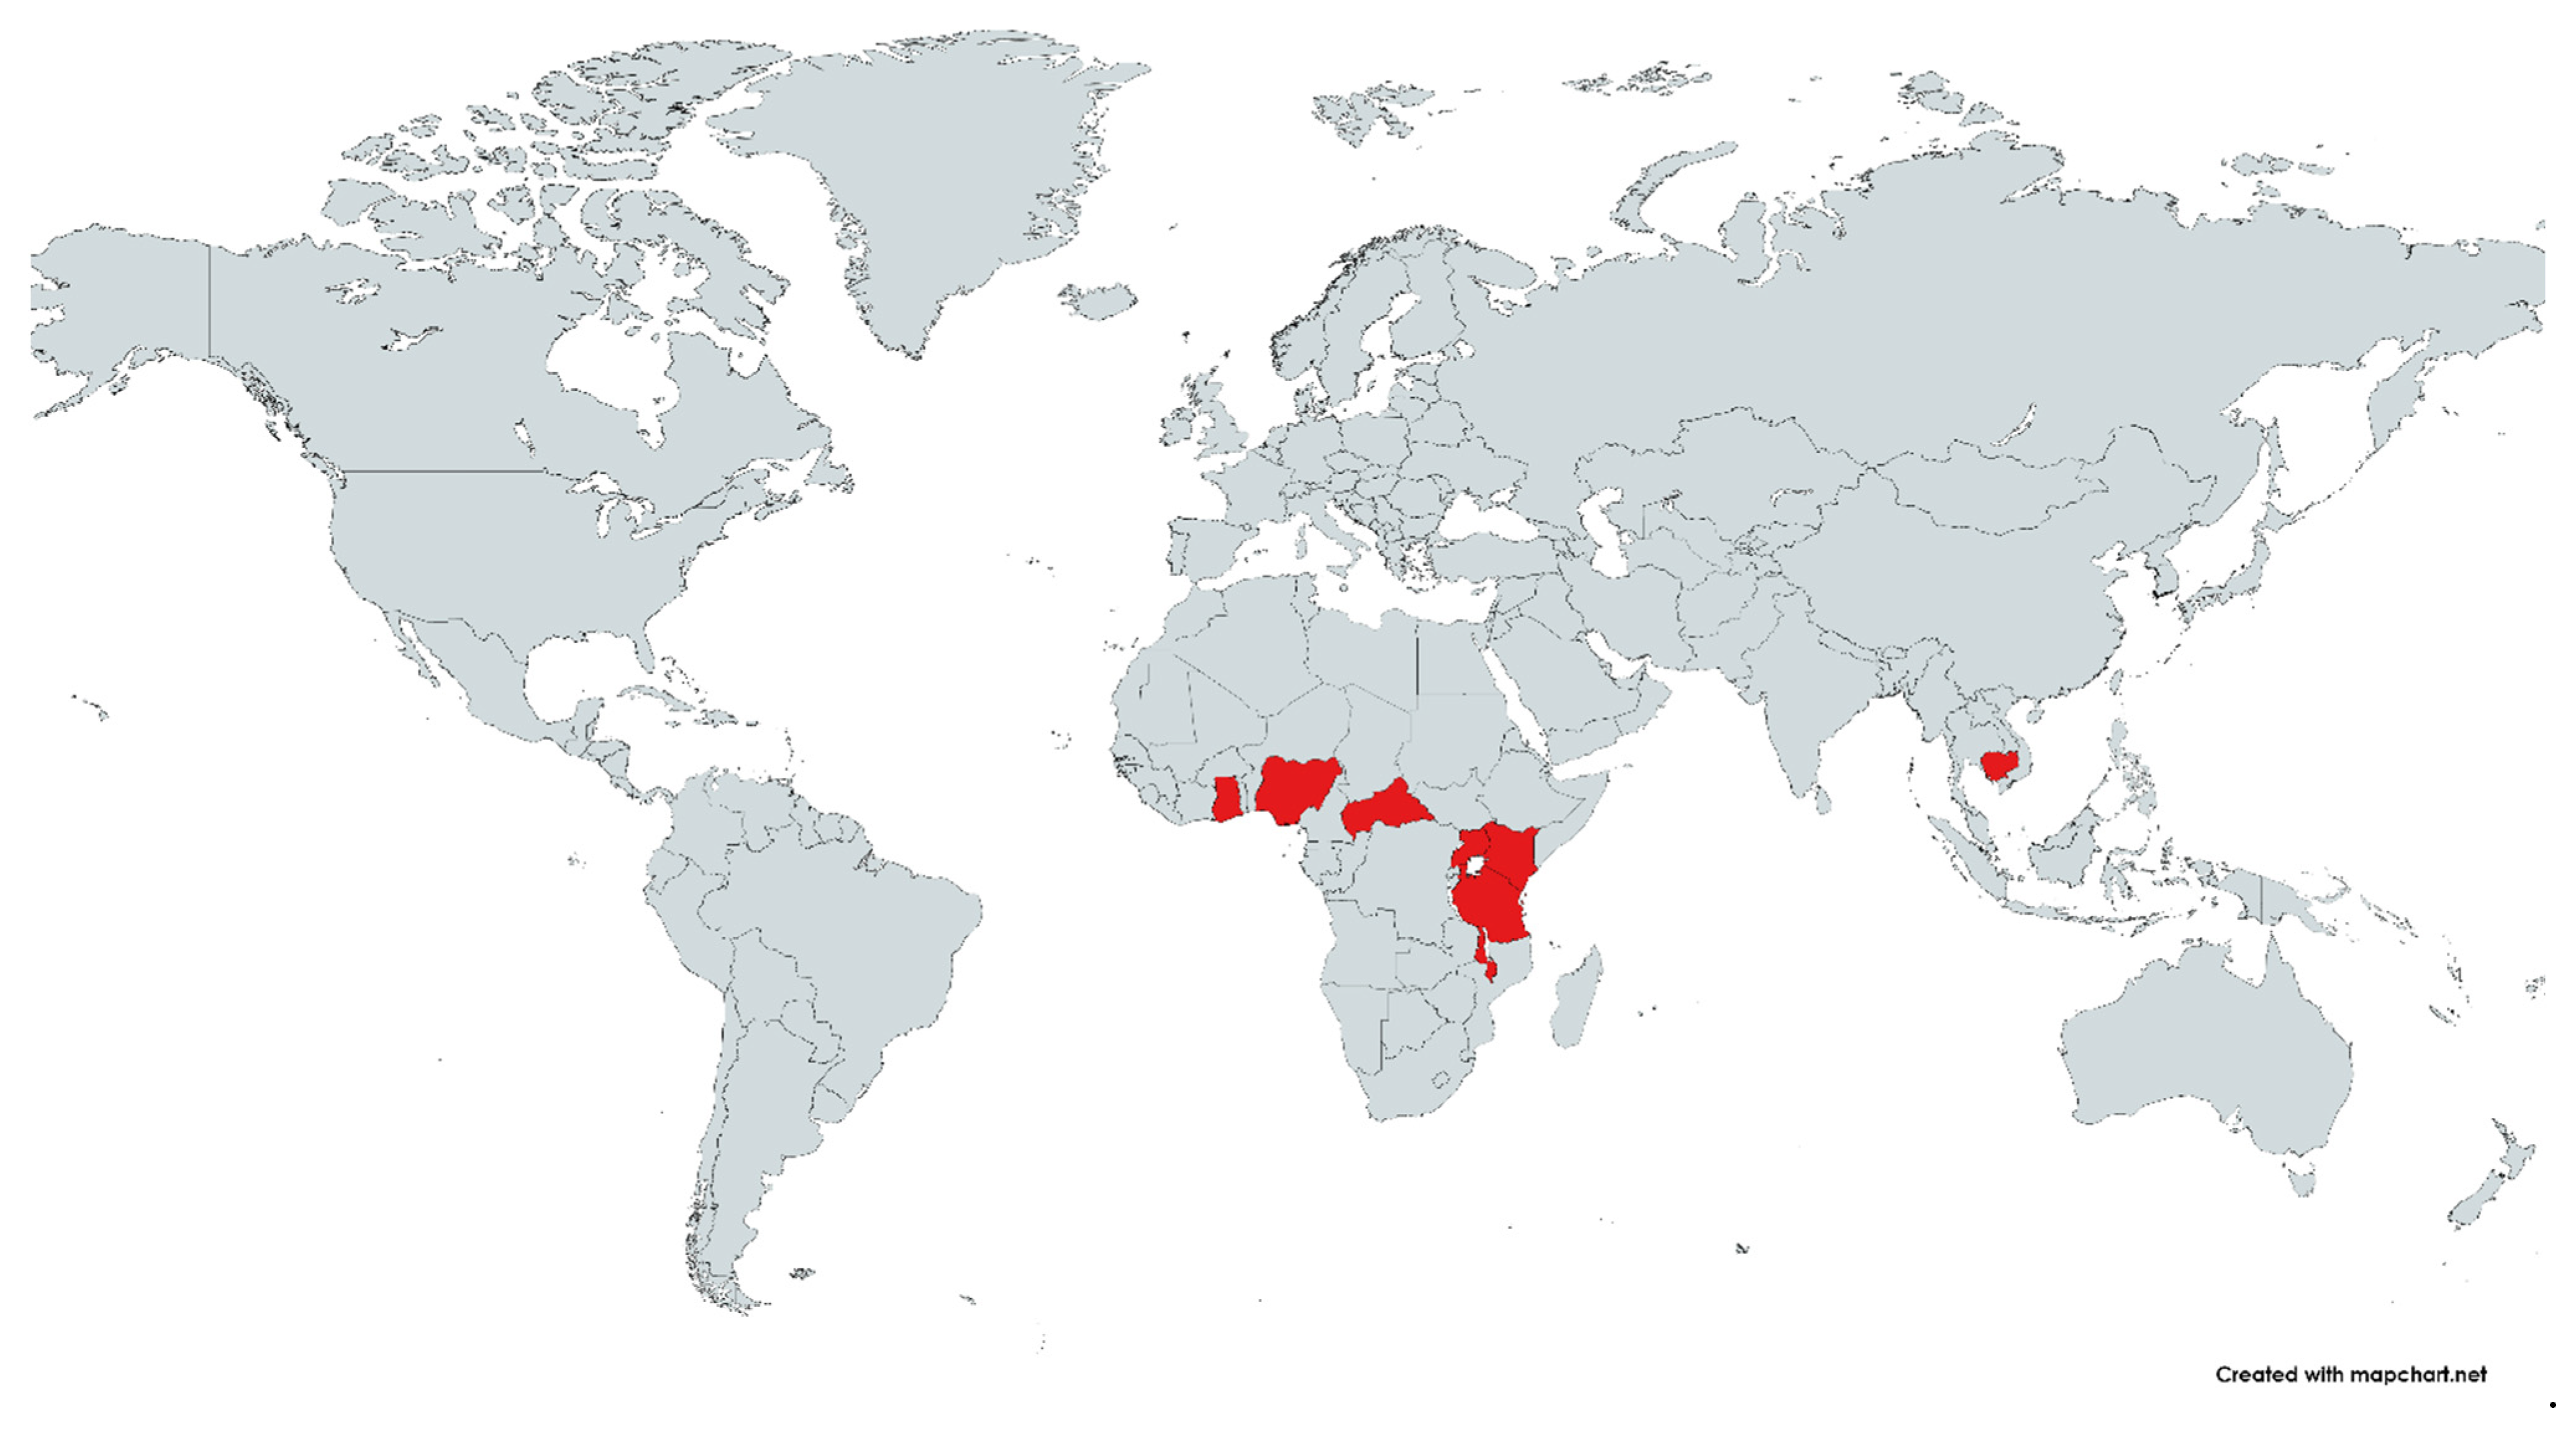
3.2. Characteristics of the Included Studies
3.3. Risk of Bias
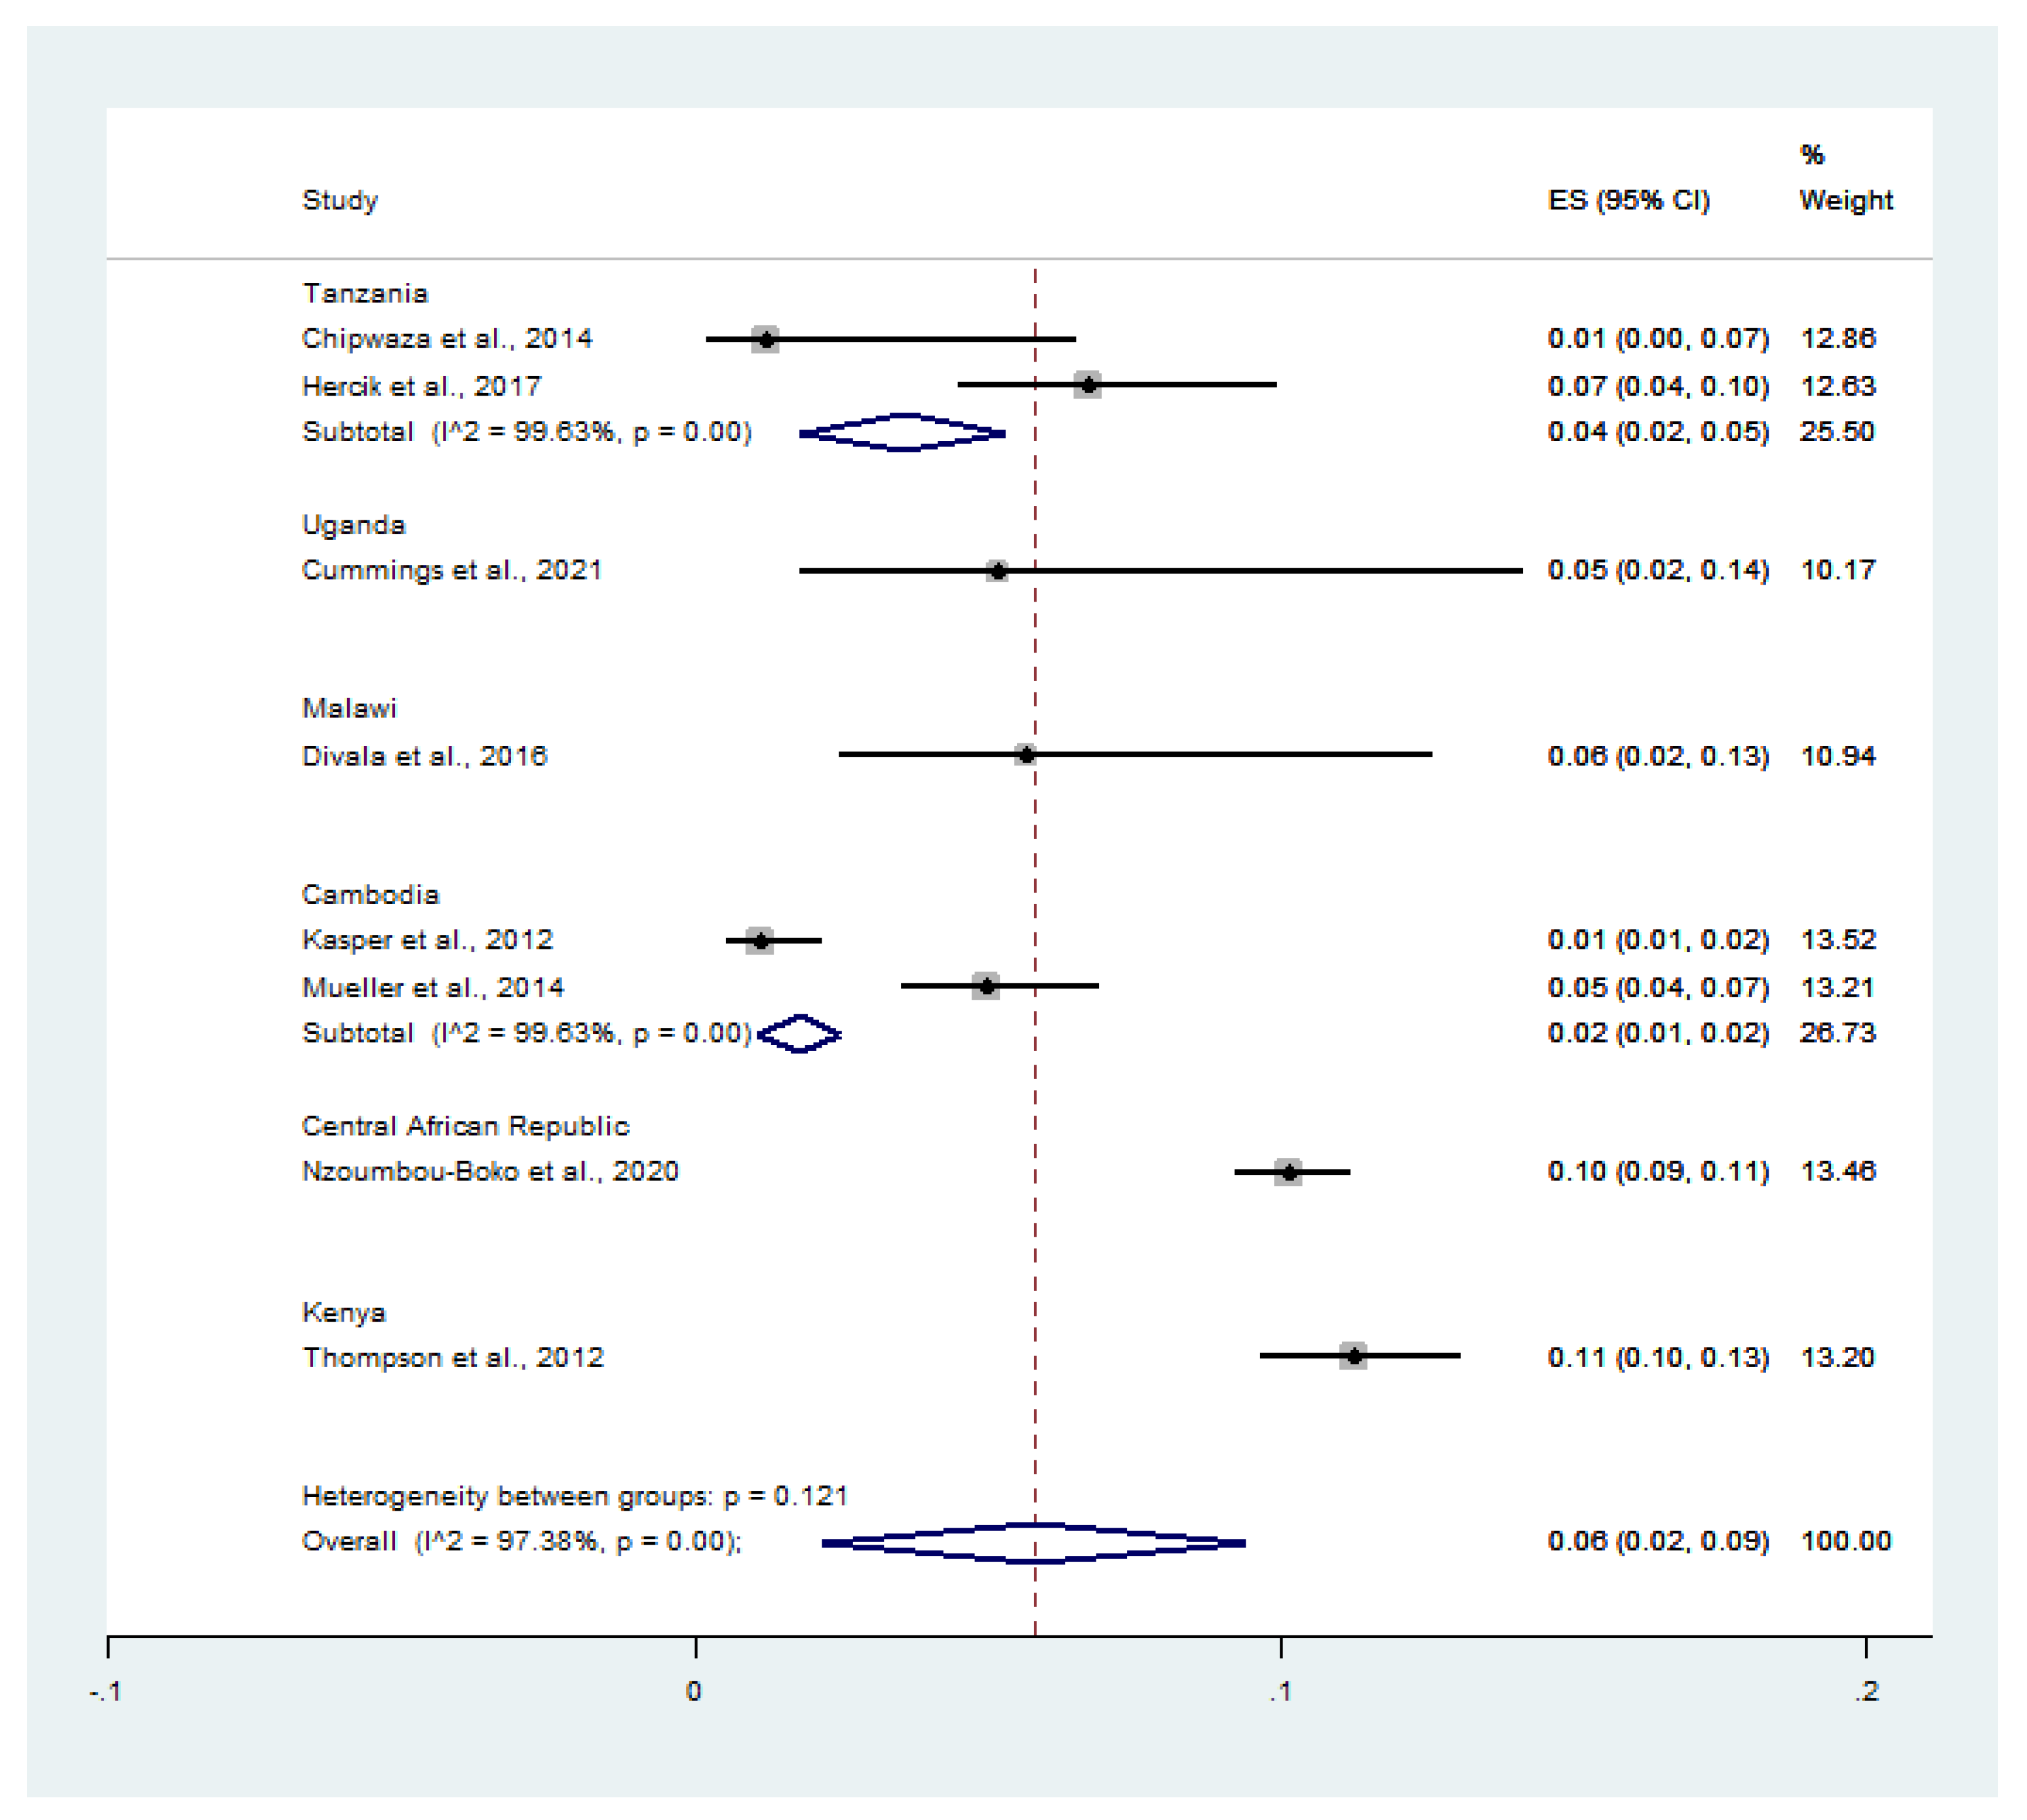
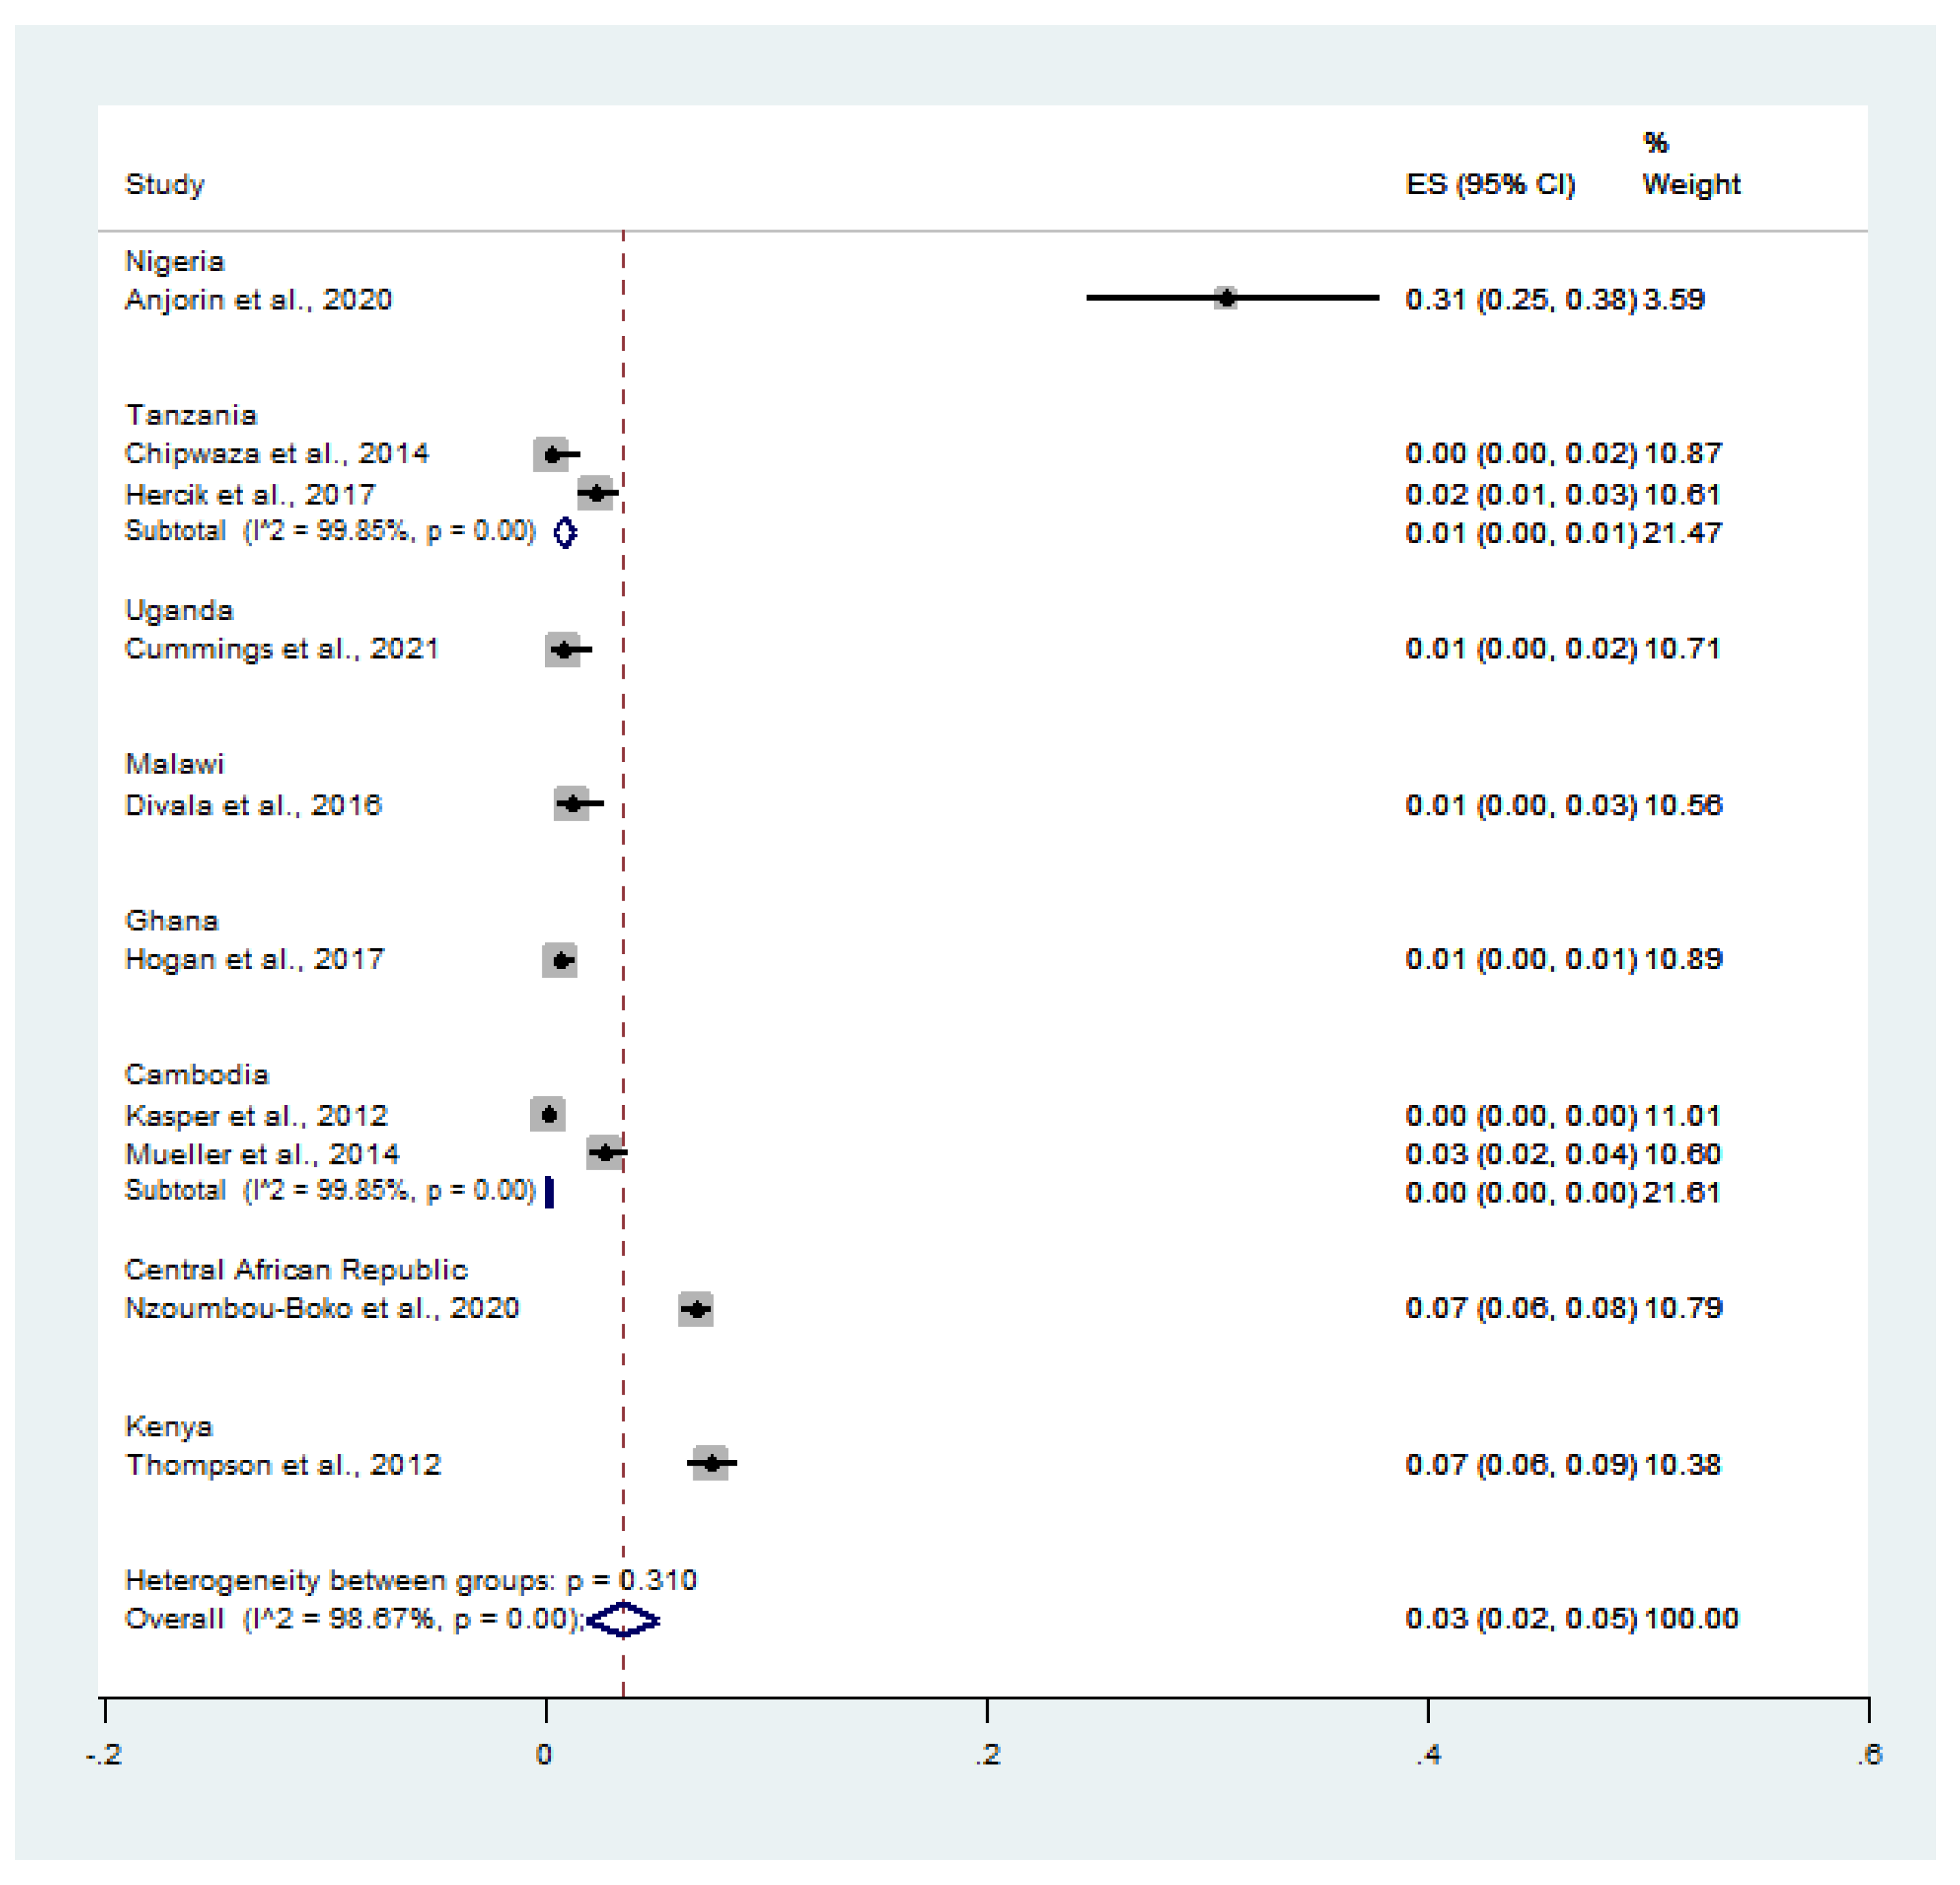
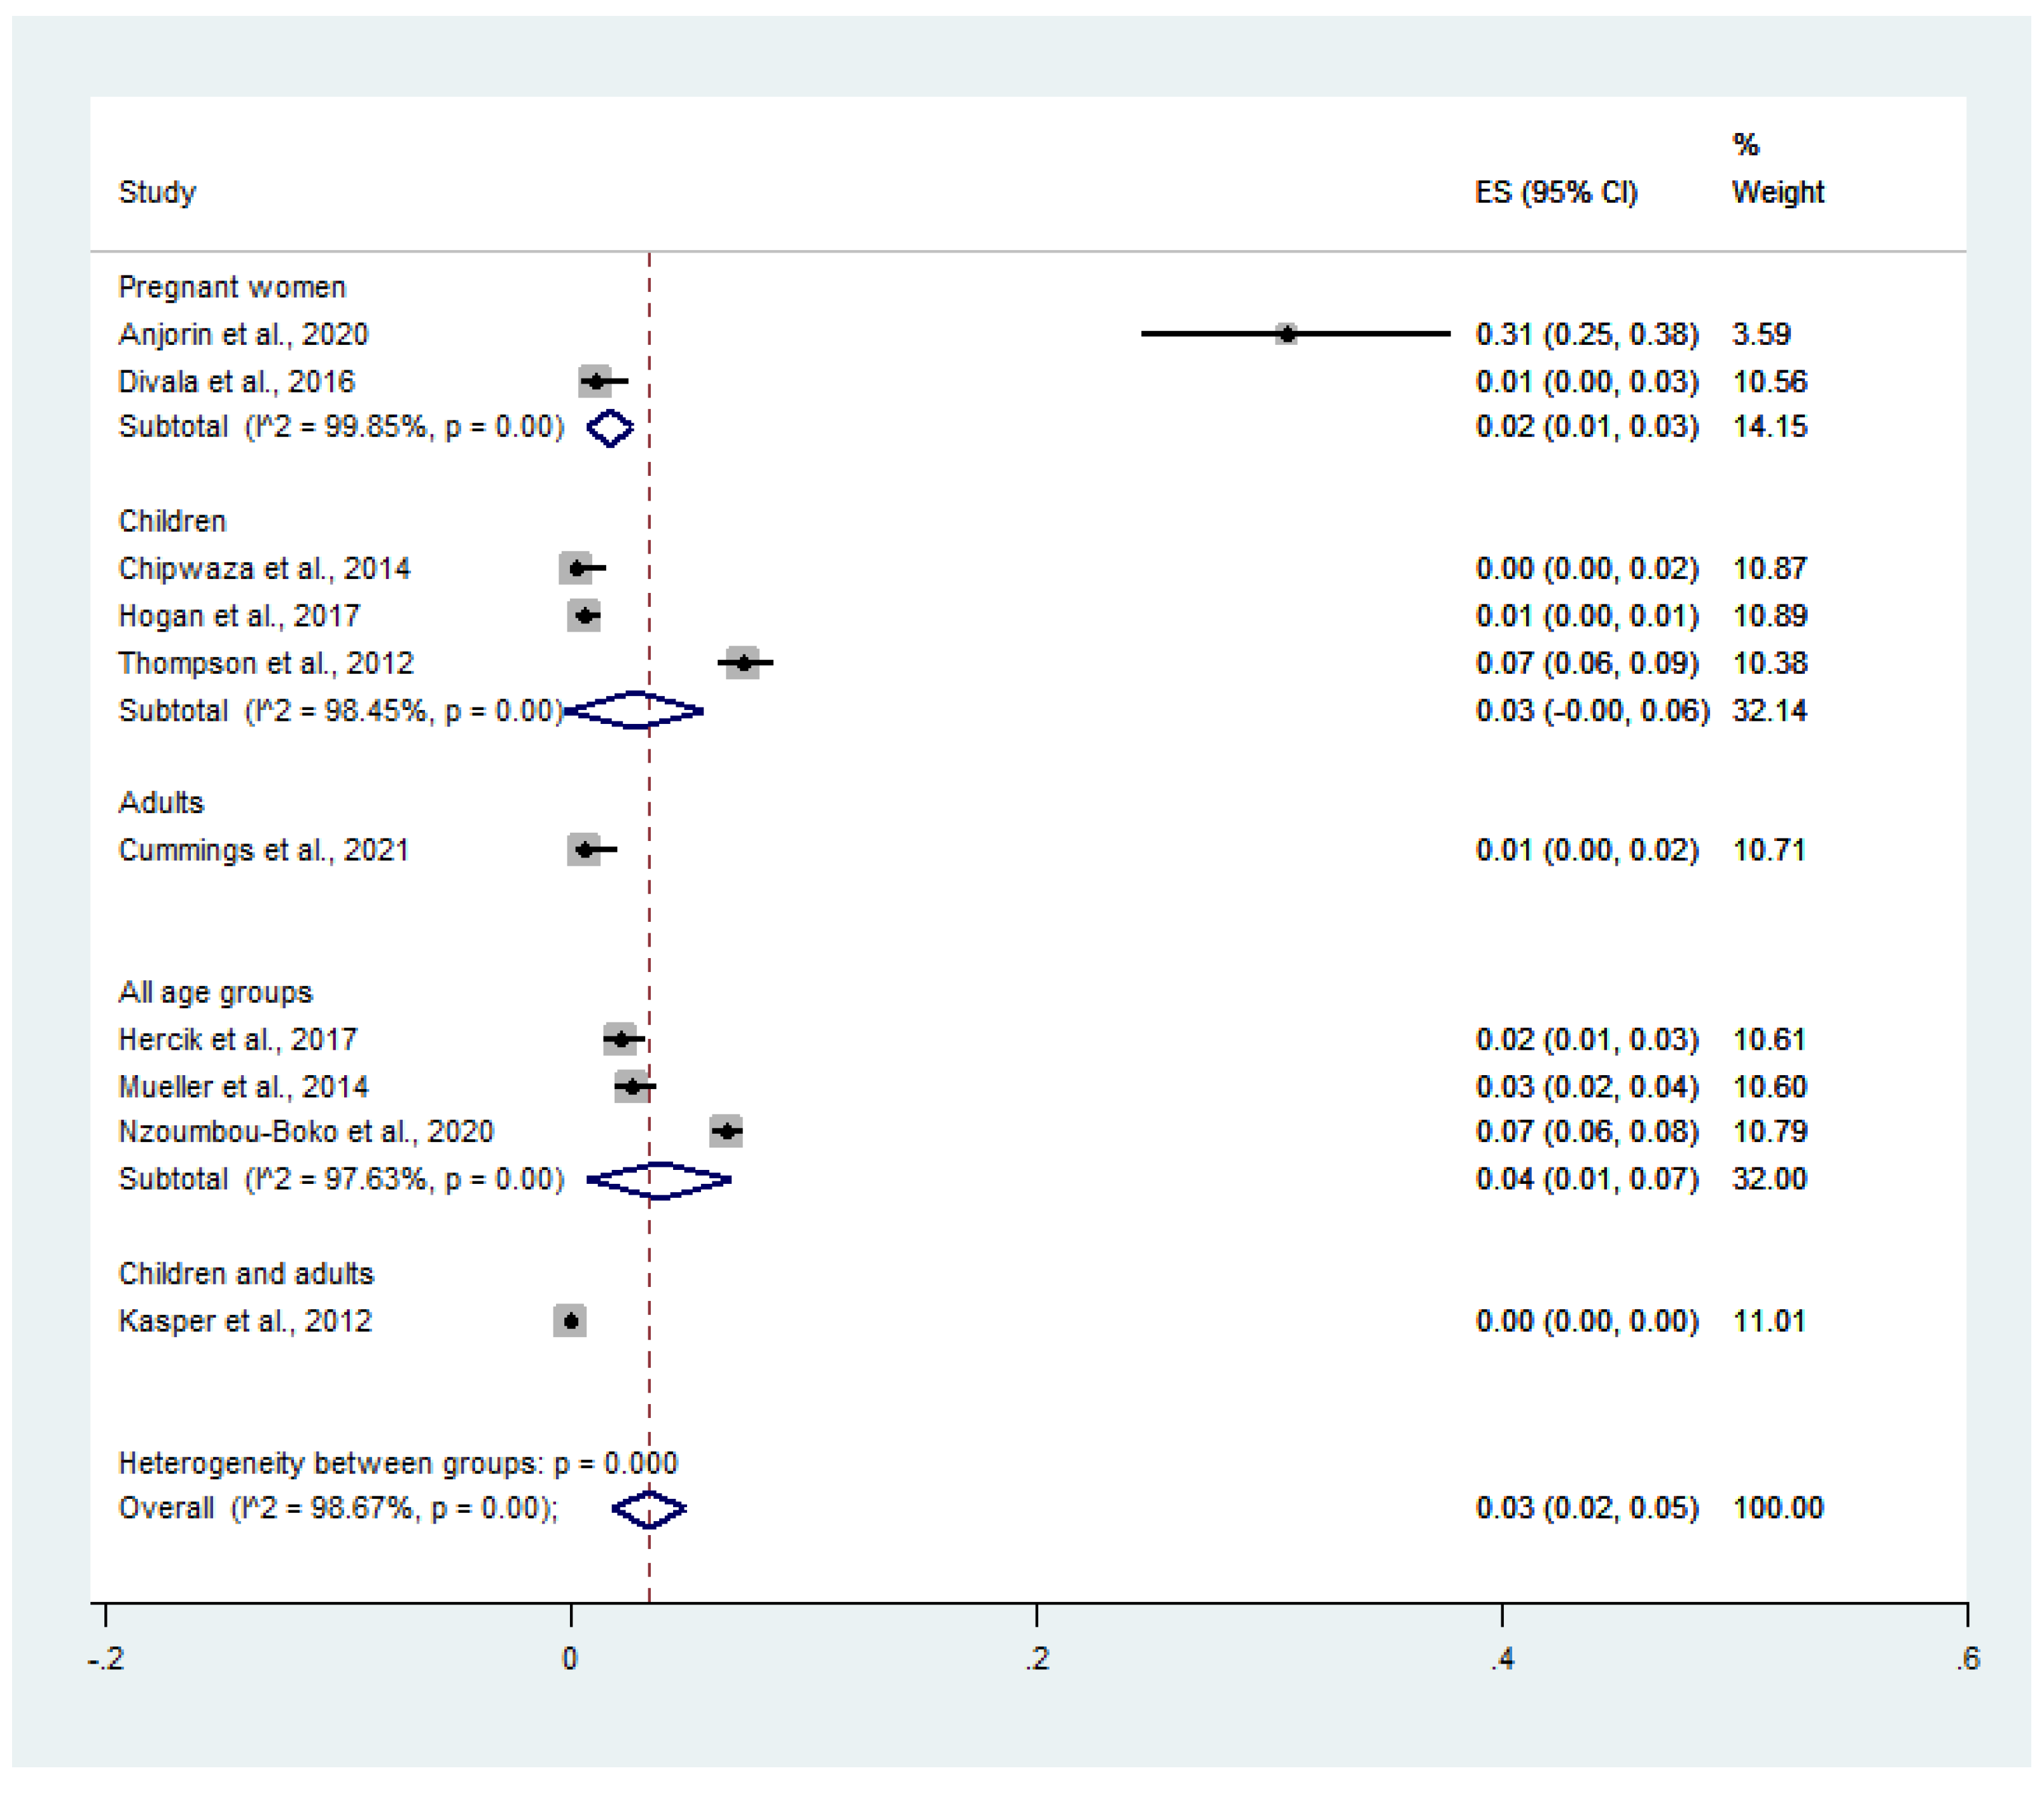
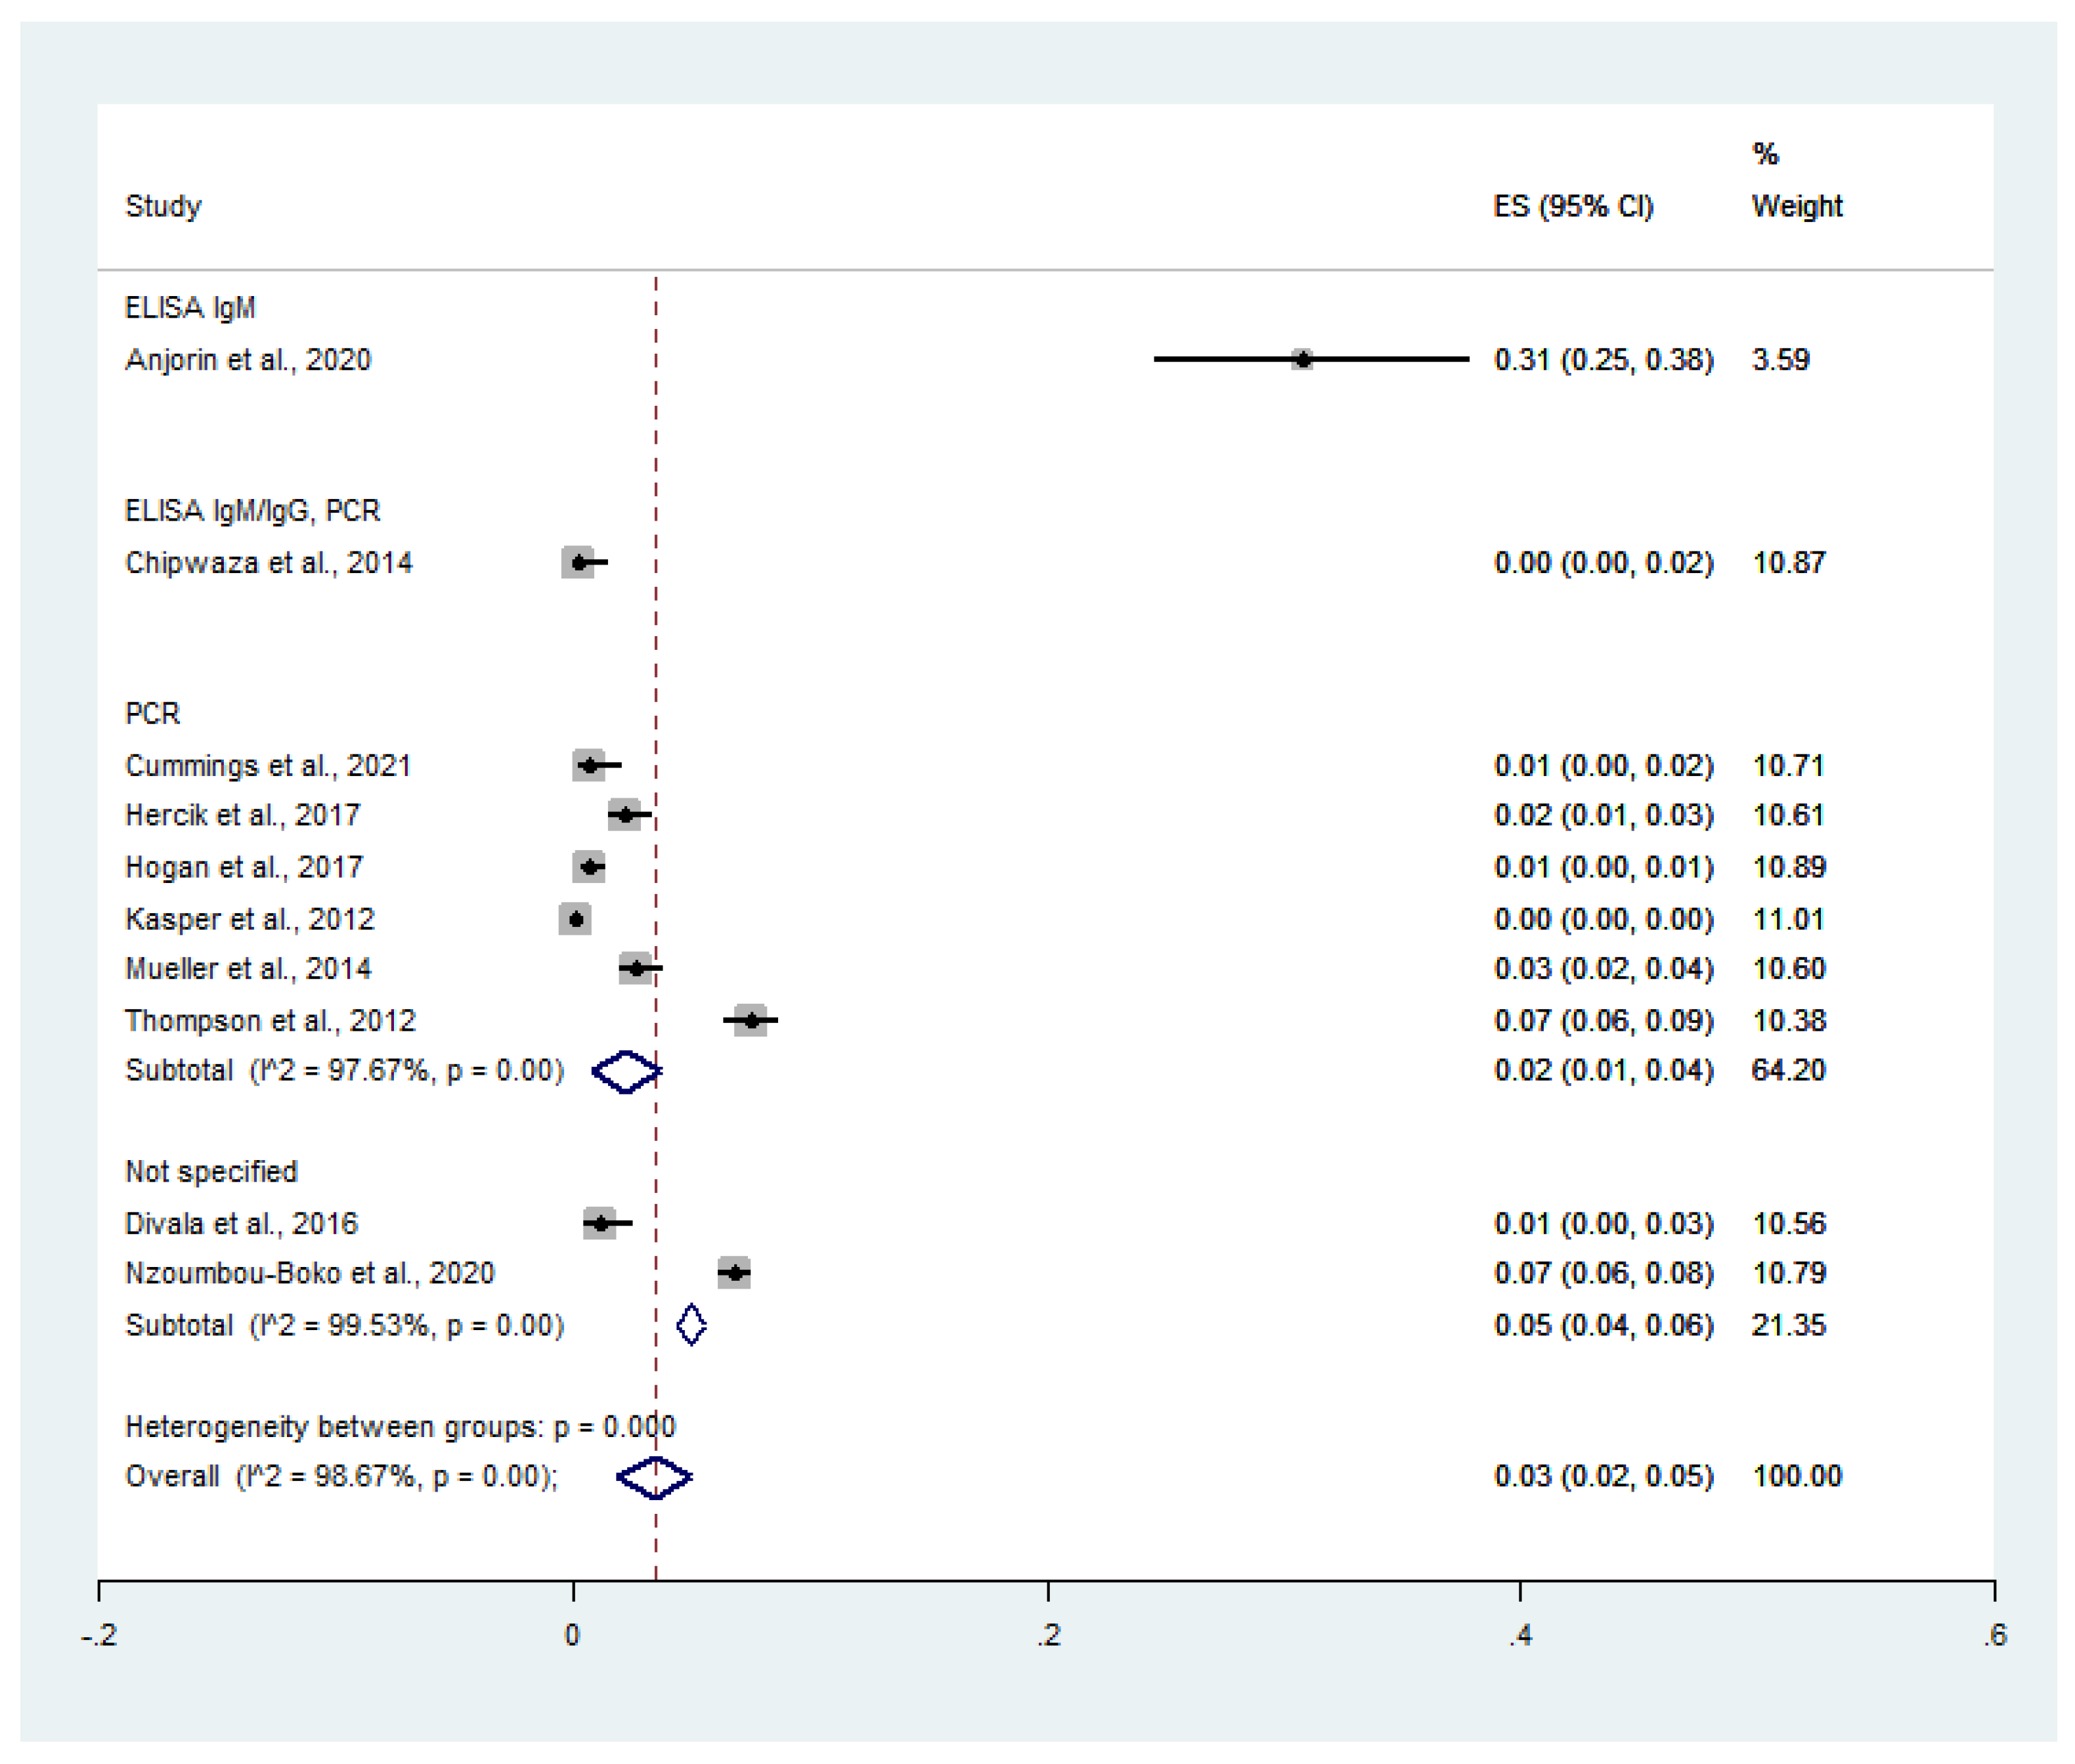
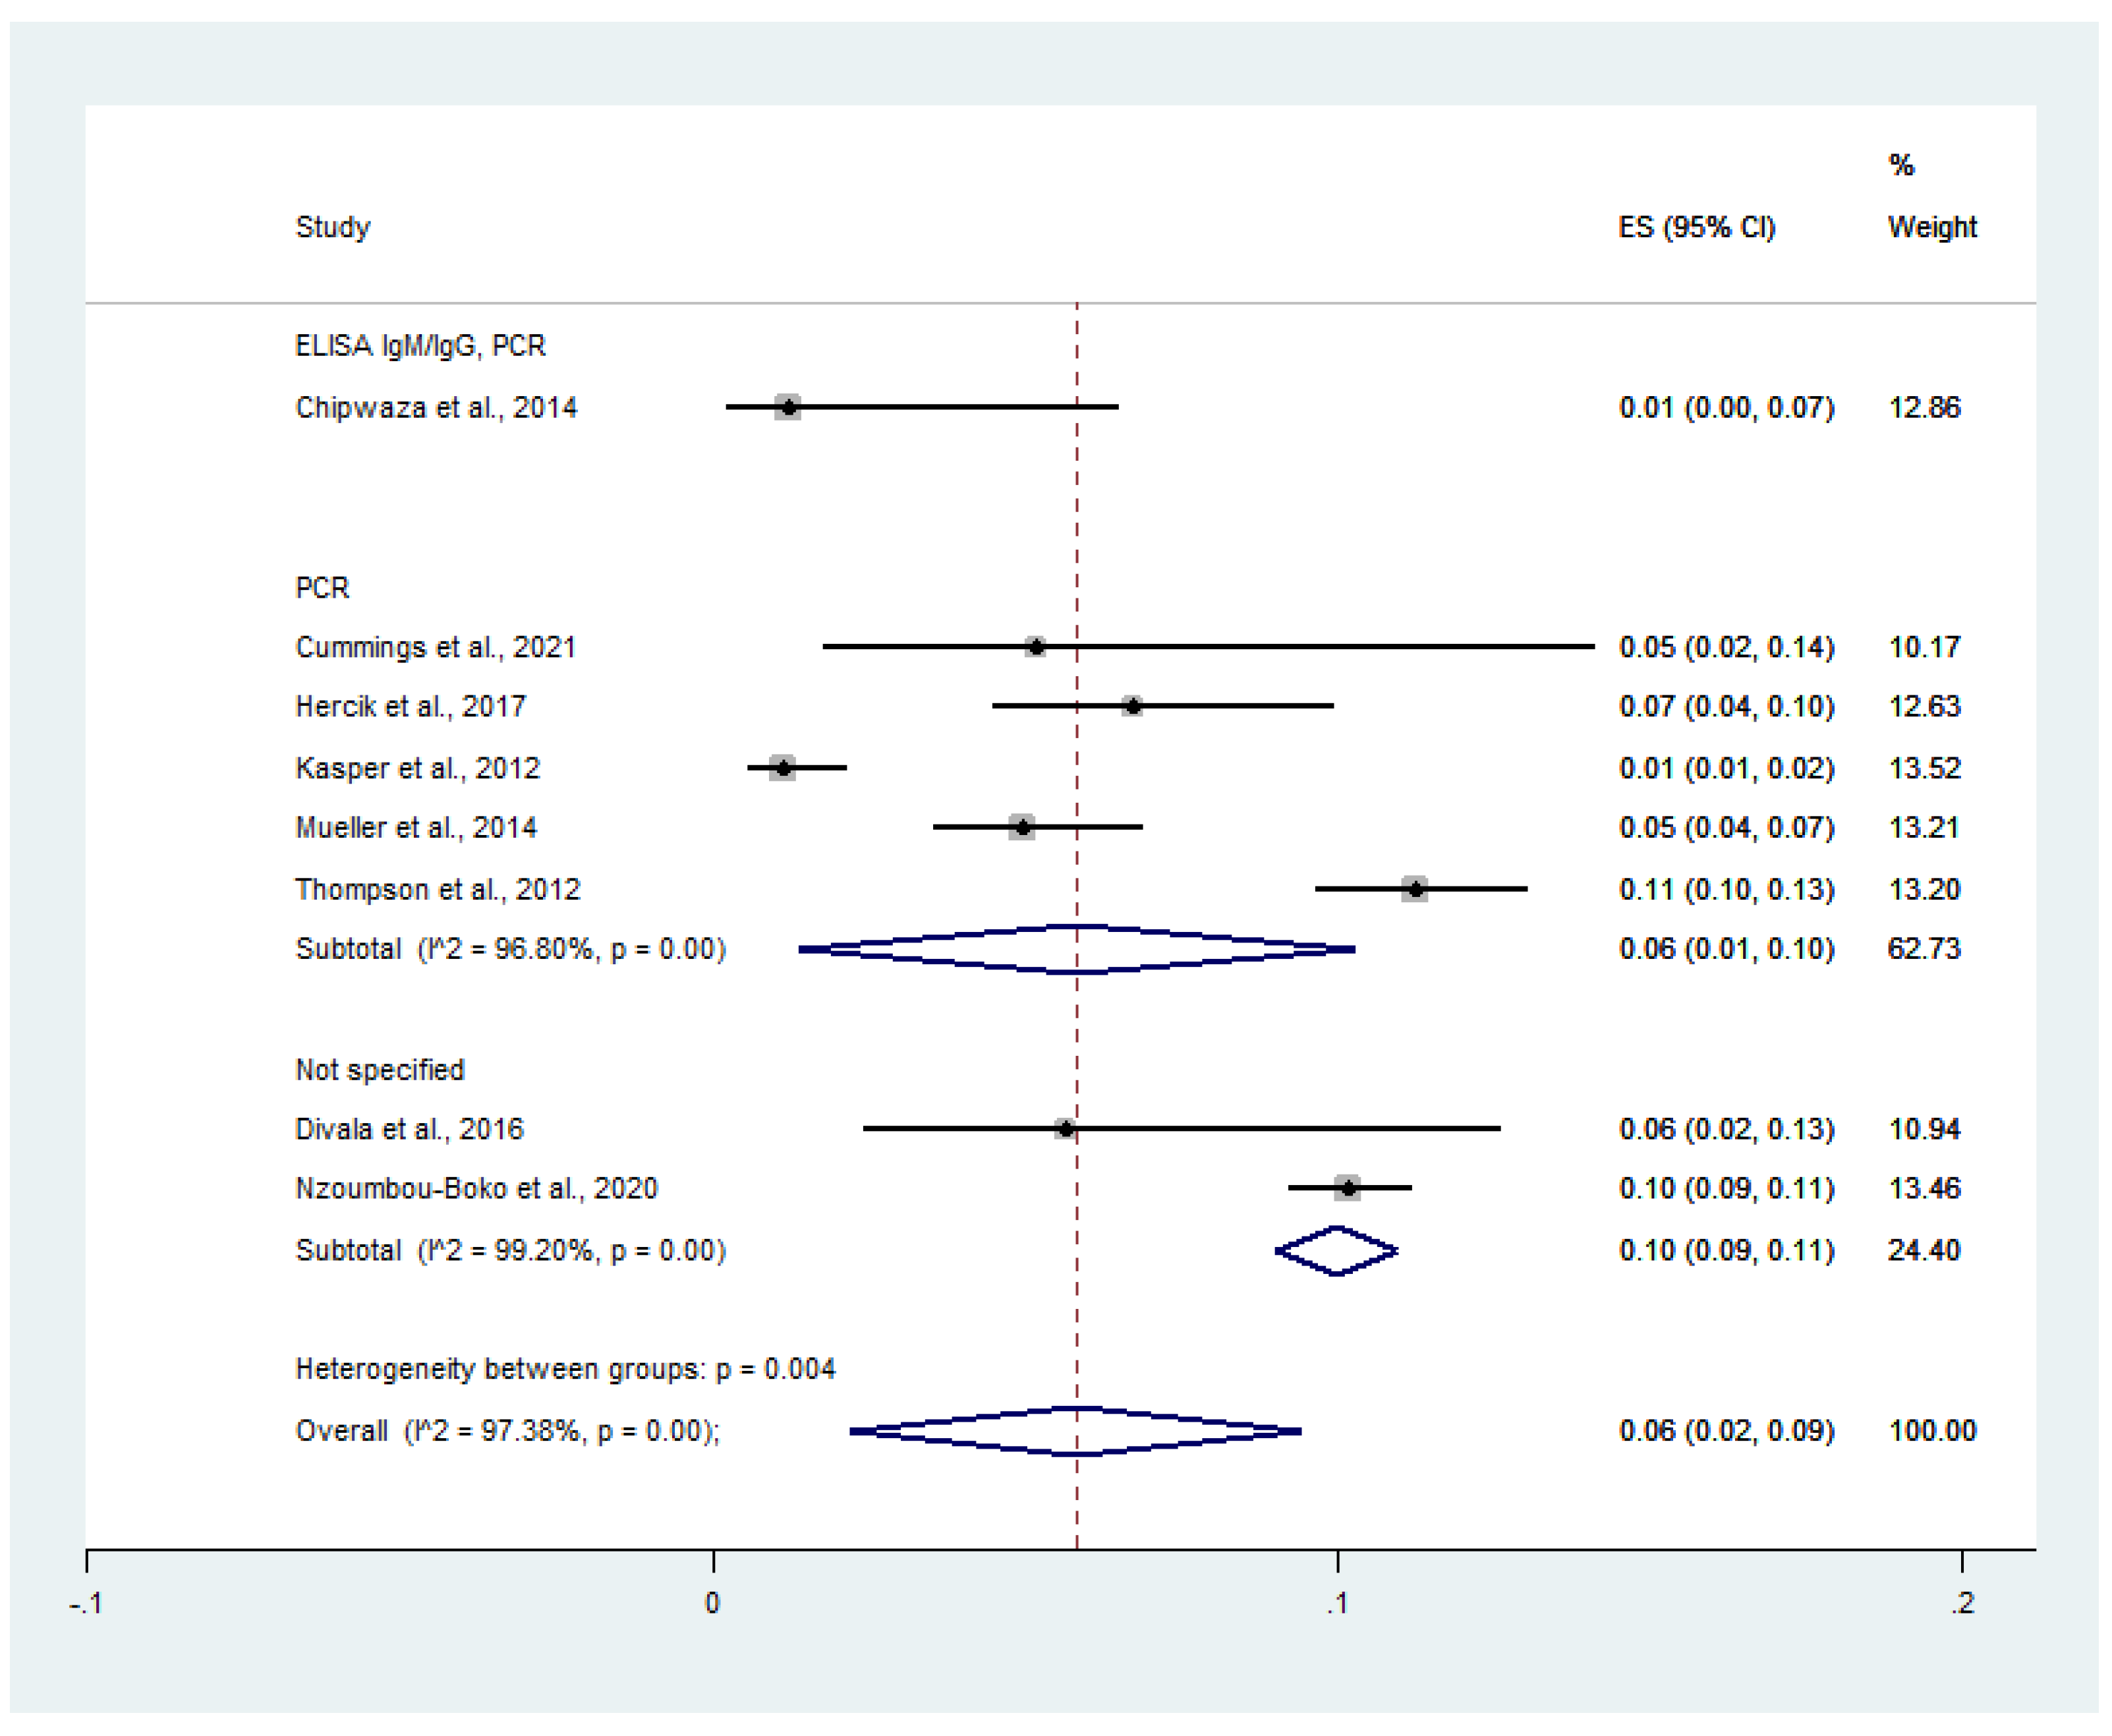
3.4. Pooled Prevalence of Malaria and Influenza Virus Co-Infection
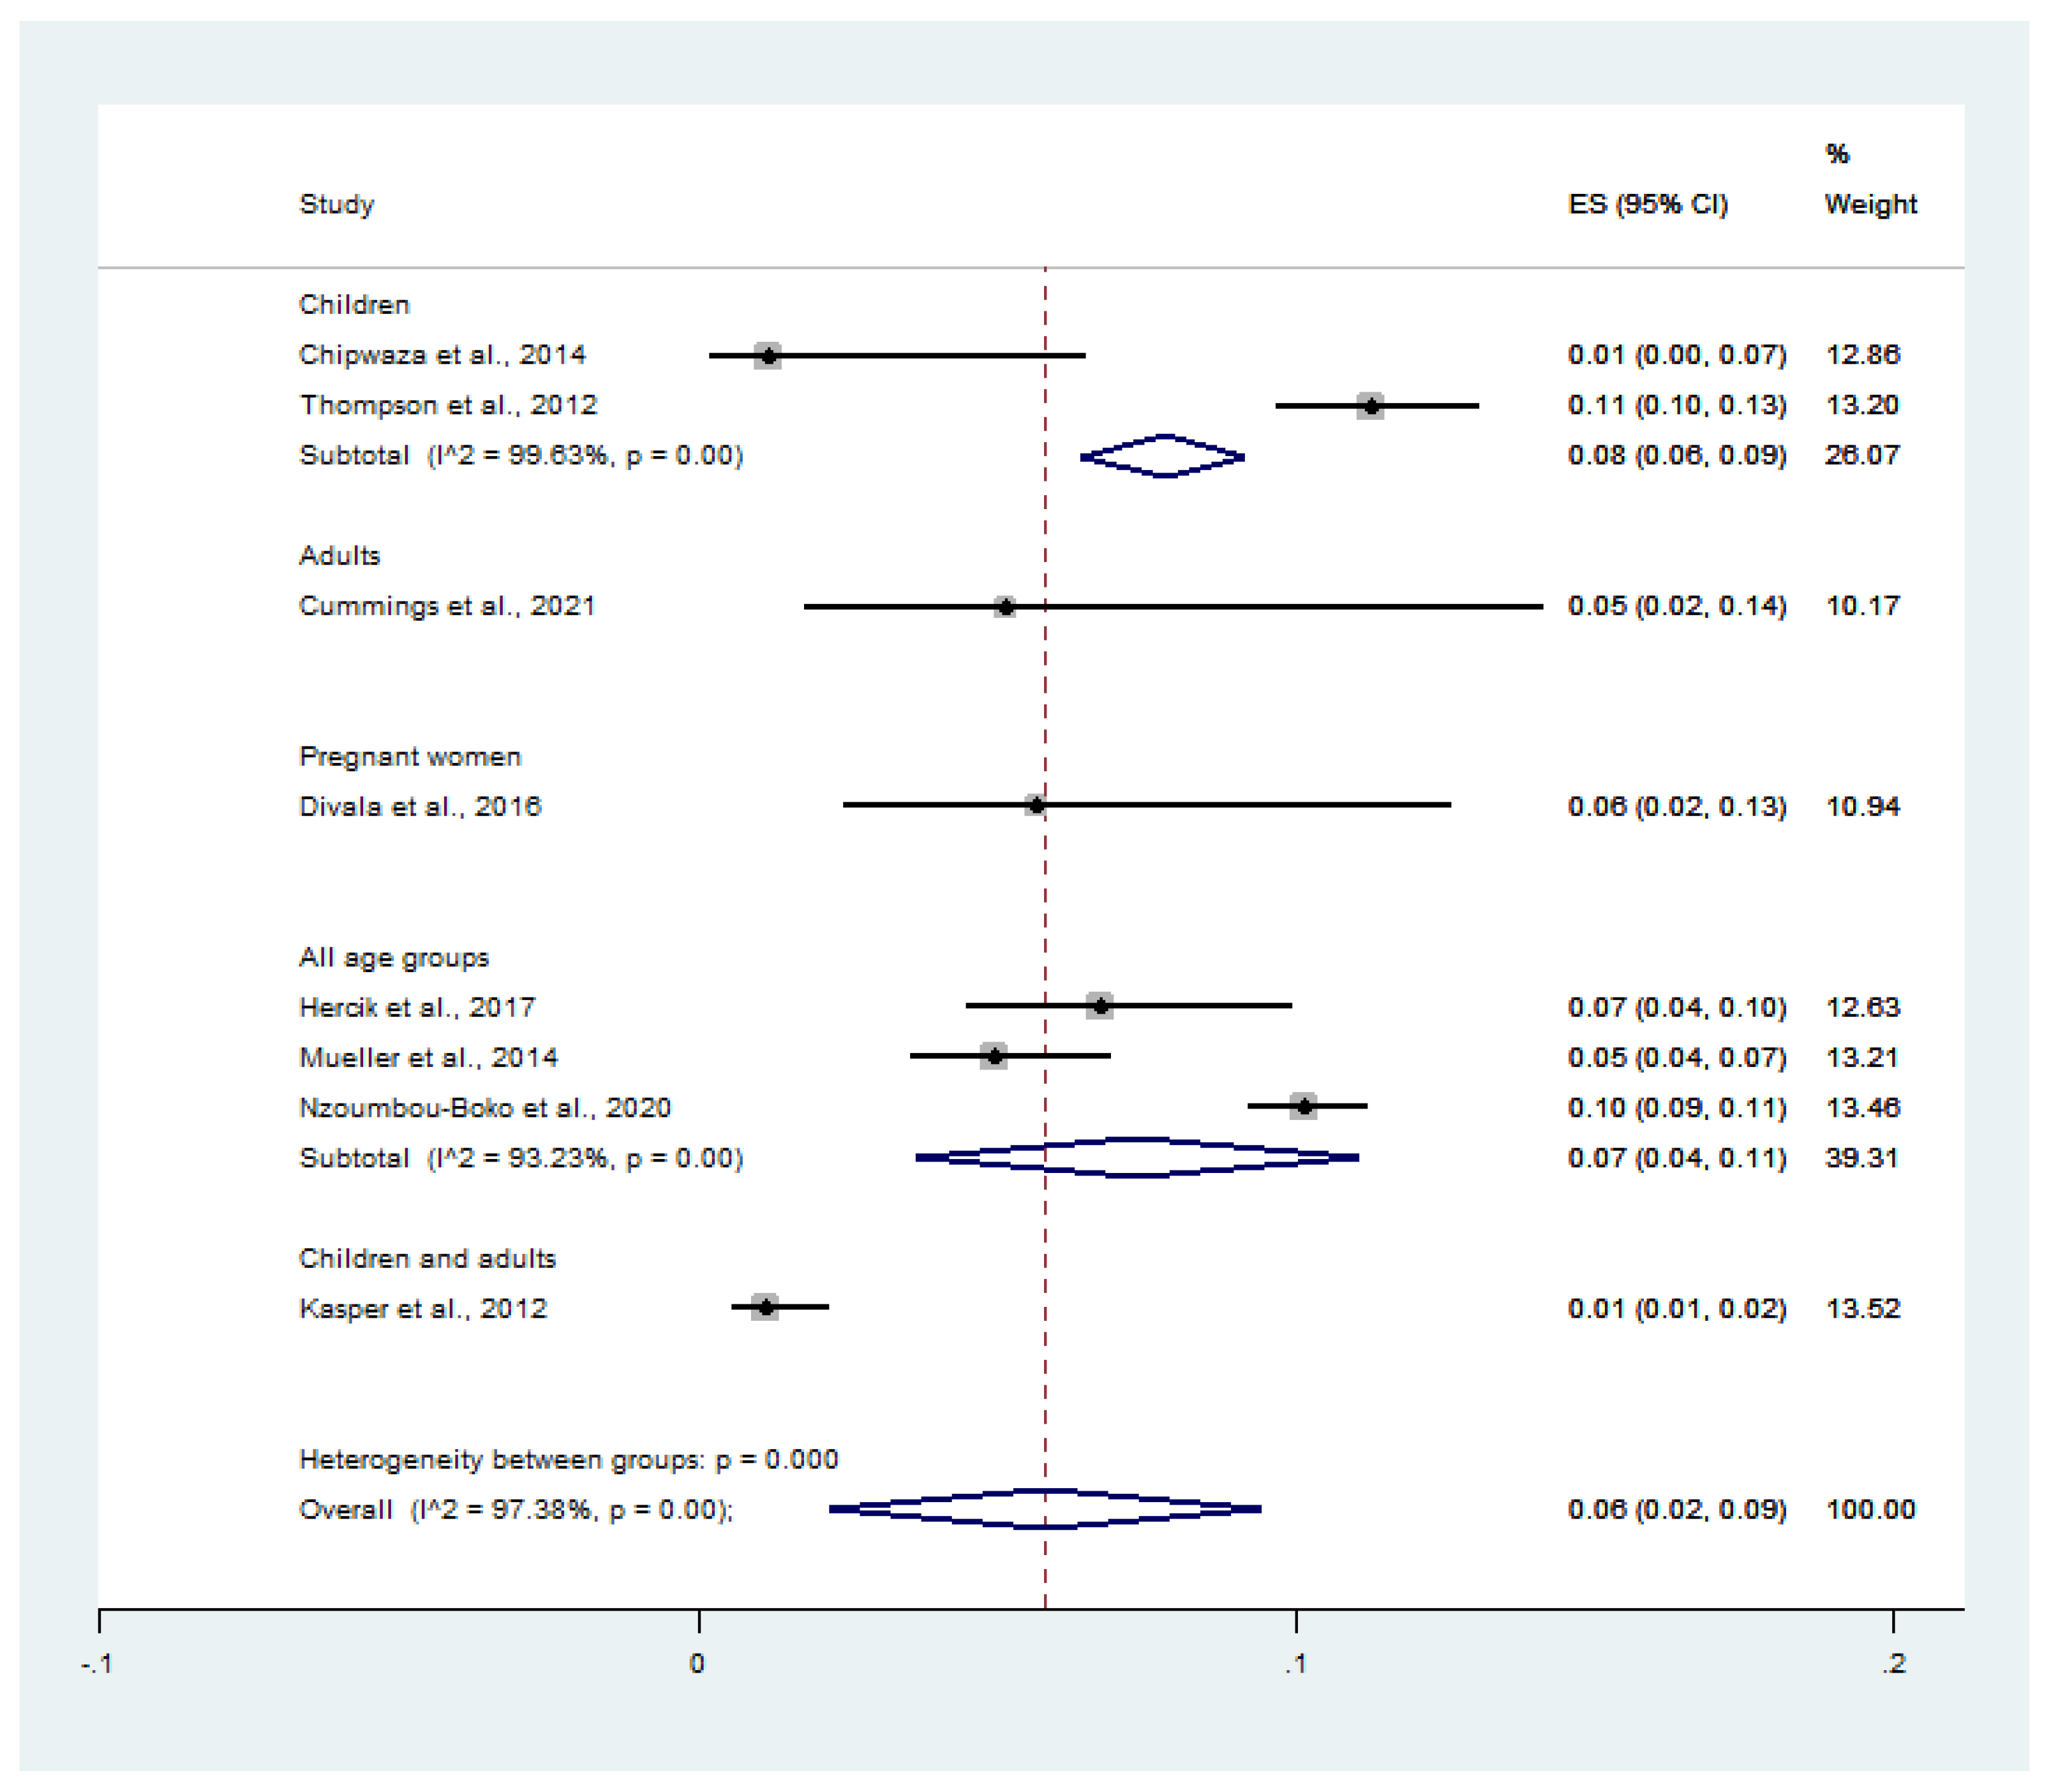
3.5. Pooled Prevalence of Influenza Virus Infection among Malaria-Positive Patients
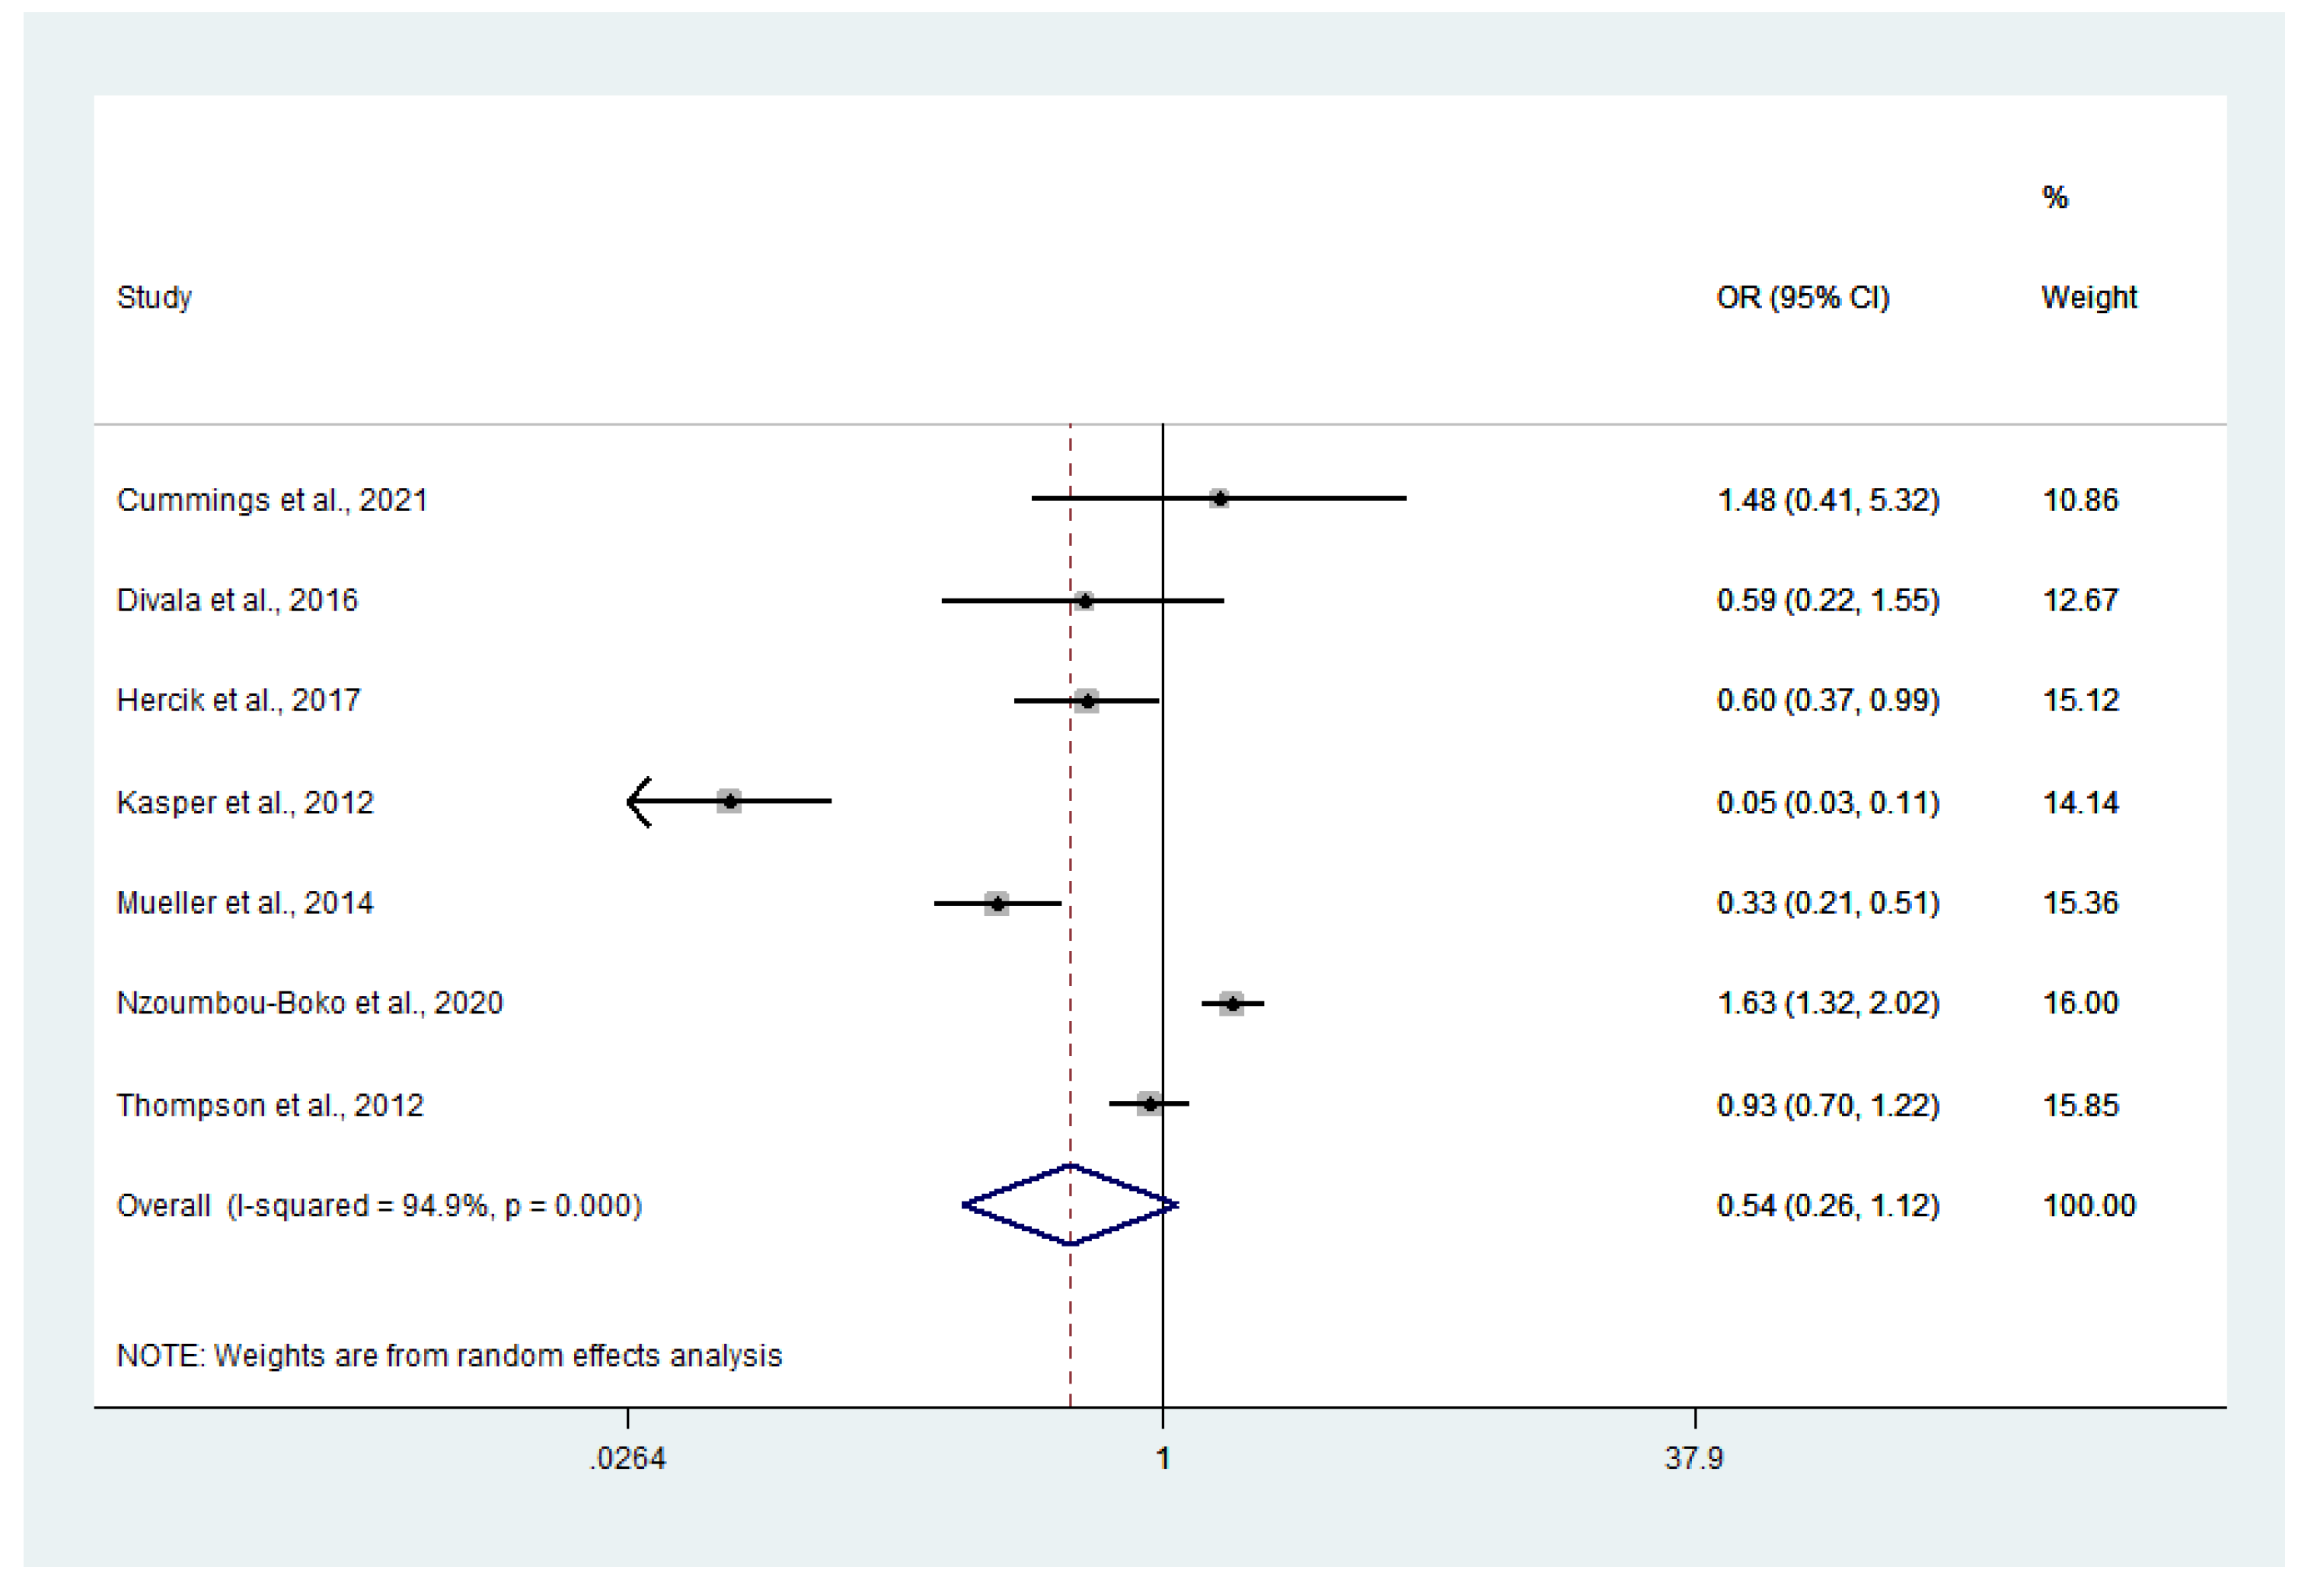
3.6. Odds of Co-Infection
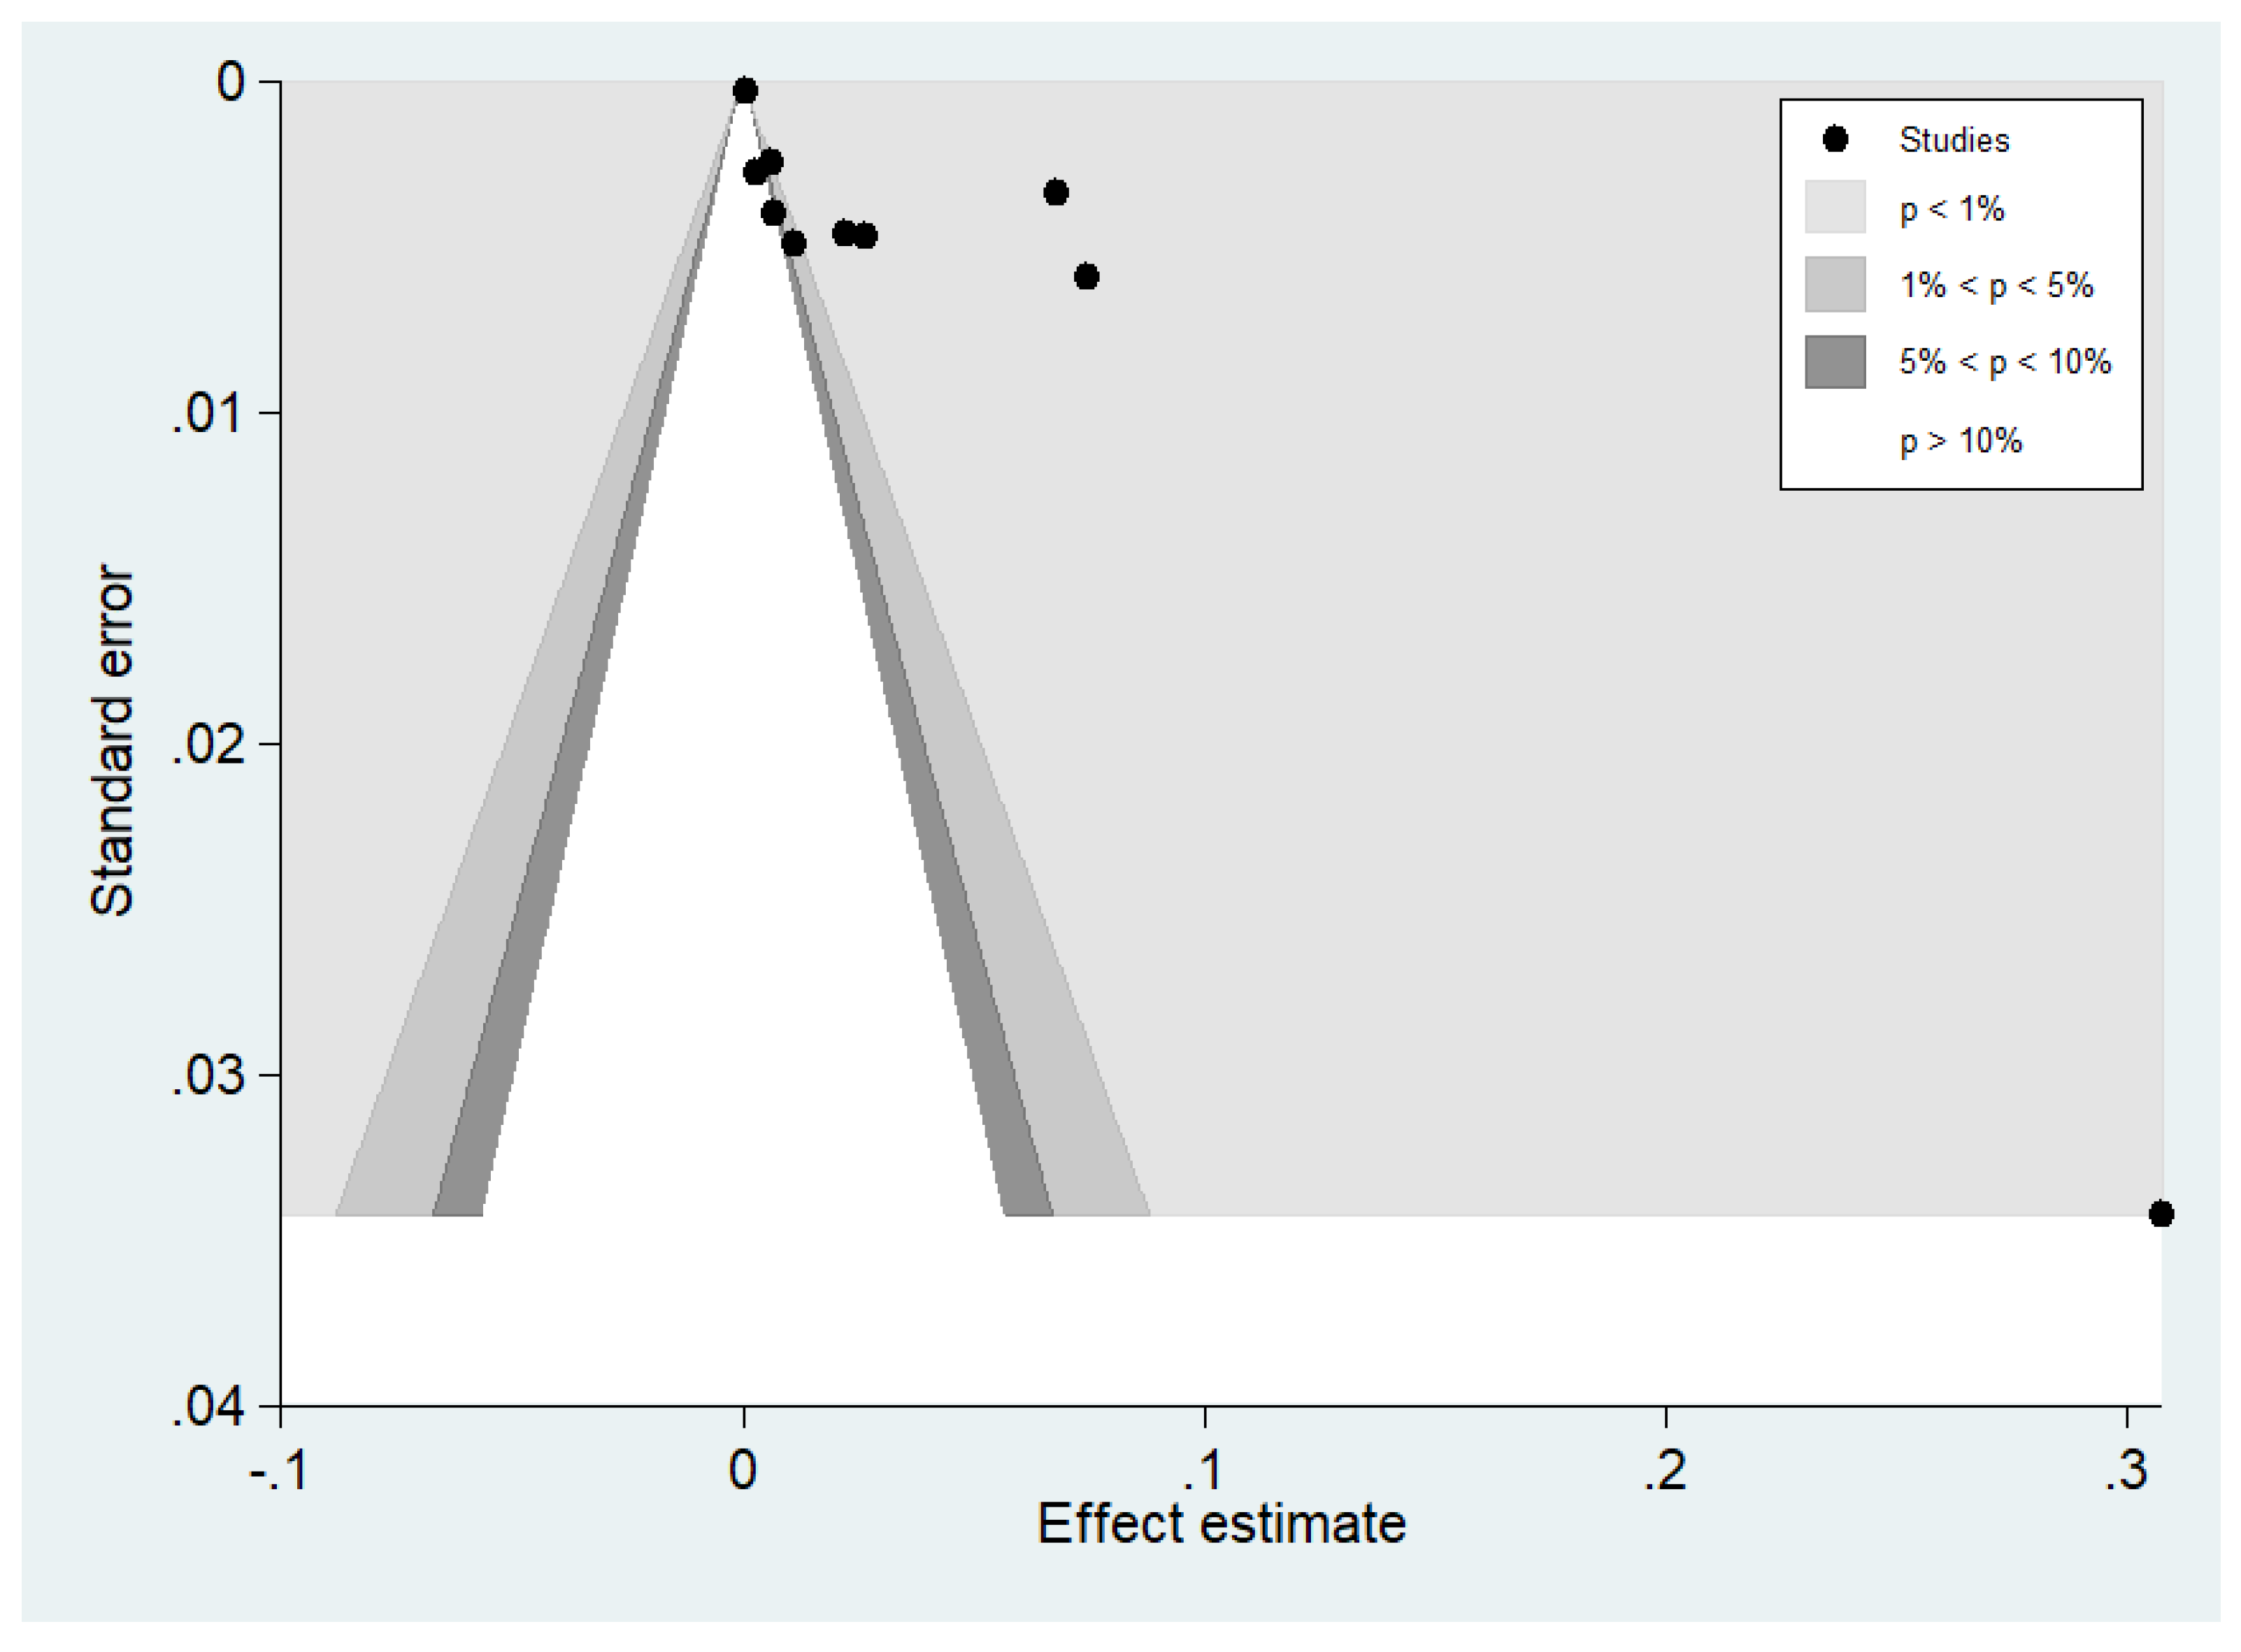
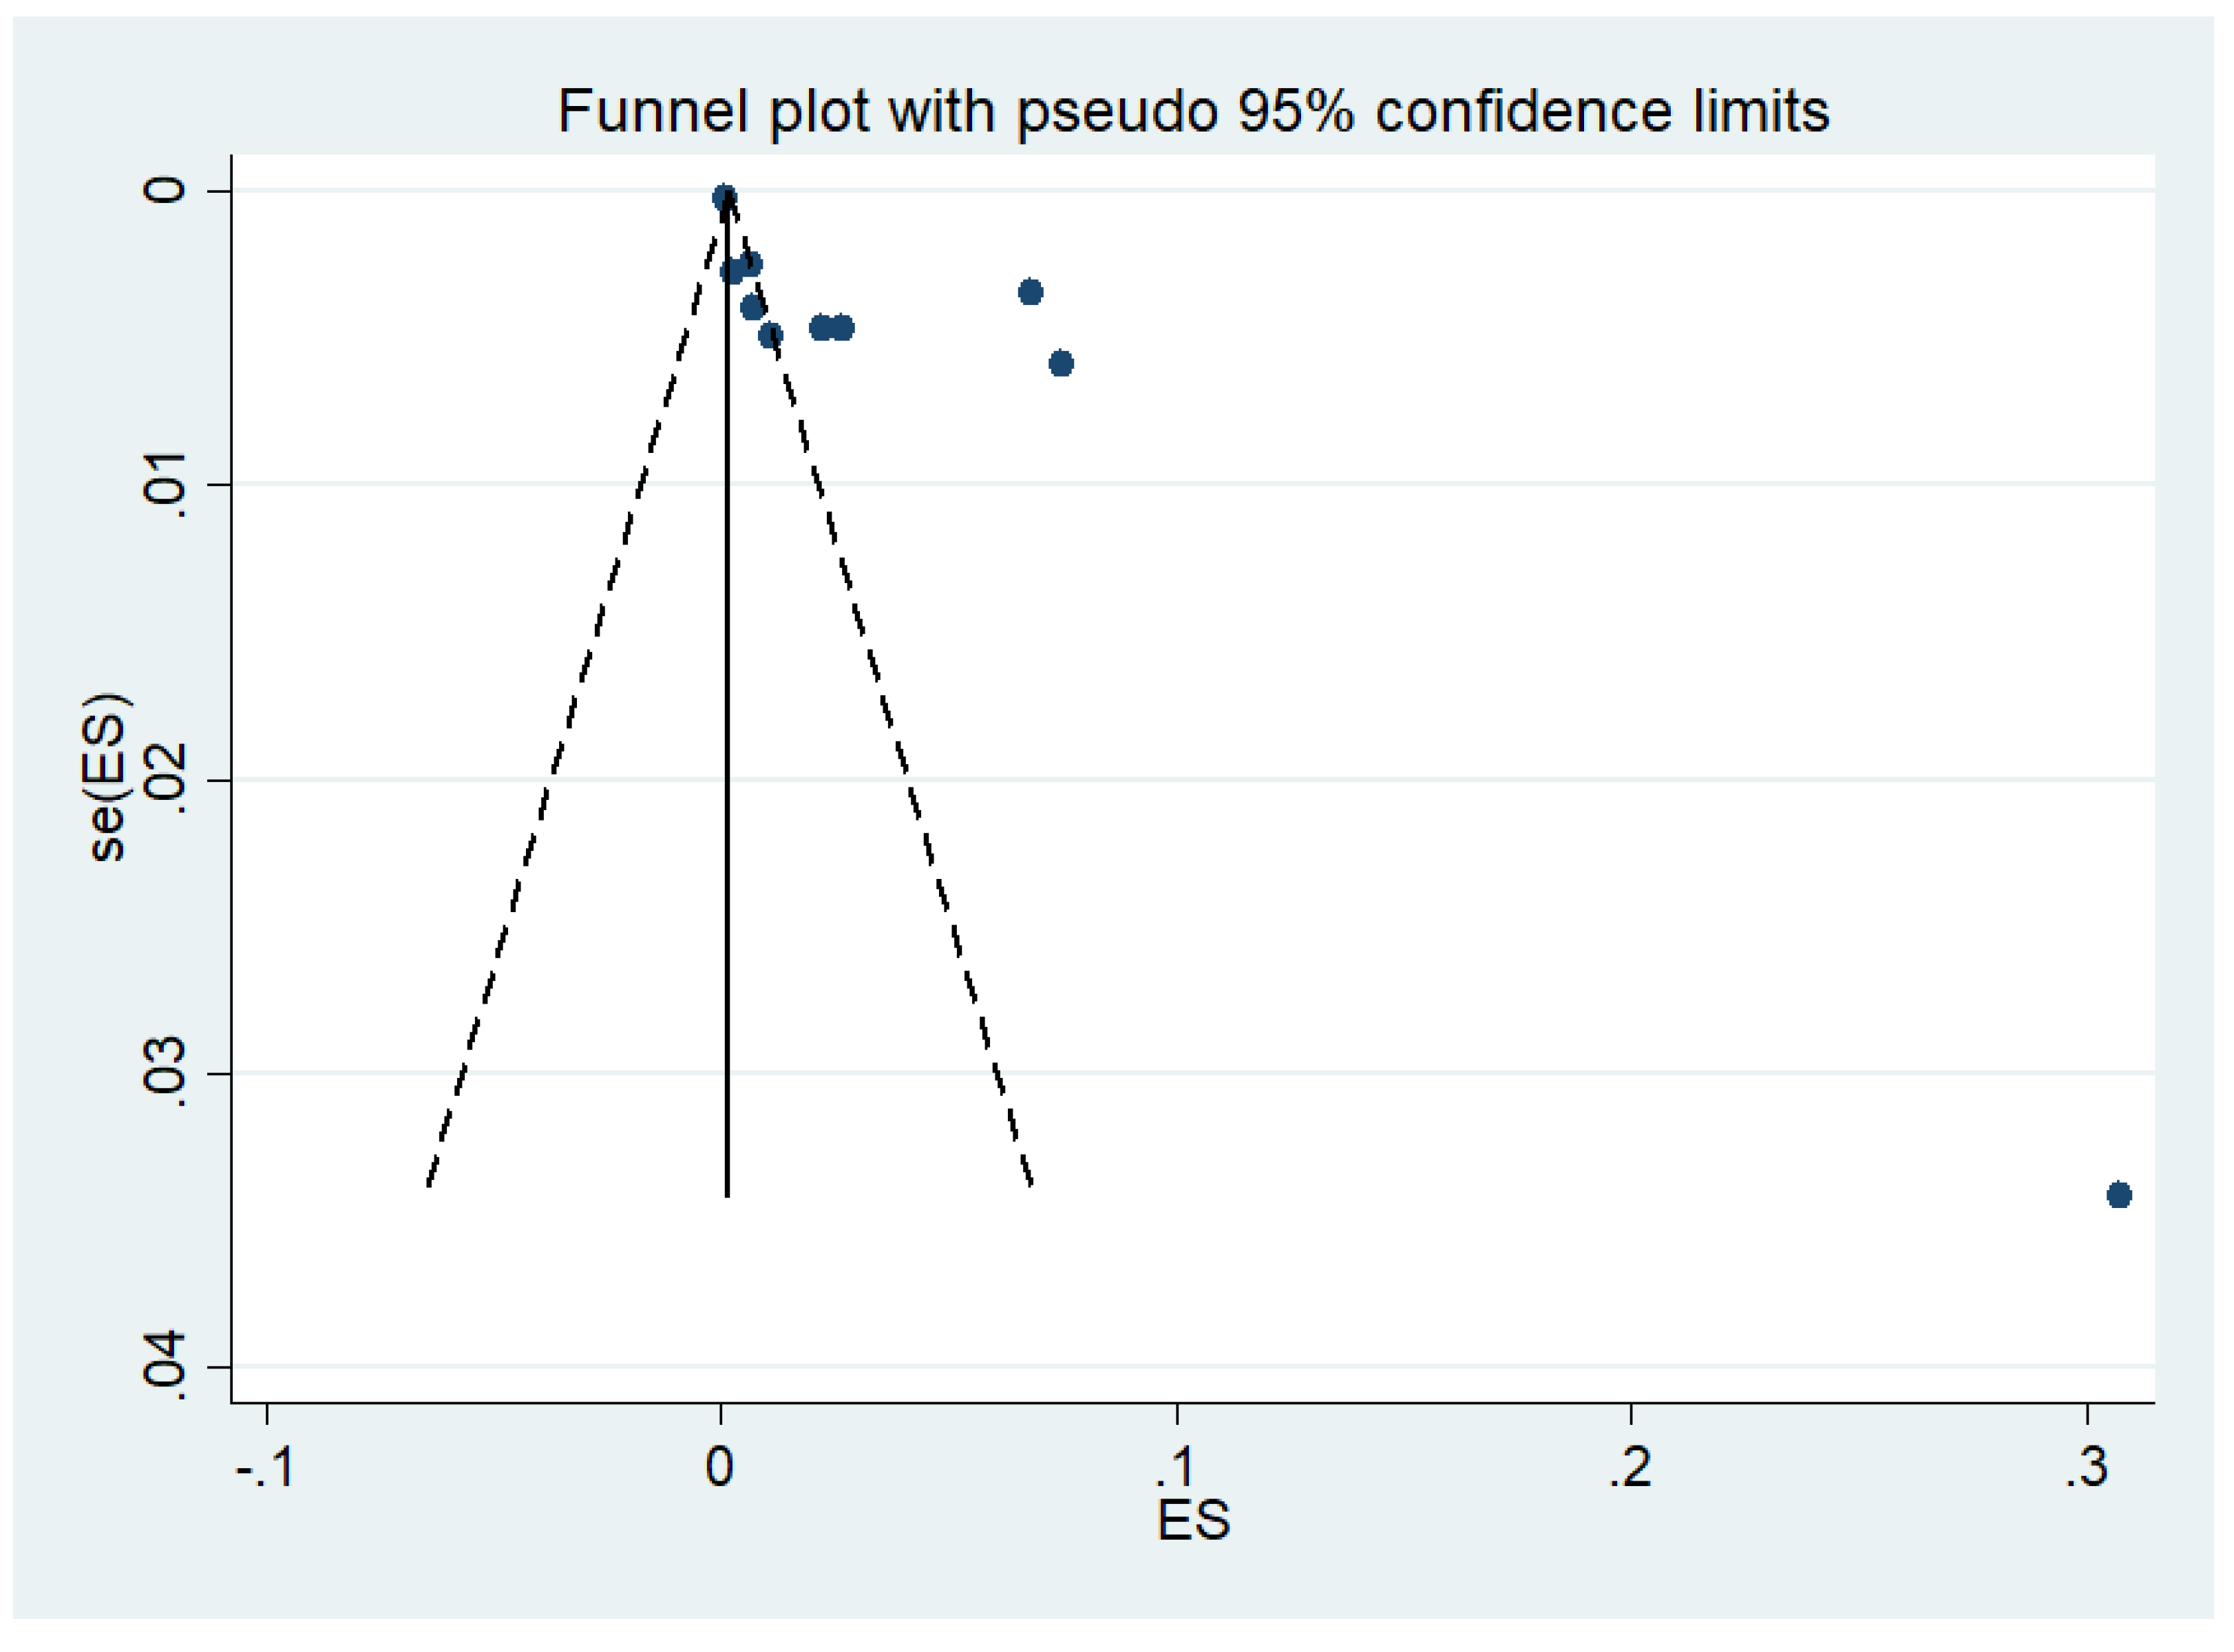
3.7. Publication Bias
4. Discussion
5. Conclusions
Supplementary Materials
Author Contributions
Funding
Institutional Review Board Statement
Informed Consent Statement
Data Availability Statement
Acknowledgments
Conflicts of Interest
Abbreviations
References
- World Health Organization. World Malaria Report 2021; WHO: Geneva, Switzerland, 2021. [Google Scholar]
- Gunalan, K.; Niangaly, A.; Thera, M.A.; Doumbo, O.K.; Miller, L.H. Plasmodium vivax infections of Duffy-negative erythrocytes: Historically undetected or a recent adaptation? Trends Parasitol. 2018, 34, 420–429. [Google Scholar] [CrossRef]
- Mendes, C.; Dias, F.; Figueiredo, J.; Mora, V.G.; Cano, J.; de Sousa, B.; do Rosario, V.E.; Benito, A.; Berzosa, P.; Arez, A.P. Duffy negative antigen is no longer a barrier to Plasmodium vivax—Molecular evidences from the African West Coast (Angola and Equatorial Guinea). PLoS Negl. Trop. Dis. 2011, 5, e1192. [Google Scholar] [CrossRef] [PubMed]
- Zimmerman, P.A. Plasmodium vivax infection in duffy-negative people in Africa. Am. J. Trop. Med. Hyg. 2017, 97, 636–638. [Google Scholar] [CrossRef] [PubMed]
- Kotepui, M.; Kotepui, K.U.; Milanez, G.J.; Masangkay, F.R. Prevalence and risk factors related to poor outcome of patients with severe Plasmodium vivax infection: A systematic review, meta-analysis, and analysis of case reports. BMC Infect. Dis. 2020, 20, 363. [Google Scholar] [CrossRef] [PubMed]
- Matlani, M.; Kojom, L.P.; Mishra, N.; Dogra, V.; Singh, V. Severe vivax malaria trends in the last two years: A study from a tertiary care centre, Delhi, India. Ann. Clin. Microbiol. Antimicrob. 2020, 19, 49. [Google Scholar] [CrossRef]
- Geleta, G.; Ketema, T. Severe malaria associated with Plasmodium falciparum and P. vivax among children in Pawe hospital, Northwest Ethiopia. Malar. Res. Treat. 2016, 2016, 1240962. [Google Scholar] [CrossRef]
- Kotepui, M.; Kotepui, K.U.; De Jesus Milanez, G.; Masangkay, F.R. Plasmodium spp. mixed infection leading to severe malaria: A systematic review and meta-analysis. Sci. Rep. 2020, 10, 11068. [Google Scholar] [CrossRef]
- Kotepui, M.; Kotepui, K.U.; Milanez, G.D.; Masangkay, F.R. Severity and mortality of severe Plasmodium ovale infection: A systematic review and meta-analysis. PLoS ONE 2020, 15, e0235014. [Google Scholar] [CrossRef]
- Kotepui, M.; Kotepui, K.U.; Milanez, G.D.; Masangkay, F.R. Global prevalence and mortality of severe Plasmodium malariae infection: A systematic review and meta-analysis. Malar. J. 2020, 19, 274. [Google Scholar] [CrossRef]
- Anjorin, A.A.A.; Nwammadu, J.E. Seroepidemiology of seasonal influenza virus among unvaccinated pregnant women in Lagos, Nigeria. Le Infez. Med. 2020, 28, 407–415. [Google Scholar]
- Ghebrehewet, S.; MacPherson, P.; Ho, A. Influenza. BMJ 2016, 355, i6258. [Google Scholar] [CrossRef] [PubMed]
- Nzoumbou-Boko, R.; Yambiyo, B.M.; Ngoagouni, C.; Vickos, U.; Manirakiza, A.; Nakouné, E. Falciparum Malaria in febrile patients at sentinel sites for influenza surveillance in the Central African Republic from 2015 to 2018. Interdiscip. Perspect. Infect. Dis. 2020, 2020, 3938541. [Google Scholar] [CrossRef] [PubMed]
- Thompson, M.G.; Breiman, R.F.; Hamel, M.J.; Desai, M.; Emukule, G.; Khagayi, S.; Shay, D.K.; Morales, K.; Kariuki, S.; Bigogo, G.M.; et al. Influenza and malaria coinfection among young children in western Kenya, 2009-2011. J. Infect. Dis. 2012, 206, 1674–1684. [Google Scholar] [CrossRef]
- Iuliano, A.D.; Roguski, K.M.; Chang, H.H.; Muscatello, D.J.; Palekar, R.; Tempia, S.; Cohen, C.; Gran, J.M.; Schanzer, D.; Cowling, B.J.; et al. Estimates of global seasonal influenza-associated respiratory mortality: A modelling study. Lancet 2018, 391, 1285–1300. [Google Scholar] [CrossRef]
- Grobusch, M.P.; Kremsner, P.G. Uncomplicated malaria. Curr. Top. Microbiol. Immunol. 2005, 295, 83–104. [Google Scholar]
- Dalrymple, U.; Cameron, E.; Bhatt, S.; Weiss, D.J.; Gupta, S.; Gething, P.W. Quantifying the contribution of Plasmodium falciparum malaria to febrile illness amongst African children. eLife 2017, 6, e29198. [Google Scholar] [CrossRef] [PubMed]
- Liberati, A.; Altman, D.G.; Tetzlaff, J.; Mulrow, C.; Gotzsche, P.C.; Ioannidis, J.P.; Clarke, M.; Devereaux, P.J.; Kleijnen, J.; Moher, D. The PRISMA statement for reporting systematic reviews and meta-analyses of studies that evaluate healthcare interventions: Explanation and elaboration. BMJ 2009, 339, b2700. [Google Scholar] [CrossRef]
- Moola, S.M.Z.; Tufanaru, C.; Aromataris, E.; Sears, K.; Sfetcu, R.; Currie, M.; Qureshi, R.; Mattis, P.; Lisy, K.; Mu, P.-F. Chapter 7: Systematic reviews of etiology and risk. In JBI Manual for Evidence Synthesis; Aromataris, E.M.Z., Ed.; JBI: Adelaide, Australia, 2020. [Google Scholar]
- Chipwaza, B.; Mugasa, J.P.; Selemani, M.; Amuri, M.; Mosha, F.; Ngatunga, S.D.; Gwakisa, P.S. Dengue and Chikungunya fever among viral diseases in outpatient febrile children in Kilosa district hospital, Tanzania. PLoS Negl. Trop. Dis. 2014, 8, e3335. [Google Scholar] [CrossRef]
- Cummings, M.J.; Bakamutumaho, B.; Owor, N.; Kayiwa, J.; Namulondo, J.; Byaruhanga, T.; Muwanga, M.; Nsereko, C.; Baldwin, M.R.; Lutwama, J.J.; et al. Stratifying sepsis in Uganda using rapid pathogen diagnostics and clinical data: A prospective cohort study. Am. J. Trop. Med. Hyg. 2021, 105, 517–524. [Google Scholar] [CrossRef]
- Divala, T.H.; Kalilani-Phiri, L.; Mawindo, P.; Nyirenda, O.; Kapito-Tembo, A.; Laufer, M.K. Incidence and seasonality of influenza-like illnesses among pregnant women in Blantyre, Malawi. Am. J. Trop. Med. Hyg. 2016, 95, 915–917. [Google Scholar] [CrossRef]
- Hercik, C.; Cosmas, L.; Mogeni, O.D.; Wamola, N.; Kohi, W.; Omballa, V.; Ochieng, M.; Lidechi, S.; Bonventure, J.; Ochieng, C.; et al. A diagnostic and epidemiologic investigation of acute febrile illness (AFI) in Kilombero, Tanzania. PLoS ONE 2017, 12, e0189712. [Google Scholar] [CrossRef] [PubMed]
- Hogan, B.; Ammer, L.; Zimmermann, M.; Binger, T.; Krumkamp, R.; Sarpong, N.; Rettig, T.; Dekker, D.; Kreuels, B.; Reigl, L.; et al. Burden of influenza among hospitalized febrile children in Ghana. Influenza Other Respir. Viruses 2017, 11, 497–501. [Google Scholar] [CrossRef] [PubMed]
- Kasper, M.R.; Blair, P.J.; Touch, S.; Sokhal, B.; Yasuda, C.Y.; Williams, M.; Richards, A.L.; Burgess, T.H.; Wierzba, T.F.; Putnam, S.D. Infectious etiologies of acute febrile illness among patients seeking health care in south-central Cambodia. Am. J. Trop. Med. Hyg. 2012, 86, 246–253. [Google Scholar] [CrossRef] [PubMed]
- Mueller, T.C.; Siv, S.; Khim, N.; Kim, S.; Fleischmann, E.; Ariey, F.; Buchy, P.; Guillard, B.; González, I.J.; Christophel, E.M.; et al. Acute undifferentiated febrile illness in rural Cambodia: A 3-year prospective observational study. PLoS ONE 2014, 9, e95868. [Google Scholar] [CrossRef]
- Mala, W.; Wilairatana, P.; Kotepui, K.U.; Kotepui, M. Prevalence of malaria and chikungunya co-infection in febrile patients: A systematic review and meta-analysis. Trop. Med. Infect. Dis. 2021, 6, 119. [Google Scholar] [CrossRef]
- Wilairatana, P.; Mala, W.; Rattaprasert, P.; Kotepui, K.U.; Kotepui, M. Prevalence of malaria and leptospirosis co-infection among febrile patients: A systematic review and meta-analysis. Trop. Med. Infect. Dis. 2021, 6, 122. [Google Scholar] [CrossRef]
- Kotepui, M.; Kotepui, K.U. Prevalence and laboratory analysis of malaria and dengue co-infection: A systematic review and meta-analysis. BMC Public Health 2019, 19, 1148. [Google Scholar] [CrossRef]
- Cohen, C.; Simonsen, L.; Kang, J.W.; Miller, M.; McAnerney, J.; Blumberg, L.; Schoub, B.; Madhi, S.A.; Viboud, C. Elevated influenza-related excess mortality in South African elderly individuals, 1998-2005. Clin. Infect. Dis. 2010, 51, 1362–1369. [Google Scholar] [CrossRef]
- Phiri, M.; Gooding, K.; Peterson, I.; Mambule, I.; Nundwe, S.; McMorrow, M.; Desmond, N. Dust or disease? Perceptions of influenza in rural Southern Malawi. PLoS ONE 2019, 14, e0208155. [Google Scholar] [CrossRef]
- McMorrow, M.L.; Wemakoy, E.O.; Tshilobo, J.K.; Emukule, G.O.; Mott, J.A.; Njuguna, H.; Waiboci, L.; Heraud, J.M.; Rajatonirina, S.; Razanajatovo, N.H.; et al. Severe acute respiratory illness deaths in sub-saharan Africa and the role of influenza: A case series from 8 countries. J. Infect. Dis. 2015, 212, 853–860. [Google Scholar] [CrossRef]
- Nyamusore, J.; Rukelibuga, J.; Mutagoma, M.; Muhire, A.; Kabanda, A.; Williams, T.; Mutoni, A.; Kamwesiga, J.; Nyatanyi, T.; Omolo, J.; et al. The national burden of influenza-associated severe acute respiratory illness hospitalization in Rwanda, 2012-2014. Influenza Other Respir. Viruses 2018, 12, 38–45. [Google Scholar] [CrossRef] [PubMed]
- Waitumbi, J.N.; Kuypers, J.; Anyona, S.B.; Koros, J.N.; Polhemus, M.E.; Gerlach, J.; Steele, M.; Englund, J.A.; Neuzil, K.M.; Domingo, G.J. Outpatient upper respiratory tract viral infections in children with malaria symptoms in Western Kenya. Am. J. Trop. Med. Hyg. 2010, 83, 1010–1013. [Google Scholar] [CrossRef] [PubMed]
- Wang, H.; Zhao, J.; Xie, N.; Wang, W.; Qi, R.; Hao, X.; Liu, Y.; Sevalie, S.; Niu, G.; Zhang, Y.; et al. A prospective study of etiological agents among febrile patients in Sierra Leone. Infect. Dis. Ther. 2021, 10, 1645–1664. [Google Scholar] [CrossRef] [PubMed]
- Vemula, S.V.; Zhao, J.; Liu, J.; Wang, X.; Biswas, S.; Hewlett, I. Current approaches for diagnosis of influenza virus infections in humans. Viruses 2016, 8, 96. [Google Scholar] [CrossRef] [PubMed]


| Authors, Year | Study Site | Study Duration | Study Design | Participants | Age (Years) | Age Range (Years) | Co-Infections | Malaria Cases | Test for Malaria | Test for Influenza |
|---|---|---|---|---|---|---|---|---|---|---|
| Anjorin et al., 2020 | Nigeria | 2016–2018 | Observational study | 182 pregnant women with influenza-like illness | Median 29 | 18–45 | 56 | 56 | NS | ELISA IgM |
| Chipwaza et al., 2014 | Tanzania | 2013 | Observational study | 364 febrile children | NS | 2–13 | 1 | 83 | Microscopy | ELISA IgM, IgG, PCR |
| Cummings et al., 2021 | Uganda | 2017–2019 | Prospective cohort study | 431 febrile adults hospitalized with suspected sepsis | Median 32 | IQR: 26–42 | 3 | 58 | RDT | PCR |
| Divala et al., 2016 | Malawi | 2009–2010 | Prospective cohort study | 450 pregnant women | 20.2 ± 0.25 | ≥15 | 5 | 88 | Microscopy | NS |
| Hercik et al., 2017 | Tanzania | 2014–2015 | Prospective observational study | 997 febrile patients | Median 23 | 1–79 | 22 | 327 | RDT, Microscopy | PCR |
| Hogan et al., 2017 | Ghana | 2014–2015 | Prospective observational study | 1063 febrile children | Median 2 | IQR: 1–4 | 7 | NS | Microscopy | PCR |
| Kasper et al., 2012 | Cambodia | 2006–2009 | Prospective observational study | 9997 febrile patients | Median 13 | IQR: 6–28 | 8 | 716 | Microscopy | PCR |
| Mueller et al., 2014 | Cambodia | 2008–2010 | Prospective observational study | 1193 febrile patients | Mean 23.4 ± 10.6 | 7–49 | 32 | 644 | RDT, PCR | PCR |
| Nzoumbou-Boko et al., 2020 | The Central African Republic | 2015–2018 | Retrospective observational study | 5397 febrile patients | Median 11 | 2 months to 78 years | 367 | 3609 | RDT | NS |
| Thompson et al., 2012 | Kenya | 2009–2011 | Retrospective observational study | 1992 febrile patients | Mean 2.31 ± 1.34 | 0–5 | 149 | 1322 | Microscopy | PCR |
Publisher’s Note: MDPI stays neutral with regard to jurisdictional claims in published maps and institutional affiliations. |
© 2022 by the authors. Licensee MDPI, Basel, Switzerland. This article is an open access article distributed under the terms and conditions of the Creative Commons Attribution (CC BY) license (https://creativecommons.org/licenses/by/4.0/).
Share and Cite
Wilairatana, P.; Mala, W.; Kotepui, K.U.; Kotepui, M. Prevalence and Characteristics of Malaria and Influenza Co-Infection in Febrile Patients: A Systematic Review and Meta-Analysis. Trop. Med. Infect. Dis. 2022, 7, 168. https://doi.org/10.3390/tropicalmed7080168
Wilairatana P, Mala W, Kotepui KU, Kotepui M. Prevalence and Characteristics of Malaria and Influenza Co-Infection in Febrile Patients: A Systematic Review and Meta-Analysis. Tropical Medicine and Infectious Disease. 2022; 7(8):168. https://doi.org/10.3390/tropicalmed7080168
Chicago/Turabian StyleWilairatana, Polrat, Wanida Mala, Kwuntida Uthaisar Kotepui, and Manas Kotepui. 2022. "Prevalence and Characteristics of Malaria and Influenza Co-Infection in Febrile Patients: A Systematic Review and Meta-Analysis" Tropical Medicine and Infectious Disease 7, no. 8: 168. https://doi.org/10.3390/tropicalmed7080168
APA StyleWilairatana, P., Mala, W., Kotepui, K. U., & Kotepui, M. (2022). Prevalence and Characteristics of Malaria and Influenza Co-Infection in Febrile Patients: A Systematic Review and Meta-Analysis. Tropical Medicine and Infectious Disease, 7(8), 168. https://doi.org/10.3390/tropicalmed7080168