Abstract
Virtual reality (VR) technology is becoming increasingly relevant as a modern educational tool. However, its application in teaching and learning computational thinking remains relatively underexplored. This paper presents the implementation of selected tasks from the international Bebras Challenge in a VR environment called ThinkLand. A comparative study was conducted to evaluate the usability of the developed game across two interface types: mobile devices and desktop computers. A total of 100 participants, including high school and university students, took part in the study. The overall usability rating was classified as “good”, suggesting that ThinkLand holds promise as a platform for supporting computational thinking education. To assess specific aspects of interface usability, a custom Virtual Environment Usability Questionnaire (VEUQ) was developed. Regression analysis was performed to examine the relationship between participants’ age, gender, and interface type with both learning performance and perceived usability, as measured by the VEUQ. The analysis revealed statistically significant differences in interaction patterns between device types, providing practical insights for improving interface design. Validated in this study, the VEUQ proved to be an effective instrument for informing interaction design and guiding the development of educational VR applications for both mobile and desktop platforms.
1. Introduction
The international Bebras Challenge, which originated in Lithuania and was launched in 2004, has grown into a global educational initiative engaging more than 3 million elementary and high school students across more than 80 countries [1]. The goal of the competition is to help students discover their talent and foster interest in computational thinking (CT) through engaging and challenging tasks that emphasize problem-solving and logical reasoning, without requiring prior coding knowledge. Computational thinking as defined by Wing [2] is a way of thinking that involves a set of skills and techniques to solve problems, design systems, and understand human behavior by drawing on the concepts fundamental to computer science. The four key techniques to CT are decomposition (breaking down complex problem into smaller parts), pattern recognition (finding similarities or sequences in problems or data), abstraction (focusing on important and ignoring irrelevant details) and algorithm design (implementing step by step instructions for solving problems) [3]. Simply put, CT encourages a systematic and logical approach to problem-solving and therefore can be useful in many disciplines, beyond computer science. Recent studies, as reviewed in [4], highlight the positive impact of serious and digital games in educational on students’ engagement, motivation, and development of CT. The findings support the notion that incorporating game-based elements into educational curricula can be an effective strategy for enhancing computational competencies among students.
The potential of utilizing tasks from the Bebras Challenge to inspire the design of educational games aimed at enhancing CT skills is the subject of extensive research and studies have consistently found that Bebras tasks serve as a valuable source of inspiration for designing CT games, e.g., [5]. By integrating Bebras tasks into innovative and disruptive learning environments, such as virtual reality (VR), we can achieve a balanced level of educational and entertainment aspects and further enhance students’ engagement and CT skills. VR allows for the visualization of complex and abstract concepts, which can help students better understand and apply CT principles. For example, students can manipulate 3D virtual objects to understand algorithmic thinking or logical structures. While direct studies combining Bebras tasks with VR are limited, research indicates that adapting CT in VR can foster CT skills [6].
However, the usability of VR games designed to enhance CT skills is often reported in the literature as below optimal, and careful evaluation and iterative design improvements are usually required. For instance, a study by Agbo et al. [7] on the iThinkSmart VR game-based application highlights that, while VR can increase motivation and engagement, it may also introduce challenges such as higher cognitive load and usability issues. The authors note that “the VR features such as immersion, interactivity, immediacy, aesthetics, and presentational fidelity... could have contributed to their higher cognitive benefits”, yet they also acknowledge that further usability enhancements are needed to fully realize the potential of supporting students in CT. Sukirman et al. [8] also emphasize that usability issues can hinder learning outcomes in VR games for CT education and that careful usability evaluations are necessary.
In this paper, we present ThinkLand, an interactive game that adapts Bebras tasks to a VR environment. We describe the interaction design within the developed game and reports on a systematic usability evaluation. Employing a mixed-methods approach that combines quantitative data analysis with qualitative interpretation, the research offers valuable insights into both overall usability and specific aspects of the game interface where usability challenges are identified. A custom-designed questionnaire was used to investigate context-specific usability issues, with particular attention given to differences between mobile and desktop platforms. Guided by established principles of human–computer interaction, the findings will inform the potential redesign strategies for the ThinkLand interface, ensuring that its highly interactive elements support rather than hinder the learning process and the achievement of meaningful educational outcomes.
The paper is structured as follows. Section 2 provides a literature review on the use of VR in education, with particular emphasis on CT education. Section 3 presents ThinkLand. Section 4 outlines the applied instruments and methods, covering both the pilot study and main study. Section 5 presents the results. Section 6 provides interpretation and discussion of findings. Section 7 concludes the paper.
2. Related Work
It is difficult to provide a single definition of VR, especially after the emergence of terms such as augmented reality (AR) and extended reality (ER), which often complement or overlap. For the purpose of this article, VR will be defined as a technology that enables users to engage in a computer-generated environment designed to simulate aspects of reality.
VR systems can be categorized based on the degree of immersion they provide. In [9], immersion is defined as an objective, technology-based property of VR system. Immersion is described as the extent to which the system delivers an inclusive, extensive, surrounding, and vivid illusion of reality to the senses of a human participant. Depending on the level of immersion experienced by the user, VR is most commonly classified into three categories: fully immersive, semi-immersive, and non-immersive [10,11], with each category based on the degree of sensory engagement and the type of technology used. Fully immersive VR completely isolates a user from the real world and provides full sensory engagement using head-mounted displays (HMDs) and motion tracking. Semi-immersive VR uses larger displays or multi-display systems, and the user is only partially immersed, e.g., CAVE systems and flight simulators. In non-immersive VR, users remain aware of the physical environment. Interaction with VR is provided through VR applications displayed on standard screens (desktop or mobile) and controlled via keyboard, mouse or touchscreen.
VR technology has been applied in various fields due to its ability to provide users with an enhanced experience through an immersive and interactive environment. Some of the fields that implement VR include gaming and entertainment, education and training, healthcare, industry and engineering, military, defense, and tourism. Despite the diversity of these application fields, they all share the fundamental requirement for realistic simulations and interactive experiences.
2.1. VR in Education
Numerous systematic literature reviews and individual studies have investigated the use of VR technology in education. In this section, systematic literature review papers are presented, followed by an analysis of studies comparing immersive VR and non-immersive VR across various aspects of educational use.
A review of research on application of learning theories in VR-based education for the period from 2012 to 2022 is presented in [12]. The authors analyzed each learning theory and educational approach across different educational levels. The Scopus database was used for the research, the PRISMA guidelines were applied and finally 17 studies were selected. The findings of these studies highlight five educational approaches, one methodology, five learning theories, and one theoretical framework, all discussed in the context of VR in education. The research identified key theoretical frameworks, including constructivism, experiential learning, and gamification, alongside others such as Cognitive Load Theory and TPACK. The findings suggest that constructivism is the most frequently applied theoretical basis for VR in education, that experiential learning is most appropriate for VR and that the gamification of learning has the greatest future potential.
A literature review of personalization techniques applied in immersive VR to support educational objectives in classroom settings is presented in [13]. Furthermore, the study analyzes gamification techniques employed in VR applications for educational purposes. The advantages, limitations, and effectiveness of VR as a learning method were examined as well as the type of hardware device that was used in studies. The results of the analysis are as follows: (i) 50 of 69 studies incorporate at least one personalization mechanism, such as manipulating virtual objects or using gamification strategies (e.g., tutorials, gamified scenarios, and reward systems), (ii) the most common research subjects are university undergraduate students who appear in 58% of studies, (iii) the most frequent fields are chemistry and engineering, (iv) the most positively evaluated aspect is the enhancement of content knowledge with VR proving effective in facilitating learning, (v) many studies lack control groups and nearly half have small sample sizes and (vi) 35% of studies employed smartphone-based cardboard VR headsets due to their accessibility and cost-effectiveness. The authors found that none of the reviewed studies employed adaptive learning methodologies tailored to individual learners’ educational needs.
In [14], 135 papers (68 focused on education and 67 on training) addressing serious games in immersive VR environments are examined. The review covers the use of VR serious games in order to explore how immersive VR technologies combined with serious games can improve learning and training outcomes. The results from both surveys (education and training) are presented according to the following categories: application domains and target audience, technological implementation and game design, performance evaluation procedures, and results of the performance evaluation. The study sets the foundation for future research on serious games in immersive VR, offering recommendations to enhance these tools for effective learning and training. These recommendations include conducting more rigorous and controlled experimental studies, developing standardized evaluation metrics, encouraging integration into educational frameworks, creating thoughtful design to ensure benefits are maintained even after the novelty effect wears off and to avoid cognitive overload or motion sickness, and ensuring scalable and cost-effective VR solutions.
A systematic review of immersive VR applications for higher education including 38 articles published between 2009 and 2018 is presented in [15]. The review identifies three key aspects for successful VR-based learning: the current domain structure in relation to learning content, the VR design elements, and the learning theories. The authors mapped application domains to learning content and examined the connection between design elements and educational objectives. The analysis revealed several gaps in the use of VR in higher education, e.g., learning theories are rarely integrated into VR application development to support and guide learning outcomes. Additionally, the evaluation of educational VR applications has predominantly focused on usability rather than actual learning effectiveness, and immersive VR has largely remained in the experimental and developmental stages, with limited integration into regular teaching. However, VR shows significant potential, reflecting its growing acceptance across various disciplines (18 application domains are identified in the review). The authors concluded that the identified gaps show opportunities in VR educational design, offering a pathway for future research and innovation.
The impact of AR and VR on various aspects of education, such as student motivation, learning outcomes, engagement and overall learning experiences, is presented in [16]. A systematic literature review comprising 82 papers was conducted on different educational domains, namely K-12 education, higher education, STEM education, professional training, and lifelong learning. The literature analysis was conducted for the following categories: distribution according to educational levels, distribution of studies according to publication year, implementation of AR/VR in distance education, K-12 education, higher education and medical education. One of the findings is that VR is mostly implemented in higher education, but studies on VR applications in higher education often lack explicit reference to foundational learning theories. Furthermore, in K-12 education, AR technologies have received more attention and have been implemented more frequently compared to VR. The authors concluded that AR and VR have significant potential to transform education by making learning more engaging and dynamic, and offering students an immersive experience. Despite the benefits provided by the integration of AR/VR into the learning environment, the observed challenges include cognitive load, cybersickness, cost, equitable access, curriculum challenges, and lack of instructional strategies. The existing literature often lacks a solid grounding in learning theories and the reviewed studies prioritize usability over the development of a robust theoretical framework. The integration of pedagogical theories into these applications can enhance their effectiveness. Nine recommendations for practical implementations of AR/VR technologies are provided.
In [17], a systematic review on the use of immersive HMD-based VR educational applications in comparison to less immersive methods, such as desktop-based VR, is presented. Immersive VR is significantly more effective for learning activities that require high levels of visualization and experimental understanding, e.g., in anatomy learning [18], cell biology learning [19], or representation of the International Space Station [20]. The analysis showed that despite many advantages of using immersive VR in education, some studies found no significant differences in attainment level regardless of whether immersive or non-immersive methods were utilized, i.e., when the content of learning did not strongly benefit from spatial immersion or interactivity. These results confirmed that matching the content and learning objective to the medium is one of the key factors in VR effectiveness.
The following studies compare immersive VR and non-immersive VR across different application domains.
In [21], the authors conducted a study that found that immersive VR improved performance on tasks requiring remembering but not on tasks requiring deeper understanding. In [22], participants learned conceptual and abstract relative motion concepts using either immersive VR or desktop VR. The findings revealed that those in the I-VR group outperformed their D-VR counterparts in solving two-dimensional problems, e.g., scenarios where one object moves vertically and the other moves horizontally. However, no significant difference was observed between the groups for problems involving only a single spatial dimension, e.g., a common physics problem where two cars are moving toward each other.
Some studies [23,24] found no significant difference in learning outcomes between immersive VR, desktop VR and 2D videos. Moreover, in [25], the authors compared teaching neuroanatomy from online textbooks and using immersive VR and found that the latter was no more effective. Also, there was no difference in information retention rates when the participants were reassessed 8 weeks later. The studies [26,27] demonstrated instances where immersive VR produced lower results compared to the non-immersive approach. In [26], immersive VR laboratory simulation results (combination of assessment and EEG) showed significantly lower test scores than their non-immersive counterparts. Similarly, in [27], the authors observed a significant performance decrement in biology learning when immersive VR was employed, relative to a PowerPoint presentation. These findings are consistent with Mayer’s Cognitive Theory of Multimedia Learning [28] and may give a possible explanation for poorer results using immersive VR, i.e., that overly rich multimedia can increase cognitive load, detract from the learning task and potentially harm learning outcomes.
Finally, comprehensive guidelines for design and evaluation of immersive learning can be found in [29]. The book presents cutting-edge techniques and pedagogical approaches, best practices in educational VR as well as emerging trends, opportunities and recommendations for integrating VR and XR into pedagogical practice. Several best practice examples in the book confirmed that usability of learning environment is the crucial factor of learning achievements, as also suggested in [30].
2.2. Computational Thinking in VR
A systematic review of studies on teaching CT using game-based learning within VR environments is presented in [31]. The authors selected 15 papers following PRISMA guidelines, and based on their analysis, a conceptual framework for designing a strategy to learn CT skills through game-based VR settings is proposed. The framework consists of three parts: game elements (playability and interactivity), VR features (presence and immersion), and CT concepts (skills). Furthermore, the variable enjoyment is introduced as a combination of both game elements and VR features. The game elements and VR features can be encapsulated in VR game applications for CT, and they are independent variables that intervene in CT skills. The CT skills are the goal of the learning process, i.e., they are dependent variables in the conceptual framework that consist of four concepts (decomposition, pattern recognition, abstraction and algorithm design). The framework suggests that integrating engaging game elements with immersive VR features can effectively foster the development of CT skills among learners. Specifically, game elements can improve user engagement, while VR features help learners stay focused and better understand complex and abstract ideas. Consequently, learners are more likely to practice and internalize CT skills through deep engagement and meaningful content interaction.
The use of immersive VR mini games to enhance CT skills in higher education students is presented in [6]. The VR application was developed, integrating three mini games: Mount Patti Treasure (developed by students), River Crossing, and Tower of Hanoi (both well-known computational problems in computer science). The users found the VR mini games interactive and immersive, and reported improved CT skills. The expedition narrative within the VR game stimulates learners’ curiosity, which contributes to sustaining their engagement and learning progress. The quantitative analysis confirmed that students’ CT competency can be enhanced through consistent playing mini games.
Similarly, the potential of VR mini games to support the development of CT skills among higher education students is investigated in [7]. An experiment was conducted with 47 computer science students divided into two groups. The experimental group (21 students) played iThinkSmartn, a VR game-based application containing mini games developed to assist learners in acquiring CT competency. The control group (26 students) learned CT concepts through traditional lecture-based instruction. The post-test and post-questionnaire results revealed that students in the experimental group demonstrated significantly better CT competency, experienced greater cognitive benefits, and showed increased motivation to learn CT concepts.
The effectiveness of VR application Logibot in teaching fundamental programming concepts and its impact on user engagement are examined in [32]. A comparative study between Logibot (VR block-based programming game) and LightBot (desktop-based game with similar mechanics) was conducted. The study involved ten participants, who were split into two groups. Participants completed programming tasks, followed by the User Engagement Survey (UES) and interviews to gather qualitative feedback. Despite the initial hypothesis, participants found the desktop application more engaging than the VR application. The study highlighted the importance of intuitive interaction design and clear instructional guidance in VR applications to enhance usability and engagement. Furthermore, future research should consider more advanced hardware.
The development of a VR game CT Saber (inspired by the VR game Beat Saber and designed for learning CT) and the evaluation of its usability are presented in the paper [8]. The usability of CT Saber was evaluated through testing involving 36 computer science students. The study concluded that CT Saber fulfills the established usability criteria, highlighting its potential as an engaging and effective VR-based educational tool for promoting CT skills among higher education students.
The use of VR as a tool to enhance students’ understanding of abstract concepts in computer science, particularly recursion is explored in the [33]. A comparison between learners who used the VR Tower of Hanoi software and those who used the conventional puzzle revealed that the VR experience led to improved understanding for most participants. Specifically, some of them demonstrated a deeper understanding of the concept of recursion. Post-survey results indicated that the majority of participants found the immersive VR environment helpful when learning abstract subjects.
All the previously cited studies demonstrate that integrating game-based learning with VR environments effectively fosters CT skills. By combining engaging game elements with immersive VR features, these approaches enhance learner engagement, facilitate understanding of complex concepts, and ultimately lead to improved CT competency and motivation. While usability remains a key consideration, VR’s unique ability to visualize abstract ideas positions it as a powerful tool for CT education.
3. Implementation
In this section, we first describe the Bebras Challenge and then explain how we implemented selected tasks into a VR application. Since the learning strategies related to CT are already embedded within the tasks, this section focuses solely on describing the interaction design that supports the process of solving these tasks.
3.1. The Bebras Challenge
The Bebras Challenge features tasks in logical reasoning, pattern recognition, algorithmic design, and data representation, all collaboratively developed by an international network of educators [1].
Depending on the country, the challenge is divided into five to six age categories, lasts 40–45 min, and typically takes place online. Typically, students solve 12–15 problems, individually, under teacher supervision. The annual competition, usually held in November, is automatically evaluated online. All participants receive certificates, and best participants may be invited to further competitions or workshops, depending on national arrangements.
In Croatia, the Bebras Challenge (the Croatian name is Dabar@ucitelji.hr) has been organized since 2016 by the association of teachers Partners in Learning [34]. The competition has been held continuously since 2016, when almost 6000 students participated, while in 2024, 51,220 students participated. The challenge Dabar@ucitelji.hr is aligned with the national informatics curriculum, promoting CT from an early age and gradually introducing students to digital technology. It is conducted in schools as an integral part of informatics education, within the regular timetable.
3.2. ThinkLand
The tasks in the Bebras Challenge are often interactive and engaging but limited to a two-dimensional representation on a computer screen. From the pool of tasks in the Dabar@ucitelji.hr competition, we selected four tasks characterized by different levels of user interaction with objects for implementation in a VR environment: Beaver-Modulo, Tower of Blocks, Tree Sudoku, and Elevator. We believe that transferring these tasks into a 3D world offers the greatest potential benefits of VR adaptation.
For the selected tasks, we present a brief version of the task texts and illustrations, showing how the original 2D tasks were adapted and implemented into a 3D environment. The complete versions of the original tasks are provided as Supplementary Materials. They include the type and difficulty of each task and the target age group, as well as the solution, explanation, and their connection to computational concepts.
The implementation was developed on the CoSpaces Edu platform, using the CoBlocks programming language. The design and implementation of the game were guided by Nielsen’s usability heuristics [35] to ensure the interface is clear, consistent, intuitive, easy to use, supports error recognition and correction, and enables effective interaction.
All tasks in the game are presented in Croatian, as the game is intended for Croatian students. The ThinkLand game is available at the following link: https://edu.cospaces.io/TRL-FUP (accessed on 9 June 2025). While we encourage readers to explore and play the game, the following sections provide the game description to help understand the tasks, the VR environment, and the ways users interact with the objects within it.
3.2.1. Implementation of the Beaver-Modulo Task
The first task in the game involves simple animation. The task text is as follows:
Some beavers took part in the annual Beaver Challenge. Their first task was to jump from rock to rock in a clockwise direction, as indicated by the arrow (shown in Figure 1), starting from rock number 0. For example, if a beaver jumps 8 times, it will land on rock number 3:

Figure 1.
Illustration from the original Beaver-Modulo task.
0 → 1 → 2 → 3 → 4 → 0 → 1 → 2 → 3.
One of the beavers showed off and jumped an astonishing 129 times. On which rock did it land?
The answer is entered as an integer between 0 and 4.
Due to the absence of a beaver character in the free version of the CoSpaces Edu platform, the main character in the 3D implementation was replaced with a raccoon, and the task text was adapted to reflect this change.
The implemented 3D version of the task in VR environment is shown in Figure 2. In this version, the user moves the raccoon from one rock to the next by clicking on the character, prompting it to jump to the subsequent rock in the sequence. Once the user is ready to submit their final answer, they can click on the girl character to select one of the numbers (0, 1, 2, 3, or 4) displayed within the virtual environment.
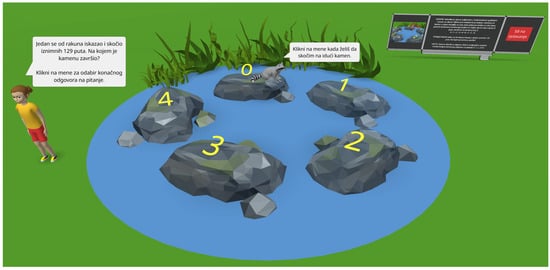
Figure 2.
The Beaver-Modulo task as implemented in ThinkLand.
The task was intentionally selected and positioned as the first in the game due to its minimal level of user interaction. Its purpose was to introduce users to the game interface, the task presentation format, the process of submitting responses, and transitioning to new tasks, all without burdening them with complex interaction mechanics. While the raccoon character moves from stone to stone, the movement is deliberately simple and symbolic, designed not for interactional depth but to ensure users can focus on understanding the environment and navigation flow at the start of the VR experience.
3.2.2. Implementation of the Tower of Blocks Task
The task text is the following:
Sam, the little beaver, is playing with his toy blocks. He built seven beautiful towers, each one made with blocks of the same size (as shown in Figure 3).
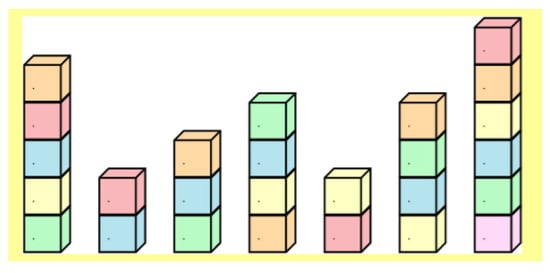
Figure 3.
Illustration from the original Tower of Blocks task.
There are two ways to change the height of a tower: adding blocks to the top or removing blocks from the top. Adding or removing a block counts as a move. For instance, if he changes the height of the leftmost tower to 2, it takes 3 moves (removing 3 blocks), and if he changes it to 7, it takes 2 moves (adding 2 blocks). Moving a block from one tower to another is considered as 2 moves.
Sam wants all towers to be the same height, and he wants to make as few moves as possible.
In total, what is the minimum number of moves Sam needs in order to make all towers the same height?
Answer options are numbers 6 to 11.
The 3D implementation of the Tower of Blocks task is shown in Figure 4. In this interactive version, the user can modify the height of a tower by clicking on the desired tower and selecting either the Add or Remove button to add or remove a block. When a block is removed, it is placed in a designated area labeled “Uklonjene kocke” (“Removed blocks”); conversely, if the user wishes to add a block, they select one from the area labeled “Kocke za nadodavanje” (“Blocks for addition”) and place it onto the chosen tower. Each move is automatically counted and displayed in the upper left corner (“Broj poteza”—“Number of moves”).
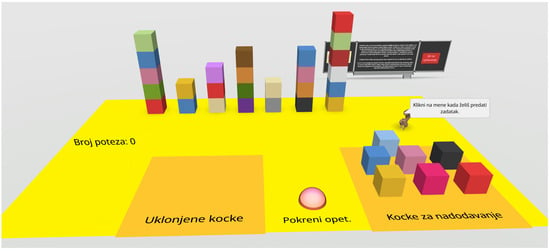
Figure 4.
The Tower of Blocks task as implemented in ThinkLand.
If the user believes they have not achieved the minimum possible number of moves, they can click the “Pokreni opet” (“Restart”) button, located between the two storage areas, to reset the task and attempt it again. Once the user is satisfied with their solution, they can submit their final answer by clicking on the squirrel character, which records the current number of moves displayed on the screen as their answer (“Klikni na mene kada želiš predati zadatak”—“Click on me when you want to submit the task”).
In the original 2D multiple-choice version of the task, no interaction is possible, and users must mentally simulate the block movements and calculate the total number of moves required to equalize tower heights. In contrast, the 3D implementation enables users to actively manipulate blocks, visually track tower height changes, and receive immediate feedback on each move. This interactivity allows users not only to execute an entire sequence of moves, but also to experiment with alternative strategies. By resetting the task and trying different solutions, they can easily identify which sequence results in the minimal number of moves. Thus, the 3D version enhances cognitive engagement by supporting experimentation, visual reasoning, and reflection on efficiency, which are not available in the original format.
3.2.3. Implementation of the Tree Sudoku Task
The following is the official task description:
A beaver’s field is divided into 16 plots arranged in a 4 × 4 grid where they can place one tree in each plot.
They plant 16 trees of heights 1, 2, 3 and 4 in each field by following the rule:
- Each row (a horizontal line) contains exactly one tree of each height;
- Each column (a vertical line) contains exactly one tree of each height.
If beavers observe the trees in one line (see Figure 5), they cannot see trees that are hidden behind a taller tree. At the end of each row and column of the 4 × 4 field, the beavers placed a sign and wrote on it the numbers of trees visible from that position.
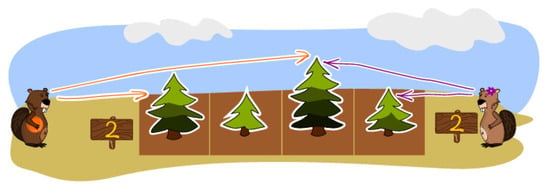
Figure 5.
The beavers observe the trees.
Kubko has written down the numbers on the signs correctly, but he placed some trees in the wrong plots.
Can you find the mistakes Kubko made (shown in Figure 6) and correct the heights of the trees?
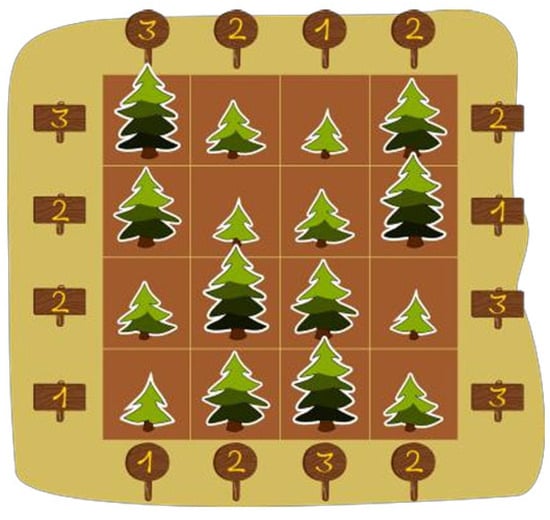
Figure 6.
The mistakes Kubko made.
Click on a tree to change its height.
Figure 7 presents the screenshot of the ThinkLand interface showing the 3D version of the Tree Sudoku task. The grid on the left displays Kubko’s initial planting of the trees, where the user observes and identifies the incorrect placements. The grid on the right allows the user to reposition the trees into the correct arrangement.
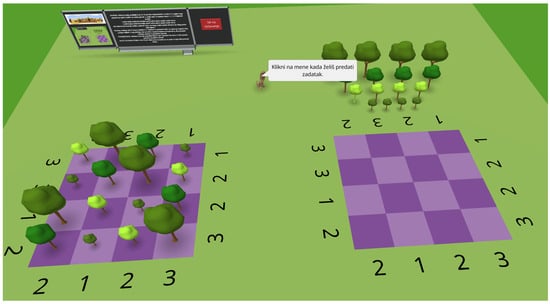
Figure 7.
The Tree Sudoku task in ThinkLand.
To move a tree, the user first clicks on the tree and then selects the target plot where they wish to place it. Consistently with previous tasks, once the user is satisfied with their arrangement, they submit their final solution by clicking on the squirrel character.
As feedback, when a tree is placed onto a plot, the plot is temporarily highlighted in white to indicate successful placement. In this task, camera rotation is highly beneficial, as it allows the user to better observe and manipulate the 3D grid from different angles.
3.2.4. Implementation of the Elevator Task
The following is the official task description:
A group of beavers are visiting the countryside and want to take the elevator up to the observation deck (shown in Figure 8). But it’s late and the elevator only goes up twice. The elevator has a load capacity of 30 kg.
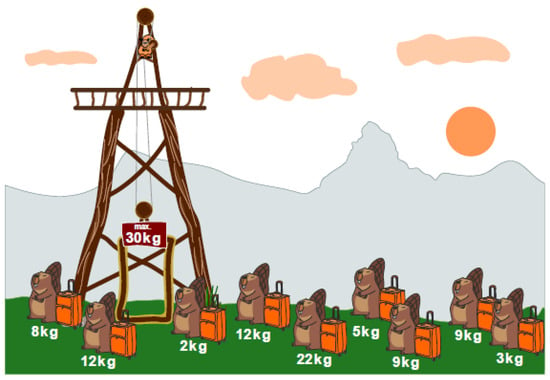
Figure 8.
Illustration from the original Elevator task.
How do you distribute the beavers with their luggage between the two elevator cabins so that as many beavers as possible can stand on the platform? Drag the beavers onto the two lifts below.
In the 3D version of the task, shown in Figure 9, the beavers were replaced with penguin characters, which are freely available within the CoSpaces Edu platform, and the task text was adapted accordingly.
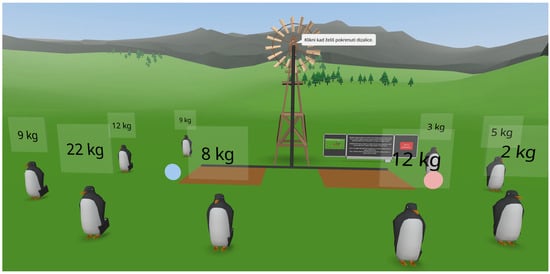
Figure 9.
Screenshot of the ThinkLand interface showing the Elevator task.
The elevators are represented by two platforms, one on the left and one on the right. The user moves a penguin by first clicking on the penguin and then on the elevator platform where they want to place it. The selected penguin then slowly slides onto the chosen elevator.
Next to each platform, a blue or pink button allows the user to return the last placed penguin from that elevator to its original starting position. Once the user has positioned all the penguins on the two elevators and is satisfied with their solution, they must click on the windmill in the center to activate the elevators and receive feedback on their answer.
In this task, particular emphasis was placed on ensuring intuitive interaction and delivering immediate visual feedback, achieved through animations of the penguins moving onto the platforms and real-time updates of the total weight displayed above each elevator.
4. Materials and Methods
The main objective of the study is to evaluate the usability of the ThinkLand, with a particular focus on comparing the desktop and mobile interfaces. Although many schools in Croatia are equipped with VR headsets, this research did not aim to examine usability across all possible platforms. Instead, it concentrated on those interfaces that are widely accessible to students in educational settings: desktop computers in school computer labs and students’ personal mobile devices, which are already occasionally used for instructional purposes.
The conceptual framework of this study is grounded on the assumption that the type of interface (mobile or desktop) may influence both objective performance outcomes and subjective user experience in VR environments. It is presumed that when users are allowed to engage with the platform they are most comfortable with, their interaction becomes more intuitive, which can positively affect both efficiency (e.g., time and task performance) and satisfaction (e.g., perceived usability and experience).
Moreover, individual characteristics such as age and gender are considered relevant factors that may shape preferences and interaction patterns with digital technologies, potentially moderating the relationship between interface type and learning outcomes. Accordingly, the research also addresses additional questions related to how age, gender, and interface type influence game performance, specifically, learning outcomes and the time required to complete the entire challenge.
4.1. Instruments and Measures
The independent variables in this study are the age group, gender, and interface type. The dependent variables included participants’ responses to 12 statements related to perceived usability of the game interface, the total score achieved in the game (referred to as Score) and the overall time required to complete the challenge (referred to as Time).
The ThinkLand VR game, as presented in Section 3, consists of four distinct tasks, each implemented as a separate scene within the virtual environment. Each task carries a maximum of 1 point. Task 3 allows partial scoring in increments of 0.25, while other tasks are scored with values 0 or 1. For the purposes of analysis, the point value achieved in each task is referred to as the task points. The outcome variable Score is defined as the sum of all task points, representing the overall challenge performance.
To evaluate the usability of the game interface, two questionnaires were used: System Usability Scale (SUS), a standardized usability assessment instrument and a custom-designed questionnaire, the Virtual Environment Usability Questionnaire (VEUQ), specifically developed for the purpose of this study to evaluate the perceived usability of the ThinkLand interface.
The System Usability Scale (SUS) [36] is a standardized instrument designed to assess participants’ satisfaction with an interface. It is widely adopted for evaluating the overall perceived usability of systems and interfaces, offering a quick, reliable, and psychometrically robust assessment [37]. The SUS consists of 10 items, alternating between positive and negative formulations, and rated on a 5-point Likert scale (1 = Strongly disagree, 5 = Strongly agree). Items cover a range of usability aspects including complexity, consistency, confidence in use, and learnability. In the standard SUS scoring procedure, individual item responses are not analyzed separately. Instead, a composite usability score, ranging from 0 to 100, is calculated. Therefore, in the data analysis, individual SUS items will not be treated as dependent variables; only the overall SUS score will be considered. The SUS score will enable us to compare the obtained results with broader usability benchmarks established across a wide range of systems and applications.
The Virtual Environment Usability Questionnaire (VEUQ) was designed to systematically assess key usability aspects related to students’ interaction with the ThinkLand environment. It is intended to serve as a complementary instrument to the SUS, providing a more detailed, context-specific evaluation of user interaction within the virtual environment. The construction of the VEUQ items was guided by established usability frameworks, primarily the ISO 9241-11:2018 standard, which defines usability in terms of effectiveness, efficiency, and satisfaction [38]. Additionally, four out of five theoretical components proposed by [39], learnability, efficiency, errors, and satisfaction, were considered to ensure a comprehensive evaluation of user experience.
The VEUQ consists of 12 items that capture key usability dimensions relevant to virtual environments including visual clarity and aesthetics, object interaction, navigational control, task flow and system responsiveness, instructional clarity and informational support. The items are rated on a 5-point Likert scale (1 = Strongly disagree, 5 = Strongly agree). The N/A option was included to account for the possibility that participants might not have used certain available interaction mechanisms, such as camera rotation or other, while solving the challenge. Following best practices adopted in the SUS, both positively and negatively worded statements were used in the VEUQ to minimize response bias and encourage participants to read each item carefully.
Prior to the implementation of the VEUQ, the quality and clarity of the questionnaire items were assessed through a pilot study, the details of which are presented in the following section. Based on the insights gained from interviews and observations during the pilot phase, minor linguistic adjustments were made to several items, improving their precision and comprehensibility. The structure and content of the final version of the VEUQ are presented in Table 1. This structure enabled a comprehensive evaluation of user experience, addressing both lower-level interaction mechanisms, such as object selection and spatial navigation, and higher-level usability factors, including the effectiveness of instructional support and the smoothness of task progression. Adopting this multidimensional approach provides a complete understanding of usability challenges specific to interactive VR environments.

Table 1.
Virtual Environment Usability Questionnaire (VEUQ).
In this study, an anonymous online survey was designed to collect the values of all the variables. The first part of this four-section survey is the SUS. The second part collects demographic data: education level (High School/University)—referred to as age, and gender (Male/Female/Prefer not to say), as well as the type of interface used to play the ThinkLand VR game (Desktop or Mobile). Besides these data that served as predictor variables, the participants also reported the values of outcome variables: task scores for each task in the game (used to calculate the score variable) and the total duration required to complete the entire challenge, i.e., the time. The third administered section of the survey is the VEUQ. This sequence of questionnaire administration was intended to encourage participants to first provide an overall usability rating and game performance data, before reflecting on specific aspects of the ThinkLand interface. In the final section, users were given the opportunity to provide qualitative feedback through a few open-ended questions.
4.2. Pilot Study
Following the generally recommended HCI practice of iterative design, implementation and evaluation of a pilot study was conducted to preliminarily assess the usability of the ThinkLand. Additionally, the study aimed to evaluate and refine the design of the VEUQ as an assessment instrument.
The pilot study involved 20 senior graduate students of Compute Science, recruited as a convenience sample due to their familiarity with digital environments and their ability to critically assess the clarity of questionnaire items and the usability of the ThinkLand interface.
Participants first completed the ThinkLand VR challenge and subsequently filled out the initial version of the VEUQ. Ten students were using their mobile devices, and ten students played the game on desktop computers. The thinking aloud protocol was employed in user testing to capture real-time feedback. After gameplay and questionnaire completion, individual interviews were conducted to gather the participants’ feedback on the interaction experience, and on their understanding of the VEUQ items. Participants were specifically encouraged to comment on the clarity, relevance, and perceived difficulty of the questionnaire items, as well as to highlight any usability issues encountered during gameplay.
The findings from the pilot study directly informed the redesign of ThinkLand, which was subsequently carried out. Regarding the VEUQ, the study confirmed that the core usability aspects targeted by the questionnaire appropriately reflected the user experience challenges in ThinkLand. Based on the feedback obtained, minor adjustments were made to the wording of several items to enhance clarity and ensure consistent interpretation across participants. No major structural modifications to the questionnaire were required.
4.3. Main Study
The study employed quasi-experimental and quantitative research design with regression-based analysis. Two groups of participants were included: high school pupils and university students. The central activity involved playing the ThinkLand VR game, accessible through two types of interfaces: mobile devices and desktop computers.
The research design involved the following steps:
- Informing participants about the purpose and objectives of the study, including ethical guidelines;
- Selection of the device (mobile phone or desktop computer) for playing the ThinkLand VR game;
- Playing the game;
- Completing the anonymous online survey.
The study was conducted in collaboration with teachers and during scheduled lessons dedicated to CT topics, as outlined in the curricula of the respective high school and university. Participating in the study did not impose any additional obligations or risks on the students.
In the first step of the procedure, the respective teachers informed their students about the purpose of the study, the voluntary nature of their participation, and the confidentiality of their game performance and responses in the survey. No personally identifiable or sensitive data was planned to be collected, and therefore, formal ethical approval or parental consent were not required.
In phase two, students were informed of the minimum technical requirements for installing the game on their own mobile devices and were given the freedom to choose whether to play on a mobile or desktop platform.
Phase three involved playing the ThinkLand VR game on the selected platform. As they solve the tasks, each participant was responsible for recording their own task points and the total time taken to complete the entire challenge.
Finally, the students were asked to complete the survey consisting of four sections: a demographic data section, the SUS and VEUQ questionnaires for usability evaluation of the game interface and the qualitative section. Participants were explicitly instructed to focus solely on evaluating the virtual environment interface in which the tasks were delivered, rather than rating the difficulty of the tasks or their preferences for CT.
All tasks and questionnaires were completed individually, without peer interaction or external assistance. Teacher supervision ensured the correctness and independence of observations, as the study setting reflected typical educational conditions.
4.4. Participants
Participants were recruited using a convenience sampling method, as part of their regular courses. The end sample included students and pupils who successfully completed all steps of the procedure, including the VR game, the online survey, and the submission of data on tasks scores and completion time. Participants with incomplete or missing data were excluded from the analysis.
A total of 100 students and pupils from Split-Dalmatia County (Croatia) participated in the study. Among the participants, there were 43 high school students (first and second grade) and 57 students at the University of Split (first year students of Computer Science). Considering gender dimension, there were 64 females, 36 males and 0 selected “prefer not to say” option. As for the interface usage, 55 participants used the desktop computer, while 45 played the game on a mobile device. Figure 10 presents the distribution of participants by gender (Male/Female) and age (High School/University), grouped according to the type of interface used to play the VR game (Desktop or Mobile). The figure shows a relatively balanced usage of both interface types across gender and age groups.
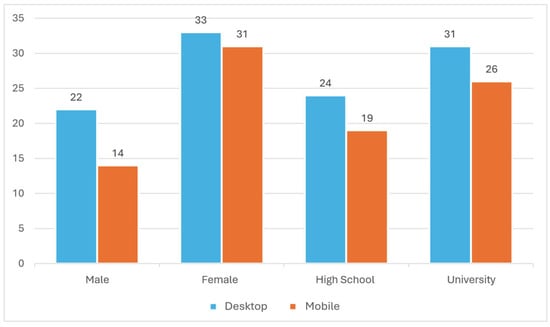
Figure 10.
Distribution of participants by gender and age according to the type of ThinkLand interface.
4.5. Data Analysis
Since each independent variable consists of two levels, the combination of these variables results in a total of eight distinct participant groups. The dependent variables include 12 statements related to interface usability, along with the time and score. To facilitate data analysis, the VEUQ statements were assigned labels q1–q12, as previously presented in Table 1. Participants’ responses ranged from 1 (Strongly disagree) to 5 (Strongly agree), with N/A option included. The time was reported in minutes, while the score was calculated as the sum of points achieved across all tasks, with a possible total value ranging from 0 to 4. As explained in Section 4.1., the SUS score is interpreted separately, in accordance with the standard practice of SUS evaluation and reporting.
Statistical analysis was conducted in the R programming language (Version 4.3.3). To select appropriate methods for data analysis, it was first necessary to clearly define the types of collected data and assess the assumptions required for different statistical procedures.
Since the study involved a large number of independent variables (8 participant groups) and 14 dependent variables, and in order to better understand the relationships among them, the initial plan was to apply a multivariate analysis approach.
An initial exploration of the relationships among the VEUQ items was conducted by calculating Pearson’s correlation coefficients and visualizing the results using a heatmap as shown in Figure 11. When two items with the same polarity (two positively worded or two negatively worded statements) are strongly related, a high positive correlation between them is expected. Conversely, when a positively worded item is strongly related to a negatively worded item, a high negative correlation should be expected. However, the analysis revealed predominantly low to moderate correlations between the items, with coefficients ranging approximately from −0.4 to 0.6. Although the correlation matrix is inherently symmetrical due to the nature of Pearson’s coefficients, no extremely high correlations are observed. These limited redundancy among items suggested that the VEUQ items captured related but distinct aspects of virtual environment usability, without evidence of multicollinearity.
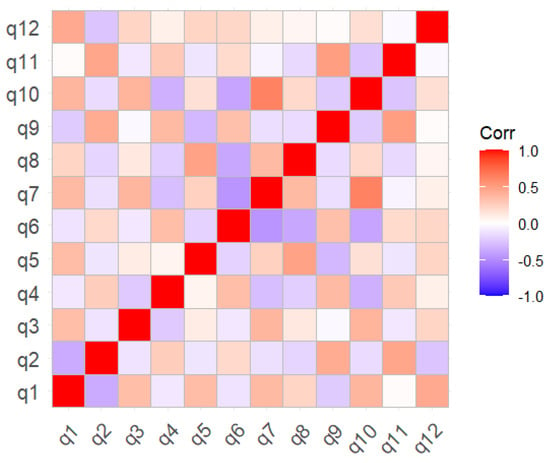
Figure 11.
Pearson’s correlation coefficients for VEUQ items.
Based on these findings, it was determined that the data did not fully meet the assumptions necessary for the application of multivariate methods such as MANOVA. Therefore, a different analytical strategy was adopted: a series of univariate general linear models (GLMs) should be applied to the data. Since all dependent variables are numerical in nature and the independent variables are categorical, the use of this method is appropriate. In this context, the term GLM refers to the regression modeling framework that allows for testing the effects of categorical predictors on continuous outcome variables. The sample size in this study (N = 100) was considered appropriate for conducting regression analyses, as the literature requires a minimum of at least 25 participants for accurate regression analysis [40].
Prior to conducting the analysis, because of large number of variables, we considered the possibility of simplifying the analytical model. If substantial multicollinearity had been found among the data, principal component analysis (PCA) would have been applied to reduce the number of variables, simplify the data structure, and consequently facilitate the data analysis process. Additionally, factor analysis would have been used to uncover latent constructs, such as underlying dimensions of user experience, by grouping related items into subscales. However, both methods require substantial inter-item correlations and a sufficient amount of shared variance to be meaningful. Therefore, it was concluded that a series of separate GLMs should be constructed for each of the 14 dependent variables, and that the results should be interpreted individually.
For each dependent variable (twelve VEUQ items, score and time), a separate GLM was fitted. As the primary aim is to assess the independent contributions of each factor, the models included only the main effects of the three predictors, without interaction terms.
5. Results
The results are organized into three sections. First, descriptive statistics are provided to summarize the main characteristics of the collected data. This is followed by the results of the GLMs for each dependent variable, including the twelve VEUQ items, the total score achieved in the ThinkLand VR game (Score), and the total time required to complete the challenge (Time). Finally, the SUS scores for mobile and desktop interface groups are presented.
5.1. Descriptive Statistics
For easier understanding of the results related to usability perceptions, descriptive statistics for VEUQ items are presented separately for positively worded (Table 2) and negatively worded items (Table 3). Items are ranked by mean scores in descending order. In Table 3, as the items are reverse-scored, lower means reflect higher usability ratings.

Table 2.
Descriptive statistics for positively worded VEUQ items.

Table 3.
Descriptive statistics for negatively worded VEUQ items.
As shown in Table 2, positively worded items (q1, q3, q5, q7, q8, q10, q12) generally received high ratings (M = 3.38–4.19), reflecting a favorable perception of ThinkLand. Among these, guidance elements such as on-screen instructions (q5: 4.19) and task accessibility (q8: 4.13) demonstrated optimal usability, while object selection feedback (q3: 3.38) and zoom functionality (q7: 3.44) emerged as critical areas for improvement despite maintaining positive ratings.
In Table 3, we can see that object selection (q4: 2.83) and camera rotation (q6: 2.31) are rated as primary usability barriers, while task switching (q11: 1.51) and instruction interference (q9: 1.60) were minimally problematic.
Overall, the pattern of responses across both positive and negative items is consistent and indicates a generally high level of perceived usability: instructional design elements (q5, q8, q12) achieved superior performance while direct interaction features (q3, q4, q6, q7) require targeted interface optimization.
Statistics for total game performance (Score), task completion time (Time), and overall usability rating (SUS score) are presented in Table 4.

Table 4.
Descriptive statistics of additional metrics.
The SUS score for the sample was 72.93. In line with standard SUS procedure, only the mean SUS score was analyzed, without examining individual item responses. According to the generally accepted interpretation using adjective rating scales [37], the obtained score corresponds to a “Good” overall usability rating. This “good but improvable” classification is in line with obtained context-specific usability ratings.
The mean total Score achieved in the ThinkLand game was 2.47 out of 4 points. The average time to complete the challenge was 19.24 min.
5.2. Regresion Analysis
Regarding the predictor variables, specific coding was introduced for their values as follows: M—Male, F—Female, H—High school pupil, U—University student, M—Mobile device interface, and D—Desktop computer interface. As a result, eight distinct groups were defined, each represented by an ordered triple composed of the above symbols, as shown in Table 5.

Table 5.
Participants group labels.
In the following section, we present the results of all 14 general linear models. Starting with modeling participants’ rating of item q1, we present the detailed interpretation of results for clarity, while for the remaining models only key conclusions are reported, without unnecessary details, especially in cases when model did not reach statistical significance.
5.2.1. Modeling Responses to VEUQ Items
Figure 12 presents eight individual box plots, each corresponding to one of the participant groups listed in Table 5. These plots illustrate how participants within each group rated item q1.
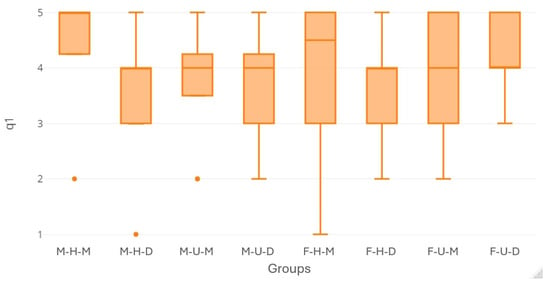
Figure 12.
Box plots showing participant ratings of item q1: The world representation is clear and interesting.
The model output indicates that the model was not statistically significant (F(1, 95) = 0.660, p = 0.579), explaining only 2.04% of variance (R2 = 0.020, with an adjusted R2 of −0.011 when corrected for the number of predictors). This suggests that gender, age group and interface type collectively have no meaningful impact on the q1 ratings.
Individual predictors showed no significant effects on q1 ratings:
- Gender: Females showed slightly higher ratings (+0.23) than males, but the difference was non-significant (p = 0.287).
- Age: High school participants gave marginally lower ratings (−0.05) than university students, with no statistical significance (p = 0.817).
- Interface type: Participants using desktop interfaces reported marginally lower ratings (−0.17) than participants who were using mobile interfaces, but this difference was non-significant (p = 0.421).
Based on these results, we conclude that gender, age group, and interface type were not significant predictors of participants’ perceptions of the clarity and interest of the ThinkLand world representation.
Figure 13 shows how participants from each group rated item q2.
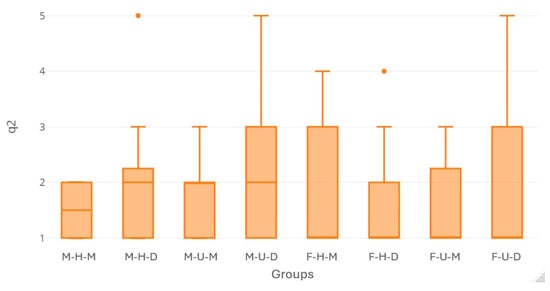
Figure 13.
Box plots showing participant ratings of item q2: Recognizing objects within the world is problematic.
The findings show that the model does not explain a significant amount of variance in the responses (R2 = 0.015; Adjusted R2 = –0.017; F(3, 93) = 0.462, p = 0.709), which indicates that gender, age group, and interface type collectively were not significant predictors of perceptions related to recognitions of objects in ThinkLand.
The results also show that none of the predictors separately is statistically significant. The box plot in Figure 14, showing reported ratings, also informs these findings.
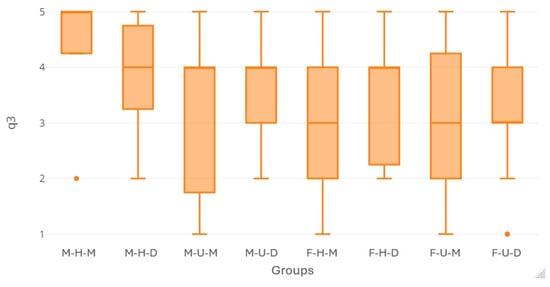
Figure 14.
Box plots showing participant ratings of item q3: It is always clear to me which object is selected.
Figure 14 presents the ratings provided by participants from each group for item q3.
The overall model was not statistically significant (R2 = 0.056; Adjusted R2 = 0.026; F(3, 94) = 1.865, p = 0.141).
Gender approached statistical significance (b = –0.492, p = 0.058), suggesting that female participants tended to rate the item q3 lower than male participants, but this difference did not reach conventional significance (p < 0.05).
Age group and interface type were not significant predictors of the q3 ratings. This result means that participants perceived feedback on object selection equally on both interfaces.
Figure 15 shows how participants from each group rated item q4.
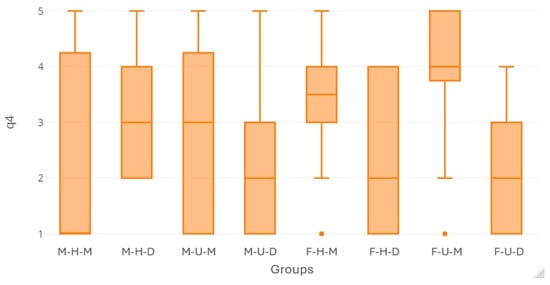
Figure 15.
Box plots showing participant ratings of item q4: It was often not easy for me to select (click) the object I wanted.
The linear regression model examining predictors of q4 ratings demonstrated statistical significance (F(3, 95) = 4.735, p = 0.004), explaining approximately 13.0% of the variance in scores (adjusted R2 = 0.103).
The analysis revealed one particularly robust finding: desktop users reported significantly lower ratings compared to mobile users (β = −0.995, SE = 0.273, t = −3.648, p < 0.001), indicating a strong negative effect of desktop use that was highly statistically significant. Participants using a desktop device gave ratings to q4 approximately one point lower than those using a mobile device. Since q4 is negatively worded, this result shows that desktop users perceive object selection in Thinkand VR environment considerably easier than the mobile users.
No significant effects in q4 were observed for either gender or age group.
The ratings provided by participants from each group for item q5 are shown in Figure 16.
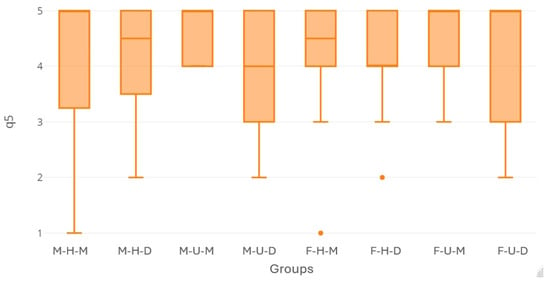
Figure 16.
Box plots showing participant ratings of item q5: The on-screen instructions are useful.
The summary of the model shows that the model does not explain a significant amount of variance in the responses (R2 = 0.027; Adjusted R2 = –0.004; F(1, 95) = 0.876, p = 0.457).
Also, gender, age group, and interface type separately were not significant predictors of perceptions related to perceived usefulness of on-line instructions. The box plots visually support the conclusion.
The ratings provided by participants from each group for item q6 are shown in Figure 17.
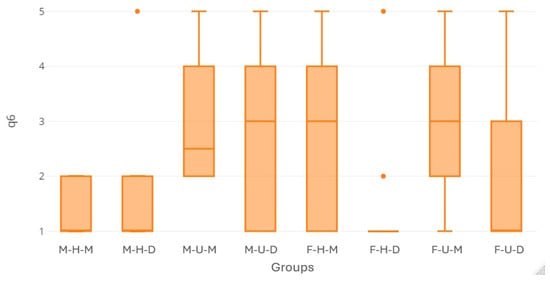
Figure 17.
Box plots showing participant ratings of item q6: Rotating the space (camera) is too complicated.
The overall model demonstrated statistically significant predictive utility (F(3, 89) = 4.764, p = 0.004), accounting for approximately 13.8% of the variance in ratings (adjusted R2 = 0.109).
Two significant negative relationships are shown in the summary. First, desktop users reported significantly lower q6 ratings compared to mobile users (β = −0.816, SE = 0.272, t = −3.005, p = 0.003), indicating a strong negative effect of desktop use. Since the statement is negatively phrased, this finding suggests that mobile users experienced rotating the camera significantly more complicated compared to desktop users.
Second, university students demonstrated significantly lower ratings in comparison with high school pupils (β = −0.641, SE = 0.273, t = −2.349, p = 0.021), representing a moderate negative age effect. The result indicates that high school students find rotating the camera more complicated than university students.
No significant gender differences were observed in the model for q6.
The ratings for item q7 are shown in Figure 18.
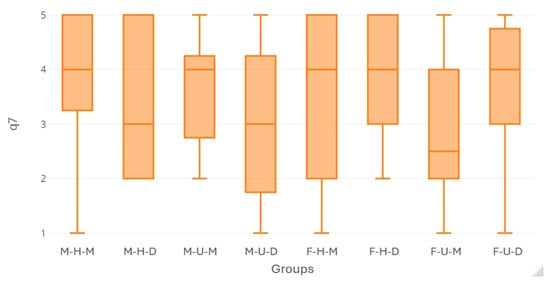
Figure 18.
Box plots showing participant ratings of item q7: Zooming in the virtual world is easy.
The overall model for q7 ratings was not statistically significant (R2 = 0.027; Adjusted R2 = −0.007; F(9, 87) = 0.806, p = 0.494).
None of the predictor variables separately showed a statistically significant effect on participants’ ratings for ease of zooming in the VR environment, although nine participants did not use it.
The ratings for item q8 are shown in Figure 19.
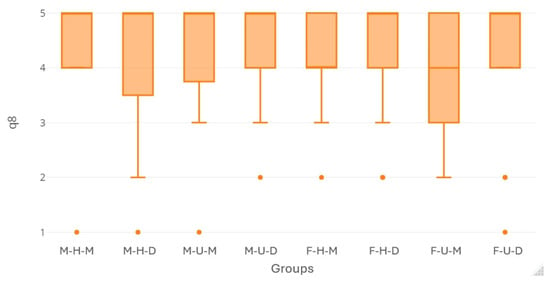
Figure 19.
Box plots showing participant ratings of item q8: The task text on the board is always easily accessible.
The model did not reach statistical significance ((R2 = 0.010; Adjusted R2 = −0.021; F(1, 95) = 0.324, p = 0.808).
Additionally, age, gender and interface type, as independent variables, were not significant predictors of participants’ perceptions of the availability of the text on the board. The result is visually informed by the box plots in Figure 19.
The ratings provided by participants from each group for item q9 are shown in Figure 20.
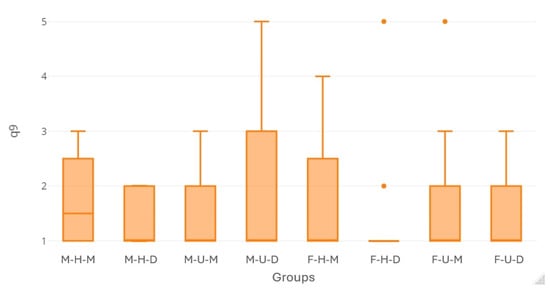
Figure 20.
Box plots showing participant ratings of item q9: The on-screen instructions make it harder to complete the task.
Similar to the previous two models, the q9 ratings model does not explain a significant amount of variance in the responses (R2 = 0.014; Adjusted R2 = –0.023; F(15, 81) = 0.370, p = 0.775).
Each predictor variable separately was not a significant predictor of perceptions that on-screen instructions made completing the tasks more difficult. The box plots visually support the conclusion, although 15 students probably did not use these instructions.
The ratings provided by participants from each group for item q10 are shown in Figure 21.
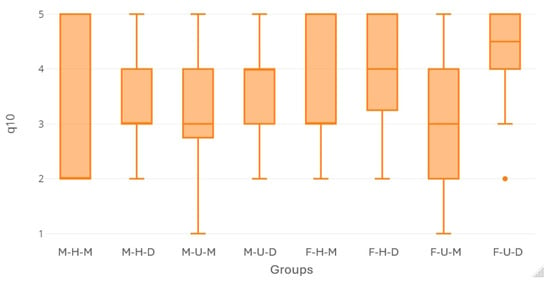
Figure 21.
Box plots showing participant ratings of item q10: I was able to move the objects I wanted in a simple way.
The summary of the model for q10 ratings indicates that the model explains a significant proportion of variance in participants’ ratings (R2 = 0.1086; Adjusted R2 = 0.080; F(3, 94) = 3.82; p = 0.013).
Among the predictors, gender and age group did not show a statistically significant effect.
Interface type was a statistically significant predictor (B = 0.713; p = 0.003). Participants using the desktop interface reported higher ease of moving objects in ThinkLand than those using the mobile interface for playing the game.
Figure 22 presents the ratings from each group for item q11.
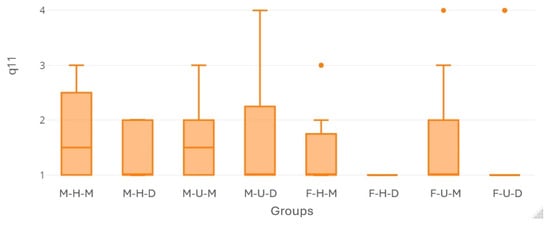
Figure 22.
Box plots showing participant ratings of item q11: Switching to the next task is complicated.
The model summary shows that the regression model does not explain a significant proportion of variance in participants’ ratings to q11 (R2 = 0.054; Adjusted R2 = 0.021; F(3, 86) = 1.63; p = 0.187).
None of the predictors were statistically significant at the 0.05 level. Gender approached marginal significance (B = –0.398; p = 0.064), suggesting a possible trend toward lower ratings (i.e., perceiving switching to the next task as less complicated) among female participants, but this effect did not reach statistical significance.
Figure 23 presents the ratings from each group for item q12.
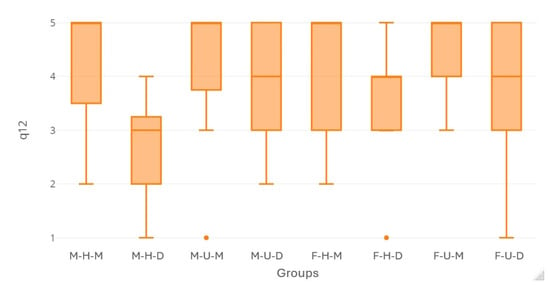
Figure 23.
Box plots showing participant ratings of item q12: Receiving real-time feedback on scores while solving tasks is important.
The model explained 13.3% of variance (p = 0.003), suggesting that the predictors account for a modest but significant proportion of q12 rating variability.
There were no statically significant differences in the effects of age groups and gender on participant ratings.
However, desktop users reported lower ratings of item q12 than mobile users (β = −0.736) and this difference is highly significant (p = 0.002). The result indicates that participants who played the game on mobile devices perceived real-time feedback on scores as substantially more important than players on desktop computers.
5.2.2. Modeling of Score
The scores in ThinkLand achieved by participants from each group are shown in Figure 24.
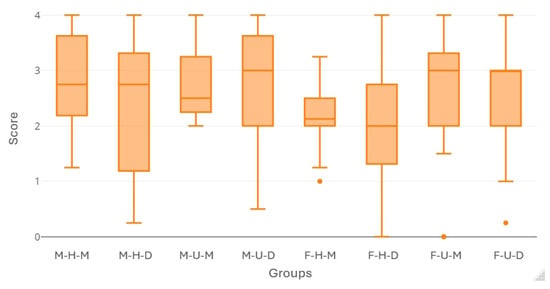
Figure 24.
Box plots showing participant scores.
The summary of the model indicates that the model does not account for a significant proportion of variance in the responses (R2 = 009; Adjusted R2 = −022; F(0, 96]) = 0.297, p = 828).
Moreover, none of the predictor variables separately showed a statistically significant effect on participants’ total score.
5.2.3. Modeling of Time
The time spent completing the overall challenge in ThinkLand, by participants from each group, is shown in Figure 25.
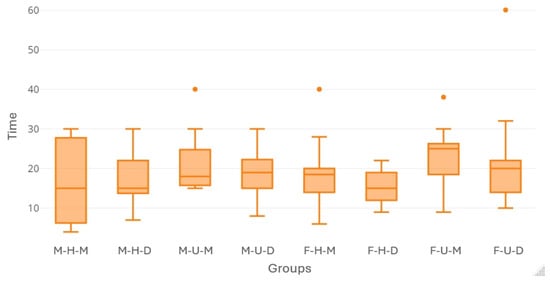
Figure 25.
Box plots showing participant time of playing the game.
The overall model was statistically significant (F(3,96) = 2.91, p = 0.039), indicating that the set of predictors explains a significant proportion of variance in time. However, the model’s explanatory power was modest, with an R-square of 0.083, meaning that approximately 8.3% of the variance in time is accounted for by gender, age group, and interface type.
University students took significantly longer to complete the challenge (β = −3.99, p = 0.016), requiring nearly 4 s more than high school users.
Although not reaching conventional significance levels, desktop users demonstrated a notable shorter time relative to mobile users (β = −2.419, SE = 1.616, t = −1.497, p = 0.138).
No meaningful gender differences were observed. The relatively low R2 indicates substantial unexplained variance, suggesting that other factors not included in the model may also influence time.
5.3. SUS for Mobile and Desktop Platform
Additional analysis focused solely on differences based on the type of interface used. The overall SUS score was calculated separately for mobile and desktop participants and presented in Table 6.

Table 6.
Comparative SUS scores for interface type.
The mean SUS score for the mobile group was 73.17 (SD = 16.88), while the mean SUS score for the desktop group was 72.73 (SD = 16.63). Both ratings are interpreted as “Good” [37]. Although the obtained difference is small, an independent sample t-test was conducted. The result confirmed that this difference was not significant, where t(98) = 0.13, p = 0.896. Thus, we conclude that participants perceived the overall usability of the ThinkLand environment similarly across both platforms.
5.4. Qualitative Feedback
Following the usability evaluation, participants provided open-ended feedback regarding their experience. Table 7 presents the responses related to the used device, in their original form, translated from Croatian language.

Table 7.
Open-ended feedback related to interface type.
To better understand the contribution of these responses, a thematic analysis was conducted. Participants’ feedback was categorized into five key themes reflecting their user experience across mobile and desktop platforms:
- Interface Simplicity and Clarity: Many participants appreciated the overall simplicity of the interface. Desktop users highlighted the interface’s minimalist design as a strength (“its simplicity gives it a big advantage”), while mobile users praised the clear visual representation of characters and environments. However, some users also noted issues with visual clarity, particularly when characters moved or when the interface became cluttered.
- Task Engagement and Integration: Both user groups positively commented on the engaging nature of the tasks and their seamless integration into the virtual environment. Mobile users emphasized the connection between mathematical tasks and the game world, while desktop users valued being able to access instructions during problem-solving.
- Navigation and Object Interaction: Navigation and interaction challenges were a recurring theme, especially among mobile users. Difficulties in selecting objects and manipulating the camera were cited as major obstacles. On the desktop, users reported issues with more complex functions such as zooming.
- Screen Visibility and Layout Issues: Several mobile users mentioned screen-related limitations, such as important information being partially obscured or duplicated, which negatively affected task performance. These issues appeared less frequently in desktop feedback but were noted as interfering elements when instructions overlapped with other content.
- Functionality Challenges: Some users, particularly on the desktop platform, reported challenges with specific functionalities such as the zoom function or long task explanations, which they found overwhelming or difficult to manage during interaction.
6. Discussion
In the first part of this section, we integrate the obtained results to provide a holistic interpretation, combining insights from both quantitative measures and qualitative feedback. Based on this synthesis, we derive the practical implications of the findings.
The second part provides reflections on the implementation of ThinkLand, the VEUQ, and the overall methodological approach. It also addresses potential limitations and offers directions for future research.
6.1. Overall Interpretation of the Results
In the previous section, we analyzed the VEUQ results separately for positively and negatively worded items. This analysis revealed that positively worded statements generally received higher scores than negatively worded ones, suggesting that the formulation of the statement may influence participants’ responses. However, to gain a comprehensive picture and enable a holistic interpretation of the results, in this section we combine all items and rank them in a single list according to their mean score. This approach allows us to identify the strongest and weakest aspects of the interface, regardless of the wording polarity, and consequently enabling us to place these findings in perspective alongside the remaining quantitative and qualitative results, i.e., the regression analysis output and descriptive user feedback.
Table 8 presents the summary of findings. For each VEUQ item, the table shows the rank based on the overall score (from Table 2 and Table 3), GLM output with practical significance (as estimated effect size) and statistical significance, and the number and the direction of user comments (from Table 7). Although the user comments do not carry statistical power, it is evident that they align well with the ranking of the items, reinforcing the quantitative findings.

Table 8.
Overview of integrated results from quantitative and qualitative feedback.
The highest-ranked interface features were the usefulness of on-screen instructions and accessibility of the task text, both receiving predominantly positive feedback and demonstrated equally impressive performances on mobile and desktop interfaces.
Items such as the importance of real-time feedback and moving the objects showed moderate effect sizes with strong statistical significance, indicating meaningful differences between user groups (e.g., mobile users rating feedback importance higher, and desktop users finding object manipulation easier).
Lower-ranked items included camera rotation and object selection, both showing strong practical significance (estimated effect sizes) and statistical significance, particularly highlighting challenges reported by mobile users. Additionally, qualitative feedback supported these findings, with several negative comments pointing to difficulties in camera control, object selection, and overall interface clarity on mobile devices. These results provide clear priorities for future ThinkLand redesign efforts.
6.2. Reflections, Limitations and Future Work
The ThinkLand, consisting of four tasks, can be understood as a VR setting that incorporates four mini games, following the definition provided by [6]. These short, guided episodes are designed to address specific learning outcomes in simple and engaging ways. Similar to related VR applications [6,7], each task in ThinkLand can be replayed as needed, helping to reinforce key concepts until the desired learning outcomes are achieved.
The game development did not include additional learning strategies, which aligns with existing research showing that CT tasks inherently incorporate well-developed teaching and learning approaches [41].
All the tasks used in ThinkLand came from an international collection accepted by Bebras International [1] and approved for use in worldwide Bebras Challenge competitions (see Supplementary Materials for original tasks in English). Therefore, the game holds strong potential for internationalization, which can be achieved simply by translation of task text. Since the game is not intended to be used for the official Bebras competitions, the linguistic and cultural adaptations for better addressing CT in other languages are also acceptable.
In the Methods section, we will first address the VEUQ and the questionnaire’s administering order.
The VEUQ was developed to cover a comprehensive range of potential usability issues and was evaluated with end users in a pilot study. This systematic approach aligns with related literature [8]. The results suggest that the VEUQ is a valid and clearly structured tool for capturing core usability aspects as perceived by users. The overall Cronbach’s alpha coefficient was relatively low (α = 0.42), and this result is consistent with the design of the instrument, as each item was intended to measure a distinct, context-specific aspect of the interface. This multidimensional nature of the VEUQ is further supported by the observed lack of multicollinearity between items, as shown in the correlation heatmap (Figure 11). Its robustness and content validity are further supported by the fact that, in the open-ended feedback, only two comments fell outside the scope of the existing VEUQ items. However, the results of the main study suggest that wording polarity could have influenced responses. While this effect remains inconclusive, it should be acknowledged as a potential limitation of the study and explored in future research.
The second limitation of the study relates to the composition of the pilot study sample. The pilot testing included only senior university students, who were selected for their greater familiarity with digital interfaces and critical evaluation skills. While this approach was appropriate for the early identification of potential issues, it may limit the generalizability of the pilot findings to younger users. However, both age groups were fully represented in the main study to ensure broader applicability of the results.
The VUEQ items were systematically mapped to three core usability dimensions of the ISO 9241-11:2018 standard [37]: effectiveness (q2, q3, q4, q5, q8, q9), efficiency (q6, q7, q10, q11), and satisfaction (q1, q12). This mapping ensures that the evaluation framework is aligned with internationally recognized definitions of usability, providing a structured and standardized basis for assessing the usability of the ThinkLand game interface.
The VEUQ structure also reflects the core usability components proposed by Nielsen [38], namely learnability, efficiency, errors, and satisfaction. Specifically, learnability was addressed through items evaluating the clarity of object selection and instructions (q3, q5, q8), efficiency was captured through questions relating to the ease of navigation and object manipulation (q6, q7, q10, q11), and user errors were assessed through items focusing on difficulties in object recognition, selection, and task transition (q2, q4, q9, q11). Satisfaction with the virtual environment was measured through the perceived clarity and usefulness of the interface (q1, q12). However, memorability, as the ease with which users can reestablish proficiency after a period of non-use, is not directly assessed within the VEUQ. This is the consequence of the study design, which involved a single-session interaction with ThinkLand, without follow-up sessions to evaluate longer-term retention of interaction skills. Future studies aiming to achieve a full alignment with Nielsen’s framework could incorporate delayed post-test evaluations or specific questionnaire items targeting users’ ability to quickly and accurately re-engage with the system after a period of non-use.
Reflecting on the decision to administer the VEUQ after the SUS, it is possible that this sequence may have influenced participants’ responses. However, this order was intentionally made to minimize the potential influence of context-specific feedback on overall usability ratings. Although research on the sequential use of perceived usability instruments is rarely conducted, this methodological choice aligns with [42] that confirmed the impact of usability assessments order on their outcomes.
An important aspect of the study’s design was allowing participants to choose their preferred interface for playing the ThinkLand game. This ensured interaction with a familiar and intuitive platform, likely reducing usability issues that might have arisen from being forced to use a less familiar device. By reflecting real-world usage patterns, this approach enhanced the ecological validity of the study: respecting user preferences led to more natural engagement and more authentic usability data. Future research could benefit from similar user-centered design choices.
The descriptive analysis revealed that users rated on-screen instructions and task text accessibility as the strongest elements of the interface, while camera control and object selection were identified as the most challenging aspects. These patterns provide an initial understanding of perceived usability across different interface components. Furthermore, the regression analysis confirmed several strongly significant effects, most notably for the lowest rated features such as camera rotation and object selection, which proved particularly difficult for mobile users.
While the GLMs revealed meaningful patterns, their overall explanatory power was modest, indicating that additional variables, possibly related to individual user characteristics or environmental factors, may also influence user experience. These findings highlight the importance of combining quantitative data with user-centered feedback to better understand the complexity of interface usability across different contexts.
A series of GLMs was employed as the analysis method, as there was no indication of multicollinearity among the predictors. While it is important to consider the assumptions underlying linear models, previous research has shown that they are generally robust to moderate deviations of residuals from normality, particularly when the sample size is adequate [43], as was the case in this study. Therefore, the statistically significant effect of interface type on participants’ responses can be interpreted as both reliable and meaningful. Besides statistical significance, the observed differences with high estimated effect sizes also have practical significance and should be considered when drawing implications for interface design.
Although relevant literature generally acknowledges that usability is strongly connected with learning outcomes [30], this study did not empirically examine that relationship. Future research should aim to explore this connection following the redesign of the ThinkLand game. The most effective way to evaluate the impact and cost-effectiveness of the 3D version would be to measure learning outcomes achieved through the redesigned ThinkLand game in comparison to the performance on the original 2D tasks from the Bebras Challenge competition. In addition, learner engagement could be assessed as a complementary indicator of educational effectiveness. This future research will also provide an opportunity to further validate the VEUQ instrument using both the analytical methods applied in this study and additional methods, provided that their assumptions are satisfied by the data.
The study design can be readily extended and adapted for use with immersive technology such as VR headsets. Since the interaction within immersive environments substantially differs from traditional screen-based experience, the VEUQ should be adapted in terms of terminology, particularly regarding the object interaction via controllers instead of a mouse or touchscreen. Additionally, user experience evaluation could benefit from incorporating measures of presence in immersive environment [44] into the mixed-method approach presented in this study.
7. Conclusions
This study aimed to evaluate the usability of the ThinkLand VR game interface across two platforms, mobile and desktop, by combining quantitative analysis with qualitative user feedback and interpretation. Allowing participants to choose their preferred platform contributed to more natural interaction and enhanced the ecological validity of the findings. The use of two complementary instruments, the VEUQ and SUS, allows the study to capture both specific user feedback and general perceptions of ThinkLand’s usability. As specifically developed and evaluated in this study, the VEUQ proved to be a valid and comprehensive instrument for capturing environment-specific usability aspects, and can be effectively applied in both academic research and the practical development of educational VR systems.
The results indicate that certain interface elements, such as on-screen instructions and task text visibility, were perceived as particularly effective, while camera control and object selection emerged as critical interaction points that may hinder user experience in both desktop and mobile interfaces. These issues were significantly more pronounced in the mobile interface and emphasize the need for thoughtful redesign that takes into account the limitations of touch-based interaction. The regression analysis further underscored the complexity of usability perception and the importance of accounting for both design and contextual factors.
Overall, the findings emphasize the value of user-centered evaluation methods and support the continued development of adaptive, platform-sensitive educational environments. Future research should further explore how interface design interacts with individual user characteristics and learning contexts to inform more inclusive and effective design strategies.
Supplementary Materials
The following supporting information can be downloaded at: https://www.mdpi.com/article/10.3390/mti9060060/s1, PDF document pdf:Original_Bebras_Tasks.pdf.
Author Contributions
Conceptualization, J.N.; methodology, J.N.; software, I.R.; validation, J.N.; formal analysis, J.N. and I.R.; investigation, J.N., I.R. and L.M.; resources, J.N.; data curation, I.R.; writing—original draft preparation, J.N., I.R. and L.M.; writing—review and editing, J.N. and L.M.; visualization, J.N. and I.R.; supervision, J.N. and L.M. All authors have read and agreed to the published version of the manuscript.
Funding
This research received no external funding.
Institutional Review Board Statement
The study was conducted in accordance with the Declaration of Helsinki. Ethical review and approval were waived for this study because the study did not involve sensitive data or personally identifiable information. Through an anonymous online survey, only the data on participants’ education level, gender and the type of device used were collected.
Informed Consent Statement
Prior to participation, students and pupils were informed about the purpose of the study, the voluntary nature of their participation, and the anonymity of their responses. As the study was conducted within a standard educational context, as part of regular classes, formal ethical approval and parental/guardian consent were not required.
Data Availability Statement
The dataset generated and analyzed during the study is deposited in Zenodo and publicly available. DOI: 10.5281/zenodo.15347704.
Conflicts of Interest
Author Ivana Rogulj was employed by Ericsson Nikola Tesla, Split, Croatia. All authors declare no competing interests.
Abbreviations
The following abbreviations are used in this manuscript:
| VR | Virtual Reality |
| CT | Computational Thinking |
| HCI | Human–Computer Interaction |
| HMD | Head Mounted Display |
| SUS | System Usability Scale |
| VEUQ | Virtual Environment Usability Questionnaire |
| GLM | General Linear Model |
References
- Bebras International. Available online: https://www.bebras.org/ (accessed on 2 May 2025).
- Wing, J.M. Computational Thinking. Commun. ACM 2006, 49, 33–35. [Google Scholar] [CrossRef]
- What Is Computational Thinking?—Introduction to Computational Thinking—KS3 Computer Science Revision. Available online: https://www.bbc.co.uk/bitesize/guides/zp92mp3/revision/1 (accessed on 13 April 2025).
- Gundersen, S.W.; Lampropoulos, G. Using Serious Games and Digital Games to Improve Students’ Computational Thinking and Programming Skills in K-12 Education: A Systematic Literature Review. Technologies 2025, 13, 113. [Google Scholar] [CrossRef]
- Laisa, J.; Henrique, E. Computational Thinking Game Design Based on the Bebras Challenge: A Controlled Experiment. In Proceedings of the Workshop sobre Educação em Computação (WEI), Niterói, Brasil, 31 July 2022; SBC. pp. 263–273. [Google Scholar]
- Oyelere, A.S.; Agbo, F.J.; Oyelere, S.S. Formative Evaluation of Immersive Virtual Reality Expedition Mini-Games to Facilitate Computational Thinking. Comput. Educ. X Real. 2023, 2, 100016. [Google Scholar] [CrossRef]
- Agbo, F.J.; Oyelere, S.S.; Suhonen, J.; Tukiainen, M. Design, Development, and Evaluation of a Virtual Reality Game-Based Application to Support Computational Thinking. Educ. Technol. Res. Dev. 2023, 71, 505–537. [Google Scholar] [CrossRef]
- Sukirman, S.; Ibharim, L.F.M.; Said, C.S.; Murtiyasa, B. Development and Usability Testing of a Virtual Reality Game for Learning Computational Thinking. Int. J. Serious Games 2024, 11, 19–43. [Google Scholar] [CrossRef]
- Slater, M.; Wilbur, S. A Framework for Immersive Virtual Environments (FIVE): Speculations on the Role of Presence in Virtual Environments. Presence Teleoperators Virtual Environ. 1997, 6, 603–616. [Google Scholar] [CrossRef]
- Salatino, A.; Zavattaro, C.; Gammeri, R.; Cirillo, E.; Piatti, M.L.; Pyasik, M.; Serra, H.; Pia, L.; Geminiani, G.; Ricci, R. Virtual Reality Rehabilitation for Unilateral Spatial Neglect: A Systematic Review of Immersive, Semi-Immersive and Non-Immersive Techniques. Neurosci. Biobehav. Rev. 2023, 152, 105248. [Google Scholar] [CrossRef]
- Bamodu, O.; Ye, X.M. Virtual Reality and Virtual Reality System Components. Adv. Mater. Res. 2013, 765–767, 1169–1172. [Google Scholar] [CrossRef]
- Marougkas, A.; Troussas, C.; Krouska, A.; Sgouropoulou, C. Virtual Reality in Education: A Review of Learning Theories, Approaches and Methodologies for the Last Decade. Electronics 2023, 12, 2832. [Google Scholar] [CrossRef]
- Marougkas, A.; Troussas, C.; Krouska, A.; Sgouropoulou, C. How Personalized and Effective Is Immersive Virtual Reality in Education? A Systematic Literature Review for the Last Decade. Multimed. Tools Appl. 2024, 83, 18185–18233. [Google Scholar] [CrossRef]
- Checa, D.; Bustillo, A. A Review of Immersive Virtual Reality Serious Games to Enhance Learning and Training. Multimed. Tools Appl. 2020, 79, 5501–5527. [Google Scholar] [CrossRef]
- Radianti, J.; Majchrzak, T.A.; Fromm, J.; Wohlgenannt, I. A Systematic Review of Immersive Virtual Reality Applications for Higher Education: Design Elements, Lessons Learned, and Research Agenda. Comput. Educ. 2020, 147, 103778. [Google Scholar] [CrossRef]
- AlGerafi, M.A.M.; Zhou, Y.; Oubibi, M.; Wijaya, T.T. Unlocking the Potential: A Comprehensive Evaluation of Augmented Reality and Virtual Reality in Education. Electronics 2023, 12, 3953. [Google Scholar] [CrossRef]
- Hamilton, D.; McKechnie, J.; Edgerton, E.; Wilson, C. Immersive Virtual Reality as a Pedagogical Tool in Education: A Systematic Literature Review of Quantitative Learning Outcomes and Experimental Design. J. Comput. Educ. 2021, 8, 1–32. [Google Scholar] [CrossRef]
- Liou, W.-K.; Chang, C.-Y. Virtual Reality Classroom Applied to Science Education. In Proceedings of the 2018 23rd International Scientific-Professional Conference on Information Technology (IT), Zabljak, Montenegro, 19–24 February 2018; pp. 1–4. [Google Scholar]
- Johnston, A.P.R.; Rae, J.; Ariotti, N.; Bailey, B.; Lilja, A.; Webb, R.; Ferguson, C.; Maher, S.; Davis, T.P.; Webb, R.I.; et al. Journey to the Centre of the Cell: Virtual Reality Immersion into Scientific Data. Traffic 2018, 19, 105–110. [Google Scholar] [CrossRef]
- Rupp, M.A.; Odette, K.L.; Kozachuk, J.; Michaelis, J.R.; Smither, J.A.; McConnell, D.S. Investigating Learning Outcomes and Subjective Experiences in 360-Degree Videos. Comput. Educ. 2019, 128, 256–268. [Google Scholar] [CrossRef]
- Allcoat, D.; Mühlenen, A. von Learning in Virtual Reality: Effects on Performance, Emotion and Engagement. Res. Learn. Technol. 2018, 26, 2140. [Google Scholar] [CrossRef]
- Kozhevnikov, M.; Gurlitt, J.; Kozhevnikov, M. Learning Relative Motion Concepts in Immersive and Non-Immersive Virtual Environments. J. Sci. Educ. Technol. 2013, 22, 952–962. [Google Scholar] [CrossRef]
- Greenwald, S.; Corning, W.; Funk, M.; Maes, P. Comparing Learning in Virtual Reality with Learning on a 2D Screen Using Electrostatics Activities. JUCS—J. Univers. Comput. Sci. 2018, 24, 220–245. [Google Scholar] [CrossRef]
- Moro, C.; Štromberga, Z.; Raikos, A.; Stirling, A. The Effectiveness of Virtual and Augmented Reality in Health Sciences and Medical Anatomy. Anat. Sci. Educ. 2017, 10, 549–559. [Google Scholar] [CrossRef]
- Stepan, K.; Zeiger, J.; Hanchuk, S.; Del Signore, A.; Shrivastava, R.; Govindaraj, S.; Iloreta, A. Immersive Virtual Reality as a Teaching Tool for Neuroanatomy. Int. Forum Allergy Rhinol. 2017, 7, 1006–1013. [Google Scholar] [CrossRef] [PubMed]
- Makransky, G.; Terkildsen, T.S.; Mayer, R.E. Adding Immersive Virtual Reality to a Science Lab Simulation Causes More Presence but Less Learning. Learn. Instr. 2019, 60, 225–236. [Google Scholar] [CrossRef]
- Parong, J.; Mayer, R.E. Learning Science in Immersive Virtual Reality. J. Educ. Psychol. 2018, 110, 785–797. [Google Scholar] [CrossRef]
- Mayer, R.E. Multimedia Learning, 2nd ed.; Cambridge University Press: Cambridge, UK, 2009. [Google Scholar]
- Obae, C.; Koscielniak, T.; Liman-Kaban, A.; Stiefelbauer, C.; Nakic, J.; Moser, I.; Cassidy, D.; Otmanine, I.; Foti, P.; Bykova, A.; et al. Immersive Learning: Innovative Pedagogies, Techniques, Best Practices, and Future Trends; European Digital Education Hub: European Union: Luxembourg, 2024. [Google Scholar] [CrossRef]
- Granić, A.; Nakić, J.; Marangunić, N. Scenario-Based Group Usability Testing as a Mixed Methods Approach to the Evaluation of Three-Dimensional Virtual Learning Environments. J. Educ. Comput. Res. 2020, 58, 616–639. [Google Scholar] [CrossRef]
- Sukirman, S.; Ibharim, L.F.M.; Said, C.S.; Murtiyasa, B. A Strategy of Learning Computational Thinking through Game Based in Virtual Reality: Systematic Review and Conceptual Framework. Inform. Educ. 2022, 21, 179–200. [Google Scholar] [CrossRef]
- Sims, R.; Rutherford, N.; Sukumaran, P.; Yotov, N.; Smith, T.; Karnik, A. Logibot: Investigating Engagement and Development of Computational Thinking Through Virtual Reality. In Proceedings of the 2021 7th International Conference of the Immersive Learning Research Network (iLRN), Eureka, CA, USA, 17 May–10 June 2021; pp. 1–5. [Google Scholar]
- Wang, X.; Saito, D.; Washizaki, H.; Fukazawa, Y. Facilitating Students’ Abstract and Computational Thinking Skills Using Virtual Reality. In Proceedings of the 2023 IEEE Integrated STEM Education Conference (ISEC), Laurel, MD, USA, 11 March 2023; pp. 243–246. [Google Scholar]
- Dabar @Ucitelji.hr—Udruga Suradnici u Učenju. Available online: https://ucitelji.hr/dabar/ (accessed on 21 April 2025).
- Nielsen, J.; Molich, R. Heuristic Evaluation of User Interfaces. In Proceedings of the SIGCHI Conference on Human Factors in Computing Systems, Seattle, WA, USA, 1–5 April 1990; Association for Computing Machinery: New York, NY, USA, 1990; pp. 249–256. [Google Scholar]
- Brooke, J. SUS: A “Quick and Dirty” Usability Scale. In Usability Evaluation in Industry; CRC Press: London, UK, 1996; ISBN 978-0-429-15701-1. [Google Scholar]
- Bangor, A.; Kortum, P.; Miller, J. Determining What Individual SUS Scores Mean: Adding an Adjective Rating Scale. J. Usability Stud. 2009, 4, 114–123. [Google Scholar]
- ISO 9241-11:2018(En); Ergonomics of Human-System Interaction—Part 11: Usability: Definitions and Concepts. ISO: Geneva, Switzerland, 2018. Available online: https://www.iso.org/obp/ui/#iso:std:iso:9241:-11:ed-2:v1:en (accessed on 6 May 2025).
- Nielsen, J. Usability Inspection Methods, 1st ed.; Mack, R.L., Ed.; John Wiley & Sons Inc: New York, NY, USA, 1994; ISBN 978-0-471-01877-3. [Google Scholar]
- Jenkins, D.G.; Quintana-Ascencio, P.F. A Solution to Minimum Sample Size for Regressions. PLoS ONE 2020, 15, e0229345. [Google Scholar] [CrossRef]
- Thorson, K. Early Learning Strategies for Developing Computational Thinking Skills. Available online: https://www.gettingsmart.com/2018/03/18/early-learning-strategies-for-developing-computational-thinking-skills/ (accessed on 7 May 2025).
- Linek, S.B. Order Effects in Usability Questionnaires. J. Usability Stud. 2017, 12, 164–182. [Google Scholar]
- Schmidt, A.F.; Finan, C. Linear Regression and the Normality Assumption. J. Clin. Epidemiol. 2018, 98, 146–151. [Google Scholar] [CrossRef]
- Granić, A.; Nakić, J.; Ćukušić, M. Preliminary Evaluation of a 3D Serious Game in the Context of Entrepreneurship Education. In Proceedings of the CECIIS 2017: 28th Central European Conference on Information and Intelligent Systems, 2017, Varaždin, Croatia, 27–29 September 2017; Volume 91, pp. 91–98. [Google Scholar]
Disclaimer/Publisher’s Note: The statements, opinions and data contained in all publications are solely those of the individual author(s) and contributor(s) and not of MDPI and/or the editor(s). MDPI and/or the editor(s) disclaim responsibility for any injury to people or property resulting from any ideas, methods, instructions or products referred to in the content. |
© 2025 by the authors. Licensee MDPI, Basel, Switzerland. This article is an open access article distributed under the terms and conditions of the Creative Commons Attribution (CC BY) license (https://creativecommons.org/licenses/by/4.0/).