Article

Digital Revolution in Spatial Planning: The Potential of Geolocation Data in Czechia

1
Department of Demography and Geodemography, Faculty of Science, Charles University, Albertov 6, 128 00 Praha, Czech Republic
2
Institute of Process Engineering, Faculty of Mechanical Engineering, Brno University of Technology—VUT Brno, Technická 2896/2, 616 69 Brno, Czech Republic
*
Author to whom correspondence should be addressed.
Urban Sci. 2025, 9(5), 158; https://doi.org/10.3390/urbansci9050158
Submission received: 28 January 2025 / Revised: 18 April 2025 / Accepted: 24 April 2025 / Published: 7 May 2025
(This article belongs to the Special Issue Sustainable Urbanization, Regional Planning and Development)

Abstract

:
This article analyzes population movement patterns in the Vysočina Region, Czechia, using mobile network geolocation data. Geolocation data provide new insights into population movement and structure, capturing real-time fluctuations in population size at different times of day and days of the week. The article aims to contribute to a better understanding of spatiotemporal population dynamics and identify links between movement patterns and different types of areas. Key mobility trends, such as work commuting, seasonal migration related to second homes and tourism, and the influence of urbanization on movement patterns, are identified. A scaling approach for categorizing municipalities based on their characteristics is proposed and tested in a case study of Vysočina Region municipalities. Furthermore, a case study of various municipality types demonstrates the practical application of geolocation data in spatial planning. The results highlight the value of these data for spatial planning, enabling a better understanding of population needs and optimization of public services and infrastructure.

1. Introduction

Effective spatial planning and settlement management require an accurate understanding of the spatiotemporal dynamics of the present population, which traditional data based on permanent residency often fail to capture [1,2]. This discrepancy between the registered and the de facto population can lead to inefficient planning of public infrastructure and services [1].
In recent decades, geolocation data, particularly mobile network operator (MNO) data, have emerged as a valuable resource for analysing these dynamics. These data allow for monitoring daily and weekly population rhythms with high granularity [3,4,5], opening new avenues for applying concepts of time geography and analysing urban or regional rhythmicity in practice. Globally, these data are utilised for studying urban mobility, e.g., [6,7], delineating functional regions [8], or analysing the impacts of extraordinary events like the COVID-19 pandemic [9], with its role within the context of “big data” for smarter and more sustainable urban planning being increasingly emphasised [10]. Similarly, GPS data, although often based on a smaller population sample, provide detailed insights into individual behaviour and space utilisation [11].
Despite these advancements in the analysis of MNO data [4,5,6,7] and its application for population estimation [8,9], a research gap persists in systematically linking detailed spatiotemporal patterns derived from these data to the functional classification of settlements and, subsequently, to practically applicable recommendations for spatial planning. Most studies focus on analysing the patterns themselves or concentrate on large cities or agglomerations, e.g., [11,12,13,14]. Meanwhile, less attention is paid to the systematic classification of diverse settlement structures and types of municipalities (including rural settlements) based on their population dynamics and to the explicit linking of these typologies with specific planning strategies. This aspect is also less explored in the Czech context, as seen in [1,15,16,17,18], where methodologies enabling automated scaling and application of findings across diverse settlement structures are lacking.
This article seeks to address this gap. The novelty of this paper lies in the proposal, verification, and demonstration of the following approaches:
(a)
Utilises characteristic daily and weekly population rhythms derived from MNO data to identify functional types of municipalities at a regional scale (Vysočina Region), encompassing a broad spectrum of settlement types.
(b)
Introduces a method for the systematic classification of municipalities into these types.
(c)
Through case studies of representative municipalities, the paper demonstrates how the derived typologies can be directly translated into specific, data-driven recommendations for spatial planning practice.
The main objective is, therefore, not only to analyse population dynamics but, crucially, to demonstrate the practical applicability of this approach for creating more informed and functionally relevant planning documents within diverse settlement environments. Thus, the study contributes to bridging theoretical concepts of time geography and urban rhythmicity, e.g., [19,20,21], with applied spatial planning through the analysis of mobile network operator data.

2. Literature Review

2.1. Time Geography, Temporal Rhythms, Mobility, and Spatial Change

To understand the spatiotemporal dynamics of populations, which form the basis for the functional typology of settlements proposed in this study, we draw upon concepts from time geography and related theories of rhythmicity and mobility. The foundations of time geography, laid by Hägerstrand [19], conceptualise the individual’s movement through spacetime and the constraints that shape their activities [20]. This framework has evolved into a comprehensive approach for analysing group behaviour patterns [21] and serves as a bridge between disciplines [22], emphasising the equivalence of time and space [23]. For understanding the dynamics observed through geolocation data, the following concepts are particularly relevant:
Polyrhythmicity: The concept of polyrhythmicity emphasises that places pulsate with overlapping rhythms of various activities (work, transport, leisure) [24]. The analysis of geolocation data, as employed in this study, allows for the decomposition of these complex rhythms to understand how they shape the overall dynamics of a locality. The identification of dominant rhythms serves as the basis for differentiating functional types of settlements, which is one of the main objectives of this work.
Changes in mobility and place attachment: Contemporary shifts in mobility, including flexible forms of work and housing [25,26], weaken traditional ties to a single location and lead to more frequent discrepancies between the place of residence and the place of actual activities [25]. This reduces the reliability of traditional statistics [2,27] for capturing the actual presence and needs of the population. Geolocation data, therefore, represent a key resource for monitoring these dynamic mobility patterns and their impacts [3], which is essential for creating a realistic picture of the functional use of municipalities in our analysis.
Rhythm of localities: This concept describes the recurring temporal patterns in the size and structure of the de facto population at a given location, which are closely linked to the locality’s function within the settlement system [17,28]. The present article utilises the analysis of these rhythms from mobile network operator data to derive a functional typology of municipalities in the Vysočina Region, thereby operationalising this concept for the needs of spatial planning.
These concepts find specific application in research on urban rhythmicity, e.g., [29] and chrono-urbanism [14,30]. Our study builds upon these directions but expands their application framework by analysing rhythms in a diverse regional context that includes not only cities but also suburban and rural municipalities. This allows for a more comprehensive understanding of the functional differentiation of the entire settlement system, an aspect often overlooked in studies focused exclusively on urban environments.

2.2. Geolocation Data

As indicated, traditional data sources such as population censuses or registers offer only a limited view of the dynamic reality of population presence, mainly due to time lags and inadequate capture of short-term movements and non-routine stays [2]. Obtaining more precise data through traditional methods often requires costly field surveys [28] or expert estimations [31]. However, the adaptation of research methods, particularly the use of information and communication technologies (ICT), opens new possibilities for monitoring the spatiotemporal behaviour of the population [27].
Geolocation data play a key role here, especially mobile network operator (MNO) data, which allow for the examination of population movements and presence at various spatiotemporal scales with high granularity [4]. These data have found application in a wide spectrum of uses: from monitoring seasonal population changes in cities [32] through analysing daily, weekly, and annual rhythms of places [5] to detailed research on urban mobility and the factors influencing it [6], or analysing the spatial aggregation and activity of urban populations [33]. While studies covering entire countries are less common due to the volume and nature of the data (e.g., Estonia [34]), they demonstrate the potential of these resources for national-level analyses.
A current global trend involves efforts to integrate various types of geolocation data and link them with other information sources. The importance of “big data” analyses, which can combine data from mobile networks, GPS, social media, and other sensors, is growing. These approaches enable a better understanding of complex functional relationships within urban systems, including movement patterns, public space usage, and interactions between population groups [7]. Examples include integrating geolocation data with public registers and traditional spatial data [8], their use for monitoring land use dynamics [35], or combining them with spatial data infrastructure (SDI) data for local spatial planning needs, as demonstrated, for example, in Poland [36].
GPS data also offer valuable insights. These data are often collected purposefully (e.g., via applications or dedicated devices) and provide highly accurate trajectories, enabling detailed analysis of individual behaviour. Examples include analysing the attractiveness of transport hubs considering demographic aspects [11] or examining changes in the behaviour of city visitors during the COVID-19 pandemic and their relationship to the built environment using combined mobile data [9]. These studies illustrate the potential of various types of geolocation data for specific research questions and planning tasks.
In the Czech and Slovak context, geolocation data, primarily from mobile networks, have become the basis for numerous research works. J. Novák was particularly instrumental in their introduction [37,38]. Research has focused, for example, on analysing urban rhythms and the spatiotemporal organisation of activities in cities [14,27,38,39], examining the mobility of specific population groups such as students [38], methodological issues in processing geolocation data for statistical purposes [18,27,40,41,42], estimating the actual population and daily mobility in large urban regions [17], or reflecting on the impacts of the COVID-19 pandemic on spatiotemporal behaviour [43].

2.3. Novelty and Contribution

This article builds upon the foundations of existing research that utilises geolocation data for analysing mobility and the spatiotemporal behaviour of populations, e.g., [4,5,6,7,8,9,25,26,27,28]. However, as discussed in more detail in the introduction, we have identified a persistent gap in the literature: the lack of a systematic approach that would (1) link the detailed spatiotemporal mobility patterns derived from these data with a functional classification of settlements, and simultaneously (2) explicitly formulate practical recommendations for spatial planning based on this classification. This gap is particularly evident when analysing diverse types of municipalities outside major metropolitan areas, where traditional methods often fail to capture the functional reality.
Unlike typologies based primarily on static (e.g., socio-demographic) or administrative characteristics, this work uses the dynamics of the actual population as a key input—specifically, the daily and weekly mobility rhythms derived from anonymised mobile network operator data. These rhythms allow for the identification of functional types of municipalities (e.g., residential, commuting, service centers) based on the actual use of territory by the population, providing a more nuanced and realistic picture than static indicators. In the Results section, we demonstrate how these rhythms differ among the identified types of municipalities.
The methodology is designed and applied for the systematic and efficient classification of a large number of municipalities (all municipalities in the Vysočina Region) into the identified functional types. Emphasis is placed on including a broad spectrum of settlement types (urban, suburban, and rural). In this way, our approach differs from studies often narrowly focused on large cities or metropolitan areas [8,17,33] and allows for a more detailed understanding of the functional specifics and interdependencies within the entire regional settlement system. The ability of our method to distinguish functional types even in less urbanised areas, as will be shown in the Section 4 and Section 5, supports this aspect of novelty.
A key element of the contribution is that the methodology does not end with the classification itself. As demonstrated in the case study (Section 4 and Section 5), the derived functional typology is directly used to formulate specific, data-driven recommendations for spatial planning, transport services, or service development in different types of municipalities. This step represents a bridge between analytical knowledge and its practical application, something often lacking in previous research.
This combination of the methodological approach (dynamic rhythms), its systematic application at a regional scale to diverse settlements, and the explicit focus on translating findings into planning recommendations form the core of this study’s novelty. In the following chapters (Section 4 and Section 5), these claims will be supported by specific empirical findings and their interpretation.

3. Materials and Methods

This chapter focuses on a detailed description of the methodology used for the collection and analysis of population mobility data. The main source of the data was anonymized and aggregated data from mobile networks. The aim was to identify typical mobility patterns and, based on them, to create a typology of municipalities. This typology allows a deeper understanding of daily and weekly rhythms in the region. For better clarity, the procedure can be summarised in the following key steps see Figure 1

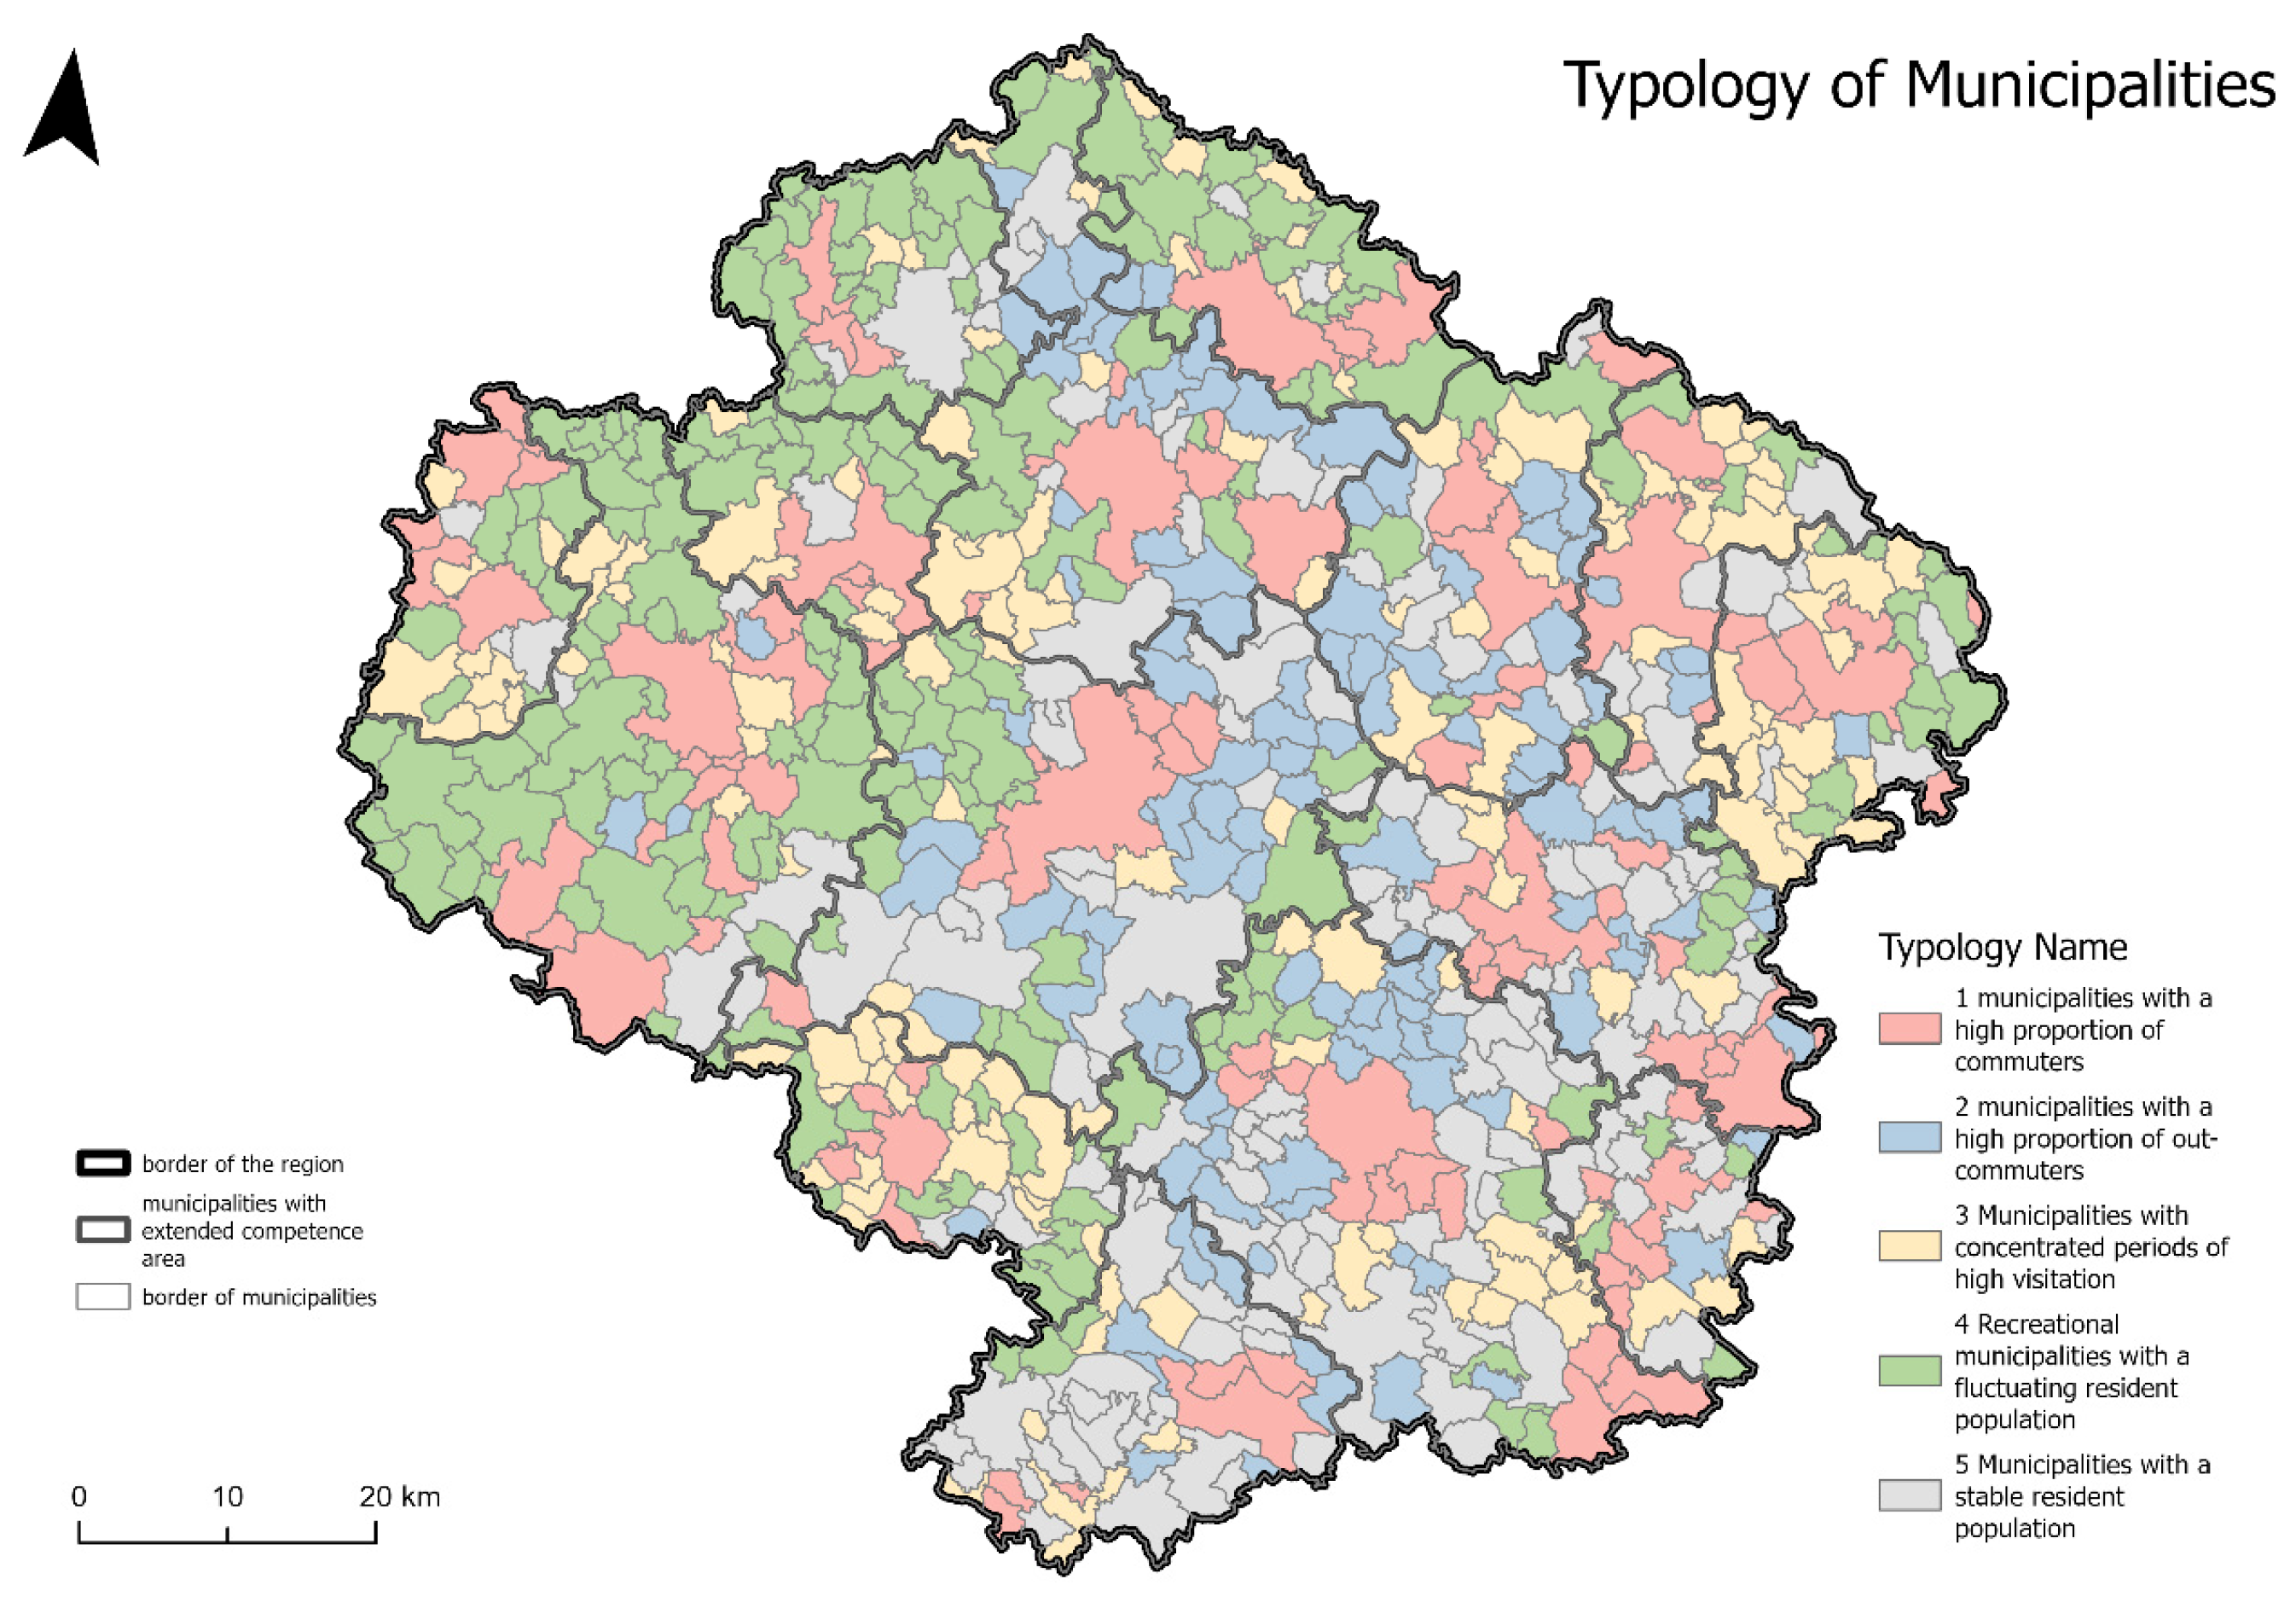
3.1. Study Area: Vysočina Region

The Vysočina Region, the focus of this article’s empirical section, offers a compelling case study representing diverse conditions across Czechia. Located centrally within the country—and, therefore, in Central Europe—on the historical border of Bohemia and Moravia, it lies relatively close to the northern border of Austria (Figure 2).
Spanning roughly 6796 km2, the region is home to approximately 510,000 inhabitants distributed across 704 municipalities. Its settlement pattern is distinctly polycentric, featuring several key towns rather than a single dominant metropolis. These include the regional capital, Jihlava, along with Třebíč, Havlíčkův Brod, Žďár nad Sázavou, and Pelhřimov.
Vysočina’s character is marked by a blend of urban and rural settings, extensive forests within the scenic Bohemian–Moravian Highlands, and significant infrastructure like the D1 motorway. This vital transport artery connecting Prague and Brno runs directly through the region, influencing its economic activity and commuting patterns. The region’s multifaceted nature—combining industry, agriculture, popular recreational areas, and zones with numerous second homes—underscores its suitability for research aiming to capture the varied environments found throughout Czechia.

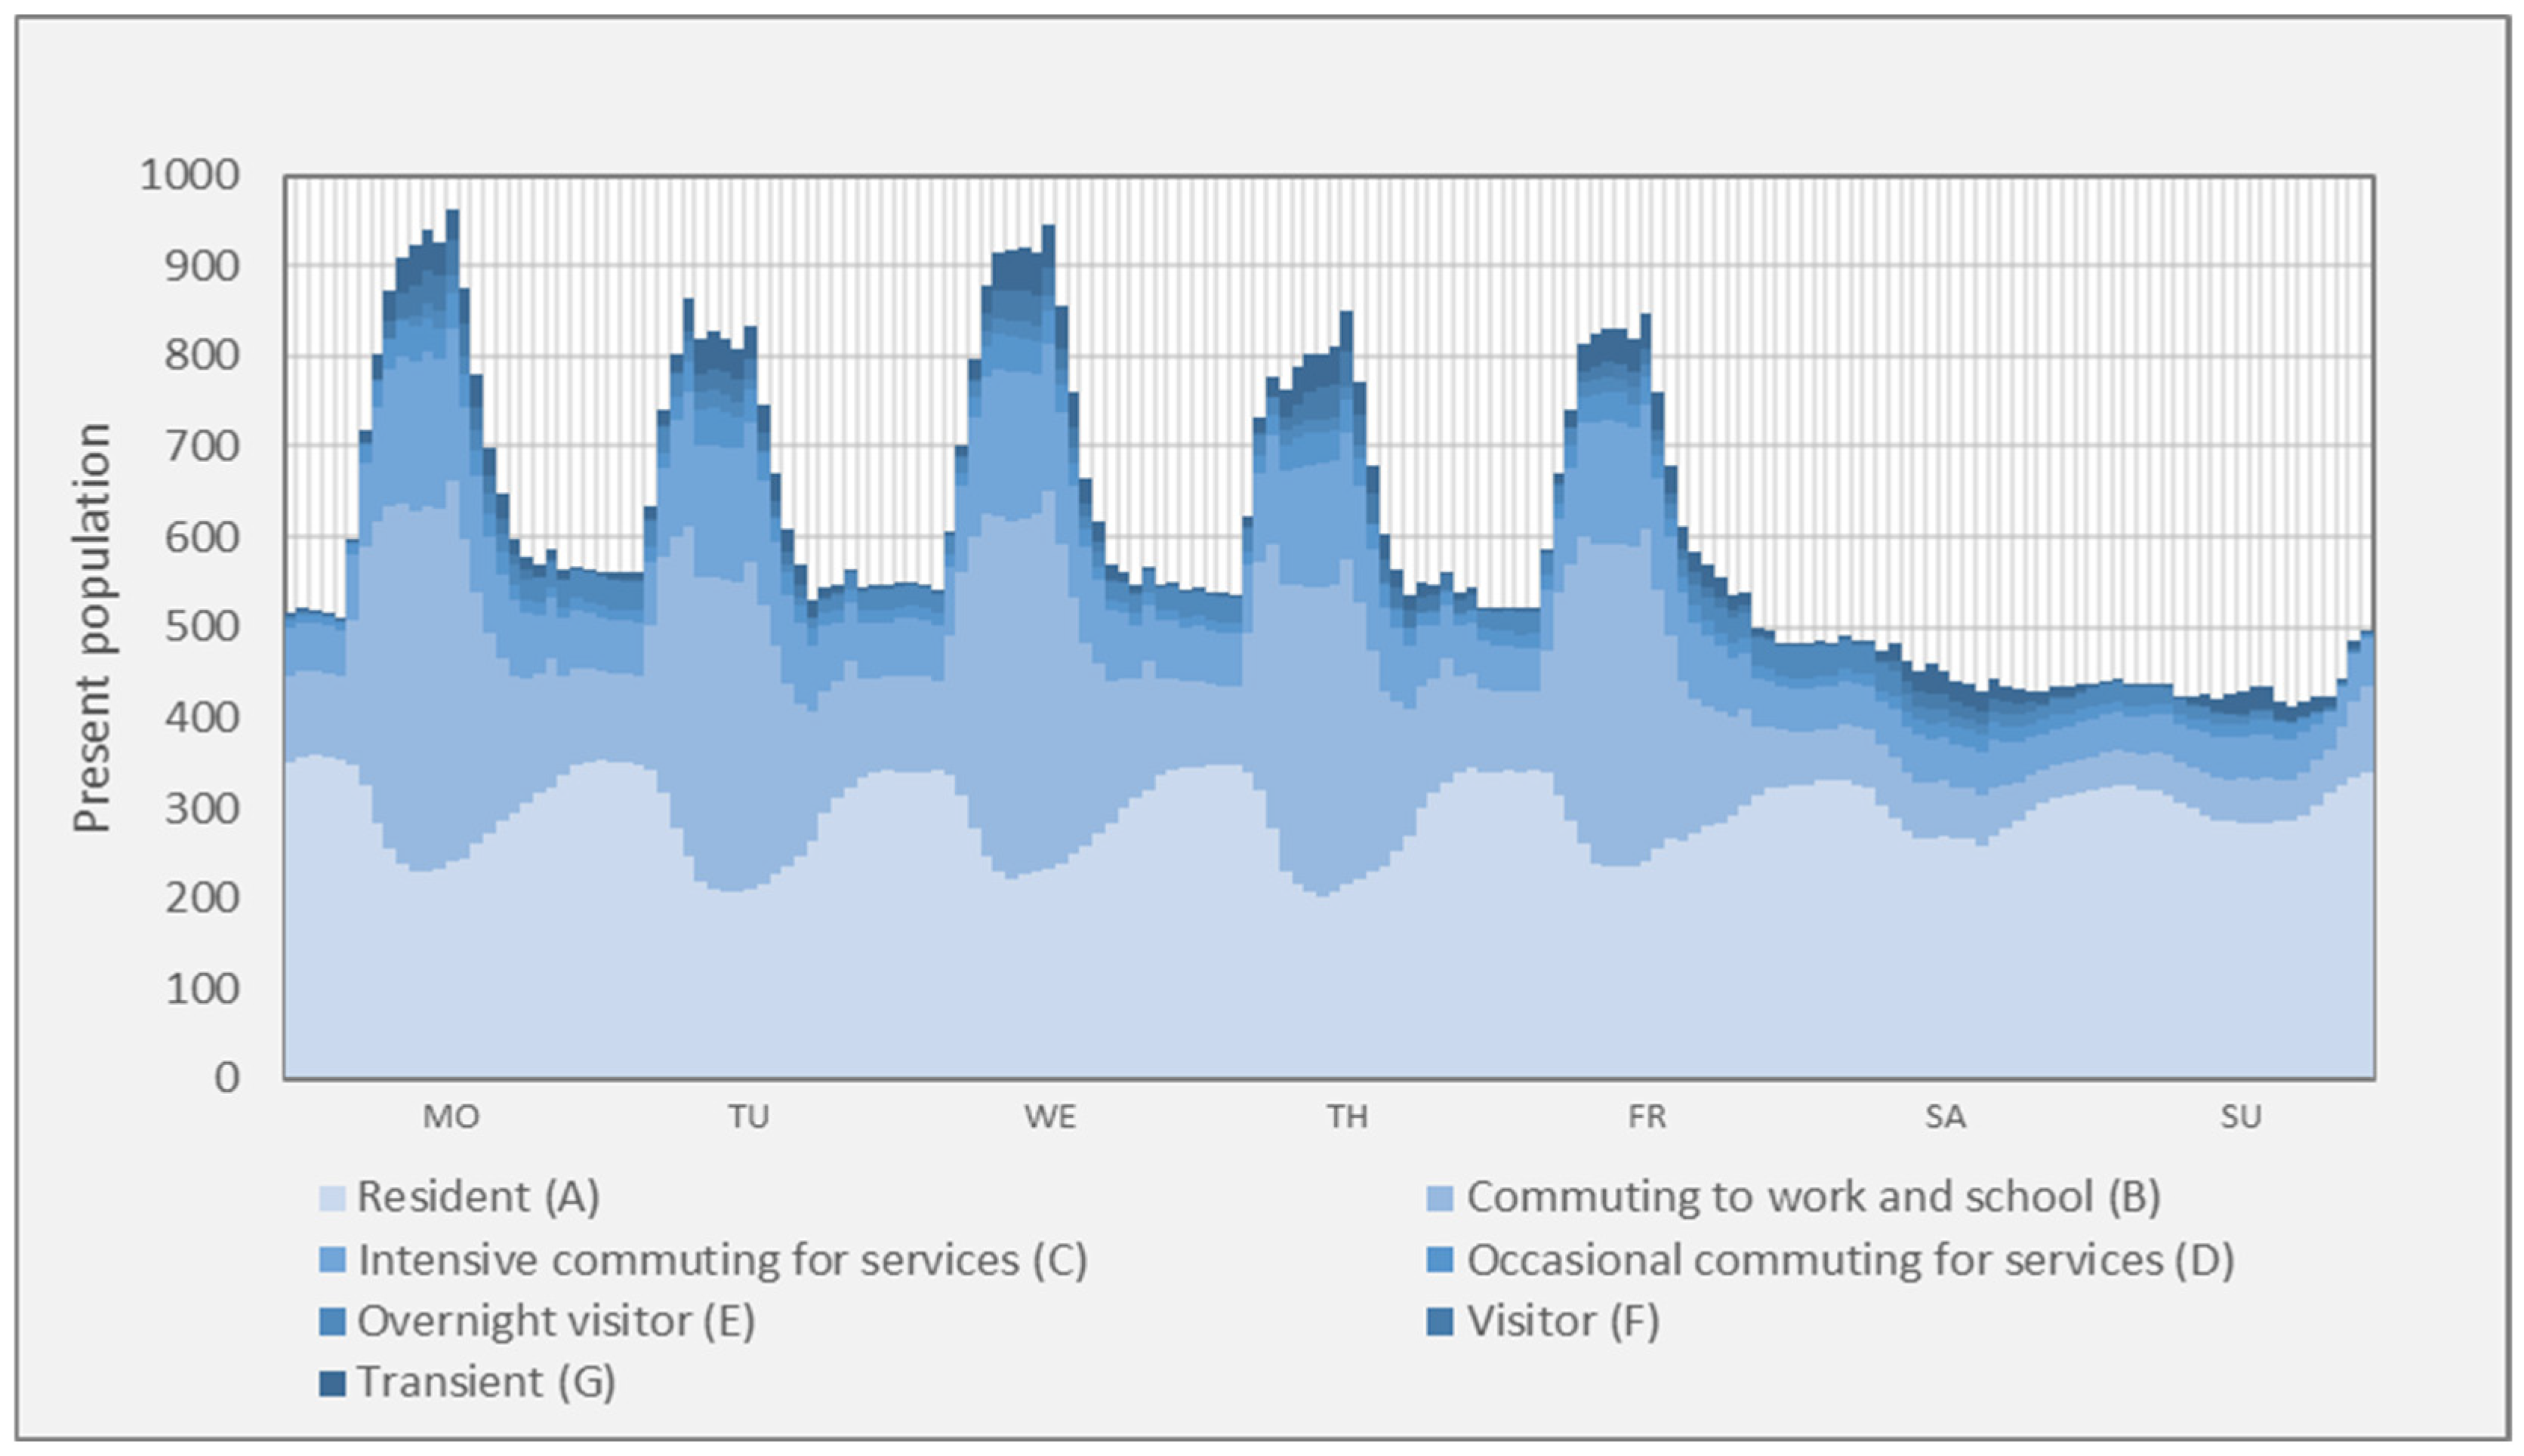
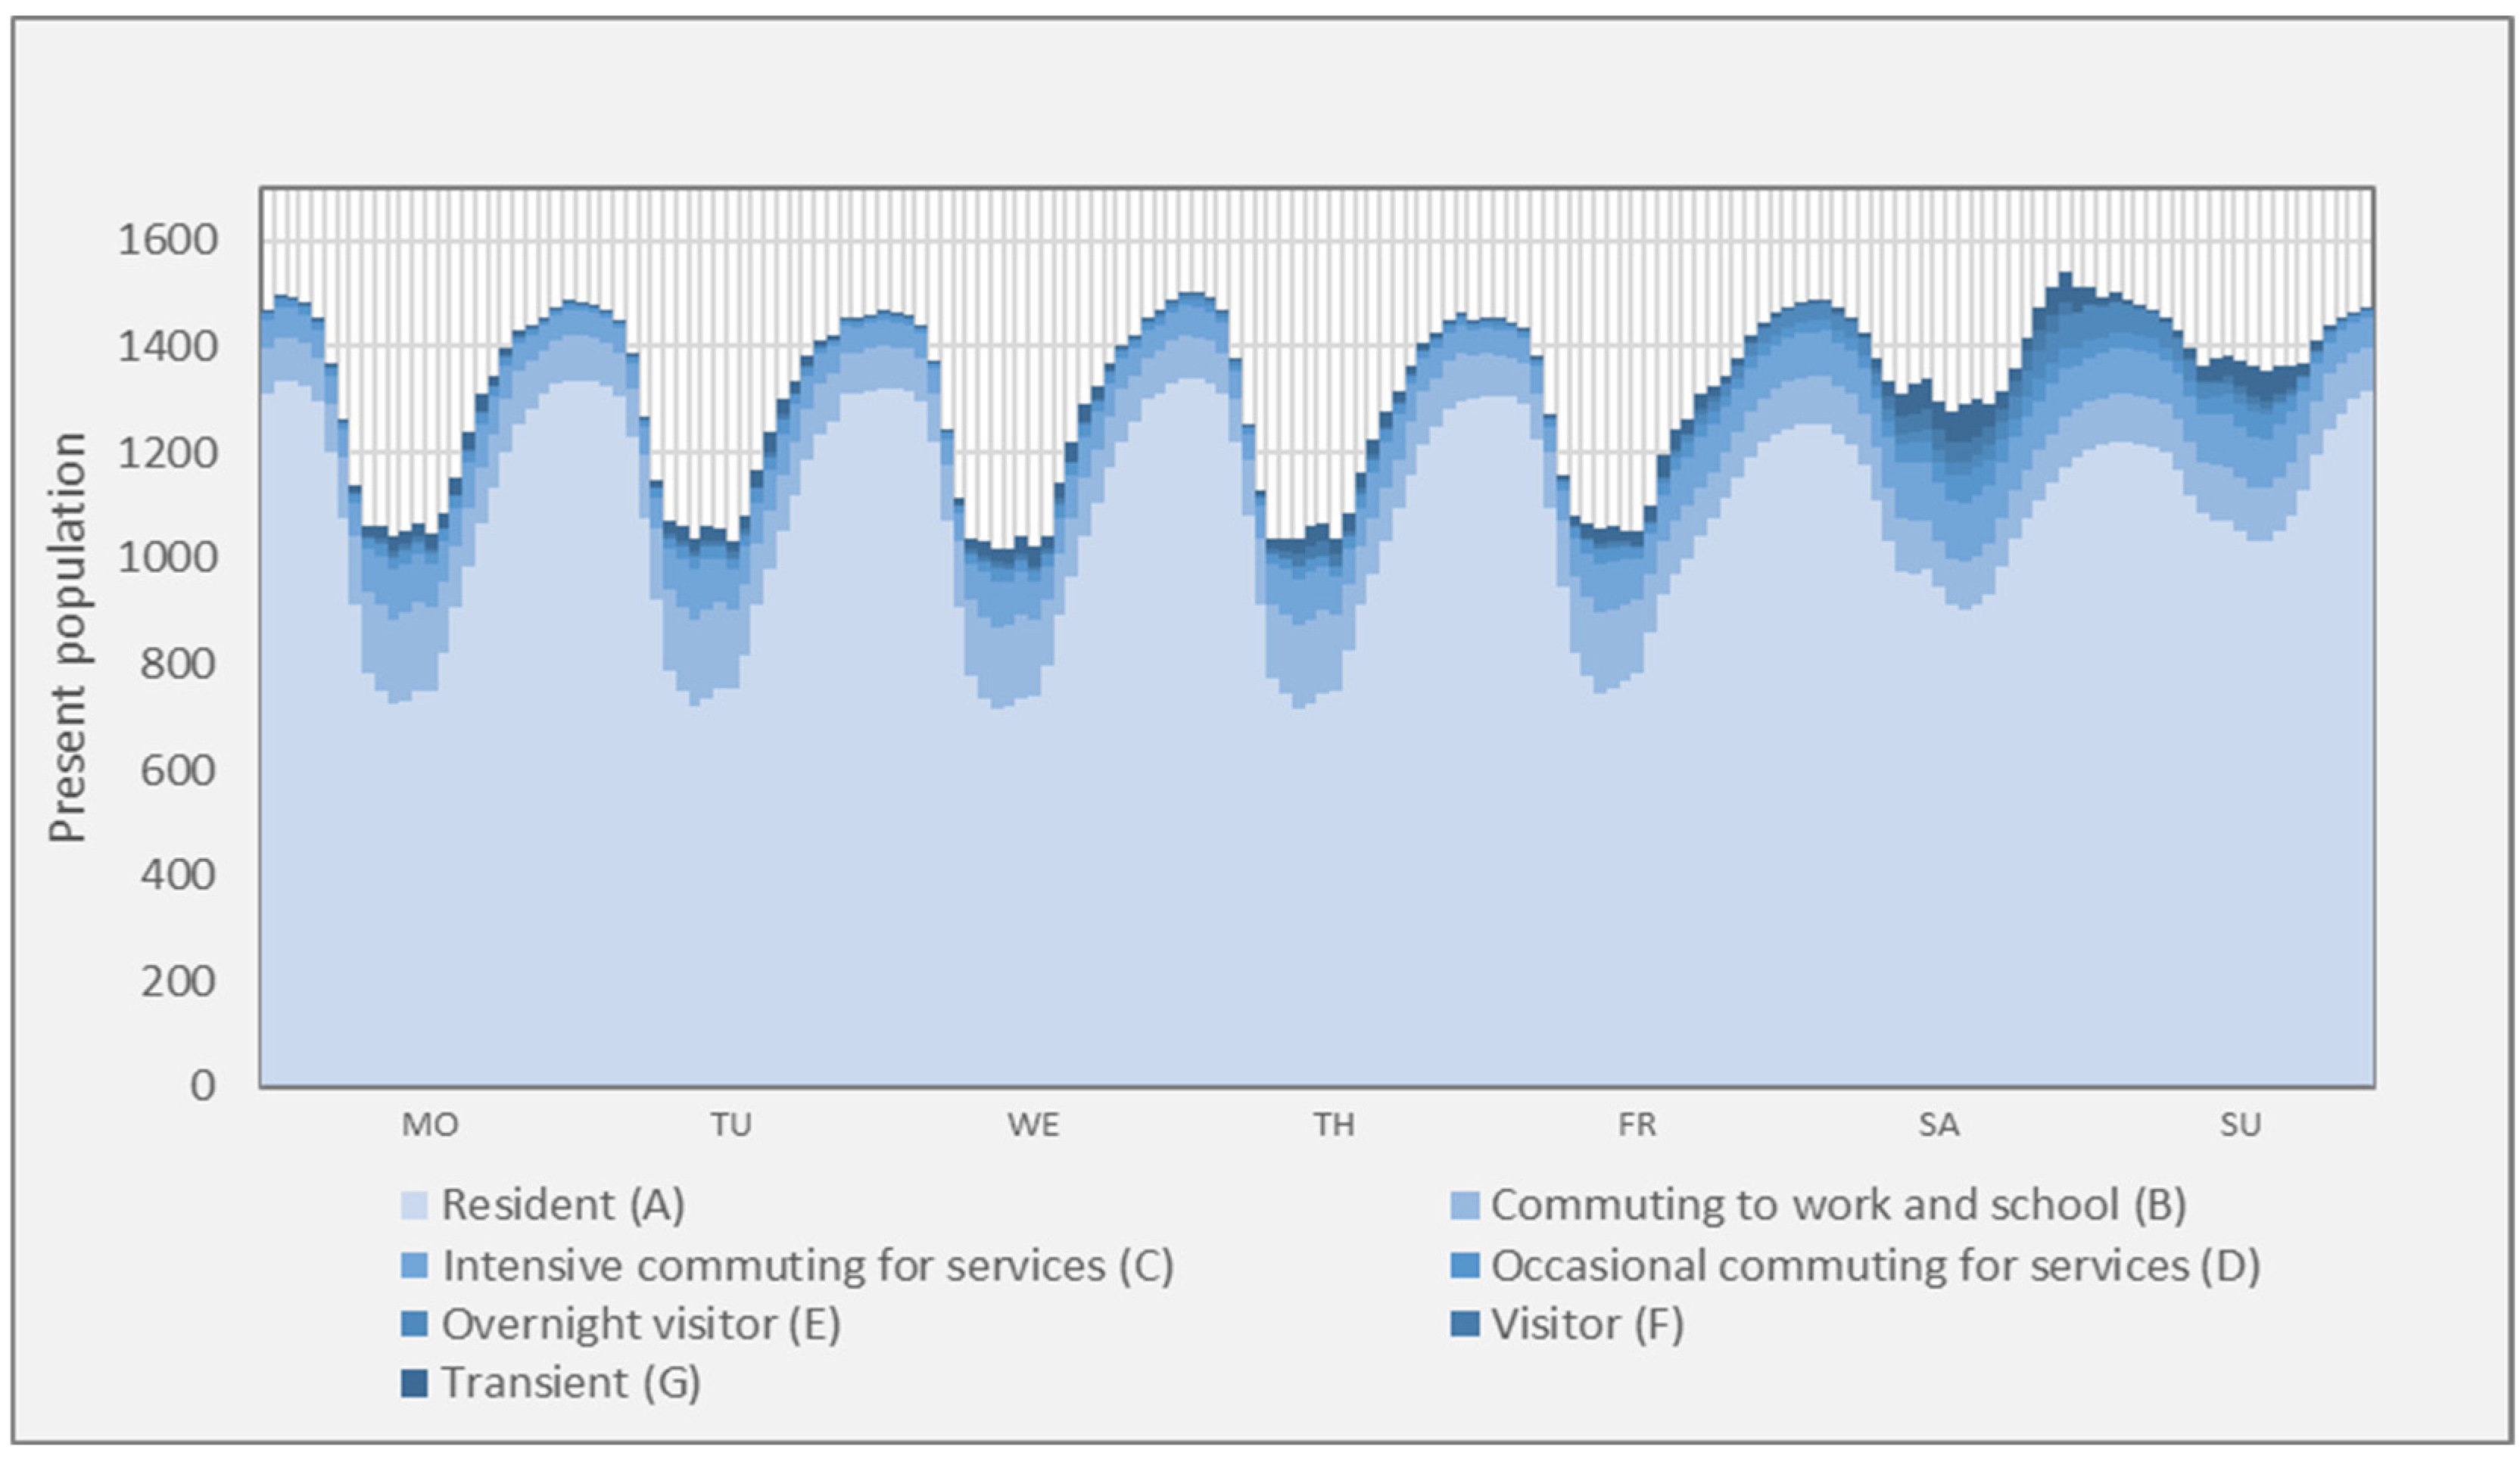
3.2. Definition of Present Population Categories

For the purposes of this study and based on the analytical possibilities of the available mobile network operator data, it was necessary to define various categories of the present population, as summarised in Table 1. The typology presented in Table 1 was adopted and adapted from the methodology developed and described in detail within a project of the Ministry of the Interior of the Czech Republic [44] and applied by Václav Jaroš [45], whose work dealt in detail with the use of mobile network operator geolocation data for analysing the settlement system and mobility in Czechia.
The rationale for this typology lies in the need to distinguish key differences in the nature of individuals’ presence in a given locality based on mobile network operator data. The basic division is between residents (individuals for whom the locality is the dominant place of overnight stay) and non-residents. The non-resident group is further structured according to the frequency, regularity, and probable purpose of their stay, as can be inferred from the data. Thus, different types of commuting (regular daily for work/school, intensive or occasional for services) and different types of visitors (overnight, one-off, transiting) are distinguished. This detailed breakdown is enabled precisely by the specific nature of mobile network operator data, providing information on the duration, frequency, regularity, and temporal patterns of users’ stays during the monitored period [46].
First, it is necessary to define the concept of “real population (or present population).” The concept of the real population, or the present population, includes all persons who are present in a given territory at a given moment in time. The present population and its change provide more accurate and useful information about the given territory. This includes both the permanent resident population and a wide range of people who commute to the location repeatedly or non-repeatedly. Other categories are non-residents who repeatedly commute to work, schools, and for services. These people spend a significant part of the day in the location, and their number can vary considerably depending on the time of day and day of the week. The last category is non-residents who visit the location non-repeatedly. This includes tourists, visits to relatives and friends, participants in one-off events, etc.

3.3. Methodological Framework for Data Collection

Mobile data fall into the family of big data and have been used in research for approximately two decades. The basic aspect of data generated from mobile phones is their secondary nature. Location data from mobile operators are created as a by-product of telephone communication providers [17]. The use of data from all operators minimizes the distortion of the image of population mobility, which could arise due to the specific distribution of the user base of individual operators in time and space. For mapping mobility and population density in the Czech Republic, anonymized and aggregated signaling data from mobile operators O2, Vodafone and T-Mobile are used. These data are generated by the technological equipment of the network and are used for its management, the reachability of mobile devices and billing.
The presented model is based on the premise that mobile phones are highly likely to coincide locally with their users most of the time. This assumption makes it possible to eliminate records from other devices, such as tablets or wearable electronics, thus significantly reducing the number of duplicate records relating to the same individual. Furthermore, the model neglects data from inactive SIM cards, as these cards generate insufficient location data in the network for robust analysis. A basic prerequisite for the functionality of this model is the high penetration of mobile phones in the given population. This fact has been previously confirmed in a number of studies, for example, by Jaroš [45] and Novák et al. [33].
Information about mobile network users is recorded when the mobile phone is active. This includes making outgoing and incoming calls, communications via Short Message Service (SMS) and Multimedia Messaging Service (MMS), and data connections. Even for inactive phones, the data show their presence in the network and switching between transmitters. It is important to emphasize that mobile phones do not report their location with every change, only in specific cases. Within one territorial area with multiple cells, the exact location of an inactive phone is not known. Once at a set interval (typically around 30 min), the mobile phone reports its active cell to the mobile network, and this event is subsequently reflected in the signaling data. A phone that does not report its location after a given interval is considered “turned off” by the network and, after technological intervals, removed from the network’s operational registers until it is “turned on” again [44].
The detection of stay/movement and its assignment to individual territorial units (municipalities) is carried out through a “cell mapping process”. When assigning cells to specific territorial units (municipalities), the algorithm takes into account several key factors. Firstly, the algorithm accounts for the spatial extent of the intravilán (built-up area or urban footprint) of each settlement, specifically the proportion of the built-up area contained within the coverage area of a given cell tower. Secondly, the algorithm takes into account the population density of individual settlements. In this way, it is ensured that the measured records are assigned to the settlement to which they are most likely related. This approach has been described in detail in the work of Jaroš [45]. It is important to emphasize that the data obtained from mobile networks do not contain direct information about specific users (SIM cards) if the device is located abroad or is connected to another operator’s network. This means that the data are collected at an anonymized level. During the collection and processing of these data, maximum emphasis is placed on protecting user privacy. The data are aggregated and anonymized to ensure that it is not possible to identify individual persons [44].
For data collection, only those SIM cards for which the mobile operator has information from the network and for whose processing users have given consent to data processing were used. Data on users who have not given consent to data processing (this also applies to foreign SIMs) are not part of the basic dataset. Any deviations in the results due to the uneven territorial distribution of SIM cards for whose processing consent has not been given in relation to the total population of SIM cards are compensated for in the results using appropriate correction mechanisms [44].
Given that, by the nature of things, it is not possible to supplement the missing mobility data for persons without a SIM card from the signaling data themselves, this structural deficit of the signaling data is addressed by estimating the number of persons without SIM cards in individual municipalities using a coefficient of the proportion of inhabitants of the municipality without a SIM card determined for each individual municipality [45].
The final adjustment to the population is carried out as follows. Based on the number of residents across all municipalities and the target population values for the Czech Republic, a population adjustment coefficient for each hour ( P k h ) is calculated using the following formula:
P k h = P r e s e n t   p o p u l a t o n h * P o p u l a t o n o f f i c i a l _ s t a t i t i s t i c s / P r e s e n t   p o p u l a t o n h
The mobility of residents was measured over a period of 28 days during the summer of 2022. The goal was to minimize the impact of technical network issues on the results. The measurement also included days of public holidays, school holidays, and other specific time periods to reflect typical conditions as accurately as possible [45].

3.4. Methodology for Municipality Typology

As mentioned in the introduction, the Vysočina Region was chosen for the purposes of this work as a typical region of Czechia. The proposed typology of municipalities (see Table 2) is based on conceptually recognized functional types of settlements that are commonly used in spatial planning and geographical research (e.g., municipalities with a dominant residential function, commuting centers, and municipalities with a recreational function). Therefore, it is not an entirely new typology at the conceptual level but rather a new method of operationalization and quantification for the specific purposes of analyzing settlement dynamics.
This operationalisation is based on the innovative use of criteria derived from the dynamics of the present population, measured using mobile network operator data (Equations (2)–(5)). Although this methodological approach—classifying municipalities based on their actual functional use identified from mobility—was elaborated and calibrated in detail within the context of the Vysočina Region in the Czech Republic, we consider it to be generally methodologically valid and transferable.
The methodology is directly applicable to other regions in the Czech Republic, although minor adjustments of threshold values may be appropriate depending on the local settlement structure and mobility patterns. The principle of using mobile data for the functional typology of municipalities is also highly relevant for other European countries with settlement structures and population densities similar to those typical of most regions in the Czech Republic (i.e., outside dominant capital cities). Here, local adaptation and calibration of the criteria’s threshold values will also likely be necessary. Application to capital cities and their immediate hinterlands would require specific consideration, as the mobility dynamics and land use structure are often more complex there and influenced by factors (e.g., public transport systems) that do not play such a dominant role in our model region. However, the fundamental methodological principle remains valid even there, although it might require expansion or modification of the criteria.
The analysis of daily and weekly rhythms provides a detailed picture of how residents of different municipalities move and how their movement patterns differ depending on the day of the week and the time of day. The analysis made it possible to divide the municipalities of the Vysočina Region into several categories. Representative samples of different types of areas with different mobility characteristics and population structures were selected as examples. Based on the number of present inhabitants in each municipality in the Vysočina Region, a typology was created that reflects the so-called rhythm of the given area. These main typologies of municipalities are identified in Table 2 (presented in the Results section).
To perform an automatic analysis of population data in individual municipalities, it is necessary to define criteria that can quantify the relationship between the municipalities and their defined typologies mentioned above. Since municipalities can fall to varying degrees into multiple typologies, it is necessary to propose a generally given rule that will determine the primary category for a given municipality or offer the proportion of individual typologies. Formula (1), which makes it possible to select the primary typology, is given below.
Definition of sets and parameters:
i I Set of municipalities ( i = 1 , , 704 , for the Vysočina Region)
j J Set of typologies ( j = 1 , , 4 , see definitions below in the text)
d D Set of days of the week ( d = 1 , , 7 )
t T Set of hours within a day ( t = 1 , , 24 )
α i j Basic criterion for municipality i and typology j
δ i Primary criterion for municipality i
π d t Present population on day d and hour t
ρ i Number of permanent residents in municipality i
φ i j Percentage share by which municipality i falls into typology j
ω j M Representation of typology j in municipalities
ω j C Representation of typology j by the number of permanent residents
δ i = max j α i j α j ~
where α j ~ is the median of the criteria α i j or typology j . From the calculated criterion δ i s possible to determine the primary typology. If δ i > 1, then municipality i falls into the selected typology of municipalities j for which δ i = ( α i j / α j ~ ) . In the case where δ i 1, it is a municipality not exhibiting the influence of the category j .
This article examined the following typology of municipalities:
j = 1 Municipalities with a high proportion of commuters
j = 2 Municipalities with a high proportion of out-commuters
j = 3 Municipalities with sudden visitor influxes
j = 4Recreational municipalities with a fluctuating present population.
If a municipality does not fall into any of the four selected typologies of municipalities (i.e., the municipality does not exhibit at least one criterion with a value above the median of all municipalities for the given typology), the municipality falls into the typology with stable present population in any period ( j = 5 ) .
Below are the definitions of the criteria for individual municipality typologies (see Equations (2)–(5)). It should be added that this is not a general exact definition. The specific form of the calculation of the observed criterion is given by the available data and may be defined differently for different regions. It is also appropriate to add the information that more typologies of municipalities can be defined or the chosen typologies can be reformulated.
α i 1 = d D t = 7 16 π d t 10 d D t = 1 6 π d t 6 f o r d D t = 7 16 π d t 10 > d D t = 1 6 π d t 6
α i 2 = d D t = 1 6 π d t 6 d D t = 7 16 π d t 10 f o r d D t = 7 16 π d t 10 d D t = 1 6 π d t 6
α i 3 = max d D , t T ( π d t ) d D t T π d t 7 24
α i 4 = d = 6 7 t T π d t 2 d = 1 5 t T π d t 5
To obtain a percentage measure for individual municipality typologies, it is necessary to normalize the criteria. The specific calculation is shown in Equation (6).
φ i j = α i j j α i j       f o r   α i j > 0       0       f o r   α i j 0
Furthermore, the representation of individual typologies can be calculated by municipality count ω j M (the percentage of municipalities that fall into the given typology) and by population ω j C (what percentage of the population, according to permanent residence, falls into the given typology). The calculation can be performed according to Formulas (7) and (8).
ω j M = i I φ i j I
ω j C = i I φ i j ρ i i I j J φ i j ρ i
where I represents the cardinality of set I .
This methodological approach, utilising dynamic mobility data to classify municipalities based on quantifiable criteria related to their functional rhythms, provides the framework for the analysis presented in the Results section.

4. Results

By applying the methodology described in the previous chapter (Section 3.4), specifically by evaluating the criteria based on daily and weekly rhythms of the present population (Equations (2)–(5)) for each municipality in the Vysočina Region, it was possible to identify five basic functional types of settlements. These types reflect characteristic patterns of mobility and actual territory use, which are often not apparent from traditional static data. The following Table 2 defines these five resulting types, which were derived directly from the analysis of mobile operator data using the established criteria. This typology forms the basis for the further analysis of the results presented in this chapter, including the spatial distribution of the types, their quantitative representation, and detailed case studies.

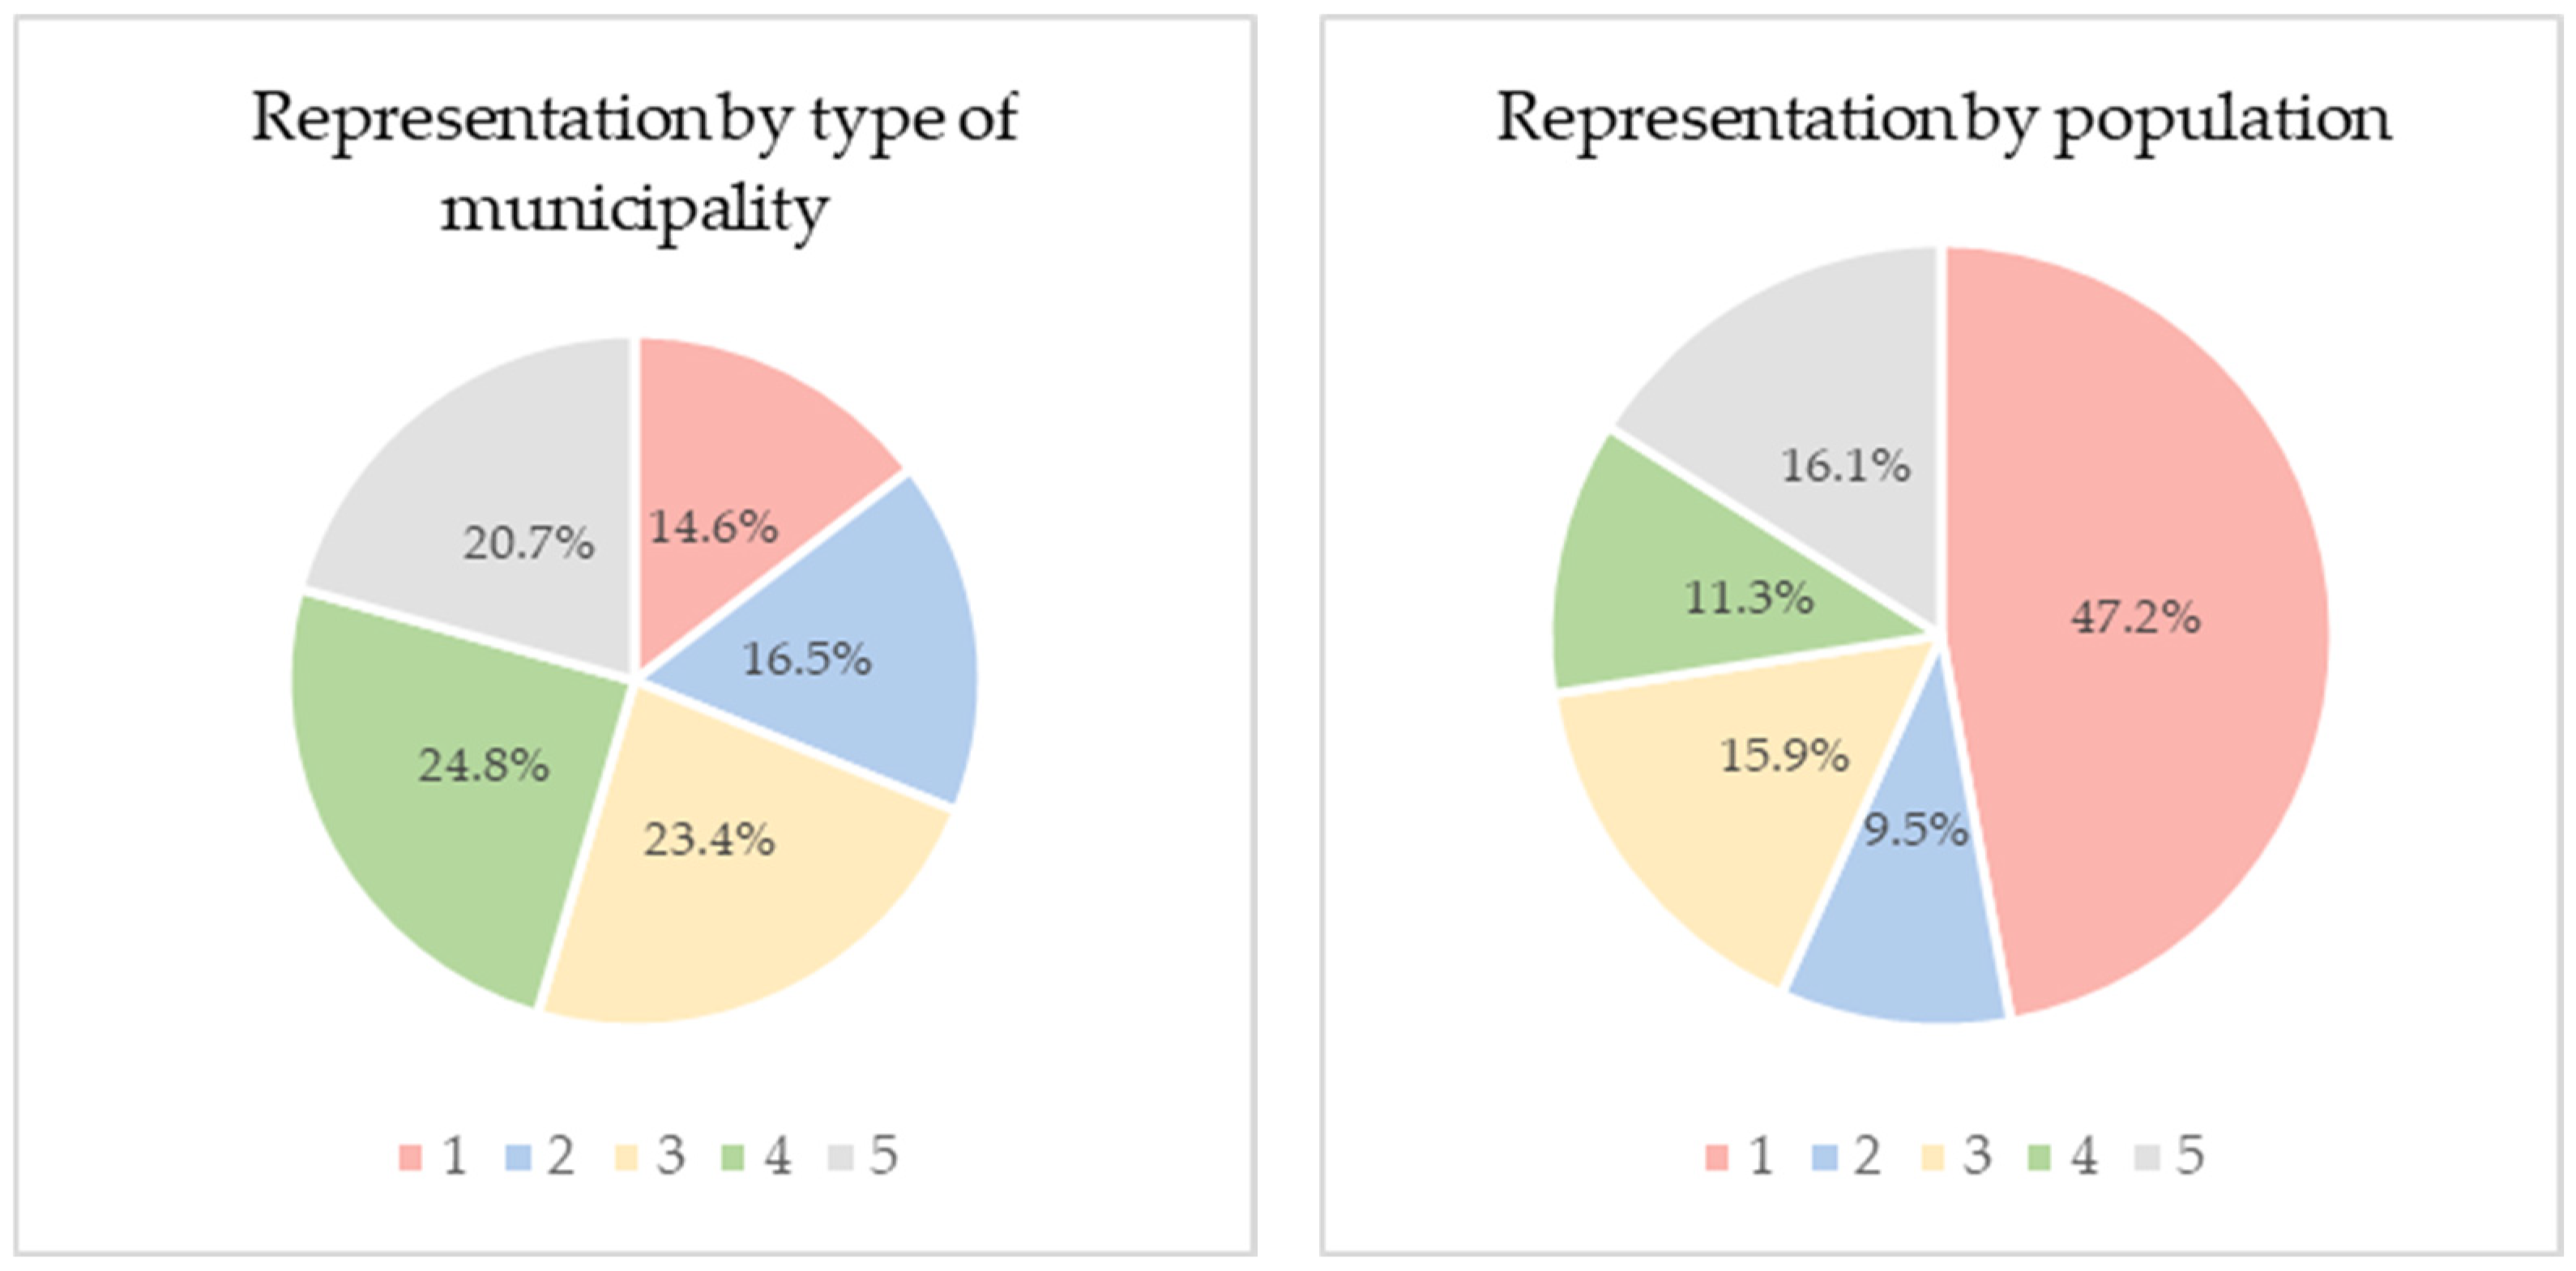
4.1. Typology of Municipalities in the Vysočina Region

It should be emphasized that this typology and the associated percentages are derived from the present population rather than the permanent resident count. This means that it also takes into account people who are temporarily staying in the municipality (e.g., tourists, vacationers, commuters). Consequently, these data offer a more complete understanding of settlement patterns and land utilisation in the Vysočina Region. Municipalities are classified by primary typology, as shown in the map in Figure 3.
The percentage representation of individual types of municipalities in the Vysočina Region, based on the number of present inhabitants, shows the diversity of the character of municipalities in this region (Figure 4). The dominant share (24.8%) is shown by recreational municipalities with a fluctuating present population, which implies a significant role of tourism and recreational activities in the socio-economic structure of the region. They are followed by municipalities with sudden visitor influxes (23.4%) and municipalities with a stable present population (20.7%), with both these categories showing the same representation. This coexistence indicates the existence of two different types of settlements—on the one hand, settlements with dynamic but time-limited visitor numbers and, on the other hand, settlements with relatively stable demographic structures and low migration rates. Municipalities with a high proportion of out-commuters make up 16.5%, while municipalities with a high proportion of commuters represent 14.6%.
Representation by population provides a different view of the structure of municipalities in the Vysočina Region. Almost half of the inhabitants of the Vysočina Region live in municipalities with a high proportion of commuters (47.2%). This suggests that these municipalities play the role of catchment centers, probably with good transport accessibility and a concentration of job opportunities. The second largest share of inhabitants (16.1%) live in municipalities with a stable present population. This share is comparable to the share of inhabitants living in municipalities with sudden visitor influxes (15.9%). Recreational municipalities with a fluctuating present population account for 11.3% of the region’s total population. The smallest proportion of inhabitants (9.5%) live in municipalities with a high proportion of out-commuters.

4.2. Case Studies of Municipality Types

Based on the developed typology, representative municipalities were selected for detailed examination. This selection ensures that the study results are generalizable to the entire Vysočina Region or even Czechia.

4.2.1. Type 1—Municipalities with a High Proportion of Commuters

In this example, the following types of real population were monitored: commuting for work and to schools (B), intensive commuting for services (C), and occasional commuting for services (D). Although significant shifts have occurred in recent years in the labor market towards flexible working hours and workplaces, new aspects are emerging in the overall assessment of the spatiotemporal distribution of employment [21]. Municipalities located near industrial zones, often situated along major transportation arteries, experience significant work-related commuting, which influences the distribution of the present population. Mobile phone data analysis provides valuable insights into these commuting patterns. Střítež u Jihlavy, located near the D1 motorway and an industrial/logistics park adjacent to Jihlava, serves as a typical example. Figure 5 illustrates substantial daily commuting for work to this zone.
Mobile data analysis has revealed an extreme daily increase in the present population due to commuting for work to the adjacent industrial zone. This specific mobility pattern generates a significant strain on transport infrastructure and the environment. To mitigate these negative impacts, identified through research, and to more effectively manage daily population flows, the following solutions are proposed in the context of spatial planning:
  • Integration of public transport with other modes of transport, aiming to reduce dependence on individual car transport among daily commuters.
  • Development of cycling and pedestrian infrastructure connecting the industrial zone with surrounding residential areas, serving as an alternative for a portion of daily commuters.
  • Optimization of workplace arrangements to minimize traffic congestion during morning and afternoon peak hours, when the data indicate the greatest population movement.
  • Provision of public amenities for employees (e.g., kindergartens, sports facilities) directly within the zone or in its vicinity to reduce the number of additional trips during the day or after work.
  • Other solutions—such as establishing a green belt, landscape protection, and mitigating the impacts of production—are relevant consequences of the zone’s existence, the scale of which, in terms of mobility, the data helped to quantify.

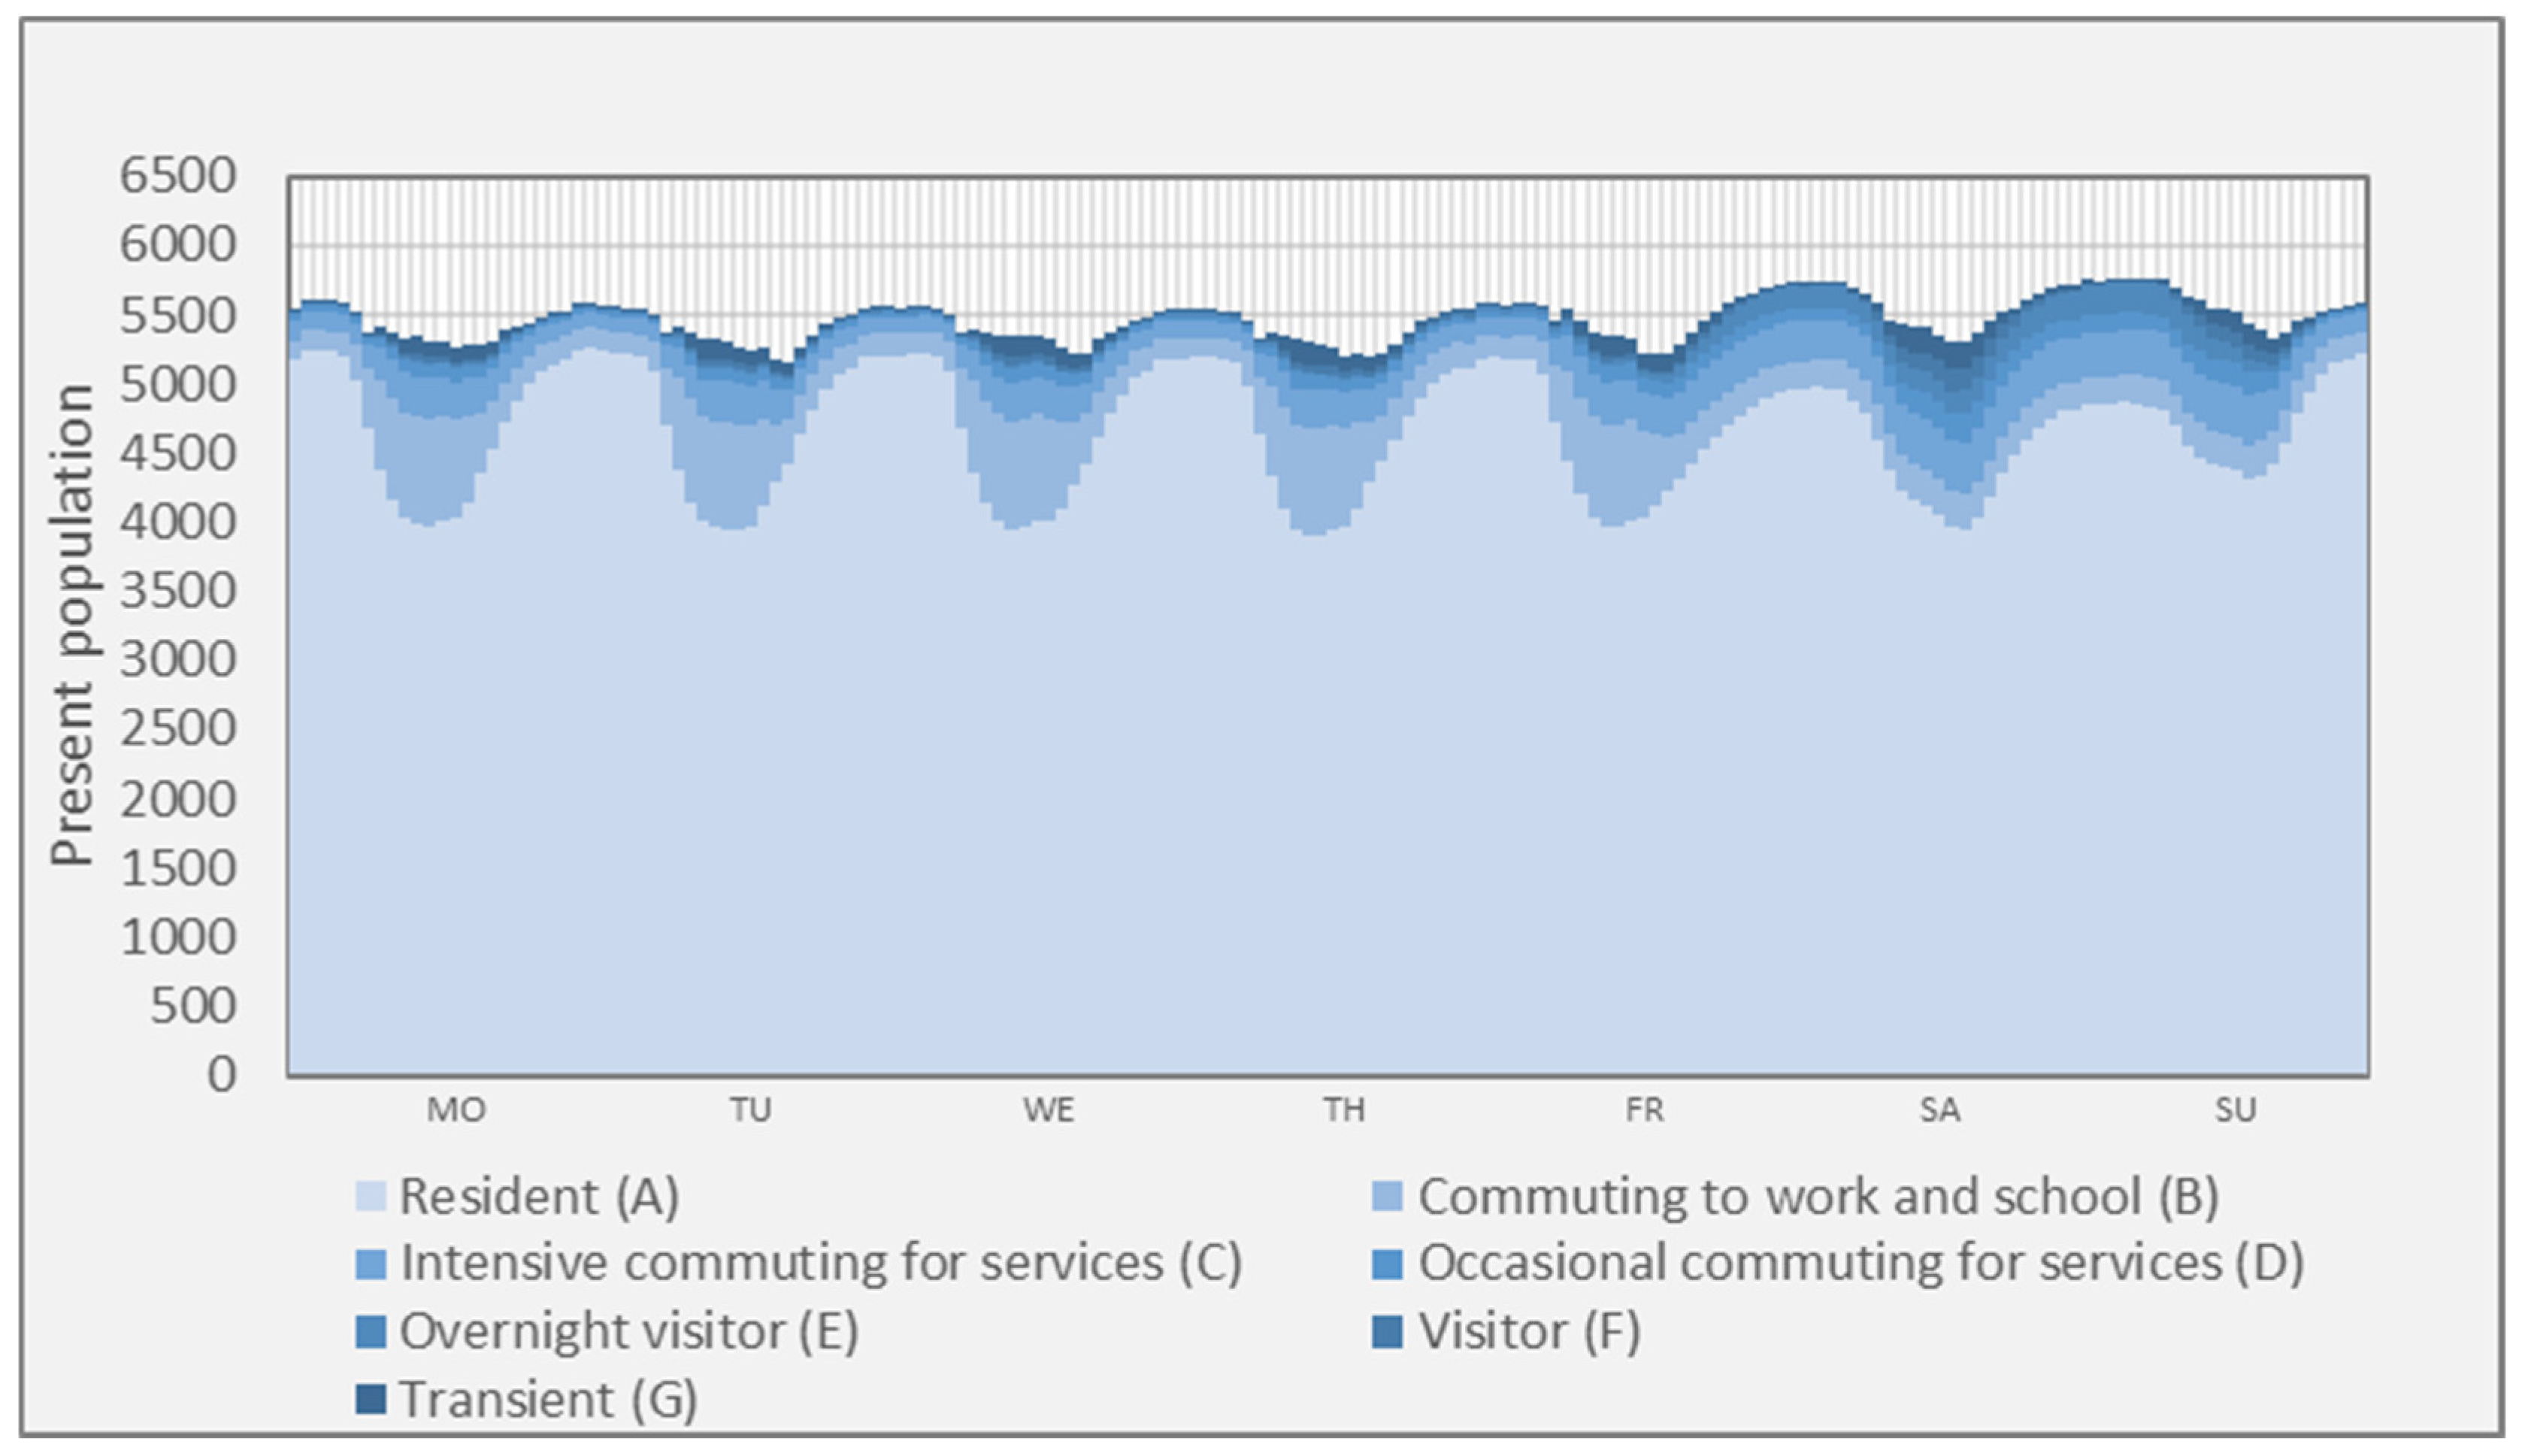
4.2.2. Type 2—Municipalities with a High Proportion of Out-Commuters

Hamry nad Sázavou exemplifies Type 2 municipalities with a high proportion of out-commuters. Mobile data (Figure 6) reveal a significant workday decrease in the present population, primarily residents (A), due to out-commuting. This confirms the municipality’s predominantly residential function, which is characteristic of peri-urban zones. Conversely, population numbers increase during evenings and weekends. This pattern of substantial day–night population shifts is typical for residential commuter towns around Czech cities. It reflects ongoing suburbanization, a dynamic process driven by life cycle stages and demographics [2], transforming rural areas with urban characteristics.
The number of persons present exhibits a significant reduction during the working day due to out-commuting for employment and education. Conversely, during nocturnal periods and weekends, when occupational functions diminish, the resident population increases. This pattern is also characteristic of other emerging peri-urban areas in the Czech Republic [46].
Research using mobile data has confirmed the character of the municipality as residential, marked by a dramatic decrease in population during the workday due to out-commuting. Spatial planning should respond to the needs of the population, who primarily use the municipality for residence and spend evenings and weekends here, while also addressing the sustainability of daily out-commuting.
The proposed solutions, therefore, focus on the following:
  • Creation of high-quality public spaces (parks, squares) to support community life and residents’ leisure activities during the times they are present (evenings, weekends).
  • Provision of public amenities (kindergartens, sports facilities, basic services) to enhance the quality of life for residents and potentially reduce the need for some trips outside the municipality.
  • Development and provision of accessible public technical infrastructure and services, scaled to meet the needs of the resident population (present mainly outside working hours).
  • Identification of suitable areas for the development of cycling infrastructure to support local mobility and potentially alternative commuting options.
  • Supporting the development of sustainable and accessible public transport for easier and more environmentally friendly daily out-commuting, a pattern clearly indicated by the data.

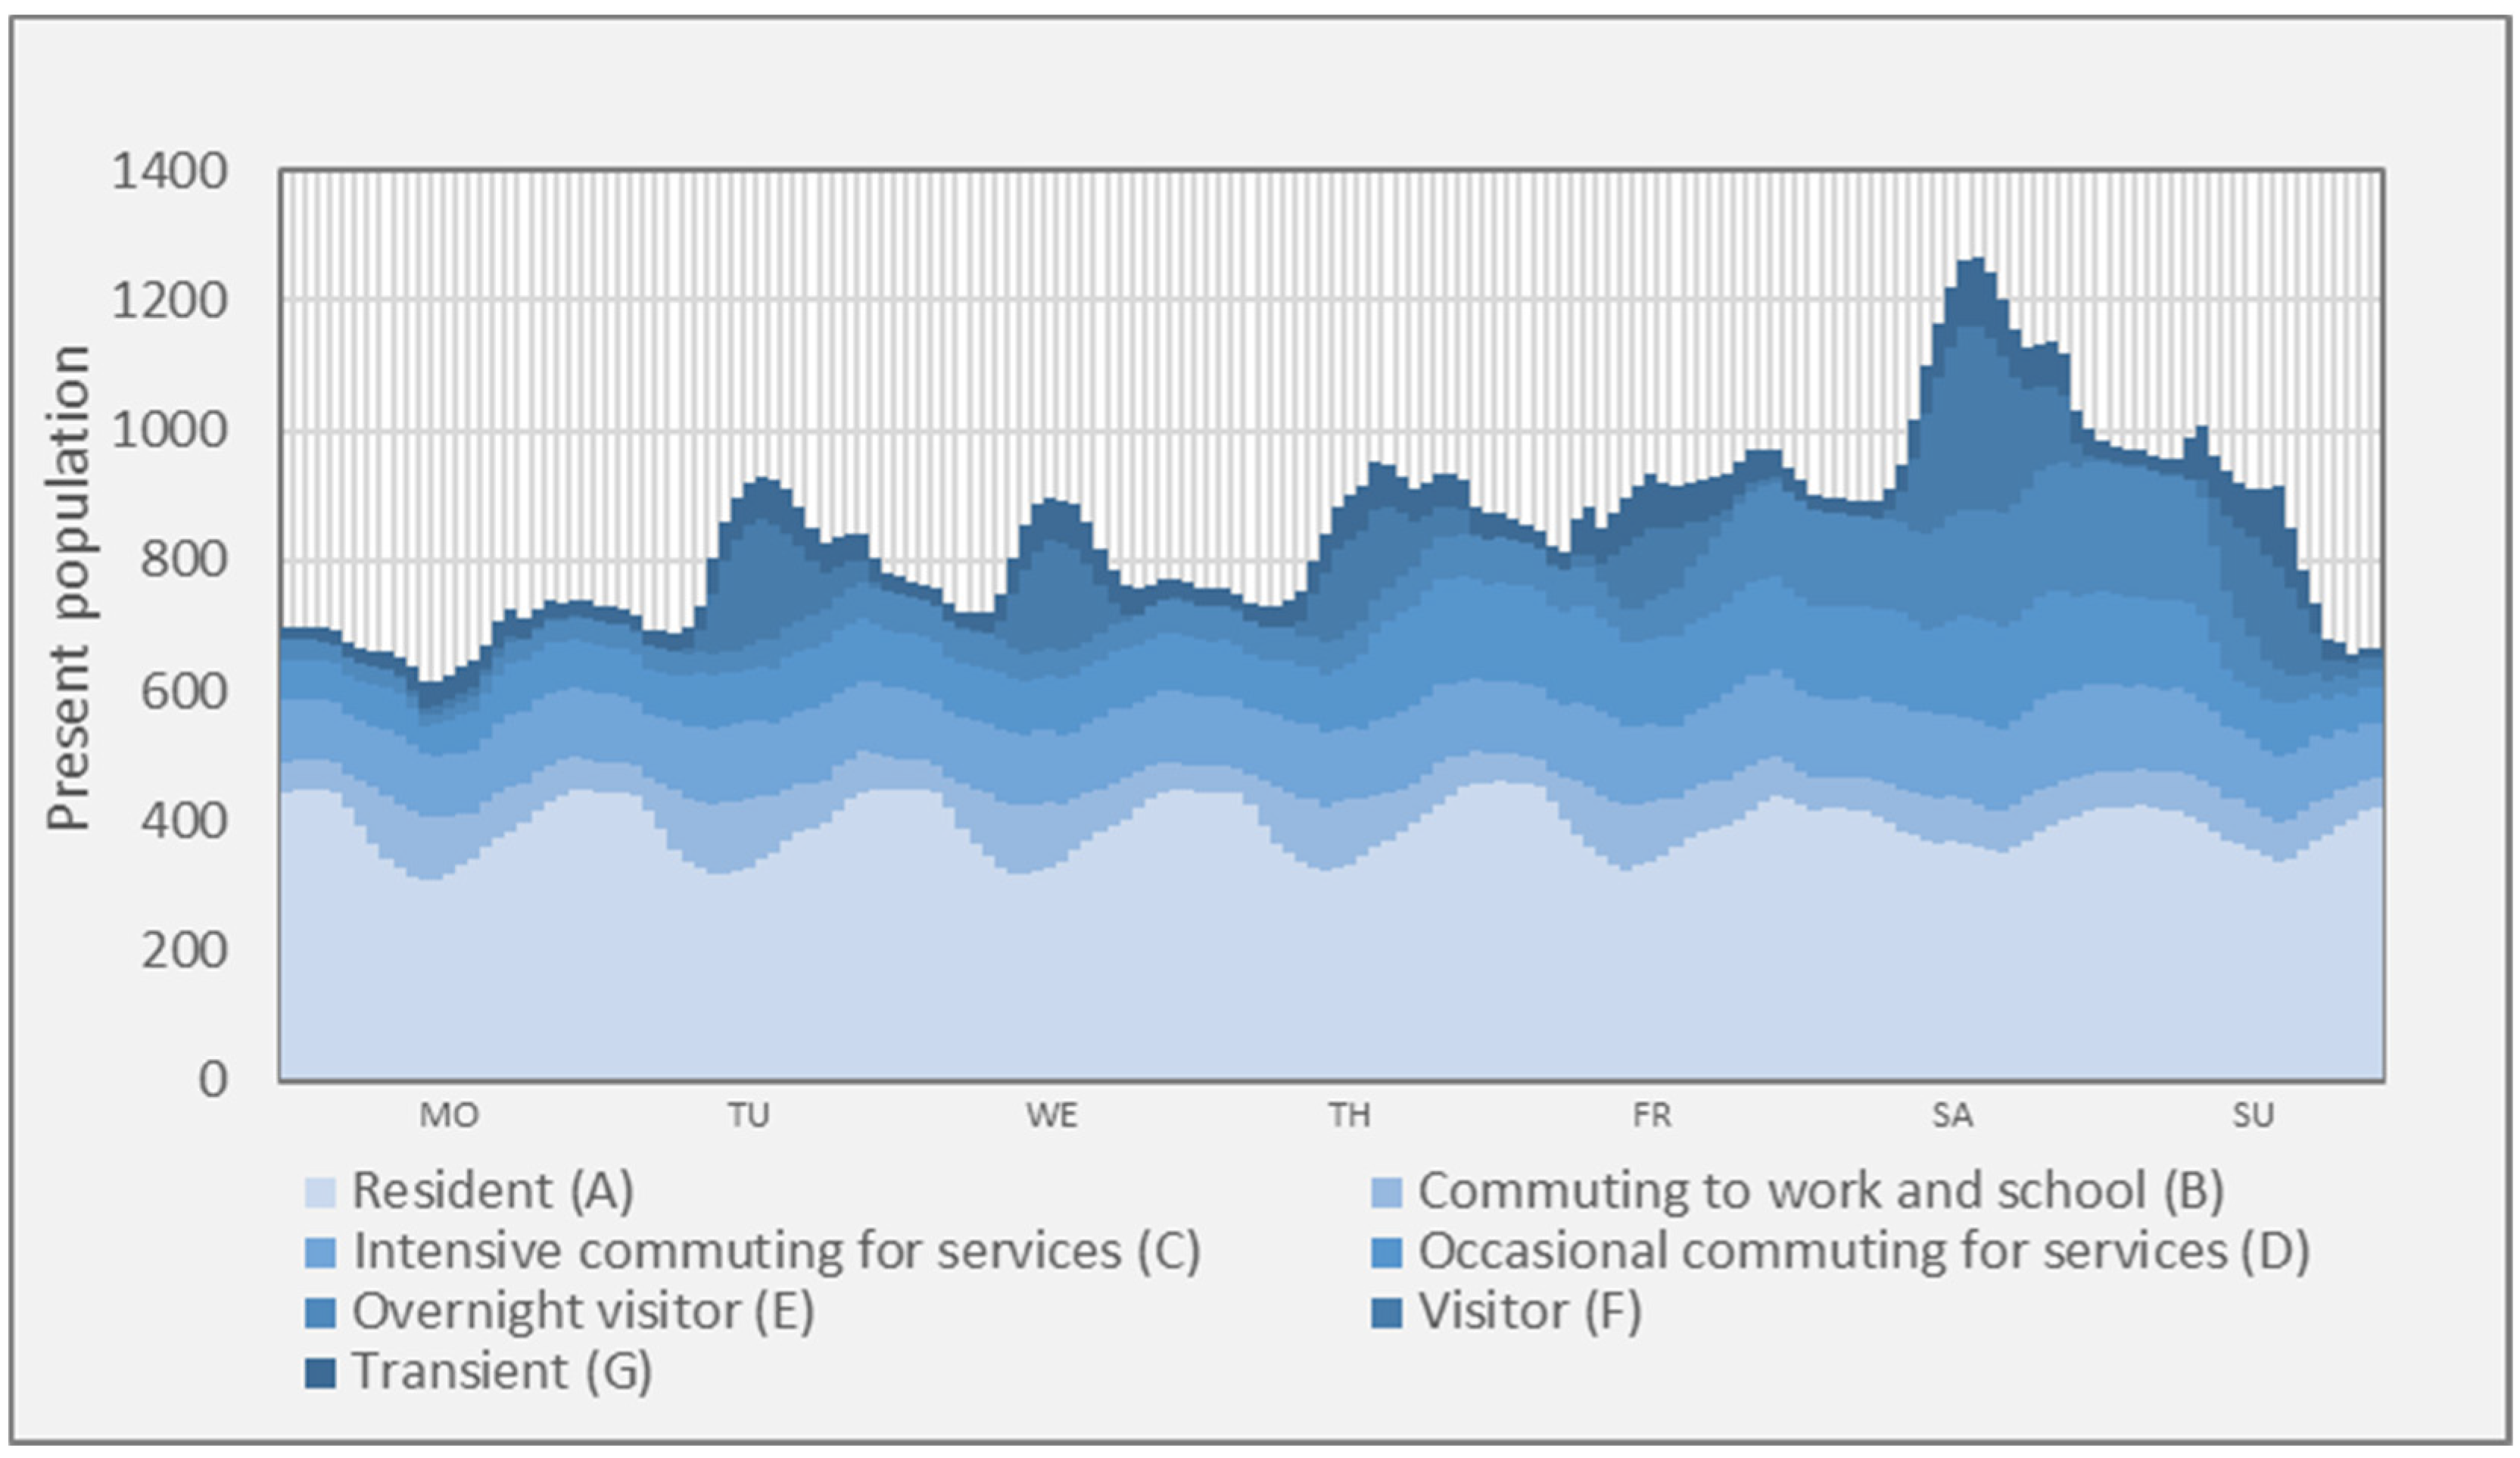
4.2.3. Type 3—Municipalities with Sudden Visitor Influxes

Zvole exemplifies Type 3 (sudden visitor influxes). The data revealed significant population peaks, particularly on weekends (Figure 7), associated with visitors (Types D, E, F) to the Šiklův mlýn amusement park.
The graph shows a significant increase in visitor numbers, especially on Saturdays. While the municipality benefits from tourism and its associated economic benefits, this popularity also brings negative impacts and places demands on infrastructure.
The rapid growth of the amusement park and the associated increase in tourism has have revealed shortcomings in the local spatial plan. Due to insufficient public transport accessibility to the municipality, the majority of visitors travel by private car. This leads to the overloading of roads, which are not designed for such traffic volumes, and to a deterioration of the environment in the municipality and its surroundings. Insufficient infrastructure capacity, particularly roads, is becoming a limiting factor, increasing the risk of traffic accidents. Noise, pollution, and the loss of tranquility are impacting the lives of residents.
Mobile data analysis has quantified the problem of visitor surges, particularly during weekends. These peaks, as the data show, cause overloading of the municipality’s transport and technical infrastructure, which is not dimensioned for such fluctuations. Spatial planning must respond to this specific, time-concentrated load. The following solutions are, therefore, proposed:
  • Optimization of parking provision while simultaneously promoting sustainable forms of transport to manage the surge arrival of visitors identified by the data, especially on weekends.
  • Supporting the development of sustainable and accessible public transport as an alternative to individual car transport, which is observed to be dominant during these visitor peaks.
  • Development and provision of accessible public technical infrastructure and services (water supply, sewage system, wastewater treatment plant with sufficient capacity to handle the short-term but intensive loads caused by the influx of visitors.
  • Development of a waste management strategy capable of handling increased waste generation during visitor peaks.

4.2.4. Type 4—Recreational Municipalities with a Fluctuating Present Population

A typical example is the municipality of Křižánky (Figure 8), located in the Žďárské vrchy Protected Landscape Area.
In this example, the following type of actual population is identified as relevant: overnight visitors (E). The issue of second homes has been studied in detail in numerous publications [47,48,49,50,51,52]. We understand second homes as a complex of phenomena and processes associated with a property (or part of a property) that serves as a temporary place of residence for owners or users who utilise this property primarily for recreational purposes [49].
The mobile data confirmed a significant weekend population increase (Figure 8), roughly doubling the weekday numbers, primarily due to overnight visitors (Type E, second homes). This seasonal/weekend dynamic, highlighted by the data, places specific demands on infrastructure, the housing market, and nature protection within the Protected Landscape Area. Solutions in spatial planning should reflect these dynamics, confirmed by research, as follows:
  • In municipalities with a high proportion of recreational properties, there are significant seasonal and weekend fluctuations in water consumption and wastewater production, as indicated by the dynamics of the present population revealed by the data. This places increased demands on the capacity and operational efficiency of these facilities.
  • Limits on the total number of beds in recreational properties should be introduced to prevent infrastructure overload during the weekend and seasonal peaks, as indicated by the data.
  • Introduction of strict regulations for the new construction of recreational properties (regarding height, density, and materials) in the context of protecting the landscape character of the Protected Landscape Area and managing the load resulting from the weekend population.
  • Support for affordable housing for permanent/local residents as a counterbalance to the pressure of second homes on property prices and to maintain a permanent community.
  • Investment in infrastructure for active mobility (cycling, pedestrian) and support for public transport to reduce car dependency among weekend visitors and residents.

4.2.5. Type 5—Municipalities with a Stable Present Population

Světlá nad Sázavou is characteristic of Type 5 (stable present population). These municipalities are characterized by a stable population with minimal daily fluctuations. The dominant population group is residents (A), whose numbers remain almost constant throughout the week. The proportion of commuters (B) and visitors (F) is significantly lower compared to municipalities with a higher degree of urbanization (Figure 9).
The stability in these municipalities often stems from their predominantly rural character with limited industrial and tourist attractions, reducing work commuting and visitor numbers. However, the presence of a significant local employer can also be a key factor. In the case of Světlá nad Sázavou, the existence of a large employer—a glassworks—plays a crucial role in maintaining population stability. This major enterprise provides sufficient local employment opportunities, significantly decreasing the need for residents to commute to distant work centers, thus contributing to low population fluctuation. Furthermore, well-developed local infrastructure and service provision meet residents’ needs, reducing the necessity to travel to surrounding municipalities. This pattern of stability, driven by local employment hubs and sufficient amenities, can be observed in other municipalities with similar characteristics.
Spatial planning should focus on maintaining and strengthening the factors contributing to this stability and on ensuring the quality of life for the predominantly resident population. Based on these findings, the following measures are proposed:
  • Integrate future population projections and demographic analyses (including age structure and migration patterns) into spatial planning and strategy development, aiming to maintain current stability and prevent future imbalances.
  • Develop and provide accessible public technical infrastructure, utilities, and services scaled to the needs of the stable resident population, supporting local self-sufficiency and reducing the need for out-commuting (as indicated by data).
  • Identify and propose proactive measures to reduce the negative effects of transportation, addressing local traffic loads (e.g., from industry, transit traffic) even within a stable population context.
  • Support the local economy and diversification of job opportunities for the long-term maintenance of the population stability identified by the research, which is linked to the expansion of buildable areas designated for production within the spatial plan.
  • Protect key landscape elements (woodlands, riparian zones, and high-quality agricultural soils) from development pressures.
The mobile data analysis identified five municipality types based on their present population dynamics without subjective bias. Specific measures were formulated for each type, addressing the identified characteristics and problems, which were quantified through a detailed analysis of spatiotemporal population patterns. This demonstrates that the use of mobile operator data as a source of information on real mobility and population presence provides valuable, evidence-based input. This input allows (urban planners) to go beyond the scope of general knowledge and formulate more targeted and effective spatial planning strategies that better reflect the actual functional reality and specific needs of individual settlements and their inhabitants.

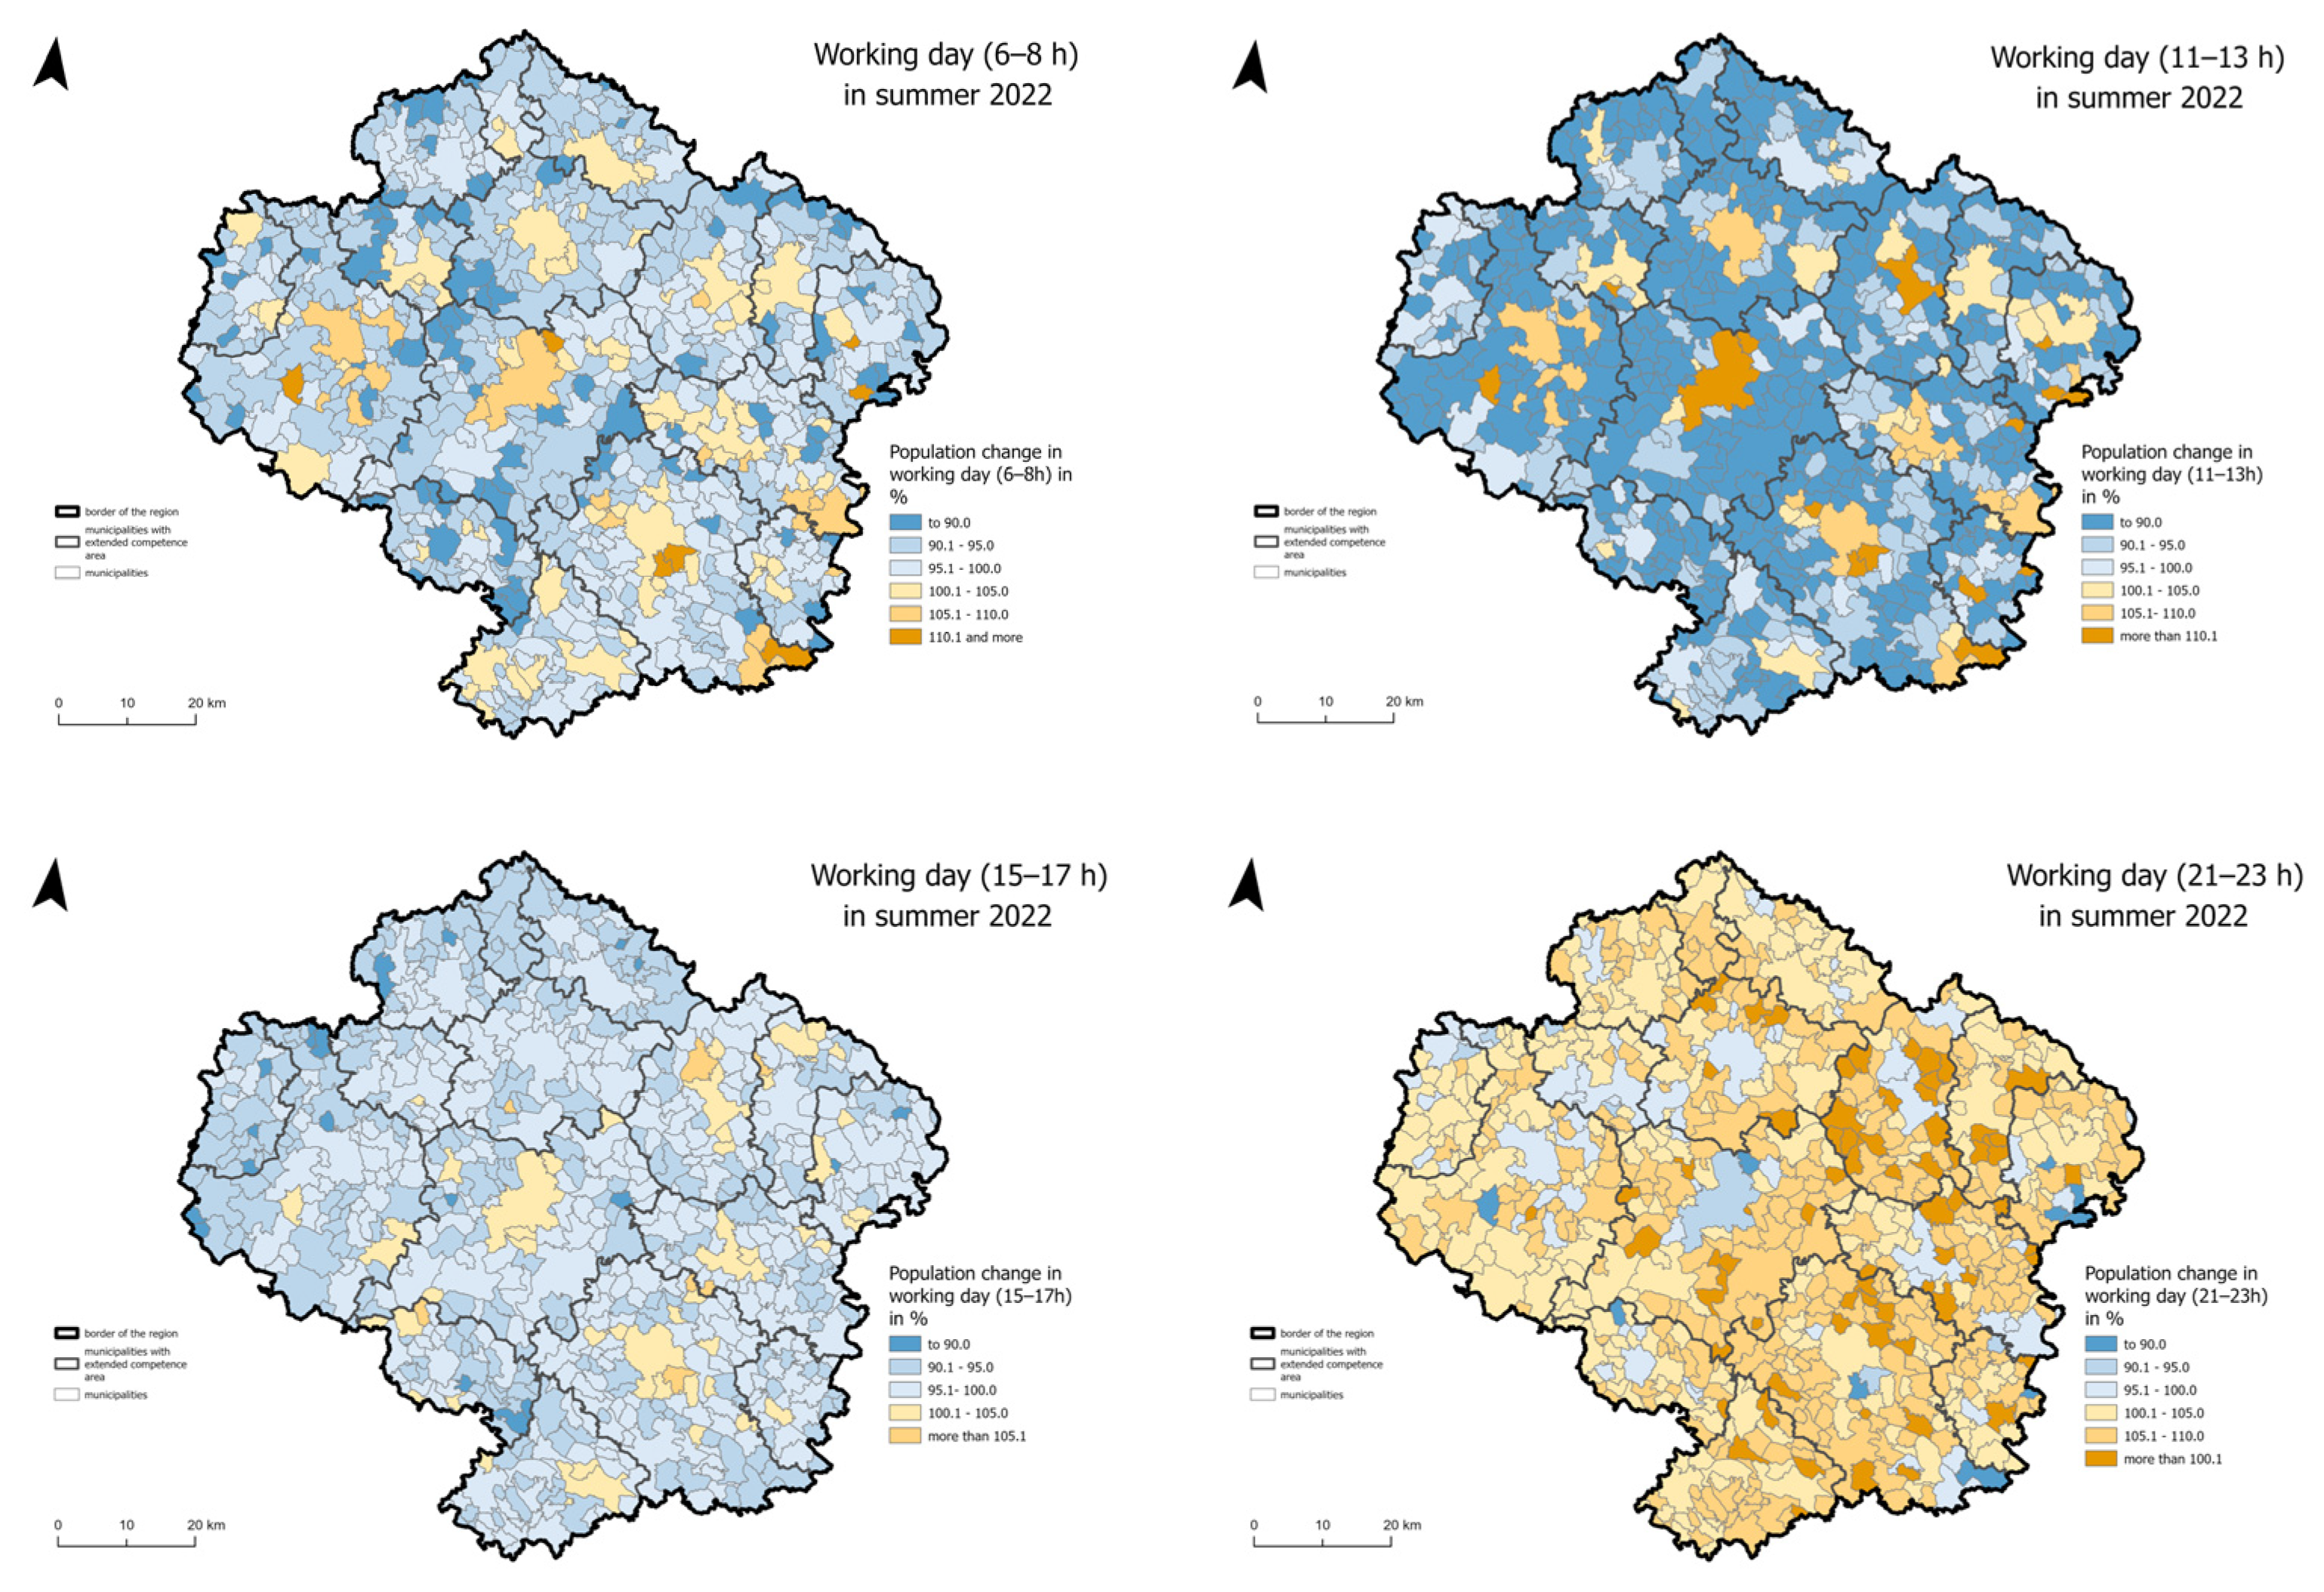
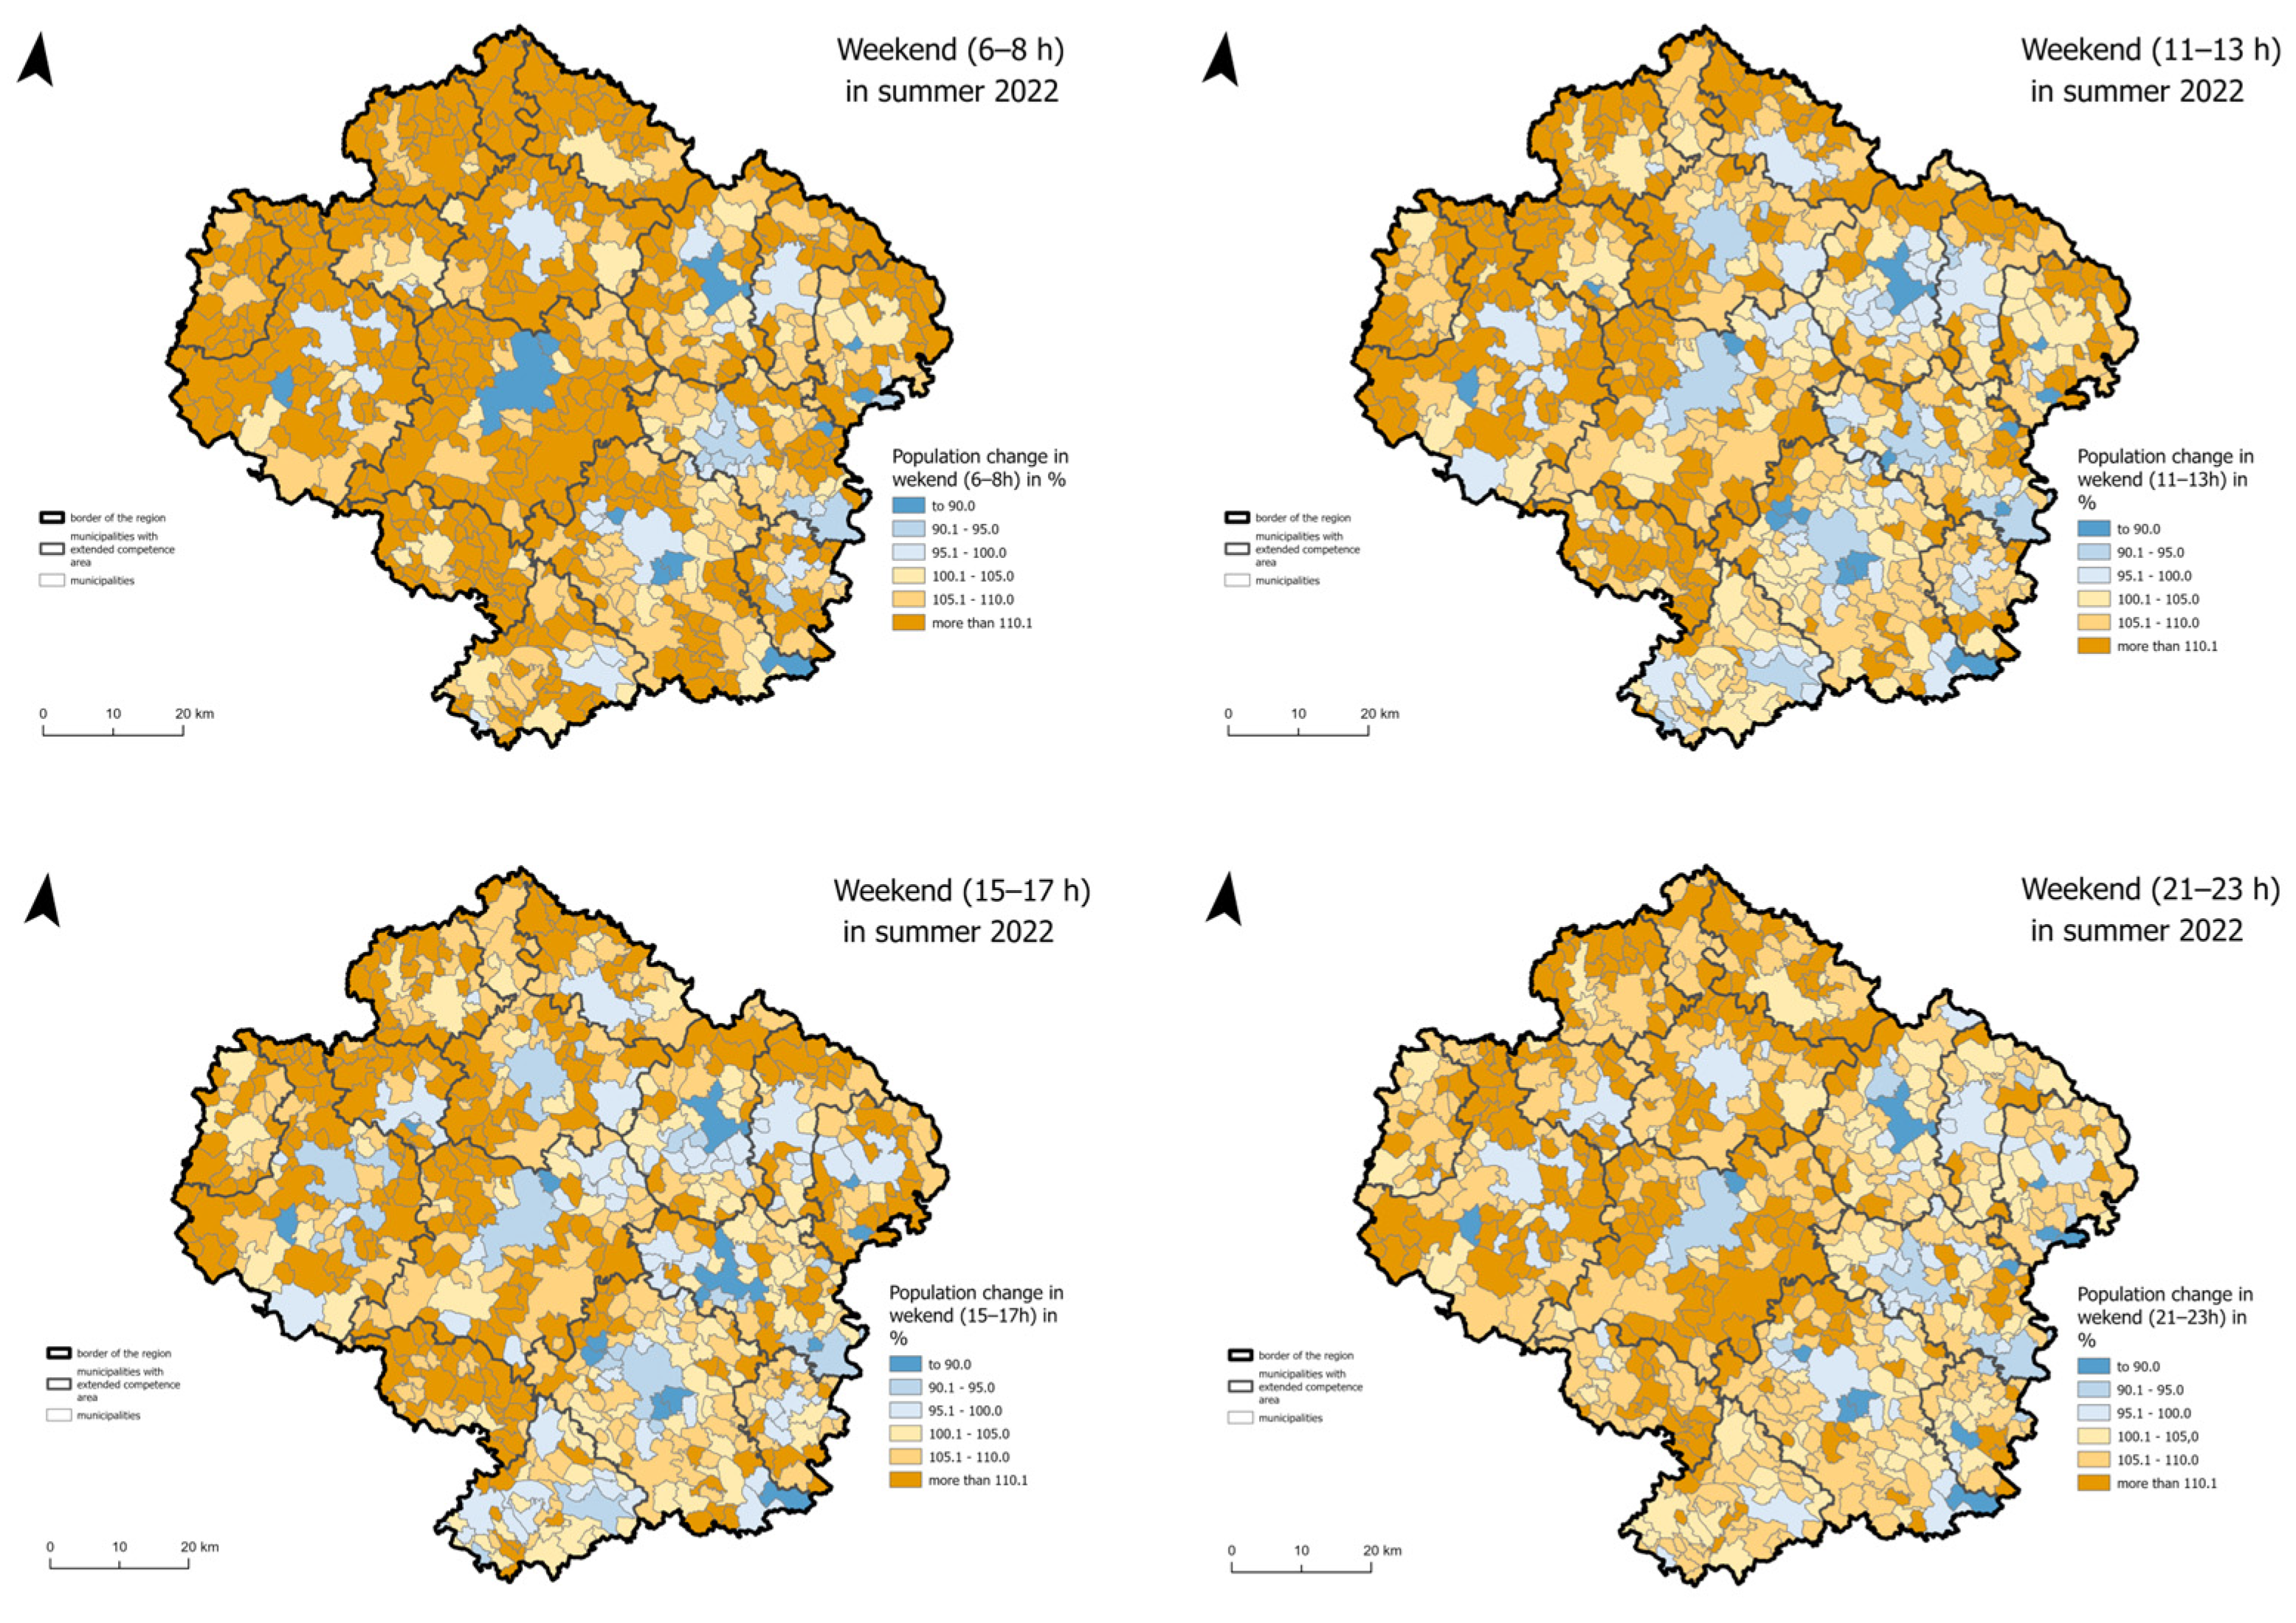
4.3. Comparison of Daytime and Nighttime Population

The aim of this work is also to analyze the temporal structure using geolocation data. This is achieved using mobile phone location data. The data are analyzed on two hierarchical levels:
  • Temporal structure within the week: Comparison of day and night time and monitoring changes in activities in a given area.
  • Temporal structure during the day: Comparison of working days (Figure 10) and weekends (Figure 11) and examining how activities in a given area change depending on the time of day.
Analysis of the available geolocation data reveals that in the vast majority of municipalities within the monitored region, the nighttime population shows a more numerous representation than the daytime population, which indicates the dominant residential character of these territorial units. This phenomenon manifests itself with particular intensity in suburban areas and agglomerations of larger cities, where extensive housing development is located, including both individual and mass housing construction.
Key commuting hubs identified include several key commuting hubs within the Vysočina Region. These encompass not only major urban centers such as Jihlava, Třebíč, Havlíčkův Brod, Žďár nad Sázavou, and Pelhřimov but also medium-sized towns strategically located along the D1 motorway corridor, including Humpolec, Velké Meziříčí, and Velká Bíteš. Furthermore, smaller settlements hosting industrial zones or logistics centers, such as Střítež, Komorovice, and Stránecká Zhoř, also function as significant attractors of commuting flows. The Dukovany nuclear power plant and the surrounding area near Okříšky represent another important employment and commuting node. The data confirm a polycentric commuting structure within the Vysočina Region influenced by the D1 motorway—both intra-regional commuting to multiple centers and inter-regional commuting patterns.

5. Discussion

This study successfully demonstrated how the analysis of daily and weekly rhythms from mobile data allows for the creation of a functional typology of municipalities in the Vysočina Region and the formulation of targeted recommendations for spatial planning. The results confirmed the existence of distinct daily and weekly population rhythms, which significantly differ across various types of municipalities, consistent with theoretical concepts of time geography and urban rhythmicity [12,19,24,53]. The proposed data-driven typology, quantifying differences between daytime/nighttime populations, weekend peaks, and overall fluctuation, successfully distinguished five main functional types, ranging from commuting centers to recreational areas and stable residential towns. This confirmed the first key aspect of this study’s novelty: the ability to identify a functional typology of diverse settlements based on their dynamic characteristics.

5.1. Comparison with the Existing Literature

As highlighted in the introduction and theoretical background, this study builds upon extensive research using geolocation data. In response to the need to place our results in a broader context, we compare our findings in more detail with relevant previous studies from both Czech and international contexts and emphasize the contribution of our work.
Our findings regarding strong commuting flows into regional centers (Jihlava, Třebíč, etc.), towns along the D1 highway (e.g., Velké Meziříčí), and industrial zones (e.g., Střítež) confirm the importance of these locations as employment centers, which is consistent with previous Czech mobility studies using both traditional census data [2] and mobile data [1,4,17,18]. However, our approach provides significant methodological and empirical extensions. Unlike census data [2], which capture only regular commuting for work/school once every ten years, the mobile data used in this study provide—consistent with findings from international studies monitoring detailed urban activities and rhythms in cities like Tallinn, Paris, or Harbin using similar data [5,6]—an almost continuous and more comprehensive picture of the physical presence of all individuals (including irregular trips, visits, tourism, etc.) with high temporal resolution. Precisely, this granularity and high temporal resolution are demonstrated both abroad in the analysis of urban rhythms and commuting [5,6] and in the Czech context [17]. This allows for a much more detailed understanding of the actual “rhythm” of individual places, which is critical for planning services and infrastructure.
While some previous studies using mobile data—including Czech ones, e.g., [1,17] —often focused primarily on mapping specific commuting flows or sectoral mobility, our typology systematically integrates various aspects of temporal dynamics (day/night differences, weekday/weekend variations, seasonal fluctuations) into a comprehensive functional classification of municipalities across a diverse region. The practical relevance of this more detailed view is evident: The identification of municipalities with surge visitor exposure (Type 3) directly demonstrates how this typology can help address specific planning challenges (infrastructure capacity, transport services during peak times, visitor management) that would remain hidden if relying solely on resident counts.
Similarly, in the context of second-home research [49,50,51,52], our data clearly quantify the intensity and precise timing of weekend and seasonal dynamics in these areas (Type 4). Thus, we offer a more current and dynamic view of the actual usage patterns of these areas and their related demands on public infrastructure and services than traditional, less frequent surveys or static databases can provide. This contribution of using geolocation or ‘big data’ to understand the dynamics of second homes and related planning challenges also resonates with findings from international research, for example, from Estonia [47] or Great Britain [48].

5.2. Key Contributions and Insights

The main contribution of this article is the presented methodological approach to an automated, data-driven typology of municipalities based on spatiotemporal population profiles. This provides a rapid and objective means to assess the functional character of a large number of municipalities and their mutual relationships, which is valuable for spatial planning. Unlike traditional typologies often relying on static socio-economic indicators, this dynamic classification better reflects the actual use of the territory and can help identify discrepancies between administrative status and real function (e.g., a small municipality experiencing a massive influx of commuters).
The analysis also visualized the specific polycentric structure of commuting in the Vysočina Region (Figure 10 and Figure 11), which is clearly influenced not only by the presence of several medium-sized centers but also by the backbone corridor of the D1 highway. Crucially, the article systematically demonstrated how insights from this analysis and typology translate into specific and differentiated implications for spatial planning for each identified type of municipality (see Section 4.1 and Section 4.2). Understanding the magnitude, timing, and regularity of population fluctuations allows for the design of more targeted interventions—from optimizing public transport schedules through the correct dimensioning of civic amenities and technical infrastructure (water supply, sewage systems, WWTPs dimensioned for actual peaks), to the management of visitor pressure in environmentally sensitive areas. This data-driven approach thus supports more sustainable and efficient use of resources and territory compared to planning based predominantly on static data about the resident population.

5.3. Potential for Optimization in Spatial Planning

The key output of the presented methodology, enabling its direct use for advanced spatial planning analyses, is the quantification of criteria (indicators according to Equations (2)–(5)), based on which municipalities are classified into functional types. The very existence of these numerically expressed indicators, describing the dynamics of the present population, is absolutely crucial. It allows for the connection of this new knowledge about actual territory use with other standardly used geographic data—typically with data on transport and technical infrastructure, socio-economic characteristics of the population, demographic data, spatial land use data, or environmental limits of the territory—within a unified analytical (GIS) framework. This connection subsequently opens the door for formulating and solving specific optimization tasks, the goal of which is to find the most effective and sustainable solutions for territorial development.
As confirmed by current research in spatial optimization [53,54,55], precisely the integration of various data layers—where our quantified indicators of population dynamics represent a new, valuable input—allows for the effective use of mathematical optimization models to solve complex planning problems. Because we have available both quantified characteristics of functional types of municipalities (e.g., commuting intensity, level of weekend load) and data on the geographical context and population, it is possible to more objectively search for optimal solutions, for example, for:
  • Optimization of public infrastructure location: Finding the best place for public infrastructure facilities (e.g., waste management or healthcare facilities) for efficient servicing of regions with minimal costs and maximum accessibility, using data on needs, networks, and costs.
  • Optimization of public transport: Design of routes and schedules based on detailed spatiotemporal demand data from mobile data, especially for commuting centers and residential municipalities, e.g., [56].
  • Land Use Planning: Spatial optimization of land allocation, e.g., [57,58,59], considers traditional factors as well as dynamic demands of different population types on functions in the territory, aiming to minimize conflicts.
This direction, which utilises modern approaches working with geospatial data and GeoAI tools CiteSpace version 6.1.R6 [60] for formulating and solving optimization problems based on quantified inputs about the real functioning of the territory, represents a significant shift from traditional, often intuitive or static, planning towards proactive optimization.

5.4. Limitations and Future Research

This article relied exclusively on mobile operator data, which, although powerful, have their limitations (e.g., potential demographic bias in phone ownership/usage, spatial accuracy linked to cell tower density, absence of socio-demographic attributes). Future research could focus on validating and enriching these findings by comparing or integrating mobile data with other sources, such as GPS records (providing finer spatial details for smaller samples [14,35]), data from transport systems, surveys, or qualitative research. The analysis of a longer time series would allow for the monitoring of the evolution of mobility patterns and municipal functions, potentially capturing responses to infrastructure changes or external shocks like the COVID-19 pandemic. The integration of mobile data with other spatial datasets (land use, service availability) could enable more comprehensive modeling of urban and regional systems [7,34,37]. Testing the transferability and adaptation of the proposed typology methodology to other regions with different settlement structures and mobility characteristics would also be a valuable next step.

6. Conclusions

This article successfully demonstrated the use of mobile operator geolocation data for a deeper understanding of the spatiotemporal population dynamics in a region with a diverse settlement structure (Vysočina Region). Based on the analysis of daily and weekly rhythms, a functional typology of five distinct types of municipalities was created, reflecting their real function in the regional system better than traditional classifications. An approach for the automated classification of municipalities into these types was developed and verified, representing a practical tool for regional planning. A key result is the demonstration of a direct link between the identified types of municipalities and specific needs and recommendations for spatial planning, as shown through case studies.
The main contribution of the work is, therefore, the verified methodology that systematically links the analysis of present population dynamics with the creation of a functional typology of settlements and the formulation of targeted, evidence-based planning strategies. With this approach, the study contributes to filling an identified gap in existing research, which has often focused on large cities or failed to link pattern analysis with specific spatial planning applications for different types of municipalities.
The results confirm that geolocation data analyzed using the proposed methodology provide valuable input for more effective and sustainable spatial development. They enable spatial planners to better respond to the actual needs and functional characteristics of individual settlements, optimize infrastructure and services, and support the polycentric development of the region. Although the use of these data still faces certain challenges, this study shows their significant potential to become a standard part of planning processes and decision-making regarding territorial development.

Author Contributions

P.J. Conceptualization; methodology; validation; formal analysis; resources; data curation writing—original draft preparation; writing—review and editing; visualization. R.Š.: Conceptualization; methodology; validation; formal analysis; Supervision; project administration; funding acquisition. All authors have read and agreed to the published version of the manuscript.

Funding

The authors gratefully acknowledge financial support provided by grant No. SS02030008 “Centre of Environmental Research: Waste management, circular economy and environmental security”.

Data Availability Statement

The data presented in this study are available on the website www.kamdojizdime.cz.

Conflicts of Interest

The authors declare no conflict of interest.

References

  1. Novák, J.; Novobilský, J. Inovativní přístupy k zachycení přítomného obyvatelstva: Data mobilních operátorů. Urban. A Územní Rozv. 2013, 16, 14–19. [Google Scholar]
  2. Ouředníček, M.; Špačková, P. Populační Vývoj v Zázemí Českých Měst Jako Důsledek Procesu Suburbanizace: Analytické Texty k Souboru Specializovaných Map. Praha; Přírodovědecká fakulta UK v Praze: Prague, Czech Republic, 2013. [Google Scholar]
  3. Pospíšilová, L.; Novák, J. Mobile phone location data: New challenges for demographic research. Demogr. Rev. Pro Výzkum Popul. Vývoje 2016, 58, 320–337. [Google Scholar]
  4. Halás, M.; Blažek, V.; Klapka, P.; Kraft, S. Population movements based on mobile phone location data: The Czech Republic. J. Maps 2021, 17, 116–122. [Google Scholar] [CrossRef]
  5. Ahas, R.; Aasa, A.; Yuan, Y.; Raubal, M.; Smoreda, Z.; Liu, Y.; Ziemlicki, C.; Tiru, M.; Zook, M. Everyday space–time geographies: Using mobile phone-based sensor data to monitor urban activity in Harbin, Paris, and Tallinn. Int. J. Geogr. Inf. Sci. 2015, 29, 2017–2039. [Google Scholar] [CrossRef]
  6. Ahas, R.; Aasa, A.; Silm, S.; Tiru, M. Daily rhythms of suburban commuters’ movements in the Tallinn metropolitan area: Case study with mobile positioning data. Transp. Res. 2010, 18, 45–54. [Google Scholar] [CrossRef]
  7. Anejionu, O.C.D.; Sun, Y.; Thakuriah, P.; McHugh, A.; Mason, P. Spatial Urban Data System: A Cloud-Enabled Big Data Infrastructure for Social and Economic Urban Analytics. Future Gener. Comput. Syst. 2019, 98, 456–473. [Google Scholar] [CrossRef]
  8. Liu, K.; Murayama, Y.; Ichinose, T. A multi-view of the daily urban rhythms of human mobility in the Tokyo metropolitan area. J. Transp. Geogr. 2021, 9, 102985. [Google Scholar] [CrossRef]
  9. Yuan, L.; Sho, K.; Eom, S.; Nishi, H.; Hasegawa, D.; Zhao, H.; Aoki, T.; Zhu, J.; Matsuo, K.; Masumura, A. Changes in visitor behaviour across COVID-19 pandemic: Unveiling urban visitation dynamics and non-linear relationships with the built environment using mobile big data. Habitat Int. 2024, 154, 103216. [Google Scholar] [CrossRef]
  10. Bibri, S.E.; Krogstie, J. Data-Driven Smart Sustainable Cities of the Future: A Novel Model of Urbanism and Its Core Dimensions, Strategies, and Solutions. J. Futur. Stud. 2020, 25, 77–94. [Google Scholar] [CrossRef]
  11. Wu, Y.; Shen, T.; Li, Y.; Kita, M.; Yoshida, Y.; Sho, K.; Yuan, L.; Yu, L.; Jiang, R.; Long, Y. Exploring urban railway station-based attractiveness considering demographic-specific demands: Case study of Odakyu line, Japan. Cities 2025, 158, 105620. [Google Scholar] [CrossRef]
  12. Muliček, O.; Osman, R.; Seidenglanz, D. Urban rhythms: A chronotopic approach to urban timespace. Time Soc. 2015, 24, 304–325. [Google Scholar] [CrossRef]
  13. Osman, R.; Ira, V.; Trojan, J. A tale of two cities: The comparative chrono-urbanism of Brno and Bratislava public transport systems. Morav. Geogr. Rep. 2020, 28, 269–282. [Google Scholar] [CrossRef]
  14. Osman, R.; Mulíček, O. Urban chronopolis: Ensemble of rhythmized dislocated places. Geoforum 2017, 85, 46–57. [Google Scholar] [CrossRef]
  15. Šveda, M.; Sládeková Madajová, M.; Barlík, P.; Križan, F.; Šuška, P. Mobile phone data in studying urban rhythms: Towards an analytical framework. Morav. Geogr. Rep. 2020, 28, 248–258. [Google Scholar] [CrossRef]
  16. Edensor, T. Geographies of rhythm: Nature, place, mobilities and bodies. Ashgate 2012, 129–134. [Google Scholar]
  17. Nemeškal, J.; Ouředníček, M.; Pospíšilová, L.; Frydrych, P. Real Population and Daily Mobility in Prague and the Central Bohemian Region. In Prague and Central Bohemia: Current Population Processes and Socio-Spatial Differentiation; Ouředníček, M., Ed.; Karolinum Press: Praha, Czech Republic, 2022; pp. 91–108. [Google Scholar]
  18. Nemeškal, J.; Ouředníček, M.; Pospíšilová, L. Temporality of urban space: Daily rhythms of a typical week day in the Prague metropolitan area. J. Maps 2020, 16, 30–39. [Google Scholar] [CrossRef]
  19. Hägerstrand, T. What about people in regional science? Reg. Sci. Assoc. 1970, 24, 7–21. [Google Scholar] [CrossRef]
  20. Hagget, P. Geography: A Modern Synthesis; Harper & Row Publishers: New York, NY, USA, 1975. [Google Scholar]
  21. Frantál, B.; Klapka, P.; Siwek, T. Lidské chování v prostoru a čase: Teoreticko-metodologická východiska. Czech Sociol. Rev. 2012, 48, 833–857. [Google Scholar] [CrossRef]
  22. Ellegård, K. Time Geography—From the Past to the Future. In Thinking Time Geography; Ellegård, K., Ed.; Routledge: London, UK, 2019; pp. 151–156. [Google Scholar] [CrossRef]
  23. Crang, M. Rhythms of the City: Temporalised Space and Motion. In Timespace: Geographies of Temporality; May, J., Thrift, N., Eds.; Routledge: London, UK, 2003. [Google Scholar]
  24. Lefebvre, H. Rhythmanalysis: Space, Time and Everyday Life; Editions Syllepse: Paris, France, 2004. [Google Scholar]
  25. Óvari, K.; Kočiš, M. Priestorová diferenciácia rozmiestnenia obyvateľstva v kontexte súčasného pobytu v Slovenskej republike k 1. 1. 2021. Slov. Stat. A Demogr. 2023, 2, 5–29. [Google Scholar]
  26. Bengston, L.; Lu, X.; Thorson, A.; Garfield, R.; Von Schreeb, J. Improved response to disasters and outbreaks by tracking population movements with mobile phone network data: A post-earthquake geospatial study in Haiti. PLoS Med. 2011, 8, e1001083. [Google Scholar] [CrossRef]
  27. Šveda, M.; Sládeková Madajová, M.; Hurbánek, P.; Rosina, K. Spracovanie Pasívnych Lokalizačných Údajov Mobilnej Siete na Použitie v Experimentálnej Populačnej Štatistike; Institute of Geography Slovak Academy of Sciences: Bratislava, Slovakia, 2024. [Google Scholar]
  28. Pospíšilová, L. Denní Rytmus Lokalit Pražského Centra. In Sociální Proměny Pražských Čtvrtí; Ouředníček, M., Temelová, J., Eds.; Academia: Praha, Czech Republic, 2012; pp. 136–158. [Google Scholar]
  29. Mareggi, M. Urban Rhythms in the Contemporary City. In Space–Time Design of the Public City; Springer: Berlin/Heidelberg, Germany, 2013; pp. 3–20. [Google Scholar]
  30. Drevon, G.; Gwiazdinski, L.; Klein, O. Chronotopies-Lecture et Écriture des Mondes en Mouvement; Elya Éditions: Grenoble, France, 2017. [Google Scholar]
  31. Burcin, B.; Čermák, Z.; Drbohlav, D.; Hampl, M.; Kučera, T. Faktické Obyvatelstvo Hlavního Města Prahy. In Výzkumná Zpráva; Univerzita Karlova v Praze, Přírodovědecká fakulta: Praha, Czech Republic, 2008. [Google Scholar]
  32. Tussupova, A.; Beikitova, A.; Mustafin, M.; Satybaldiyev, O.; Lewis, D.J. Analysis of Spatial Aggregation and Activity of the Urban Population of Almaty Based on Cluster Analysis. Sustainability 2024, 17, 3243. [Google Scholar] [CrossRef]
  33. Isaacman, S.; Becker, R.; Caceres, R.; Kobourov, S.; Martonosi, M.; Rowland, J.; Varshevsky, A. Ranges of human mobility in Los Angeles and New York. In Proceedings of the IEEE International Conference on Pervasive Computing and Communications Workshops, Seattle, WA, USA, 21–25 March 2011; pp. 88–93. [Google Scholar]
  34. Novák, J.; Ahas, R.; Aasa, A.; Silm, S. Application of mobile phone location data in mapping of commuting patterns and functional regionalization: A pilot study of Estonia. J. Maps 2013, 9, 10–15. [Google Scholar] [CrossRef]
  35. Esch, T.; Asamer, H.; Bachofer, F.; Zeidler, J.N. Digital World Meets Urban Planet-New Prospects for Evidence-Based Urban Studies Arising from Joint Exploitation of Big Earth Data, Information Technology and Shared Knowledge. Int. J. Digit. Earth 2020, 2, 136–157. [Google Scholar] [CrossRef]
  36. Zwirowicz-Rutkowska, A.; Michalik, A. Spatial Data Infrastructure and Mobile Big Data for Urban Planning Based on the Example of Mikolajki Town in Poland. Appl. Sci. 2024, 14, 9117. [Google Scholar] [CrossRef]
  37. Novák, J. Lokalizační Data Mobilních Telefonů: Možnosti Využití v Geografickém Výzkumu. Disertační Práce; Univerzita Karlova v Praze, Přírodovědecká Fakulta, Katedra Sociální Geografie A Regionálního Rozvoje: Praha, Czech Republic, 2010. [Google Scholar]
  38. Novák, J.; Temelová, J. Každodenní život a prostorová mobilita mladých Pražanů: Pilotní studie využití lokalizačních dat mobilních telefonů. Czech Sociol. Rev. 2012, 48, 911–938. [Google Scholar] [CrossRef]
  39. Halás, M.; Klapka, P. The Timescape of the City: Example of Spatial Interactions Based on Big Data; Habitat International: Atlanta, GA, USA, 2023. [Google Scholar] [CrossRef]
  40. Kraft, S.; Květoň, T.; Blažek, V.; Pojsl, L.; Rypl, J. Travel diaries, GPS loggers and smartphone applications in mapping the daily mobility patterns of students in an urban environment. Morav. Geogr. Rep. 2020, 28, 259–268. [Google Scholar] [CrossRef]
  41. Šveda, M.; Križan, F. Využitie Lokalizačných Údajov Mobilnej Siete v Priestorových Analýzach; Univerzita Komenského v Bratislavě: Bratislava, Slovakia, 2022. [Google Scholar]
  42. Šveda, M.; Hurbánek, P.; Sládeková Madajová, M.; Rosina, K.; Förstl, F.; Záboj, P.; Výbošťok, J. When spatial interpolation matters: Seeking an appropriate data transformation from the mobile network for population estimates. Comput. Environ. Urban Syst. 2024, 110, 102106. [Google Scholar] [CrossRef]
  43. Klapka, P.; Ellegård, K.; Frantál, B. What about time-geography in the post-COVID-19 era? Morav. Geogr. Rep. 2020, 28, 238–247. [Google Scholar] [CrossRef]
  44. Ministerstvo vnitra ČR. Metodický Postup Řešení: Zlepšení Podmínek pro Decentralizaci a Dostupnost Veřejné Správy v Území. Finální Databáze 4; Ministerstvo vnitra ČR: Prague, Czech Republic, 2023.
  45. Jaroš, V. Geolocation Data as a Research Tool for the Organization of the Settlement System and Mobility Mapping—Case Study of the Spatial Mobility Model in Czechia. In AI, Data, and Digitalization, Proceedings of the First International Symposium SAIDD 2023, Sogndal, Norway, 9–10 May 2023; Springer: Berlin/Heidelberg, Germany, 2023. [Google Scholar] [CrossRef]
  46. Frydrych, P.; Ouředníček, M.; Nemeškal, J. Reálná Noční Populace v Katastrálních Územích Prahy a v Obcích Středočeského Kraje. Specializovaná Mapa; Univerzita Karlova, Přírodovědecká fakulta, Katedra sociální geografie a regionálního rozvoje, Urbánní a regionální laboratoř: Praha, Czech Republic, 2020. [Google Scholar]
  47. Raun, J.; Järv, O.; Okkonen, P.; Rantanen, M.; Hyyryläinen, T.; Ryynänen, T.; Toivonen, T. New avenues for second home tourism research using big data: Prospects and challenges. Curr. Issues Tour. 2022, 26, 1–13. [Google Scholar] [CrossRef]
  48. Gallent, N.; Hamiduddin, I. COVID-19, second homes and the challenge for rural amenity areas. Town Plan. Rev. 2020. ahead-of-print. [Google Scholar] [CrossRef]
  49. Fialová, D. Transformace Druhého Bydlení (v Zázemí Prahy). Dizertační Práce; Katedra sociální geografie a regionálního rozvoje Přírodovědecké fakulty Univerzity Karlovy v Praze: Praha, Czech Republic, 2000. [Google Scholar]
  50. Fialová, D. Tradiční a Nové Formy Druhého Bydlení Jako Významná Součást Vnitrostátního Cestovního Ruchu. 5. Mezinárodní kolokvium o Cestovním Ruchu; Masarykova univerzita nakladatelství: Brno, Czech Republic, 2014. [Google Scholar]
  51. Vágner, J.; Fialová, D. Regionální Diferenciace Druhého Bydlení v Česku Regional Differentiation of Second Homes in the Czech Republic; Univerzita Karlova v Praze, Přírodovědecká fakulta, Katedra sociální geografie a regionálního rozvoje: Praha, Czech Republic, 2004; p. 286. [Google Scholar]
  52. Bičík, I.; Fialová, D.; Vágner, J. Druhé Bydlení v Česku. Second Homes in the Czech Republic; Katedra sociální geografie a regionálního rozvoje Přírodovědecké fakulty Univerzity Karlovy v Praze: Praha, Czech Republic, 2001. [Google Scholar]
  53. Mulíček, O.; Osman, R.; Seidenglanz, D. Time–space rhythms of the city—The industrial and postindustrial Brno. Environ. Plan. 2016, 48, 115–131. [Google Scholar] [CrossRef]
  54. Luo, H.; Huang, B. A probabilistic framework with the gradient-based method for multi-objective land use optimization. Int. J. Geogr. Inf. Sci. 2023, 37, 1128–1156. [Google Scholar] [CrossRef]
  55. Guo, Y.; Jiao, L.; Sun, Y.; Zhang, H.; Liu, Z.; Xu, G. A novel urban population-land coupling simulation model: Integrating spatial equilibrium and macro-micro strategies. Int. J. Appl. Earth Obs. Geoinf. 2024, 132, 104002. [Google Scholar] [CrossRef]
  56. Ezquerro, S.; Alonso, B. Optimisation and Land Use-Transport Interaction Models. In Land Use–Transport Interaction Models; CRC Press: Boca Raton, FL, USA, 2017; pp. 87–102. [Google Scholar]
  57. Zhang, H.; Zeng, Y.; Tan, R.; Liu, H. A model for regional land use optimization allocation based on multi-agent system and its application. Acta Geogr. Sin. 2011, 66, 972–984. [Google Scholar] [CrossRef]
  58. Ren, Z.; Lu, X. Using GA for land use planning. In Proceedings of the 4th International Workshop on Advanced Computational Intelligence, New York, NY, USA, 19–21 October 2011; pp. 64–69. [Google Scholar]
  59. Wang, S.-D.; Wang, X.-C.; Zhang, H.-B. Simulation on optimized allocation of land resource based on DE-CA model. Ecol. Model. 2015, 314, 135–144. [Google Scholar] [CrossRef]
  60. Cao, K.; Zhou, C.; Church, R.; Li, X.; Li, W. Revisiting spatial optimization in the era of geospatial big data and GeoAI. Int. J. Appl. Earth Obs. Geoinf. 2024, 129, 103832. [Google Scholar] [CrossRef]
Figure 1. Diagram summarizing the chronological procedure and the interconnection of individual key steps.
Urbansci 09 00158 g001
Figure 2. Location of the Vysočina Region within the Czech Republic and the wider region.
Urbansci 09 00158 g002
Figure 3. Typology of municipalities in the Vysočina Region.
Urbansci 09 00158 g003
Figure 4. Representation of individual types of municipalities in the Vysočina Region Note: 1—Municipalities with a high proportion of commuters, 2—Municipalities with a high proportion of out-commuters, 3—Municipalities with sudden visitor influxes, 4—Recreational municipalities with a fluctuating present population, 5—Municipalities with a stable present population.
Urbansci 09 00158 g004
Figure 5. The high proportion of commuters in the case of Střítež u Jihlavy in the summer of 2022. Note: The letters following the type of present population indicate the order from the x-axis (alphabetically).
Urbansci 09 00158 g005
Figure 6. Residential municipalities with a high proportion of commuters, exemplified by the municipality of Hamry nad Sázavou in the summer months of 2022. Note: The letters following the type of present population indicate the order from the x-axis (alphabetically).
Urbansci 09 00158 g006
Figure 7. Municipalities with sudden visitor influxes in the case of Zvole in the summer of 2022. Note: The letters following the type of present population indicate the order from the x-axis (alphabetically).
Urbansci 09 00158 g007
Figure 8. Weekly population dynamics in the municipality of Křižánky during the summer months of 2022. Note: The letters following the type of present population indicate the order from the x-axis (alphabetically).
Urbansci 09 00158 g008
Figure 9. Communities with a stable present population in the case of Světlá nad Sázavou during the summer of 2022. Note: The letters following the type of present population indicate the order from the x-axis (alphabetically).
Urbansci 09 00158 g009
Figure 10. Daytime and nighttime population dynamics on weekdays in the Vysočina Region during the summer of 2022.
Urbansci 09 00158 g010
Figure 11. Daytime and nighttime population dynamics on weekends in the Vysočina Region during the summer of 2022.
Urbansci 09 00158 g011
Table 1. Categories and types of the present population.
TypologyName of TypologyComment
ResidentResident (A)Individuals for whom the locality constitutes the dominant place of overnight stay for an extended period (e.g., one month or more).
Regularly non-residentCommuting to work and school (B)The most intensive type of commuting.
Intensive commuting for services (C)A type of commuting comparable to regular commuting for services, particularly shopping, as well as cultural, social, and sporting services, or visits to relatives and friends, etc.
Occasional commuting for services (D)This pattern is comparable to non-daily travel for particular services, such as cultural, social, sporting, and other facilities, medical appointments, administrative errands, or visits to family and friends.
Non-recurring non-residentOvernight visitor (E)An individual who is neither a resident of the municipality nor commutes to it regularly nor owns a second home there but nonetheless stays overnight.
Visitor (F)An individual visiting the municipality on a single occasion and staying for at least 3 h who does not fall into any of the three previously mentioned categories of recurring commuters.
Transient and other (G)Number of persons whose primary residence was in the municipality during the given interval and who have no other connection to the municipality.
Source: Ministry of the Interior of the Czech Republic [44], Jaroš [45].
Table 2. Typology of Municipalities in the Vysočina Region according to the Prevailing Present Population.
TypologyName of TypologyComment
j = 1Municipalities with a high proportion of commutersThese municipalities are characterized by a high influx of commuters during the day for work, study, and services. The difference between nighttime and daytime populations is analyzed to define this category.
j = 2Municipalities with a high proportion of out-commutersThese municipalities function primarily as residential areas and experience a substantial daytime population outflow. The difference between nighttime and daytime population levels is analyzed to define this category, with a focus on daytime reduction.
j = 3Municipalities with sudden visitor influxesThese municipalities are characterized by short-term, high-intensity visitor influxes, typically on weekends, holidays, or during the season, due to tourism and events. These influxes are identified by analyzing population time profiles for rapid, short-term increases.
j = 4Recreational municipalities with a fluctuating present populationThese municipalities are typical of recreational areas and are characterized by a variable number of people depending on the season, weather, and other factors affecting recreation.
j = 5Municipalities with a stable present populationThese municipalities exhibit a relatively stable number of people over time without significant daily, weekly, or seasonal fluctuations. To define this category, the variability in the number of people in the municipality is monitored across different time horizons.
Disclaimer/Publisher’s Note: The statements, opinions and data contained in all publications are solely those of the individual author(s) and contributor(s) and not of MDPI and/or the editor(s). MDPI and/or the editor(s) disclaim responsibility for any injury to people or property resulting from any ideas, methods, instructions or products referred to in the content.

