1. Introduction
Nearly five decades ago, Leo Schnore pointed out that “just as there is no satisfactory definition of ‘suburbs,’ so also is there no consensus regarding the meaning of ‘suburbanization’” [
1]. This remains the case today. Some have defined suburbanization as the movement of people from the central city to its less urban outskirts within the same metropolitan area [
2]. Others have defined it as “a process involving the systematic growth of fringe areas at a pace more rapid than that of core cities, [and] a lifestyle involving a daily commute to jobs in the center” [
3]. Still, some point out that suburbanization reflects “a political creation brought about by the division of urban space into mutually exclusive units of local government” [
4]. Nevertheless, “suburbanization” has often been conceptualized as a critical “step” or precursor to another outcome: immigrant spatial assimilation. According to Alba et al. [
5], “the identification of suburbanization as a key step in the process of spatial or residential assimilation is well established for past [European] immigrant groups”.
In this paper, we use United States Census data to examine the suburbanization, segregation, and ethnic concentration of four former refugee groups from Southeast Asia—Cambodians, Hmong, Laotians, and Vietnamese—within the Minneapolis-St. Paul metropolitan area of Minnesota between 1990 and 2010. We limit the category of Southeast Asian to these four groups because their generally lower and more heterogeneous social class backgrounds distinguish them from other post-1965 immigrants from Southeast and East Asia who have tended to be of higher social class statuses [
6,
7,
8]. Specifically, we aim to address three interrelated questions: (1) how and to what extent has the suburbanization of individual Southeast Asian former refugee groups changed in the Minneapolis-St. Paul Metropolitan Statistical Area between 1990 and 2010? (2) how has Southeast Asians’ suburbanization affected their degree of racial segregation in the central city and in the suburbs? (3) how does understanding the differences between these Asian subgroups improve our understanding of urban geographic processes?
Our paper contributes to the literature on immigrant groups’ urban geographic processes in at least three ways. First, we call attention to the problem of lumping various Asian American subcategories into a single racial category, Asian, when studying racial segregation in the United States. Although past studies have suggested that Asians are the least segregated among racial minority groups [
9], we suspect that segregation levels vary across Asian American groups. We show in this paper that despite living in the same state, Southeast Asians’ degree of segregation differs from that of other Asians. Furthermore, we show that even within the category of “Southeast Asians”, there are between-group differences with respect to ethnic concentration, suburbanization and segregation patterns.
Second, rather than side with one side or the other debate on whether minority groups experience spatial assimilation or place stratification (of which more below), we argue that certain immigrant groups can experience substantial suburbanization alongside substantial residential segregation and persistent ethnic concentration. We call attention to the possibility that immigrant groups can experience different or divergent urban geographic processes—that is, different combinations of suburbanization, ethnic concentration, and racial segregation—depending on their unique contexts of reception.
Finally, we chose the Minneapolis-St. Paul MSA as a site to examine urban geographic processes such as immigrant suburbanization, segregation, and ethnic concentration because past research on immigrant residential patterns has mostly examined cities such as New York, Los Angeles, San Francisco, Miami, and Chicago. It is well documented that immigrant settlements are expanding into medium and small cities away from coastal cities, some of which used to be immigrant gateways and some of which are new gateways [
10,
11,
12]. Minneapolis-St. Paul or the Twin Cities collectively is a re-emerging immigrant gateway city in the sense that it received significant waves of European immigrants in the mid- to late-1800s [
13]; however, it was not until the late 1970s that the city began receiving significant numbers of immigrants again, namely, refugees from Southeast Asia [
14]. As we describe below, tens of thousands of Southeast Asian refugees have settled and formed vibrant communities in the Minneapolis-St. Paul MSA since the late 1970s. Yet, we currently do not know whether or to what extent these communities are similar to or different from other Asian American communities, such as Asian American enclaves in New York or Chinese American ethnoburbs in Los Angeles [
15].
We will proceed as follows. First, we review the relevant theoretical and empirical literature on minority residential processes and outcomes in the United States. Second, we provide a succinct background of Southeast Asian former refugees’ contexts of reception in Minnesota. Third, we describe our data sources and measurements. Next, we present the evidence on Southeast Asians’ patterns of suburbanization, levels of segregation, and degrees of ethnic concentration. Then, we discuss the implications of our findings for understanding immigrant groups’ complex urban geographic processes.
1.1. Minority Residential Processes
In the United States, two theoretical models or perspectives on minority groups’ residential processes/outcomes have been predominant. These are the spatial assimilation model and the place stratification model on minority residential processes and outcomes. We discuss each of these in turn before discussing trends in suburbanization in the United States.
In one of the earliest sociological works to deploy the term, Massey and Mullan define spatial assimilation as “the process whereby a group attains residential propinquity with members of a host society” [
16]. They continue, “In the United States, it has generally involved the movement of minority groups out of established racial and ethnic neighborhoods into a larger urban environment inhibited primarily by ‘nonethnic’ native whites” (Massey and Denton 1984, 837). More recent studies define spatial assimilation similarly as the “movement by immigrant minorities away from ethnic enclaves and into communities where the ethnic majority predominates” [
5]. Implicit in the definition of spatial assimilation is the assumption that immigrants and ethnic minorities desire residential propinquity with the majority, which, in the context of the U.S., are Whites. Yet, whether some or most non-White immigrants want to live near Whites is an open empirical question. By assuming that ethnic minority immigrants want to live near Whites, spatial assimilation ignores the real possibility that some immigrants may want to live near co-ethnics in order to maintain an ethnic community.
A related assumption of the spatial assimilation model is that immigrant settlement in the central city is a temporary phenomenon and that “over time…social mobility and acculturation [will] bring about the spatial assimilation of minority groups in urban society” [
17]. It is thought that as an immigrant minority group becomes more acculturated and especially as it achieves socioeconomic mobility, its members will engage in suburbanization in order to “improve their spatial position in urban society” [
17] and increase their or their children’s life chances (Massey and Denton 1988b, 613; Massey and Mullan 1984, 837-8). According to Massey and Denton [
17], “both socioeconomic mobility and acculturation reduce the social distance between minority members and native whites, so the former’s entry into a [suburban] neighborhood does not spark hostility, resistance, and systematic out-migration by the latter”.
The second perspective on minority groups’ residential processes and outcomes is the place stratification perspective [
18]. Rather than assume that a minority group’s socioeconomic status or prior acculturation will lead them toward integration, this perspective posits that the established and privileged residents of an area often “employ exclusionary strategems, such as zoning regulations, to maintain their superior position” [
19]. In addition, the following was noted: “Among the targets of exclusion are minorities such as African-Americans and Latinos, who thus find it difficult or impossible to enter the best residential environments and must pay more than Whites to significantly improve their surroundings” [
19]. Because of exclusionary practices, even as minorities undergo suburbanization, they may remain concentrated in areas with higher proportion of minorities and disadvantaged people rather than achieve residential propinquity with Whites [
19]. However, by assuming that segregation is largely a result of external exclusion, proponents of place stratification ignore or minimalize the possibility that segregation may be partly the result of human choice or preference.
Although the spatial assimilation and place stratification perspectives differ in their explanations for the occurrence of segregation, both perspectives implicitly assume that ethnic segregation or, put differently, ethnic concentration represents an undesirable social condition. As Dunn points out, urban researchers of different schools of thoughts have generally theorized ethnic concentration “as a spatial outcome of oppressions, and as part of the process of the reproduction of oppression” [
20]. Even though urban theorists of the Chicago School recognized “the supportive role which ethnic concentrations had for recent migrants”, they “held that the permanent retention of a distinguishable ethnic identity by ‘newcomer’ groups was negative” as such retention presumably stunts assimilation [
20].
Rather than side with one side or the other debate on whether groups experience spatial assimilation or place stratification, we call attention to the possibility that non-White immigrant suburbanization may be qualitatively different from White European suburbanization and more similar to racial minority suburbanization (and segregation) but equivalent to neither. Unlike the spatial assimilation perspective, we do not make the assumption that immigrants always want to achieve residential propinquity with Whites or that such propinquity represents social equality. Second, rather than assume, as the place stratification perspective does, that segregation represents inequality and is primarily the result of external exclusion, we recognize that ethnic immigrants have some personal and collective agency even when faced with discrimination and that immigrants and their families may prefer to live closer to members of their ethnic group for any number of reasons. Moreover, we recognize that ethnic concentration does not necessarily represent economic stagnation, just as suburbanization does not necessarily represent economic success. For, in some cases, suburbanization could simply be a byproduct of economically successful ethnic concentration rather than the goal of ethnic concentration. In other words, ethnic concentration could represent a viable alternative to traditional spatial assimilation (i.e., dispersal or exit from the inner city into its less urban outskirts).
Next, we draw on the theory of immigrant segmented assimilation [
21] to offer an alternative framework for thinking about non-White immigrants’ divergent settlement patterns.
1.2. Divergent Settlement Patterns: An Alternative Framework
Just as immigrant groups’ unique contexts of exit and contexts of reception could produce divergent socioeconomic outcomes, we suggest that immigrants’ contexts of exit and reception could shape the formation of ethnic immigrant communities and, subsequently, ethnic immigrants’ divergent settlement patterns. In segmented assimilation theory [
21], the contexts of exit refer to the political conditions under which an immigrant group exited their country of origin and the set of social class standing as well as human capital, such as language, job skills and education that immigrants bring along with them. On the other hand, the contexts of reception entail a number of factors in the place of settlement: (a) the policies of the receiving government, whether these are exclusive, passive acceptance, or active encouragement; (b) the manner of reception by the public or established residents, whether prejudiced, indifferent, or supportive; (c) the existence and type of co-ethnic communities and networks, whether poor, entrepreneurial or professional; cohesive or not, etc.; and (d) the conditions of the labor market (the extent of its bifurcation) [
22,
23]. As we are interested in explaining divergent settlement patterns, we highlight some factors in the contexts of exit and the contexts of reception that could affect non-White immigrant groups’ residential processes and outcomes.
Besides the social class standing and human capital that an immigrant group brings with it, it is important to consider an immigrant group’s pre-migration settlement patterns, especially those settlement patterns that group members have come to consider as ideal for their living arrangements. For instance, an immigrant group that preferred to live in small, dispersed communities in its former country might tend to prefer the same living arrangements in a new host society. Conversely, a group that has, as a result of war and forced displacements, been compelled to live in close proximity to its ethnic members for protection may, over time, come to appreciate living in concentrated communities; once group members arrive in a new host society, they might desire recreating these kinds of living arrangements in response to real and perceived threats to safety, cultural and linguistic isolation or other economic and non-economic hardships.
However, regardless of how strong group members’ settlement preferences and tendencies may be, the opportunities for realizing them could be constrained, at least for a time, by structural factors in the contexts of reception. First, the federal government that is in charge of immigration and resettlement policies can create and implement policies that determine where immigrants are able to settle initially. For instance, during the late 1970s and throughout the 1980s, Southeast Asian refugees were subjected to U.S. government-sanctioned policies that deliberately dispersed and resettled them across various U.S. cities and states [
24]. Second, established residents could receive immigrants positively, negatively, or be indifferent to them. Within the U.S., many immigrants and racial minorities, including those with incomes comparable to Whites, cannot simply pick and choose which neighborhoods to move into or where to buy their homes [
25]. More often than not, their choices are constrained by circumstances not of their choosing. Individuals’ and families’ decisions to move or stay put might be influenced by both economic and non-economic factors, such as their perception of how Whites and other racialized minority groups who share their contexts might react to new residents. Third, whether ethnic immigrants are able to form communities in a particular area could also depend on whether there are existing co-ethnic communities in such area. It may be the case that an ethnic community may never emerge, let alone reach the point of ethnic concentration, if there is not a critical number of ethnic members who interact and define themselves as members of the same ethnic community. Finally, the conditions of the labor market could impact both the formation and development of ethnic communities in particular areas. For instance, whether immigrants and their families can become gainfully employed in an area could affect whether new immigrants decide to move into the area. If jobs are plentiful and stable and if a large segment of employed immigrants are able to meet their basic needs of housing, schooling, medical care, etc., immigrants may stay longer in an area, forming visible ethnic immigrant neighborhoods. As immigrants become more established residents and economically mobile, they could establish formal organizations, associations and businesses to serve their and other residents’ needs. A community’s institutional completeness, in turn, could reinforce ethnic concentration. Given Hmong’s, Cambodians’, Laotians’ and Vietnamese’s relatively similar contexts of exit (i.e., the foreign-born among them are refugees of war or children of refugees), and contexts of reception (they all settled in Minnesota), we are interested in whether these groups all experience similar residential patterns or divergent residential patterns.
1.3. Historical Trends in Suburbanization and Residential Segregation
Since the 1980s, researchers have documented the levels of suburbanization and patterns of residential segregation among four major racial categories: non-Hispanic Whites, Blacks, Hispanics, and Asians. Using 1970 and 1980 United States Census data on 59 major Metropolitan Statistical Areas (SMSAs), Massey and Denton found that, in 1970, Blacks (0.201) had substantially lower levels of suburbanization compared to Hispanics (0.461) and Asians (0.431) [
4]. However, between 1970 and 1980, “the average black suburbanization increased significantly, from 0.201 to 0.282 in 1980” [
4]. Despite the increases in Blacks’ suburbanization, “blacks, compared with other minority groups, remain highly concentrated in central cities, and, within these areas, they experience very high levels of residential dissimilarity and spatial isolation from non-Hispanic whites, especially in the Northeast and Midwest” [
4].
Contrary to Blacks’ suburbanization pattern, Massey and Denton (1988b, p. 597) found that the suburbanization of Hispanics stagnated in most SMSAs between 1970 and 1980 [
4]. On the other hand, Asian suburbanization “increased significantly in nearly all metropolitan areas” during the 1970s [
4]. Furthermore, Massey and Denton observed, “even SMSAs with well-established [Asian] enclaves, such as San Francisco, experienced considerable suburbanization” [
4]. These findings led Massey and Denton to conclude that “Asians appear, therefore, to deviate from the traditional American immigrant pattern by bypassing inner-city enclaves as a first step in the process of spatial assimilation” [
4]. The focus on Asians as a whole category, however, may hide significant within-group differences with respect to suburbanization.
Some studies have found that among most post-1965 immigrants to the United States, suburbanization has tended to increase rather than decline over time. Using the 1980 and 1990 United States Census data, Alba et al. found that although the suburbanization levels of various Asian and Latino immigrant groups differed from one another, suburbanization has generally held steady or increased over time across all groups [
5]. For example, between 1980 and 1990, Chinese, Filipinos, Koreans, Asian Indians, Vietnamese, Cubans, and Afro-Caribbeans each experienced increases in the percentage of their populations living in the suburbs. During the same period, Mexicans experienced only a slight increase in the percentage living in suburbs. Alba et al. suggest that ethnic groups’ different suburbanization trajectories may be due to differences in their average household incomes. Specifically, lower household incomes are associated with residence in the central cities, whereas higher household incomes are associated with residence in the suburbs [
5]. Alba and his collaborators note that “the Vietnamese are somewhat less likely than other Asians to reside in suburbs [and that] [t]his may be a result of their modest incomes and frequent refugee status” [
5].
More recently, studies have also begun to explore the spatial assimilation of ethnic groups and racial categories within “inner” and “outer” suburban rings, also known as “mature” and “developing suburbs”, respectively [
26,
27,
28]. Aware of the Fair Housing Act of 1968, which prohibits housing discrimination, and its potential positive impact on racial minorities’ opportunity to live in the suburbs, some scholars have defined inner/mature suburban rings as places within the suburb where the majority of housing was built in 1969 or earlier and outer/developing suburban rings as those places within the suburb where the majority of housing was built in 1970 or later [
26,
27]. Using 2012–2016 American Community Survey data, Argeros [
26] found that all racial and ethnic groups in his study—Whites, Blacks, Asians, and Hispanics—were more likely to reside in the outer suburban rings, which has higher SES levels and lower poverty rates, than in the inner suburban rings of America’s major suburbs. However, interestingly, Asian households are more likely than Black, Hispanic, and White households to reside in the outer suburban rings. Argeros attributes this to Asians’ comparatively higher median household income, education, and homeownership [
26].
Recent studies using United States Census data have found that Blacks, Hispanics and Asians in various United States metropolitan areas continue to experience substantial levels of racial segregation [
29]. For instance, Logan points out that although Black–White segregation has gradually declined between 1980 and 2010, by the late 2000s, Blacks were still, on average, highly segregated as indicated by their dissimilarity index (D) of 59.1. On the other hand, the segregation level of Hispanics as well as that of Asians remained essentially unchanged during this thirty-year period. By 2010, the dissimilarity index for Hispanics was 48.5, while it was 40.9 for Asians, indicating the persistence of moderately high levels of segregation [
30].
Although several studies have examined either segregation or suburbanization among United States immigrants [
5,
31,
32,
33,
34,
35,
36,
37,
38,
39], since Massey and Denton’s article in the late 1980s [
4], few studies have investigated the intersection between immigrant groups’ suburbanization and their residential segregation (Jones [
40] is an exception). This is surprising given that these processes are probably intertwined in complex ways when it comes to immigrant groups and their assimilation outcomes. As Kaplan and Woodhouse remind us, “Groups vary considerably, not only in their cultural makeup but also in the financial, human, and other resources they possess” [
41]. At the same time, the contexts that social groups encounter could vary widely in terms of their “history, culture, economic opportunity, and [relationship with] the political state” [
41]. Within the context of the United States, many racial minorities, including those with incomes comparable to Whites, cannot simply pick and choose which neighborhoods to move into or where to buy their homes [
25]. More often, their choices are constrained by the context or a set of circumstances not of their choosing. For instance, individuals’ and families’ decision to move or stay put might be influenced by both economic and non-economic factors, such as their perception of how Whites and other racialized minority groups who share their contexts might react to new residents. Investigating immigrant groups’ suburbanization without paying attention to their racial segregation gives us, at best, an incomplete understanding of immigrants’ lives in urban American cities. Thus, we suggest that it is crucial to investigate immigrants’ suburbanization alongside their segregation. Doing so might help us to not only understand both of these processes better but also broaden our understanding of the interracial dynamics in a certain place. Understanding the interracial dynamics in a particular context could, in turn, help us to assess immigrant groups’ relative degree of assimilation along more than one axis.
The increased attention in the literature on racial categories and ethnic groups other than Whites and Blacks suggests that scholars are trying to move beyond the Black-and-White racial paradigm when studying spatial assimilation in the United States. However, to date, little research has examined the spatial assimilation of more recent Asian immigrant groups such as Southeast Asian former refugees. Nevertheless, investigating the spatial assimilation of Southeast Asian former refugees is important for at least two reasons.
First, although previous studies of immigrant spatial assimilation have yielded some helpful information about immigrants, these studies have tended to lump various Asian and Hispanic groups into single categories. However, as Alba and Logan point out, “statistically convenient categories—such as ‘Asian’ and ‘Hispanic’—[are not only] unlikely to capture adequately racial and ethnic diversity”, but could also be potentially misleading [
31]. The assumption of Asian homogeneity, whether intended or not, is highly problematic for a number of reasons. First, unlike economic migrants from Asia, such as many Chinese, Koreans, and Japanese, most Southeast Asians migrated as political refugees from the war-torn countries of Cambodia, Laos, and Vietnam. Second, Cambodians, Hmong, Laotians, and Vietnamese immigrated in irregular ‘waves’ starting in 1975. As political refugees, the majority of Southeast Asians, especially those of later immigration waves, came with very limited financial and human capital [
42]. Furthermore, during the late 1970s and throughout the 1980s, Southeast Asian refugee groups were subjected to United States government-sanctioned policies that deliberately dispersed and resettled them across various United States cities and states [
24]. Unlike other Asian immigrants with substantial socioeconomic status (SES), most Southeast Asians could not readily choose which neighborhoods to settle into. Given the policies of dispersal and Southeast Asian refugees’ relatively low SES upon arrival, it is reasonable to assume that Southeast Asian refugees have been more limited in their ability to choose where they want to live compared to other higher-SES Asian and Latino immigrant groups. Yet, little research has systematically examined how Southeast Asian former refugees’ residential patterns have changed or remained the same since the 1980s.
Second, studying the suburbanization of Southeast Asian groups affords us the opportunity to study another important aspect of spatial assimilation: residential segregation or integration. At the time of this writing, most Southeast Asian refugees have been in the United States for 25 to 40 years. Significant economic and social changes have occurred in their communities over the last three decades [
43,
44]. Yet, at present, we know relatively little about how Southeast Asians’ changing socioeconomic status affects their ability to move into predominantly white neighborhoods. Moreover, we still know little about Southeast Asians’ degrees of segregation from Whites as well as from various other non-White racial categories, including Blacks, Hispanics, and other Asians. The availability of United States Census data enables us to study how Southeast Asian former refugees have adjusted to the changing and diverse demographics in major United States cities.
1.4. Background of Southeast Asians’ Resettlement in Minnesota
Prior to 1975, no Southeast Asian community existed in Minnesota. However, by October of 1975, Minnesota had become the state to receive the largest number of refugees in the Midwestern U.S. [
45]. Like a dozen or so other U.S. states, Minnesota was part of one of the largest refugee resettlement efforts in U.S. history. In 1975, the U.S. admitted 120,000 of the more than two million Southeast Asian (formerly Indochinese) refugees from the war-torn, U.S.-backed countries of South Vietnam, Cambodia and Laos [
7]. In December 1975, the Lutheran parishes in Rochester, Minnesota received 1791 Vietnamese refugees [
46]. In that same month, one of the first Hmong refugee families settled in Minneapolis [
47]. By the end of 1975, 3802 Southeast Asian refugees had been resettled in Minnesota—2.3 percent of the 129,792 Southeast Asian refugees in the U.S. at that time [
48]. By 1981, about a third of the 20,000 Hmong in the U.S. lived in St. Paul [
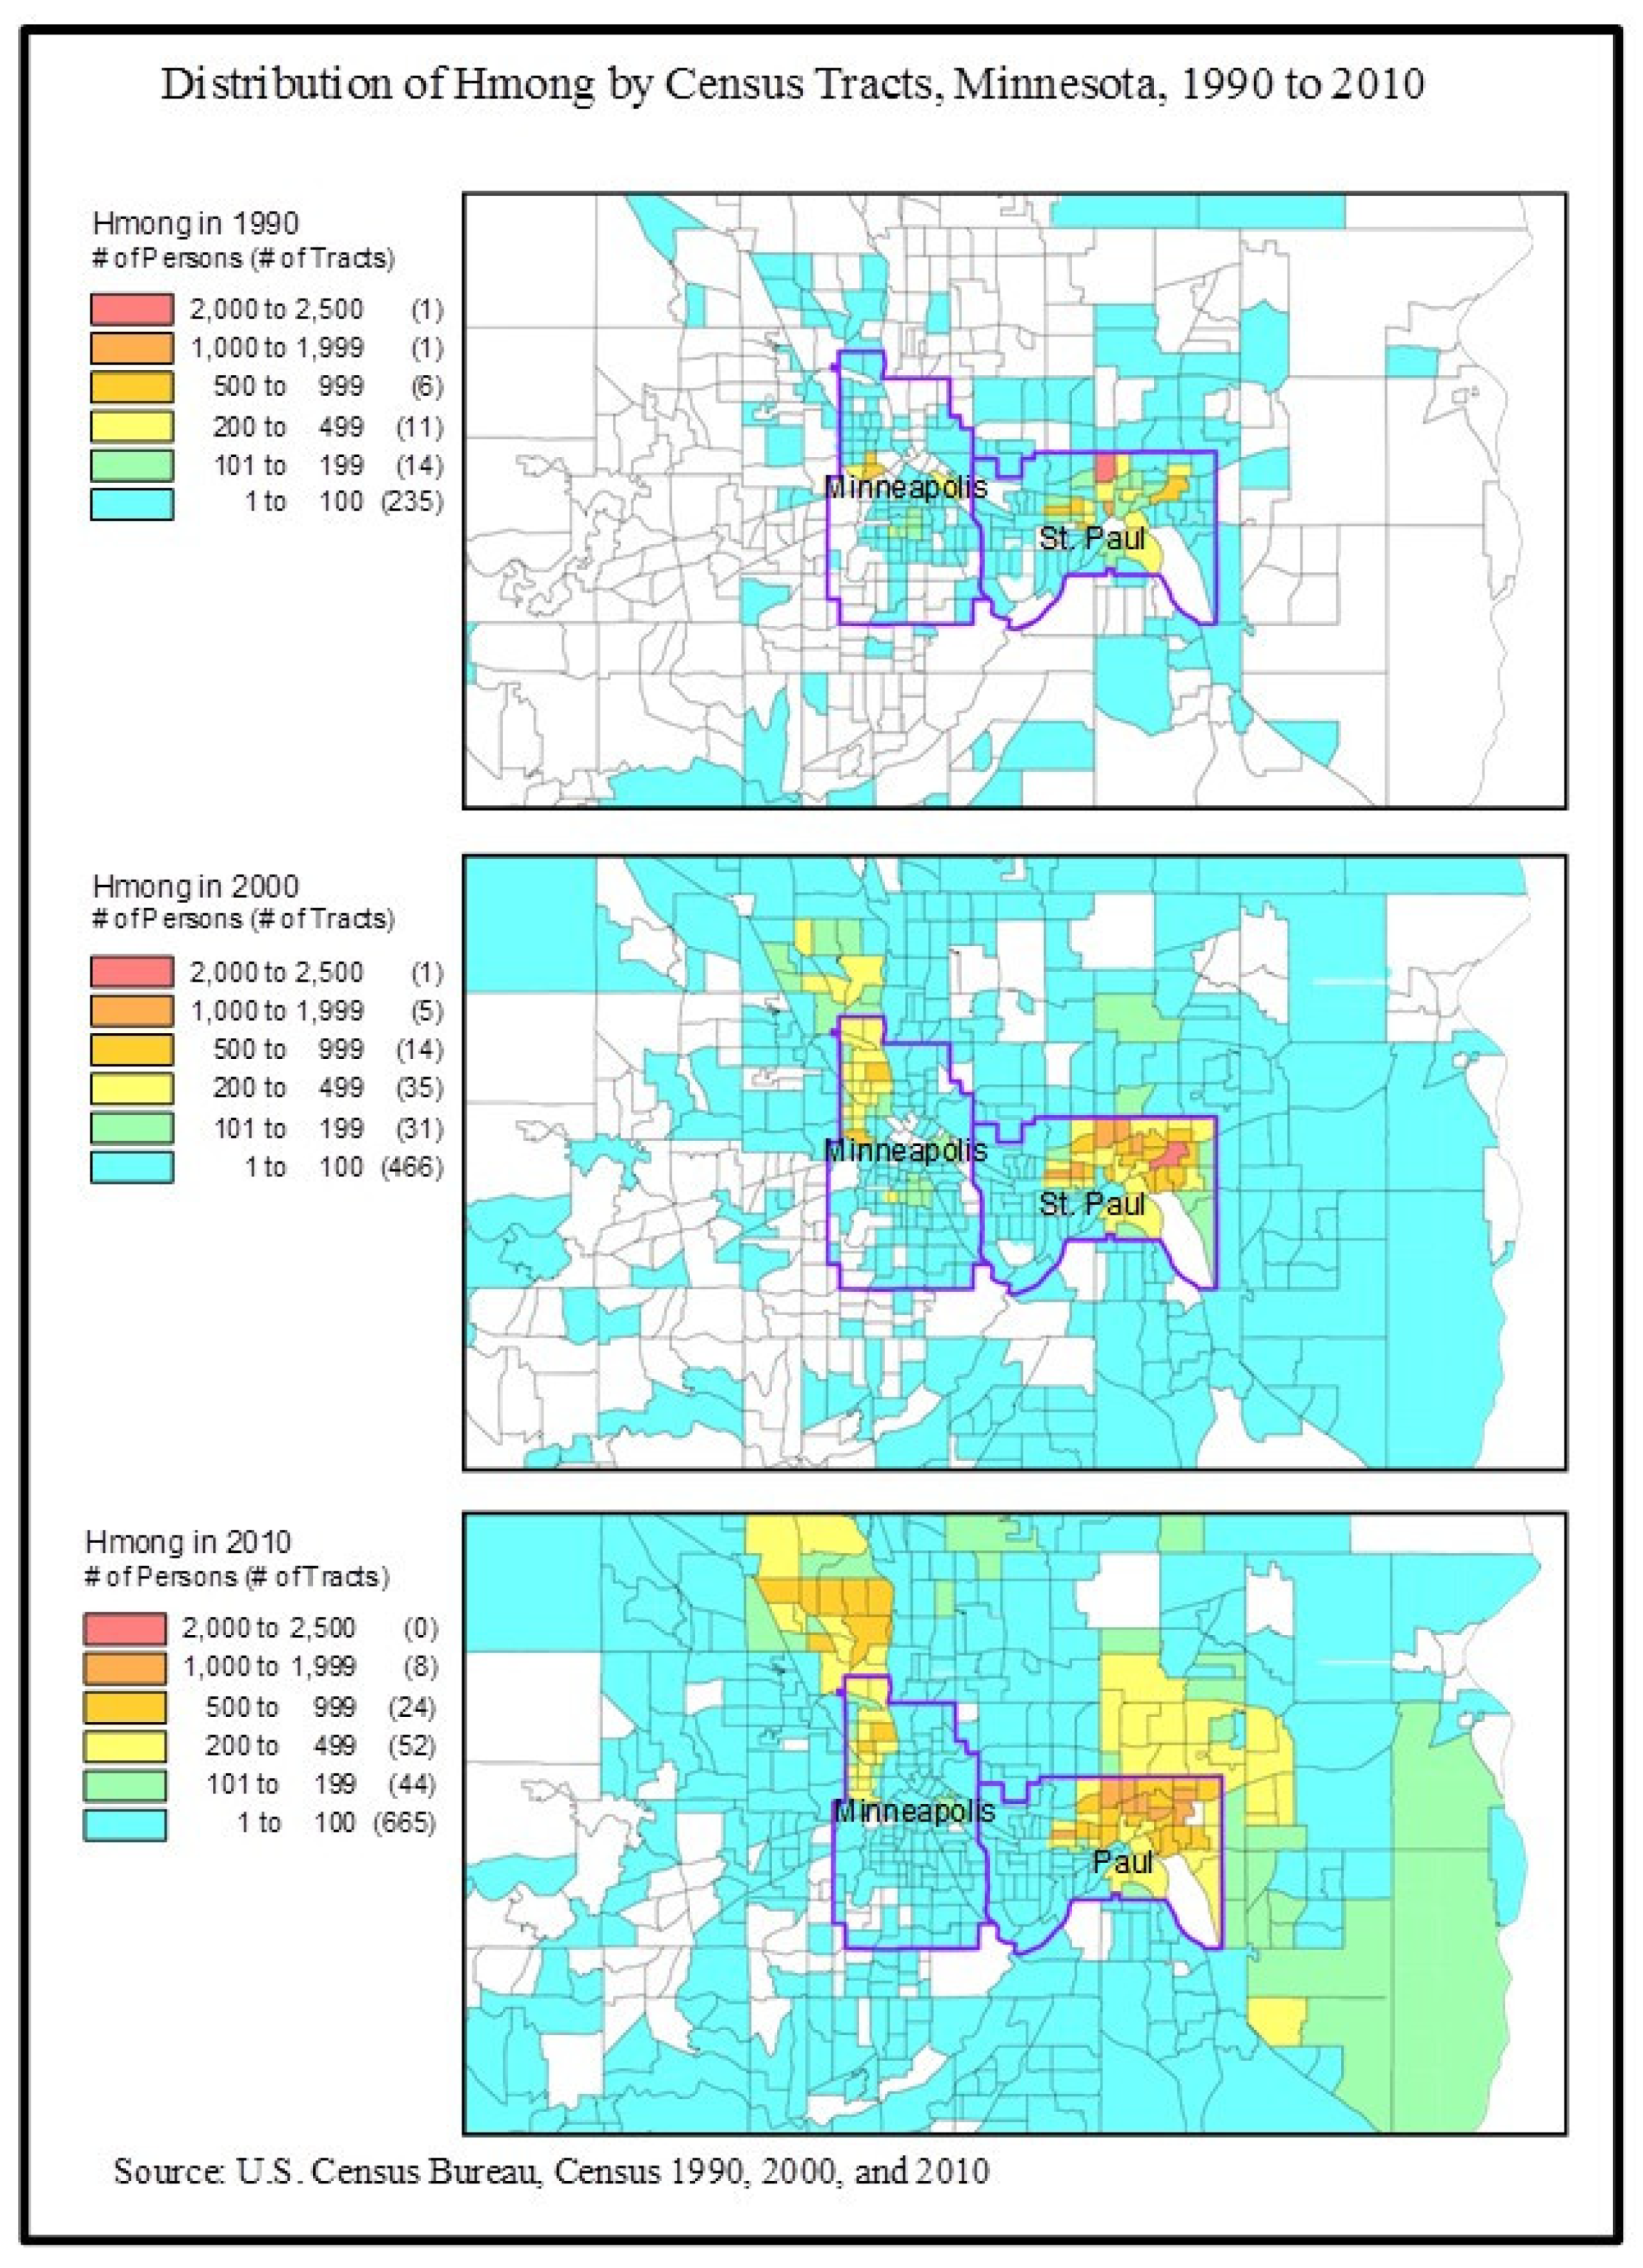
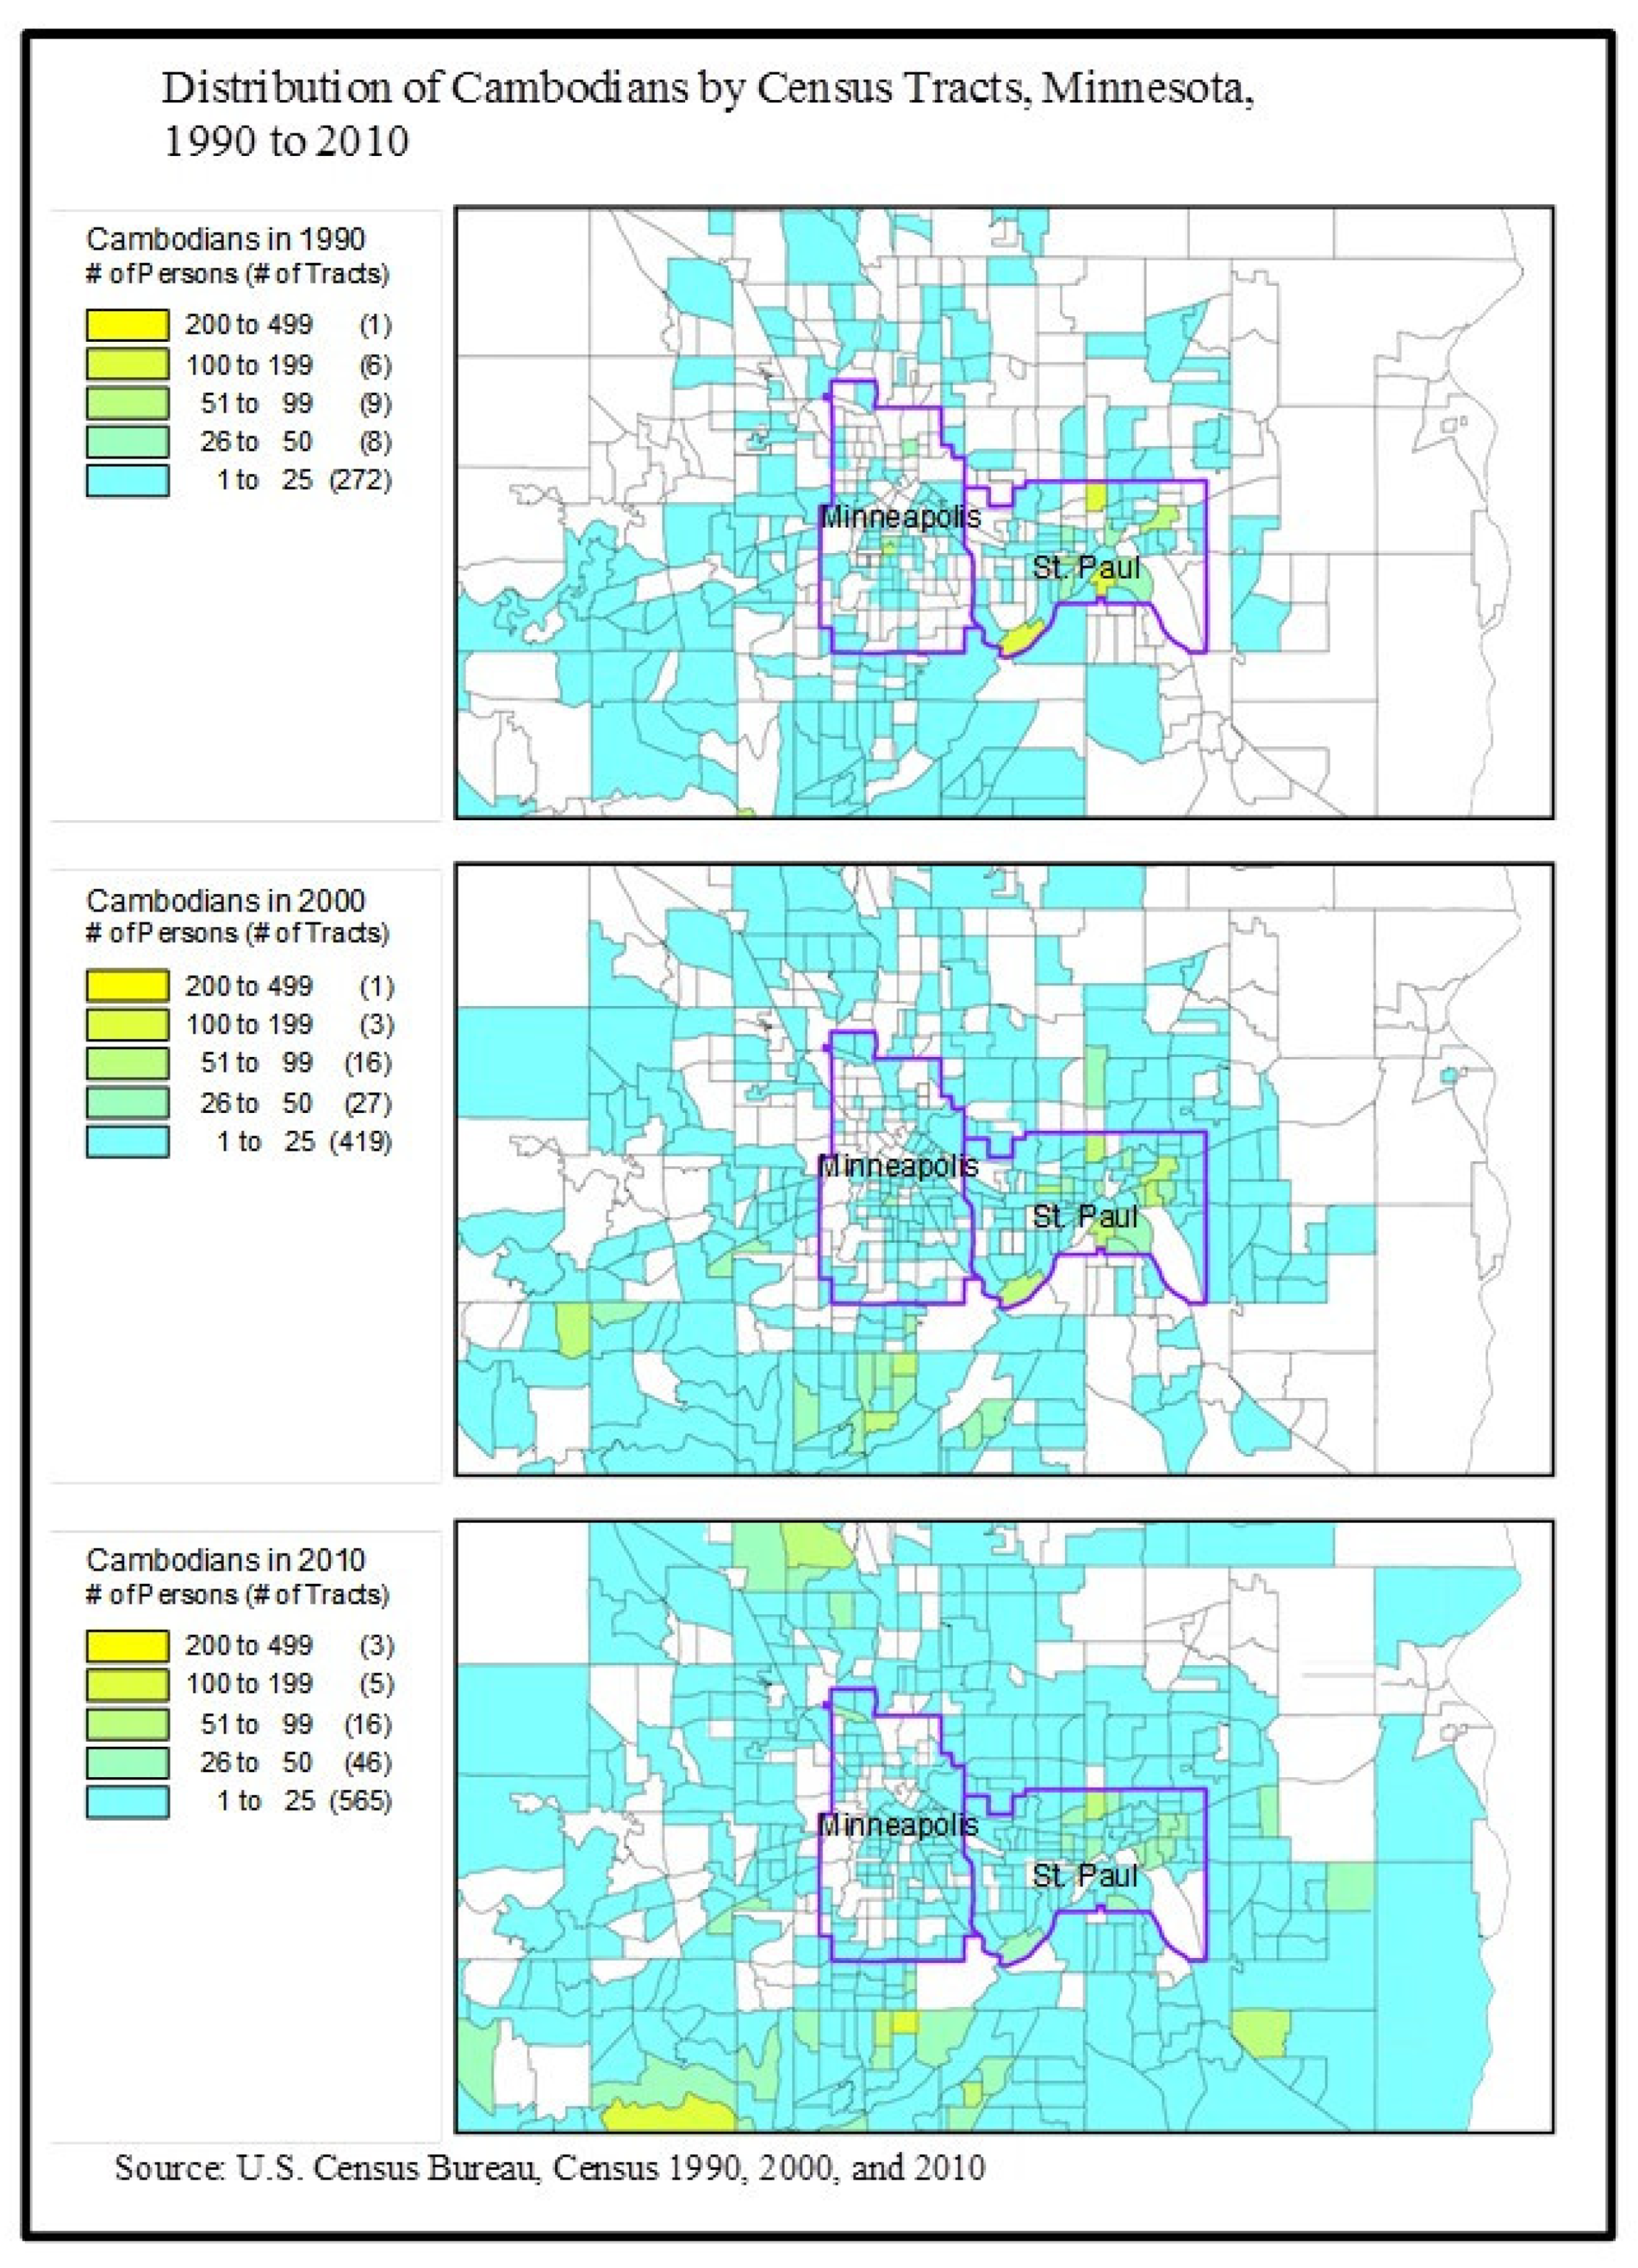
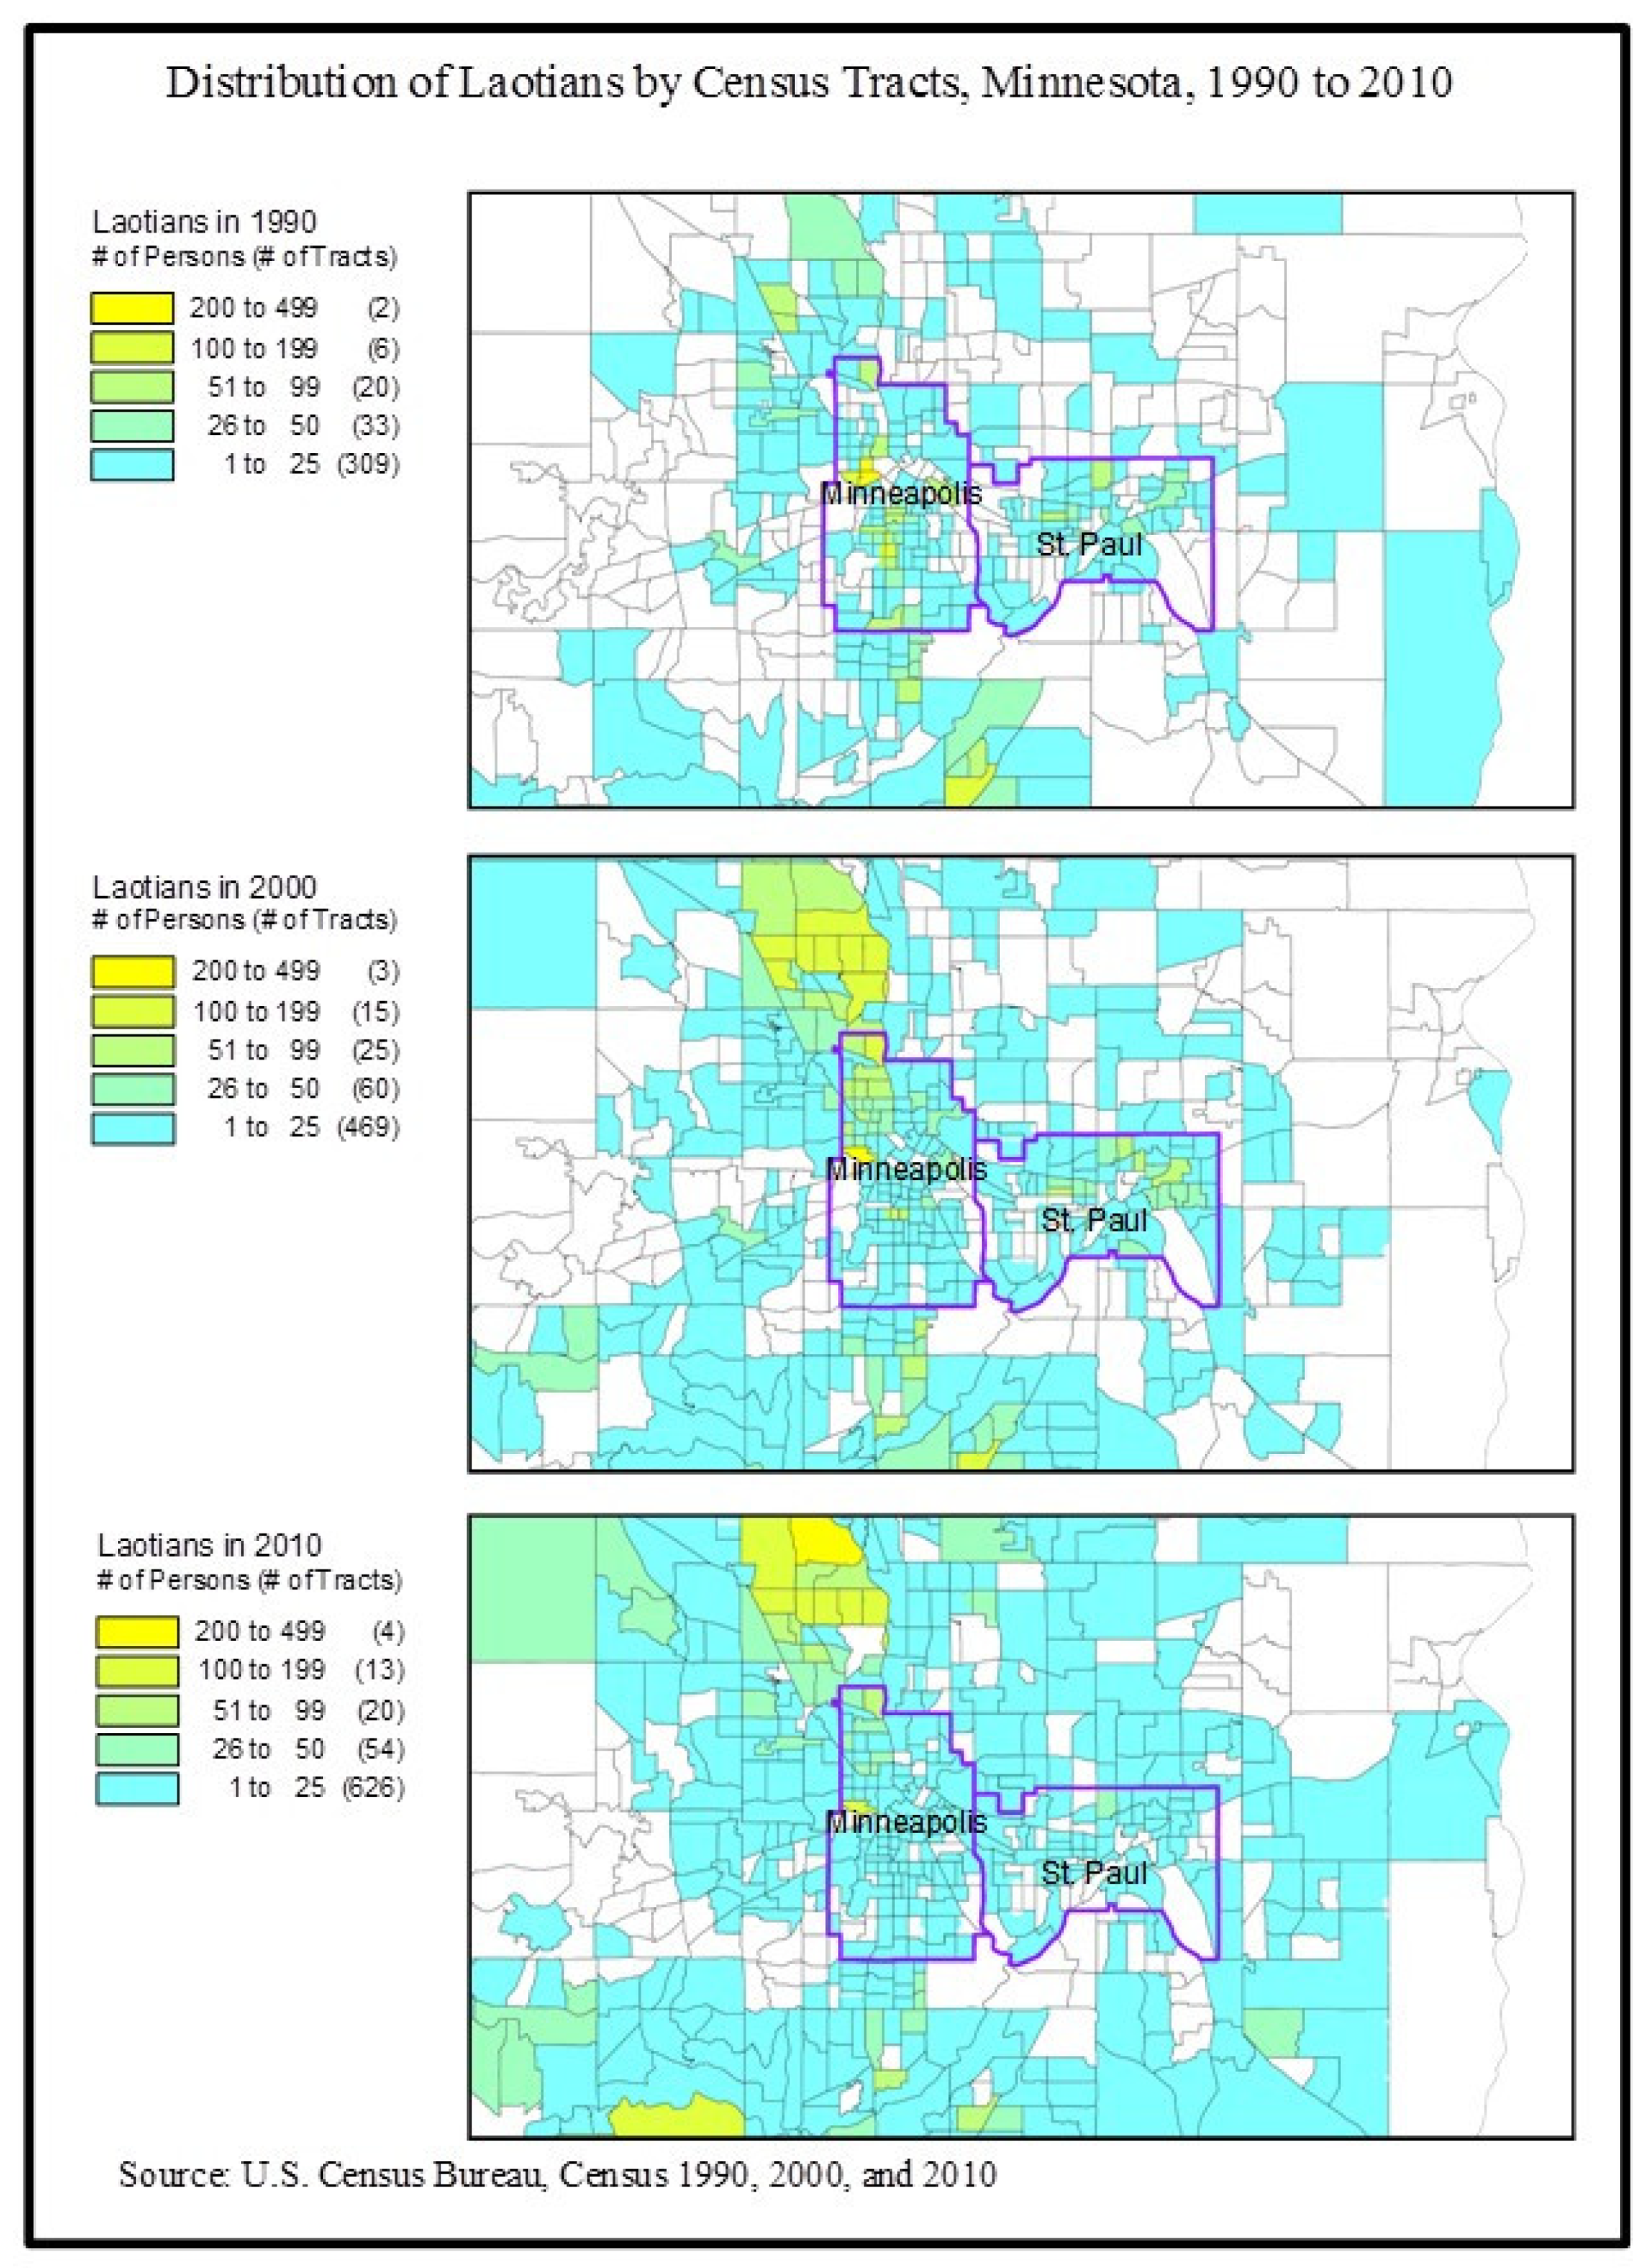
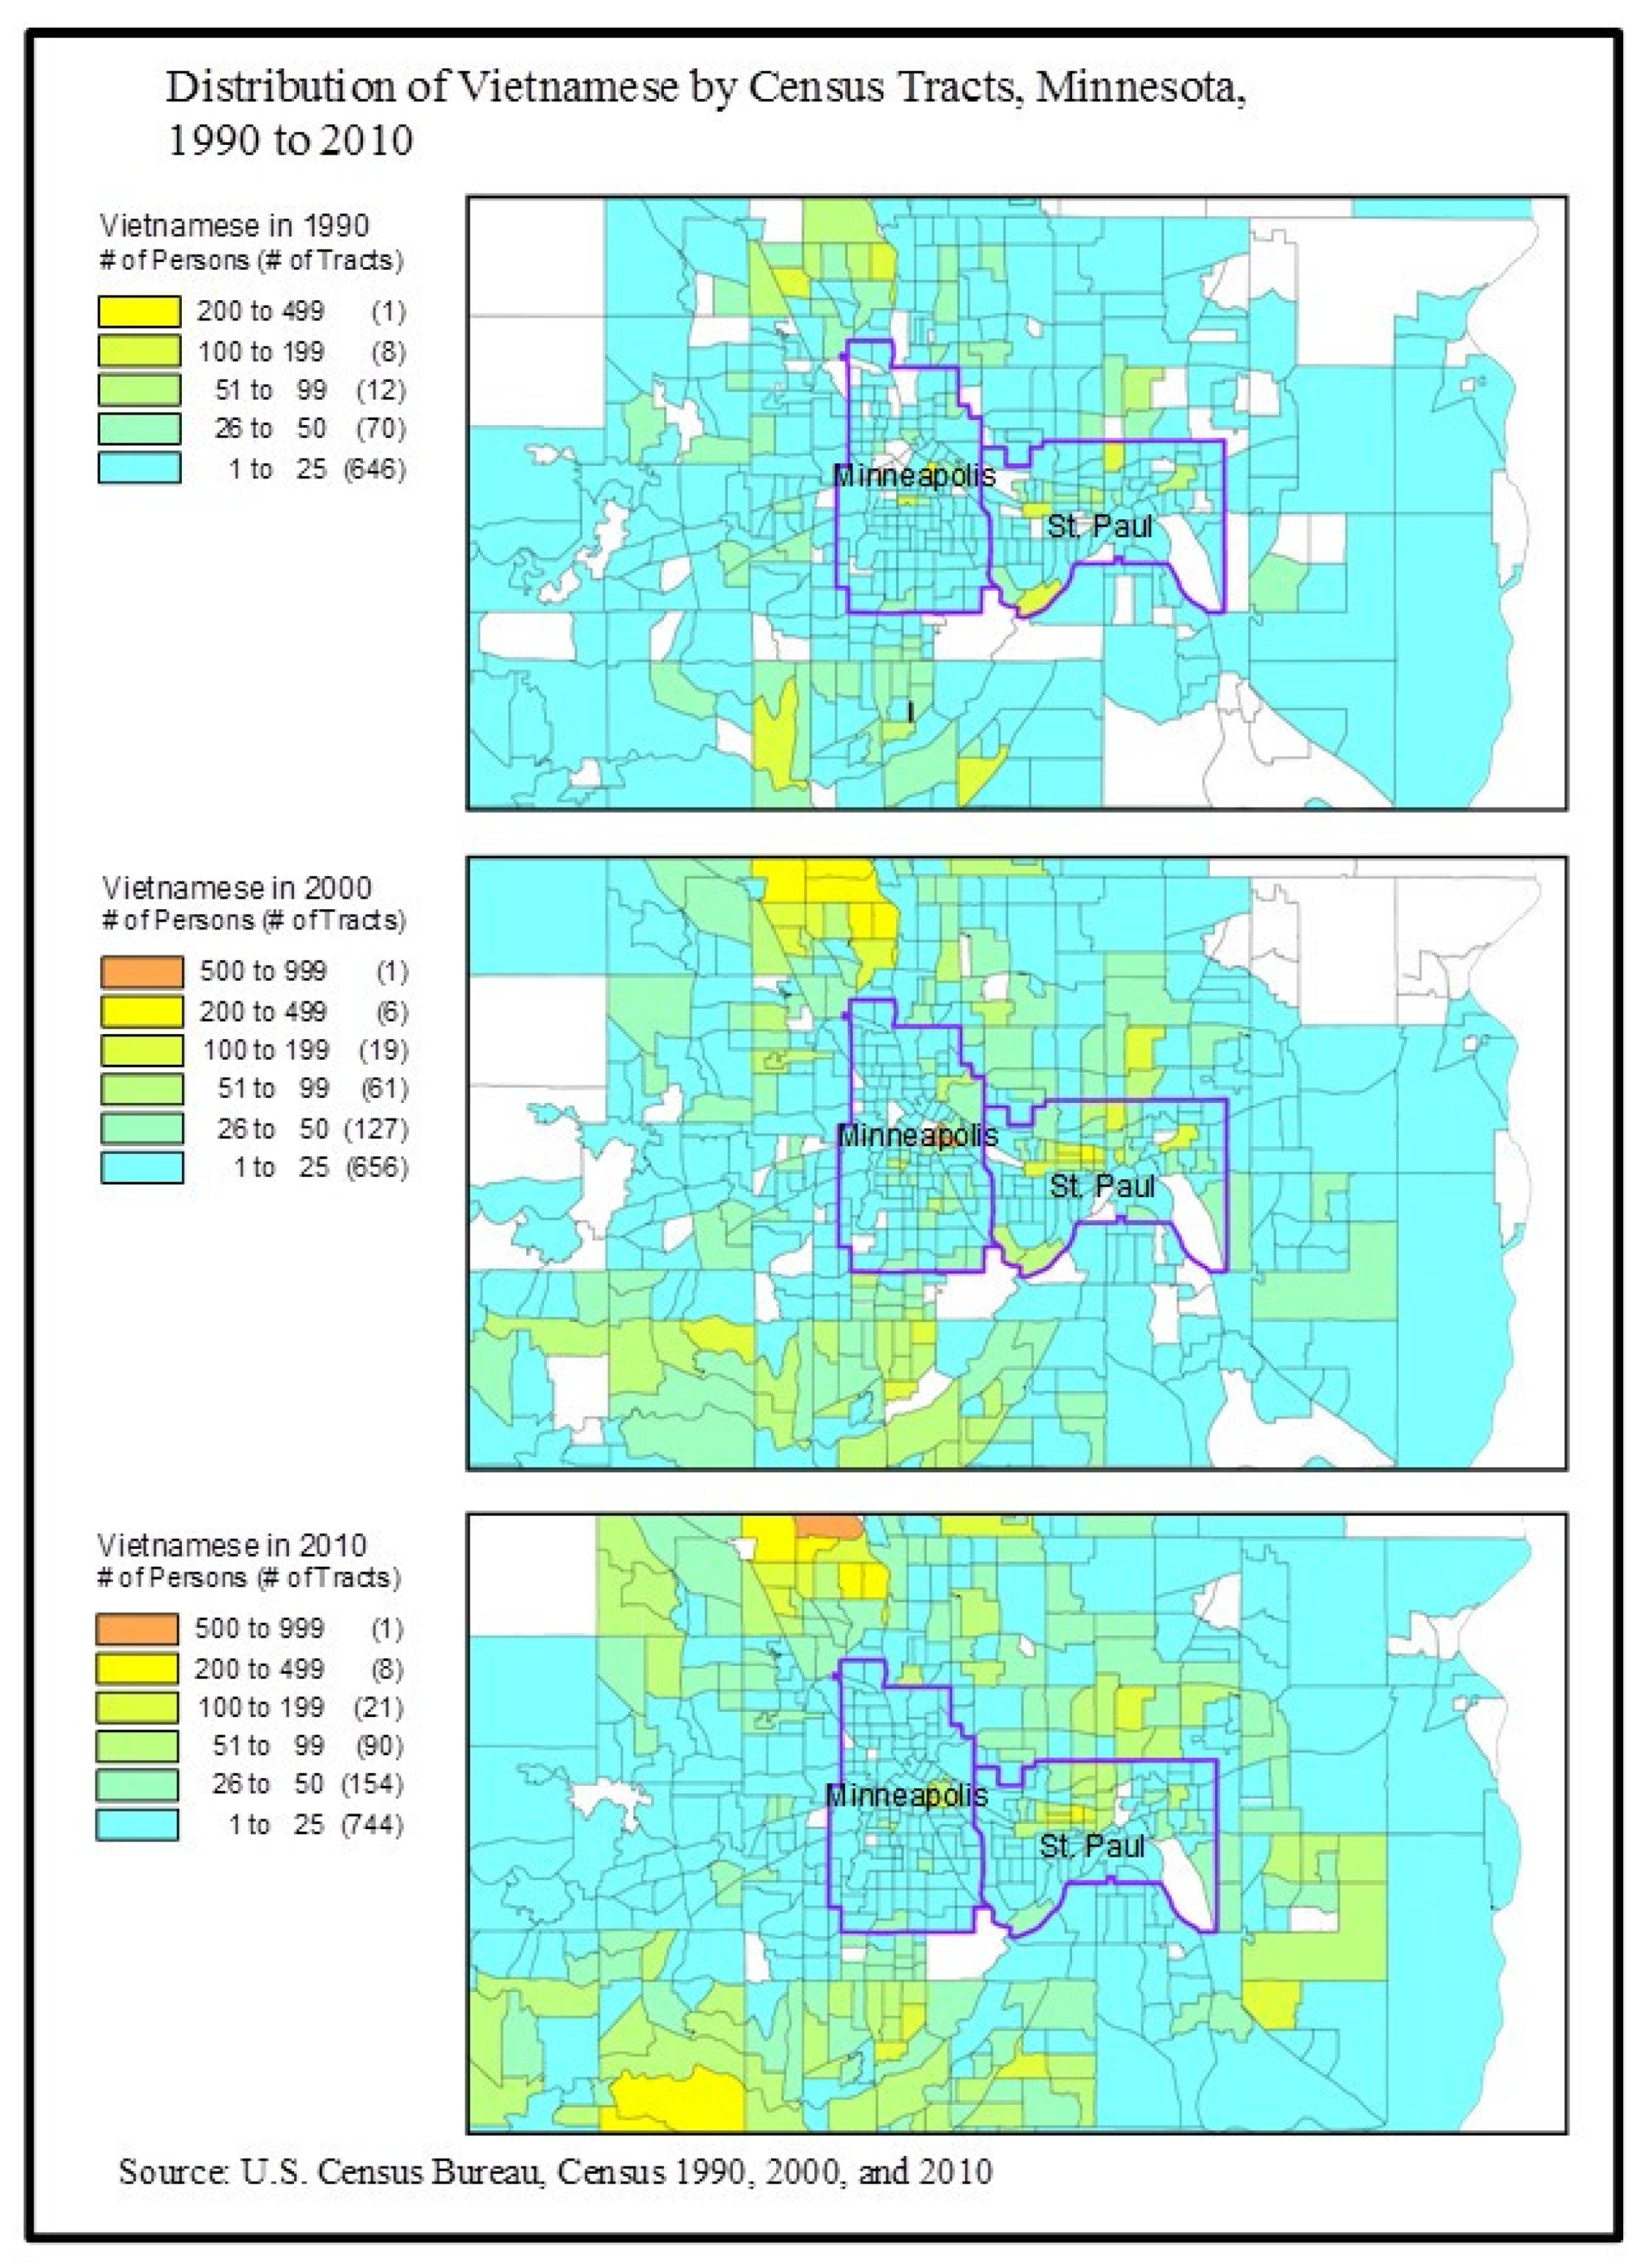
46]. By October 1984, the State’s Refugee Program Office estimated the total number of Southeast Asian refugees to be about 26,000. Of these, 10,000 were Hmong, 6000 were Vietnamese, 6000 were Cambodians, and 4000 were Laotians (Downing et al., 1984). As we will see, Hmong remain the largest group of Southeast Asians in Minnesota.
According to Vang, “From 1976 to 1978, [Hmong families] resided primarily in the Central, Near North, Phillips, and Powderhorn neighborhoods in the city of Minneapolis” [
47]. However, by 1979, some Hmong had moved to St. Paul [
47]. In the only empirical study of Southeast Asian refugee settlement patterns in Minnesota that we know of, Hendricks estimated that in December 1980, of the 4131 Southeast Asian families who had medical assistance eligibility records and lived in Minnesota, 41 percent lived in St. Paul while 26 percent of them lived in Minneapolis [
49]. Consistent with this, Downing and his associates observed that “the majority of Hmong, and Indochinese [Southeast Asian] refugees in general, are concentrated in the central cities [Twin Cities]” [
50].
The population of Southeast Asians, but especially Hmong in Minnesota, grew significantly during the 1980s and 1990s. From 1990 to 2000, the Southeast Asian population grew from 76,094 to 84,062, comprising more than half of Minnesota’s Asian population (166,217). Hmong’s population increased from 41,800 to 45,443, making them the largest (at 30.1 percent) of all Asian groups. The Vietnamese population increased from 18,824 to 20,570. Although they were fewer compared to Asian Indians (19,963) and Chinese except Taiwanese (18,622), the populations of Laotians (9940 to 11,516) and Cambodians (5530 to 6533) also grew during that period [
51]. Whereas in the 1980s, Fresno, California was considered by some as the “capital of the Hmong” in America [
52], by the 2000s, Minneapolis-St. Paul had come to replace Fresno as the Hmong capital of America or even the “Hmong capital of the world” [
47]. Much of this growth can be traced to Southeast Asians’ secondary migration, which was both compelled and voluntary.
Initially, the U.S. government, through its Department of Health, Education, and Welfare (HEW), reimbursed state agencies and voluntary agencies (Volags) for providing welfare, medical, and social services to Southeast Asian refugees [
53]. The government had previously promised that aid would last for 36 months after arrival. However, in May 1982, it shortened it to 18 months after arrival. To make matters worse, states such as Washington and Oregon, which previously relied on federal aid to support Southeast Asian refugees, chose not to allot any special funds to continue the support to refugees after their federal aid programs were cut. Southeast Asian refugees, most of whom lacked the English skills and formal credentials to find gainful employment, were left with difficult choices: to stay or to move elsewhere. Having few options, many Southeast Asian refugees migrated to states such as California, Illinois, Louisiana, Minnesota and North Carolina in search of jobs [
24,
54,
55]. However, many Hmong also migrated in order to be reunited with lineages, subclans or co-ethnic communities [
56,
57].
According to the 2000 U.S. Census, the Minneapolis-St. Paul MSA was home to 2,968,806 persons. Of this, 86.1 percent were White, 5.3 percent were Black, 4.1 percent were Asian, 3.3 percent were Hispanic (of any race), and 2.1 percent were of mixed racial background. By 2010, the Minneapolis-St. Paul MSA population had grown to 3,154,469. Of this, 78 percent were non-Hispanic Whites, 7.5 percent were non-Hispanic Blacks, 5.9 percent were non-Hispanic Asians, 5.5 percent were Hispanics, and 3.1 percent were “Other”. Southeast Asians made up the majority (51.2 percent) of the Asian population not including Hawaiians and Pacific Islanders, in this MSA [
58]. As one of the oldest places of Southeast Asian refugee resettlement (1975–2006), the Minneapolis-St. Paul MSA presents an ideal opportunity to observe the ethnic concentration, suburbanization and segregation patterns of Cambodians, Hmong, Laotians and Vietnamese over time. We focus our attention on this in the rest of this paper.
2. Materials and Methods
Our primary data consist of the Decennial Census of Housing and Population for 1990, 2000, and 2010, and the 2006–2010 Public Use Microdata Sample (PUMS) data of the American Community Survey. We also used census tract level data from the professional version of Social Explorer (Social Explorer, Inc., Bronxville, NY, USA) to compute the dissimilarity indices as well as the proportion of Southeast Asian suburbanization within the seven-county Minneapolis-St. Paul metropolitan area. In the rest of this article, we use the terms non-Hispanic Whites, non-Hispanic Blacks, and non-Hispanic Asians (not including Hawaiians or Pacific Islanders), as these are identified in the United States Census. The term “Southeast Asians” refers to Cambodians, Hmong, Laotians, and Vietnamese collectively. We will refer to specific ethnic groups when comparing groups. Admittedly, each Southeast Asian group is comprised of persons from different immigration cohorts (e.g., some immigrated earlier than others) as well as different generational cohorts (e.g., some were born abroad, others were born in the U.S.). Given the limitations inherent in aggregated United States census tract data, we were unable to distinguish between United States-born persons and foreign-born persons without losing ethnic specificity (i.e., Hmong, Cambodian, Laotian, Vietnamese). As such, the category of Southeast Asian actually includes persons who are immigrants as well as persons who are the children of immigrants. Nevertheless, United States immigrant communities have rarely, if ever, been comprised of solely foreign-born persons or families. In this paper, we are interested primarily in immigrant group patterns and outcomes rather than in individual-level variables or relationships.
2.1. Definition of Suburbanization
The United States Office of Management and Budget defines metropolitan statistical areas (MSAs) as geographical areas that “have at least one urbanized area of 50,000 or more population, plus adjacent territory that has a high degree of social and economic integration with the core as measured by commuting ties” [
59]. Analytically, a metropolitan statistical area contains a core and a periphery. The United States Census defines a “central city” as the city or set of qualifying cities with the largest population in an MSA [
60]. In 2010 and 2000, the Minneapolis-St. Paul-Bloomington MSA was comprised of 13 counties, 2 of which are located in Wisconsin. These 13 counties include Anoka, Carver, Chisago, Dakota, Hennepin, Isanti, Ramsey, Scott, Sherburne, Washington and Wright counties in Minnesota and Pierce and St. Croix counties in Wisconsin. However, prior to that, in 1990, the Minneapolis-St. Paul MSA consisted of only 11 counties (Anoka, Carver, Chisago, Dakota, Hennepin, Isanti, Ramsey, Scott, Washington, Wright, and St. Croix counties).
Following the conventions of the United States Census Bureau, we define the suburban population as the proportion of the population that resides outside of the central city but within the metropolitan statistical area [
4]. We are aware of some of the limitations of defining suburbs in this way (see, for instance, the discussion by Massey and Denton [
4]). However, others have followed a similar approach in defining suburbs [
60]. In this paper, we count the cities of St. Paul and Minneapolis as the “central city” of the Minneapolis-St. Paul MSA and take the remainder of the MSA to be suburbs. We will also refer to these areas as “metro central city” and “metro suburbs”.
2.2. Definition of Dissimilarity Index
As one of the most widely used measures of residential evenness, the index of dissimilarity measures the departure from evenness between two social groups. This index ranges from 0 to 100, and represents the proportion of the minority population that would have to move to another neighborhood in order to achieve an even distribution across the larger geographic area under study [
17]. An index score between 0 and 30 is considered low segregation, an index between 30 and 60, moderate segregation, and an index score equal to or above 60 suggests that there is high segregation between the two groups [
4]. A difference of less than five points is usually considered a negligible difference [
61]. The dissimilarity index (
D) is calculated as follows:
where, supposing that we are calculating the dissimilarity for Blacks and Whites,
bi is the Black population of the
ith areal unit (in our case, the census tract represents neighborhoods);
B is the total Black population of the large geographic entity (in our case, MSA) for which the index of dissimilarity is being calculated;
wi is the White population of the
ith areal unit (census tract); and
W is the total White population of the large geographic entity for which the index of dissimilarity is being calculated. When interpreting the results on segregation, we are aware that the dissimilarity index may be inaccurate and less reliable when a group’s population is less than 1000 [
62]. This is less of a concern to us in this paper since the populations of the individual racial and ethnic categories (White, Black, Asian, Southeast Asian, etc.) that we study number more than 1000 within the Minneapolis-St. Paul MSA, including its central city and suburbs.
In using the dissimilarity index, we are aware that it is one of at least five indicators of racial segregation, that none of these indicators is superior to the rest, and that no single indicator can capture all the aspects of racial segregation. Given our research questions and considering the constraints of space, we decided to use the dissimilarity index because it is one of the most commonly used measures of racial segregation and therefore might enable us to compare our findings with past findings.
4. Discussion
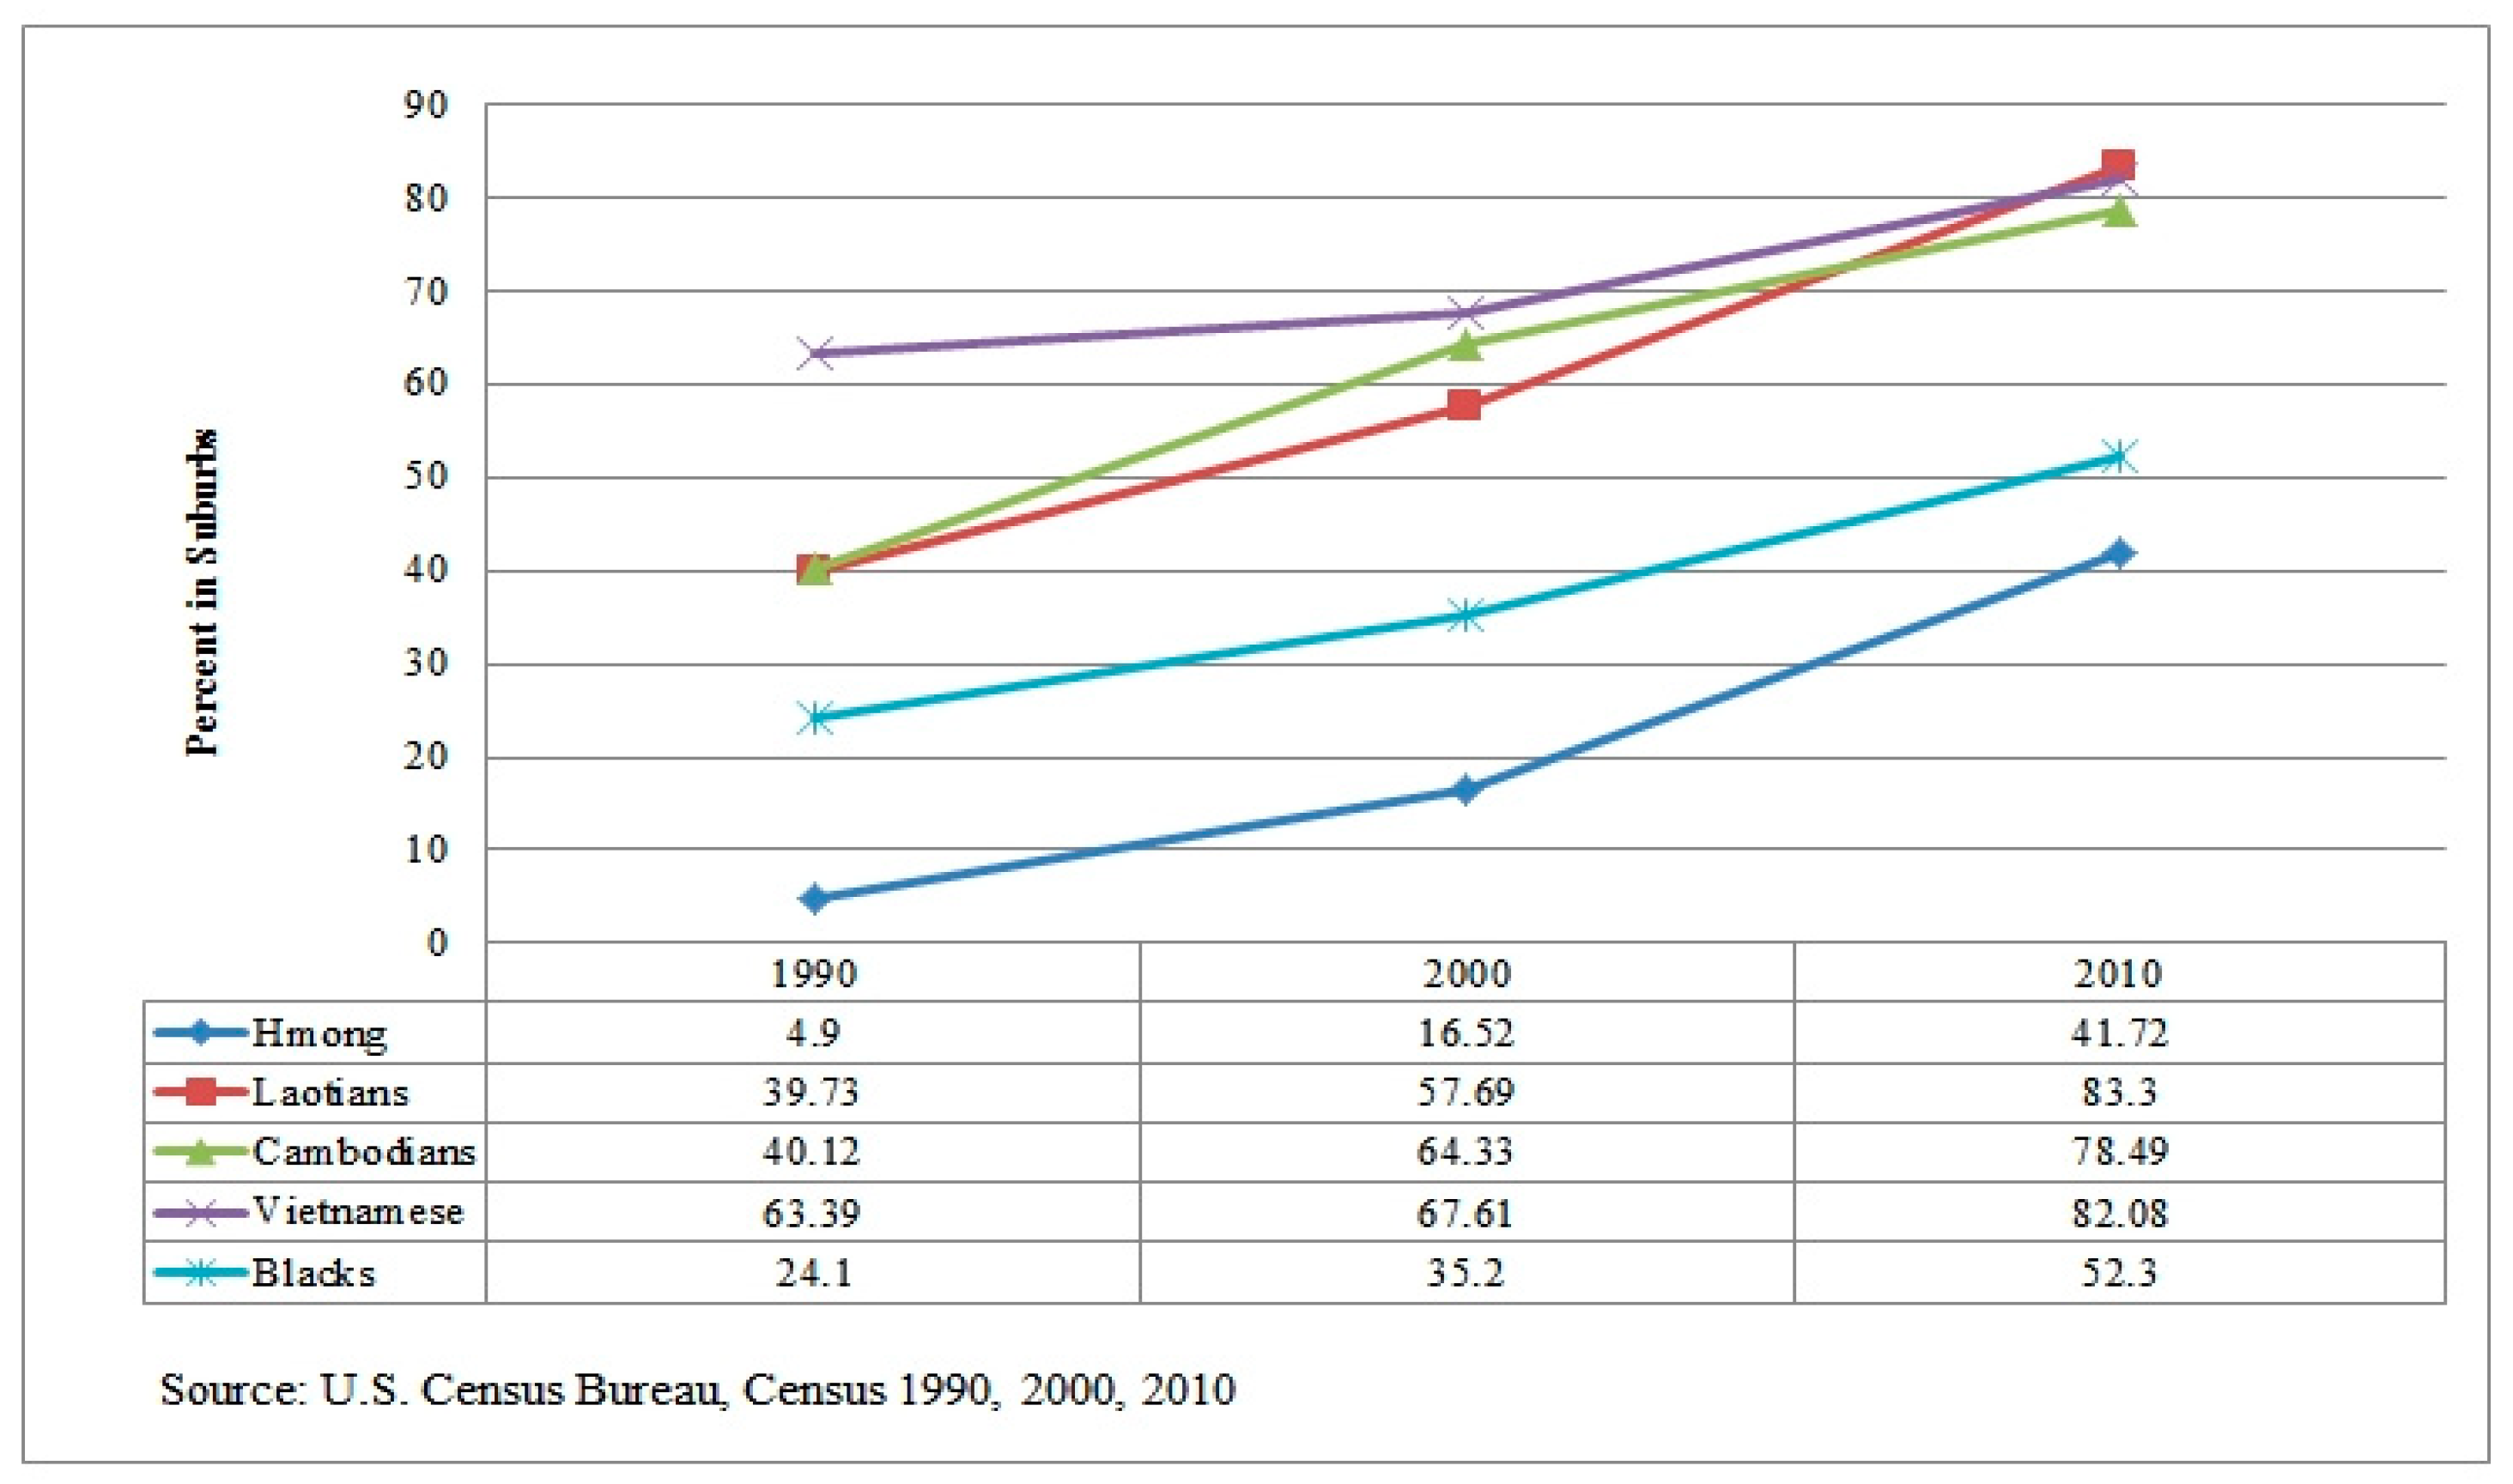
At the outset of our paper, we posed three questions: (1) how and to what extent has the suburbanization of individual Southeast Asian former refugee groups changed in the Minneapolis-St. Paul Metropolitan Statistical Area between 1990 and 2010? (2) how has Southeast Asians’ suburbanization affected their degree of racial segregation in the central city and in the suburbs? (3) how does understanding the differences between these Asian subgroups improve our understanding of urban geographic processes? Our data show that during the 1990 to 2010 period, Southeast Asians in the Minneapolis-St. Paul Metropolitan Statistical Area experienced substantial suburbanization. However, Southeast Asians’ suburbanization has occurred alongside moderately high to very high levels of residential segregation in both the central cities and suburbs. However, not all Southeast Asian ethnic groups experienced the same levels of suburbanization, segregation, or concentration. For instance, a clear majority (58 percent) of Hmong Americans remained in the central cities, particularly St. Paul, and Hmong experienced greater racial segregation than any of the other Southeast Asian groups as well as Blacks. Vietnamese, who were the least segregated among Southeast Asians, remain just as segregated as Blacks in both the central cities and the suburbs. Taken together, our set of findings complicates any simple meaning or definition of “suburbanization” and raises questions about the assumptions of both the spatial assimilation and place stratification perspectives on immigrant residential processes. Next, we discuss the first of our questions before turning our attention to the second and third questions.
How has Southeast Asian Americans’ suburbanization been possible over time? We suggest that Southeast Asians’ suburbanization was probably facilitated by a combination of factors and processes, including the gradual accumulation of financial capital, families’ recognition of and responses to specific economic constraints and opportunities, changes in families’ residential preferences, and the lack of substantial new Southeast Asian immigration into the central cities. For most individuals and groups in American society, the accumulation of financial capital is a gradual, difficult, and uncertain process rather than a fast, easy or inevitable one. Southeast Asian refugees, unlike other economic immigrant groups in the U.S., arrived with diverse social class backgrounds, much less resources and fewer transferable language and work skills and credentials (because the skills that they possessed were often devalued by employers in the host society). Consequently, they experienced higher levels of poverty and had a much more difficult time accumulating financial capital than other European or non-refugee immigrant groups [
63,
64]. As such, in the late 1970s and early 1980s, homeownership was simply out of reach for the vast majority of them. Nevertheless, Southeast Asian Americans’ family and household poverty levels have been declining since the 1980s and 1990s [
65]. The decline in Southeast Asian Americans’ overall poverty probably enabled some to afford to move out of the inner cities and into the suburbs, where the cost of housing tended to be higher.
The fact that Southeast Asians’ gradual suburbanization partly reflects their gradual accumulation of financial capital can be inferred from the reports that most of the suburbs into which Southeast Asians have moved are aging suburbs—as indicated by U.S. census data on the median year in which housing structures were built. These aging suburbs are adjacent to the two central cities: St. Paul and Minneapolis. This finding is similar to previous findings that Black households in the 1970s gained access to only aging suburbs that have been abandoned by higher-socioeconomic Whites, who have moved into the exburbs far away from the central cities [
66]. As a result, despite having moved further away from the central cities, Blacks remain closest to it compared to Whites. To be sure, socioeconomic resources cannot entirely explain Southeast Asians’ suburbanization or their continued segregation.
During the economic recession of the mid- to late-2000s, home foreclosures pushed some established residents out of their homes both in the central cities and in the suburbs. At the same time, the frequency of foreclosures produced a population that demanded both rental and owned property. This demand for rental property kept rent prices fairly high or at least stable for the rest of the population who rent their homes. Working Southeast Asian adults recognized this economic opportunity (i.e., cheap foreclosed homes and lower mortgages for homes compared to previous decades, and easier access to home loans). The relatively lower prices of homes, including homes in the suburbs in this decade, made it more possible for Southeast Asian who had been renters to buy older homes in these neighborhoods. Even some Southeast Asian who already owned homes opted to let go of their high-mortgage homes in order to repurchase newer but less expensive homes.
But perhaps even more important than cost-benefit considerations, Southeast Asians’ residential preferences have developed and changed over time due to real and perceived social circumstances. Like most residents, many established Southeast Asian residents are keenly aware that access to certain sets of important resources is affected by one’s location. For example, this includes access to better public schools, but also access to cleaner streets, more parks and public places of accommodation, more responsive police, less regular police surveillance (lower perceived risk of racial profiling), etc. Southeast Asian children born in the late 1970s were now in their mid-20s; many of them have graduated from college and are employed. Their wages supplemented individual households’ incomes, increasing their capacity to purchase homes in the suburbs. The more culturally and linguistically acculturated and more economically mobile generation is both more cognizant of the racial stratification of our American society—a society that encourages association with lighter-skin people and discourages association with darker-skin people—and more able to afford to move into predominantly white neighborhoods, if they choose to. This does not mean they can always choose where they want to live—because racism against Asians and racial minorities in general remains pervasive—but it means they have more options than their parents.
However, our findings question the expectation that all immigrant groups will continue to move to the suburbs as their socioeconomic standing improves. Our data show that, contrary to this expectation, Cambodians with higher median household incomes reside and disproportionally own homes in the central city as opposed to the suburbs where their lower-income counterparts are found. Moreover, a clear majority of Hmong residents remained in the central cities, particularly St. Paul, despite improvements in their overall socioeconomic status during the previous two decades. To what extent might this have to do with racial discrimination in housing or racism against Asians in the broader society? To what extent might this have to do with ethnic members’ own preferences to live and work among people who look like them? While these questions are beyond the scope of our study, we encourage future research to explore them.
How has suburbanization affected Southeast Asians’ degree of racial segregation? Our data show that although Southeast Asians in the central city tended to experience higher segregation than their counterparts in the suburbs of the Minneapolis-St. Paul MSA, living in the suburbs has not resulted in residential propinquity with non-Hispanic Whites. As we have seen, between 1990 and 2010, Asians in the suburbs became more rather than less segregated from non-Hispanic Whites. During the same period, the segregation level of Southeast Asians in the suburbs stayed about the same (D = 45.7 or moderately high). Indeed, our data indicate that Southeast Asians in the suburbs are less segregated from non-Hispanic Blacks in the suburbs than they are from Whites or other Asians in the suburbs. This suggests that suburban Southeast Asians are, on average, less separated from (or living closer to) non-Hispanic Blacks than they are from either non-Hispanic Whites or other non-Hispanic Asians. Once again, there were some marked differences between Southeast Asians in terms of residential segregation. By 2010, Vietnamese in the suburbs were substantially less segregated than Cambodians, Laotians, and Hmong in the suburbs. Nevertheless, Vietnamese in the suburbs remained just as segregated from Whites as Blacks in the suburbs were from Whites.
The spatial assimilation model, which predicts that immigrants will move into the suburbs as their socioeconomic status improves, is unable to explain (a) why a clear majority of Hmong residents remained in the central cities, particularly St. Paul, despite improvements in their overall socioeconomic status during the previous two decades or, relatedly, (b) why Hmong have formed ethnic concentrations in areas adjacent to the central city. Instead of focusing on “assimilation”, perhaps we should focus more on the variety and complexity of immigrants’ and immigrant groups’ spatial processes and outcomes. One important finding of our study is the persistence of ethnic concentration, especially the concentration of Hmong in the Minneapolis-St. Paul metro area as indicated by their high levels of neighborhood clustering and residential segregation.
One of the key lessons of our study is that even though Hmong, Cambodians, Laotians and Vietnamese share similar experiences of having been displaced refugees, immigrating to the U.S. during the same historical period (1970s), and resettling in the same state (Minnesota), their spatial processes and, more specifically, their residential patterns, are not necessarily alike. Indeed, our data suggest that each of these groups has unique residential patterns that cannot be explained by increases in their socioeconomic status alone. Although segmented assimilation theory, by taking account of immigrant groups’ unique contexts of exit and contexts of reception, can reliably predict immigrant groups’ socioeconomic outcomes or social mobility prospects, it may be less able to predict groups’ residential patterns, at least without greater specification. We suspect that this may be because non-White immigrants’ residential processes involve complex, dynamic individual and collective actions, social, economic, and political opportunities and constraints, institutional processes and state policies, and evolving social norms and interactions—factors that are affected by social and economic factors but are not necessarily determined by it. Perhaps by further specifying the processes and mechanisms and by clarifying how they work in tandem with government reception policies, labor markets, and public reception to condition groups’ residential constraints and opportunities, segmented assimilation theory may be further developed to predict groups’ residential patterns.
Furthermore, the residential patterns of Southeast Asians as a group, at least up to this historical period, differ from those of other East Asian groups who have resided in the United States for much longer and are more established in U.S. metropolitan areas. For example, Li showed that Chinese Americans formed an “ethnoburb” or “ethnic suburb” in the San Gabriel Valley in Los Angeles. By ethnoburb, she means “suburban ethnic clusters of residential areas and business districts in large American metropolitan areas….[which are] characterized by both vibrant ethnic economies, due to the presence of large numbers of ethnic people, and strong ties to the globalizing economy, revealing their role as outposts in the emerging international economic system” [
67]. Even though Hmong Americans are highly concentrated in the Twin Cities and have vibrant ethnic economies, they do not (yet) appear to be an “ethnoburb” in the sense that they lack strong ties to the globalizing economy and do not currently serve as outposts in the emerging economic system. Nevertheless, both Hmong Americans in the Twin Cities and Chinese Americans in the San Gabriel Valley do have at least one thing in common: ethnic concentrations with various ethnic businesses, some of which are thriving.
How does understanding the differences (and similarities) between these subgroups improve our understanding of urban geographic processes? The varied residential patterns of Southeast Asian subgroups suggest that there cannot be a one-size-fits-all model of immigrant spatial processes or outcomes. Just as the spatial assimilation model cannot fully explain why a large proportion of Hmong and Cambodian Americans remain in the central city, place stratification cannot fully account for why Vietnamese Americans have become quite suburbanized. Given that each immigrant group experiences its own unique contexts of exit and contexts of reception, which can shape their members’ resources and opportunities and possibly their residential assimilation process and outcome [
21,
22], models of immigrant spatial process or outcome, should, at the minimum, take immigrant groups’ unique contexts of exit and reception into account when studying immigrant groups’ urban spatial processes and outcomes. Since immigrant groups’ contexts of reception are subject to change rather than remaining static, we should expect changes, such as interruptions, inconsistencies, reversals, and so on, in immigrant groups’ spatial processes and outcomes.

