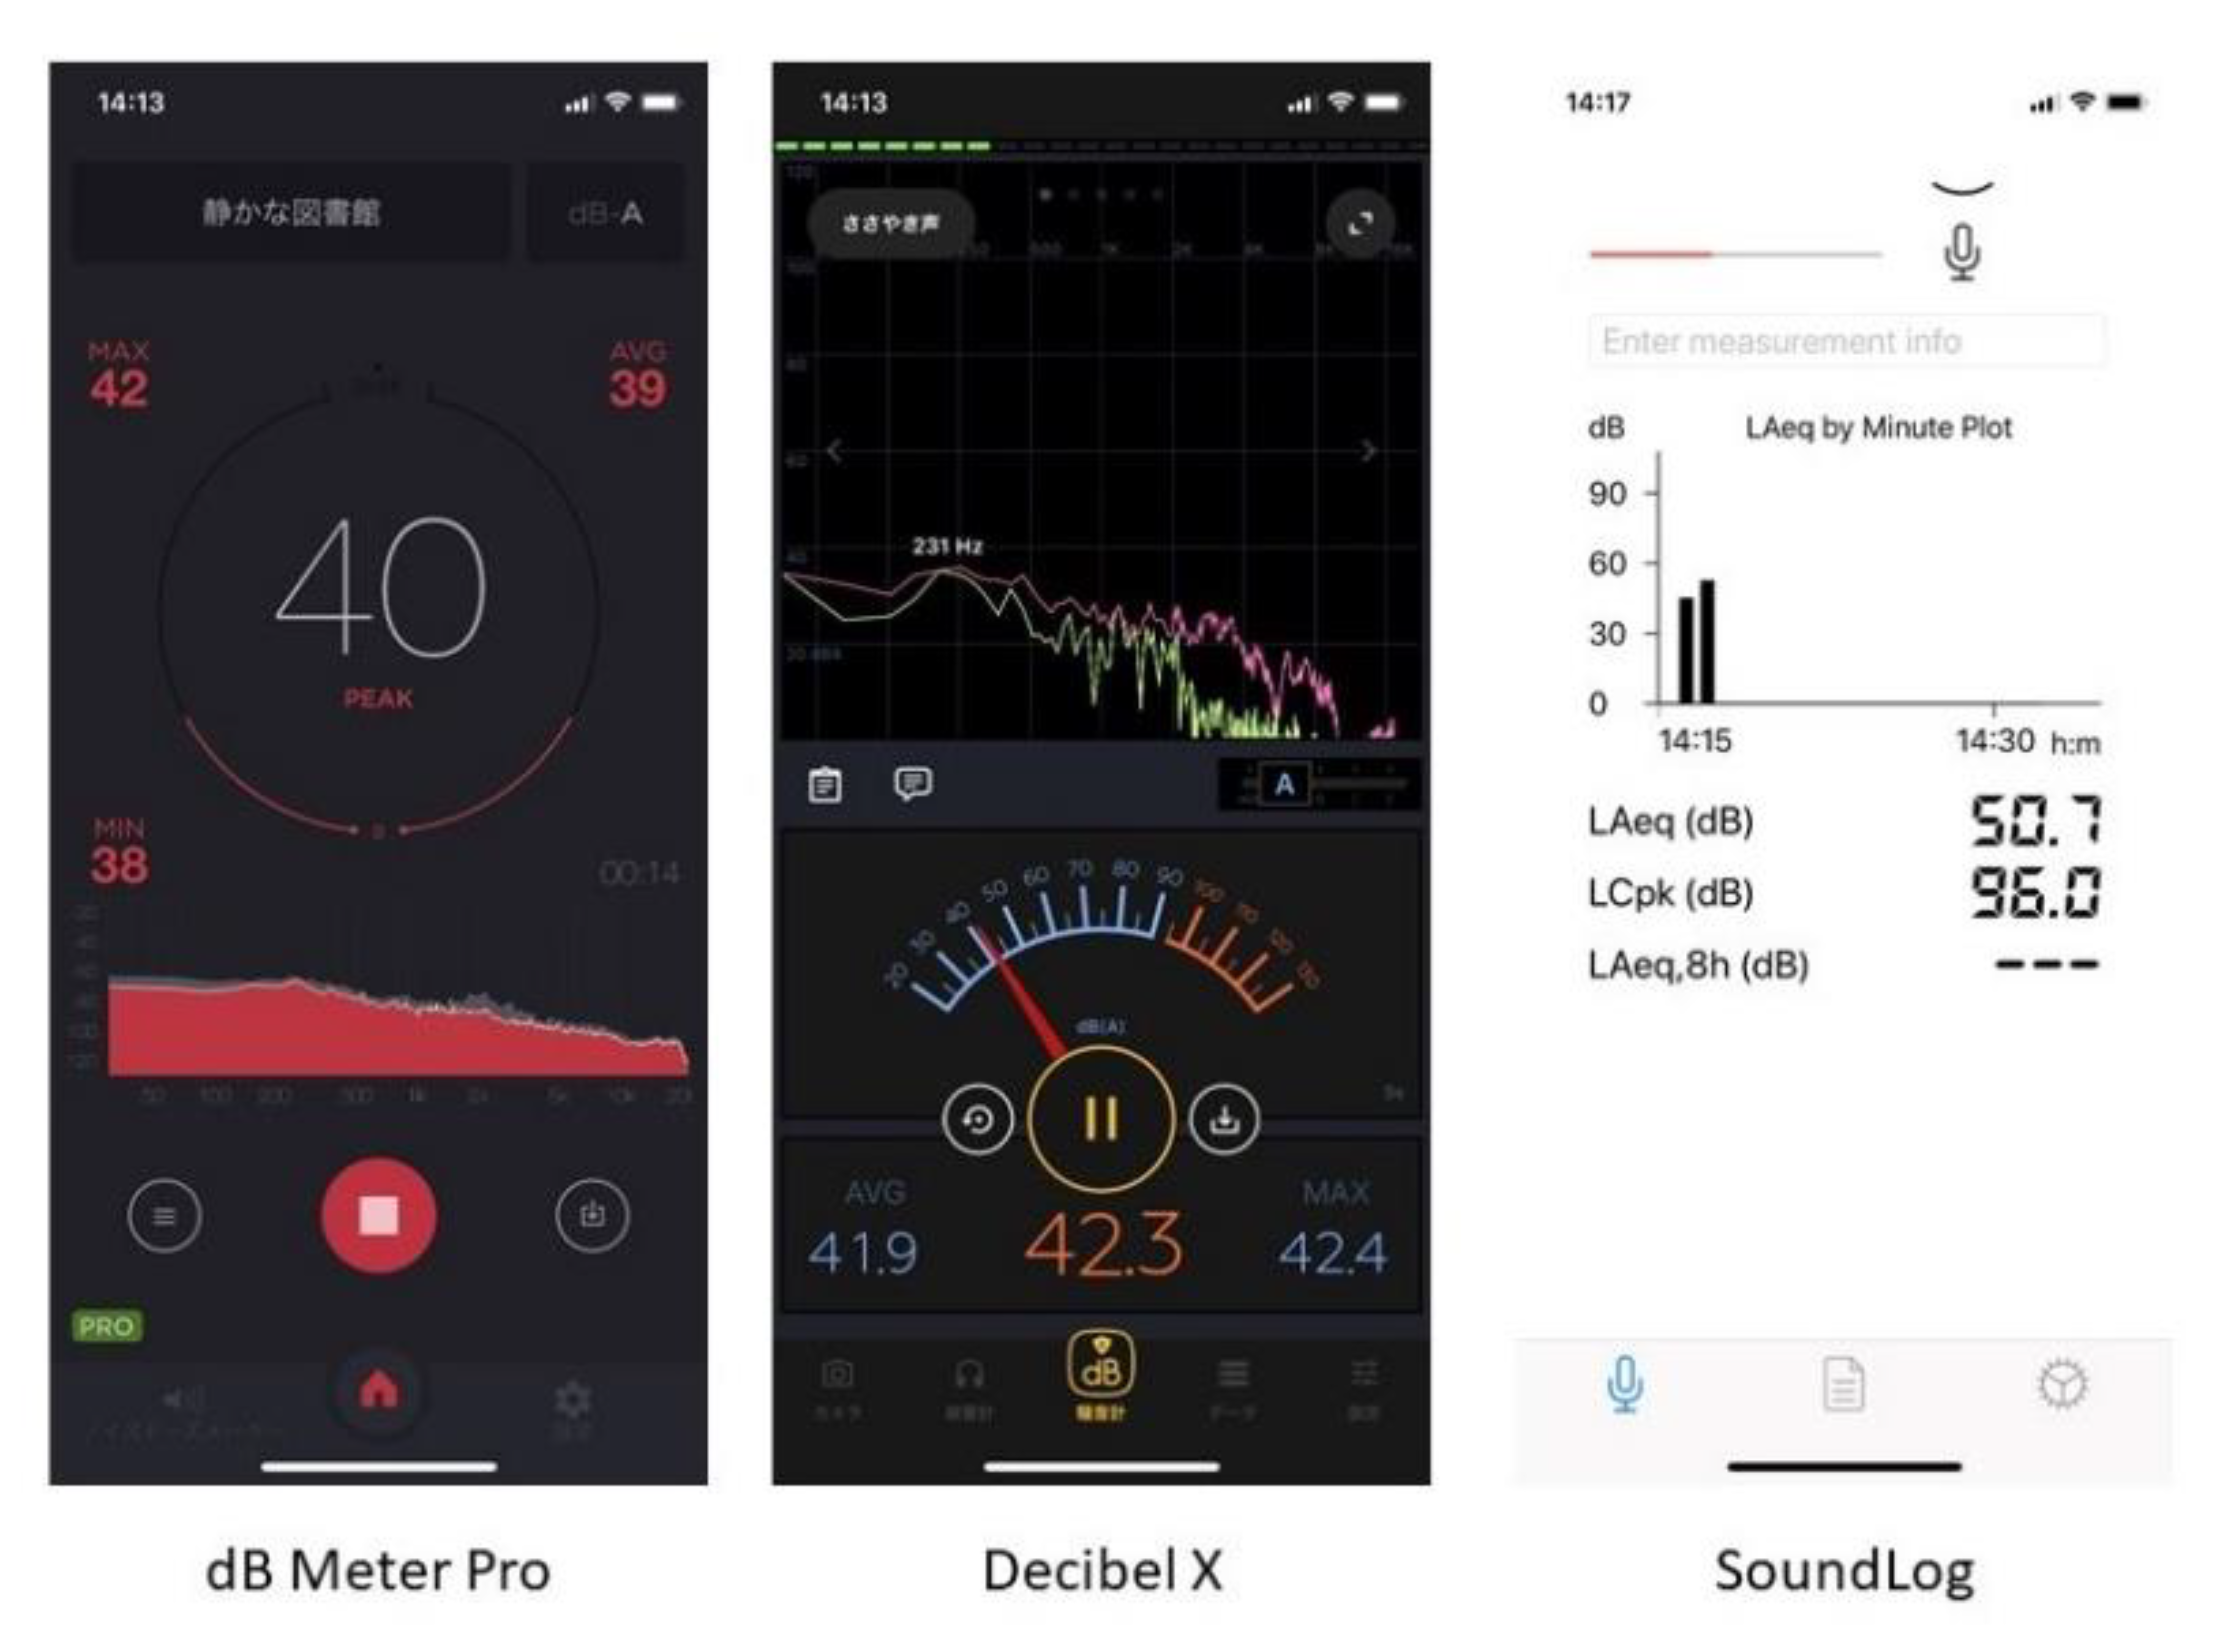
3. Accuracy Check
Previous studies [
32,
33] have clarified the measurement accuracy of iOS/Android sound-level measurement applications for mobile devices, and dB Meter Pro and Decibel X were studied in Reference [
33]. In previous work by the present authors, recent changes in both the applications and devices made some variation in accuracy of applications [
6]. Therefore, in the present paper, we also made an accuracy check to confirm the reliability of the above three applications on both iOS and Android devices.
We proposed a detailed method to test accuracy in Reference [
6,
21]. However, considering that the main purpose of the present work is education of urban acoustic environments, in this work, the method of accuracy check is simplified. This is because, in many cases, the measurement is limited to A-weighted sound-pressure level (SPL): if the accuracy of the measured value includes some smaller errors, qualitative analyses are possible and often enough for educational purposes. Additionally, considering that it is difficult to perform an accuracy check in an anechoic chamber in the actual field of education, we performed an accuracy check in a typical non-reverberant room with nonprofessional equipment to produce test sound. For the test sound, we used pink noise only: in the previous studies aimed at engineering-oriented education [
6,
20,
21], we used 1/1-octave band noise of various centre frequencies to check the frequency response of the device. However, considering the abovementioned purpose, accuracy for a broadband noise is sufficient. We used a standardized class 1 sound-level meter (SLM) as the reference for obtaining the best results. However, when quantitative discussion is less important, a class 2 SLM can be used.
Before the accuracy check, we removed the case of mobile devices and cleaned around the microphone port. The devices were oriented so that the microphone was directed to the loudspeaker emitting the test sound during the test. The loudspeaker used was a full-range loudspeaker of 12-cm diameter enclosed in a cabinet. The test was performed in the middle, but not the centre, of the room to avoid the effect of walls. The distance between the device and the loudspeaker was 1.5 m. The room used for the test was an office (3.5 × 6.5 × 2.8 (m3). Reverberation time, T20, was calculated from measured impulse response, and it was about 0.3 s) with furniture on the walls, carpet on the floor, and a sound-absorbing ceiling. Background noise level was 26 dB(A) (measured by class 1 SLM). Considering the level of typical environmental noise, the test was performed up to about 80 dB(A).
In this accuracy check, first, all applications were calibrated by measuring the A-weighted SPL of 1 kHz 1/1-octave band noise of 60 dB(A). The measured values were compared with those measured by a class 1 SLM (RION NL-52), and the values of difference between them were given in each application as a trimming value. After this calibration procedure, pink noises of different levels were presented from a loudspeaker, which we measured with each application on a mobile device and a class 1 SLM. In this test, we used an iPhone XS (issued Oct. 2018, iOS 13) and an iPad Air (issued Apr. 2019, iOS 13). As the dB Meter Pro and Decibel X are also available for Android devices, these applications were also tested with an Android tablet (Teclast P80X, Android OS 9) for reference. The results from both the mobile devices and class 1 SLM were plotted in a graph.
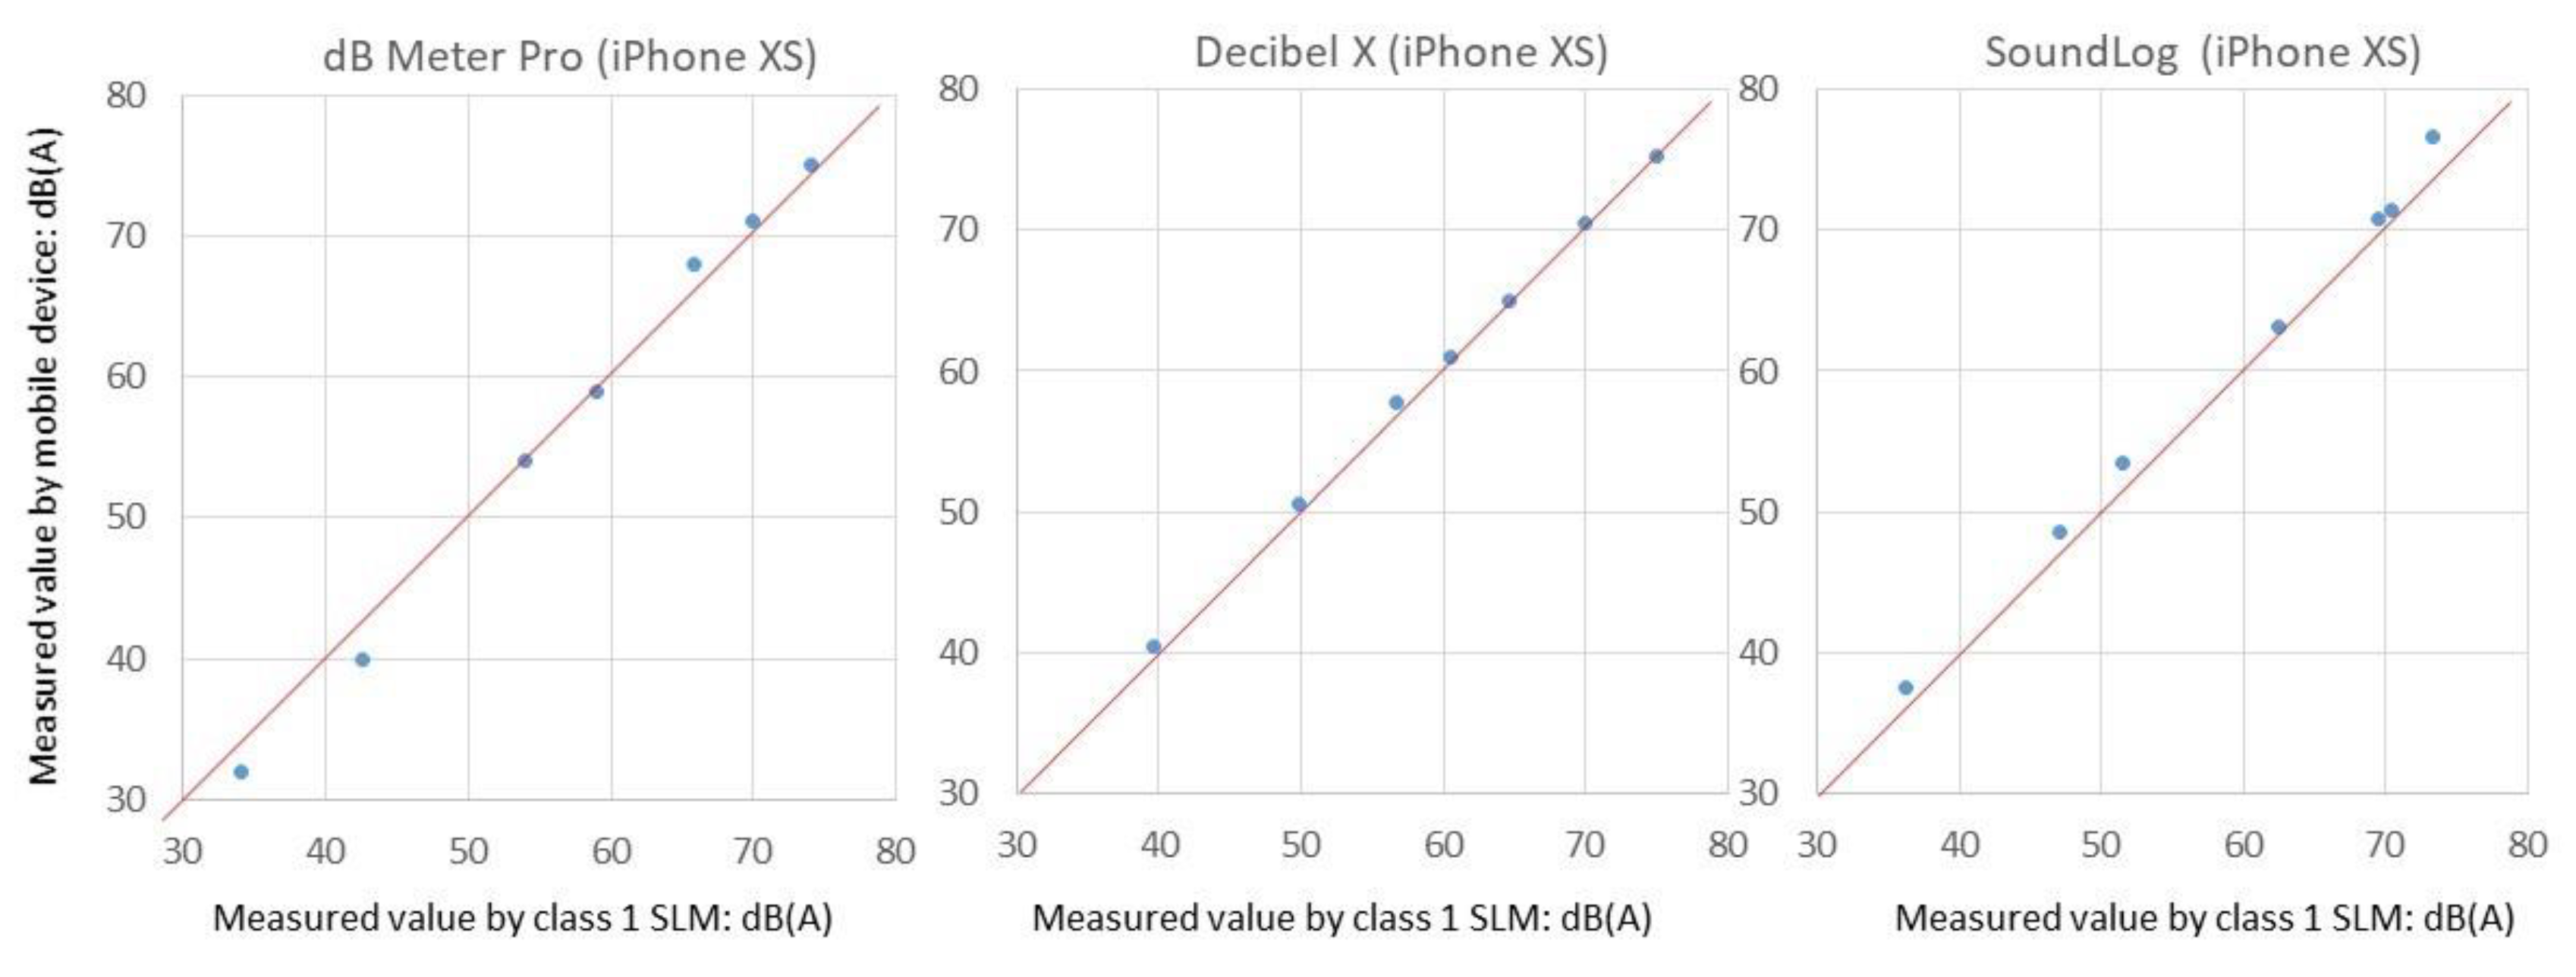
Figure 2 shows the results using an iPhone XS. As is observed in the figure, Decibel X showed the most accurate results: average error was 0.6 dB(A) and maximum error was 0.7 dB(A). The other two showed small but clear discrepancies. In the case of the dB Meter Pro, it only gave the measured values in integers, with no numbers given after the decimal. This was considered as the main cause of discrepancies. On the other hand, in the case of SoundLog, the trimming value was given by 0.5 dB steps, and this could be a cause of an error in the calibration. (Trimming value could be given in 0.1 dB steps in the dB Meter Pro and Decibel X).
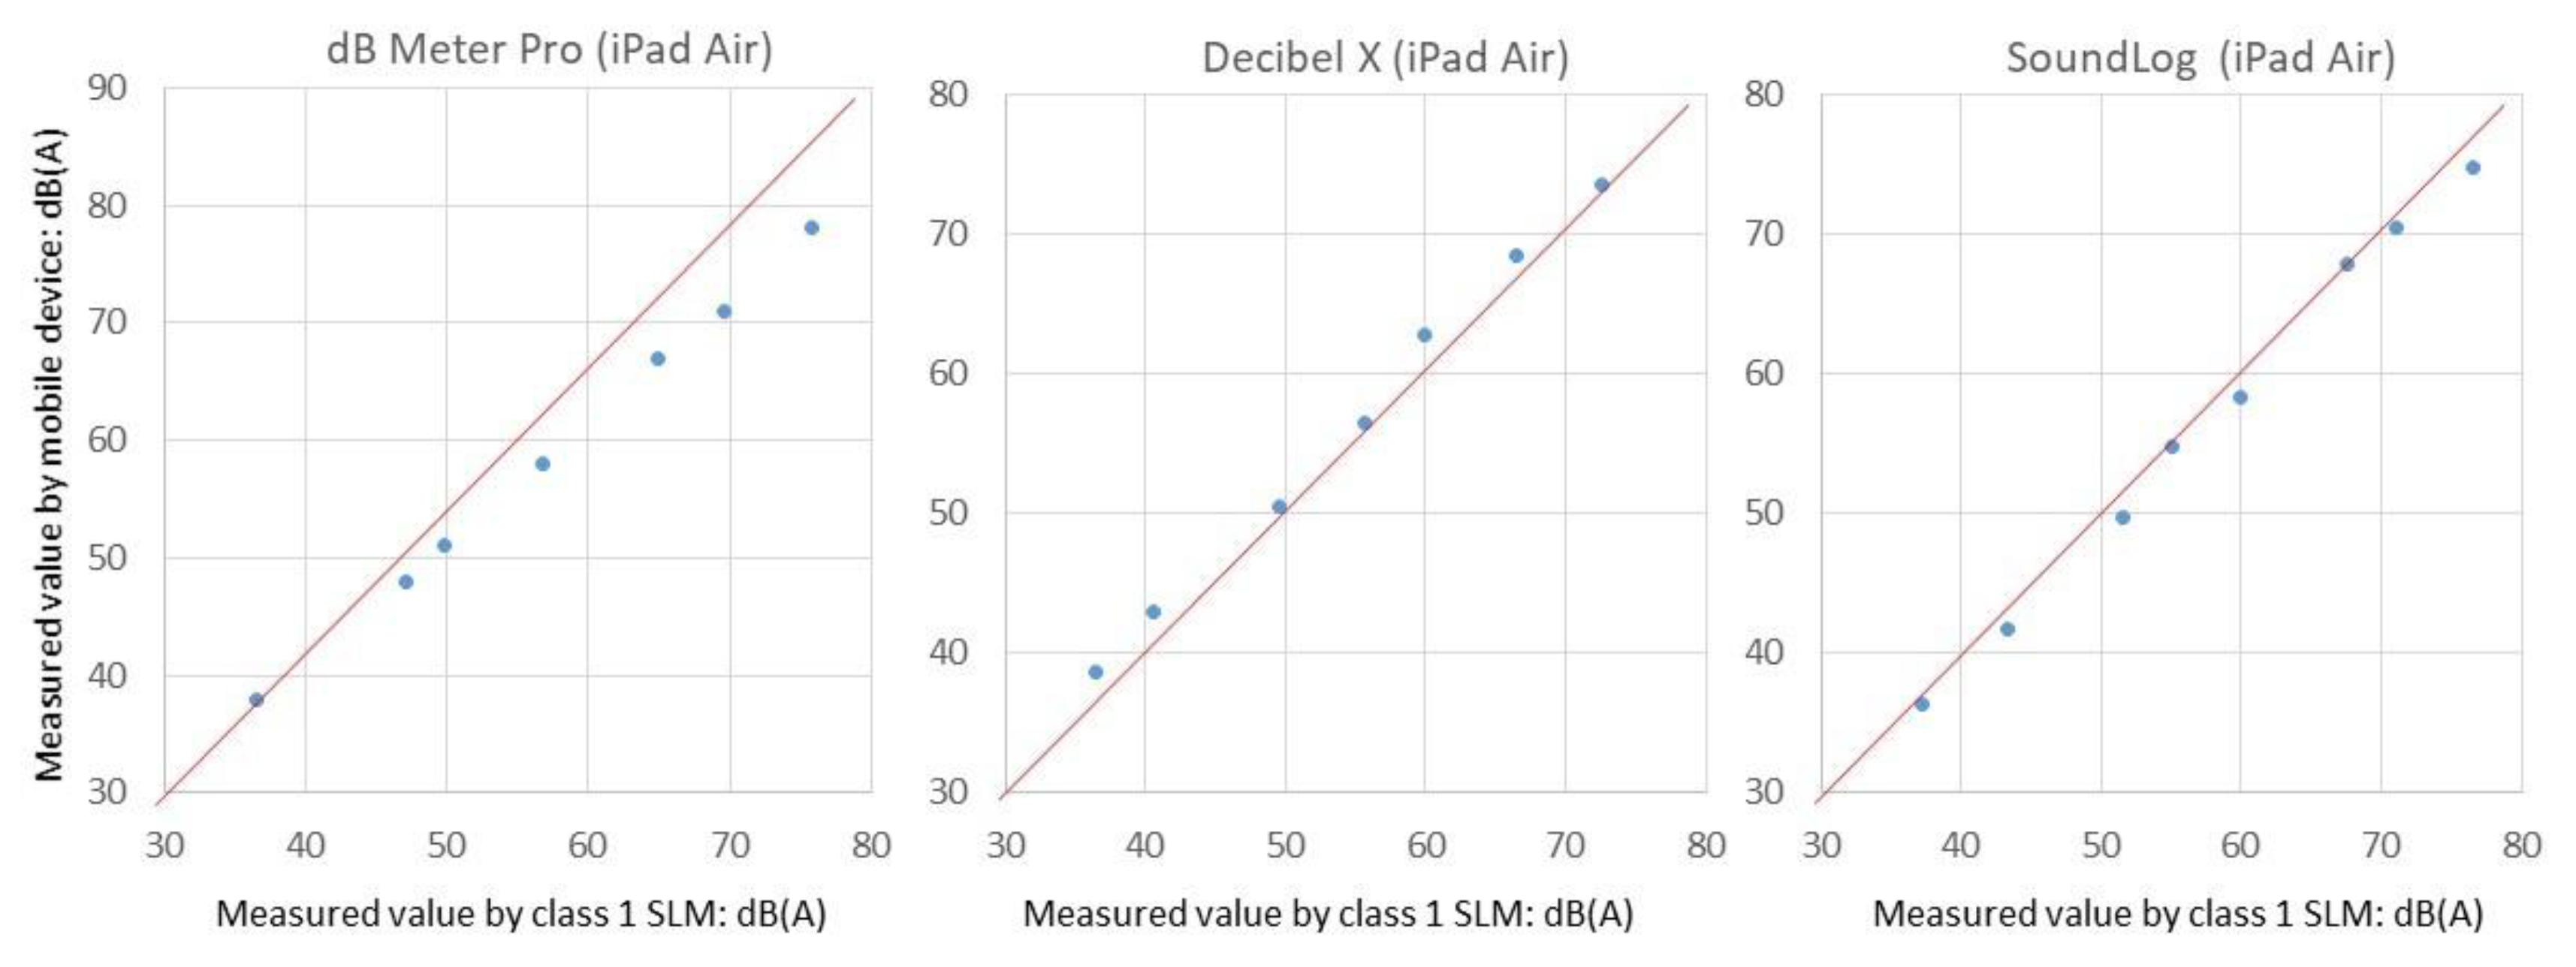
Figure 3 shows the results using an iPad Air. Although the tendency was the same as that of the iPhone XS, the discrepancies were somewhat larger. Similar results were obtained in our previous results in References [
6,
20,
21]. As is pointed out in previous work, the accuracy of applications may become worse when they are used with iPads, and it depends on the version of the device [
6].
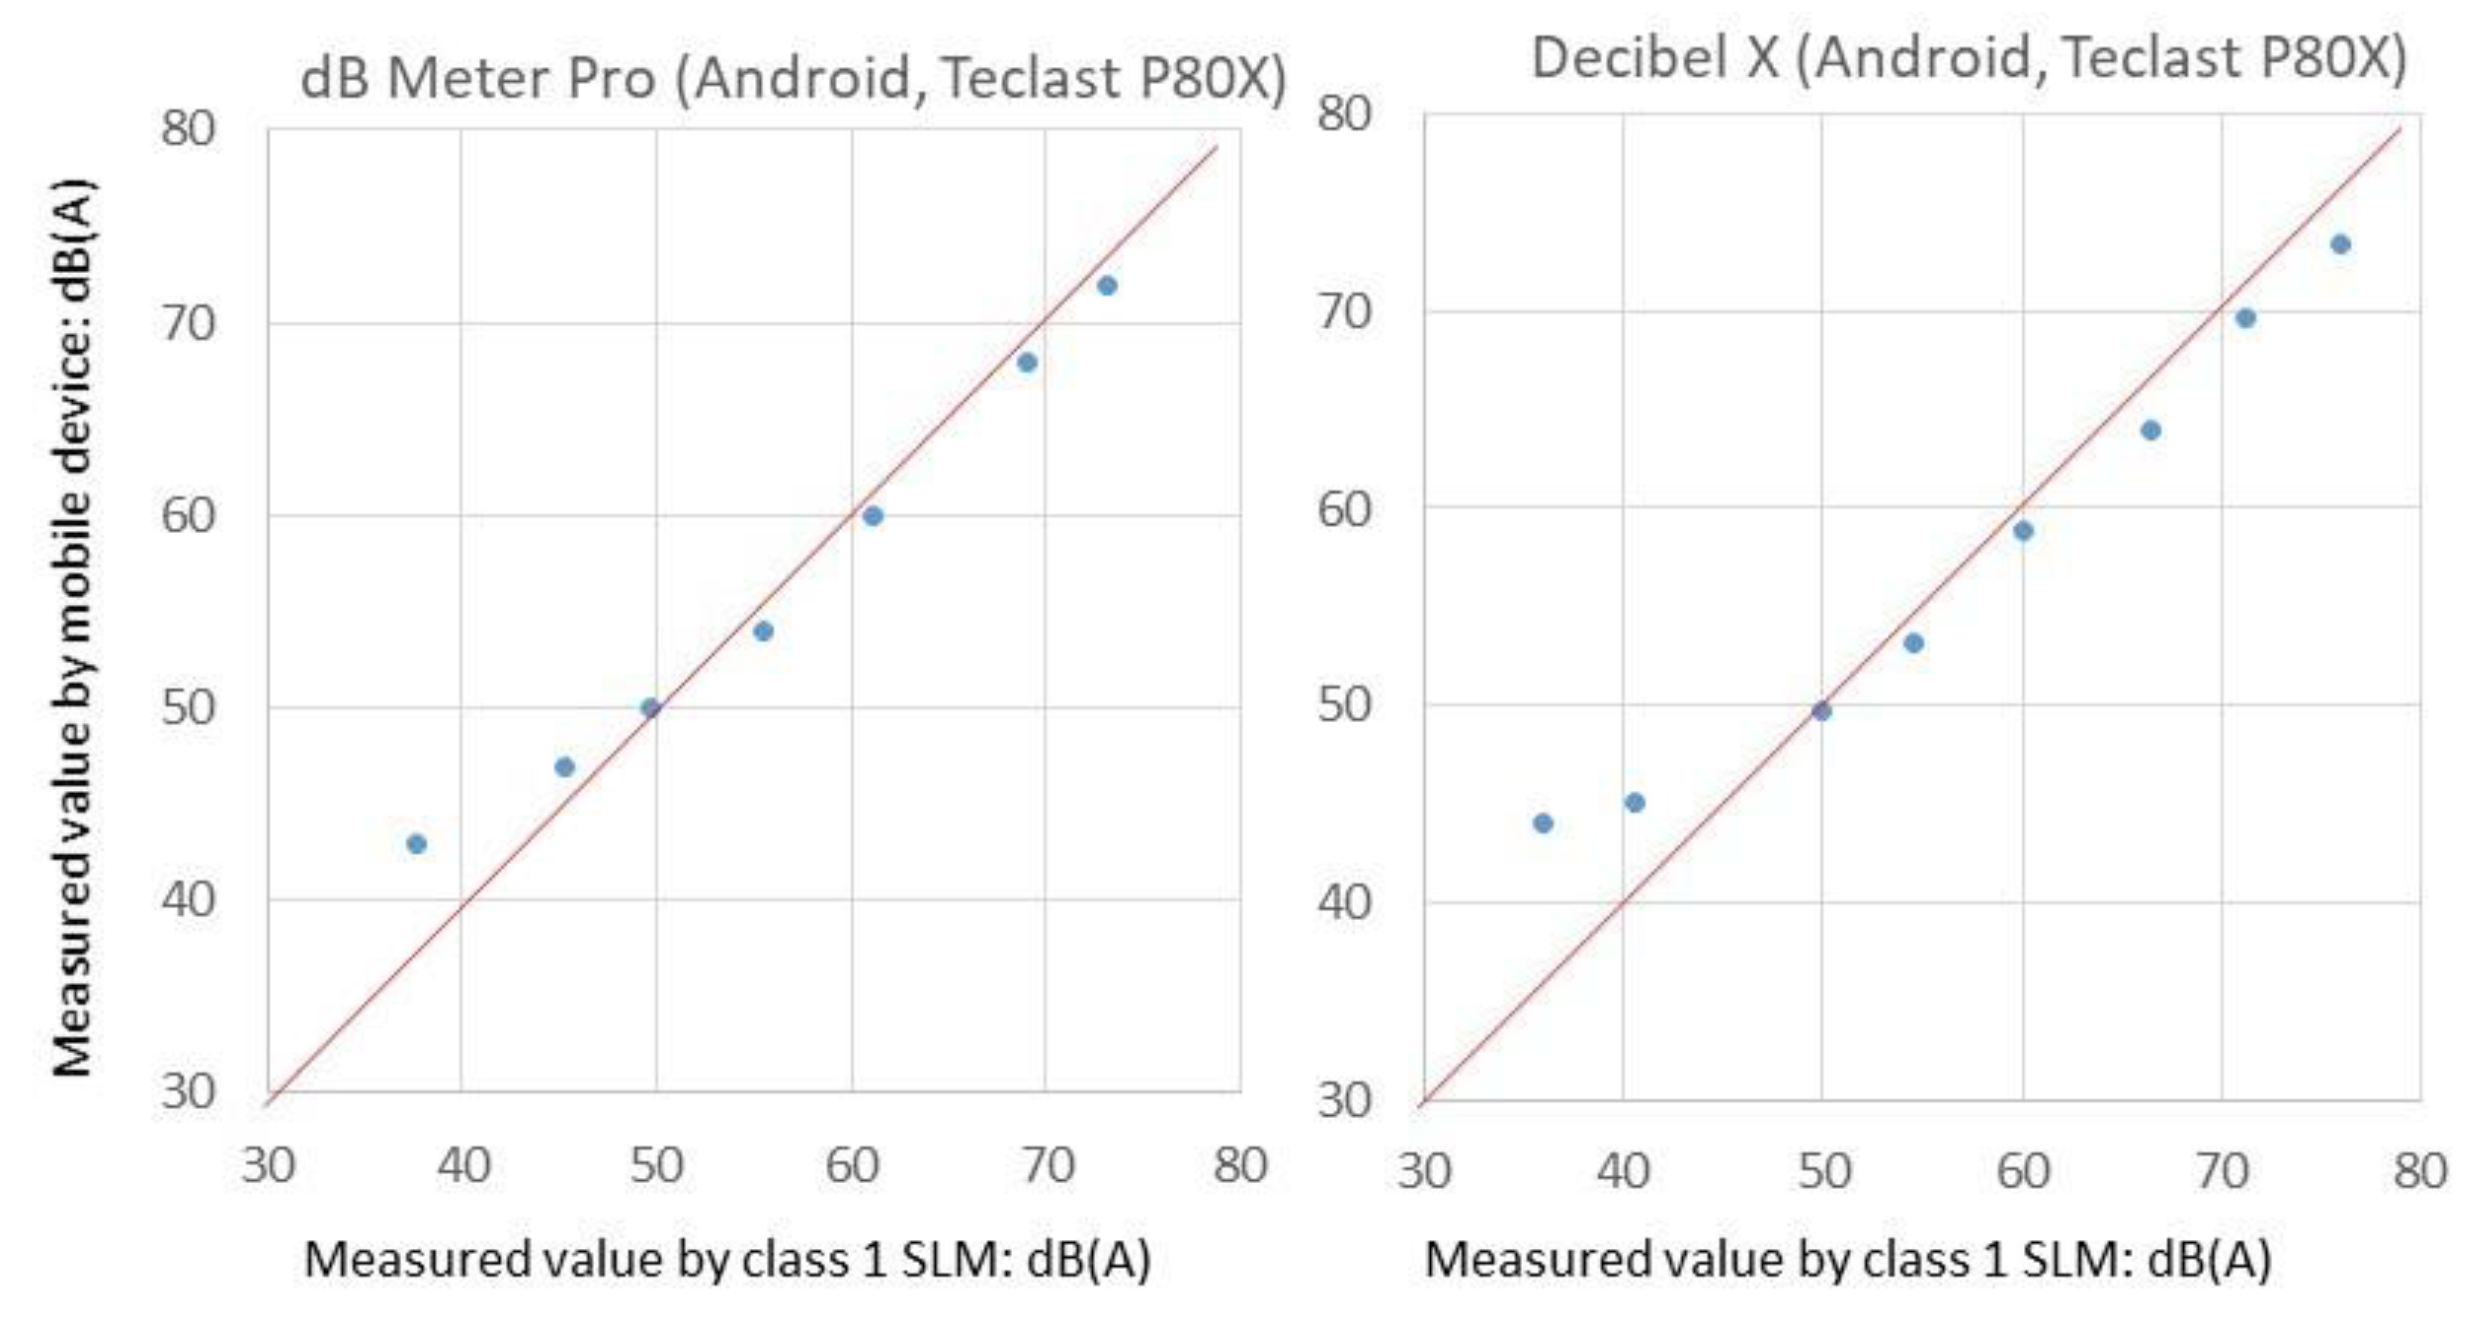
Figure 4 shows the results of an Android tablet P80X for dB Meter Pro and Decibel X (SoundLog is not available for Android devices). At middle to high levels, the discrepancies were smaller than observed in the authors’ previous study [
6,
21]; however, at low levels, the discrepancies were quite large (maximum errors: 5.3 dB(A) for dB Meter Pro and 8.2 dB(A) for Decibel X) and linearity was deteriorated. This was inferred to be attributed to the specifications of the device used in this test. Android devices are manufactured by various manufacturers; therefore, the specifications of audio hardware are different from type to type: some devices can be accurate but others may not be [
21]. Another possible reason is the internal noise of the device; however, this was not confirmed. This should be noted when Android devices are used. Although the linearity was not good at low levels in this case, reversal of measured value was unlikely to occur, so Android tablets may be used, depending on the purpose, after careful calibration.
Based on these results, we decided to use an iPhone XS in the survey for making the following examples. As the results were limited to three devices that were issued recently, the test above was not intended to determine the best device. However, the conclusion in our previous work [
6] comparing iPhones and iPads that the former was better in accuracy is supported. Therefore, it is always possible to use another mobile device, as long as its accuracy is checked beforehand and considered when the results are analyzed.
In the above, we checked the accuracy for measured values of overall A-weighted SPL of pink noise at various levels. This method does not give information about the frequency response of the devices or the built-in microphones. Regarding this problem, in our previous work, we pointed out that the accuracy deteriorated for 125 Hz [
20,
21]. However, for recent iOS devices, in Reference [
6], we checked the frequency response by testing their accuracy using 1/1-octave band noises from 125 Hz to 4 kHz (considering typical frequency characteristics of environmental noise) and observed that the accuracy was almost independent on the frequency. From the results, we can infer that, as for iOS devices, the frequency response of the device is almost flat in the above frequency range or adjusted in applications to be flat. For Android devices, which is not used in the following survey, we did not perform such a detailed test. As mentioned above, Android devices are made by various manufacturers and the specifications are different for each model. Therefore, if testing frequency response is needed, it is possible to obtain a rough evaluation by testing the device using the method in Reference [
6].
4. Examples and Suggested Usages
In this section, we present some examples of the outcome of the survey using the applications selected. Mainly, in the results, geo-referenced sound data obtained from the surveys are supposed to be organized on a map. In light of the principles of soundscape [
2], perceptual comments should also be included; however, here, only the map with the sound data is presented, as it will be used, for example, in educational activities afterwards, for discussion where perceptual aspects will be exchanged. Therefore, the following examples will be assumed to be used for teaching material. Of course, it is possible to record perceptual comments during the survey by the surveyor, if needed.
4.1. Geo-Referenced Sound Data by the Selected Applications
The sound or photo/video recording function during SPL measurements in a field survey is expected to be helpful for checking the situation around each measuring point as well as for plotting the measuring points on a map later to arrange the measured results on a map. In this section, some examples are given of a map with geo-referenced sound data using the applications with such functions.
Here, three examples are given of geo-referenced sound data arranged on a map from the data measured whilst walking on the determined route (similar to a soundwalk) using the three applications with GPS, sound-recording, and photo- and video-taking functions.
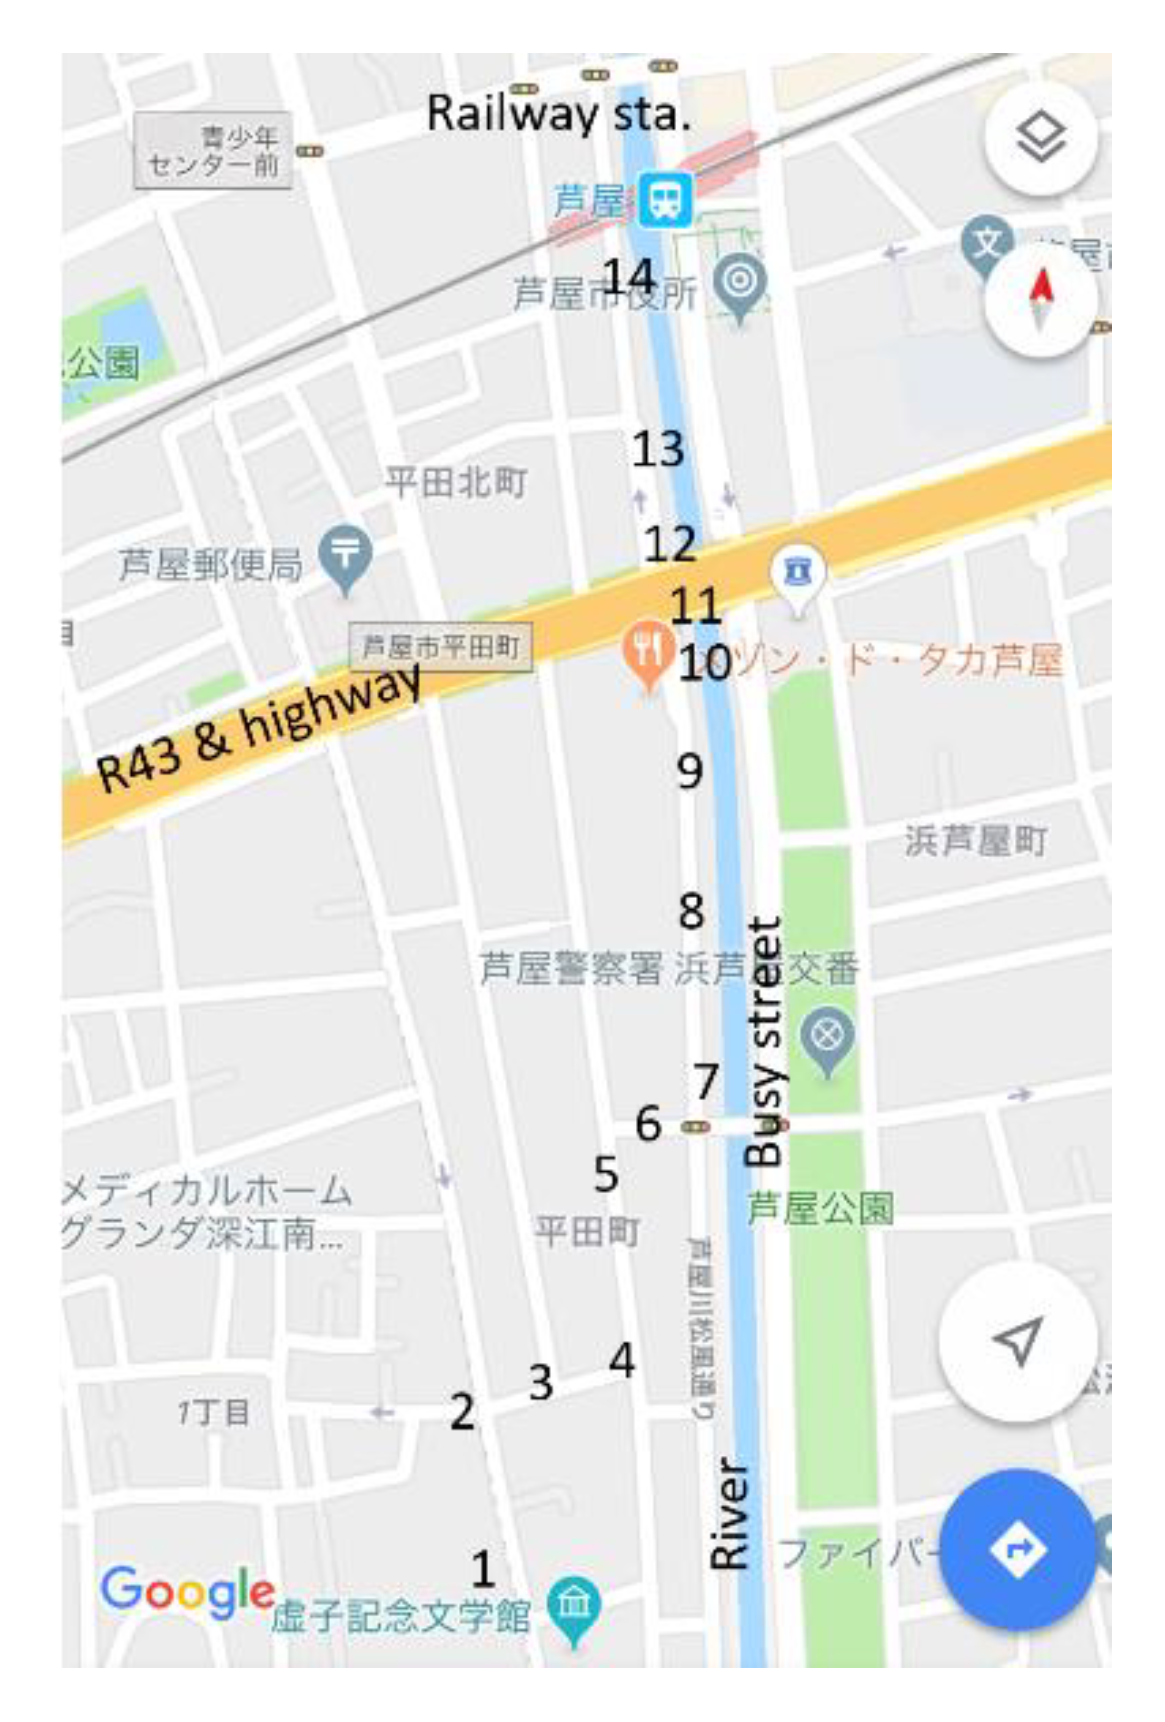
Figure 5 shows the course of the trial sessions. In a preliminary walk, measurement points were determined (Points 1–14). This area is moderately urbanized and is mainly a residential area. There is a railway and busy traffic as indicated in the map. The following examples are not made from data taken on the same day but on three different days. For the measurements, an iPhone XS (issued 2018, iOS 13) was used throughout and applications were calibrated beforehand.
The surveys were performed on calm days to avoid the effect of the wind, and also, we checked that the effect of wind noise was negligible before the surveys.
4.2. Example with Measurements by dB Meter Pro
This application records sound and GPS positioning data during SPL measurements, and the data can be exported as PC compatible files as well as screen shots. GPS data can be helpful to record the location of measuring points. The recorded sound can also be played by the application on the mobile device. This function helps to check the type of sound source; overall impression of the acoustic environment; and the location of the measuring point after the measurements at the laboratory, classroom, etc.
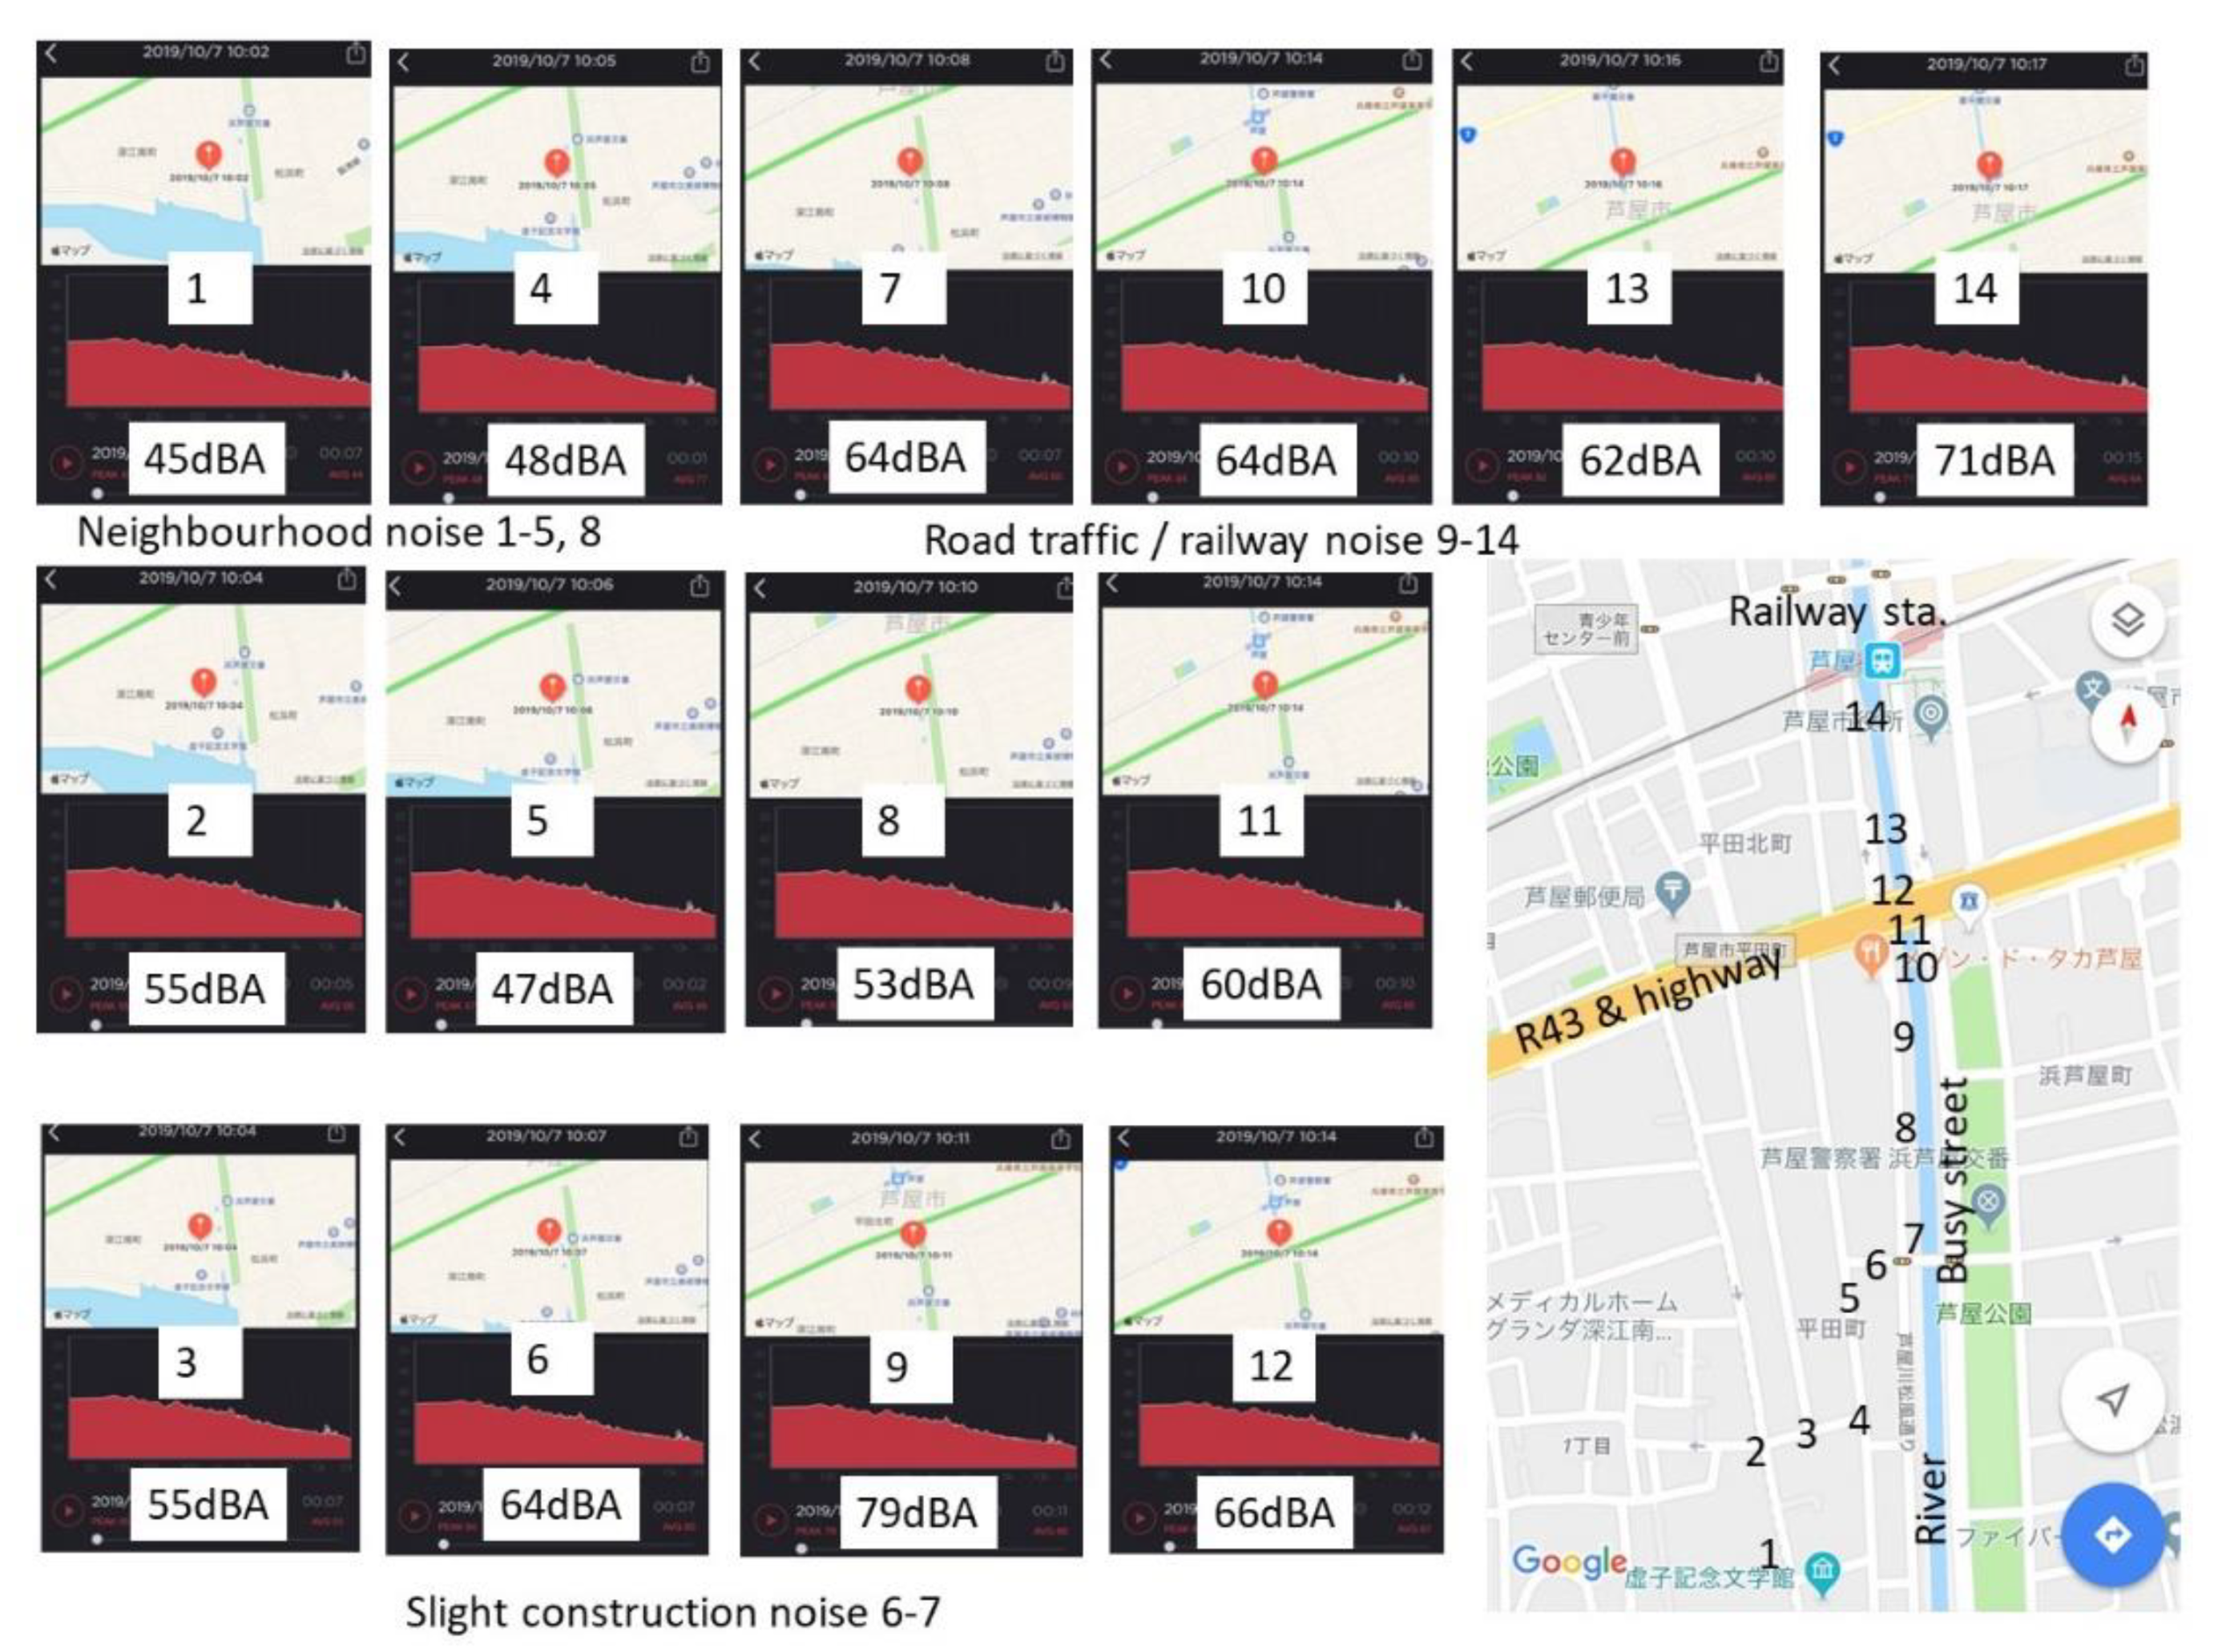
An example of a map with geo-referenced sound data of the above area made with the data taken by dB Meter Pro is shown in
Figure 6, with the measured value of the peak level of A-weighted SPL with slow time constant (dB(A), slow, peak). The screenshots of the data at each point are displayed on the map: on the top, GPS data are shown on the maps; in the middle, red graphs show the power spectra; and the measured value of peak and the average and max SPL are indicated in the bottom with the playback button.
After the measurements, by playing back the recording at all points, the source type and cause of the noise were checked. Points 1–8 were in a rather quiet residential area, although SPLs at points 6 and 7 were higher. By playing back the recorded sound, it was confirmed that these higher levels were due to noise from a construction site near these points. Furthermore, the main type of the noises at points 9 to 14 was confirmed to be traffic noise, and especially at point 9, the level was very high, which was confirmed as coming from a car that passed by during measurement. The high level at point 14 was also identified as a mixture of car noise and railway noise from a train approaching the station. In this way, playing back the sound recording was helpful and useful to organize the measured data.
One problem is the accuracy of GPS data: the locations of points 9–12 were rather difficult to discriminate, and errors could be observed when compared with actual points indicated on the map. There were also some deviations with others points from the actual positions observed. In this measurement, the smartphone used was connected online using a 4 G (LTE) network (no Wi-Fi connection was available.) In this case, some errors were observed in GPS data, for example, in some cases, if one moved a few meters with the device while taking measurements, GPS data could not be obtained at all.
When GPS data are not required, it is of course possible to measure SPL as one walks while recording the sound. This may also be used for a method “to collect sounds” as the application records SPL and time, which can be exported as a csv file; therefore, one can trace back the SPL at some point by using these data if time is also put down on a notebook by the experimenter during a measurement.
Finally, this application shows the sound power spectrum, which may only give the outline of spectra, but it may help to see which frequency range is dominant.
4.3. Example with Measurements by Decibel X
This application has a distinguishing feature in that it can take photos or videos whilst measuring SPL. A photo taken by this application includes the measured SPL and the address (only the name of city in the iOS version but detailed street address in the tablet Android version) of the measurement position suggested by GPS (note that raw GPS data are not displayed or recorded). Therefore, just looking at a photo reminds the surveyor of not only the measured SPL but also the position where the measurement was carried out. The record of the name of city is not sufficient, but photos can provide detailed information about the measurement position. By taking a video instead of still photos, one can also listen to the sound and see the situation around the point after the measurement, which is helpful for checking measured sound level data as well as the visual environmental conditions of the point.
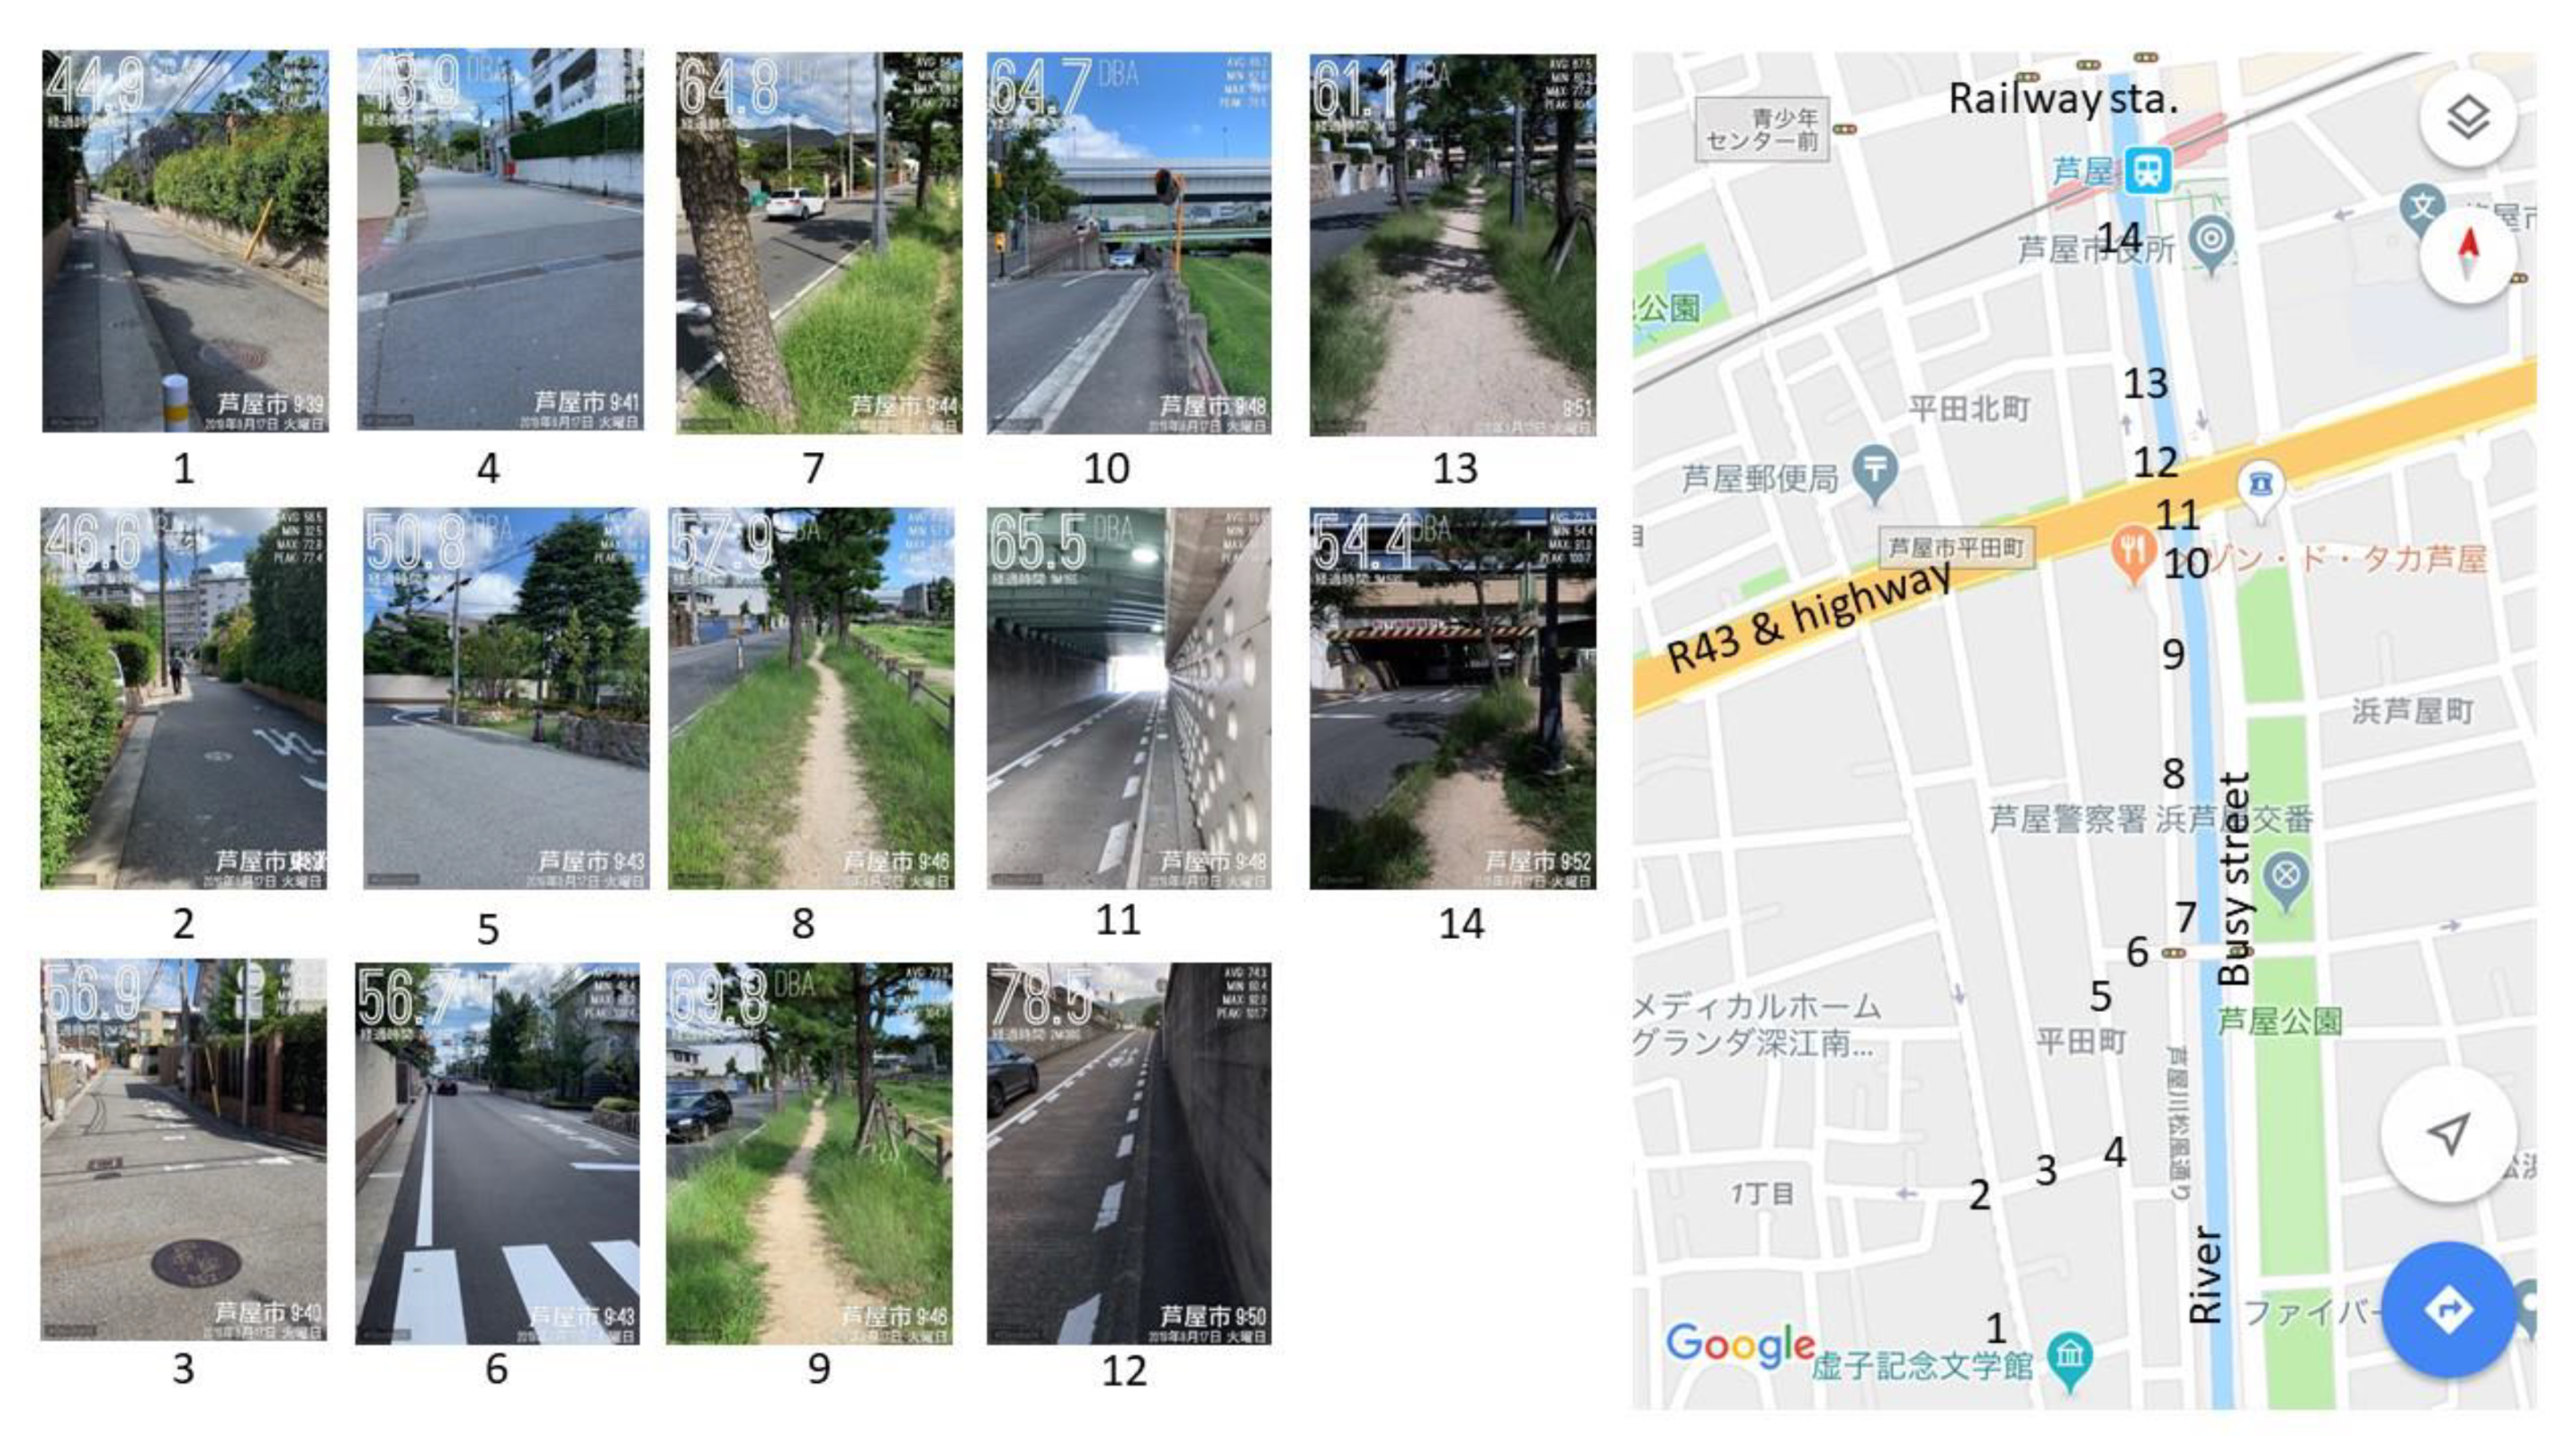
An example is shown in
Figure 7. Looking at the figure, one can understand the situation around each measuring point with photos taken there. SPL and location, which were also measured, are indicated in the photos. The photos are quite useful to confirm the measuring point.
Interestingly, the photos of points 7 and 8 visually include the most greenery, but the SPLs were rather high. This was due to the road traffic noise from the busy street along the river. In this way, visual information from photos offers interesting opportunity for discussion in a classroom when used for educational purposes and is also usefully employed to better understand the environment of the area.
In this example, only the name of the city was given in the photos, as the smartphone version was used, but in the tablet version, detailed street addresses are printed in the photos, which is helpful to confirm the measuring point.
This application also shows the sound power spectrum on the main screen, but it may not be seen when the application is used in the photo-taking mode.
4.4. SoundLog
This application neither records sound nor takes photos or video, but the display measures Leq(A) every minute as a time history. The graph showing the measured results is rather rough and intuitive; therefore, this application is not suitable for quantitative surveys. However, the graph shows variations of temporal fluctuations of Leq(A).
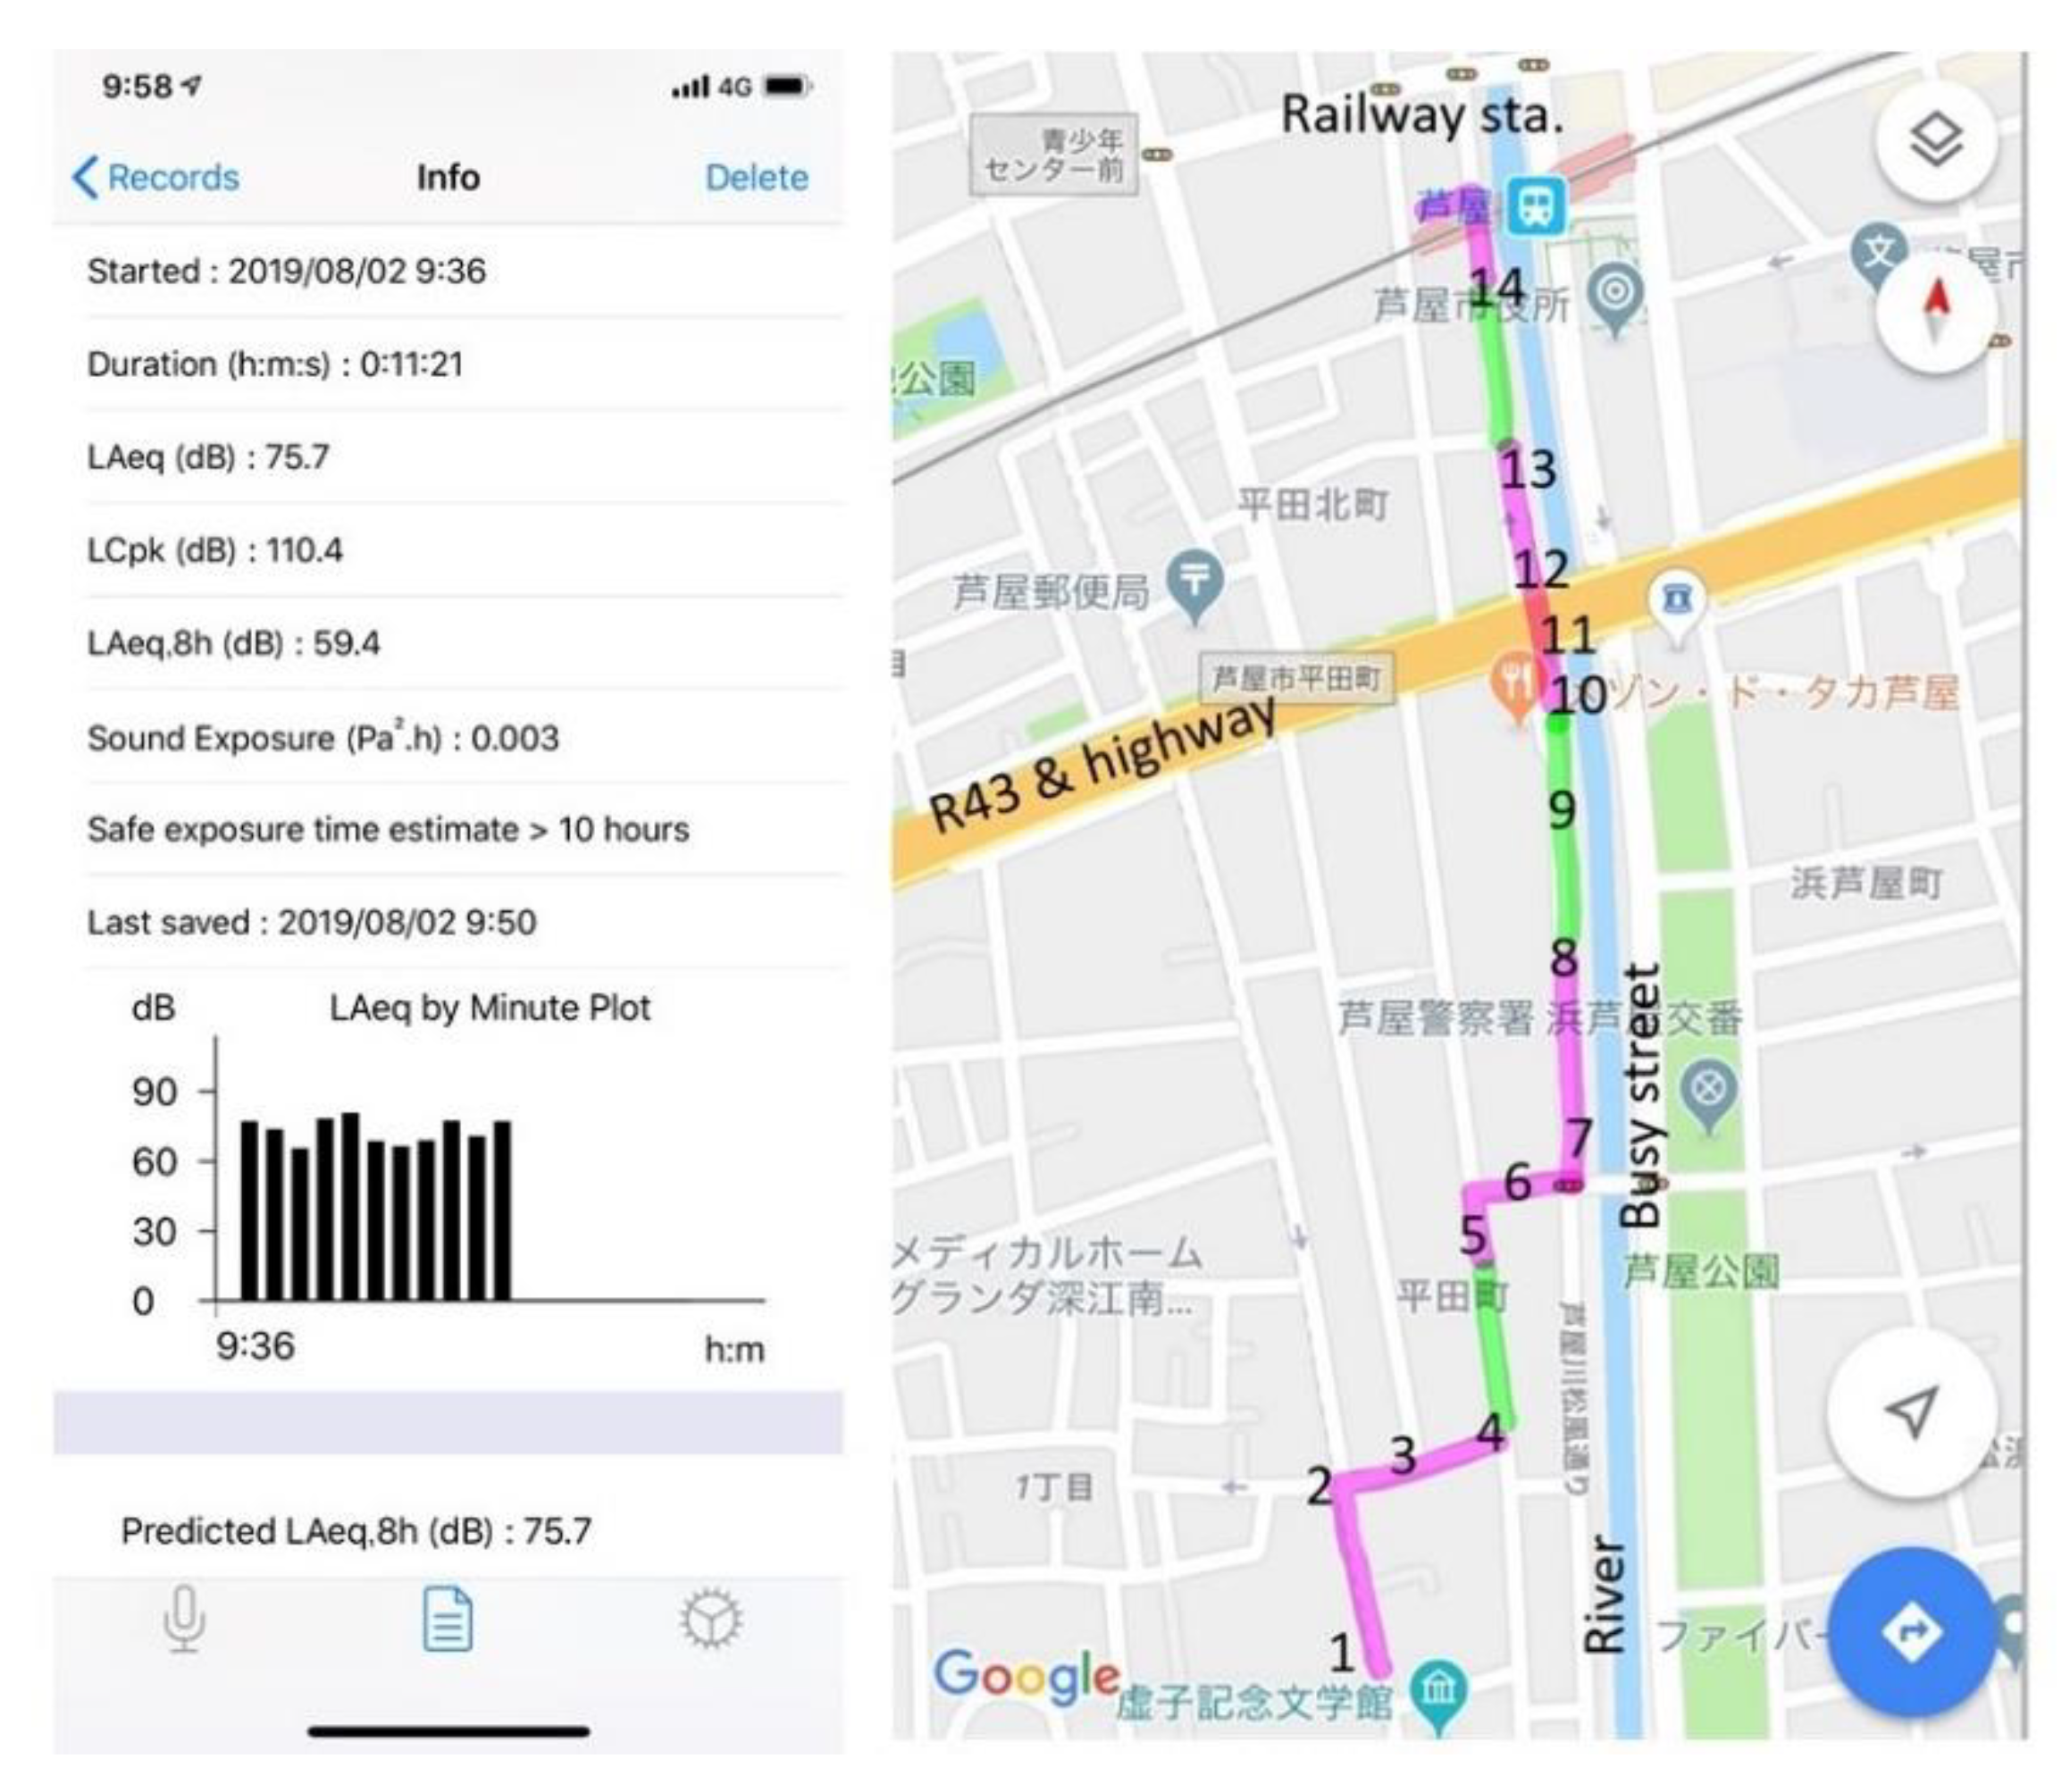
An example of a map with geo-referenced sound data using this application is presented in
Figure 8. In this survey, this application was running whilst the surveyor was walking through the course and the time at each measuring point was noted on the map by hand. In this way, the geo-referenced sound data are arranged in the map. This map could provide a rough distinction of a “quiet area” and “noisy area”. In this map, the pink zone indicates the area with Leq(A) larger than 70 dB (A) and it was identified, by on-site observations, that the cause of such a high SPL was the sound of cicadas: this survey was performed on a very hot day in midsummer, and there were many cicadas on the trees around the course. Information like this provides a topic for discussion on the “attitude” towards various sounds afterwards in a classroom.
4.5. Fixed Point Observation
In the above, examples of maps with geo-referenced sound data by soundwalk-like methods with mobile device are presented. Another method to be considered as a use of these applications is fixed point observations, in which a surveyor takes video, sound recordings, etc. while measuring sound levels several times at the same point. In so doing, one can see the change of sound levels as well as changes in sound sources and situations around the point.
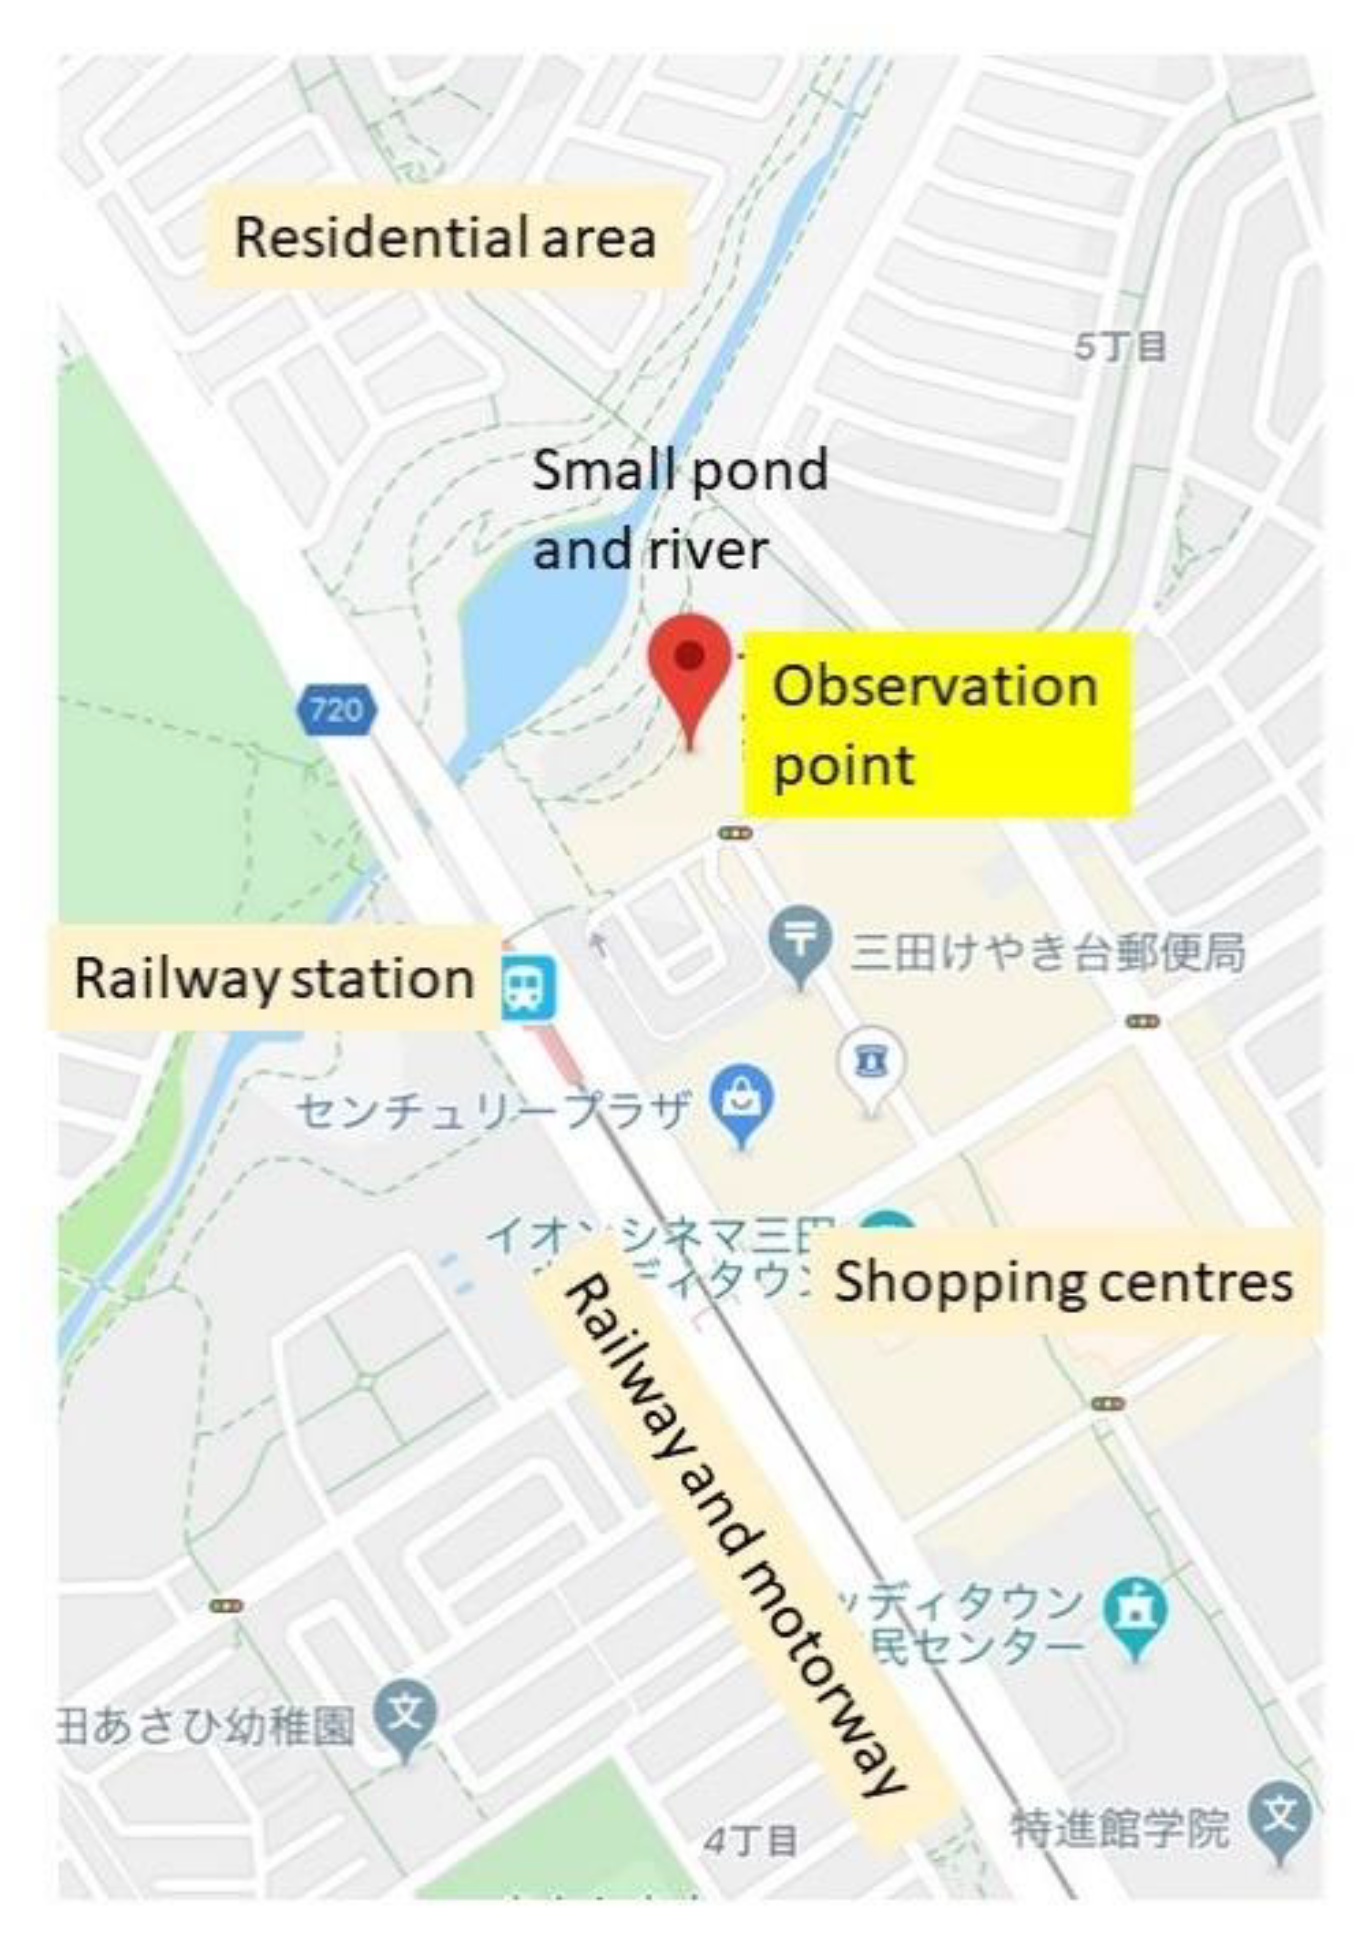
Here, an example of a fixed point observation using Decibel X is presented. In this trial, videos were taken during measurements at the same point indicated in the map shown in
Figure 9. The duration of the video was 10 s.
The observation point was on the balcony of a room on the sixth floor of a six-storey building in Sanda city, Hyogo prefecture, Japan, which is in the suburb of Kobe city. This hotel is surrounded by a park and car parking, and there are no tall buildings near it. It is a rather new residential area with mainly two-storey houses.
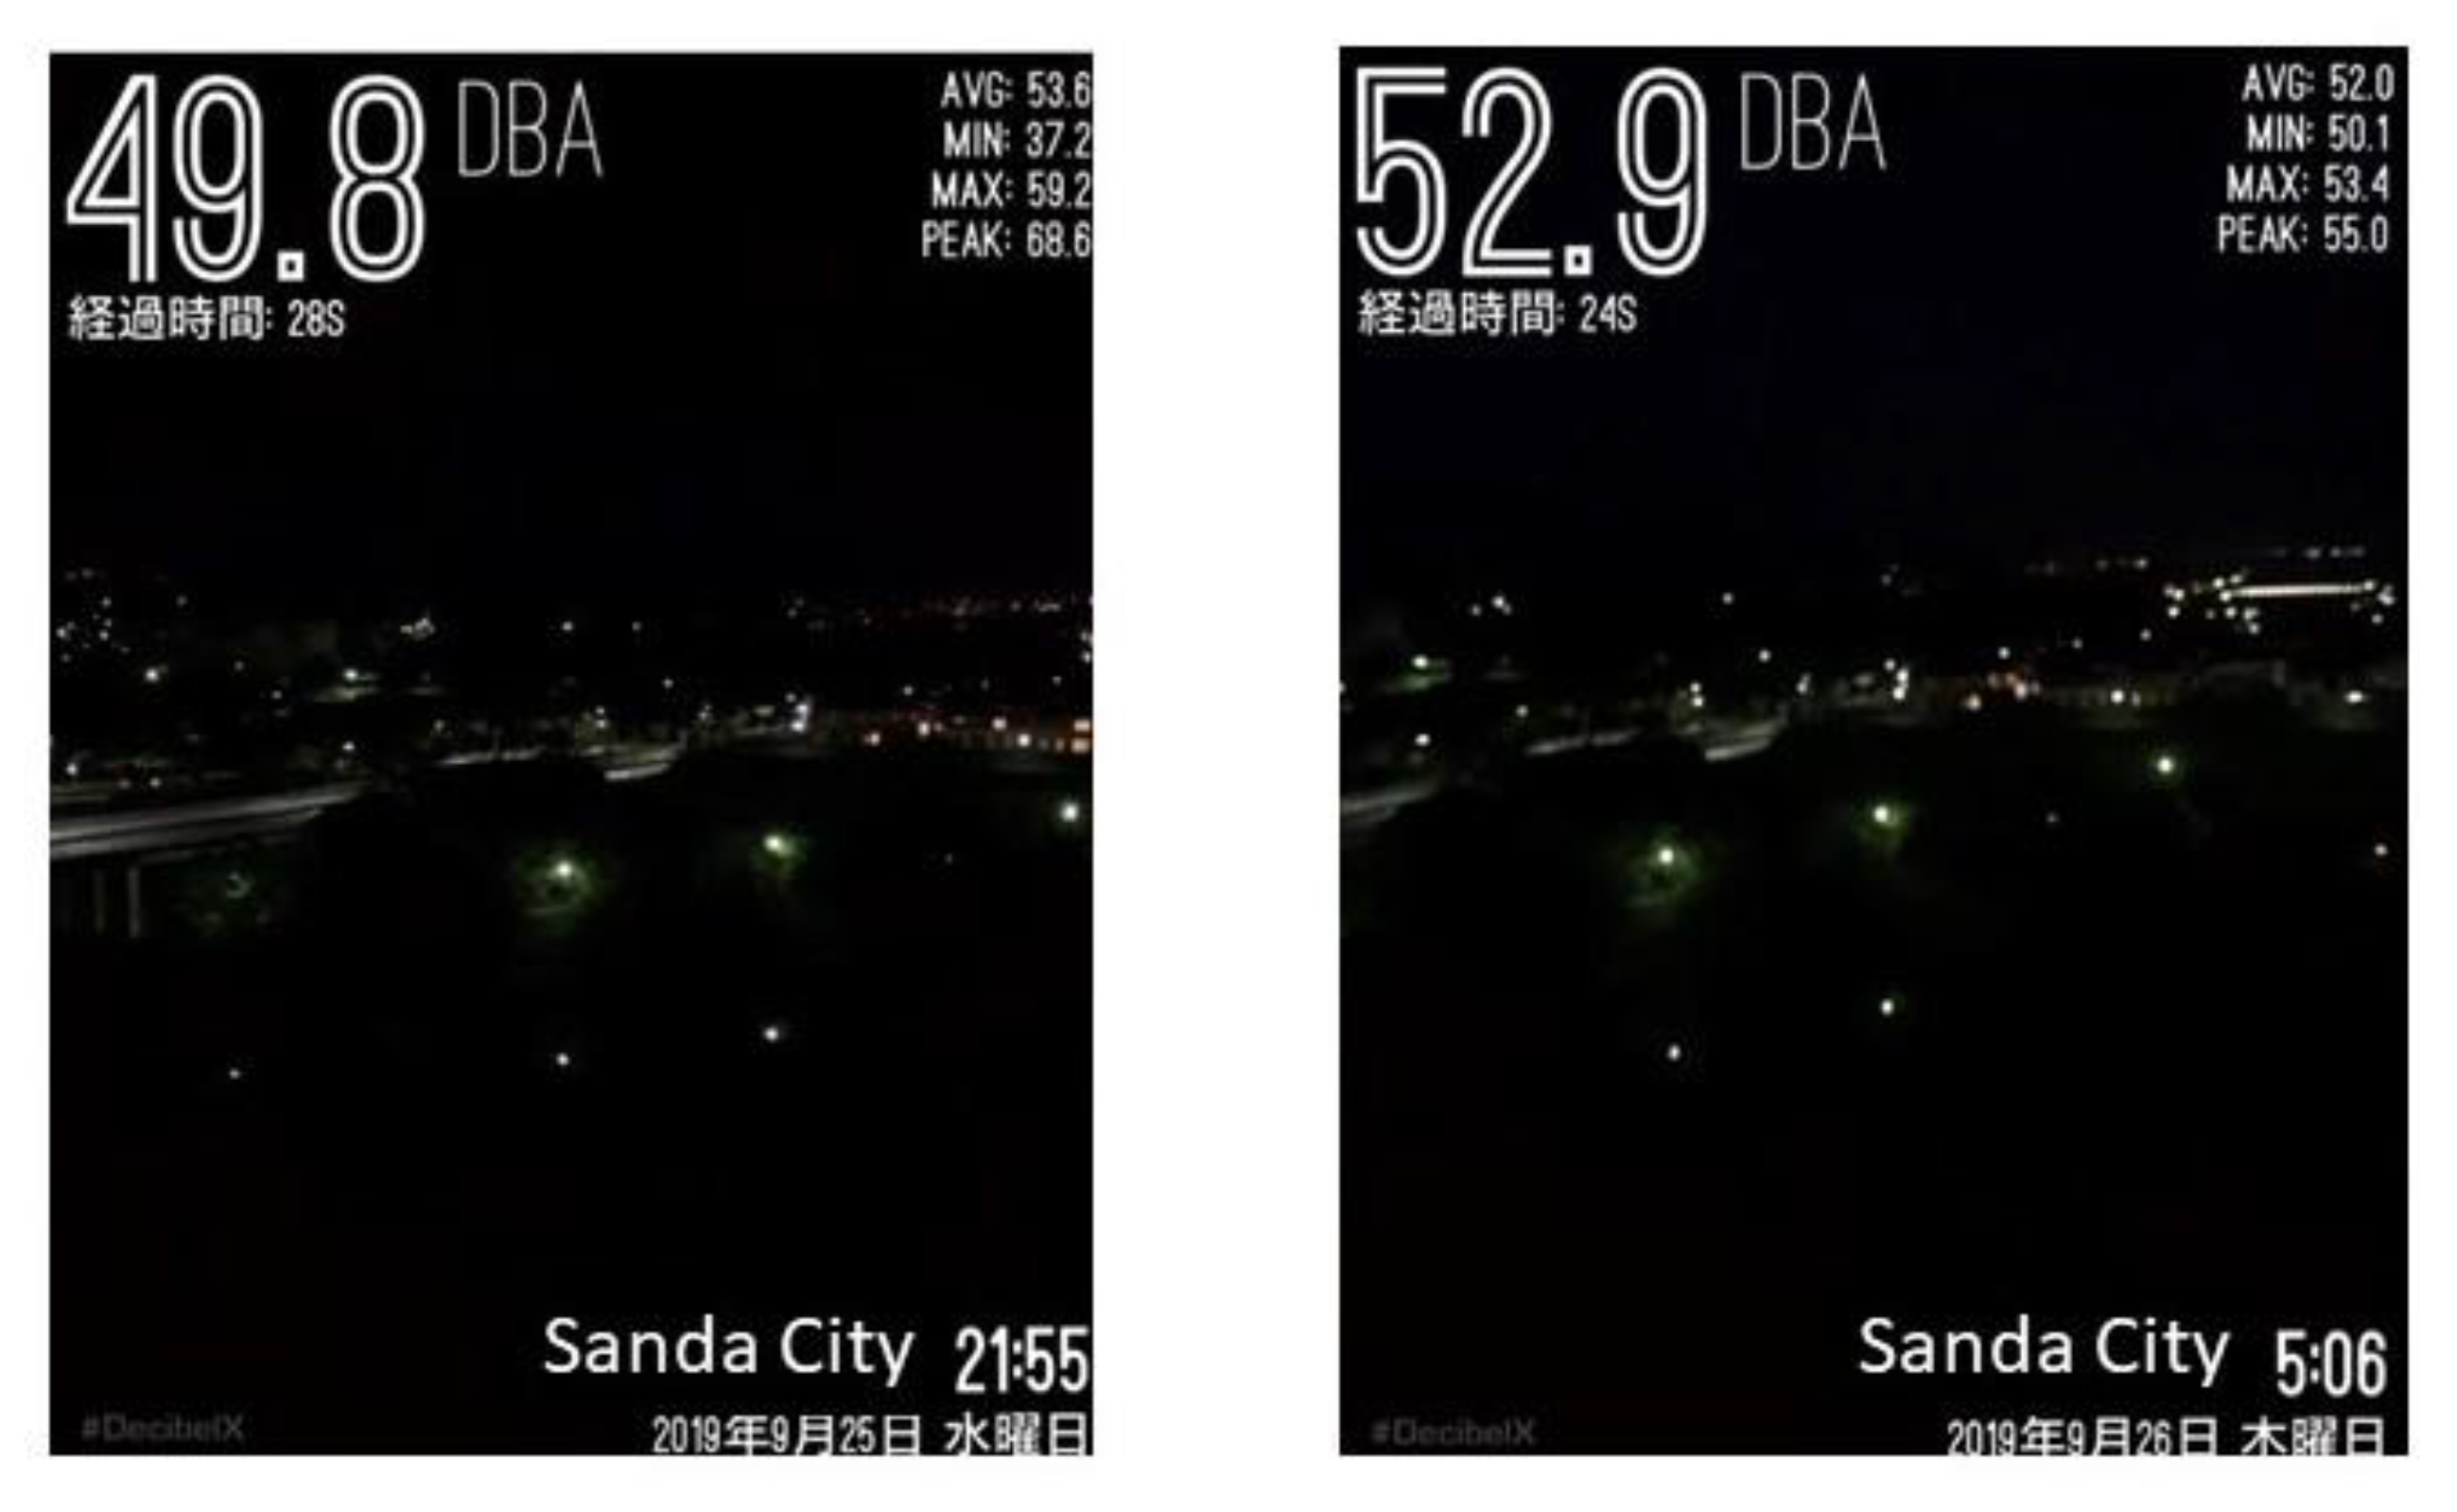
The examples of the snapshots from the videos taken at the observation point are shown in
Figure 10. One was taken at night (21:55), and the other was taken in the early morning (05:06). In the night, a few cars passing by were observed but the sound level was lower. The main sound source was the sound of insects, which was at almost a steady level. In the early morning, cars were rarely passing and no car was observed during this measurement. However, the sound level was rather higher. This was also the sound of insects, but comparing the sounds of the two videos, it was understood that the sounds were different. In the early morning, the different types of insects caused characteristic sounds and the sound was relatively greater than in the night. The videos were short but long enough to perceive these differences.
In this trial, only two samples were taken as this area was basically quiet and few other sounds were detected. However, it gave us some more findings compared with, for example, busy areas with various sounds. Although the device used could take only 10 s of video, taking video offers various applications for educational purposes. As mentioned above, the “Pro” version can take longer videos, which should be useful for more detailed surveys.
4.6. Summary
In this section, the examples of a map with geo-referenced sound data are elaborated, using the measured data of SPL as well as some additional data such as recorded sound, photo, video, and time history provided by mobile device applications. Arranging geo-referenced sound data on a map can be done without those additional data, but those data can be useful information for confirming the situations around measuring points, checking main sound sources, etc.
Additionally, they provide good opportunities for further discussion in the field of education. Not only using these applications but also simply taking videos by built-in cameras in devices to collect sound samples are useful for sound education programmes, e.g., one with sound quiz or group discussion activities as reported in References [
16,
19]; when there is a need to combine SPL measurements, an application such as Decibel X (Pro) will be an alternative for the programme. As for the sound spectra presented by dB Meter Pro and Decibel X, they can be used to “see” the frequency component of the sound in some cases. In this way, the application can be used in multisensorial environmental education and surveys [
34].
Regarding GPS data, the accuracy is often somewhat problematic, mainly because of the latency caused by various factors [
35], including position of mobile phone base station. There are studies for elaborating the system to overcome the latency, for example [
36], and may overcome this problem in the future.
In this way, mobile devices can offer various possibility for sound education, especially urban acoustics education, for both primary/secondary education and engineering-oriented higher education, depending on educators’ ideas and teaching plans.
5. Concluding Remarks
In this paper, some examples of geo-referenced sound data arranged on a map with additional information such as recorded sound, photos, etc., using mobile devices during soundwalk-like activities, are presented. Three commercial applications, which are easily available, are tested for their accuracy and usability, and they are actually used in the above experiences.
Each application has a significant feature; therefore, users are advised to choose one of them considering the function necessary for their educational programme or purpose of the survey. For example, if the sound recorded with measured SPL is needed, one with a sound-recording function is suitable, but if visual information of the situations around the measuring point is of interest, one with photo- and video-taking functions is also available. In this way, various programmes for education of urban acoustic environments can be organized.
As the methods and usages presented in this paper are not only limited to outdoor environment surveys, they can be also applied to indoor acoustic environment surveys with sound collecting activities, which may be necessary in primary or secondary education as well as engineering-oriented higher education institutions.
In this work, we used applications to measure physical values only, and collecting perceptual data was either done while the measurement used a field book or played back the recorded data afterward to discuss. In order to develop more elaborated educational activities, it is desirable to include a function to collect perceptual data, even a simple note or comment. Therefore, more integrated applications collecting also perceptual data, such as Hush City [
27] or Noise Capture [
28], will be in demand for educational purposes as well. This will be one of the future tasks.
