Mapping the Sound Environment of Andorra and Escaldes-Engordany by Means of a 3D City Model Platform
Abstract
:1. Introduction
2. Real Operation Andorra Acoustic Data
2.1. Measurement Equipment Requirements
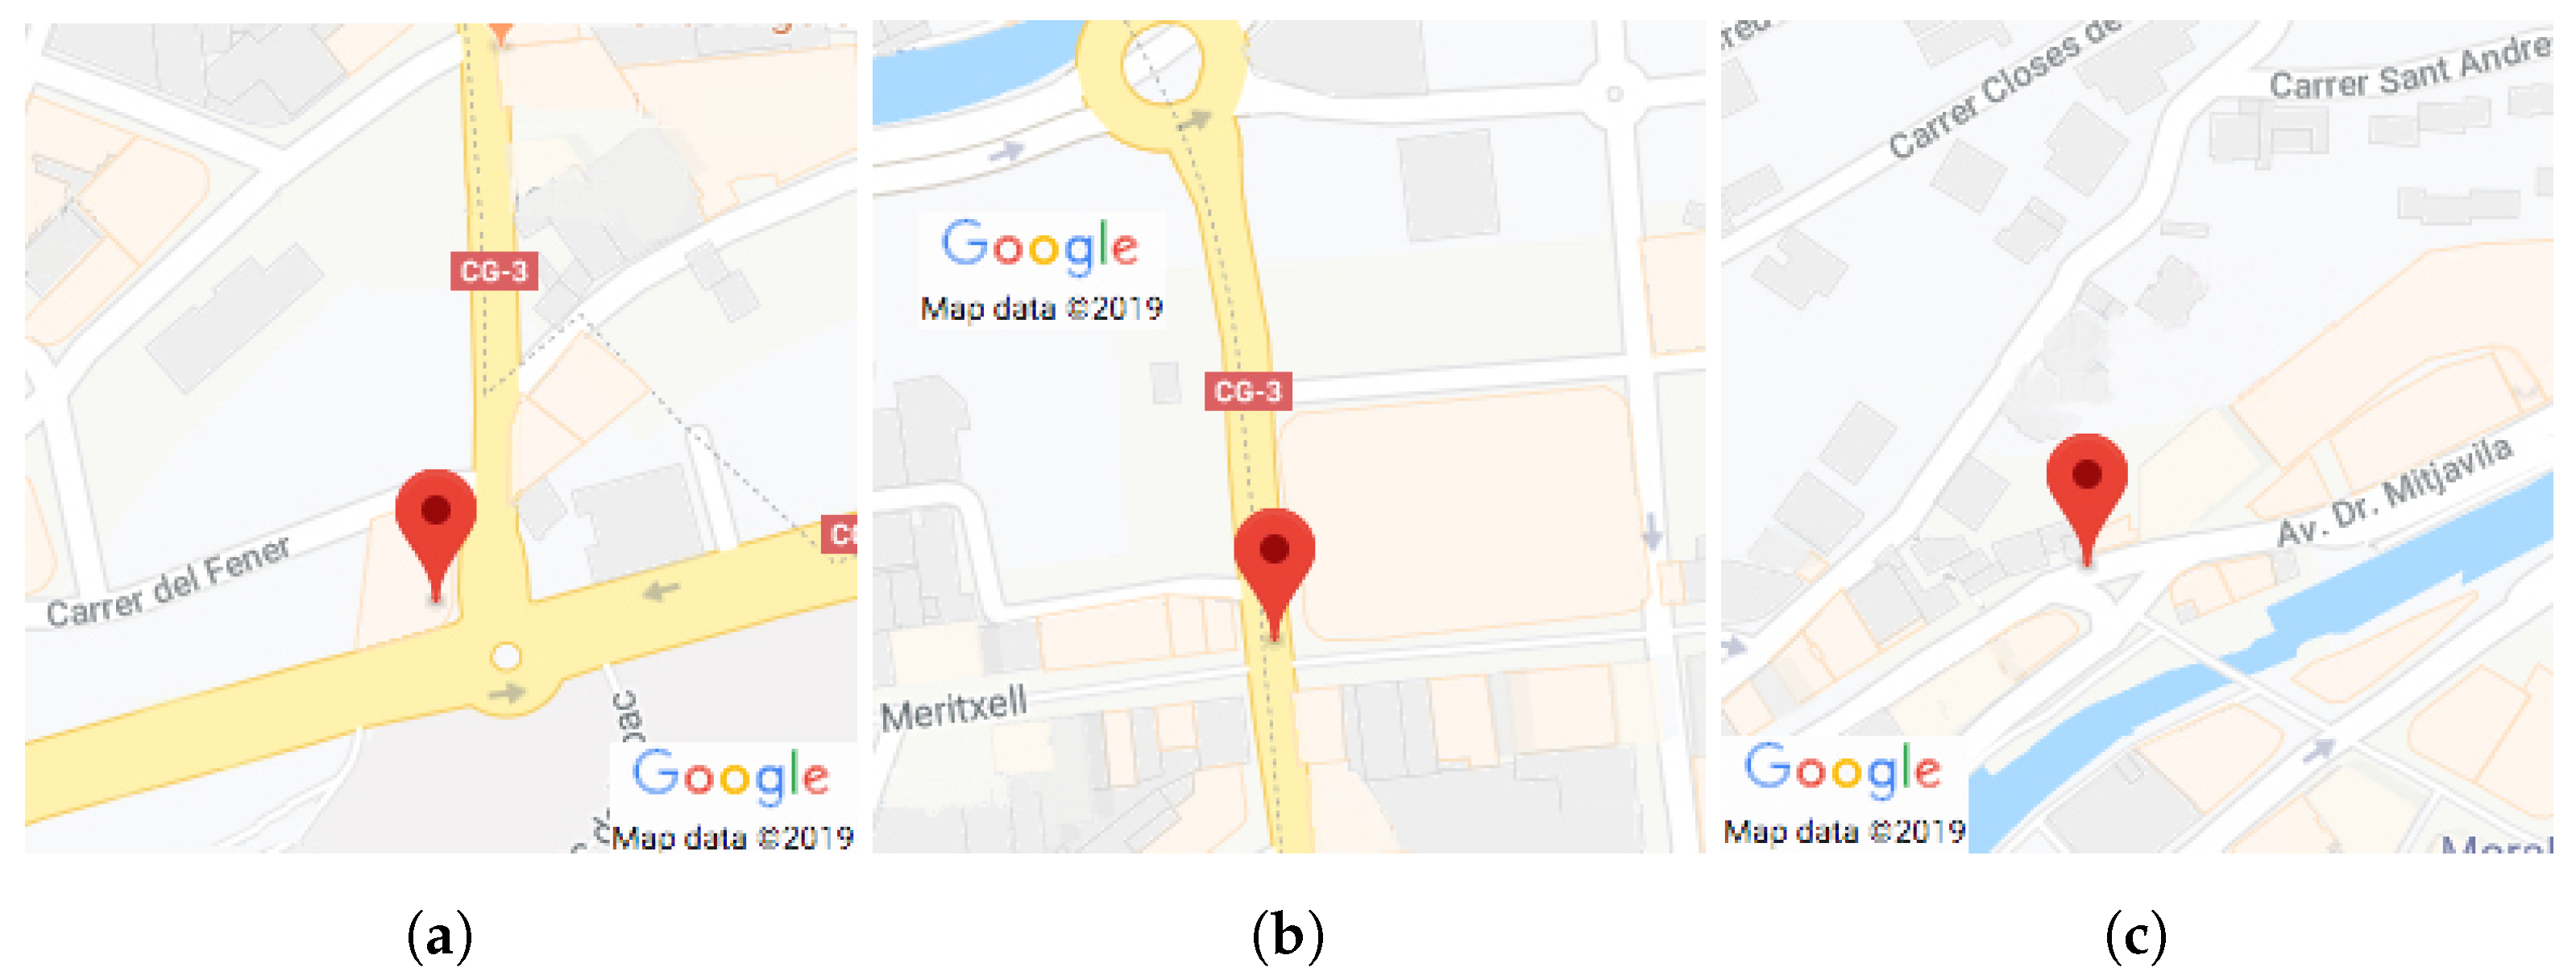
2.2. Recording Locations in Andorra and Escaldes-Engordany
- Location (a), found at 3024.0 N 3202.5 E (see Figure 2a), is a key point connecting the three main roads of Andorra in the capital [35,36]; it has the heaviest traffic during rush time, especially during weekdays. The principal source of noise was expected to be traffic, so it should have constant high equivalent levels of noise and a lower variation of noise sources compared to other areas during the mentioned rush hours and will only decrease as the day goes by.
- Location (b), found at 3030.8 N 3202.8 E (see Figure 2b), is the intersection between a main road named CG-3, which leads the traffic from Andorra La Vella and Escaldes-Engordany to the northern part of the country, with a wide pedestrian and commercial axis. This is not only a traffic area like Location (a), but one of the most common promenade points for Andorrans and also for tourists. In this area, the number of potential noise sources is wider also during the entire day, which consequently increased our interest in obtaining effective mapping results. Location (b) is of great interest since it recently became the biggest pedestrian area in the country, making it a key point to study the noises that occur in and around it.
- Location (c), found at 3032.3 N 3143.9 E (see Figure 2c), is also the crossing of a main road and the final part of a pedestrian and commercial street, similar to Location (b). The difference with Location (b) that this street is not totally pedestrianized, since it depends on traffic lights for people to cross the road. Therefore, we expected a high variability of noise sources during the day as reported in Location (b), but with the additional street works detected during both days of the recording campaign due to different circumstances, creating a totally different noise dynamics for further analysis.
3. Data Description and Categorization
3.1. Exhaustive Labeling of Events
3.2. Categorization of Street Noise Events
- Vehicles: Noise sources coming from any kind of vehicle, albeit without an engine. This category was chosen as all of the measurement points have a road nearby where a significant density of vehicles circulate every day, so traffic plays an important role in acoustic pollution.
- Works: Noise sources related to street or construction jobs. This category is defined to consider construction works located near the recording points and helps to characterize the contribution of construction to the impact of sound on the population.
- City life: Noise sources from typical events occurring in an urban area (other than vehicles) that helps to provide a wider context to the measurements taken and the local surroundings. This category comprises noise events coming from traffic light emitters, sirens, or music coming from commerce or cars.
- People: Human noise sources. This category is important as some of the measurement areas have pedestrian or half-pedestrian zones highly frequented by both residents and tourists, so it is expected that in this category, human noise sources will be one of the most significant or frequent labels identified during the measurement periods.
4. Analysis of the Real Operation Audio Collected
- Duration: This was evaluated in fractions of a second and corresponds to the time that the 3D visualization platform would spend to show its values.
- : This is also known as the time-average or equivalent sound level [39], and it stands for the equivalent of the total sound energy measured over a limited period of time.
- SNR: The Signal-to-Noise Ratio is the relation between any noise event’s evaluated power and the power of the previous and the posterior Road-Traffic Noise (RTN) surrounding the event under study. For more details about the calculus of the SNR, the reader is referred to [40].
5. Methodology and Visualization
5.1. First Visualization Approach
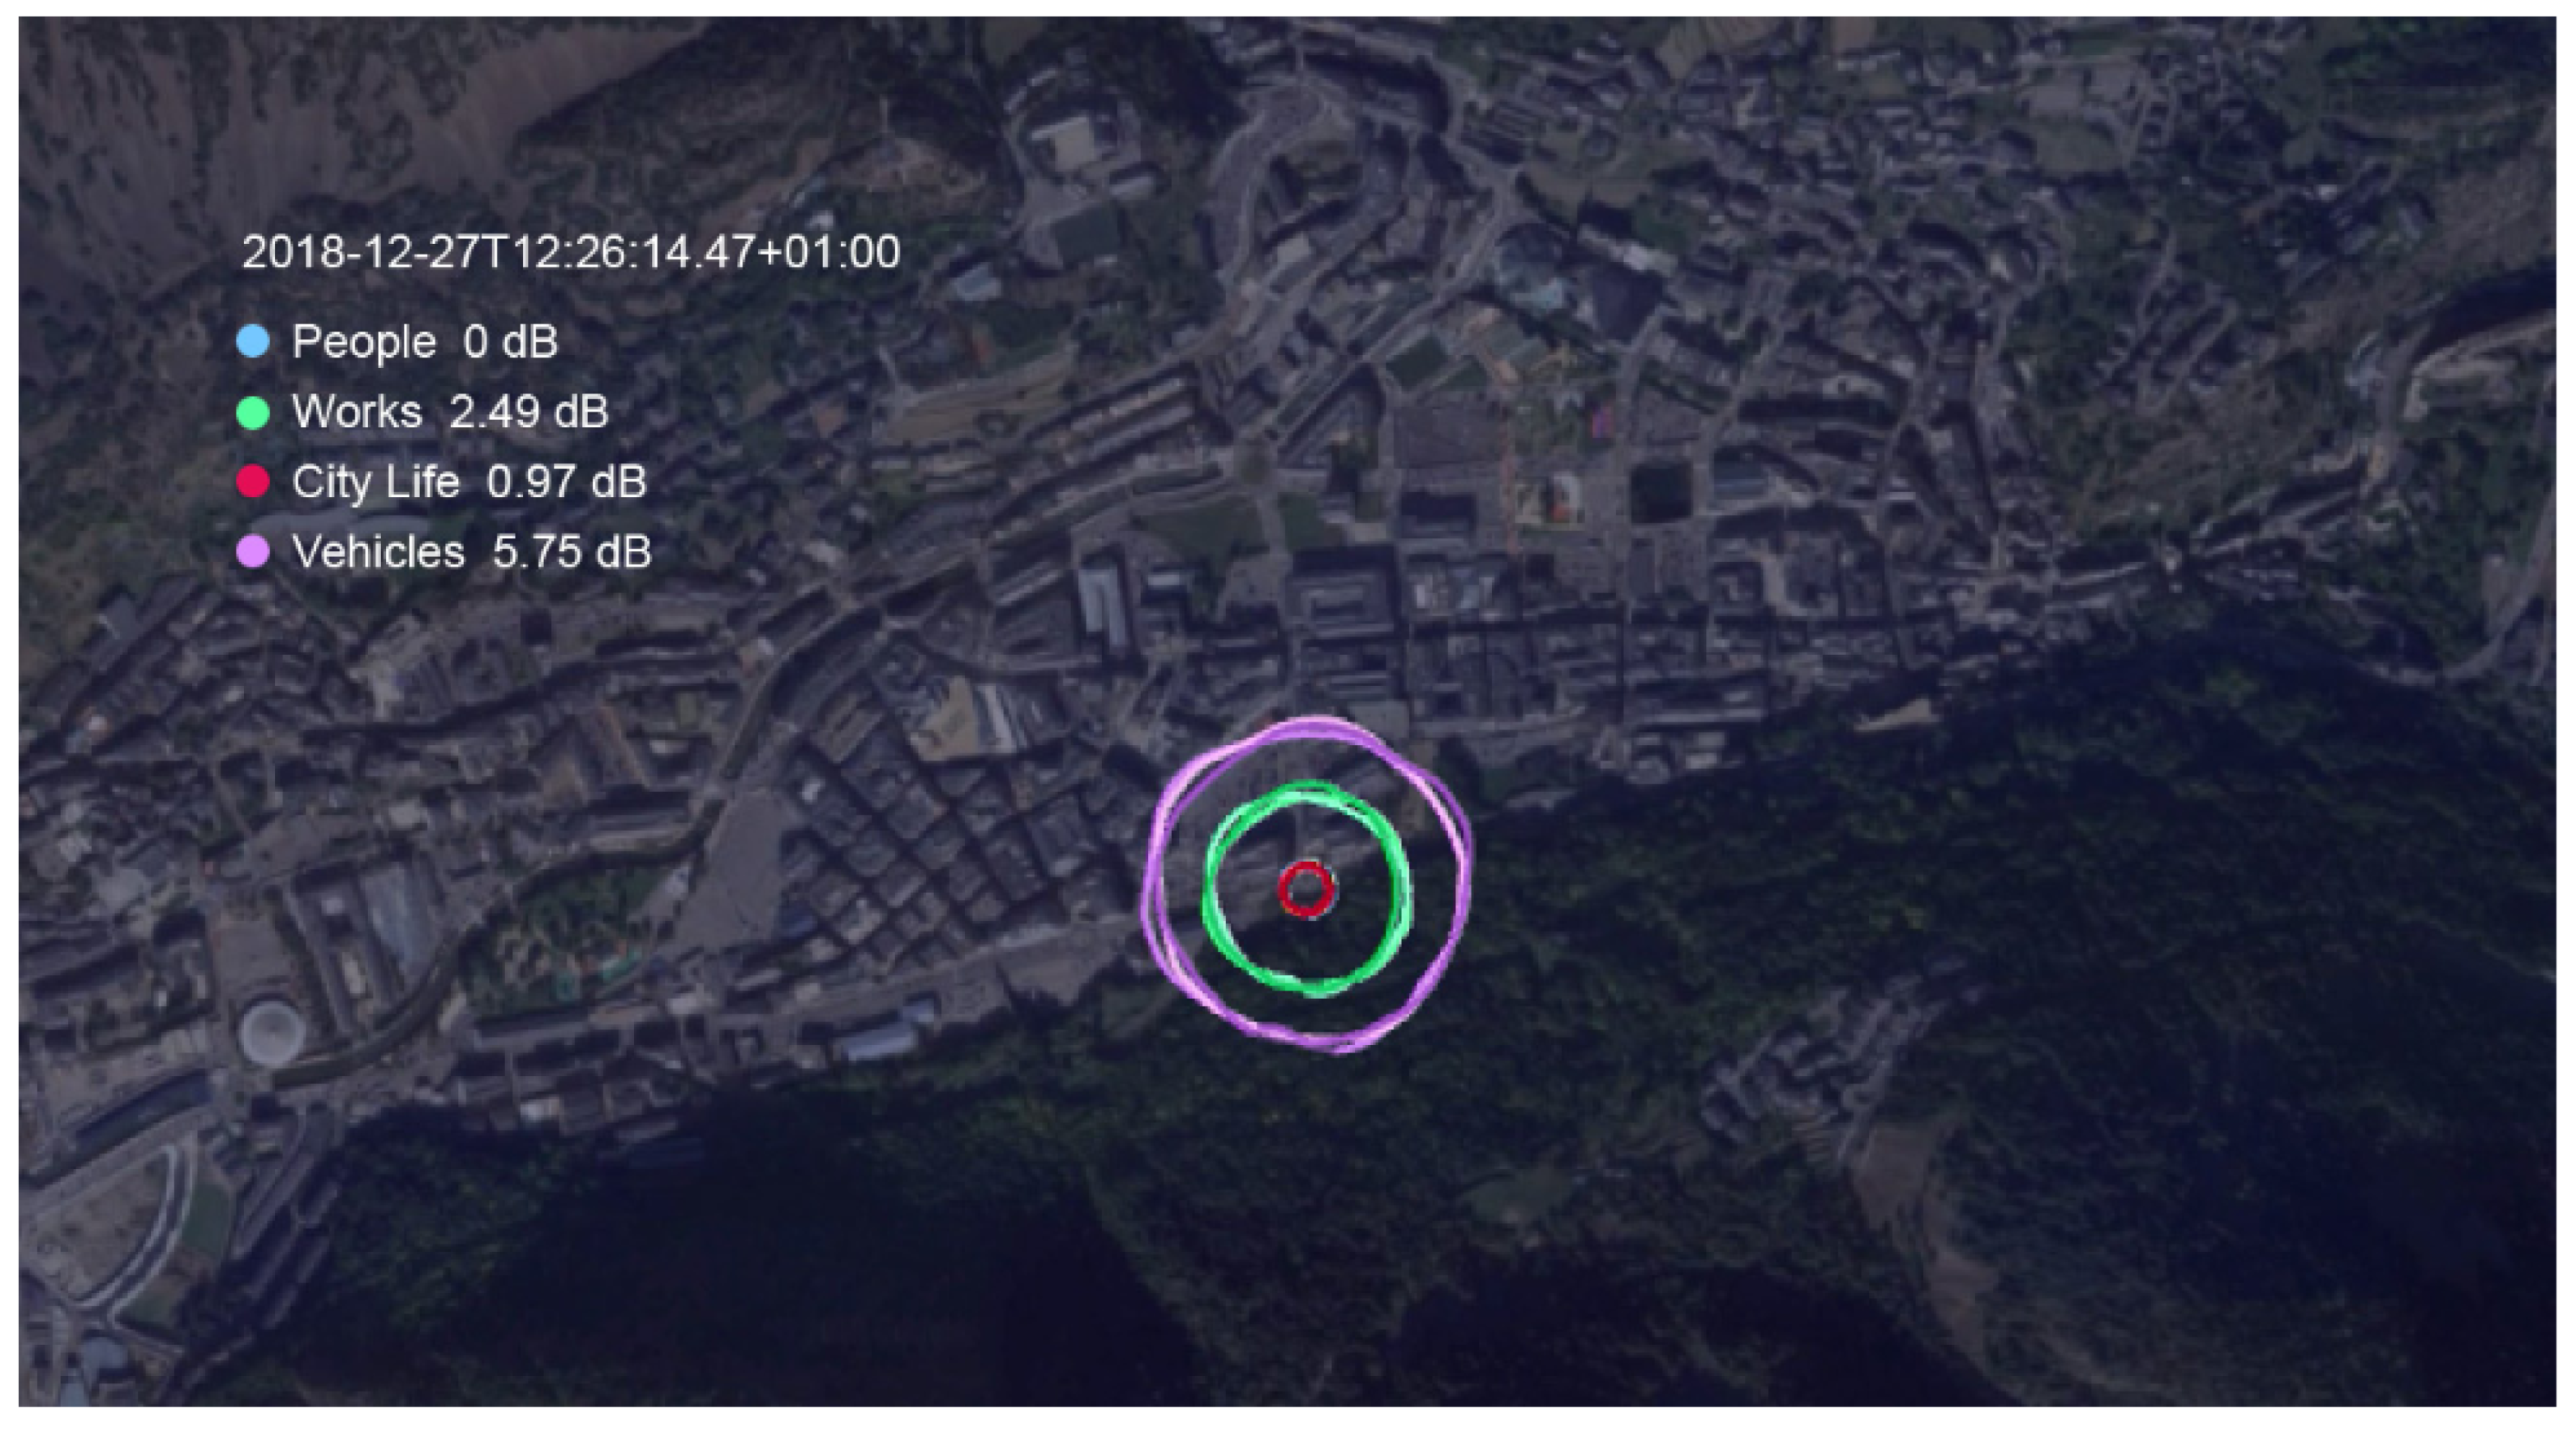
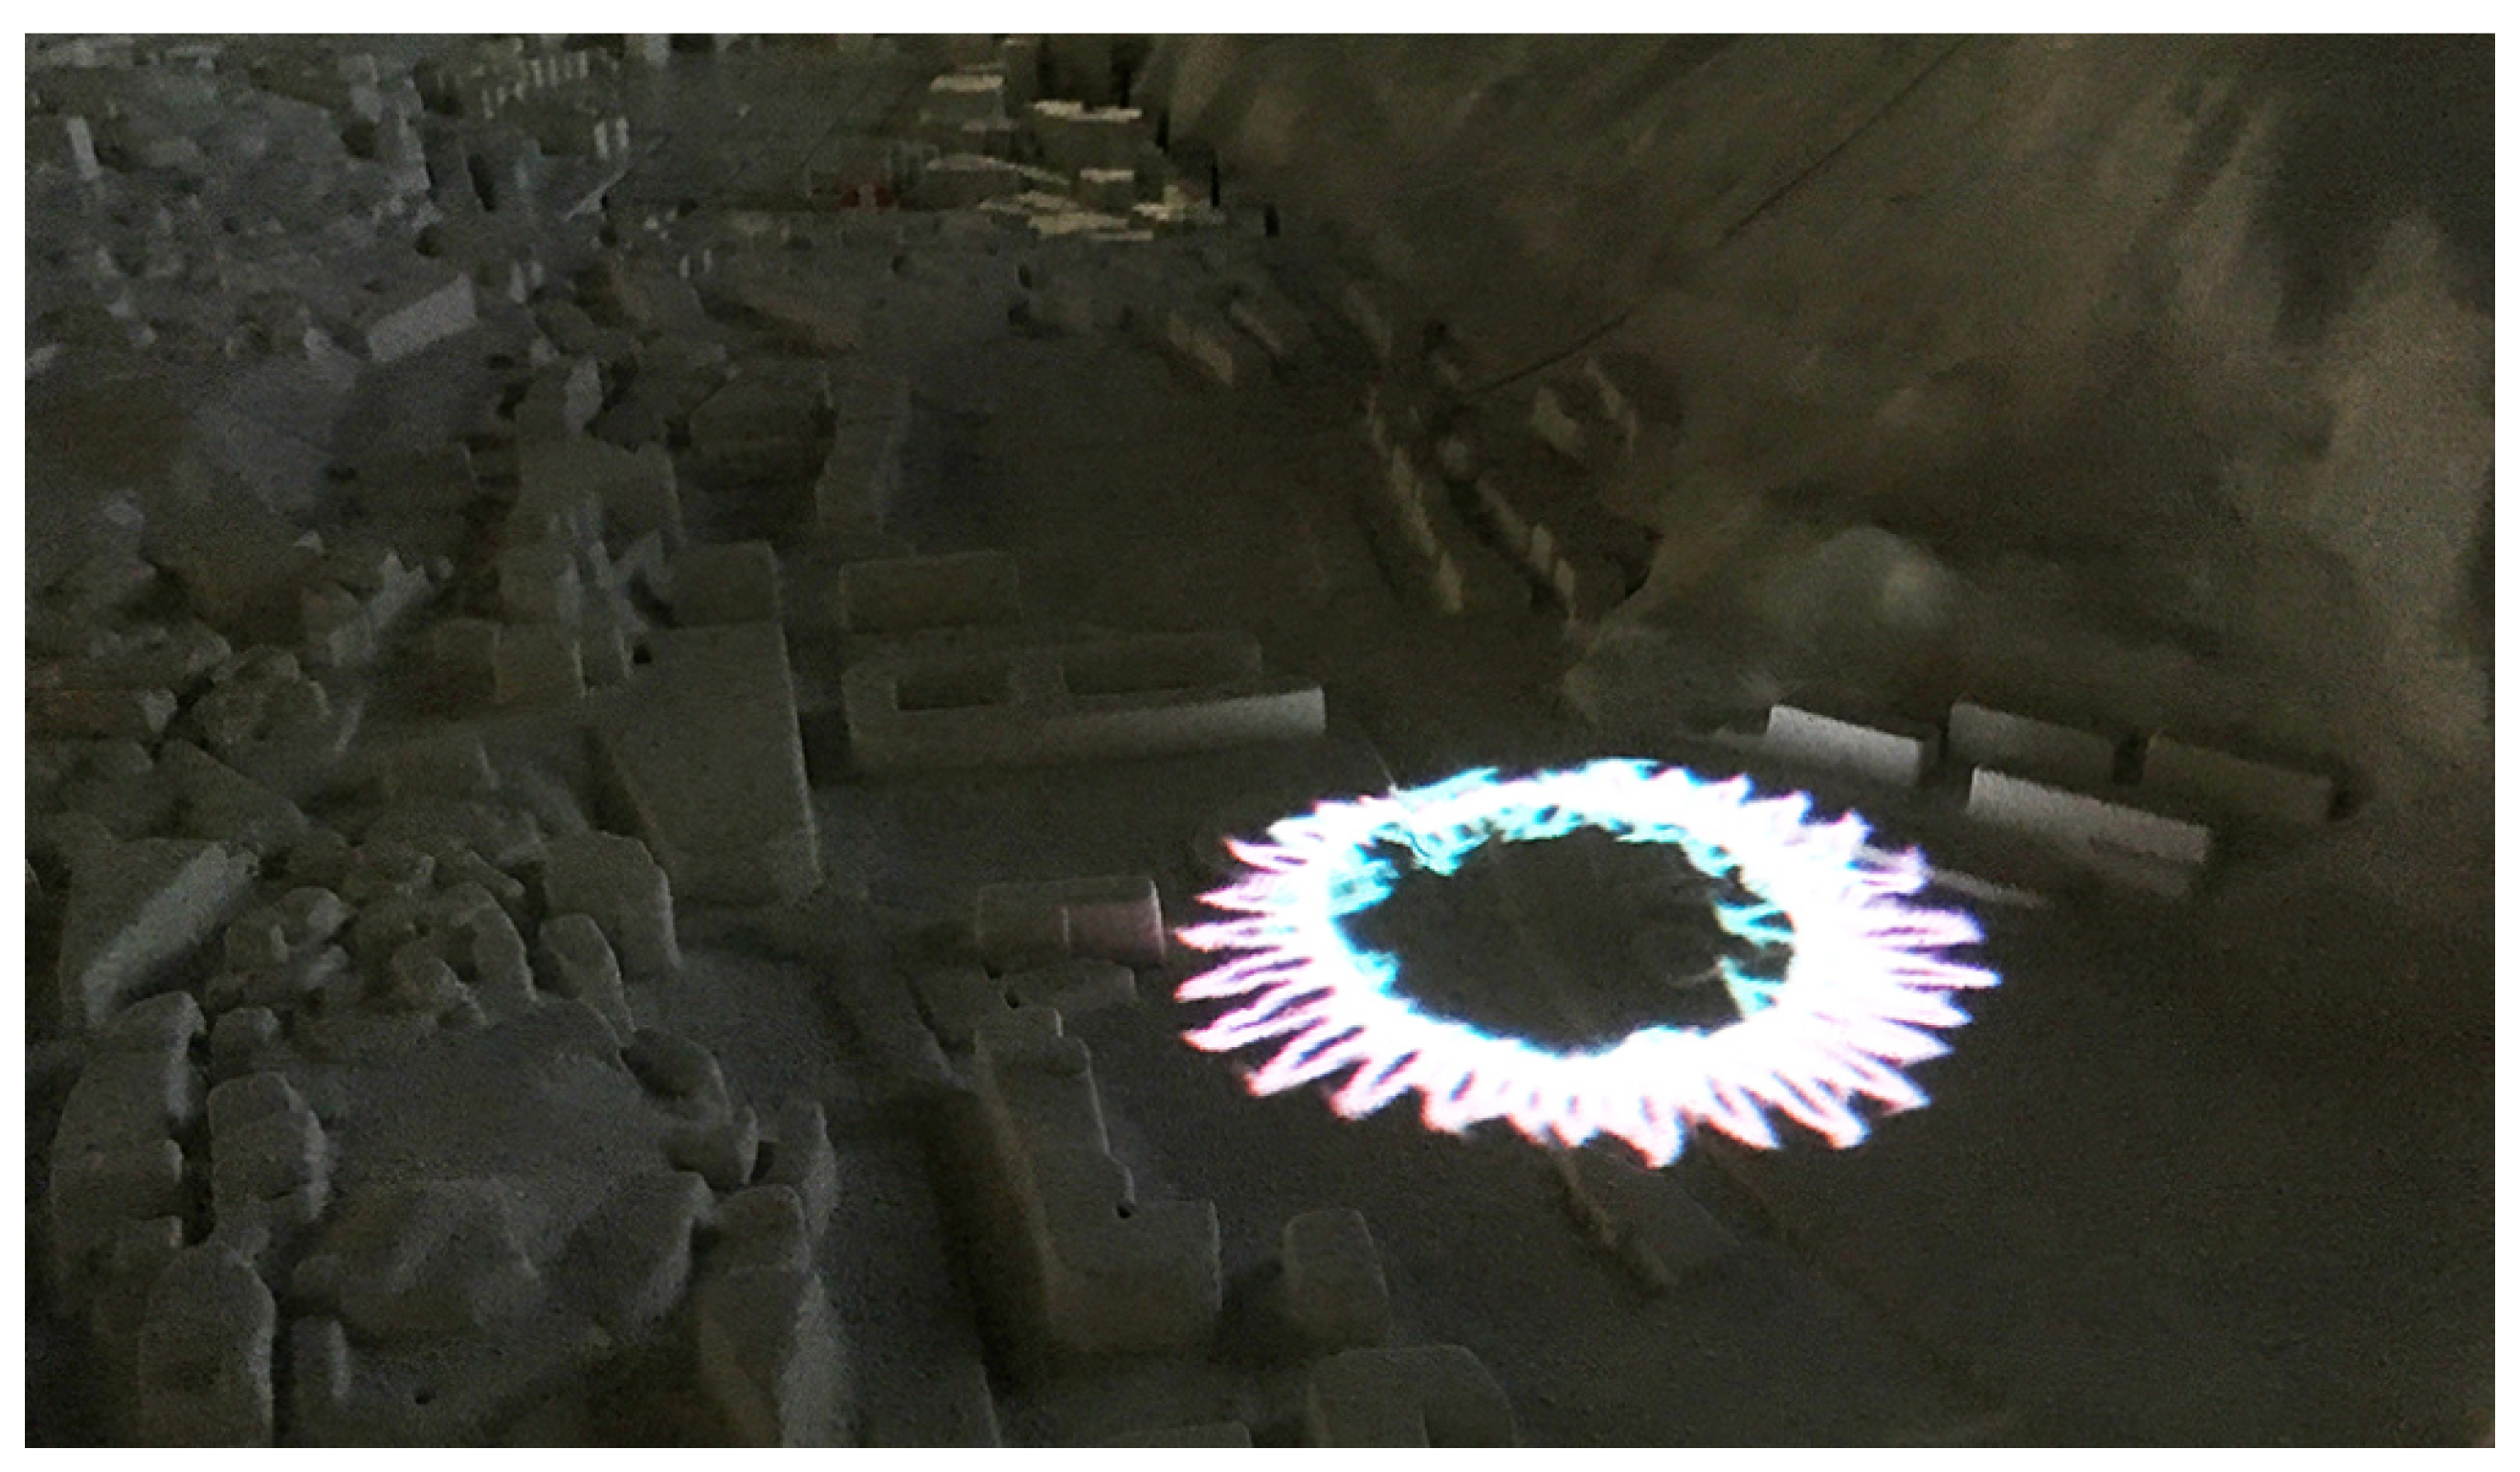
5.2. Visualization Approach Including
- When a sound event occurred, the circle rippled according to the event’s SNR. The visual effect looked harmonic in a single circle scenario, but it became cluttered when multiple circles were overlapped.
- Any SNR bigger than 3 dB produced a ripple amplitude more than twice the radius of the circle. If the sound events were susceptible to reaching more than 20 dB, the circle would overpass 3D surface bounds and become totally useless in terms of the interpretation.
- Negative SNR values cannot be represented in terms of ripple amplitude.
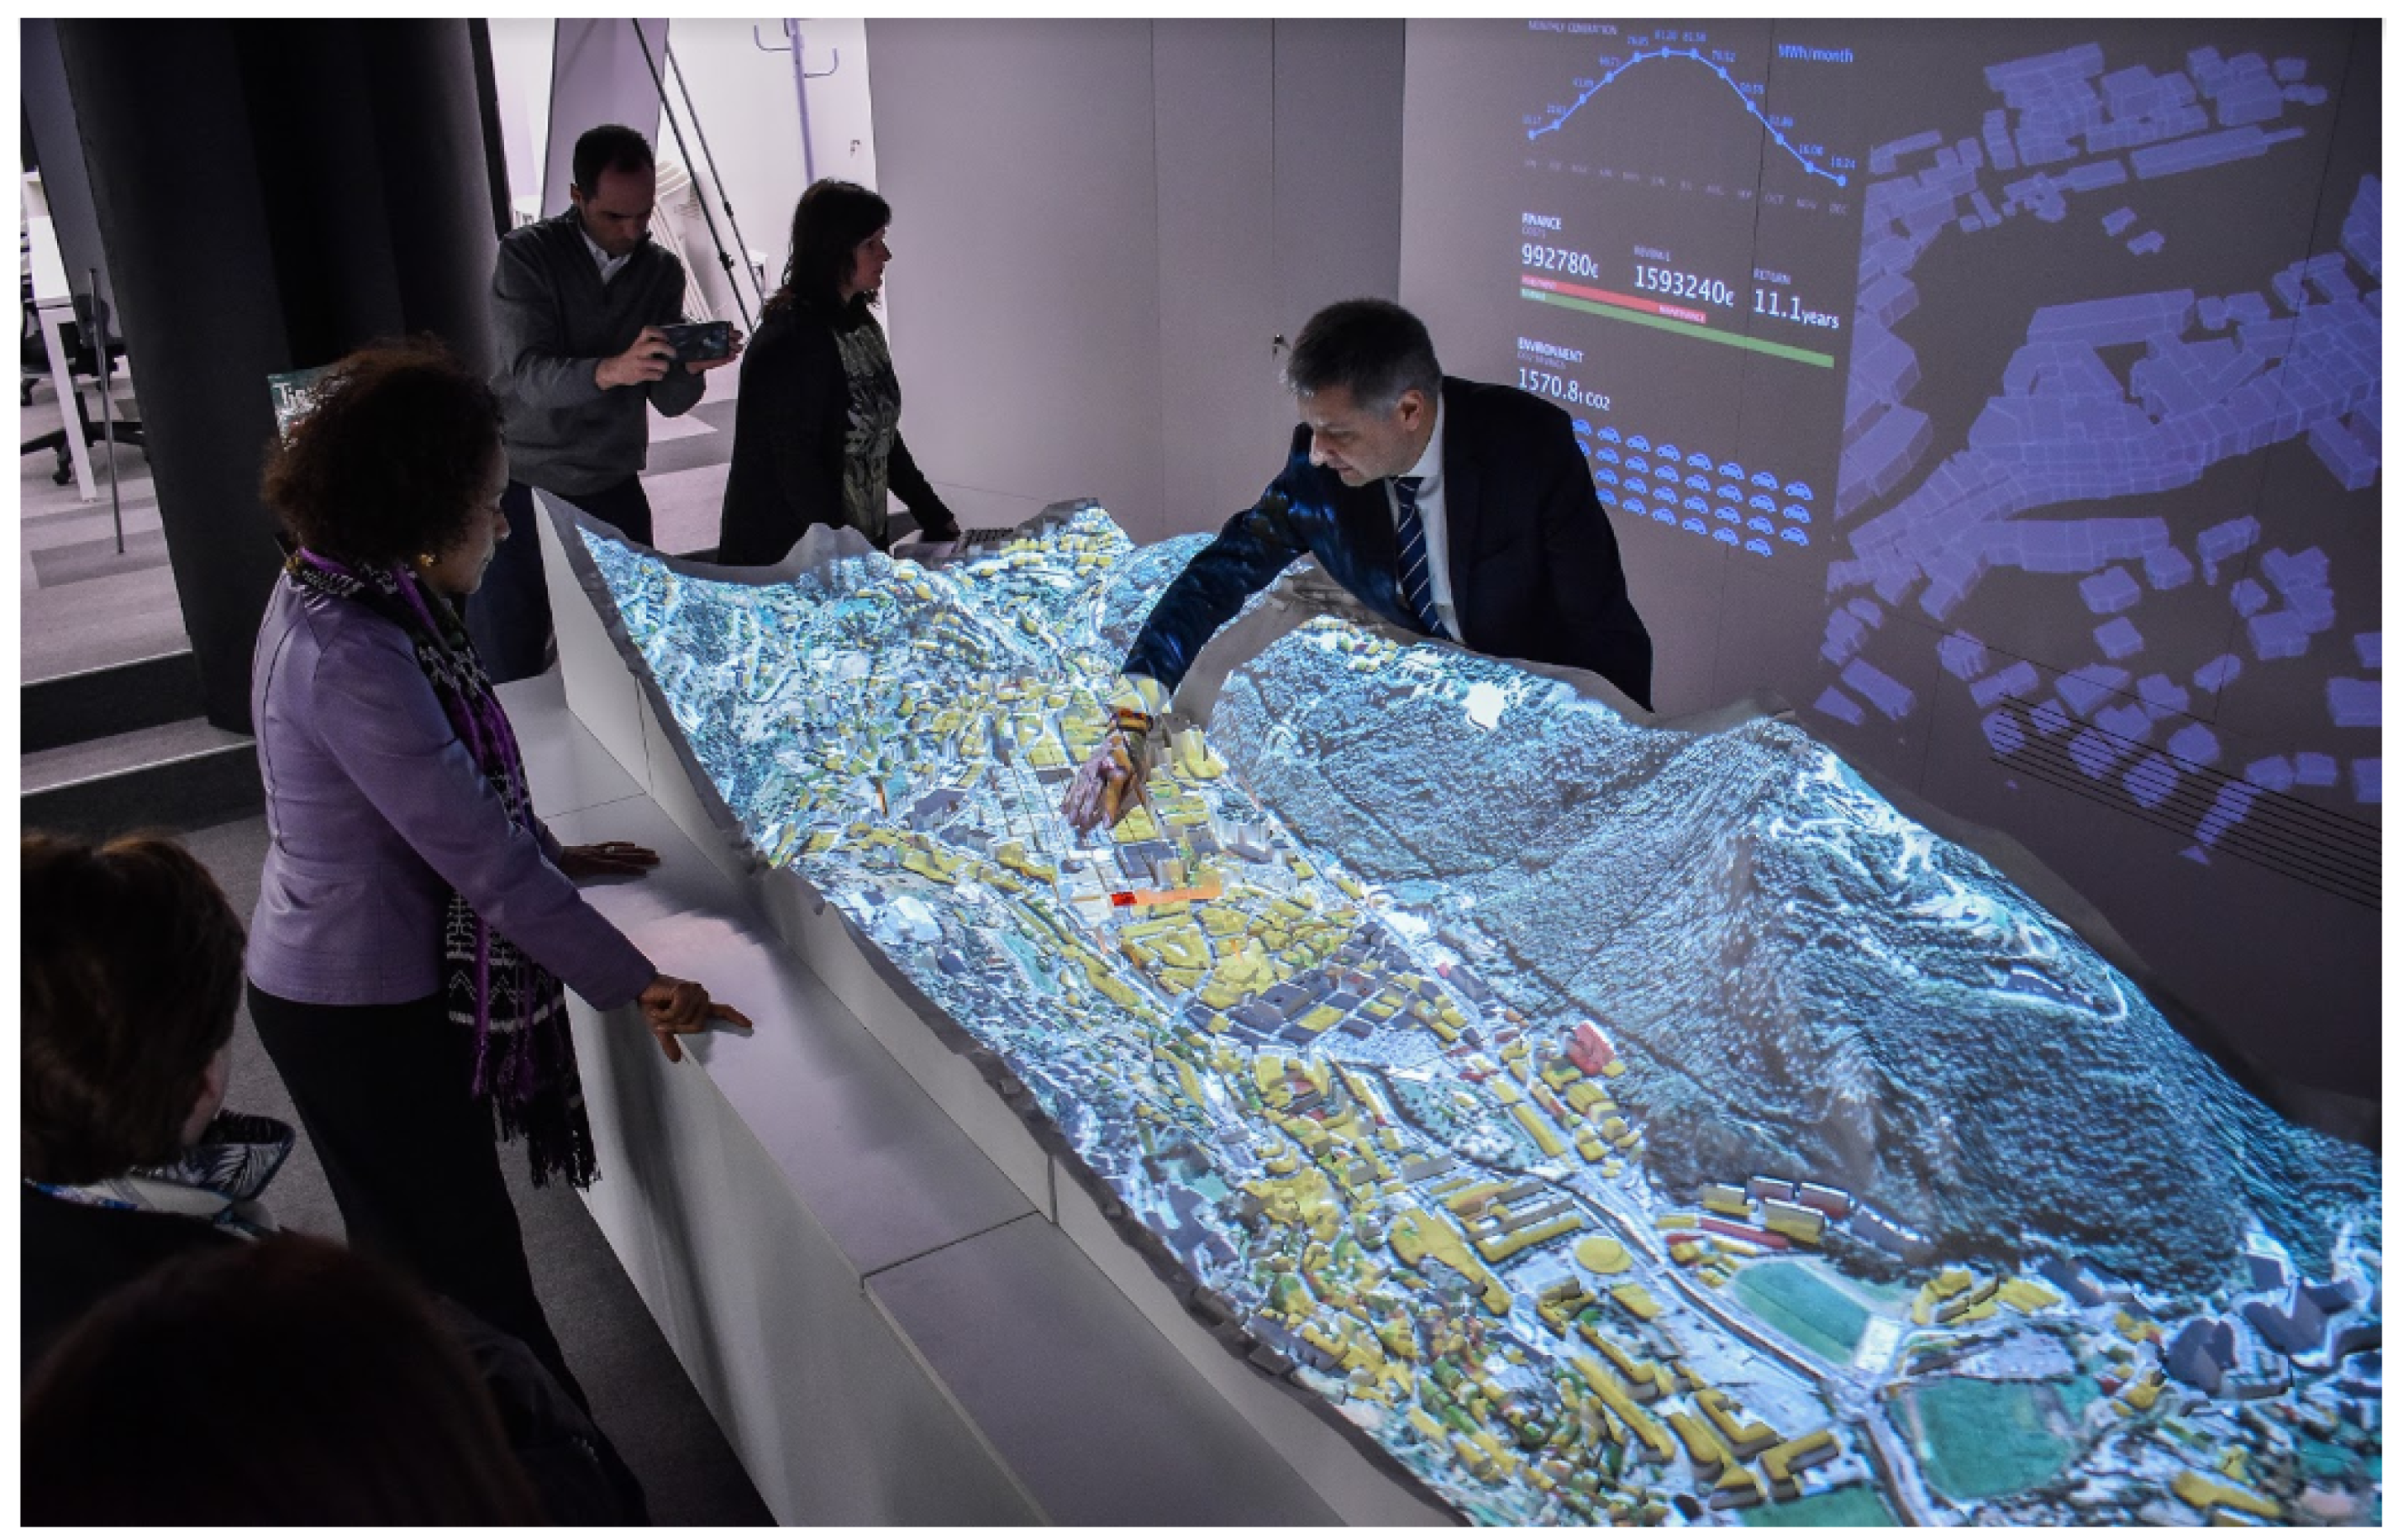
5.3. Implementation of the Visualization over the 3D City Model
- ANE (Anomalous Noise Event): categorization label for every sound event. The label was indexed and grouped by the 4 categories described in Section 3.2.
- SNR: Signal-to-Noise relation in dB of the event over the RTN.
- : equivalent noise level.
- TS: Timestamp of the event captured in the format hh:mm:ss,d. Even if the resolution could be higher, a decisecond was chosen, as it was considered enough for representational goals.
6. Conclusions
Author Contributions
Funding
Acknowledgments
Conflicts of Interest
Abbreviations
| ANE | Anomalous Noise Event |
| END | Environmental Noise Directive |
| Equivalent Level A-weighted filter | |
| OBSA | Observatori de la Sostenibilitat d’Andorra |
| RTN | Road Traffic Noise |
| SNR | Signal-to-Noise Ratio |
| SPL | Sound Pressure Level |
| WASN | Wireless Acoustic Sensor Network |
| WSN | Wireless Sensor Network |
References
- Zentner, A.; Covit, R.; Guevarra, D. Exploring Effective Data Visualization Strategies in Higher Education. 2019. Available online: https://ssrn.com/abstract=3322856 (accessed on 9 August 2019).
- Grignard, A.; Alonso, L.; Macia, N.; Vilella, M.; Larson, K. CityScope Andorra data observatory: A case study on tourism patterns. In Proceedings of the CEUR Workshop Proceedings, CEUR, Siegen, Germany, 24 February 2019. [Google Scholar]
- Travesset-Baro, O.; Francisco, G.; Vilella, M.; Pons, M. Building rooftops photovoltaic potential in mountainous regions: A case study from the Pyrenees. In Proceedings of the 33rd European Photovoltaic Solar Energy Conference and Exhibition, Amsterdam, The Netherlands, 25–29 September 2017. [Google Scholar]
- Massachusetts Institute of Technology (MIT) & Actuatech. Actuatech Foundation CityScope Platform. 2019. Available online: https://youtu.be/FdUKJtJd9ts (accessed on 8 August 2019).
- Goines, L.; Hagler, L. Noise Pollution: A Modern Plague. South. Med. J. Birm. Ala. 2007, 100, 287–294. [Google Scholar]
- Stansfeld, S.A.; Matheson, M.P. Noise pollution: non-auditory effects on health. Br. Med. Bull. 2003, 68, 243–257. [Google Scholar] [CrossRef] [PubMed]
- Muzet, A. Environmental noise, sleep and health. Sleep Med. Rev. 2007, 11, 135–142. [Google Scholar] [CrossRef] [PubMed]
- De Kluizenaar, Y.; Janssen, S.A.; van Lenthe, F.J.; Miedema, H.M.; Mackenbach, J.P. Long-term road traffic noise exposure is associated with an increase in morning tiredness. J. Acoust. Soc. Am. 2009, 126, 626–633. [Google Scholar] [CrossRef] [PubMed]
- Miedema, H.; Oudshoorn, C. Annoyance from transportation noise: relationships with exposure metrics DNL and DENL and their confidence intervals. Environ. Health Perspect. 2001, 109, 409–416. [Google Scholar] [CrossRef] [PubMed]
- Babisch, W.; Beule, B.; Schust, M.; Kersten, N.; Ising, H. Traffic noise and risk of myocardial infarction. Epidemiology 2005, 16, 33–40. [Google Scholar] [CrossRef] [PubMed]
- Lercher, P.; Evans, G.W.; Meis, M. Ambient noise and cognitive processes among primary schoolchildren. Environ. Behav. 2003, 35, 725–735. [Google Scholar] [CrossRef]
- Chetoni, M.; Ascari, E.; Bianco, F.; Fredianelli, L.; Licitra, G.; Cori, L. Global noise score indicator for classroom evaluation of acoustic performances in LIFE GIOCONDA project. Noise Mapp. 2016, 3, 157–171. [Google Scholar] [CrossRef]
- Regecová, V.; Kellerová, E. Effects of urban noise pollution on blood pressure and heart rate in preschool children. J. Hypertens. 1995, 13, 405–412. [Google Scholar] [CrossRef] [PubMed]
- Van Renterghem, T.; Botteldooren, D. Focused study on the quiet side effect in dwellings highly exposed to road traffic noise. Int. J. Environ. Res. Public Health 2012, 9, 4292–4310. [Google Scholar] [CrossRef] [PubMed]
- Zambon, G.; Roman, H.; Smiraglia, M.; Benocci, R. Monitoring and prediction of traffic noise in large urban areas. Appl. Sci. 2018, 8, 251. [Google Scholar] [CrossRef]
- Zambon, G.; Benocci, R.; Bisceglie, A.; Roman, H.E.; Bellucci, P. The LIFE DYNAMAP project: Towards a procedure for dynamic noise mapping in urban areas. Appl. Acoust. 2017, 124, 52–60. [Google Scholar] [CrossRef]
- Licitra, G.; Ascari, E.; Fredianelli, L. Prioritizing process in action plans: A review of approaches. Curr. Pollut. Rep. 2017, 3, 151–161. [Google Scholar] [CrossRef]
- Fredianelli, L.; Del Pizzo, A.; Licitra, G. Recent developments in sonic crystals as barriers for road traffic noise mitigation. Environments 2019, 6, 14. [Google Scholar] [CrossRef]
- Licitra, G.; Fredianelli, L.; Petri, D.; Vigotti, M.A. Annoyance evaluation due to overall railway noise and vibration in Pisa urban areas. Sci. Total. Environ. 2016, 568, 1315–1325. [Google Scholar] [CrossRef] [PubMed]
- Bunn, F.; Zannin, P.H.T. Assessment of railway noise in an urban setting. Appl. Acoust. 2016, 104, 16–23. [Google Scholar] [CrossRef]
- Flores, R.; Gagliardi, P.; Asensio, C.; Licitra, G. A case study of the influence of urban morphology on aircraft noise. Acoust. Aust. 2017, 45, 389–401. [Google Scholar] [CrossRef]
- Gagliardi, P.; Fredianelli, L.; Simonetti, D.; Licitra, G. ADS-B System as a Useful Tool for Testing and Redrawing Noise Management Strategies at Pisa Airport. Acta Acust. United Acust. 2017, 103, 543–551. [Google Scholar] [CrossRef]
- Gallo, P.; Fredianelli, L.; Palazzuoli, D.; Licitra, G.; Fidecaro, F. A procedure for the assessment of wind turbine noise. Appl. Acoust. 2016, 114, 213–217. [Google Scholar] [CrossRef]
- Kephalopoulos, S.; Paviotti, M.; Anfosso-Lédée, F.; Van Maercke, D.; Shilton, S.; Jones, N. Advances in the development of common noise assessment methods in Europe: The CNOSSOS-EU framework for strategic environmental noise mapping. Sci. Total. Environ. 2014, 482, 400–410. [Google Scholar] [CrossRef]
- Morel, J.; Marquis-Favre, C.; Gille, L.A. Noise annoyance assessment of various urban road vehicle pass-by noises in isolation and combined with industrial noise: A laboratory study. Appl. Acoust. 2016, 101, 47–57. [Google Scholar] [CrossRef]
- Union, E. Directive 2002/49/EC of the European Parliament and the Council of 25 June 2002 relating to the assessment and management of environmental noise. Off. J. Eur. Communities 2002, L 189, 12–25. [Google Scholar]
- Camps-Farrés, J.; Casado-Novas, J. Issues and challenges to improve the Barcelona Noise Monitoring Network. In Proceedings of the EuroNoise 2018, EAA—HELINA, Heraklion, Crete, Greece, 27–31 May 2018; pp. 693–698. [Google Scholar]
- Camps, J. Barcelona noise monitoring network. In Proceedings of the Euronoise, Maastricht, The Netherlands, 31 May–3 June 2015; pp. 218–220. [Google Scholar]
- Sevillano, X.; Socoró, J.C.; Alías, F.; Bellucci, P.; Peruzzi, L.; Radaelli, S.; Coppi, P.; Nencini, L.; Cerniglia, A.; Bisceglie, A.; et al. DYNAMAP—Development of low cost sensors networks for real time noise mapping. Noise Mapp. 2016, 3, 172–189. [Google Scholar] [CrossRef]
- Bellucci, P.; Peruzzi, L.; Zambon, G. LIFE DYNAMAP project: The case study of Rome. Appl. Acoust. 2017, 117, 193–206. [Google Scholar] [CrossRef]
- Cerniglia, A. Development of a GIS based software for real time noise maps update. In Proceedings of the INTER-NOISE and NOISE-CON Congress and Conference Proceedings, Institute of Noise Control Engineering, Hamburg, Germany, 21–24 August 2016; Volume 253, pp. 6291–6297. [Google Scholar]
- Bello, J.P.; Silva, C.; Nov, O.; DuBois, R.L.; Arora, A.; Salamon, J.; Mydlarz, C.; Doraiswamy, H. SONYC: A System for Monitoring, Analyzing, and Mitigating Urban Noise Pollution. Commun. ACM 2019, 62, 68–77. [Google Scholar] [CrossRef]
- Alsina-Pagès, R.M.; Garcia Almazán, R.; Vilella, M.; Pons, M. Noise Events Monitoring for Urban and Mobility Planning in Andorra la Vella and Escaldes-Engordany. Environments 2019, 6, 24. [Google Scholar] [CrossRef]
- Ministeri de Turisme i Comerç d’Andorra. Estratègia Nacional del Ministeri de Turisme i Comerç; Ministeri de Turisme i Comerç d’Andorra: Andorra la Vella, Andorra, 2015.
- M.I. Consell General. Govern d’Andorra. Llei sobre la contaminació atmosférica i els sorolls. 1985. Available online: http://www.aire.ad/assets/documents/10200707_Llei_Contaminacio.pdf (accessed on 8 August 2019).
- Govern Andorra. Reglament de Control de la Contaminació Acústica; Butlletí Oficial del Principat d’Andorra: Andorra la Vella, Andorra, 1996.
- Ministry of Environment, Agriculture and Sustainability. Acoustic Quality of Andorra 2017 Annual Report. 2017. Available online: https://www.mediambient.ad/images/stories/PDF/temes-interes/QualitatAcustica2017.pdf (accessed on 8 August 2019).
- Corporation, Z. H4nPro Handy Recorder Manual. 2016. Available online: https://www.zoom.co.jp/sites/default/files/products/downloads/pdfs/S_H4nPro.pdf (accessed on 2 September 2018).
- International Electrotechnical Commission. Electroacoustics—Sound Level Meters—Part 1: Specifications (61672-1, I); International Electrotechnical Commission: Geneva, Switzerland, 2013. [Google Scholar]
- Orga, F.; Alías, F.; Alsina-Pagès, R.M. On the Impact of Anomalous Noise Events on Road Traffic Noise Mapping in Urban and Suburban Environments. Int. J. Environ. Res. Public Health 2017, 15, 13. [Google Scholar] [CrossRef] [PubMed]
- Wilkinson, F.; Wilson, H.R.; Habak, C. Detection and recognition of radial frequency patterns. Vis. Res. 1998, 38, 3555–3568. [Google Scholar] [CrossRef] [Green Version]
- Reas, C.; Fry, B. Processing: A Programming Handbook for Visual Designers and Artists; Mit Press: Cambridge, MA, USA, 2007. [Google Scholar]


| ANE | SNR | TS | |
|---|---|---|---|
| BARK (dog barking) | 6.745 | 62.6 | 00:12:23.4 |
| CMPLX (complex) | 1.365 | 63.1 | 00:12:34.1 |
| RTN | 0 | 62.8 | 00:13:18.6 |
| BRAK (brake) | 9.734 | 64.5 | 00:13:32.8 |
© 2019 by the authors. Licensee MDPI, Basel, Switzerland. This article is an open access article distributed under the terms and conditions of the Creative Commons Attribution (CC BY) license (http://creativecommons.org/licenses/by/4.0/).
Share and Cite
Alsina-Pagès, R.M.; Vilella, M.; Pons, M.; Garcia Almazan, R. Mapping the Sound Environment of Andorra and Escaldes-Engordany by Means of a 3D City Model Platform. Urban Sci. 2019, 3, 89. https://doi.org/10.3390/urbansci3030089
Alsina-Pagès RM, Vilella M, Pons M, Garcia Almazan R. Mapping the Sound Environment of Andorra and Escaldes-Engordany by Means of a 3D City Model Platform. Urban Science. 2019; 3(3):89. https://doi.org/10.3390/urbansci3030089
Chicago/Turabian StyleAlsina-Pagès, Rosa Ma, Marc Vilella, Marc Pons, and Robert Garcia Almazan. 2019. "Mapping the Sound Environment of Andorra and Escaldes-Engordany by Means of a 3D City Model Platform" Urban Science 3, no. 3: 89. https://doi.org/10.3390/urbansci3030089
APA StyleAlsina-Pagès, R. M., Vilella, M., Pons, M., & Garcia Almazan, R. (2019). Mapping the Sound Environment of Andorra and Escaldes-Engordany by Means of a 3D City Model Platform. Urban Science, 3(3), 89. https://doi.org/10.3390/urbansci3030089


