Abstract
The usage of greenery systems as nature-based solutions to assist in urban cooling in summer time as well as urban warming in wintertime is considered a scientific validated approach in urban planning. The objective of this research is the investigation and quantification of the role of green roofs and green facade solutions concerning thermal behavior in buildings energy savings by using standardized semantic city models that allow the quantification of such measures on district and city scales. The implemented model uses standardized geospatial data based on the CityGML format, a semantic city model standard, for analysis and data storage. For storage of the thermal properties of the buildings, the behavior of its occupants as well as the sensor measurements the Energy ADE of the CityGML standard was used. A green roof/façades model was implemented to simulate the heat transfer in a building based on the heat balance principle of foliage, soil, and structural layers. This model allows analyzing the thermal influence of plant and substrate layers on the heat gains from incoming solar radiation into buildings and the heat losses. This implementation was validated for cooling solutions using monitoring data from real-time experiments during summer measurements at three locations in Germany. Results from this experiment correspond well with the findings of other relevant studies. A sensitivity analysis was conducted to test the impacts of climate, substrate and plants on the greenery layer performance.
1. Introduction
Today, more than half of the world’s population lives in cities or urban areas with an expected increase to 68% by 2050 [1]. At the same time, urban areas with their high demand of energy and other resources are, through often indirect, major emitters of greenhouse gases. According to the European energy commission, buildings account for 40% of energy consumption and 36% of CO2 emissions in the European Union (EU) [2]. In recent years, significant efforts were made to improve energy efficiency and to reduce energy consumption of building by improving their thermal envelope. Structural efficiency and the reduction of air pollutants is a global political and scientific goal. Not only urban residents but also urban nature is impacted by climate change in various ways due to the rapid increase in the rate of urbanization and associated phenomena such as Urban Heat Islands (UHI) and more frequent heat waves ([3,4]). One efficient and cost-effective possibility to mitigate these effects of climate change it the application of nature-based solutions such as green roofs and green facades in urban areas. These applications for buildings are considered as a solution to integrate greenery in urban development that increases not only the energy efficiency of buildings but also shows positive effects on ecology and the environment [5]. At the same time reducing heat-induced stress from UHI on humans and animals, that influences their behavior, health, and well-being. The benefits that these nature-based applications have on urban systems are a presented in numerous research studies, and range from UHI mitigation [6,7,8], energy and noise reduction [9,10,11], filtering pollutants [12] to storm water retention [13] and urban aesthetics [7]. In recent years, these systems are receiving more and more attention and are being implemented by urban planners and architects and over 800 publications alone in Germany on the topic of green façades have been published since 2006 [7].
This research focuses on the modelling and monitoring of the effects of green roof and green façade systems. These two applications of nature-based solutions differ in their application on urban structures where green roofs are described as a Green Horizontal System (GHS) placed on top of the building roof surface. These installations serve, beside aesthetical aspects such as providing a green view for residents, energy consumption reduction, as well as multiple environmental benefits. The thermal effects of green roofs, acting as an additional building envelop layer, on energy consumption of buildings have been proven in the building sector by numerous previous research studies [14,15,16]. For example, Wong N.H. et al. [17] conducted a field experiment in Singapore which indicated that the application of green roofs (e.g., rooftop garden) can save from 0.6–14.5% of the annual energy consumption. In general, these benefits are due to thermal insulation, shading and evapotranspiration processes [14,18,19].
When greenery is applied vertically on building structures, they are referred to green façades and are classified as a green vertical system (GVS) where plants climb or hang directly on the vertical surface of buildings. Thereby, plants can be planted on the ground surface or in pots. Green façade applications have been classified into traditional, double skin, and perimeter pots groups [20]. The concept of GVS is considered a successful solution for urban greening, due to its capacity of extending greened areas and to reduce the energy consumption of buildings [21]. Perez et al. [20] indicated that three fundamental mechanisms should be investigated before building vertical greenery systems: shading effect (due to an interception of solar radiation), thermal insulation (due to a presence of soil and vegetation), and evapotranspiration by plants. Susorova et al. [22] developed a mathematical model to simulate the thermal performance of a traditional green façade. The results showed that on sunny days, a plant layer on a brick wall estimated to decrease its exterior surface temperature by 0.7–13.1 °C and reduce the heat flux through the building façade by 2–33 W/m2.
Monitoring of such nature-based solution is essential in order to quantify their effect on the building itself as well as the surrounding urban climate. Traditional deployment of such monitoring network for green roofs and green facades require substantial investments and are time consuming to set up and maintain. In the past, traditional installations of monitoring hardware and networks consisted of professional grade and proprietary hardware and software systems from the meteorological and soil sciences research domains [23,24]. A need of a low-cost sensors/monitors networking is essential as owing the benefits of revolutionary technologies in environmental monitoring such as air quality monitoring [25]. Currently, assembly and deployment of these environmental sensors such air temperature; air humidity and/or air quality require less effort [24].
The objective of this research is to investigate and quantify the role of vegetation concerning thermal behavior in buildings energy savings by using standardized semantic 3D city models and sensor data as input that will allow the quantification of such measures not only on one single building but also at district and city scales. To our knowledge, there is no existing model that demonstrates this impact for both greenery systems using standardized geospatial data as input. Furthermore, most studies and models developed are focusing only on one building with limited spatial scalability [22,26]. Thus, the study develops a model, which is able to simulate not only green roof but also the green façade applications. Thereby, the usage of standardized data models, such as CityGML and its Application Domain Extensions (ADE) will allow transferability and scalability to any geography region. Furthermore, an open access low-cost sensor system based on Arduino as well as data from open weather data platforms is used to generate and validate the model.
2. Related Research and Methodologies
This research draws upon three different research domains, namely the modelling of green roof/façade systems, open sensor networks, and semantic 3D city models. Thereby providing a scalable solution that can be applied to any geographic location at multiple scales.
Current research on greenery modeling is focused on studying potential energy savings that green roofs/green façades can contribute to the total energy demand of buildings. This thermal perspective of the greenery system can be classified based on its main components such as structural, foliage, substrate layers and the ambient air surrounding the system. The modelling of greenery systems can be demonstrated by heat and mass energy balance algorithms ([27,28]). There are a variety of green roofs/green façades models that have been developed to simulate energy performance in specific buildings such as commercial ([29]) or high-rise buildings ([30]). However, these models lack a holistic approach for simulating the green roof and green façade model together in one mode on multiple building types.
For example, Susorova et al. [22] developed a mathematical model to simulate the thermal performance of a traditional green façade at the Illinois Institute of Technology in Chicago and conducted an experiment to validate this model. This model offers a capacity to estimate thermal performance of the green façade envelope on buildings, with respect to the effects of plant physiological processes (evapotranspiration, radiative, and convective heat exchange) and weather conditions. Due to an absence of a soil layer in this model, it cannot directly be used to simulate the thermal properties of the green roof.
Many studies have implemented field measurements to collect field data on the greenery models to compute physics-based energy balance models and to validate the accuracy of the model [15,20,22,26]. The design and construction of experiments for simultaneously collecting weather conditions as well as the temperature of the solid surfaces (e.g., plants, concrete) is a challenging process, which requires a robust and flexible system for real-time monitoring support. Besides, the choice of location site with ideal green infrastructure environments are difficult especially in the case of the green façades not many buildings exists that allow the installation of monitoring experiments.
In recent years, multiple open source platforms and citizen science projects have been developed that not only promote but also provide different ready to use hardware and software solutions ([31,32,33,34]). These solutions have not only been used as prototypes but have also been applied in research and commercial applications such as for example senseBox [35] or the Air Quality Egg [36]. In 2015, Pfeil et al. [37] for example introduced OpenSenseMap [38] an open source Webserver, developed by GI@School lab at the Institute for Geoinformatics in Münster that enables conducting in low-cost scalable situ experiments for gathering real-time measurements. Besides these sensor platforms, a variety of open sensor Application Programming Interfaces (API) exists such as the Open Weather Map API [39] or the Netatmo API [40] framework allowing the integration of weather and energy relevant data from sensors that could be used for modelling and validation of the green roof and green façade models. In this research the application of an open source electronic prototyping platform based on Arduino [41] with a wide-spread online community at sharing and development is considered [42].
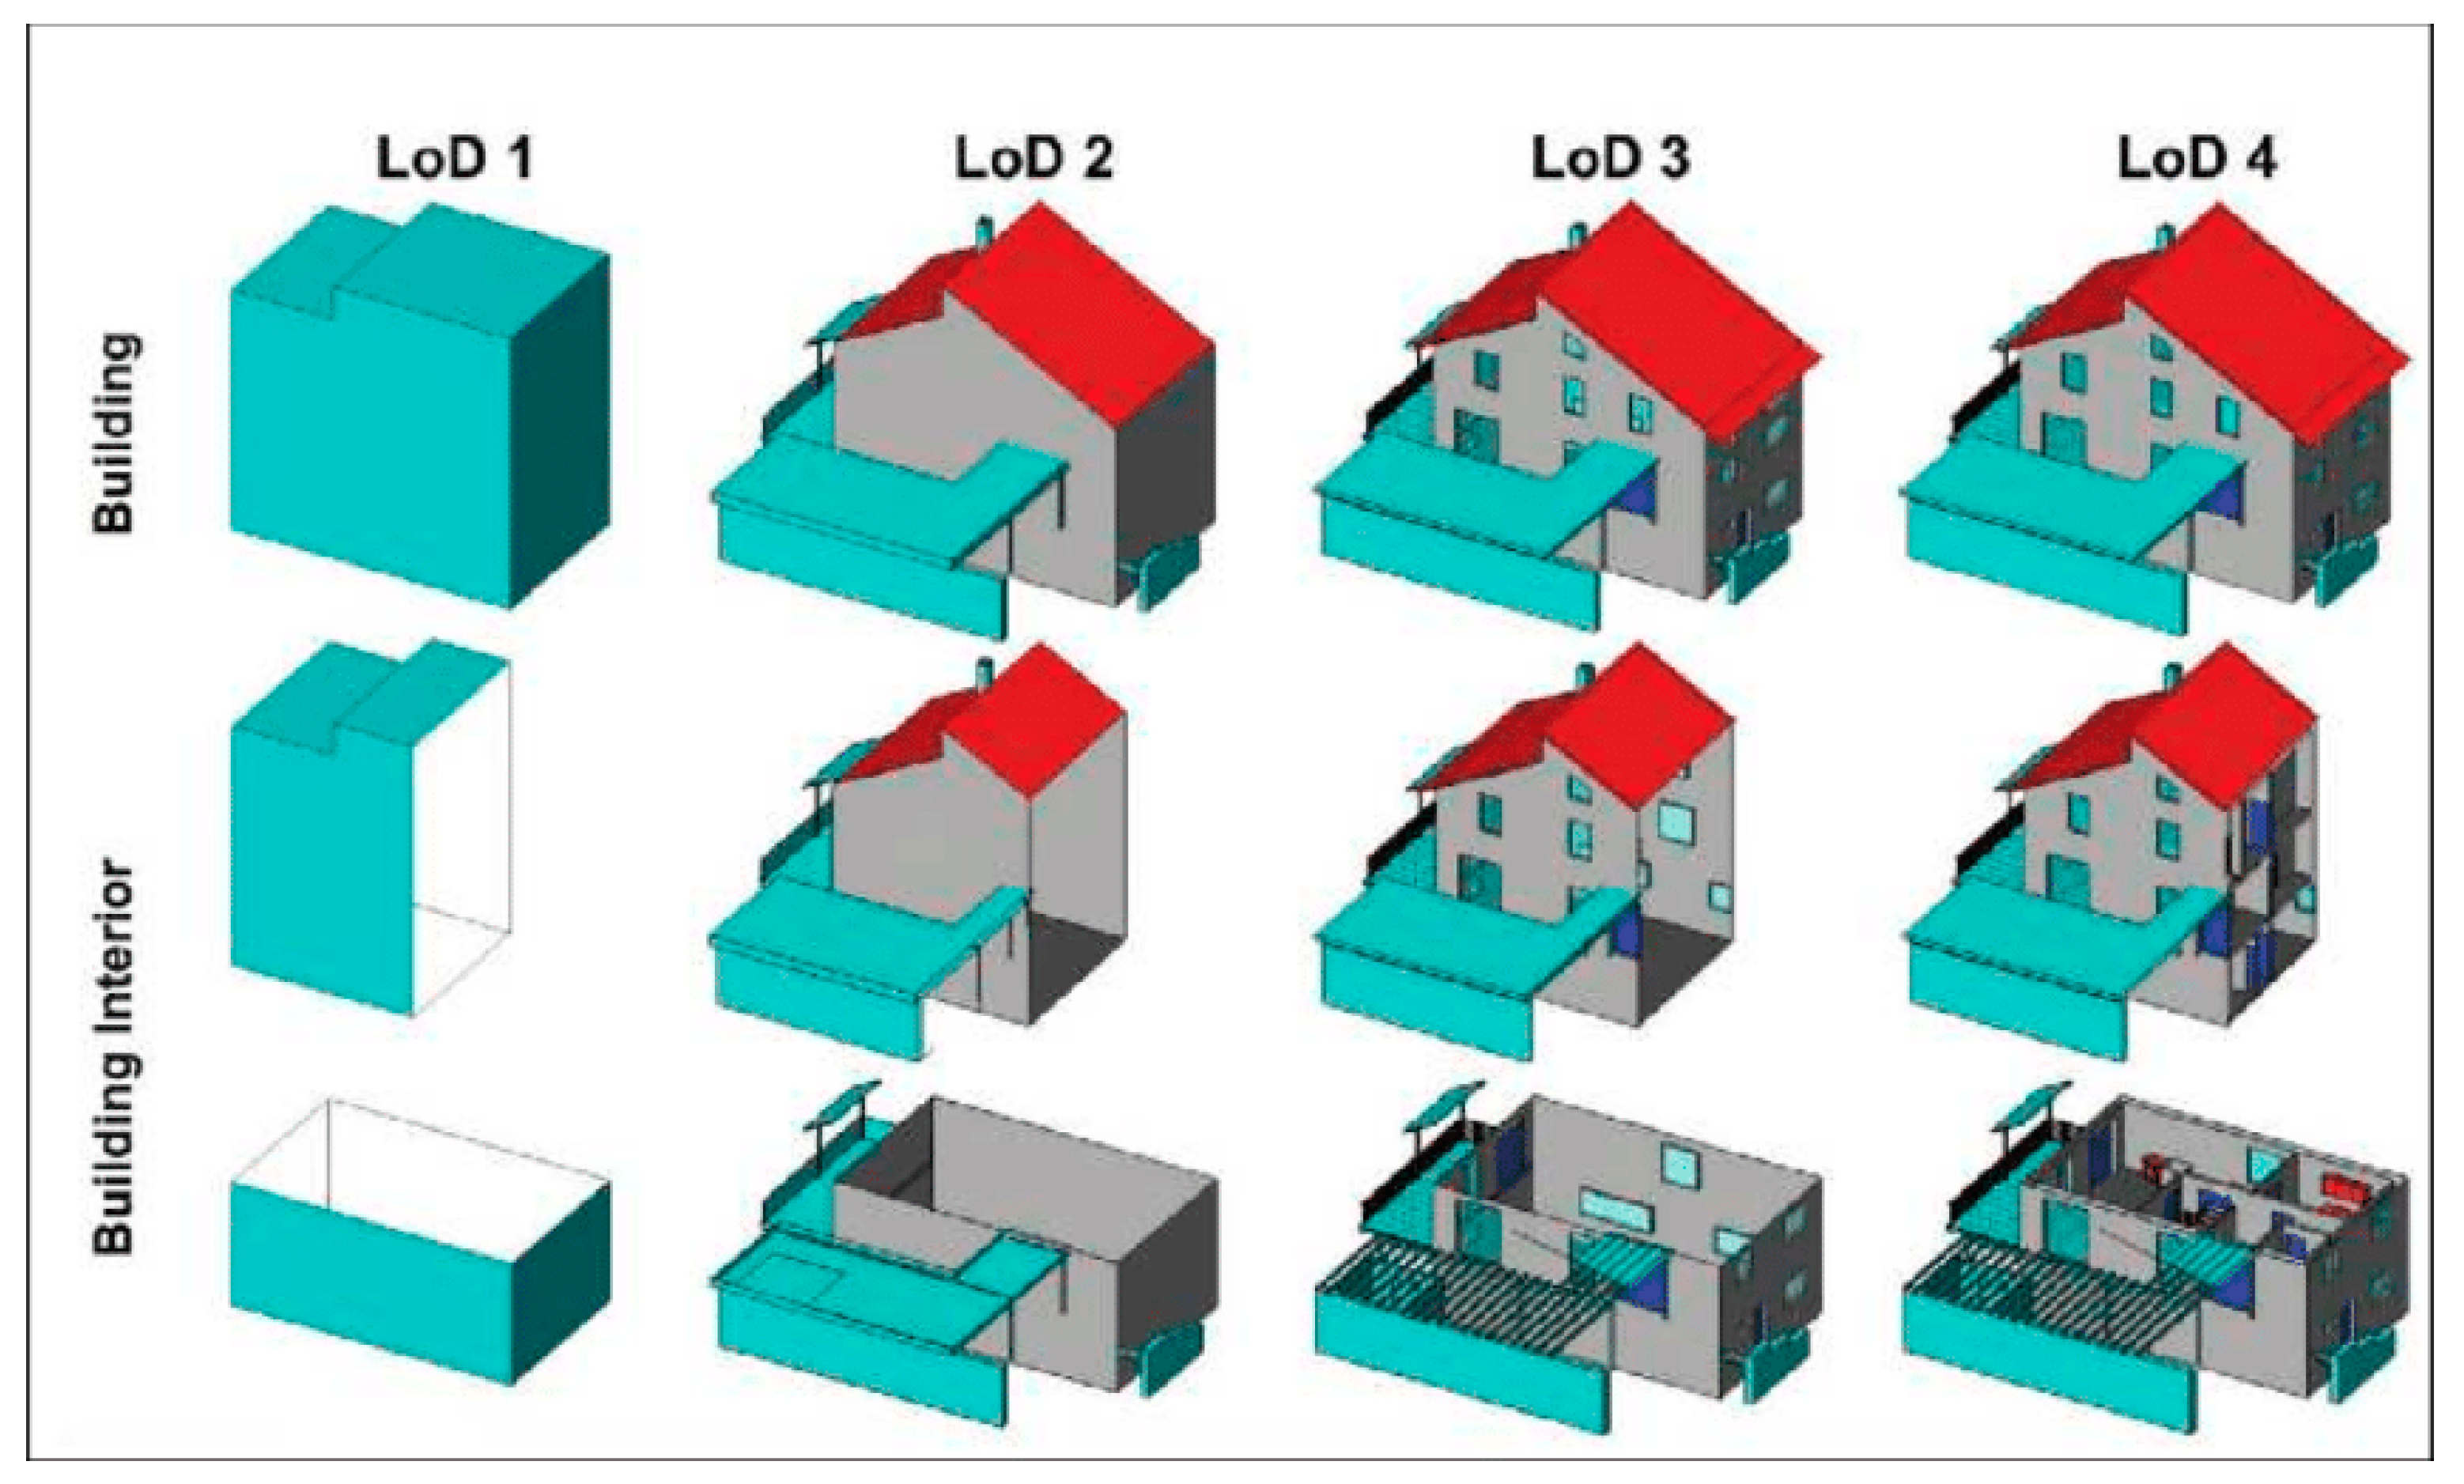
For the storage and geolocation of input and output data from greenery models, 3D city models are gaining increased popularity. More and more urban energy models are based on such 3D representations that can range from single building to whole city applications [43,44,45,46,47]. Sensor data, modelling and simulation results can be directly linked to spatial objects such as buildings or city furniture. Furthermore, with multi-level of details (LoD) concepts and formats such as CityGML [48] or ESRI Multipatch [49] it is possible to not only aggregate data by the building itself but at a finder scale such as building surface or building installations (Figure 1). Figure 1 shows on overview of the LoD concepts of 3D city models based on the CtiyGML standard.

Figure 1.
Different levels of details (LoD) represented in the CityGML standard (Source: Karlsruhe Institute of Technology (KIT), CityGML 2.0 Encoding standard).
This research incorporates all elements presented above into the experiment setup, the modelling and simulation of the green roof and green façade model and the visualization and representation of the results. To our knowledge, such an approach towards a holistic greenery model has not been presented in the literature before.
3. Semantic City Models and Data Infrastructure
In our attempts to find a suitable infrastructure that allows reliable and accurate city, neighborhood and district scale energy studies to be performed, we have focused on using open standards and services to service and store data. To that end we follow principles and an infrastructure first described in [47] and then further detailed in [50]. This data infrastructure uses semantic city models to describe cities from a spatial, semantical, thematic, and topological perspective. It provides us with a way to calculate the impact of the surrounding environment on energy demand. A simple example of this is shading, which has an influence on the amount of energy surfaces receive from the sun.
For the spatial description of our city environments, we use CityGML. It is an XML-based open data model widely used for storage and exchange of 3D city models which not only allows us to quantify the impact of spatial factored parameters (e.g., shading) in our test model but also the thermal performance of the studied buildings and the impact of neighboring buildings on one another. According to Futcher et al. [51] these interactions with other buildings and their shading effects have a significant effect on the annual energy demand. This further facilitates the quantification of the studied phenomena on statistically significant spatial scales.
Like with any standard, when it was finally implemented, it was both incomplete and obsolete, so the developers of CityGML added an internal mechanism called the Application Development Extension (ADE) to allow for modeling of additional information not foreseen by the initial development. This allowed an international consortium to develop an extension dedicated to storing standardized building energy information in the Energy ADE. This effort is presented in [52,53] with the first stable version presented in 2018 at the 10th meeting in of the OGC CityGML working group in Delft [54]. Currently the extension contains one core module and four topic modules, Building Physics, Energy Systems, Material and Construction, and Occupant Behavior, which are all described in detail in [55].
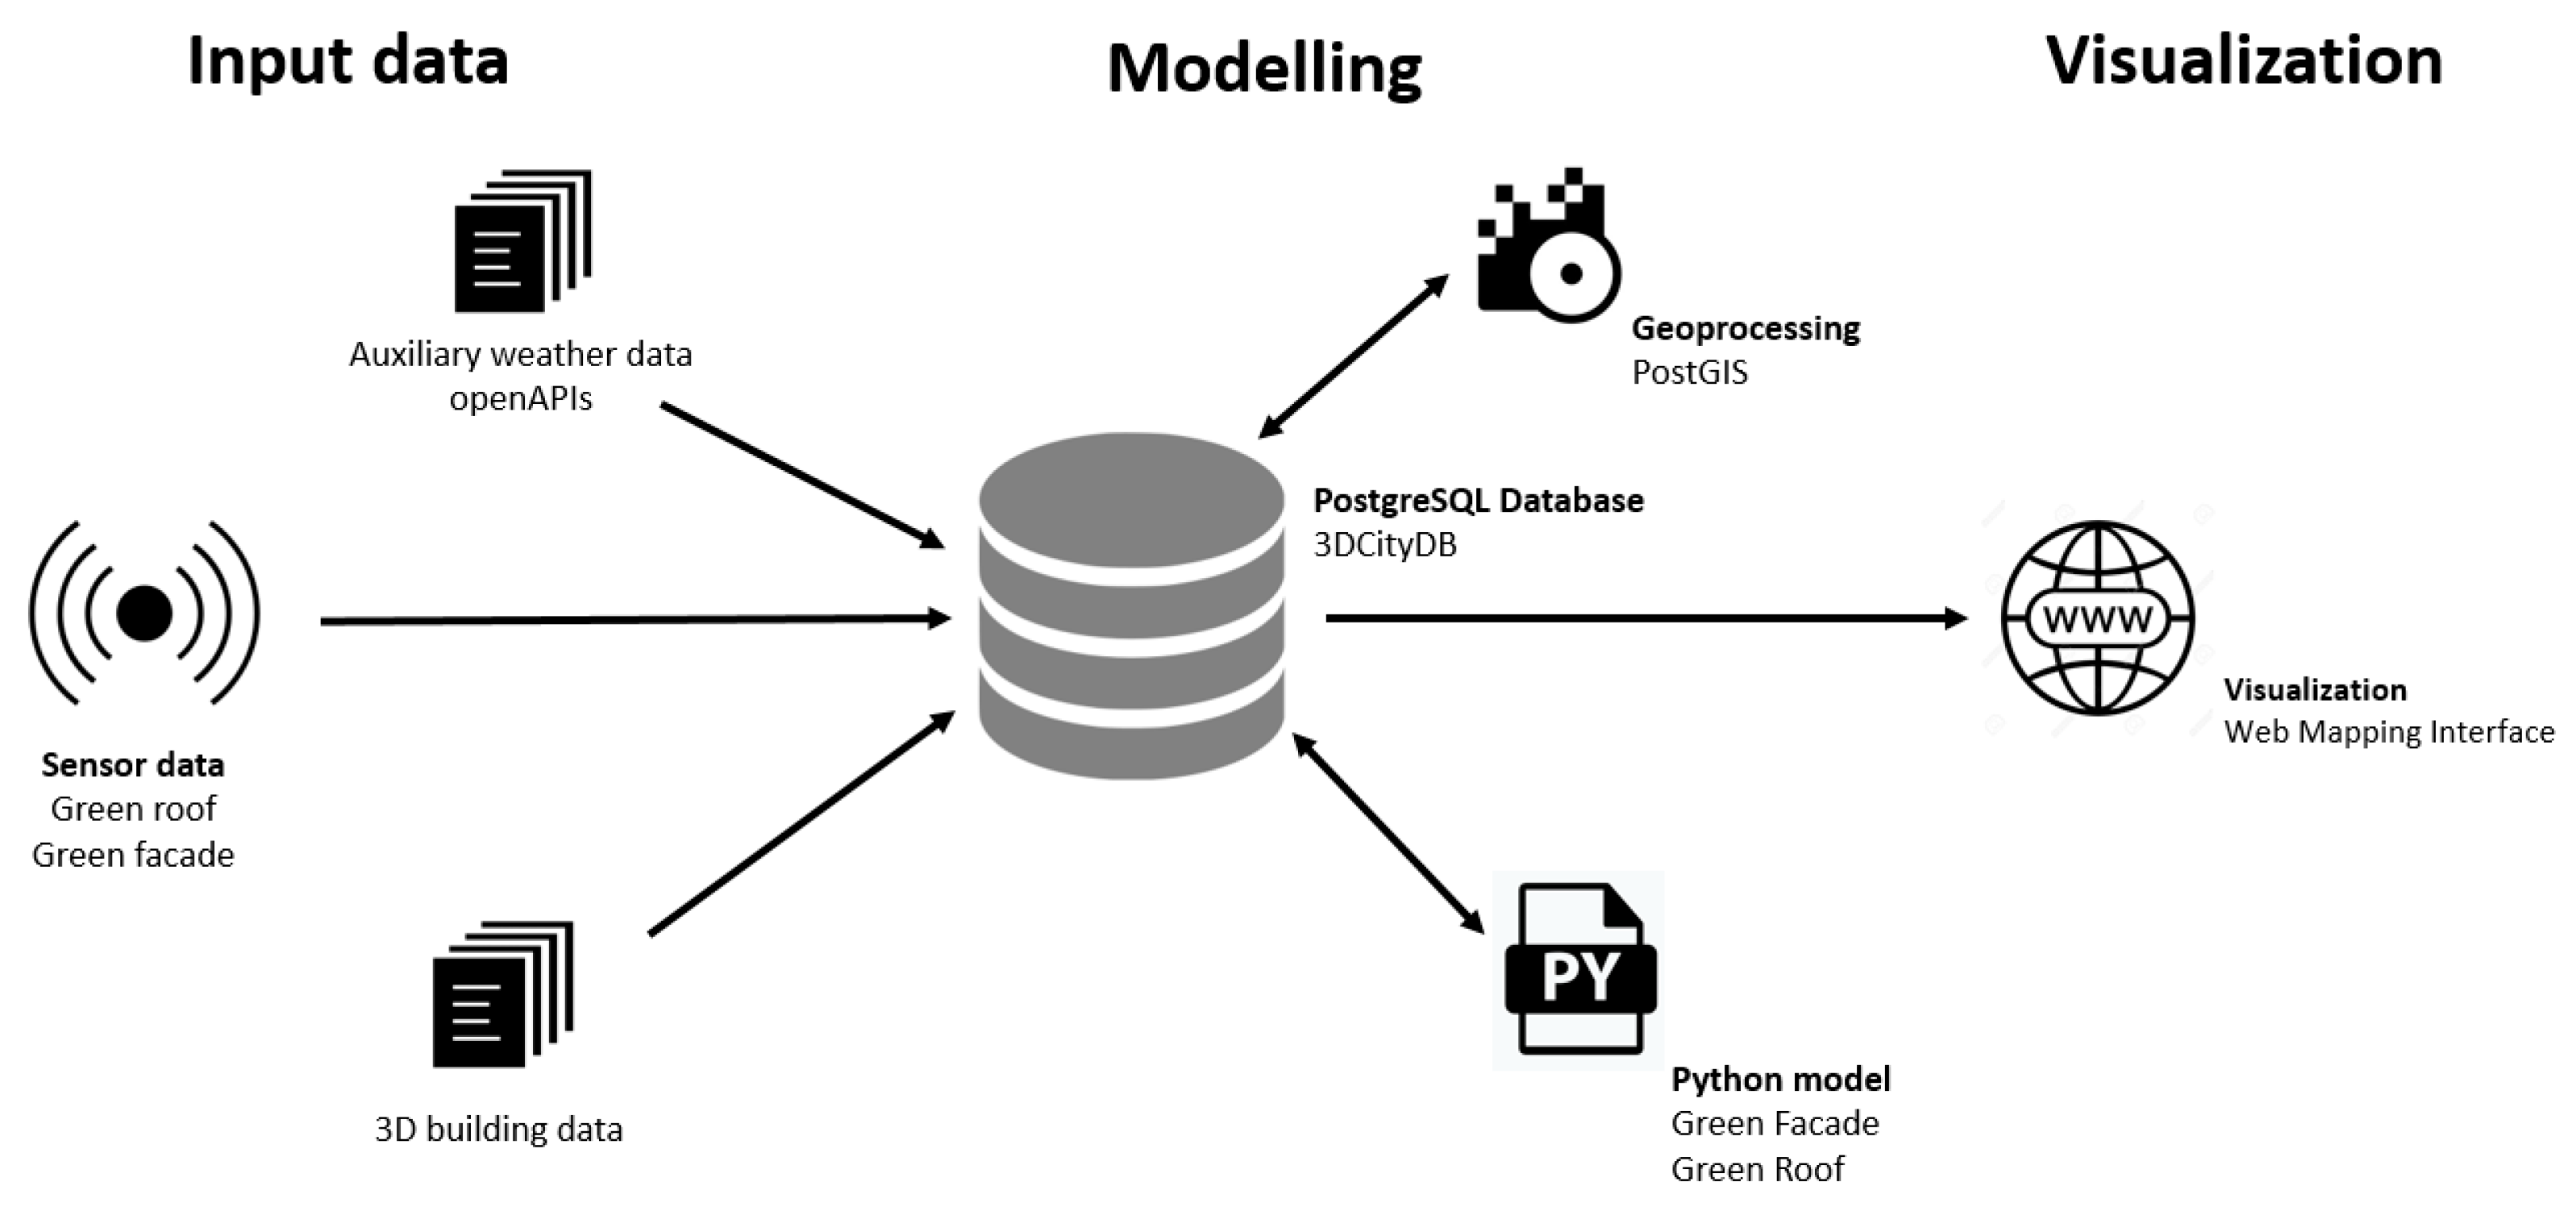
We decided to make the code development of our work in an environment based on Python and Structured Query Language (SQL). Python code focuses on code readability while SQL is used in almost all database products. As the team members of our developers’ group are mainly scientists and engineers with mid-level programming expertise, using readable and well used programming languages facilitates the skills set we need to maintain when moving from one task to another. The PostgreSQL allow us to input and store multiple data formats coming from open sensor APIs (weather data), our own sensor installations and auxiliary data such as the 3D city model. The development of the models was done in Python that provides direct connectivity to the PostgreSQL databases as well as to all spatial functionalists that are provided by the PostGIS [56] extension (Figure 2). For visualization of the results a web mapping application that can directly access data from the PostgreSQL database was developed.

Figure 2.
Data modelling and processing infrastructure and workflow.
To store data, we use the database version of CityGML, called 3DCityDB [57]. This data structure, which converts an XML described standard to UML, reduces by a factor of 10 the number of tables required to stored data when compared to the original CityGML standard and greatly facilitates the use of semantical city models data. The simplification and the software product are presented in [46] as are the advantages of using it.
4. Setup of the Experiment
Three experiments were conducted to measure the thermal performance of greenery systems during summertime. The sites are located in the cities of Illingen, Vaihingen an der Enz, and Ettlingen, which are positioned in the western part of the state of Baden-Württemberg in Germany (Figure A1 in Appendix A). All study sites are situated in a peri-urban environment consisting mostly of single-family houses at similar elevation levels between 180 m and 320 m mean sea level.
Two experiment setups, one for the green roof case study and on for the green façade case study are illustrated in Figure 3 and Figure 4. The experiments were conducted from 15 August 2017 until 9 September 2017. The meteorological conditions were similar in all sites, with its typical temperature climate zone characteristics of Southwestern Germany. Taken into account potential difficulties from previous research experiments that were conducted in similar conditions that may influence the measurement values in built environment for in situ experiments guidelines for the placement standard weather stations were considered [18,23,25,26].

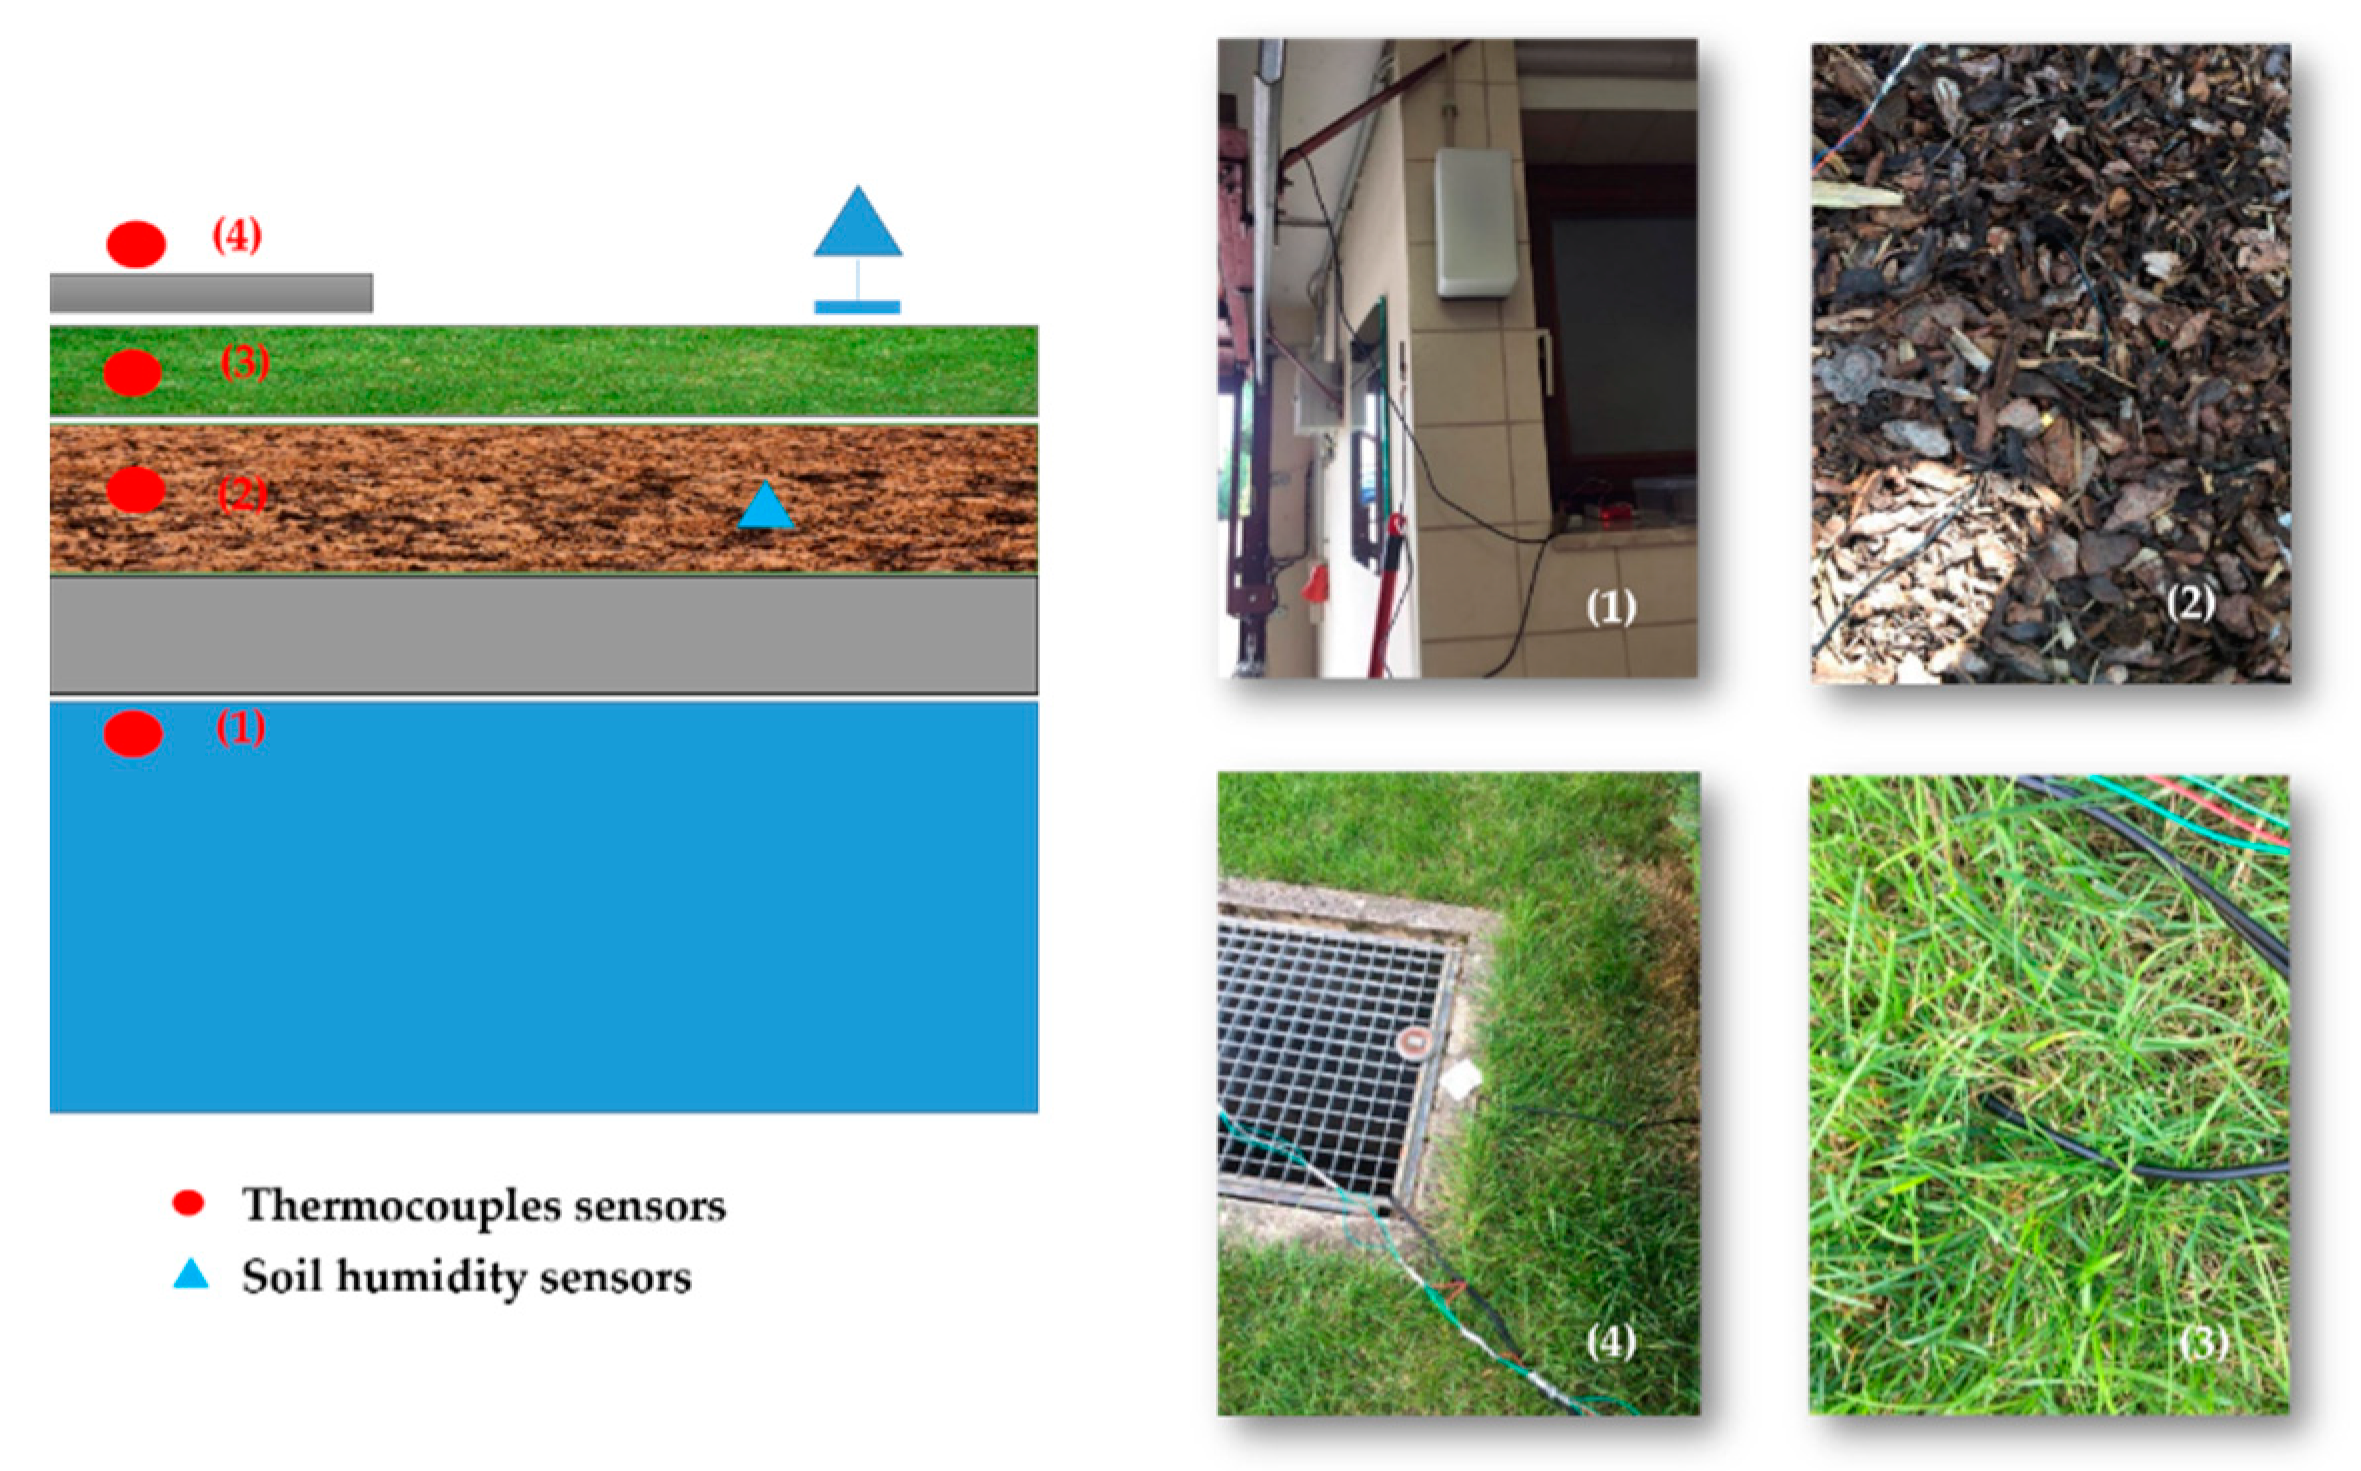
Figure 3.
Experiment setup and sensor placement (green roof in Illingen, Germany).
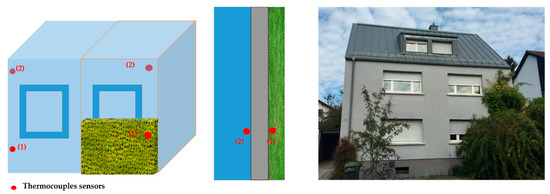
Figure 4.
Experiment setup and sensor placement (green façade in Ettlingen, Germany).
During the experimental campaign, calibration and validation were conducted to evaluate the accuracy of environmental sensors and test power consumption capacity. Several sensors were constructed to measure: (1) HDC100x: air temperature and humidity; (2) BMP200: air pressure; (3) TSL45315: luminosity; (4) Aenometer: wind speed and (5) DS18B20: concrete and substrate temperature (Table 1).

Table 1.
Measured parameters. The type of sensors measuring for individual parameters are listed out.
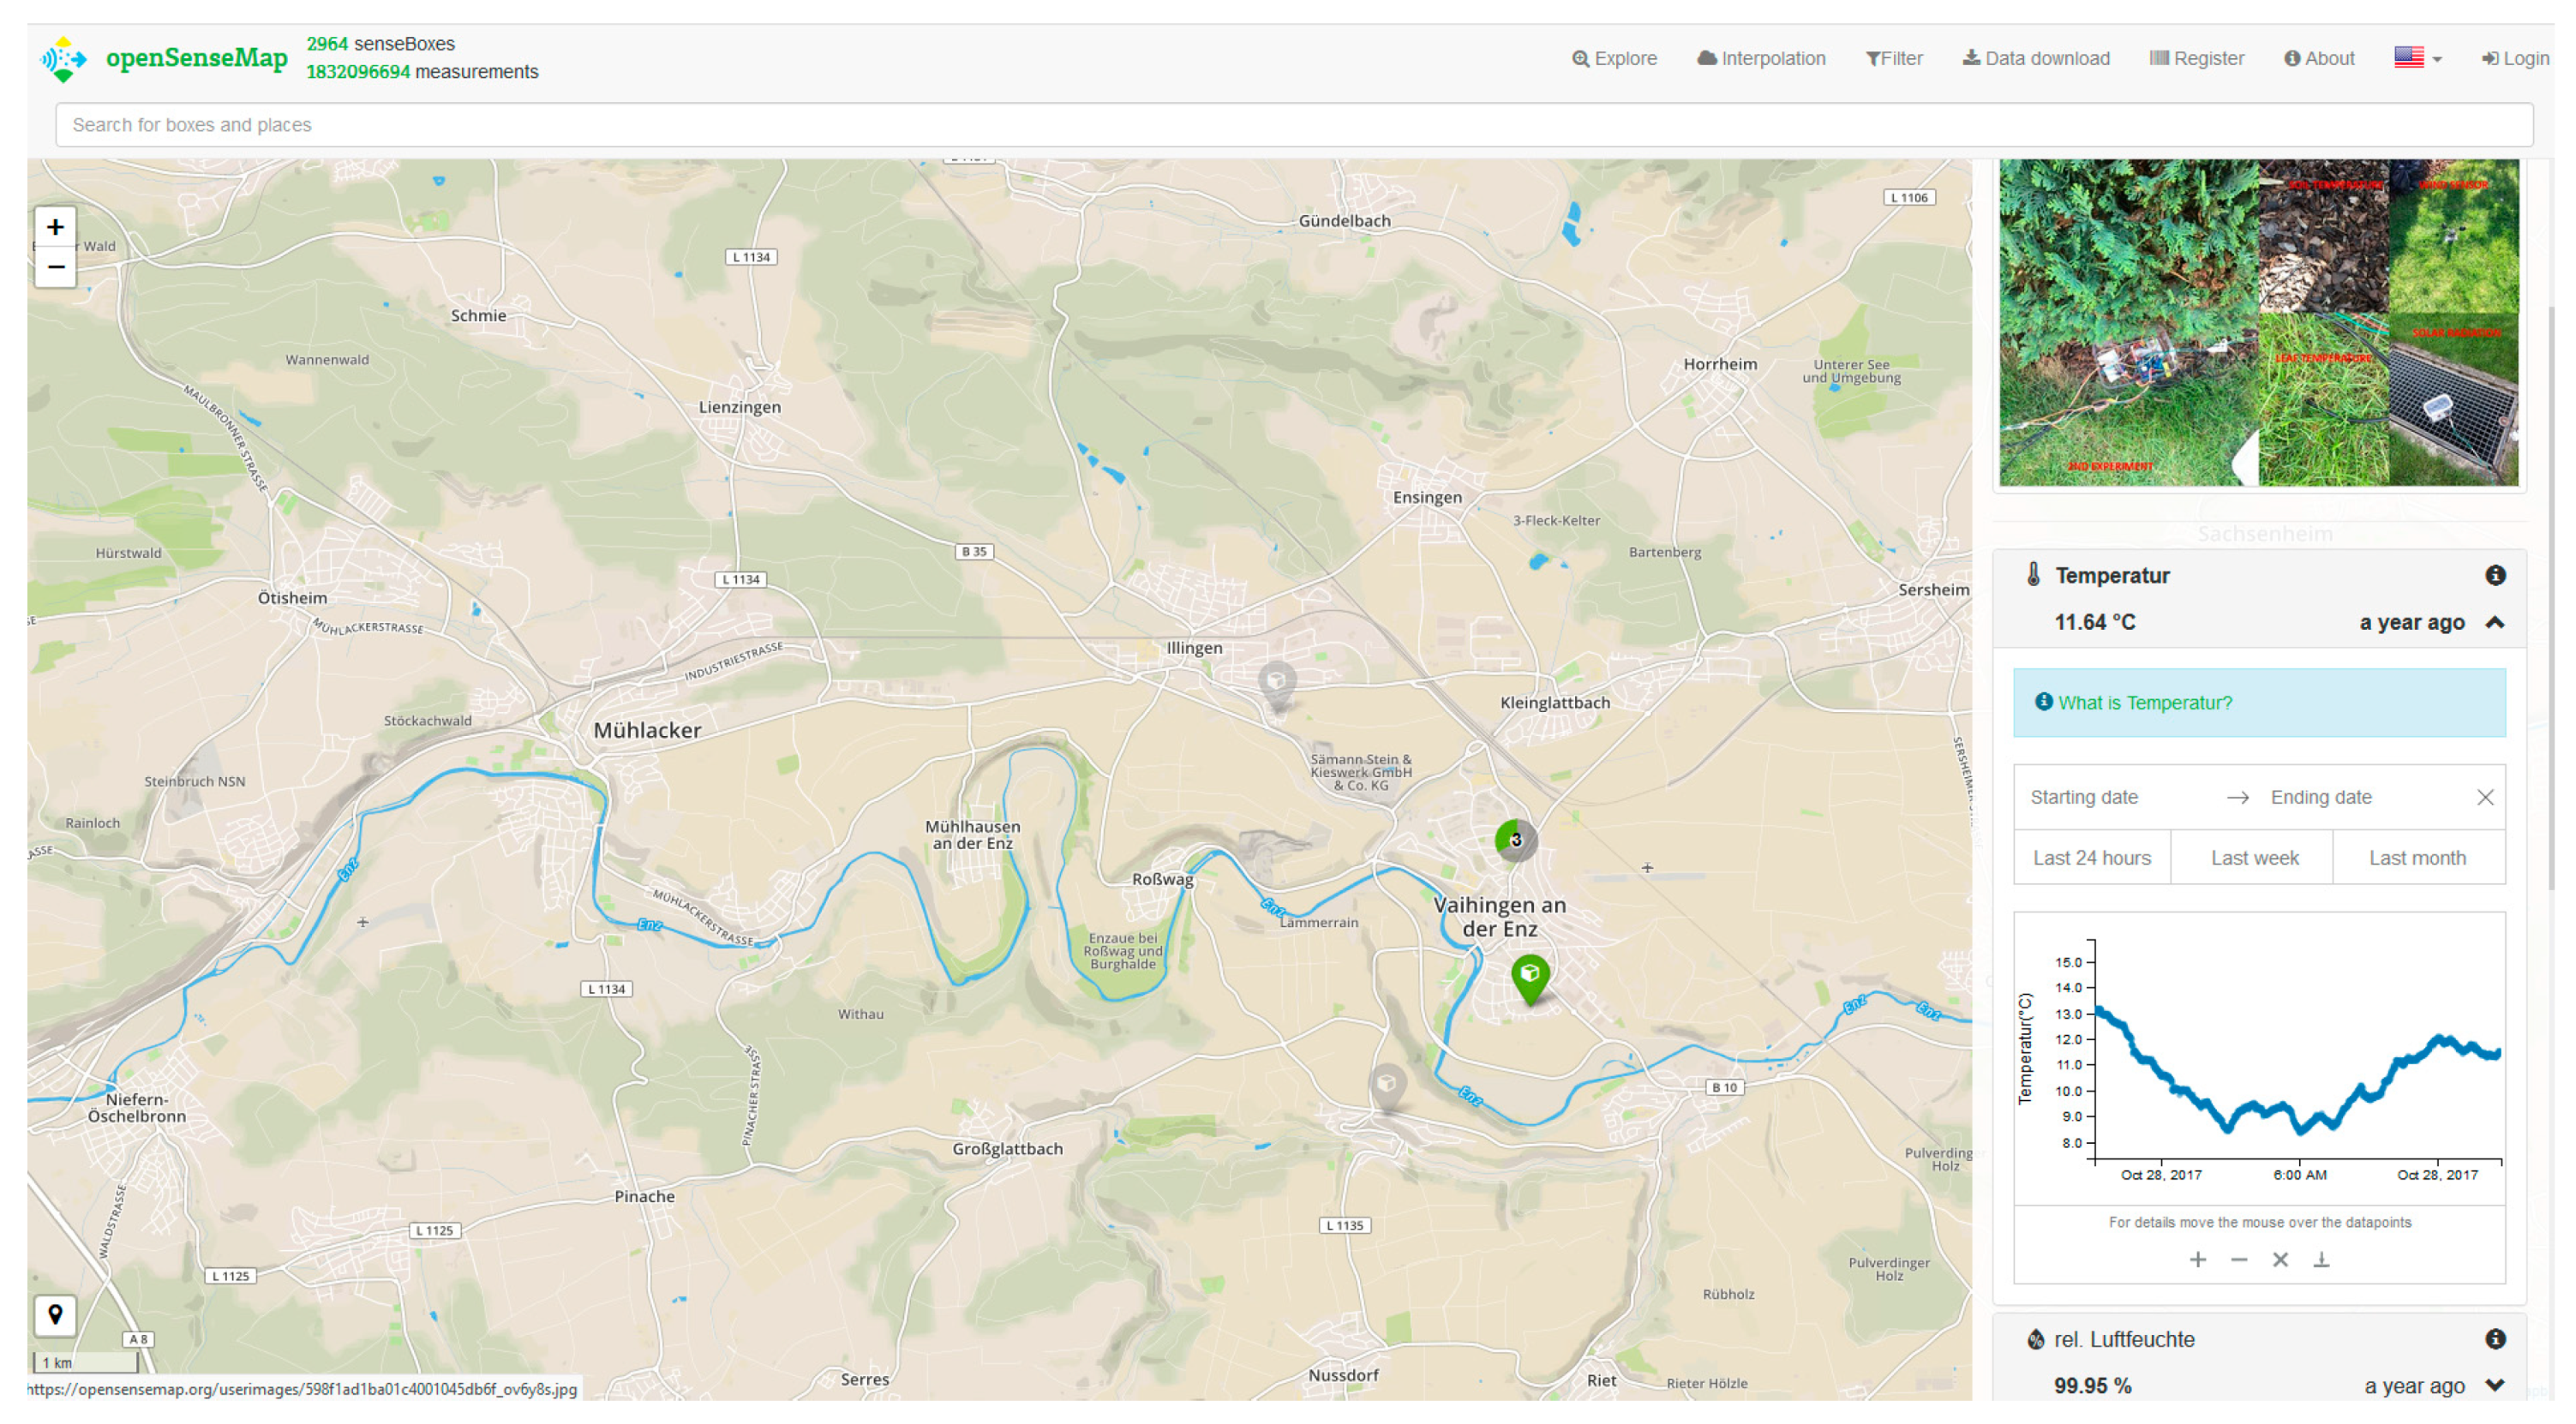
Two different data collection strategies were followed, as it was not possible in all locations to collect and upload the data via WiFi. In the case if no WiFi network is present the data will be stored locally on a SD card, when a WiFi network is present the data collected will be directly uploaded to the OpenSenseMap webserver displayed in Figure A2 in Appendix A and provided as an URL in the supplementary section of this paper.
The main purpose of the experiment is to capture the thermal behaviors of the greenery system in hot climate conditions. For each experiment, different types of plants were tested separately ranging from Sedum spurium for the green roofs study case in Illingen, graphs for green façades in the study case for Vaihingen, Enz, and Boston Ivy for the double-skin green façades study case in Ettlingen. For each plant type, different plant characteristics were determined such as leaf stomatal conductance, leaf area index etc. as listed in Table 2. The values are based on previous studies by [20,22,26,58].
Table 2.
Assumed values of plant and material parameters for the green roof and the green façade use cases.
The vegetation of the experiment on the green roof consists mostly of Sedum spurium, a typical vegetation type for this type of greenery system (about 10 cm thick). The substrate layer is about 30 cm in thickness, which comprises of peat soil. The average measured soil humidity is about 40%. Several parameters were defined based on existing literature (Table 2) [26]. The areal density of the canopy was assumed by directly measuring at the field site. The volumetric water ratio of soil was derived based on the measured soil humidity. Peri G et al. [59] summarized the values of radiative transmission through the plants in the green roof based on existing literature. The transmissivity of plants was assumed based on the LAI, which equals to 0.65 with the LAI of about 1.5. The thermal properties of the structural layer were assumed based on the wall materials, which is full brick with an average thickness of 30 cm. The density of materials is 400 kg/m3 and specific heat capacity is 0.2 kJ/kg K.
The vegetation for the green façade study area is Boston ivy, a typical type of plants for traditional green façade with an average thickness of 50 cm. Several parameters of plants and materials were assumed based on existing literature and measurements [20,22,59]. For instance, the values of leaf absorptivity and radiation attenuation were adopted from Susorova et al. [22]. The leaf area index and dimension were directly measured at the field site. The LAI was measured by counting the area of leaves per ground and were defined as:
The values of wall materials were assumed based on the wall materials, which are full brick with the thickness of 40 cm with the wall absorptivity and emissivity of 0.90. The density and specific heat capacity of the wall materials were also assumed as 400 kg/m3 and 0.20 J/kg K, respectively.
5. Model Development
5.1. Green Façade Model
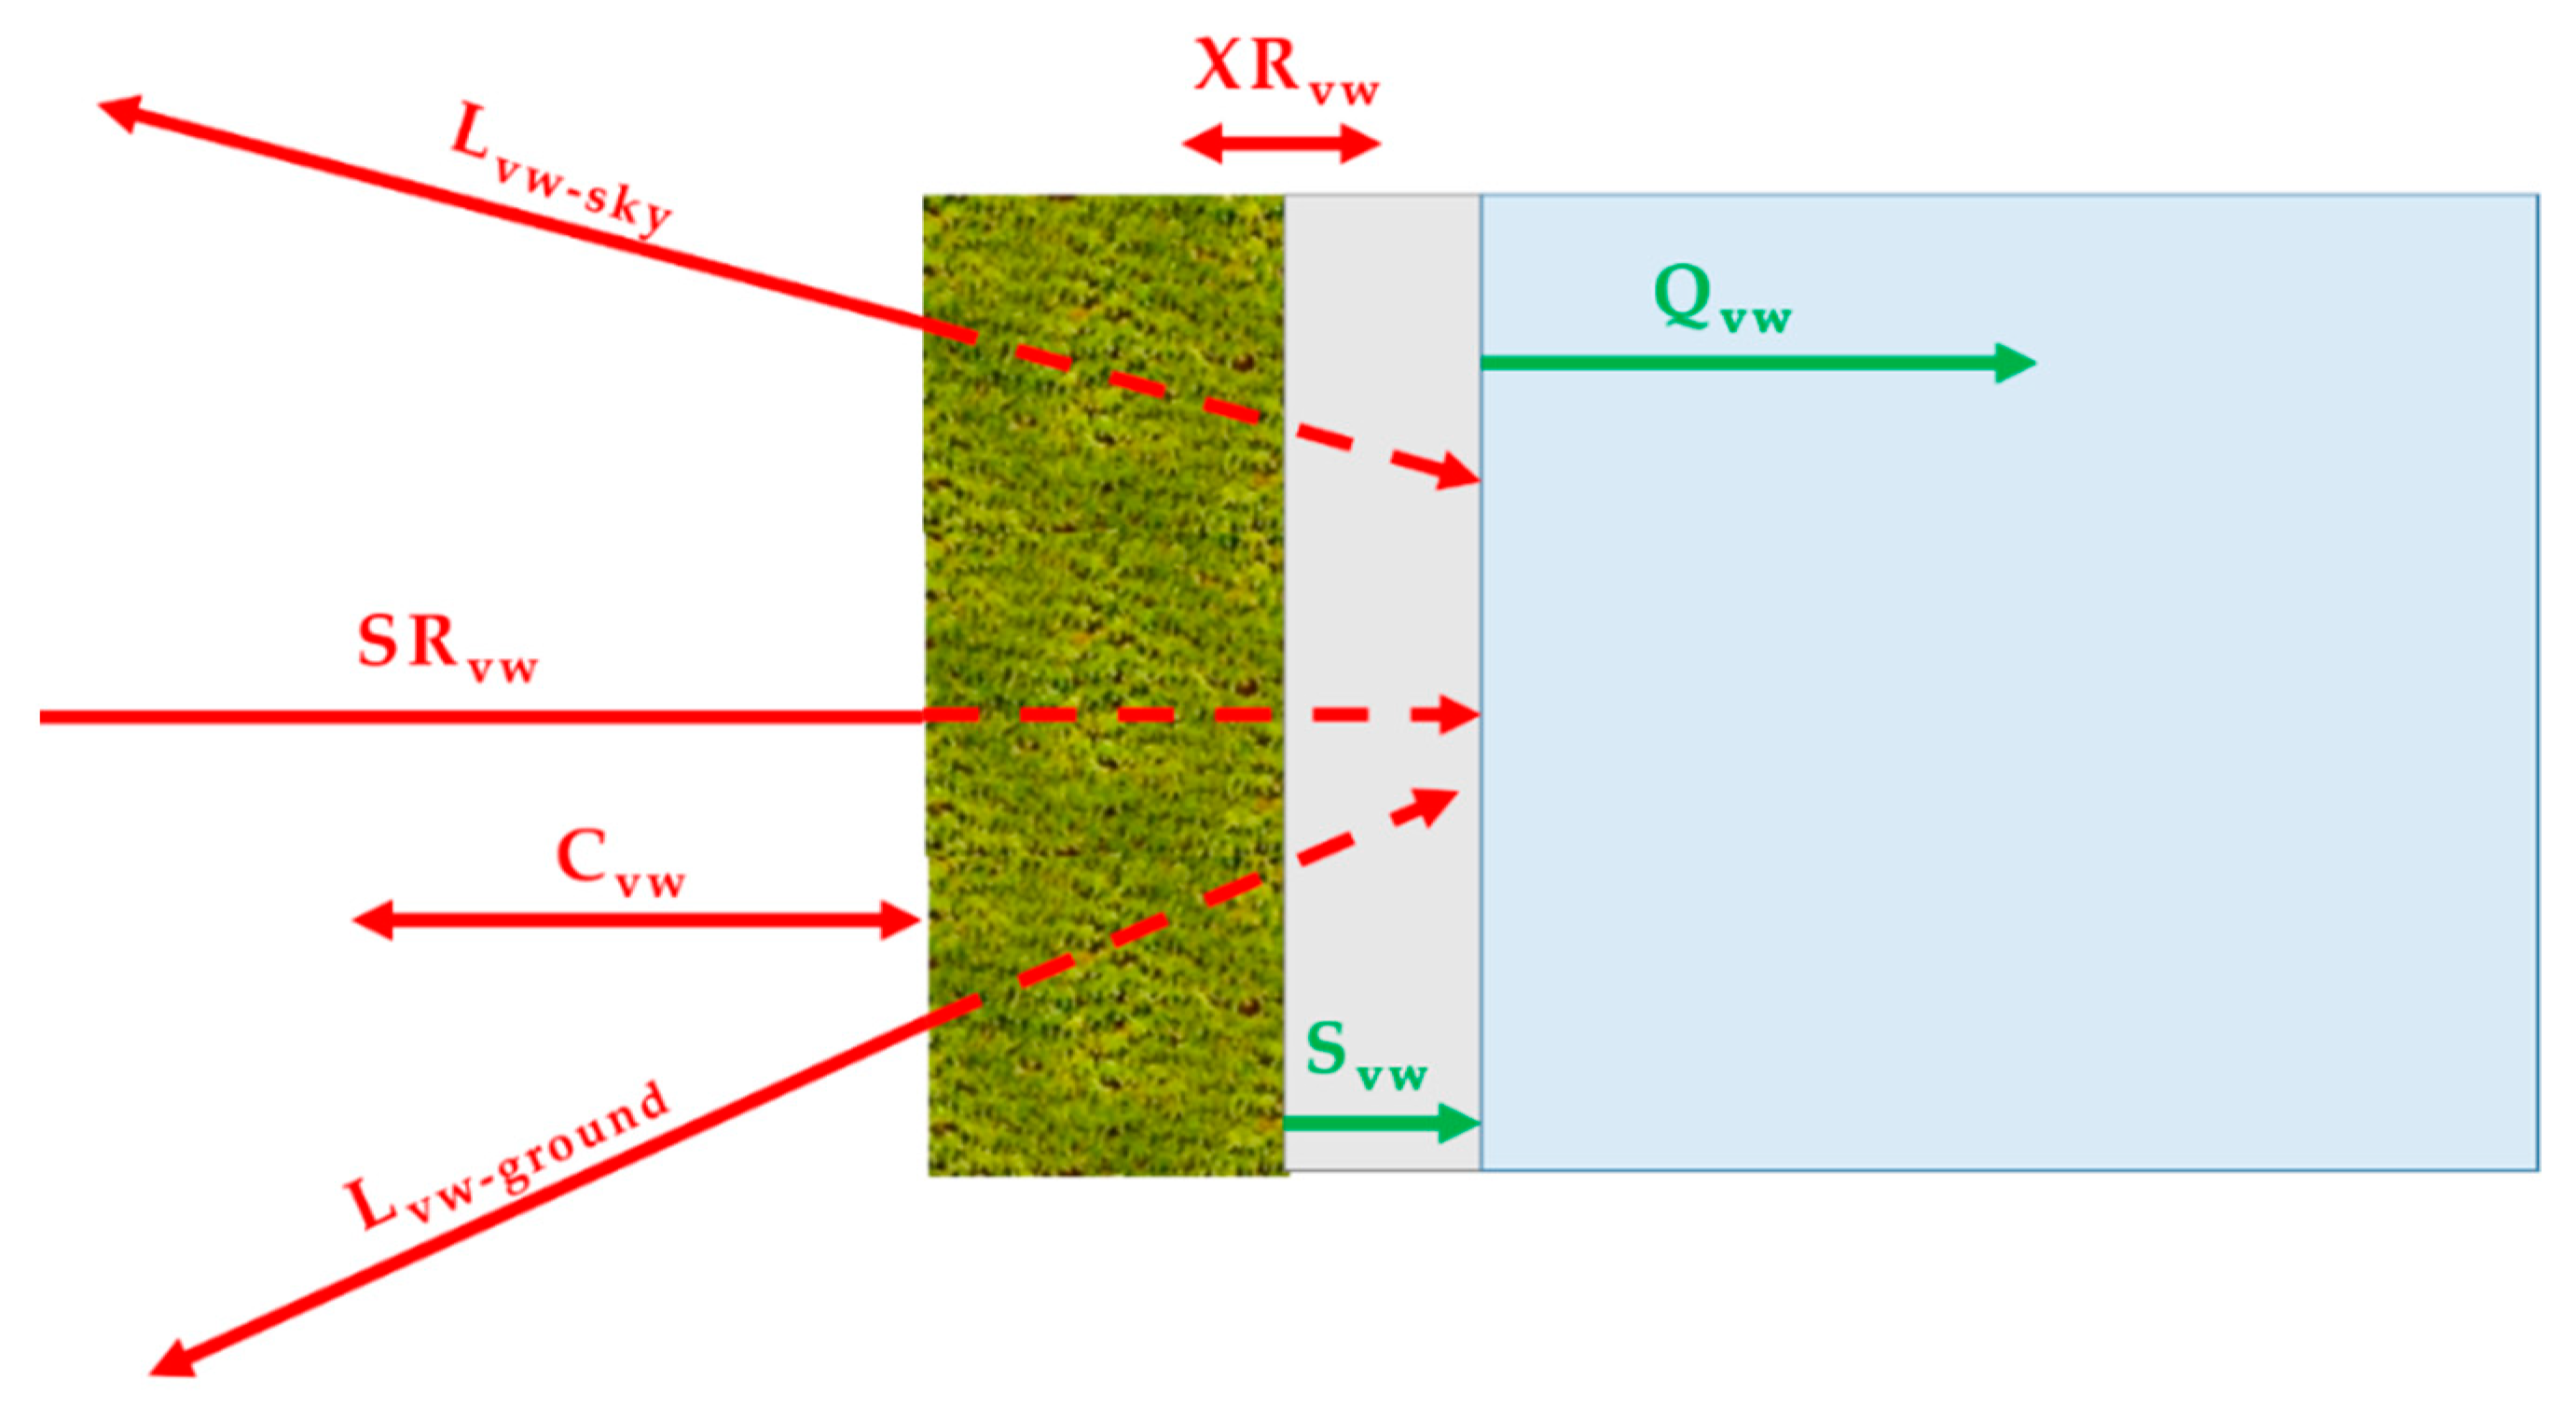
The first model, the green façade model, is based on Susorova et al. [22] which is a 1-dimensional green facade model. This model offers a capacity to estimate the thermal performance of the green façade envelope on buildings, with respect to the effect of plant physiological processes (evapotranspiration, radiative, and convective heat exchange) and weather conditions. Due to an absence of a soil layer in this model, it cannot be directly used to simulate the thermal properties of the green roof. Therefore, the aim of this research is to advance this existing green façade model and evaluate its performance towards the thermal performance of the green roof. The primary thermal exchange processes are described in Figure 5.

Figure 5.
Vertical cross-section of the green façade model (after [22]).
The green façade model accounts for shortwave radiation transmission through the plant layer, long-wave radiative exchange between the plant and surrounding environment, convective heat transfer to and from vegetation, and the radiative exchange (or evapotranspiration) of leaves. Furthermore, it comprises of the following heat transfer mechanisms: radiation, convection, evapotranspiration, storage and conduction. The energy balance of the green façade model is defined as:
where SRvw refers to the shortwave radiation to/from the vegetated façade (W/m2), LRvw presents the longwave radiation to/from the vegetated façade (W/m2), Cvw depicts the convection to/from the vegetated façade (W/m2), XRvw refers to the radiative exchange between the bare façade/soil and plant layer (W/m2), Qvw presents the heat conduction through the wall behind the vegetated façade (W/m2), and Svw refers to the heat stored in the wall behind the vegetated façade (W/m2). The heat storage is only considered for structural layers due to lacking substrate layers.
5.2. Green Roof Model
The second model, the green roof model, is directly modified based on the existing green façade model developed by Susorova et al. [22] with the distinction that we added the thermal behavior of the substrate layer. According to Tabares-Velasco [60], the thermal storage in the foliage is often neglected in vegetation or soil-vegetation models. This is due to the amount of the heat stored in plants, which accounts for 1–2% of the net radiation, according to Gates [61]. In contrast, the thermal storage in substrate and structural layers is more significant. For instance, He et al. [26] pointed out that the heat storage in a green roof contributes to 5.36% of heat dissipation while a common roof accounts for 0.04%. Even though this proportion is not significant compared to other thermal components (e.g., latent heat), it is also necessary to be included it in heat exchange models because heat-insulated performance varies based on U-values of different materials that can be defined as:
where is the structural thickness (m), refers to the specific heat of structural material (J/kg K), is the structural material density (kg/m3), defines the subtract thickness (m) the specific heat of substrate material (J/kg K), is the substrate material density (kg/m3), refers to the specific heat of water (J/kg K), refers to the water density in substrate layer (kg/m3), and the time (s).
Therefore, the second term of the equation is neglected. In contrast, the soil layer in green roofs act as a major component of thermal storage. Thus, both terms in the equation [3] need to be taken in account.
The thermal storage is solved for the temperature behind the vegetation or the substrate layers at a resolution of 30 s. These values are calculated using a numerical bisection method, which is inspired by Susorova et al. [22]. The ratio of water in the substrate layer contributes to the humidity of the soil, which also contributes to the heat-insulated capacity of soil layer. The current temperature is calculated based on the previous temperature and the modelled results are correlated to the measured results to verify the accuracy of the developed model.
6. Results
The experiments were conducted during the summer time from 15 August 2017 to September 10, 2017. The monitoring parameters include air temperature, relative humidity, air pressure, light intensity, wind speed, wall temperature, and soil humidity.
6.1. Results from the Measurement Campaign
Structural Temperature
The thermal behavior of the plant layers with respect to the energy savings in buildings are evaluated based on the temperature difference of the wall behind the vegetation and the wall without vegetation. Thus, the experiments were conducted not only to collect climate data but also the temperature of the structural layers (wall), the substrate layers (soil) and the vegetation layers. The data transmission via wireless communication can be viewed at the OpenSenseMap setup of the experiment that is provided as a link in the supplementary section of this paper.
For validation of our measurements we have compared it with local smart homes weather stations nearby which are freely available through the open APIs of Weather Underground [62] and Netatmo Weathermap [40]. Our values were consistent in most cases (except for wind speed data) for the time span mentioned above, it is also the reason for which we replaced the wind measurements with values from the smart homes weather station.
From our measurement campaign after performing data analysis and treatment, we chose due to consistency and for validation of our models the following data from 26 August 2017 to 30 August 2017.
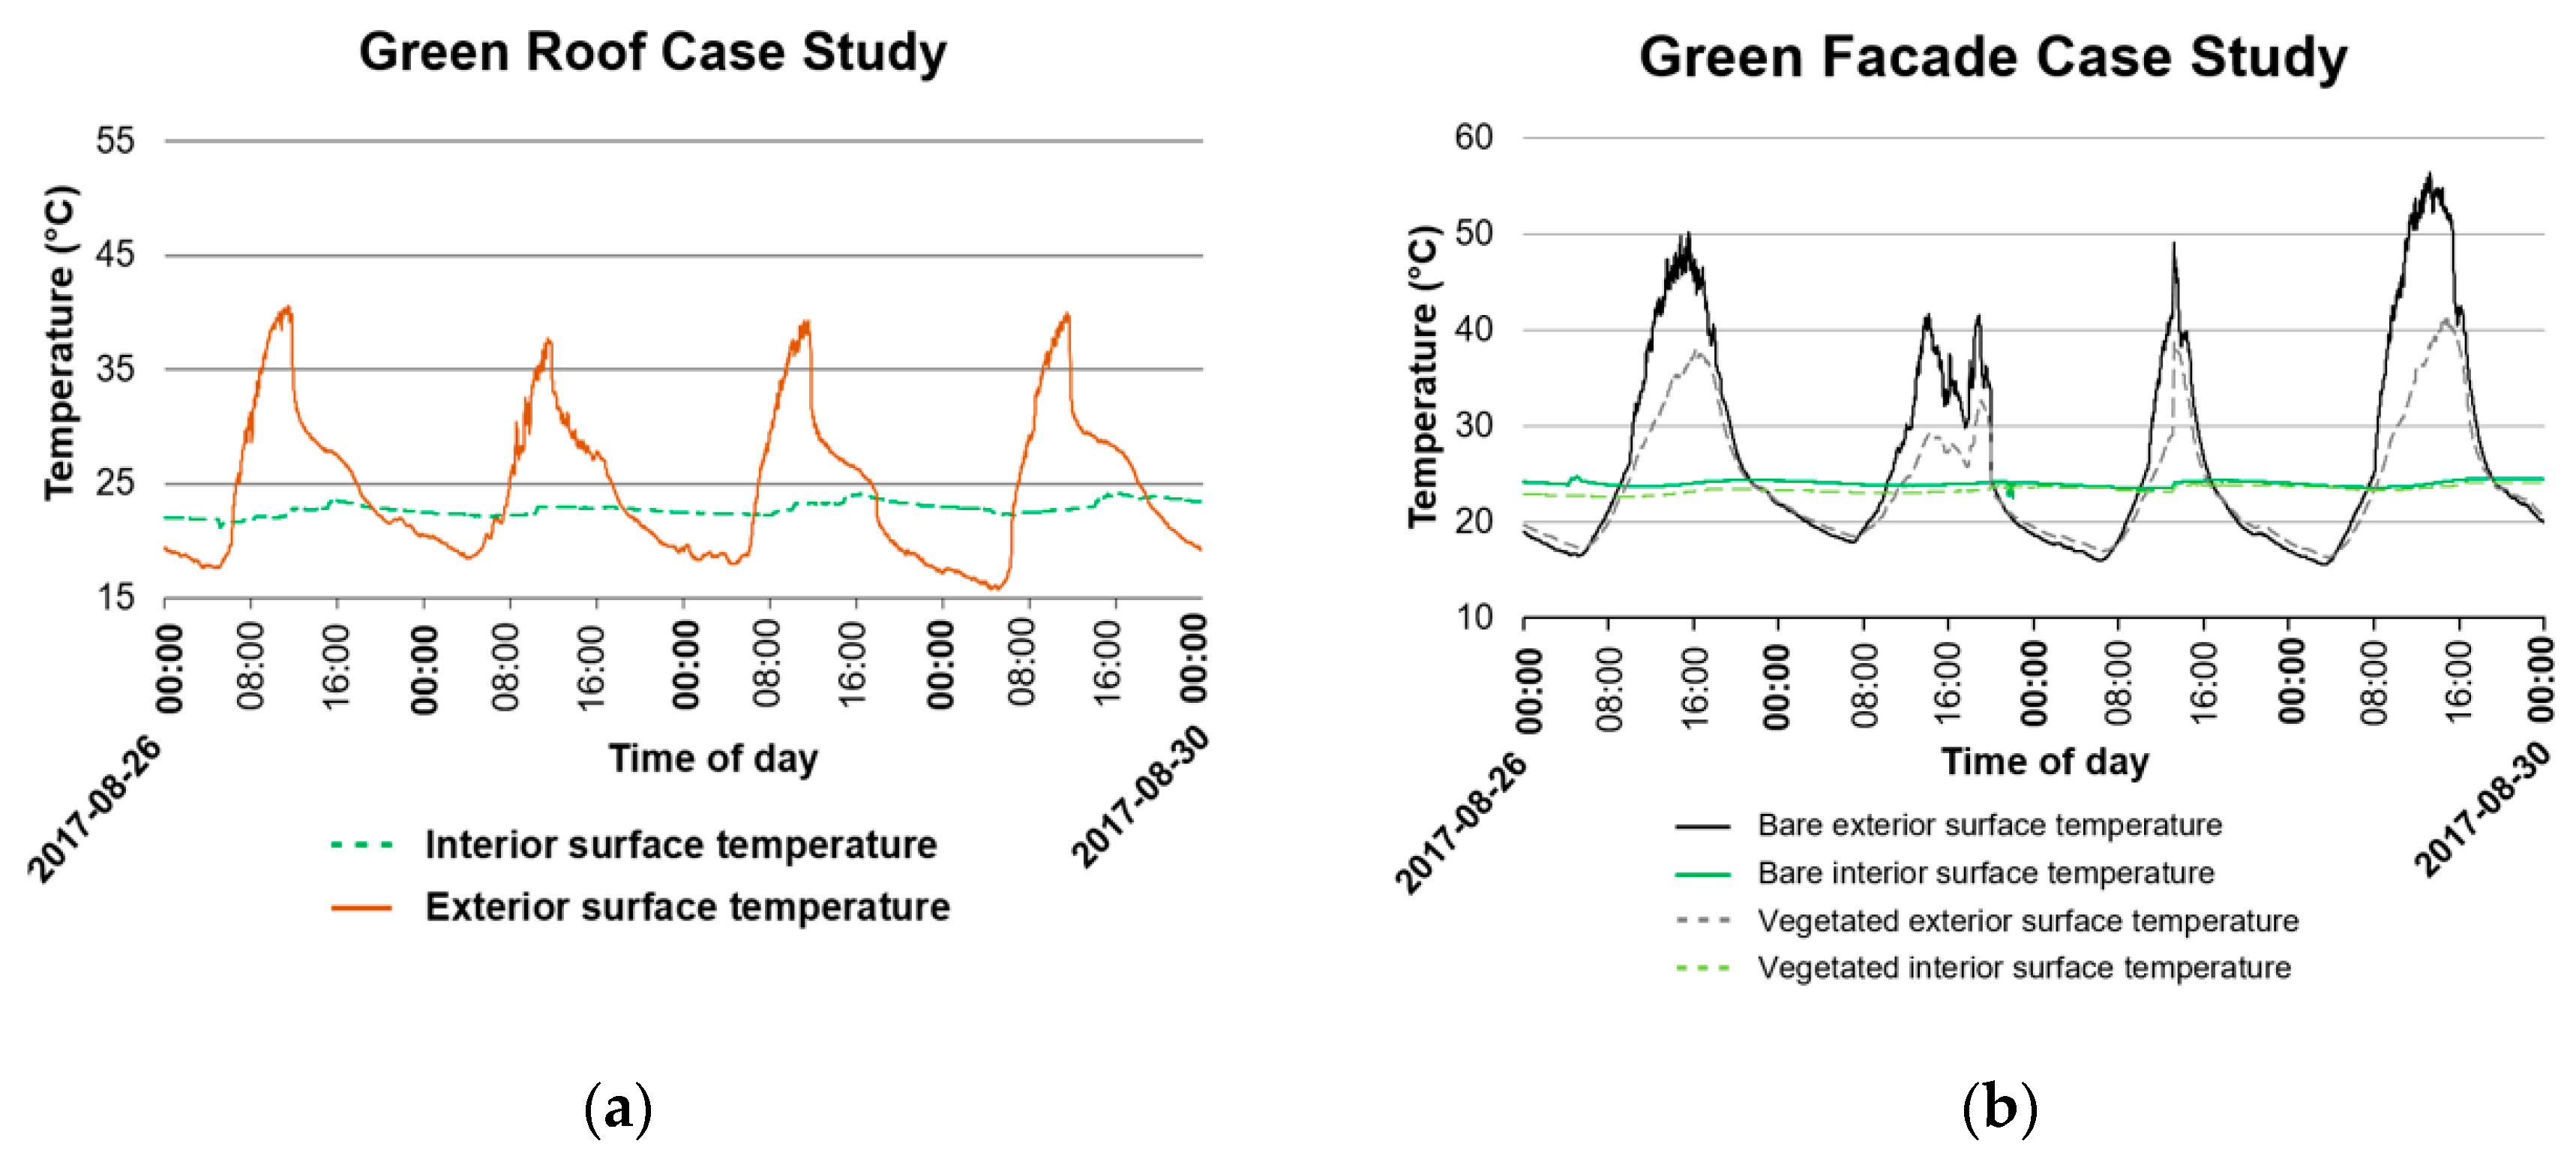
It can be observed from Figure 6a, that 23 °C is approximately the average hourly indoor temperature of the green roof building. The temperature of the bare wall, which is strongly influenced by the sunlight intensity, varied between 40 °C at daytime (11:00–12:00 UTC) and 15 °C at night (02:00–03:00 UTC) on 26 August 2017. This phenomenon explains the thermal performance of buildings with the presence of green roof layer.
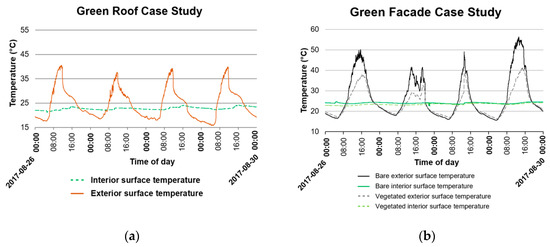
Figure 6.
Temporal trends of the indoor and bare wall temperature in (a) Green roof case study (one simulated room); (b) Green façade case study (two simulated rooms)
In the case of the green façade in Ettlingen, the experiment was conducted for two rooms: one without the green façade (bare room) and one with the green façade (vegetated room). Consequently, the thermocouples sensors were set up inside and in front of both rooms to compare their thermal properties. It can be observed from Figure 6b that maximum temperature of the bare wall was about 15 °C higher than the temperature of the vegetated wall. Besides, the indoor temperature of the bare room was higher than the vegetated room about 1 °C, which proves the efficiency of the green layer on the cooling effect.
6.2. From Our Models
We introduced the measured climate data in our green roof and façade models to calculate leaf temperature, heat transfer via the roof or facades of a building for the same time span as the validated measured data with the same temporal resolution of our measurements (30 s).
7. Discussion
7.1. Model Significance
The model developed in this research is just one component of the factors that can reduce the total energy demand in a building. This work is part of an entire library, called aEneAs (Energy Assessment) developed in EIFER, which has the scope of building modeling providing yearly demand values with significant accuracy at district, neighborhood and city level. The first model from this library, implementing the Passiv Haus method within the same semantical city environment is presented in [47].
However, even if greenery in cities is just one solution, it is currently providing multiple advantages as a nature-based solution, and in the context of smart cities greenery is seen as a solution with regards to heating, cooling, UHI mitigation, storm water retention, air particles filtering, noise reduction and aesthetics [30].
As can be seen with the samples, we tested our model on small geographical extents, different spatial scales, and buildings. In practice (due to data ownership, privacy, and many other reasons) the parameters required for detailed energy assessment studies are hard to come by at building level. To bypass this issue, we make statistical assumptions on the energy description parameters, which reduces the accuracy of the results at this spatial scale. However, once this model gets used on a statistically significant area the results begin to become accurate. This effect within parametric building modelling as well as a comparison with data driven models has been performed by [31]. This study indicates the best way to use our model, on larger areas that have statistical significance in the total urban energy demand. In this way, the assumptions we made even themselves out.
7.2. Model Validation
Thermal performance in the green model is the main interest to estimate the thermal efficiency of the greenery system on buildings. Therefore, weather data from the measuring campaign in the experiment was used in the green models to evaluate the implementation of the green facade method and to validate the green roof developed model
According to the American Institute of Aeronautics and Astronautics (AIAA) Guide [63], model validation is needed to demonstrate the magnitude of a model capacity and to illustrate its applicably in the real world. It is performed to quantify the accuracy of the model by comparing the results with the experimental data [64]. RMSE (root mean square error) was applied for the validation test between the measured and modelled values defined as:
where is the modelled or predicted value, the measured or reference value, and the number of samples.
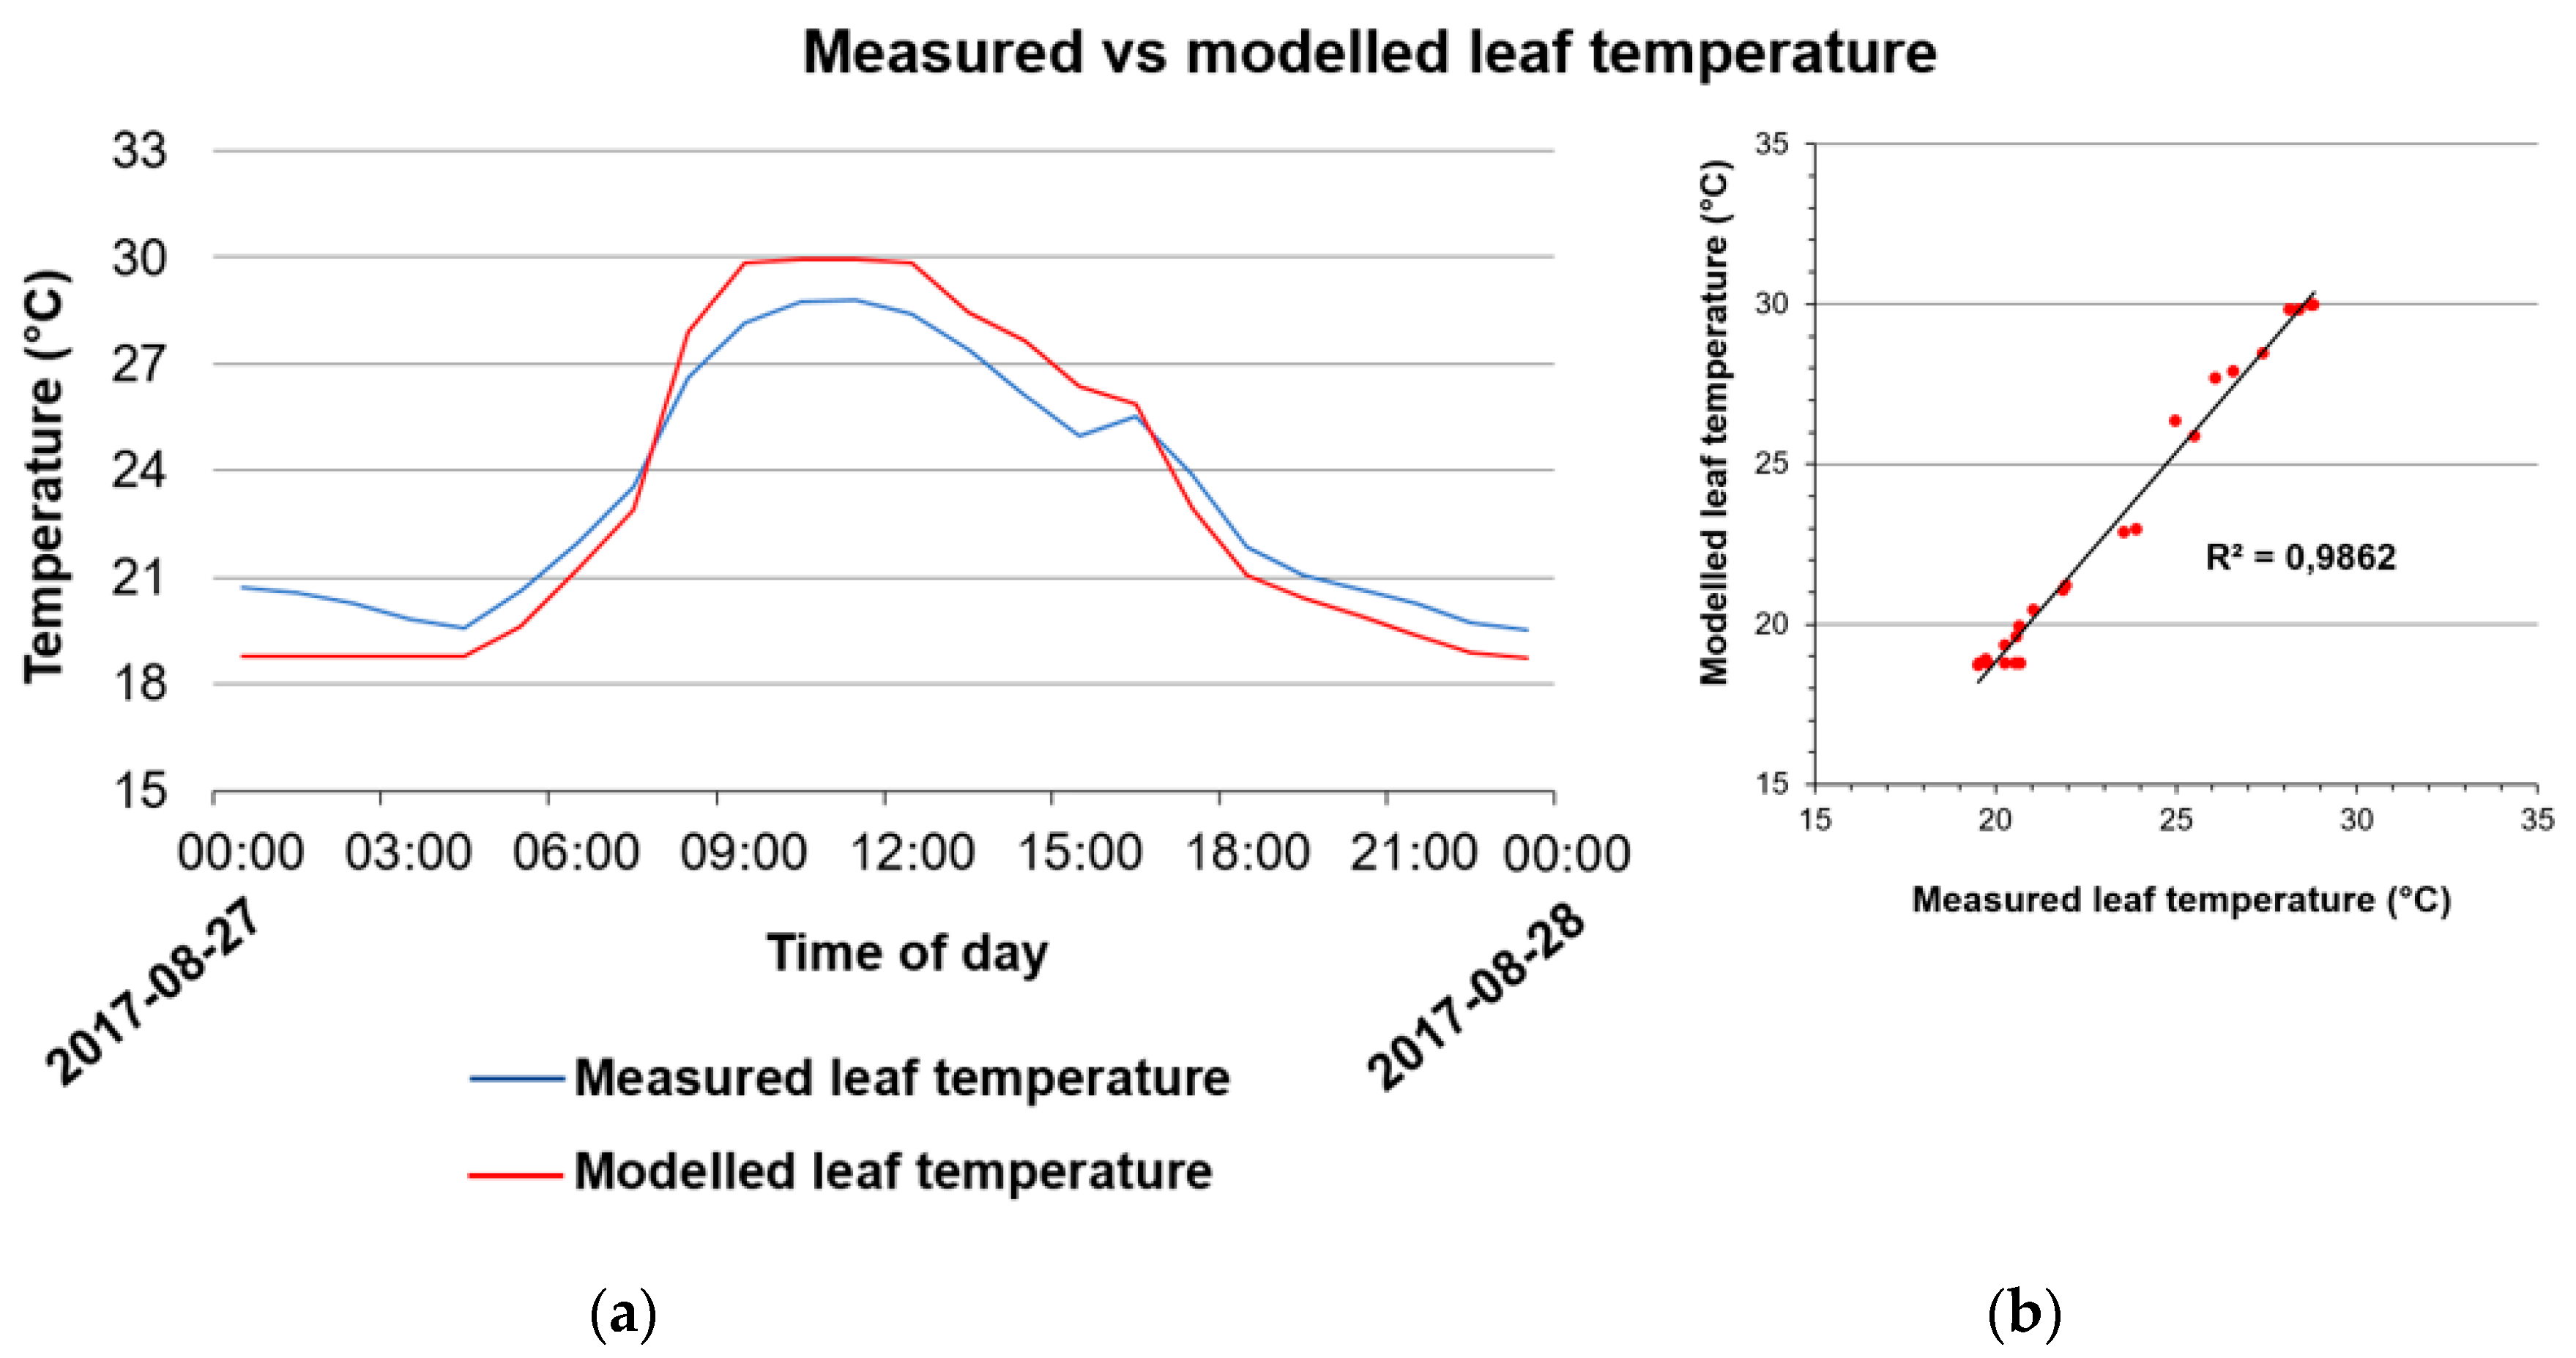
Figure 7 depicts the dependencies between the measured and modelled leaf temperature for the green roof case study on 27 August 2017. The results show that the developed green roof model is able to predict the leaf temperature compared to experimental data with the R2 of 0.98 and a root mean square () of 0.59 °C, which proves the high confidence of the green model.
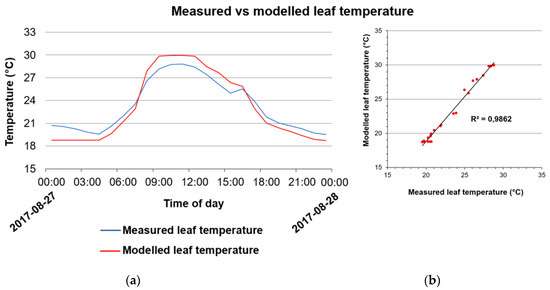
Figure 7.
Comparison of the measured and modelled leaf temperature at the green roof on a sunny day 27 August 2017. (a) Presentation of temporal changes of the values and (b) Correlation analysis of the variables. The measured leaf temperature was analyzed using a median filter approach with the kernel size of 5.0.
The green façade model is established for two rooms with different conditions (1) a bare wall room without the green façade (bare room) and (2) a room with the green façade (vegetated room). The thermal performance in both rooms were estimated and compared to understand the thermal properties of the vertical greenery layers.
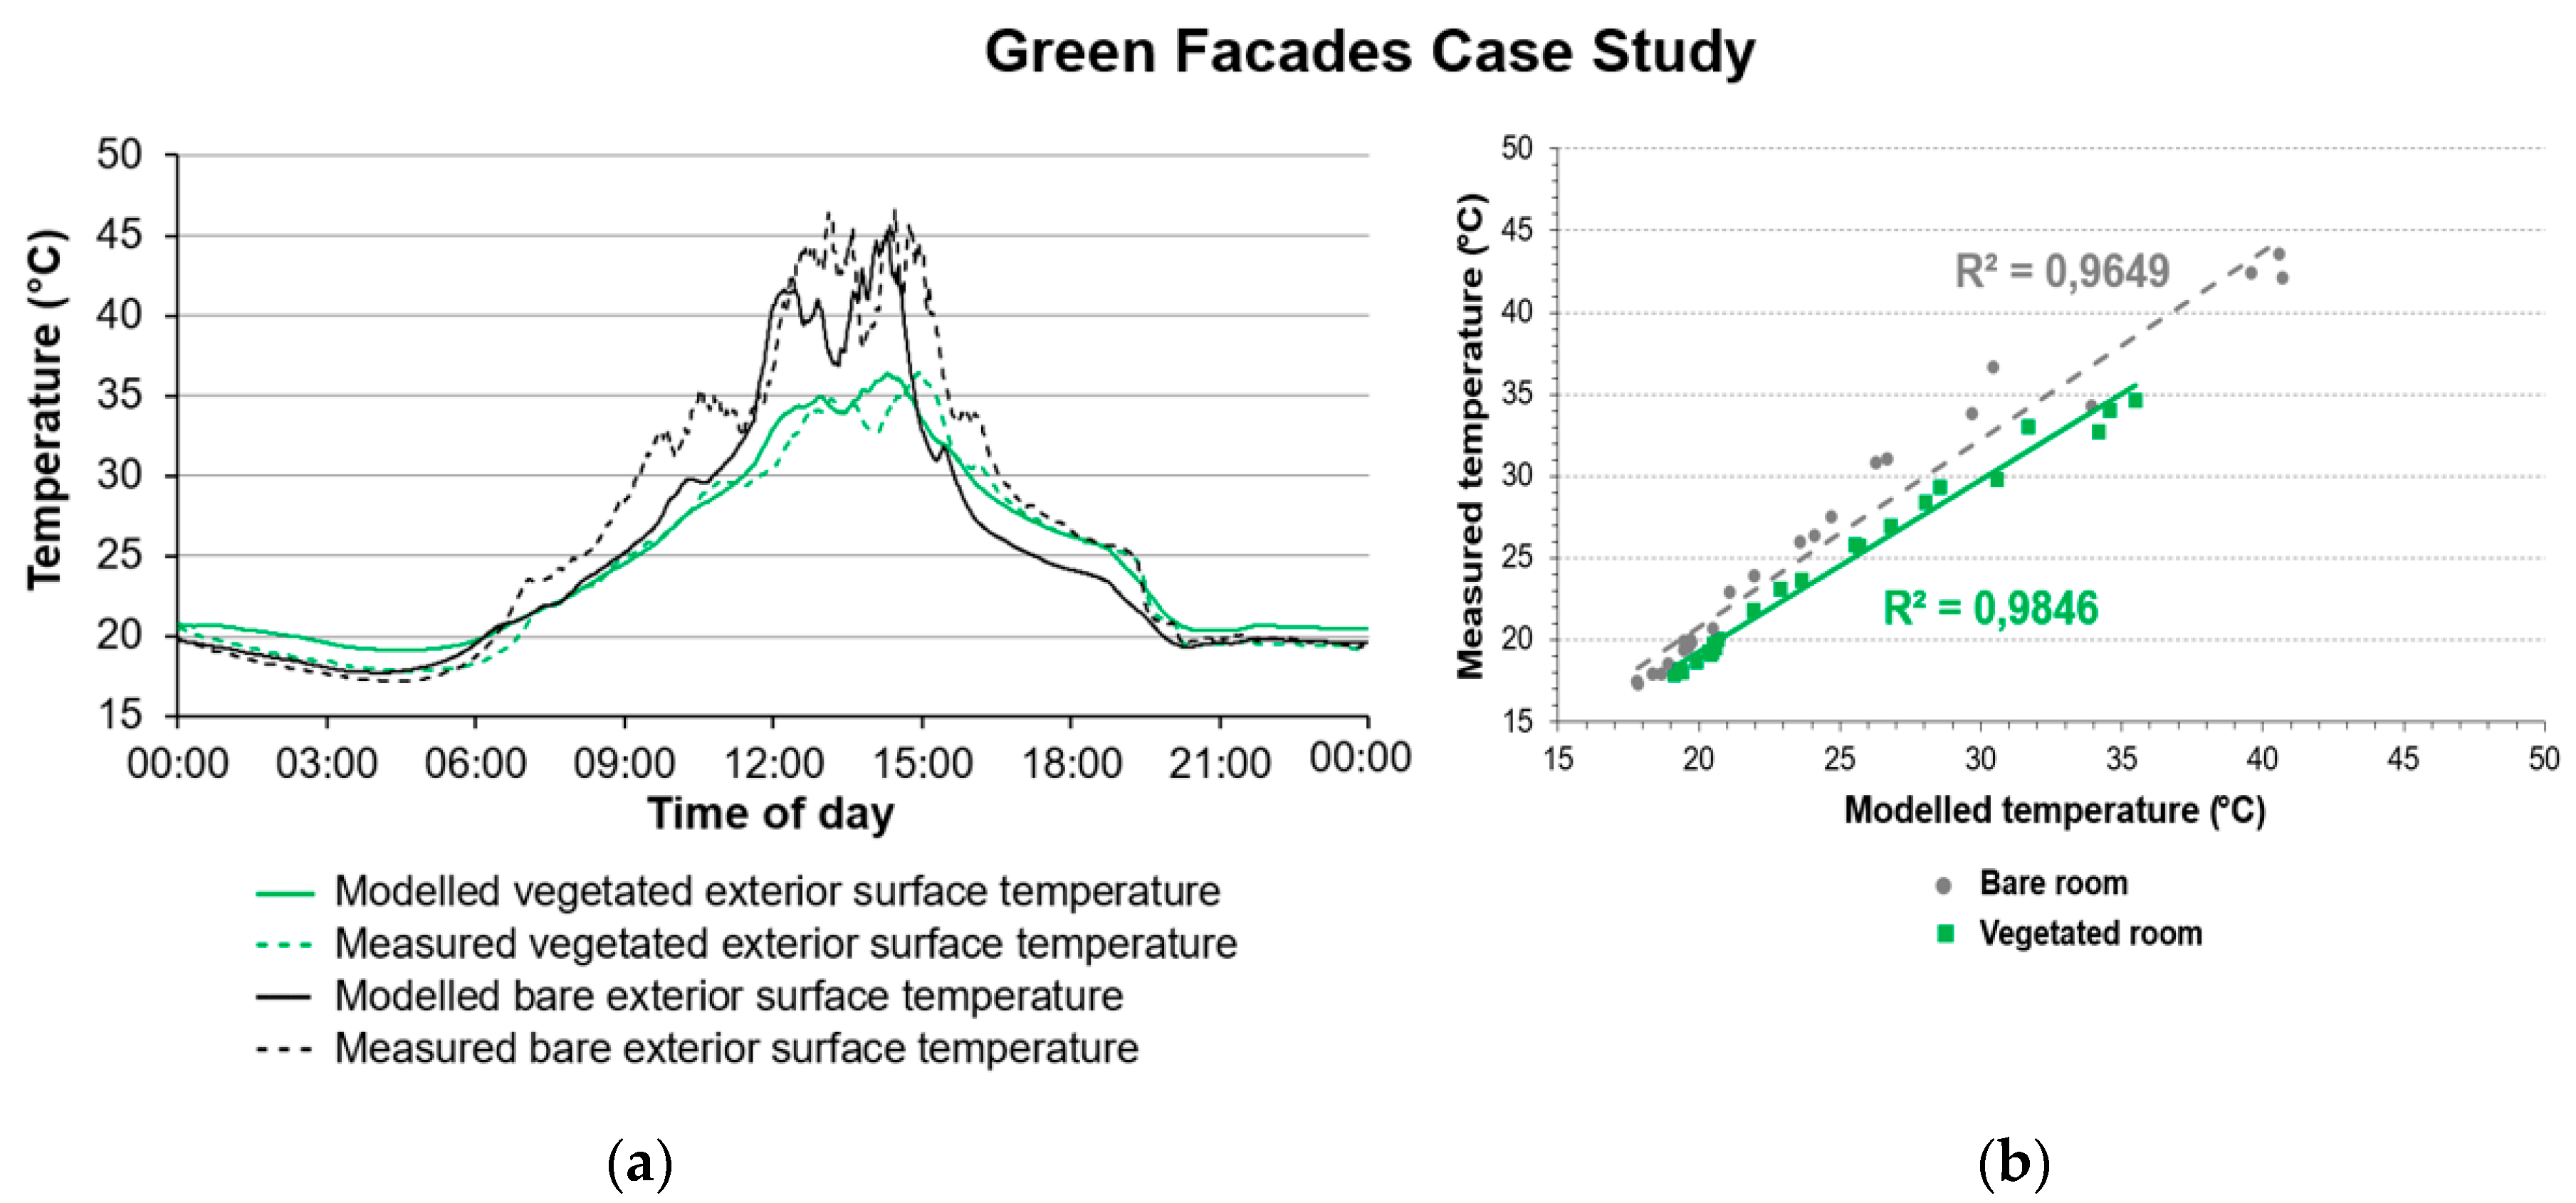
Figure 8a illustrates the measured and modelled exterior surface temperature for both rooms on a sunny day 30 August 2017. The linear relationship between these values was calculated as proved that the R2 between measured and modelled values in bare room and vegetated room are 0.96 and 0.98 respectively. The RMSE of the green façade model were estimated and results in the values for both rooms are 2.68 °C and 1.30 °C. In general, the validation of the model on the two rooms shows high accuracy and confidence of the results. The model is therefore able to predict the thermal performance in the green façade system.
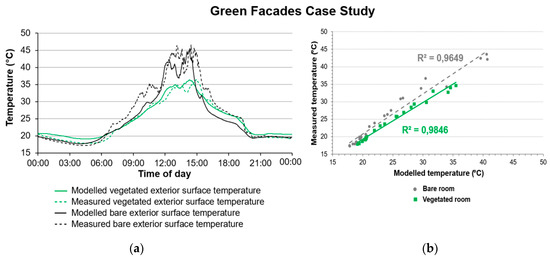
Figure 8.
Comparison of the measured and modelled leaf temperature at the green facade on a sunny day 30 August 2017. (a) Presentation of temporal changes of the values and (b) Correlation analysis of the variables.
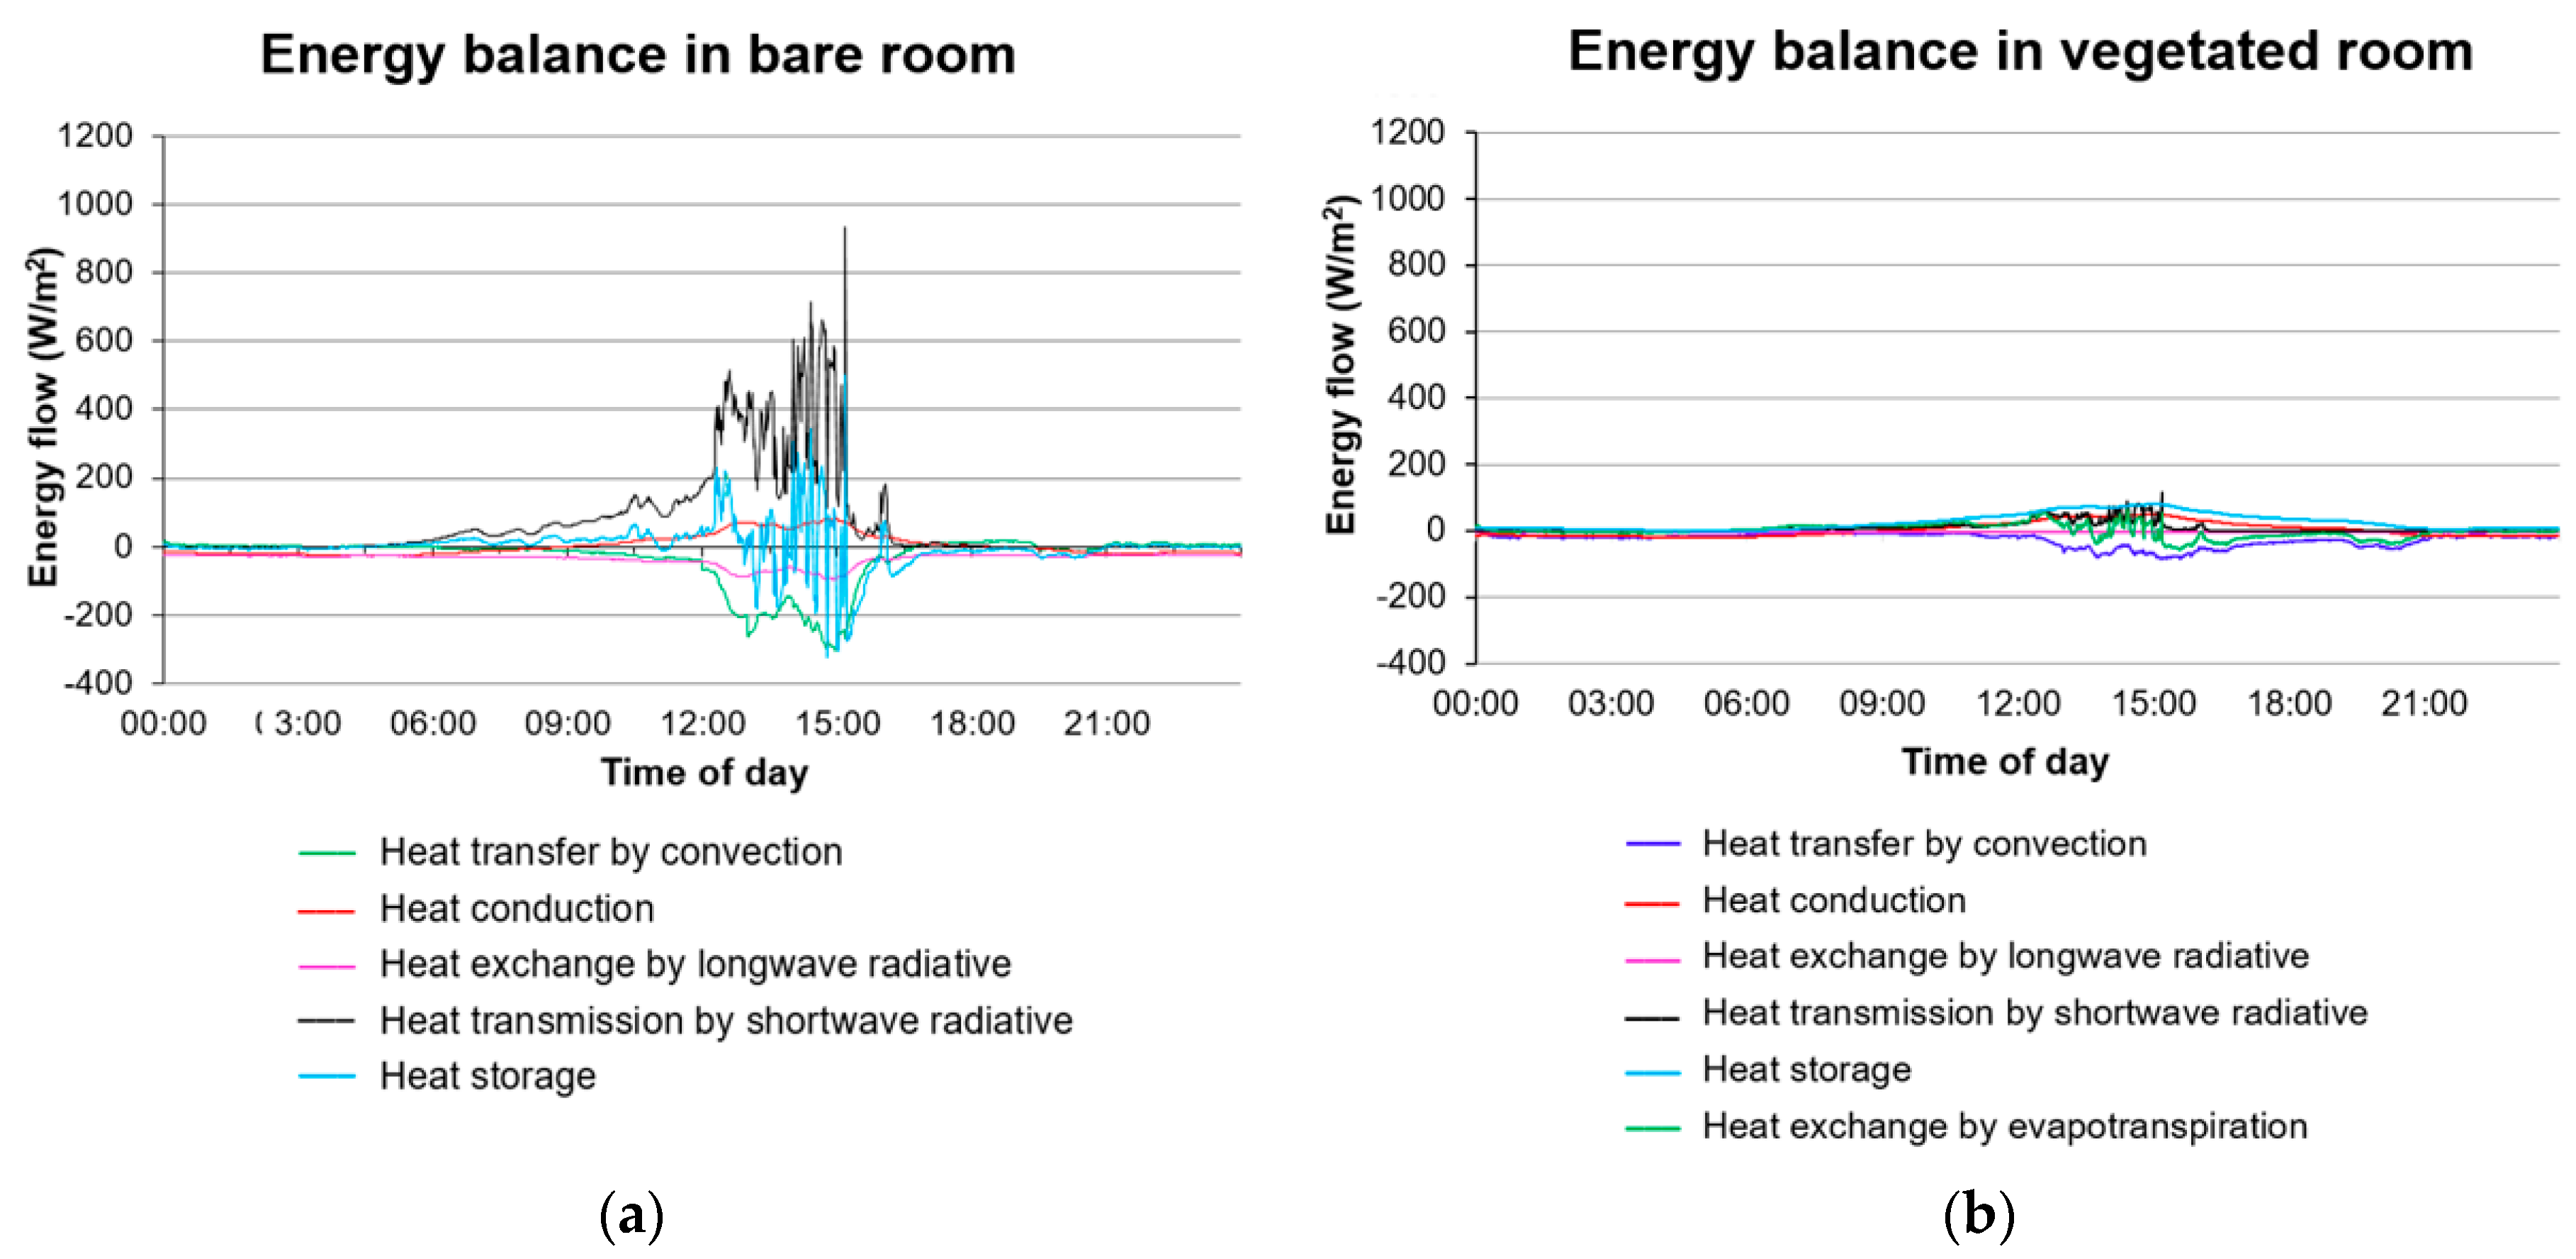
The validated model was implemented to calculate the heat exchange components in the green façade system. It can be seen from Figure 9, that vegetation has a significant influence on the amount of heat exchange. For instance, the heat transmission by shortwave radiation into the vegetated room is about 5 times smaller than into the bare room. Furthermore, the heat conduction into the vegetated room were calculated with a reduction of about 50 W/m2 at the middle of the day (11:00–12:00 UTC) compared to the bare room. In addition, it can be concluded that the heat exchange by convection is the largest source of heat loss in the green façade, which accounts for about 50%. The values of heat exchange by evapotranspiration is positive, which means the vegetation contributes in the increase of heat conduction.
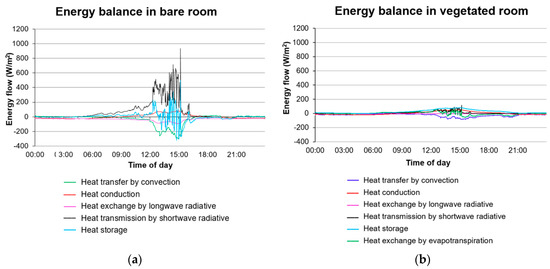
Figure 9.
Comparison of heat exchange between (a) The bare room and (b) The vegetated room on a sunny day 30 August 2017.
7.3. Sensitivity Analysis
We performed a sensitivity analysis on the heat conduction and heat reduction through the greenery systems. The parameters tested were climatic values (e.g., solar radiation, wind velocity), and plant types (using the LAI parameter). The purpose of this analysis is to evaluate the effectivity of vegetation while varying the climate condition or type of plants.
7.3.1. Sensitivity to Climate Conditions: Solar Radiation, Relative Humidity, Wind Speed
The sensitivity of heat conduction and reduction through the green roof and green façade to climate parameters were evaluated for solar radiation, relative humidity and wind velocity (Figure 10, Figure 11, Figure 12 and Figure 13).
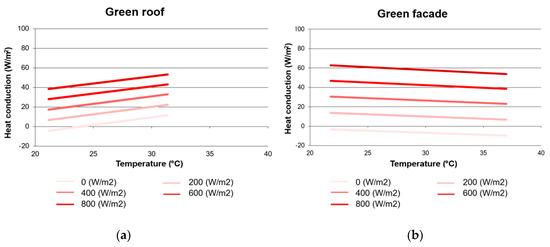
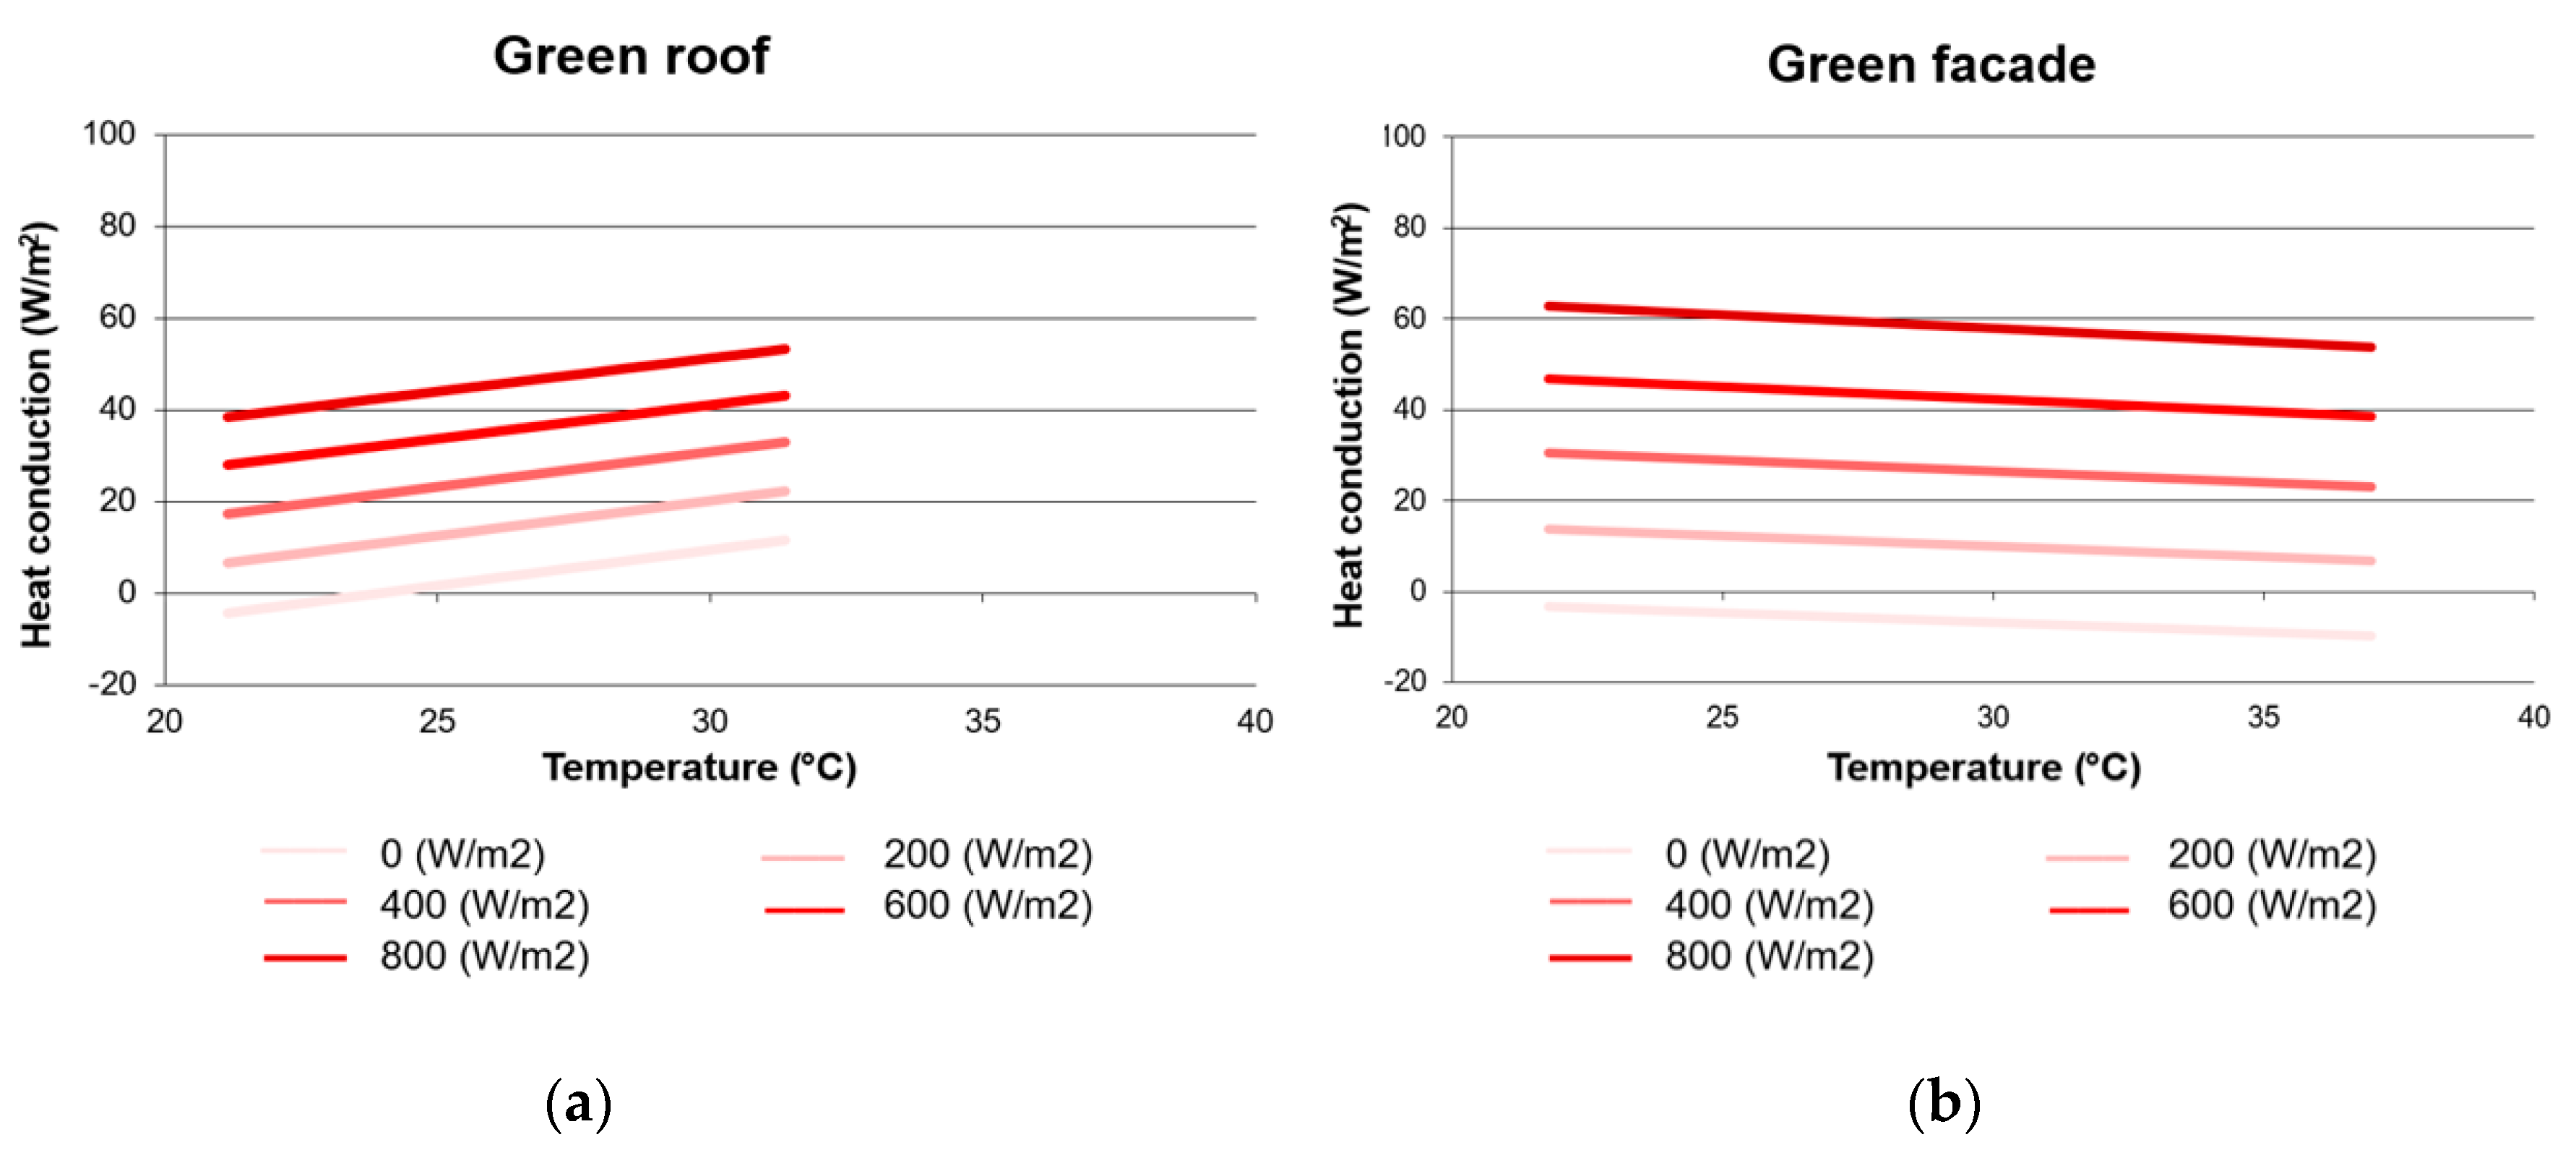
Figure 10.
Sensitivity of (a) the heat conduction through the green roof and (b) the heat reduction through the green façade to solar radiation for relative humidity of 50% and wind speed of 1 m/s.
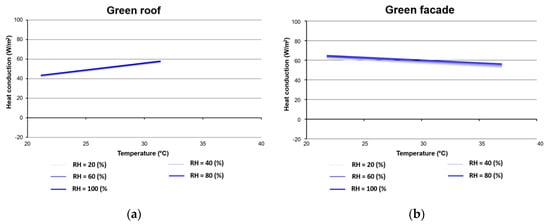
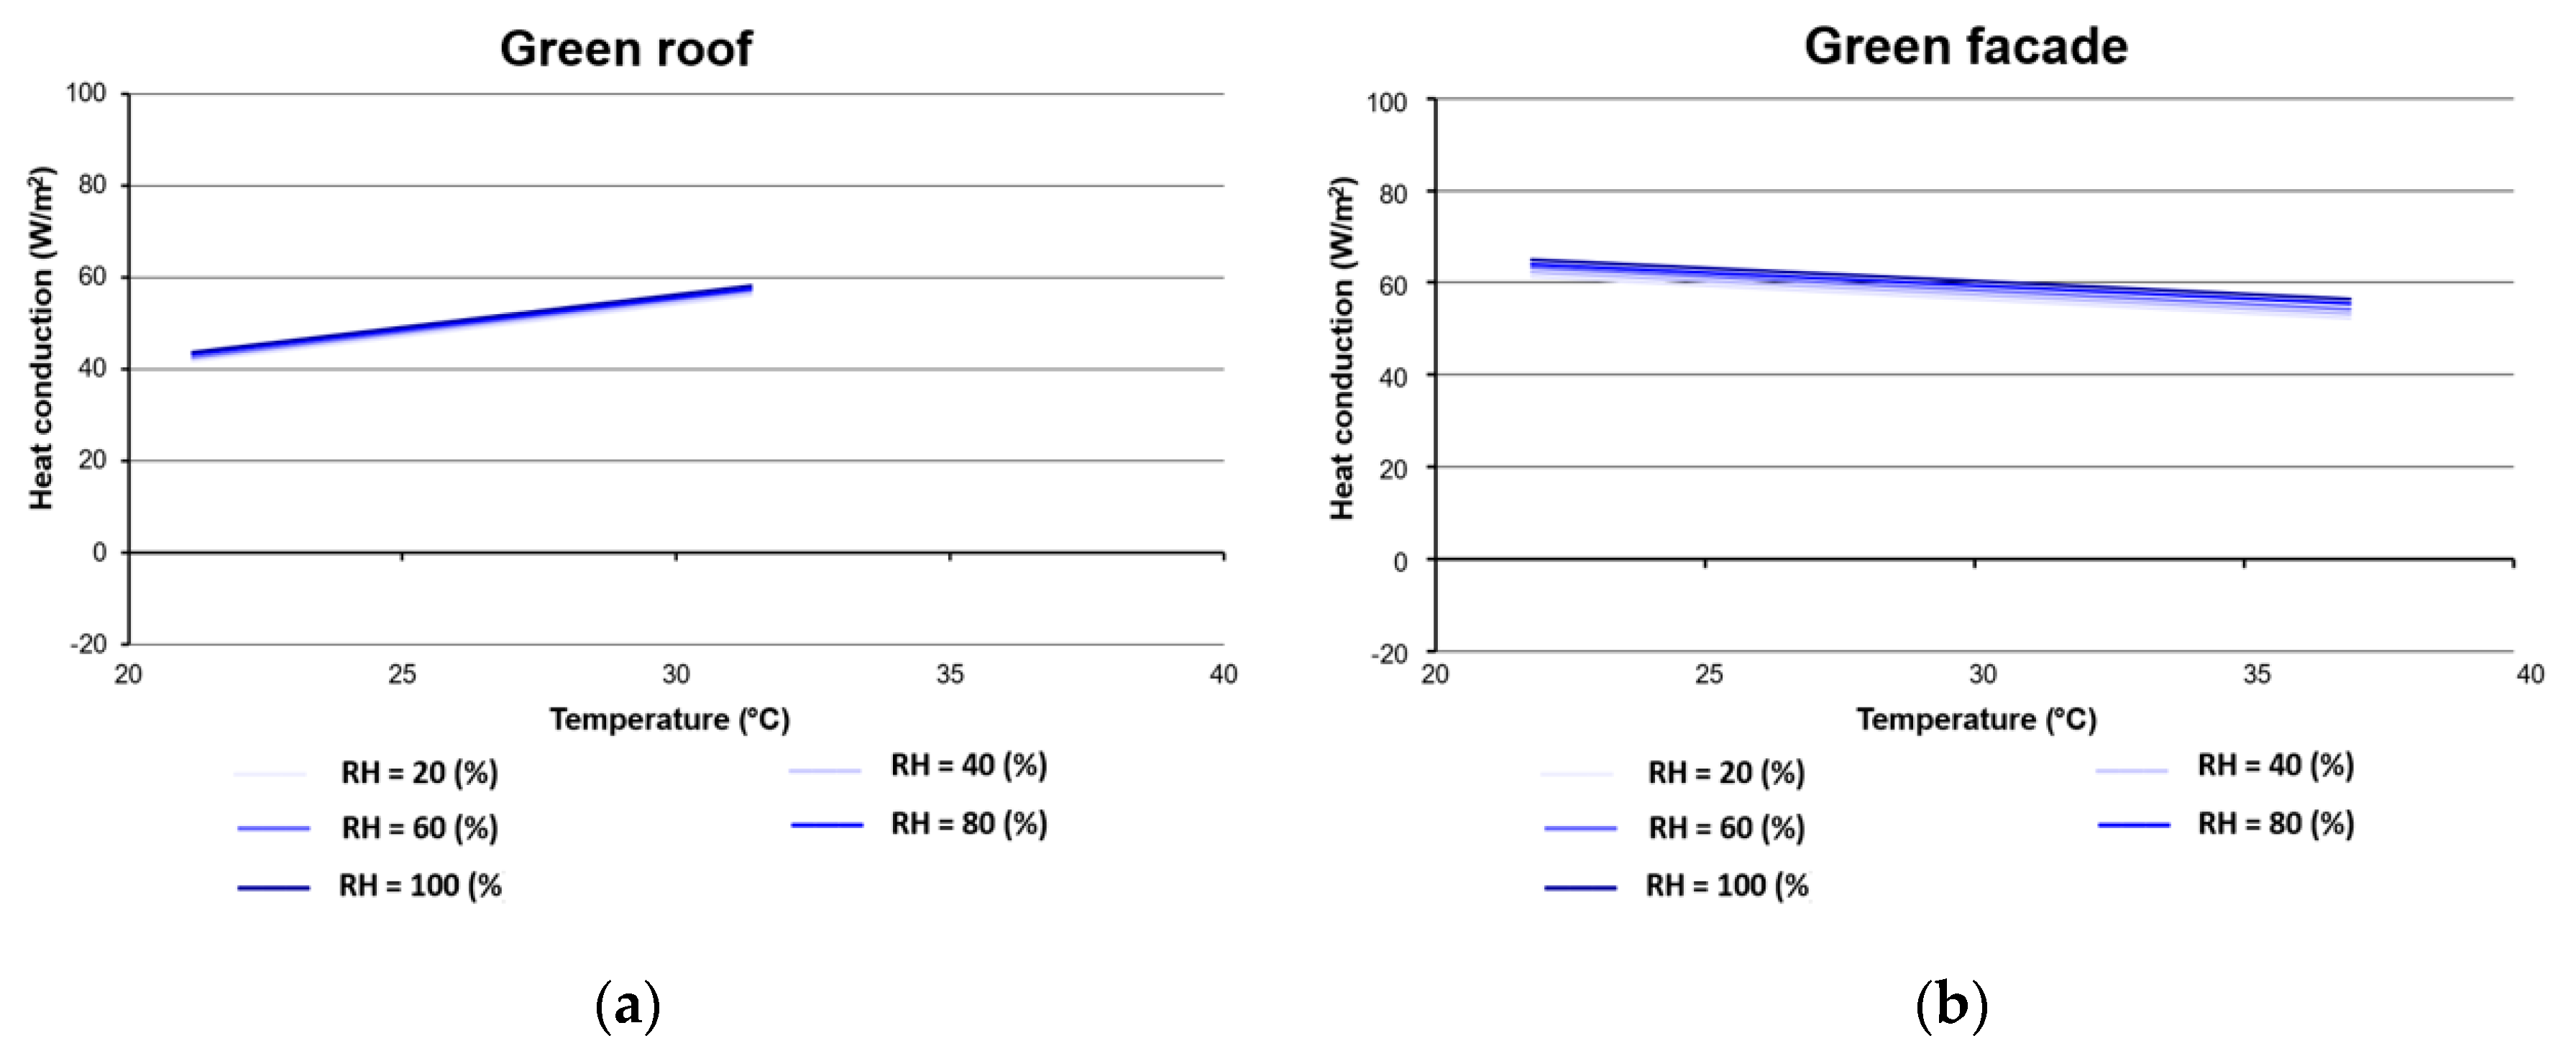
Figure 11.
Sensitivity of (a) the heat conduction through the green roof and (b) the heat reduction through the green façade to relative humidity for solar radiation of 800 W/m2 and wind speed of 1 m/s.

Figure 12.
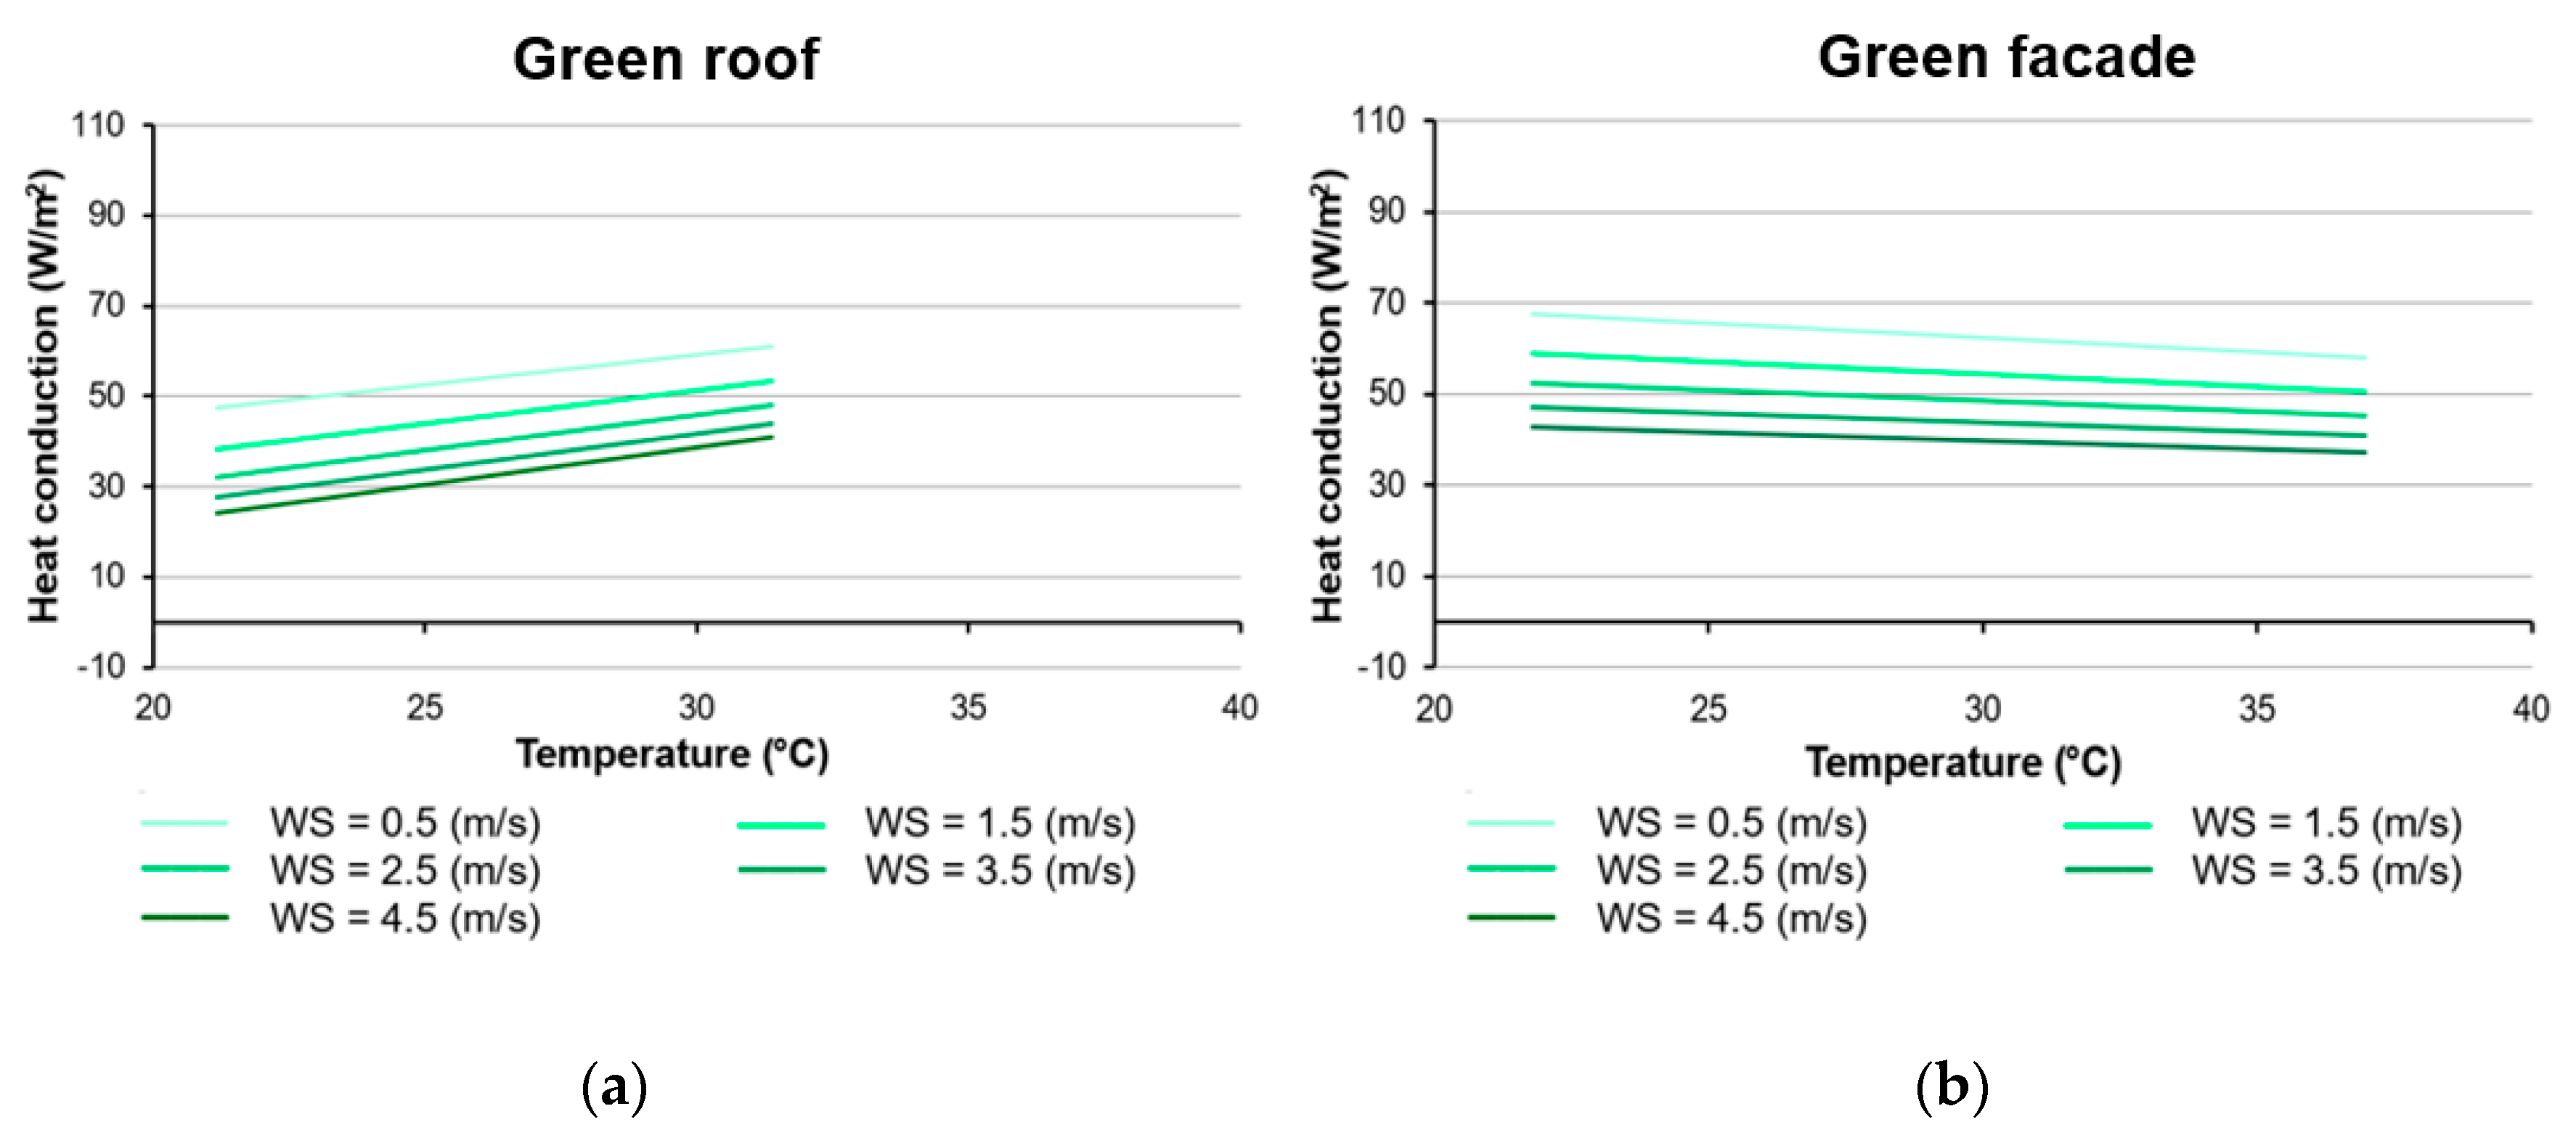
Sensitivity of (a) the heat conduction through the green roof and (b) the heat reduction through the green façade to wind velocity for solar radiation of 800 W/m2 and relative humidity of 50%.
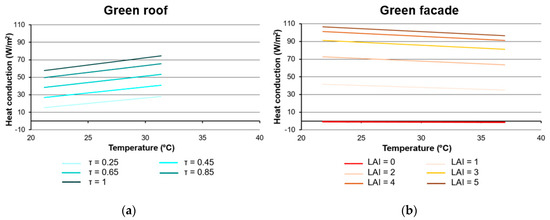
Figure 13.
Sensitivity of (a) the heat conduction through the green roof to Transmissivity of radiation through the plant and (b) the heat reduction through the green façade to Leaf area index (LAI) for solar radiation of 800 W/m2 and relative humidity of 50%.
The solar radiation has a significant influence on the amount of heat conduction into the buildings with the difference of 20 W/m2 per each values of solar radiation. The thermal performance of plant layers is also proven by the sensitivity of heat reduction between the bare room and vegetated room to solar radiation. Due to the presence of plant layers, the amount of heat conduction can be decreased by up to 100 W/m2 when the solar radiation is 800 W/m2. From the results it is evident that the vegetation plays an effective role in the zone with a high amount of solar radiation.
The relative humidity factor contributes to the thermal performance of the greenery systems is demonstrated mostly by evapotranspiration process. However, unlike the solar radiation, the magnitude of influence is not significant.
In contrast to the wind velocity, that highly influences the thermal performance of the greenery system. It is important to note that the heat conduction through the green roof and the heat reduction through the green façade are more sensitive with wind speeds over 1.5 m/s.
7.3.2. Sensitivity to Plant Characteristics
The plant characteristics have significant influences on thermal performance of the vegetation model as depict in the sensitivity tests of the values of transmissivity and LAI. The LAI values are considered more sensitive with a range under 3.0 (Figure 13).
8. Conclusions
This research successfully implemented a combined green roof and green façade model based on the existing green façade model of Susorova et al. [22]. We extended this implementation further, in order to accommodate the modelling of green roof structures. To our knowledge, this is the first model considering both green roofs and green façades, thus allowing the estimation of green systems impact on the entire building envelope and directly its energy demand. Our new development considers the heat exchange between building structure green layer and the atmosphere.
We validated our implementation for the summertime period by measurements gathered during our measurement campaign. The experiments were implemented by means of free and open software and hardware and demonstrate the usage of such systems on greenery system implementations. Having our own measurement campaign presented an advantage in that it highlighted the effects of the literature review and the initial results of this study. For example, in the case of the green roof study in test case of Illingen, we observed that the distribution of indoor temperature is centrally located in the range of 22 °C–24 °C regardless of the leaf temperature variation (from 15–40 °C) or the outside measured temperature, ranging from 15 °C–42 °C. We observed the same with the green façade study at the test site in Ettlingen, where the maximum temperature of the bare wall is about 15 °C higher than the temperature of the vegetated wall during the early afternoon hours when the solar radiation is the highest. Besides, the indoor temperature of the room with a bare wall is higher than the one with vegetated wall by approximately 1 °C, which further proved the efficiency of the green layer in cooling applications.
Furthermore, the study contributes to the current software developments of the semantic city model standard CityGML and its extension, the CityGML Energy ADE. A novel aspect of the study was the testing of the sensor data-storing capabilities of this standard. Our research validated the proposed database structure, which is now present in the stable version of the CityGML standard released in the spring of 2018. The generated results and novel methodology contribute and extend related studies on urban energy modeling such as Nouvel et al. [44], Bahu et al. [35], and Strzalka et al. [46] and was presented at the Energy ADE consortium meeting held at EIfER in Karlsruhe in 2017.
Results from this implementation correspond well with the findings of other relevant studies, such as Susorova et al. [22] on the green façade and He et al. [26] on the green roof. The conducted sensitivity analysis shows that the developed model is robust and consistent throughout different scenarios. We tested the influence of different parameters such as climate, plant, and substrate to the developed model. The solar radiation has a significant influence on the greenery model while relative humidity and wind velocity do not significantly influent the model. The sensitivity to substrate characteristics specifically soil thickness has not been proven in the case of the green roof. However, the plant characteristics have significant influences on the thermal performance of the vegetation model, which are depicted by the sensitivity tests to the values of transmissivity and LAI. LAI is considered more sensitive with the range under 3.0 as it becomes more redundant and inefficient with higher density of leaves.
Our implementation also has limitations related to input data and the lack of suitable buildings for testing. While nature-based solutions are gaining increased popularity, greenery systems are currently still rare applications in urban and peri-urban settings. Furthermore, it was difficult to identify suitable testing locations, and even harder to get permissions to install our measurement campaign on public or private buildings. Another limitation of our research is the lack of building data and the quality of the building data. In our study, we have used low quality 3D models with LoD1 building characteristics that relates to lower accuracy in estimations of solar radiation of the buildings and to lower accuracy in the estimation of the building volumes. Furthermore, our measurements were performed in summertime and we would require a second session of testing our model in wintertime to validate the behavior of the model under different climatic conditions. Lastly, during our experiments data collection was difficult for two sites, as we had to physically visit the sites and collect the data. This happened for two reasons, a lack of electrical network and second, lack of internet access. If the first could be overcome with more capable batteries, the second one could be with increased storage capacity or by using newer data transitions standards such as Long Range Wide Area Network (LoRaWAN) [65], which would facilitate our communication with applications over long-range wireless connections.
Concerning future work, there are three general directions of this study. First, is the validation of our method during wintertime, which requires the same measurement campaign to be performed during the winter months. The second study directions would investigate the energy impact of the green roofs and green façades at energy relevant scales in urban planning, such as district and neighborhood, as these are the scales used by energy companies and urban planners for strategic planning. The last one regards the implementation of other types of greenery systems, which go beyond single houses and on to district scale, such as rainwater collection via permeable pavement and green alleys. Greenery systems and their impact on urban phenomena should thereby be quantified at a larger scale and should not be limited to a single building or a building complex.
Supplementary Materials
OpenSenseMap of the green roof sensor network https://opensensemap.org/explore/598f1ad1ba01c4001045db6f.
Author Contributions
Conceptualization, A.N. and J.W.; methodology, T.T.V.; software, A.N. and J.W.; validation, T.T.V.; formal analysis, T.T.V.; investigation, T.T.V., A.N., and J.W.; resources, A.N. and J.W.; data curation, T.T.V., A.N., and J.W.; writing—original draft preparation, T.T.V., A.N. and J.W.; writing—review and editing, T.T.V., A.N., and J.W.; visualization, T.T.V.; supervision, A.N. and J.W.; project administration, A.N.; funding acquisition, A.N.
Funding
The authors would like to acknowledge the financial and administrative support of EIFER/EDF. The Smart Services for Cities project (Fabrice Casciani and Monika Heyder) supported the master thesis via N45 Energy Planning and Geosimulation (Andreas Koch) and N41 Smart, and Sustainable Cities (Alberto Pasanisi).
Acknowledgments
Certain EIFER colleagues contributed directly to the work performed: Alexander Simons supported the code development with his expertise on the 3DCityDB and CityGML, Ute Karl offered scientific supervision to the work while Thomas Jung, Wanji Zhu, and Francisco Marzabal supported the hardware and software development for the installation.
Conflicts of Interest
The authors declare no conflict of interest.
Appendix A
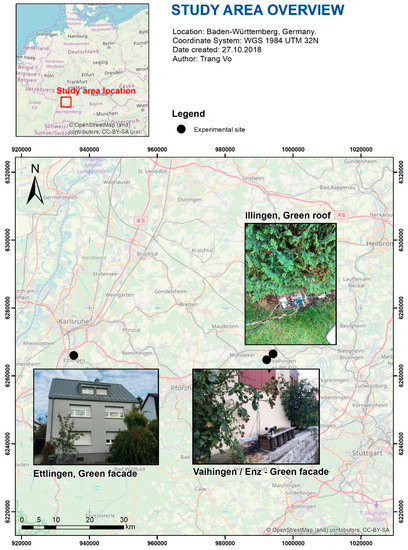
Figure A1.
Map of the study area and location of experimental sites. The red dots illustrated the position of the three study sites.


Figure A2.
Screenshot of the OpenSenseMap web server visualization of the measurement experiment at the green roof structure in Illingen, Germany (https://opensensemap.org/explore/598f1ad1ba01c4001045db6f).
References
- United Nations Department of Economic and Social Affairs. The 2018 Revision of World Urbanization Prospects; United Nations Department of Economic and Social Affairs: New York, NY, USA, 2018. [Google Scholar]
- Energy Efficiency Buildings. Available online: https://ec.europa.eu/energy/en/topics/energy-efficiency/buildings (accessed on 15 October 2018).
- Stewart, I.D.; Oke, T.R. Local climate zones for urban temperature studies. Bull. Am. Meteorol. Soc. 2012, 93, 1879–1900. [Google Scholar] [CrossRef]
- Arnfield, A.J. Two decades of urban climate research: A review of turbulence, exchanges of energy and water, and the urban heat island. Int. J. Climatol. 2003, 23, 1–26. [Google Scholar] [CrossRef]
- Perini, K.; Ottelé, M.; Fraaij, A.L.A.; Haas, E.M.; Rossana, R. Vertical greening systems and the effect on air flow and temperature on the building envelope. Build. Environ. 2011, 46, 2287–2294. [Google Scholar] [CrossRef]
- Hoffmann, L. Sustainable Architecture; Earth Pledge Foundation: New York, NY, USA, 2000. [Google Scholar]
- Köhler, M. Green facades—A view back and some visions. Urban Ecosyst. 2008, 11, 423–436. [Google Scholar] [CrossRef]
- Hoelschera, M.-T.; Nehls, T.; Jänickeb, B.; Wessolek, G. Quantifying cooling effects of facade greening: Shading, transpiration and insulation. Energy Build. 2016, 114, 283–290. [Google Scholar] [CrossRef]
- Fang, C.F. Evaluating the thermal reduction effect of plant layers on rooftops. Energy Build. 2008, 40, 1048–1052. [Google Scholar] [CrossRef]
- Cameron, R.W.F.; Taylor, J.E.; Emmett, M.R. What’s ‘cool’ in the world of green façades? How plant choice influences the cooling properties of green walls. Build. Environ. 2014, 73, 198–207. [Google Scholar] [CrossRef]
- Renterghem, T.V. Improving the noise reduction by green roofs due to solar panels and subtrate shaping. Build. Acoust. 2018, 25, 219–232. [Google Scholar] [CrossRef]
- Currie, B.A.; Bass, B. Estimates of air pollution mitigation with green plants and green roofs using the UFORE model. Urban Ecosyst. 2008, 11, 409–422. [Google Scholar] [CrossRef]
- Bengtsson, L.; Grahn, L.; Olsson, J. Hydrological function of a thin extensive green roof in Southern Sweden. Nordic Hydrol. 2005, 36, 259–268. [Google Scholar] [CrossRef]
- Vijayaraghavan, K. Green roofs: A critical review on the role of components, benefits, limitations and trends. Renew. Sustain. Energy Rev. 2016, 57, 740–752. [Google Scholar] [CrossRef]
- Liu, K.; Baskaran, B. Thermal performance of green roofs through field evaluation. In Proceedings of the First North American Green Roof Infrastructure Conference, Chicago, IL, USA, 29–30 May 2003; pp. 1–10. [Google Scholar]
- Ouldboukhitine, S.-E.; Belarbi, R.; Djedjig, R. Characterization of green roof components: Measurement of thermal and hydrological properties. Build. Environ. 2012, 56, 78–85. [Google Scholar] [CrossRef]
- Wong, N.H.; Chen, Y.; Ong, C.L.; Sia, A. Investigation of thermal benefits of rooftop garden in the tropical environment. Build. Environ. 2003, 38, 261–270. [Google Scholar] [CrossRef]
- Raji, B.; Tenpierik, M.J.; van den Dobbelsteen, A. The impact of greening systems on building energy performance: A literature review. Renew. Sustain. Energy Rev. 2015, 45, 610–623. [Google Scholar] [CrossRef]
- Saadatian, O.; Sopian, K.; Salleh, E.; Lim, C.; Riffat, S.; Saadatian, E.; Toudeshki, A.; Sulaiman, M.Y. A review of energy aspects of green roofs. Renew. Sustain. Energy Rev. 2013, 23, 155–168. [Google Scholar] [CrossRef]
- Pérez, G.; Rincón, L.; Vilaa, A.; González, J.M.; Cabeza, L.F. Green vertical systems for buildings as passive systems for energy savings. Appl. Energy 2011, 88, 4854–4859. [Google Scholar] [CrossRef]
- Besir, A.B.; Cuce, E. Green roofs and facades: A comprehensive review. Renew. Sustain. Energy Rev. 2018, 82, 915–939. [Google Scholar] [CrossRef]
- Susorova, I.; Angulo, M.; Bahrami, P.; Stephens, B. A model of vegetated exterior facades for evaluation of wall thermal performance. Build. Environ. 2013, 67, 1–13. [Google Scholar] [CrossRef]
- Gaffin, S.; Khanbilvardi, R.; Rosenzweig, C. Development of a green roof environmental monitoring and meteorological network in New York City. Sensors 2009, 9, 2647–2660. [Google Scholar] [CrossRef] [PubMed]
- Sonne, J. Evaluating green roof energy performance. Ashrae J. 2006, 48, 59. [Google Scholar]
- Morawska, L.; Thai, P.K.; Liu, X.; Asumadu-Sakyi, A.; Ayoko, G.; Bartonova, A.; Bedini, A.; Chai, F.; Christensen, B.; Dunbabin, M.; et al. Applications of low-cost sensing technologies for air quality monitoring and exposure assessment: How far have they gone? Environ. Int. 2018, 116, 286–299. [Google Scholar] [CrossRef]
- He, Y.; Yu, H.; Dong, N.; Ye, H. Thermal and enery performance assessment of extensive green roof in summer: A case study of a lightweight building in shanghai. Energy Build. 2016, 127, 762–773. [Google Scholar] [CrossRef]
- Ouldboukhitine, S.-E.; Belarbi, R.; Jaffal, I.; Trabelsi, A. Assessment of green roof thermal behavior: A coupled heat and mass transfer model. Build. Environ. 2011, 46, 2624–2631. [Google Scholar] [CrossRef]
- Castleton, H.F.; Stovin, V.; Beck, S.B.; Davison, J.B. Green roofs; building energy savings and the potential for retrofit. Energy Build. 2010, 42, 1582–1591. [Google Scholar] [CrossRef]
- Chan, A.L.S.; Chow, T.T. Evaluation of overall thermal transfer value (OTTV) for commercial buildings constructed with green roof. Appl. Energy 2013, 107, 10–24. [Google Scholar] [CrossRef]
- Wong, I.; Baldwin, A.N. Investigating the potential of applying vertical green walls to high-rise residential buildings for energy-saving in sub-tropical region. Build. Environ. 2016, 97, 34–39. [Google Scholar] [CrossRef]
- Bröring, A.; Remke, A.; Stasch, C.; Autermann, C.; Rieke, M.; Möllers, J. enviroCar: A Citizen Science Platform for Analyzing and Mapping Crowd-Sourced Car Sensor Data. Trans. GIS 2015, 19, 362–376. [Google Scholar] [CrossRef]
- Demuth, D.; Nuest, D.; Bröring, A.; Pebesma, E. The airquality sensebox. In Proceedings of the EGU General Assembly Conference Abstracts, Vienna, Austria, 7–12 April 2013. [Google Scholar]
- Devarakonda, S.; Sevusu, P.; Liu, H.; Liu, R.; Iftode, L.; Nath, B. Real-time air quality monitoring through mobile sensing in metropolitan areas. In Proceedings of the 2nd ACM SIGKDD International Workshop on Urban Computing, Chicago, IL, USA, 11 August 2013; p. 15. [Google Scholar]
- Bröring, A.; Remke, A.; Lasnia, D. SenseBox–A generic sensor platform for the web of things. In Proceedings of the International Conference on Mobile and Ubiquitous Systems: Computing, Networking, and Services, Copenhagen, Denmark, 6–9 December 2011; pp. 186–196. [Google Scholar]
- SenseBox, die Kiste mit Sinn. Available online: https://sensebox.de/ (accessed on 10 January 2019).
- Air Quality Egg. Available online: https://airqualityegg.com/home (accessed on 10 January 2019).
- Pfeil, M.; Bartoschek, T.; Wirwahn, J.A. Opensensemap–A Citizen Science Platform for Publishing and Exploring Sensor Data as Open Data. In Proceedings of the Free and Open Source Software for Geospatial (FOSS4G), Seoul, Korea, 14–19 September 2015; p. 39. [Google Scholar]
- openSenseMap. Available online: https://opensensemap.org/ (accessed on 5 December 2018).
- Open Weather API. Available online: https://openweathermap.org/api (accessed on 23 November 2018).
- The Netatmo API Technical References. Available online: https://dev.netatmo.com/en-US/resources/technical/reference (accessed on 5 December 2018).
- Arduino. Available online: https://www.arduino.cc (accessed on 10 January 2019).
- Ali, A.S.; Zanzinger, Z.; Debose, D.; Stephens, B. Open Source Building Science Sensors (OSBSS): A low-cost Arduino-based platform for long-term indoor environmental data collection. Build. Environ. 2015, 100, 114–126. [Google Scholar] [CrossRef]
- Agugiaro, G. Energy planning tools and CityGML-based 3D virtual city models: Experiences from Trento (Italy). Appl. Geomat. 2016, 8, 41–56. [Google Scholar] [CrossRef]
- Nouvel, R.; Zirak, M.; Dastageeri, H.; Coors, V.; Eicker, U. Urban Energy Analysis based on 3D City Model for National Scale Applications. In Proceedings of the IBPSA Germany Conference, Aachen, Germany, 22–24 September 2014; p. 8. [Google Scholar]
- Bahu, J.M.; Koch, A.; Kremers, E.; Murshed, S.M. Towards a 3D spatial urban energy modelling approach. ISPRS Ann. Photogram. Remote Sens. Spat. Inf. Sci. 2013, 1, 33–41. [Google Scholar] [CrossRef]
- Strzalka, A.; Bogdahn, J.; Coors, V.; Eicker, U. 3D city modeling for urban scale heating energy demand forecasting. HVAC&R Res. 2011, 17, 526–539. [Google Scholar]
- Nichersu, A.; Simons, A. Building a CityGML Infrastructure for Energy Related Simulations. In Proceedings of the GIScience, Vienna, Austria, 24–26 September 2014. [Google Scholar]
- The CityGML OGC standard. Available online: https://www.opengeospatial.org/standards/citygml (accessed on 10 January 2019).
- ESRI ArcMap Multipatches Help. Available online: https://desktop.arcgis.com/en/arcmap/latest/extensions/3d-analyst/multipatches.htm (accessed on 23 November 2018).
- Wendel, J.; Simons, A.; Nichersu, A.; Murshed, S.M. Rapid development of semantic 3D city models for urban energy analysis based on free and open data sources and software. In Proceedings of the ACM Urban GIS, Redondo Beach, CA, USA, 7–10 November 2017. [Google Scholar]
- Futcher, J.; Mills, G.; Emmanuel, R. Interdependent energy relationships between buildings at the street scale. Build. Res. Inf. 2018, 46, 829–844. [Google Scholar] [CrossRef]
- Nouvel, R.; Kaden, R.; Bahu, J.-M.; Kaempf, J.; Cipriano, P.; Lauster, M.; Benner, J.; Munoz, E.; Tournaire, O.; Casper, E. Genesis of the CityGML Energy ADE. In Proceedings of the CISBAT, Lausanne, Switzerland, 9–11 September 2015. [Google Scholar]
- Agugiaro, G.; Benner, J.; Cipriano, P.; Nouvel, R. The Energy Application Domain Extension for CityGML: Enhancing interoperability for urban energy simulations. Open Geospat. Data Softw. Stand. 2018, 8. [Google Scholar] [CrossRef]
- 10th Workshop on the CityGML Energy ADE Delft 2018. Available online: http://en.wiki.energy.sig3d.org/index.php/Workshop_Delft_2018 (accessed on 27 March 2019).
- Yao, Z.; Nagel, C.; Kunde, F.; Hudra, G.; Willkomm, P.; Donaubauer, A.; Adolphi, T.; Kolbe, T.H. 3DCityDB—A 3D geodatabase solution for the management, analysis, and visualization of semantic 3D city models based on CityGML. Open Geospat. Data Softw. Stand. 2018, 3. [Google Scholar] [CrossRef]
- PostGIS—Spatial and Geographic objects for PostgreSQL Website. Available online: https://postgis.net/ (accessed on 20 November 2018).
- The CityGML Database 3D CityDB Website. Available online: https://www.3dcitydb.org/3dcitydb/ (accessed on 20 November 2018).
- Nobel, P.S. Biophysical Plant Physiology and Ecology; W.H. Freeman and Company: San Francisco, CA, USA, 1983. [Google Scholar]
- Peri, G.; Rizzo, G.; Scaccianoce, G.; Gennusa, M.L.; Jones, P. Vegetation and soil—Related parameters for computing solar radiation exchanges within green roofs: Are the available values adequate for an easy modeling of their thermal behavior? Energy Build. 2016, 129, 535–548. [Google Scholar] [CrossRef]
- Tabares-Velasco, P.C. Predictive Heat and Mass Transfer Model of Plant-Based Roofing Materials for Assessment of Energy Savings. Ph.D. Thesis, The Pennsylvania State University, Pennsylvania, PA, USA, 2009. [Google Scholar]
- Gates, D.M. Biophysical Ecology; Dover Publications, Inc.: New York, NY, USA, 2003. [Google Scholar]
- WunderMap Weather Underground. Available online: https://www.wunderground.com/wundermap/ (accessed on 10 January 2019).
- American Institute of Aeronautics and Astronautics. Guide for the Verification and Validation of Computational Fluid Dynamics Simulations; AIAA-G-077-1998; American Institute of Aeronautics and Astronautics: Reston, VA, USA, 1998. [Google Scholar]
- Roache, P.J. Verification and Validation in Computational Science and Engineering; Hermosa Publishers: Albuquerque, NM, USA, 1998. [Google Scholar]
- LoRa Alliance Website. Available online: https://lora-alliance.org/ (accessed on 10 January 2019).


© 2019 by the authors. Licensee MDPI, Basel, Switzerland. This article is an open access article distributed under the terms and conditions of the Creative Commons Attribution (CC BY) license (http://creativecommons.org/licenses/by/4.0/).