1. Introduction
Non-emergency reporting refers to the process through which residents notify local governments about everyday urban issues, such as potholes, broken streetlights, graffiti, litter, blocked drains, and damaged street furniture, which do not require police, fire, or ambulance response. In many cities, these issues are handled through “311-style” service channels, web portals, and mobile applications. Within the smart-city paradigm, citizen reporting systems function as a distributed sensing layer in which residents act as “human sensors,” helping governments detect problems earlier and maintain urban assets more efficiently [
1]. Compared with periodic inspections alone, citizen reporting can expand spatial coverage, reduce detection latency, and support more targeted allocation of limited municipal resources [
2].
Mobile applications are a natural interface for this workflow because they simplify geotagging, photo capture, case submission, and two-way feedback. However, launching an app does not guarantee citizen participation. Reporting behavior is voluntary, often low visibility, and dependent on residents’ expectations about whether their effort will lead to meaningful action. Cities also face persistent challenges in uneven participation across neighborhoods, languages, age groups, and levels of digital access, creating potential representation bias in what gets reported and prioritized [
3,
4,
5]. Report quality may also vary, with duplicates, vague descriptions, and inaccurate locations increasing triage costs. In addition, privacy concerns and uncertainty about data use can reduce willingness to report, while fragmented reporting channels and weak feedback loops may erode trust over time [
6]. These challenges make non-emergency reporting not only a technical implementation problem, but also a pre-deployment design problem.
Technology acceptance frameworks such as the technology acceptance model (TAM) and the unified theory of acceptance and use of technology (UTAUT) have been widely used to explain user adoption of digital services [
7,
8]. In public-sector settings, prior studies have shown that perceived usefulness, ease of use, social influence, trust, and risk-related concerns are important predictors of citizens’ willingness to use e-government systems. However, much of this literature examines systems after deployment or focuses on general public-service platforms. Less is known about how cities can evaluate alternative design strategies before a civic reporting app is launched, when actual usage data are unavailable and design choices are still adjustable. This pre-deployment stage is important because decisions about interface design, feedback visibility, privacy reassurance, and incentive framing may shape future participation patterns.
A second gap concerns incentive design. Civic participation studies suggest that incentives can influence voluntary public-good behaviors, but their effects are not uniform. Monetary rewards may increase participation by adding extrinsic benefits, yet they can also crowd out intrinsic or prosocial motivation when poorly aligned with the civic nature of the task [
9]. Non-monetary incentives, such as recognition, symbolic awards, gamification, and civic-related framing, may strengthen reputational or moral value and support engagement at relatively low cost [
10]. Existing studies often examine these incentive mechanisms separately from technology acceptance models. As a result, it remains unclear how different incentive framings are translated into perceived value and how that perceived value subsequently affects behavioral intention in a pre-deployment civic-technology context.
To address these gaps, this study develops a design-oriented pre-deployment evaluation framework for a crowdsourced non-emergency reporting app. Rather than treating technology acceptance modeling only as a post hoc explanatory tool, the study uses an extended UTAUT framework to support comparison of alternative system designs before implementation. The model includes core acceptance drivers—performance expectancy (PE), effort expectancy (EE), social influence (SI), attitude (ATT), and trust—and adds a value-based incentive pathway. Specifically, incentive type is modeled as influencing perceived value (PV), which then affects PE and behavioral intention (BI). In this framework, PV is not treated as another general adoption belief; instead, it serves as a common evaluative mechanism through which heterogeneous incentives, including monetary rewards, recognition, and donation-based community-benefit incentives, can be compared.
The study makes three contributions. First, it moves beyond conventional pre-adoption acceptance prediction by using the acceptance model as a comparative design-evaluation framework for randomized participation mechanisms. This responds to the practical need for cities to assess design options before actual usage data are available. Second, it clarifies how incentive mechanisms can be integrated into an acceptance framework through a value-based pathway, while also distinguishing the value-mediated component from additional direct effects on performance expectancy and behavioral intention. Third, it provides an experimental-modeling approach that combines a scenario-based multi-arm design with PLS-SEM and supplementary effect decomposition, enabling direct, indirect, and total effects of alternative incentive strategies to be compared before deployment.
Empirically, the framework is applied to a proposed city reporting application in the Greater Toronto Area. Participants were randomly assigned to one of the following four conditions: control, monetary incentive, recognition incentive, or donation-based community-benefit incentive. The study addresses the following two research questions:
RQ1 (acceptance drivers): In a pre-deployment setting for a city reporting app, which acceptance constructs most strongly predict behavioral intention?
RQ2 (incentive-type effects): Do different incentive framings differentially increase perceived value and, in turn, behavioral intention through a value-based pathway?
The remainder of the paper is organized as follows.
Section 2 reviews related work on technology acceptance in public services, incentives in civic participation, and citizen crowdsourcing for city maintenance.
Section 3 presents the conceptual model and hypotheses.
Section 4 describes the scenario-based experimental design, measures, sampling, and analytical approach.
Section 5 reports the measurement and structural model results.
Section 6 discusses theoretical, methodological, and practical implications, as well as limitations and future research directions.
3. Theory and Hypotheses
3.1. Conceptual Model
This study proposes a two-part framework for evaluating citizen adoption of a non-emergency reporting application in a pre-deployment context. The framework builds on TAM/UTAUT and related civic-technology acceptance research while extending these models to support comparison of alternative participation designs before system launch.
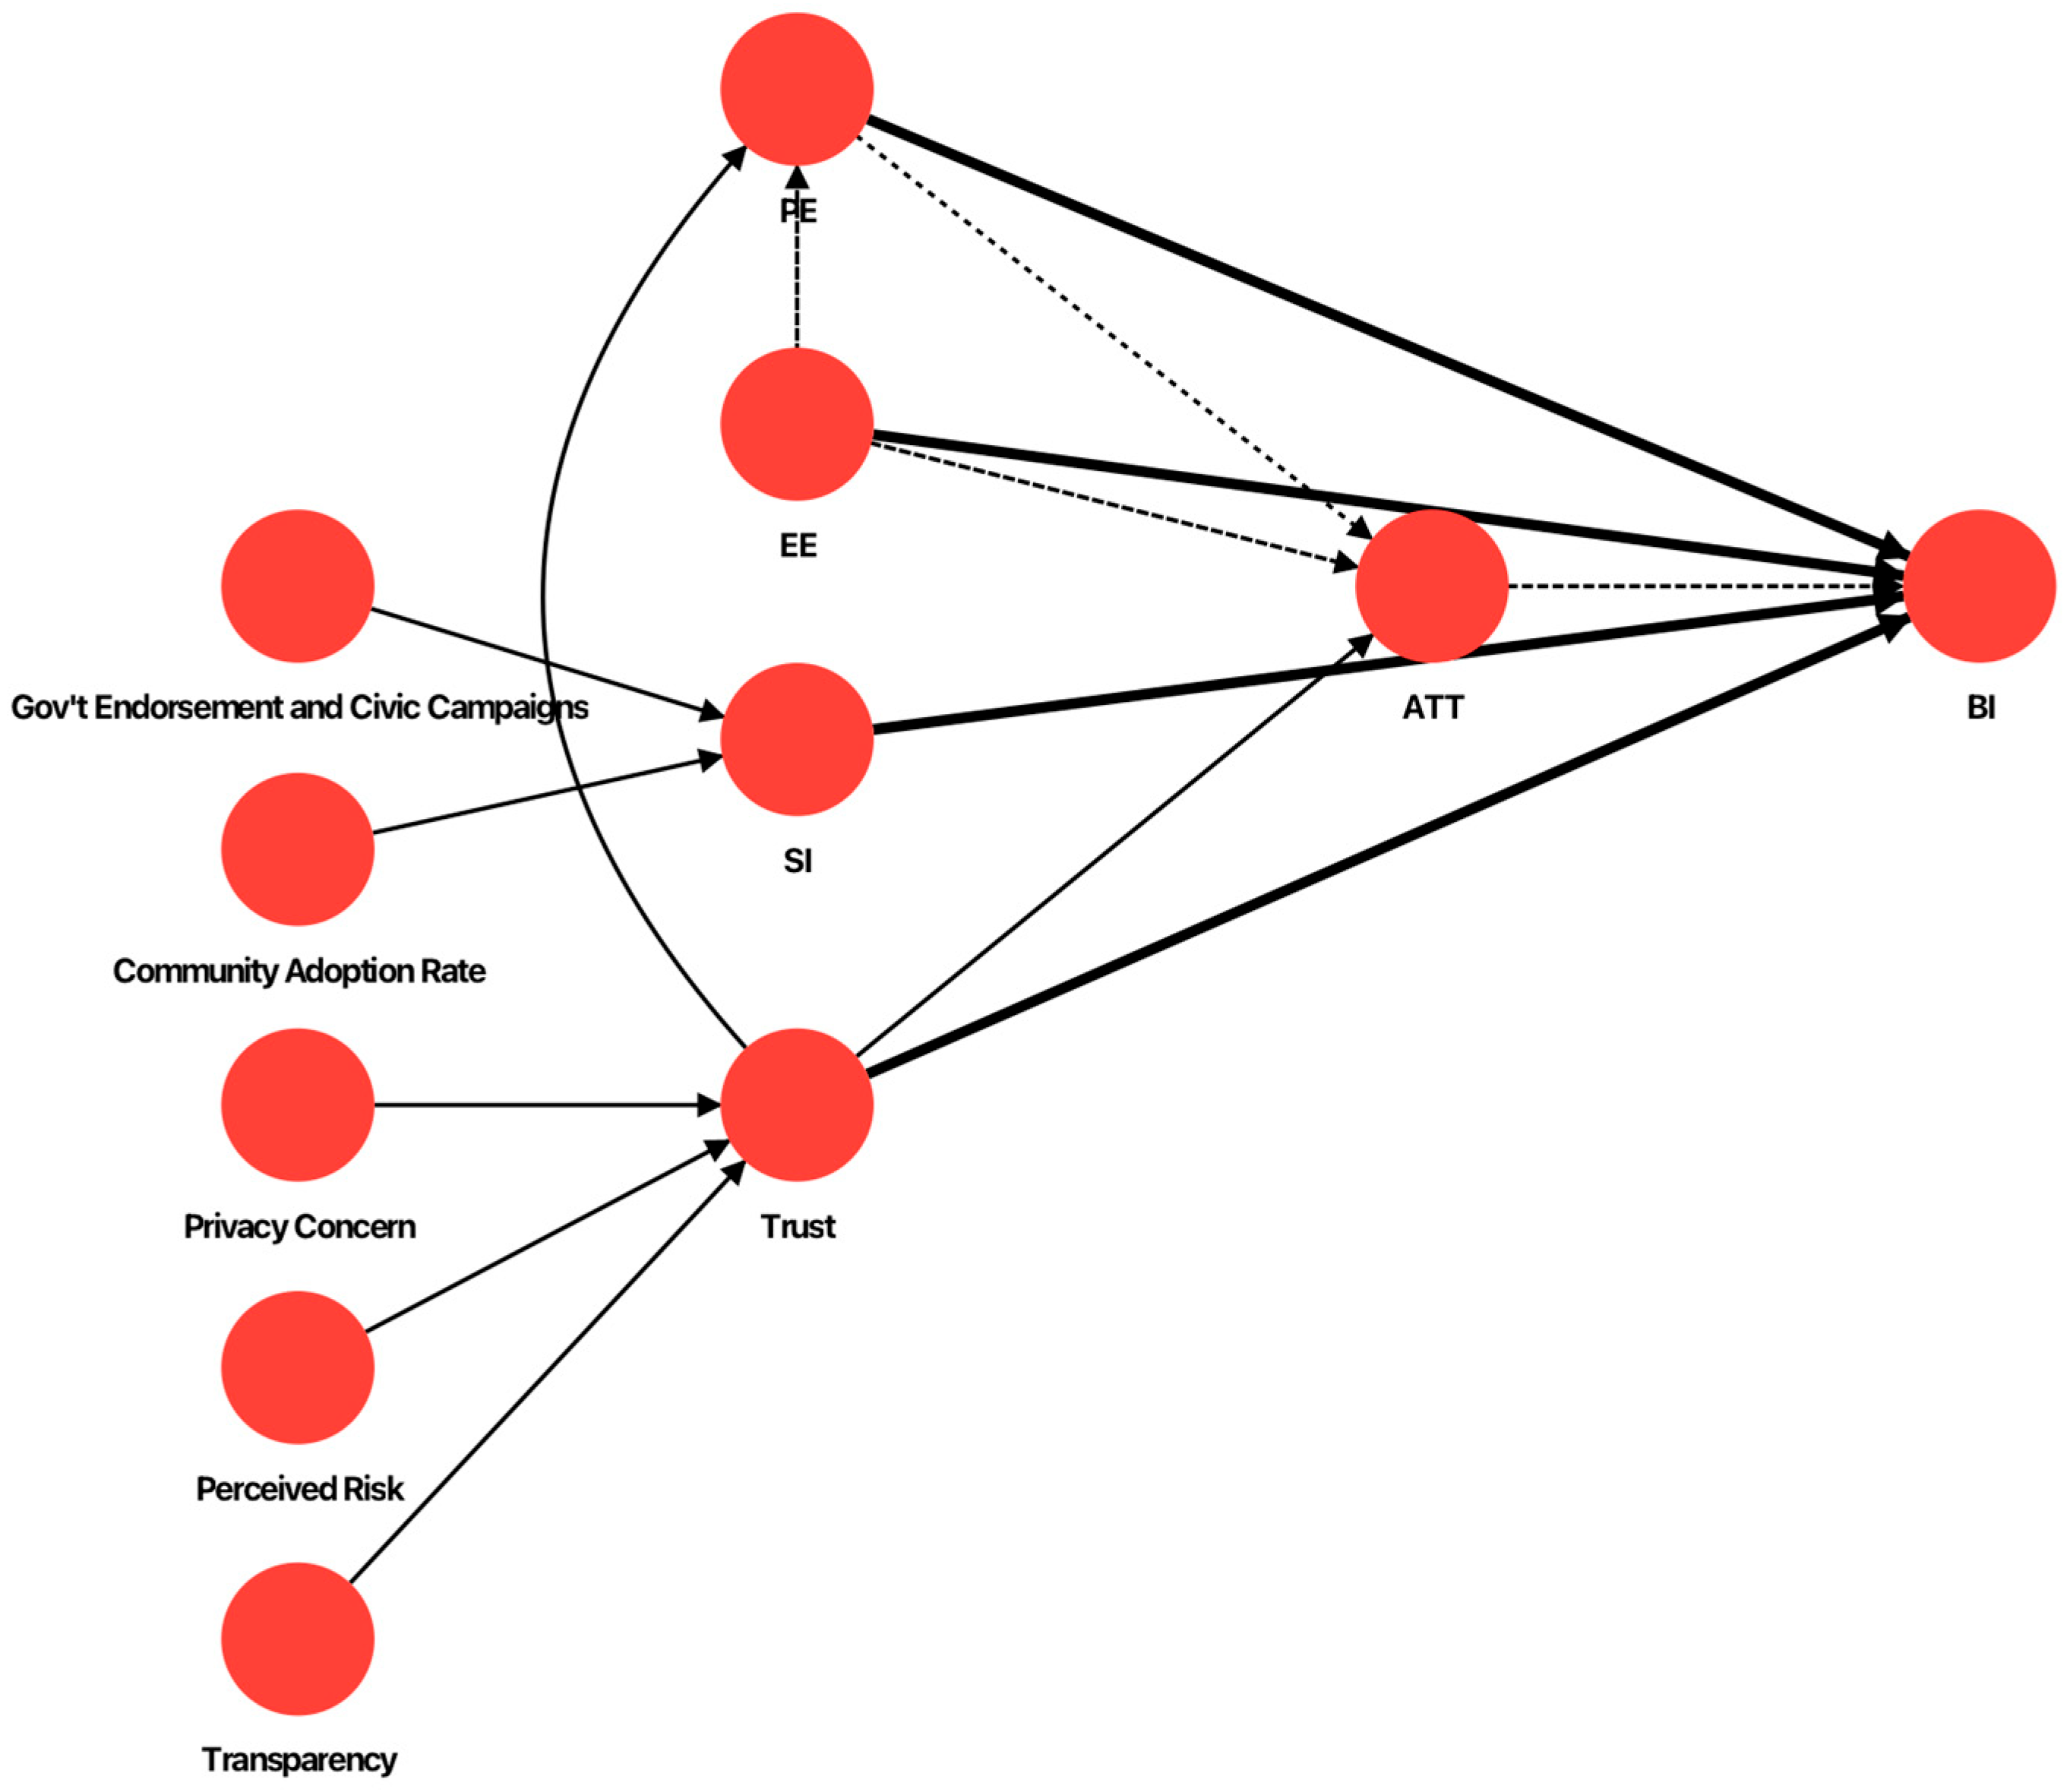
The baseline acceptance model, shown in
Figure 1, adapts TAM/UTAUT to the public-service context. Performance expectancy (PE), effort expectancy (EE), social influence (SI), and attitude (ATT) are posited to predict behavioral intention (BI), while trust in civic technology provides additional explanatory power. Trust is, in turn, shaped by privacy concern, perceived risk, and transparency/feedback visibility. The baseline model addresses RQ1 by identifying the core acceptance drivers of a proposed reporting application before deployment.
Because the app has not yet been launched, BI is used as the endpoint in both models. This is standard in pre-deployment TAM/UTAUT research, where actual usage behavior cannot yet be observed [
7,
8]. Using BI also improves parsimony and validity because introducing use behavior (UB) at this stage would require hypothetical or proxy measures that are inherently speculative.
ATT is retained although some UTAUT studies omit it. ATT captures the affective appraisal that accompanies cognitive evaluations of usefulness and effort. In civic technologies, residents may not only ask whether the app is useful, but also whether it feels trustworthy, reassuring, intuitive, and socially appropriate. Retaining ATT therefore enables examination of whether cognitive evaluations operate directly on intention or partly through affective responses. From a design perspective, ATT also reflects actionable design elements such as onboarding tone, reassurance cues, and interface clarity.
The baseline model adapts UTAUT to the civic-technology context in several ways. PE corresponds conceptually to TAM’s perceived usefulness (PU) and is modeled as a direct driver of BI. EE corresponds to perceived ease of use (PEOU) and is expected to influence BI both directly and indirectly through PE and ATT. SI remains a direct antecedent of BI because civic participation can be shaped by perceived endorsement from governments, communities, and peers [
8]. Facilitating conditions (FCs) are not included because the original UTAUT primarily links FC to post-adoption use behavior, which cannot be observed in a pre-launch setting.
Given the public-service context, trust is incorporated as a central construct reflecting confidence in both the city institution and the reporting platform to process reports competently, fairly, and securely. Trust is theorized to increase PE by strengthening expectations that will lead to action, to improve ATT by reducing uncertainty and anxiety, and to directly increase BI by lowering perceived barriers to participation [
15]. The following three antecedents are therefore attached to trust: privacy concern, perceived risk, and transparency/feedback visibility.
Two external antecedents are also specified for SI, following the injunctive/descriptive norms distinction [
30]. Injunctive norms refer to perceived endorsement by governments or civic organizations, whereas descriptive norms reflect beliefs about whether peers or neighbors are likely to use the app. Both are modeled as antecedents of SI.
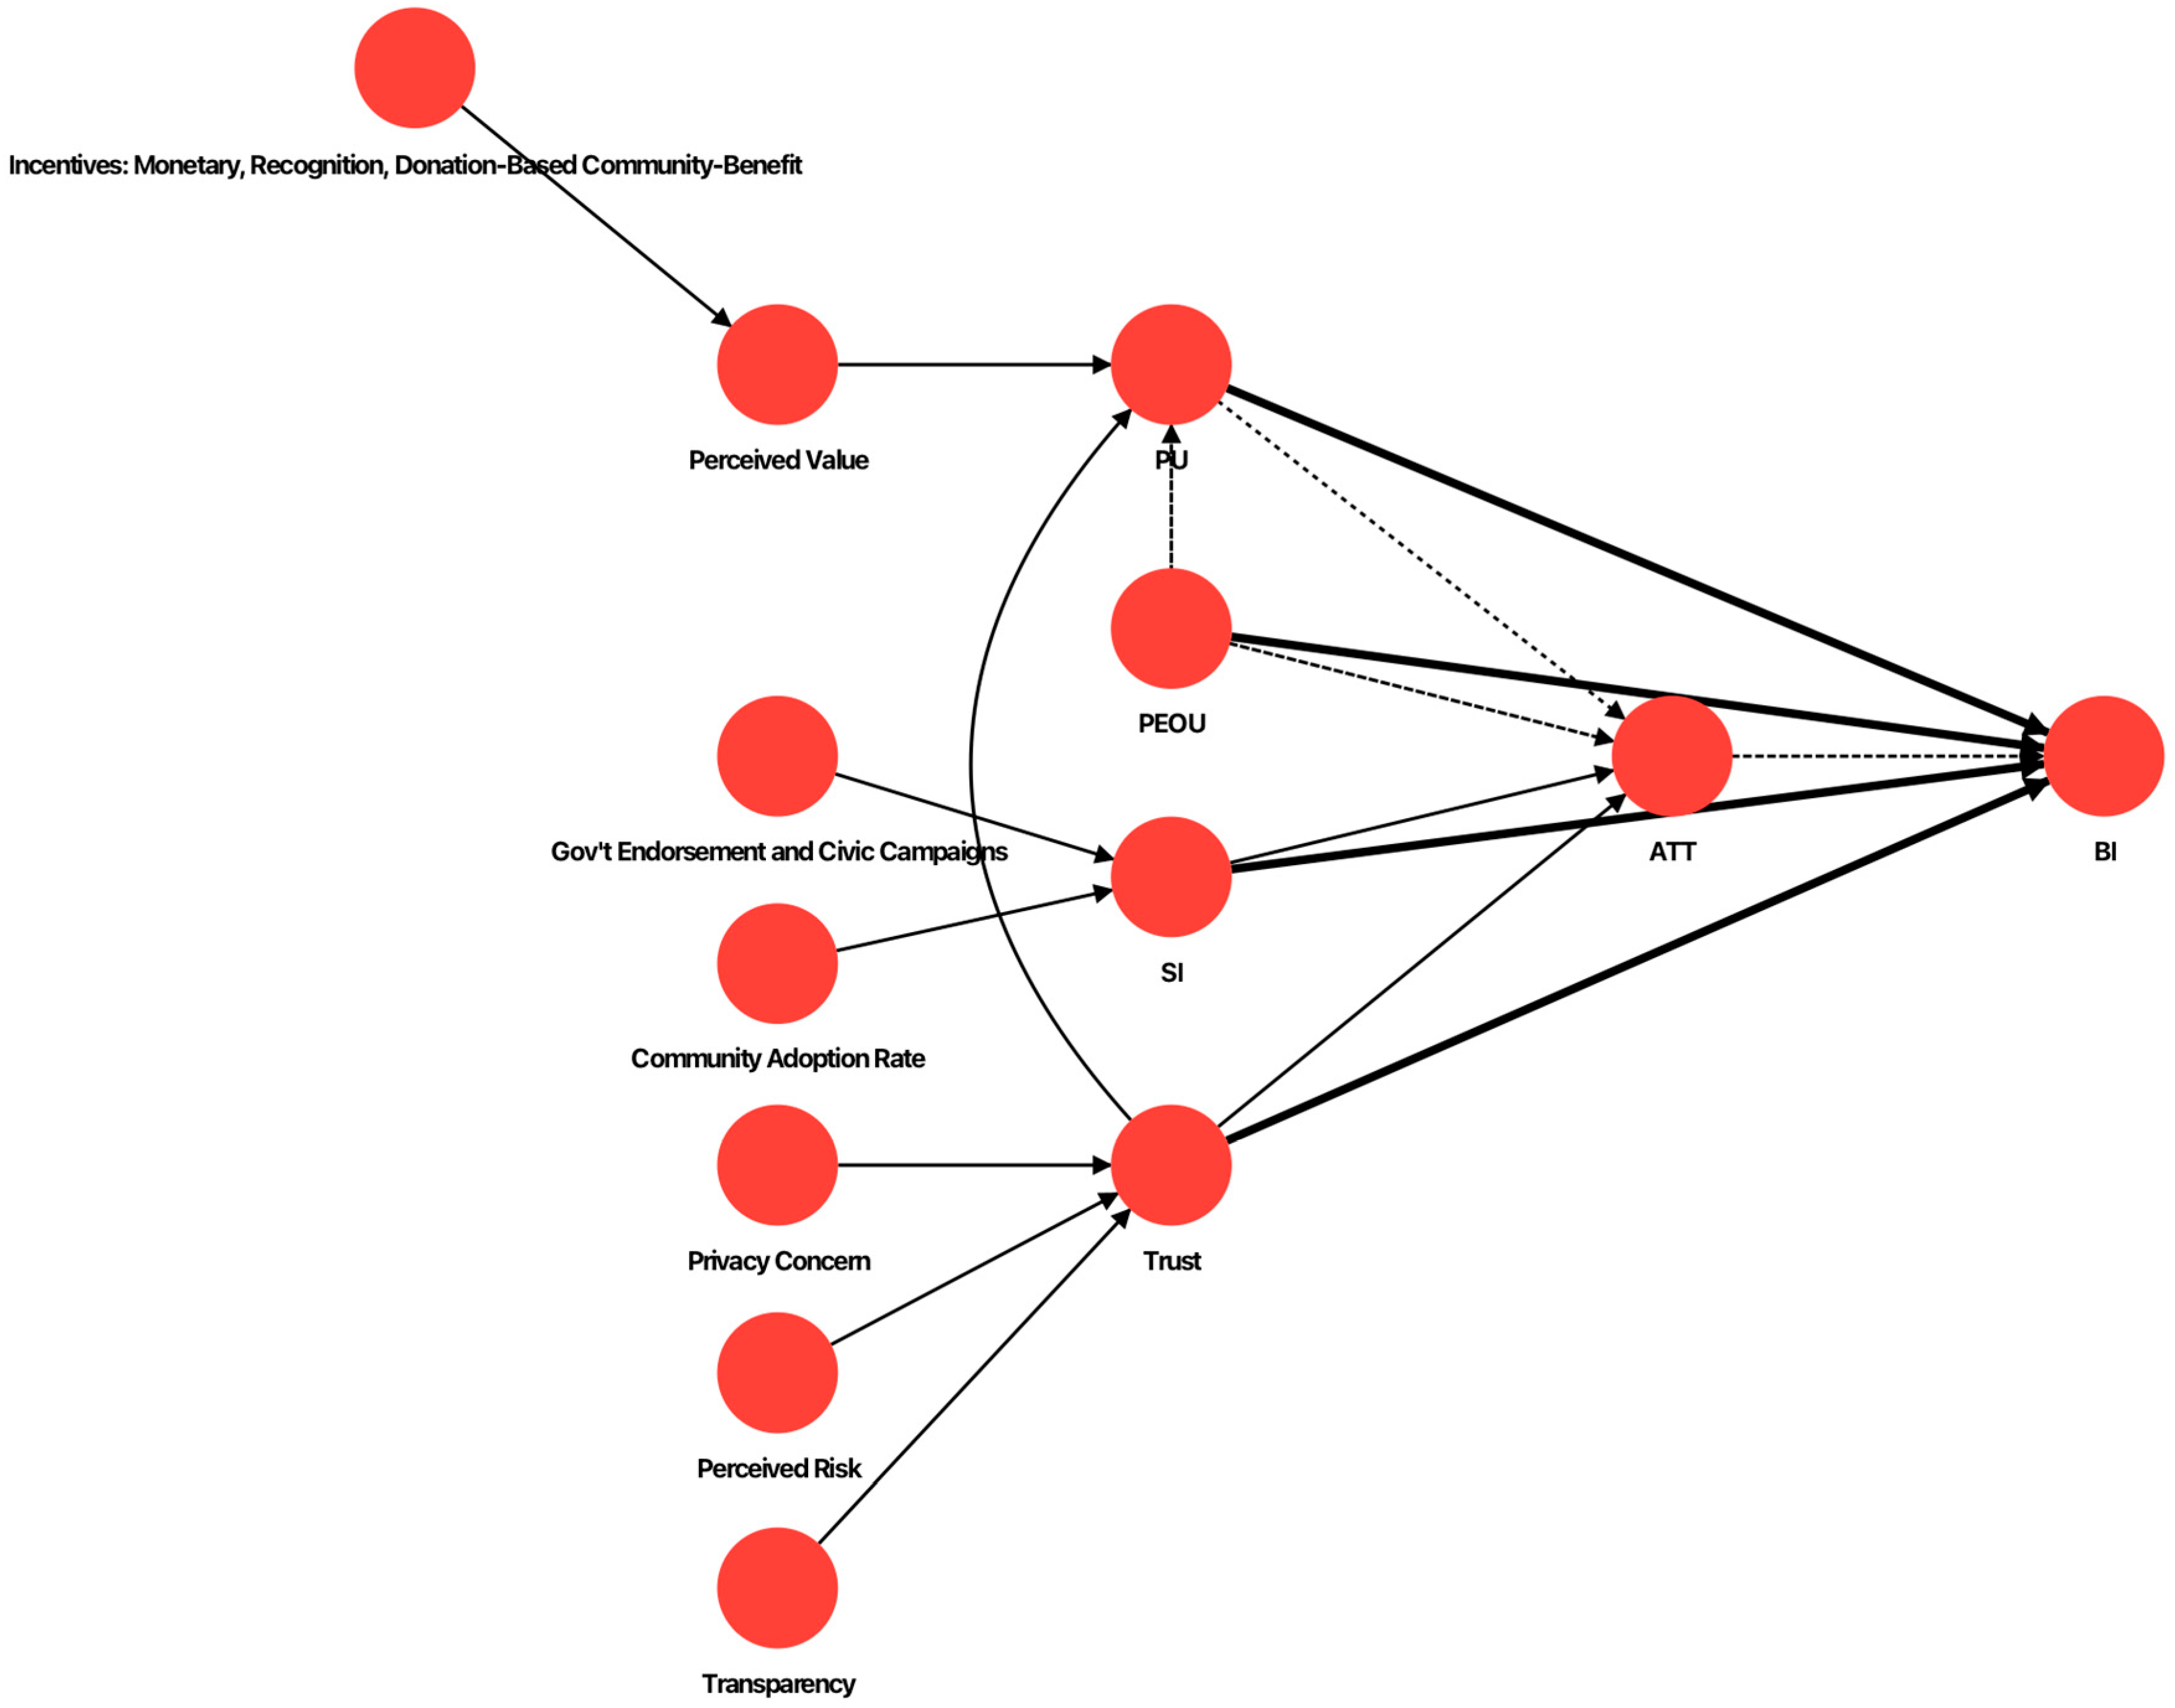
To isolate practical design levers, the incentive-augmented model shown in
Figure 2 extends the baseline structure by introducing an incentive pathway for RQ2. Specifically, randomized incentive type (monetary, recognition, donation-based community-benefit incentive, versus control) is modeled as an exogenous factor operating through perceived value (PV).
Conceptually, PV is distinct from both PE and ATT. PE captures expected functional effectiveness—whether the reporting app is likely to improve issue resolution, responsiveness, or service efficiency. ATT reflects a general affective evaluation of using the system. In contrast, PV represents a broader net appraisal of benefits relative to perceived costs. In the present context, these benefits may include instrumental outcomes, reputational gains, symbolic recognition, or moral satisfaction associated with civic contribution, while perceived costs may include time, effort, inconvenience, or privacy concerns.
This distinction is important because different incentive framings do not directly alter the technical functionality of the application itself. Instead, they reshape how residents evaluate the overall desirability and worth of participation. Monetary incentives may increase external utility through rewards, whereas recognition and donation-based community-benefit incentives may strengthen reputational or prosocial value. PV therefore functions as a common evaluative mechanism through which heterogeneous incentive designs can be systematically compared within a unified framework.
Accordingly, the augmented model specifies the pathway Incentive Type→PV→PE→BI. Supplementary direct paths from the incentive-condition indicators to PE and BI were subsequently examined to distinguish direct, indirect, and total effects; these analytical paths are not shown in
Figure 2 because they were not part of the hypothesized conceptual structure. Incentives are treated as randomized group indicators, and arm-specific indirect effects are estimated via bootstrapping. Importantly, the remaining acceptance structure from RQ1 remains unchanged, enabling direct comparison between the baseline acceptance model and the incentive-augmented model.
Importantly, the proposed framework is not intended as a new acceptance theory per se. Rather, it reframes technology acceptance as a pre-deployment design evaluation problem. By integrating incentive mechanisms into a value-based pathway within an extended UTAUT structure, the framework enables systematic comparison of alternative participation strategies before system implementation and provides practical decision support for civic-technology design.
3.2. Hypotheses for RQ1 (Acceptance Drivers)
When residents believe the app will help get issues acknowledged and fixed faster, they form stronger intentions to use it. This maps TAM’s perceived usefulness to the public-service outcome that matters—service resolution—and is the most consistently strong predictor of intention across acceptance studies [
7,
8].
H1. PE positively affects BI (PE→BI).
Pre-launch, users lack hands-on experience; perceived effort therefore looms large. Simple flows (geotagging, photo upload, and status checks) reduce anticipated cognitive and time costs and can directly raise intention, especially for novices or low digital-literacy groups [
8].
H2. EE positively affects BI (EE→BI).
In civic technologies, perceived expectations of important others—city government, civic groups, neighbors—can trigger compliance even when private affect is neutral. UTAUT shows SI can shape intention under conditions of visibility and normative pressure, both of which characterize public-spirited reporting [
8].
H3. SI positively affects BI (SI→BI).
Beyond cognition, residents form an affective appraisal of the app (e.g., “using it feels right/pleasant”). TAM2/TAM-derived models show that favorable attitudes translate into intention, particularly when the experience is framed as fluent, reassuring, and respectful [
12].
H4. ATT positively affects BI (ATT→BI).
Believing the app will be useful (PE) and easy (EE) should not only act directly on intention; these beliefs also improve how the app feels to prospective users, which, in turn, increases intention. This mechanism clarifies how instrumental appraisals propagate through affect in public-sector contexts.
H5a. PE positively affects ATT.
H5b. EE positively affects ATT.
H5c. PE has a positive indirect effect on BI via ATT.
H5d. EE has a positive indirect effect on BI via ATT.
Classic TAM posits that ease of use informs usefulness; pre-launch, perceived effort can bolster expected performance outcomes [
7,
12].
H6. EE positively affects PE.
Trust blends beliefs about ability, integrity, and benevolence of both the city institution and the platform. In e-government, trust reliably lowers perceived barriers, raises perceived usefulness, and can directly increase intention [
15]. Applied here, if residents trust that reports will be handled competently and fairly, they expect greater payoff (PE), feel more comfortable (ATT), and are more willing to act (BI).
H7a. Trust positively affects PE.
H7b. Trust positively affects ATT.
H7c. Trust positively affects BI.
Privacy concern (about locations/photos/identifiability) and perceived risk (misuse, exposure, and retaliation) should reduce trust; transparency/feedback visibility (process descriptions, timestamps, case IDs, and closure photos) should increase trust. Prior work highlights the salience of these factors in public digital services [
15].
H8. Privacy concern negatively affects trust.
H9. Perceived risk negatively affects trust.
H10. Transparency/feedback visibility positively affects trust.
Following the focus theory of normative conduct, injunctive norms (official endorsement/“ought to use”) and descriptive norms (expectations that peers/neighbors will use) shape perceived social pressure via distinct mechanisms—authority signaling vs. observed/common behavior [
30]. Both should elevate SI pre-launch.
H11. Injunctive norms positively affect SI.
H12. Descriptive norms positively affect SI.
3.3. Hypotheses for RQ2 (Incentive-Type Effects)
To compare practical launch levers, an incentive pathway is added to the RQ1 baseline as follows: randomized incentive type (monetary, recognition, and donation-based community-benefit incentive, vs. control)→PV→PE→BI. PV serves as a common currency for heterogeneous incentives—the resident’s net appraisal of benefits (instrumental outcomes, reputation/status, and moral satisfaction) versus costs (time/effort, privacy) [
17]. This aligns with UTAUT2’s emphasis on price/value in consumer-like, mobile services [
18]. The analysis treats the incentive conditions as exogenous dummy variables, estimates arm-specific indirect effects using percentile bootstrapping, and reports direct, specific indirect, total indirect, and total effects. The incentive amounts and wording were calibrated to emphasize appreciation rather than to price the civic act.
Small vouchers/lotteries increase extrinsic benefits and can raise PV, particularly where effort is salient or outcomes are delayed. At the same time, prosocial settings carry crowding-out risks if payments are trivial or poorly aligned [
9,
19,
20,
21]. Accordingly, a net positive shift in PV was hypothesized relative to the control condition.
H13a. A monetary incentive (vs. control) increases PV.
Badges, leaderboards, or public thanks elevate status/reputational benefits at near-zero marginal cost; symbolic awards have increased public-good contributions, and gamification shows generally positive (though heterogeneous) engagement effects [
10,
23]. We therefore expect a PV gain.
H13b. A recognition incentive (vs. control) increases PV.
Donation-based community-benefit incentives link an individual reporting action to a tangible contribution to the local community. By allowing participants to generate prosocial benefit without receiving personal financial reward, this mechanism may increase perceived value through moral satisfaction, perceived social impact, and neighborhood identification [
21,
22].
H13c. A donation-based community-benefit incentive (vs. control) increases PV.
When PV rises—because rewards, recognition, or civic meaning increase the perceived “return” on effort—residents also expect better outcomes from using the app (e.g., faster resolution, visible impact). Conceptually, PV raises the instrumental expectancy that use will pay off, thereby boosting PE [
17,
18].
H14. PV positively affects PE.
Given the PE→BI relationship specified for RQ1, each incentive condition is expected to exhibit a positive indirect effect on BI through the chain incentive condition→PV→PE→BI. Percentile bootstrap confidence intervals are used to assess these specific indirect effects [
31,
32,
33,
34].
H15a. The indirect effect monetary→PV→PE→BI is positive.
H15b. The indirect effect recognition→PV→PE→BI is positive.
H15c. The indirect effect donation-based community-benefit incentive→PV→PE→BI is positive.
The hypotheses focus on the theoretically specified value-based pathway. To assess whether these indirect effects coexist with additional direct effects, supplementary structural analyses also estimated direct paths from the incentive-condition indicators to PE and BI. These analyses were used to decompose each condition’s direct, specific indirect, total indirect, and total effects, rather than to introduce additional hypotheses.
4. Methods
4.1. Design and Measures
This study conducted a scenario-based, pre-deployment survey experiment to evaluate acceptance of a non-emergency city-reporting app and to compare incentive types at launch. The study uses a between-subjects randomized design with four arms—monetary, recognition, donation-based community-benefit, and control—implemented via short, equal-tone messages embedded in the survey. The full wording of the incentive conditions is provided in
Appendix B. Participants viewed mock screens (report→triage→dispatch/repair→closure→feedback) and a concise process description to anchor judgments in a realistic 311 workflow. The four conditions shared a common app interface, reporting workflow, tone, and general presentation format, while differing in the focal incentive mechanism and associated message content.
The design serves two linked aims. For RQ1 (baseline acceptance), we estimate an extended UTAUT model in which PE, EE, SI, ATT, and trust predict BI. Because the app has not been launched, BI is the prespecified primary endpoint. For RQ2 (incentive effects), we augment the baseline with a mechanism pathway: incentive type→PV→PE→BI. Incentive arms are coded as group dummies (control as reference) to estimate arm-specific indirect effects through PV→PE. To further distinguish mediated effects from additional direct effects, a supplementary structural specification added direct paths from each incentive-condition indicator to PE and BI. This specification retained all paths in the hypothesized RQ2 model and was used only for effect decomposition. The RQ1 structure (PE, EE, SI, ATT, trust→BI; EE→PE; PE/EE→ATT; antecedents→trust; norms→SI) is otherwise unchanged.
To ensure comparability across the research questions, the two primary structural variants were estimated using the same full randomized sample (N = 580: control, n = 146; monetary, n = 146; recognition, n = 145; donation-based community-benefit, n = 143). In RQ1, the baseline acceptance model was estimated on the full sample without including perceived value or the incentive-condition indicators. Random assignment supports comparability across the experimental conditions by reducing the likelihood of systematic baseline differences among the arms; however, it does not establish measurement or structural invariance. Accordingly, the pooled RQ1 model is interpreted as an overall-sample estimate of the acceptance relationships, not as evidence that these relationships are invariant across experimental conditions.
RQ2 extends this baseline by incorporating perceived value (PV) and modeling incentive conditions (dummy-coded with control as the reference) as exogenous predictors of PV, while keeping all other structural relationships identical to RQ1. This design enables direct comparison of incentive mechanisms within a consistent modeling framework.
All latent variables are measured reflectively using three items on seven-point Likert scales. All measurement items are provided in
Appendix A. Questionnaire items refer to the mature and classic scales from previous studies. Wording is adapted to the non-emergency reporting app and pre-deployment context. The survey sequence is standardized: scenario and mock screens→random assignment to one incentive (or control)→PV (RQ2 mechanism)→core constructs (PE, EE, SI, ATT, trust and their antecedents)→BI→manipulation checks and demographics. This ordering ensures that incentive manipulations temporally precede PV and the acceptance measures while preserving the baseline model’s interpretability.
4.2. Sampling and Data Quality Control
Participants were residents of Toronto and the Greater Toronto Area (GTA) aged 16 years or older and were recruited through community outreach and online social groups. Participation was voluntary, and informed consent was obtained on the first survey screen. The study protocol was approved by the relevant ethics committee at Tianjin University on 18 June 2025 (approval no. TJU20250618-2). The ethics approval covered participants aged 16 years and older, and the approved consent procedure was applied to all participants. No direct personally identifiable information was collected. Qualtrics used concealed computer randomization to assign participants to one of four conditions.
A total of 640 submissions were received. Thirty-four responses were excluded because completion time was below the prespecified threshold of 180 s, and 26 were excluded because of highly patterned response behavior (across-item straightlining). The final analytical sample therefore comprised 580 participants: 146 in the monetary condition, 145 in the recognition condition, 143 in the donation-based community-benefit condition, and 146 in the control condition.
Soft quotas were used to reduce major imbalances in age, gender, and broad geographic region.
Table 1 summarizes the demographic composition of the analytical sample and compares it with relevant GTA benchmarks synthesized from the 2021 Census of Population conducted by Statistics Canada [
35].
The final sample was broadly similar to the GTA benchmark in gender and in the distribution across Toronto, York, Peel, Durham, and Halton. However, it was younger and more highly educated than the benchmark population. Participants aged 60 years or older represented 13.1% of the sample compared with 31.0% in the benchmark, while 79.5% of respondents reported college or university education compared with 72.0% in the benchmark. In addition, 38.5% of participants reported prior experience with a civic-reporting application. The sample should therefore be interpreted as a diverse non-probability urban sample rather than as statistically representative of the GTA population.
4.3. Data Analysis
Data analysis was conducted using SmartPLS 4.1.2. Partial least squares structural equation modeling (PLS-SEM) was selected because the study combines an extended acceptance model with multiple exogenous experimental-condition indicators and emphasizes prediction, explained variance, and indirect-effect estimation in a pre-deployment design context [
36]. PLS-SEM is also appropriate for estimating complex structural relationships without requiring multivariate normality.
A sensitivity power analysis was conducted using G*Power 3.1 for a fixed-model multiple regression test [
37]. The most complex endogenous equation in the supplementary model included eight predictors. With a total sample size of 580, an alpha level of 0.05, and statistical power of 0.80, the analysis indicated a minimum detectable effect size of approximately f
2 = 0.026. The sample was therefore adequate for detecting effects slightly above the conventional small-effect threshold, although very small structural effects may remain difficult to detect.
The analysis proceeded in two stages. First, the reflective measurement model was evaluated using indicator loadings, Cronbach’s alpha, composite reliability, average variance extracted (AVE), and discriminant validity. Internal consistency reliability was considered acceptable when Cronbach’s alpha and composite reliability exceeded 0.70, while convergent validity was supported when AVE exceeded 0.50. Discriminant validity was assessed using both the Fornell–Larcker criterion and the heterotrait–monotrait ratio of correlations (HTMT). HTMT values below 0.85 were interpreted as supporting discriminant validity [
36].
Second, the structural model was evaluated using variance inflation factors (VIFs), standardized path coefficients, Cohen’s f2 effect sizes, coefficients of determination (R2), adjusted R2, predictive relevance (Q2), and indirect effects. Cohen’s f2 was used to assess each predictor’s incremental contribution to the explained variance of the corresponding endogenous construct, with values of 0.02, 0.15, and 0.35 interpreted as small, medium, and large effects, respectively. Collinearity was considered acceptable when VIF values were below 5.0. Statistical significance was assessed using nonparametric bootstrapping with 5000 bootstrap subsamples, two-tailed testing, and a significance level of 0.05. Bootstrap confidence intervals were calculated using the percentile method. Model fit was additionally examined using the standardized root mean square residual (SRMR) for the estimated model. SRMR values below 0.08 were interpreted as indicating good approximate fit, while values below 0.10 were considered acceptable. Because global model-fit assessment is less established in PLS-SEM than in covariance-based SEM, SRMR was treated as a supplementary diagnostic rather than as a definitive test of model validity.
Predictive relevance was assessed using the blindfolding procedure with an omission distance of 7. Positive Q2 values were interpreted as indicating predictive relevance for the corresponding endogenous constructs. No item-level missing values remained in the final analytical dataset after data-quality screening.
Out-of-sample predictive performance was assessed using PLSpredict 4.1.1 with 10 folds and 10 repetitions [
38]. Predictive performance was evaluated using indicator-level Q
2_predict values and root mean squared error (RMSE). Positive Q
2_predict values indicate that the PLS-SEM predictions outperform a naïve mean-value benchmark. The PLS-SEM RMSE values were also compared with those obtained from a linear-model benchmark; lower PLS-SEM RMSE values indicate superior predictive performance.
Two primary structural specifications were estimated using the same analytical sample. The baseline model addressed RQ1 by excluding PV and the incentive-condition indicators, whereas the augmented model addressed RQ2 by adding the randomized incentive-condition indicators as predictors of PV while retaining the remaining structural relationships.
To further assess the incentive-related effects, a supplementary structural specification was estimated by adding direct paths from each incentive-condition indicator to PE and BI while retaining all relationships in the hypothesized RQ2 model. This specification enabled decomposition of each incentive condition’s direct effect on PE, indirect effect on PE through PV, and total effect on PE. For BI, the analysis estimated the direct effect, four specific indirect effects—through PV→PE→BI, PV→PE→ATT→BI, PE→BI, and PE→ATT→BI—the total indirect effect, and the total effect. The supplementary model used the same analytical sample, PLS algorithm settings (Path Weighting Scheme, a maximum of 3000 iterations, and a stop criterion of 10
−7), and 5000-subsample percentile bootstrap procedure as the primary models. The additional direct paths are not shown in
Figure 2 because they were introduced for supplementary effect decomposition rather than as part of the hypothesized conceptual model.
5. Results
A manipulation check was conducted to verify whether participants correctly perceived their assigned experimental condition. The conditions were perceived as intended by nearly all participants. Correct identification rates were 100% in the control condition (146/146), 100% in the monetary condition (146/146), 99.3% in the recognition condition (144/145), and 100% in the donation-based community-benefit condition (143/143). Overall, 579 of the 580 participants (99.8%) correctly identified their assigned condition. The single participant who did not correctly identify the assigned condition was retained in the full randomized-sample analysis because manipulation-check performance was not a prespecified exclusion criterion.
5.1. Measurement Model
The reflective measurement model was evaluated using commonly recommended reliability and validity criteria for PLS-SEM, including internal consistency reliability, convergent validity, and discriminant validity.
Table 2 summarizes Cronbach’s alpha, composite reliability (CR), average variance extracted (AVE), and the Fornell–Larcker criterion for all constructs. Cronbach’s alpha values range from 0.721 to 0.881, while CR values range from 0.809 to 0.881, exceeding the recommended threshold of 0.70. AVE values range from 0.586 to 0.713, indicating adequate convergent validity. In addition, the square root of AVE for each construct exceeds its correlations with all other constructs, supporting discriminant validity under the Fornell–Larcker criterion. The HTMT values ranged from 0.275 to 0.813, and all construct-pair values were below the conservative threshold of 0.85, providing additional support for discriminant validity.
Standardized outer loadings ranged from 0.654 to 0.991. All indicators except SI1 and DES1 met or exceeded the recommended value of 0.70. SI1 and DES1 were retained because the corresponding constructs demonstrated satisfactory composite reliability and average variance extracted, and because the items contributed to the conceptual coverage of their respective constructs. Item-level outer loadings are reported in
Appendix A.
Overall, the measurement model demonstrates acceptable reliability and validity for subsequent structural model analysis. All questionnaire items were adapted from established scales in prior technology-acceptance and civic-technology studies and were contextually revised for the non-emergency reporting application and pre-deployment setting.
5.2. Structural Model (RQ1 and RQ2)
Before estimating structural relationships, collinearity diagnostics were examined using variance inflation factor (VIF) values. All internal and external VIF values were below the recommended threshold of 5.0, indicating that multicollinearity was not a significant concern in the structural model estimation.
The estimated-model SRMR values were 0.076 for the baseline model, 0.063 for the incentive-augmented model, and 0.072 for the supplementary direct-effect specification. All three values were below 0.08, providing no indication of substantial overall model misspecification. Consistent with the analytical approach described above, SRMR was interpreted as a supplementary diagnostic rather than as a standalone criterion for model acceptance.
Cohen’s f2 values indicated that several central acceptance relationships made substantial incremental contributions to explained variance. The effects of injunctive norms on SI and effort expectancy on PE were large, while descriptive norms, transparency, PV, PE, ATT, and trust showed predominantly medium effects on their respective endogenous constructs. Recognition showed a medium effect on PV, whereas the donation-based community-benefit condition showed a smaller effect and the monetary condition showed a negligible effect. In the supplementary model, the statistically significant direct effects of recognition and donation-based community-benefit on PE and BI had f2 values below 0.02, indicating negligible incremental contributions to explained variance despite their statistical significance.
Table 3 summarizes the explanatory power (R
2, adjusted R
2) and predictive relevance (Q
2) of the endogenous constructs for both the baseline model (RQ1) and the incentive-augmented model (RQ2). All endogenous constructs exhibit positive Q
2 values, indicating acceptable predictive relevance. The introduction of the value-based mechanism in RQ2 increases the explained variance of performance expectancy (PE), consistent with the addition of perceived value (PV) as an upstream predictor. The explained variance of attitude (ATT) and behavioral intention (BI) remained similar across the two primary models. However, similarity in R
2 should not be interpreted as complete structural invariance, because the significance of selected paths changed after PV and the incentive-condition indicators were introduced.
Table 4 reports the standardized path coefficients and bootstrapped t-values for all hypothesized relationships. In the baseline acceptance structure (RQ1), effort expectancy (EE) positively predicts performance expectancy (PE), while PE, EE, and trust positively predict attitude (ATT). PE and ATT emerge as the strongest predictors of behavioral intention (BI). The direct effect of EE on BI is non-significant in RQ1 but becomes small and significant in RQ2. Social influence (SI) does not significantly predict BI in either model once the cognitive and affective constructs are included.
The trust-related pathways were partially supported. Trust was significantly associated with both PE and ATT, but its direct relationship with BI was not statistically significant (β = 0.045, t = 1.31). Accordingly, H7a and H7b were supported, whereas H7c was not supported. Nevertheless, the significant indirect effects reported in
Table 5 indicate that trust was associated with BI primarily through PE and ATT. Among the antecedents of trust, perceived risk had a significant negative effect, while transparency/feedback visibility had a significant positive effect. Privacy concern negatively predicted trust only in the incentive-augmented model. The changes in the significance of EE→BI and privacy concern→trust indicate some sensitivity to model specification. Although the principal roles of PE and ATT remained similar across the two models, the baseline and incentive-augmented specifications should not be interpreted as structurally invariant. The changes may reflect shifts in shared explained variance after PV and the incentive-condition indicators were introduced.
The incentive-augmented model (RQ2) further examined the value-based mechanism linking incentive design to behavioral intention. Recognition significantly increased PV relative to the control condition (β = 0.327, t = 9.19), as did the donation-based community-benefit condition (β = 0.105, t = 4.88). By contrast, the monetary condition showed only a small positive coefficient that was not statistically significant (β = 0.014, t = 1.76). Accordingly, H13b and H13c were supported, whereas H13a was not supported. PV was positively associated with PE in the structural model.
Table 5 reports the indirect effects within the baseline acceptance structure. Both PE→ATT→BI and EE→ATT→BI are significant, indicating that attitude partially mediates the effects of cognitive evaluations on behavioral intention. Trust showed significant indirect associations with BI through PE and ATT. The variance-accounted-for (VAF) results indicate partial mediation for PE and predominantly indirect influence for EE.
Table 6 and
Table 7 summarize the comparative incentive effects. Planned contrasts on PV indicate that recognition and donation-based community-benefit incentives outperform the monetary condition. To distinguish the hypothesized value-based pathways from additional direct effects, a supplementary structural model added direct paths from each incentive-condition indicator to PE and BI.
Table 7 reports the resulting direct, specific indirect, total indirect, and total effects.
For PE, the recognition condition showed a significant direct effect (β = 0.056, p < 0.001) and a significant indirect effect through PV (β = 0.013, p < 0.05), resulting in a significant total effect of 0.069. The donation-based community-benefit condition also showed significant direct (β = 0.012, p < 0.01) and indirect effects through PV (β = 0.008, p < 0.05), producing a significant total effect of 0.020. These patterns indicate complementary mediation at the PE stage. The monetary condition showed no significant direct, indirect, or total effect on PE.
For BI, recognition showed a significant direct effect (β = 0.022, p < 0.05), a significant total indirect effect (β = 0.085, p < 0.001), and a significant total effect (β = 0.107, p < 0.001). The indirect component accounted for approximately 79.4% of its total effect. The donation-based community-benefit condition similarly showed a significant direct effect (β = 0.007, p < 0.05), total indirect effect (β = 0.028, p < 0.01), and total effect (β = 0.035, p < 0.01), with the indirect component accounting for 80.0% of the total effect. For both conditions, the directionally consistent direct and indirect effects indicate complementary mediation, with indirect effects predominating at the BI stage. The monetary condition showed no statistically significant direct, indirect, or total effect on BI.
Finally, out-of-sample predictive performance was assessed for the two primary structural models using PLSpredict with 10 folds and 10 repetitions.
Table 8 reports indicator-level Q
2predict values and compares the root mean squared error (RMSE) of the PLS-SEM predictions with that of a linear-model (LM) benchmark. This analysis complements the blindfolding-based
assessment reported in
Table 3 by evaluating predictive performance for observations not used in model estimation.
All target indicators in both primary models produced positive Q2predict values, indicating that the PLS-SEM predictions outperformed the naïve mean-value benchmark. For the baseline model, the PLS-SEM RMSE was lower than the corresponding LM RMSE for six of the nine target indicators. The exceptions were PE3, ATT3, and BI3, for which the LM benchmark showed slightly lower prediction errors. For the incentive-augmented model, the PLS-SEM predictions outperformed the LM benchmark for ten of the twelve indicators, with only BI3 and PV3 showing slightly higher RMSE values. Because the PLS-SEM predictions had lower errors than the LM benchmark for the majority, but not all, of the indicators, both models demonstrated medium out-of-sample predictive power. The incentive-augmented model showed comparatively stronger predictive performance, particularly for the PE and ATT indicators.
6. Discussion
Before discussing the detailed findings, it is useful to situate the results within the broader context of civic-technology design. Rather than treating technology acceptance solely as a post-adoption explanatory framework, the present study examines how acceptance modeling can support pre-deployment evaluation of alternative participation strategies for non-emergency reporting systems.
6.1. Reframing Technology Acceptance as a Pre-Deployment Design Evaluation Problem
The findings of this study suggest that technology acceptance modeling in civic-technology contexts can serve a broader role than post hoc explanation of user adoption. Rather than evaluating participation only after a system has been implemented, the proposed framework demonstrates how acceptance modeling can be used as a pre-deployment design evaluation tool for comparing alternative participation strategies before launch.
This distinction is important in smart-city governance because civic reporting systems often require substantial investment in interface development, backend integration, moderation workflows, and organizational coordination before operational data become available. Once a reporting platform is deployed at scale, modifying participation mechanisms, trust signals, or incentive structures may become administratively costly and politically difficult. In this context, pre-deployment evaluation provides practical value by enabling cities to assess alternative design choices during the planning stage rather than relying exclusively on post-launch behavioral analytics.
The study therefore reframes acceptance analysis from a purely explanatory exercise into a decision-support approach for civic-technology design. Instead of asking only whether residents are likely to adopt a proposed system, the framework evaluates how alternative participation designs shape perceived value, usefulness perceptions, trust formation, and downstream behavioral intention. The integration of randomized incentive conditions within the same structural framework further enables systematic comparison of participation strategies.
Importantly, the study does not propose a fundamentally new technology acceptance theory. The baseline relationships among performance expectancy, effort expectancy, social influence, attitude, trust, and behavioral intention remain broadly consistent with established TAM/UTAUT logic. The contribution instead lies in repositioning these acceptance mechanisms within a pre-deployment civic-design context and extending them with a value-based incentive pathway that supports comparison of alternative participation framings.
This framing is particularly relevant for civic technologies because citizen participation is voluntary, socially contextual, and closely linked to trust in public institutions. Unlike many commercial platforms, non-emergency reporting systems depend not only on usability, but also on residents’ expectations that reporting will produce meaningful municipal response and civic value. Pre-deployment acceptance evidence should therefore be treated as one component of a broader implementation assessment rather than as a standalone basis for deployment decisions. Cities should interpret such evidence alongside usability and accessibility testing, cybersecurity and privacy assessments, organizational readiness, service-delivery capacity assessment, field piloting, and post-launch behavioral monitoring. The positive out-of-sample predictive results further suggest that the framework has practical predictive relevance beyond its in-sample explanatory performance, although its prediction errors did not outperform the linear-model benchmark for every indicator.
Cybersecurity and institutional resilience are particularly important because civic-reporting platforms depend on interconnected digital and organizational processes, including the handling of geolocation and image data, identity and access management, cross-departmental case routing, and continued service availability. Smart-city research has shown that interconnected urban technologies create vulnerabilities that cannot be addressed through technical safeguards alone, but require governance, systematic risk assessment, and lifecycle-oriented mitigation [
39]. Consistent with the NIST Cybersecurity Framework 2.0, deployment readiness should therefore include capabilities for cybersecurity governance, asset identification, protection, detection, incident response, and recovery [
40]. Institutional resilience further requires public organizations to maintain service continuity, coordinate across organizational units, absorb operational disruptions or demand shocks, and adapt service-delivery processes without undermining citizen trust [
41]. Accordingly, favorable pre-deployment acceptance should not substitute for evidence that the municipality can securely process reports, sustain back-office operations during disruptions, and restore services in a timely and accountable manner.
6.2. What Drives Adoption Before Deployment?
The results suggest that citizen adoption of non-emergency reporting applications is driven primarily by pragmatic and institutional evaluations rather than by social pressure alone. Across both models, performance expectancy (PE) and attitude (ATT) show the strongest relationships with behavioral intention (BI), indicating that residents are most willing to participate when they believe the system is likely to produce meaningful municipal response and when the reporting experience is perceived positively.
The strong role of PE is particularly important in the civic-reporting context. Unlike entertainment-oriented or socially networked platforms, non-emergency reporting applications are fundamentally outcome-oriented systems. Residents submit reports because they expect visible issue resolution, timely municipal response, or improved neighborhood conditions. As a result, usefulness perceptions are closely tied to expectations of institutional responsiveness rather than purely technological efficiency. This finding reinforces the importance of feedback visibility, case tracking, repair confirmation, and transparency mechanisms in sustaining anticipated usefulness before deployment.
ATT also exerts a substantial effect on BI, suggesting that adoption decisions are not based solely on instrumental reasoning. Residents appear to evaluate whether the reporting experience feels trustworthy, reassuring, intuitive, and socially appropriate. In this sense, attitude captures a broader affective appraisal that complements functional usefulness. The indirect effects of effort expectancy (EE) through ATT further suggest that usability may influence participation less through direct efficiency gains and more through reductions in friction, uncertainty, and cognitive burden during reporting.
By contrast, social influence (SI) becomes non-significant once cognitive and affective evaluations are included in the model. One possible interpretation is that non-emergency reporting is often a low-visibility and weakly social activity. Unlike highly public forms of online participation, reporting potholes, litter, or infrastructure issues is typically episodic, private, and minimally identity-signaling. Residents may therefore rely more heavily on their own evaluations of usefulness and trustworthiness than on perceived peer endorsement. At the same time, the significant effects of injunctive and descriptive norms on SI indicate that institutional encouragement and perceived community participation still shape the broader normative environment, even if they do not directly translate into behavioral intention once individual evaluations are formed.
Trust functions primarily as an upstream mechanism in the model. It was significantly associated with both PE and ATT, but its direct relationship with BI is not statistically significant once these cognitive and affective evaluations are included. This pattern suggests that trust was associated with behavioral intention mainly through stronger expectations that reports would lead to meaningful action and more reassuring evaluations of participation, rather than through an independent direct relationship with intention. The significant effects of transparency/feedback visibility and perceived risk on trust further reinforce the importance of institutional reassurance in civic-technology adoption.
Taken together, these findings suggest that pre-deployment acceptance of civic reporting systems depends less on novelty or social visibility and more on whether residents perceive the platform as credible, useful, low-friction, and institutionally responsive. The acceptance structure identified in this study therefore reflects not only technology usability, but also broader expectations regarding civic responsiveness and public-service reliability.
The comparison between the baseline and incentive-augmented models also indicates limited sensitivity to structural specification. The central roles of PE and ATT in predicting BI were consistent, but the EE→BI and privacy concern→trust paths changed in statistical significance after PV and the incentive indicators were introduced. These differences suggest that some smaller effects depend on how value-related predictors are represented in the model. Accordingly, the substantive interpretation should emphasize the consistently supported central relationships rather than treating every path estimate as invariant across specifications.
6.3. Direct and Value-Mediated Effects of Incentive Design
A central finding of this study is that the experimentally manipulated incentive conditions differed not only in their ability to shape perceived value (PV), but also in their direct and total relationships with performance expectancy (PE) and behavioral intention (BI). Recognition and donation-based community-benefit incentives produced significant direct and indirect effects on both PE and BI, whereas the specific $2 city-credit condition showed no significant direct, indirect, or total effects. The supplementary decomposition therefore indicates that PV represents an important, but not exclusive, mechanism linking non-monetary incentive designs to downstream acceptance outcomes.
The findings continue to support the conceptual role of PV as a broader evaluative mechanism distinct from PE. For recognition, the PV-initiated pathways accounted for 0.068 of the total indirect effect on BI, while an additional 0.017 operated through PE independently of PV. For the donation-based community-benefit condition, 0.018 of the total indirect effect operated through PV and 0.010 through the additional PE pathways. These results suggest that the incentive conditions shaped downstream intention partly by increasing the perceived worth of participation and partly through additional changes in expected system performance that were not fully captured by PV.
The direct and indirect effects of both recognition and donation-based community-benefit were positive and statistically significant, indicating complementary rather than indirect-only mediation. However, the indirect components accounted for approximately four-fifths of their total effects on BI. Thus, although neither condition operated exclusively through PV and PE, the predominant share of its relationship with behavioral intention was transmitted through downstream evaluative mechanisms. Recognition produced the larger overall effect, while the donation-based community-benefit condition showed a smaller but similarly structured pattern.
The comparatively stronger performance of recognition and donation-based community-benefit incentives is particularly notable in the civic-technology context. Unlike purely commercial digital services, participation in urban reporting systems may be closely linked to civic identity, neighborhood belonging, and perceptions of public contribution. Recognition-oriented incentives may strengthen reputational visibility and social acknowledgment, while donation-based community-benefit incentives may reinforce prosocial meaning by linking each report to a tangible local contribution. By contrast, monetary incentives may frame reporting participation as a transactional exchange rather than a civic contribution, potentially limiting their downstream influence on perceived value and behavioral intention.
Importantly, these findings should not be interpreted as evidence that monetary incentives are generally ineffective in civic participation. The result is contingent on the specific incentive tested in this study: a
$2 city credit redeemable for selected municipal services. A larger, more immediate, or more fungible reward, such as direct cash or a higher-value voucher, might produce different effects. The present findings therefore show that this particular low-value city-credit design produced no statistically significant direct, indirect, or total effect on either PE or BI. Its comparatively weak performance is consistent with, but does not directly establish, motivational crowding-out explanations [
9,
19,
20,
21].
From a design perspective, these findings suggest that incentive systems in civic technologies should be understood not simply as participation triggers, but as mechanisms that shape how residents perceive the value of engagement. Recognition surfaces, civic identity cues, community contribution framing, and visible acknowledgment may therefore function as meaningful design levers in participatory urban platforms. More broadly, the findings illustrate how incentive evaluation can be integrated into a technology acceptance framework through both value-mediated and supplementary direct pathways, enabling systematic comparison of alternative participation strategies before deployment.
6.4. Design Implications for Civic Reporting Systems
The findings of this study have several implications for the design of non-emergency reporting systems and participatory civic technologies more broadly. Rather than treating adoption as solely a communication or outreach problem, the results suggest that participation depends heavily on whether residents perceive the reporting process as credible, responsive, low-friction, and socially meaningful.
First, the strong role of performance expectancy (PE) and trust highlights the importance of visibility and institutional reassurance in civic reporting systems. Residents appear more willing to participate when they believe reports will lead to meaningful municipal action. As a result, reporting platforms should not function merely as issue-submission interfaces, but also as transparency and feedback infrastructures. Design elements such as status tracking, repair timestamps, assignment visibility, closure evidence, and progress notifications may strengthen expectations that reporting efforts will produce tangible outcomes. Similarly, privacy-by-default settings, clear consent language, optional anonymity, and transparent data-handling policies may help reduce uncertainty and reinforce institutional trust before deployment. These user-facing protections should be supported by backend cybersecurity governance, incident-response procedures, recovery planning, and cross-departmental service-continuity arrangements [
40,
41].
Second, participation incentives should be understood as mechanisms that can shape both the perceived value of participation and broader expectations about system performance, rather than merely as simple reward triggers. The significant direct effects on PE suggest that recognition and community-benefit designs may also influence how credible, impactful, or institutionally meaningful the reporting system appears, beyond their effects on PV alone. The comparatively stronger effects of recognition and donation-based community-benefit incentives indicate that residents may respond more positively to participation designs that reinforce civic identity, community contribution, or social acknowledgment. In practice, this may include contributor badges, neighborhood contribution dashboards, public appreciation mechanisms, or interface language emphasizing collective urban improvement. Importantly, these findings do not imply that monetary incentives should never be used, but rather that the specific low-value city-credit incentive tested in this study was less effective than the recognition and donation-based community-benefit conditions; this result should not be generalized to monetary incentives with different values or formats.
Third, the indirect effects of effort expectancy (EE) through attitude (ATT) suggest that usability influences participation not only through efficiency, but also through reductions in cognitive burden and uncertainty. Reporting systems should therefore minimize procedural friction through concise forms, intuitive navigation, guided photo upload, auto-filled location functions, and clear onboarding instructions. Warm interface tone, reassurance cues, and simplified reporting flows may also improve affective responses to participation, particularly during first-time use.
More broadly, the study illustrates how pre-deployment evaluation frameworks can support evidence-informed civic-technology design before large-scale implementation. By integrating acceptance modeling with comparative incentive evaluation, cities may be better positioned to assess alternative participation strategies during early planning stages rather than relying solely on post-launch trial-and-error adjustments.
6.5. Limitations and Future Research
Several limitations should be acknowledged when interpreting the findings of this study.
First, the study evaluates behavioral intention (BI) rather than actual reporting behavior because the proposed reporting application has not yet been deployed. Although BI is widely used in TAM/UTAUT research as a valid pre-adoption endpoint [
7,
8], intention does not always translate into sustained real-world participation. Actual use may be influenced by additional operational factors such as long-term engagement fatigue, notification overload, repair responsiveness, and evolving trust in municipal institutions. The present framework should therefore be interpreted primarily as a pre-deployment design evaluation tool rather than a substitute for post-launch behavioral analytics. Future studies should validate the framework using operational platform data, including actual reporting frequency, retention, response satisfaction, and longitudinal participation patterns.
Second, the study used a non-probability sample recruited in Toronto and the Greater Toronto Area. Comparison with the 2021 Census benchmarks indicates that the sample was broadly similar in gender and regional distribution but underrepresented adults aged 60 years or older and was more highly educated than the benchmark population. Detailed information on ethnicity and household income was not collected. Consequently, representativeness and potential heterogeneity in acceptance across racialized and socioeconomic groups could not be assessed. This limitation is important because digital access, institutional trust, and reporting propensity may vary across demographic groups.
Third, the study uses a scenario-based survey experiment conducted within the Greater Toronto Area. Although the randomized multi-arm design strengthens internal validity for comparing incentive framings, the external validity of the findings may vary across cities and governance environments. Urban reporting cultures, trust in government, civic norms, digital literacy, and prior experience with public-service technologies differ substantially across regions and countries. For example, incentive mechanisms that are effective in high-trust or highly civic-oriented contexts may operate differently in cities with lower institutional trust or different expectations regarding citizen-government interaction. Future research should therefore examine the transferability of the framework across different urban, cultural, and administrative settings.
Fourth, the study focuses on pre-deployment evaluation rather than full system implementation. While this design enables comparison of alternative participation strategies before launch, it necessarily simplifies some aspects of real-world usage. Participants evaluated hypothetical reporting scenarios and mock interfaces rather than interacting with a fully operational platform over time. Factors such as repeated exposure, peer visibility, evolving community norms, and actual repair outcomes may reshape perceptions after deployment. Future research could extend the framework through field pilots, longitudinal studies, or live platform experiments that examine how acceptance drivers and incentive effects evolve during operational use.
Fifth, the direct-effect paths from the incentive conditions to PE and BI were examined in a supplementary analysis rather than as part of the original hypothesized incentive structure. Although the resulting decomposition clarifies the direct, specific indirect, total indirect, and total effects of the experimental conditions, these additional paths should be interpreted as a robustness-oriented extension of the primary model. Future studies should preregister competing direct- and indirect-effect specifications and examine whether the observed mediation patterns can be replicated in field settings. More broadly, the changes in selected path estimates across the primary specifications indicate that smaller structural effects may be sensitive to model specification and should be replicated in future studies.
Finally, although the study integrates incentive mechanisms into an extended acceptance framework, the findings should not be interpreted as establishing definitive psychological causality for all motivational processes. The study identifies comparative effects of different incentive framings through perceived value (PV) but does not directly observe deeper motivational constructs such as intrinsic motivation, civic identity formation, or long-term prosocial commitment. Future work may combine behavioral modeling with qualitative or mixed-method approaches to further examine how residents interpret and internalize different participation incentives in civic-technology contexts.
7. Conclusions
This study examined citizen adoption of a smart-city non-emergency reporting application through a pre-deployment evaluation framework that integrates technology acceptance modeling with comparative incentive analysis. Using a randomized multi-arm survey design and PLS-SEM, the study investigated both the baseline drivers of behavioral intention and the comparative effects of alternative participation framings before system implementation.
The findings show that performance expectancy (PE) and attitude (ATT) are the strongest predictors of behavioral intention, while trust appears to function as an important upstream construct associated with both cognitive and affective evaluations of the reporting system. Social influence becomes comparatively weak once residents form direct evaluations of usefulness and trustworthiness, suggesting that participation in non-emergency reporting is driven more by pragmatic and institutional considerations than by social pressure alone.
The study also shows that incentive mechanisms can operate through both direct and indirect pathways. Recognition and donation-based community-benefit incentives produced significant direct, indirect, and total effects on PE and BI. At the BI stage, indirect effects accounted for approximately 79% and 80% of their respective total effects, indicating complementary mediation with indirect mechanisms predominating. The specific $2 city-credit condition, by contrast, showed no significant direct, indirect, or total effect. These findings identify PV as an important but non-exclusive mechanism through which incentive design shapes anticipated civic-technology adoption.
Beyond the specific empirical findings, the study contributes by reframing technology acceptance as a pre-deployment civic-design evaluation problem. Rather than using acceptance models only to explain adoption after implementation, the proposed framework illustrates how acceptance modeling can support evidence-informed comparison of alternative participation strategies before launch. This perspective is particularly relevant for civic technologies, where participation depends not only on usability, but also on institutional trust, perceived responsiveness, civic meaning, and expectations of public-service effectiveness.
From a practical perspective, the findings suggest that cities should prioritize visible responsiveness, institutional reassurance, low-friction reporting experiences, and socially meaningful participation mechanisms when designing non-emergency reporting systems. Features such as feedback visibility, transparent case tracking, recognition-oriented participation design, and clear onboarding processes may strengthen anticipated usefulness and participation willingness prior to deployment.
Several limitations should also be acknowledged. The study evaluates behavioral intention in a pre-deployment setting rather than actual long-term reporting behavior, and the findings are derived from a scenario-based survey conducted within the Greater Toronto Area. Future research should therefore validate the proposed framework using operational platform data, field deployments, longitudinal participation analysis, and comparative studies across different urban and governance contexts. Further work may also examine how participation mechanisms evolve after deployment as residents accumulate direct experience with civic reporting systems.