1. Introduction
Road-traffic injury remains a leading cause of premature death worldwide and disproportionately affects low- and middle-income countries and socially disadvantaged urban populations [
1,
2]. Within cities, fatal risk is rarely distributed evenly. Instead, it concentrates in specific corridors, intersections, and time windows that reflect how land use, mobility systems, and enforcement capacity shape everyday exposure to kinetic energy [
3,
4,
5]. These concentrations are not only technical phenomena; they also reflect decisions about street design, speed management, enforcement, and public-space allocation [
6,
7,
8].
In Latin America, rapid motorization, high motorcycle dependence, and persistent urban inequality intersect with institutional constraints that limit large-scale implementation of Safe System-aligned infrastructure [
9,
10]. Dense central districts often concentrate intense multimodal interaction, whereas peripheral corridors may operate at higher speeds under weaker oversight [
9]. Administrative datasets make high-resolution analysis possible, but regional research is often constrained by fragmented data systems, missing exposure denominators, and limited methodological transparency. As a result, findings may remain descriptive and difficult to translate into accountable policy prioritization [
11,
12].
Medellín is an appropriate setting for a governance-oriented road-safety analysis. The city combines a dense historical core, heterogeneous peripheral expansion, and marked socio-spatial inequality, while maintaining large-scale administrative incident records. Those records allow detailed spatial and temporal analysis but also raise methodological issues, including mixed time formats, incomplete geocoding, and limited information on road-user exposure. Without explicit treatment of these constraints, results can be overstated and policy arguments can imply stronger causal claims than the data support [
3,
13].
The time span of the dataset also matters. The 2008–2025 series crosses pre-pandemic, pandemic, and post-restriction years, and COVID-19 altered mobility conditions in many settings. Studies from multiple contexts report large shifts in traffic volume, crash frequency, and crash severity during the pandemic period [
14,
15]. For a long administrative series, pandemic-period years therefore require explicit discussion and sensitivity checks rather than being treated as fully comparable to adjacent years.
Within road safety, the term vulnerable road users usually refers to users who lack the protective shell of an enclosed vehicle, especially pedestrians, cyclists, and motorcyclists. In this study, pedestrians receive particular attention because the administrative incident-class field most clearly identifies pedestrian-involved fatal events through Pedestrian strike. The paper does not use vulnerability only in a demographic sense; rather, it examines how urban conditions and governance decisions distribute protection unevenly across locations, times, and road-user configurations.
Although a substantial body of crash research applies hotspot mapping and clustering statistics, much of that work is not framed in terms of governance, spatial justice, or the uneven protection of vulnerable road users [
4,
16,
17]. Conversely, justice-oriented governance scholarship often advances normative arguments without relying on reproducible spatial evidence from administrative surveillance systems. This study addresses that gap by linking transparent injury-surveillance analytics to a governance interpretation of unequal road-safety protection.
Accordingly, the article addresses two linked questions: (1) how are fatal road-traffic incidents in Medellín distributed across time, space, and incident mechanism; and (2) how can transparent surveillance analytics and spatial statistics support governance prioritization for vulnerable road users, with particular attention to pedestrians? To answer these questions, we integrate reproducible data cleaning, inferential modeling, sensitivity checks, and grid-based spatial autocorrelation analysis. Hotspots are interpreted not as cartographic outputs alone, but as signals of uneven protective capacity within the urban system.
The study contributes to the urban science literature in three main ways. First, it documents a transparent workflow for severity filtering, time standardization, geocoding checks, and sample construction in a large administrative dataset. Second, it combines omnibus compositional tests with a theory-driven class-contrast model that distinguishes pedestrian-strike from collision fatalities while acknowledging the absence of exposure denominators. Third, it produces global and local spatial autocorrelation evidence that can be translated into governance priorities without overstating causal inference. The contribution is therefore conceptual and applied rather than statistical in a narrow sense: the paper does not introduce a new spatial statistic, but shows how reproducible injury-surveillance analytics can be used to interpret unequal road-safety protection and support auditable public-sector prioritization.
Throughout, the analysis is interpreted cautiously. Observed patterns are treated as associations consistent with Safe System and spatial justice arguments, not as direct evidence on speeds, enforcement intensity, or pedestrian volumes, which are not measured in the dataset [
18,
19,
20]. The remainder of the article proceeds as follows:
Section 2 develops the theoretical framework;
Section 3 describes the data and methods;
Section 4 reports the empirical findings;
Section 5 discusses the results, policy implications, and limitations; and
Section 6 presents the conclusions.
2. Theoretical Framework: Spatial Justice, Governance Capacity, and Safe System Benchmarks
This section articulates the conceptual foundation that guides the analysis and interpretation of spatiotemporal fatality patterns in Medellín. It integrates three complementary lenses: spatial justice, which frames uneven safety as a distributive urban outcome; governance capacity, which explains how institutional coordination and accountability shape exposure and protection; and Safe System benchmarks, which provide the normative standard for interpreting risk concentration and system performance. Together, these perspectives link spatial evidence to policy mechanisms and clarify the analytical choices adopted in the empirical sections that follow.
2.1. Spatial Justice and Uneven Protection in Mobility Systems
Spatial justice perspectives emphasize that urban benefits and burdens are distributed unevenly across space and are produced through policy, institutions, and infrastructure [
21,
22]. In mobility systems, safety is part of that distribution: the ability to move without disproportionate exposure to lethal risk is a prerequisite for inclusive urban life [
23,
24]. In road-safety research, vulnerable road users are those with little physical protection in a crash, especially pedestrians, cyclists, and motorcyclists. Their vulnerability can be intensified further by age, disability, or poverty, but it does not depend only on demographic characteristics.
Pedestrian vulnerability is central here because pedestrians rely almost entirely on system-level protection: lower operating speeds, safe crossings, adequate lighting, legible priority rules, and forgiving street design [
19,
25]. When those protections are unevenly distributed, pedestrian safety becomes an urban equity issue. Dense central districts may require strong conflict management because of high interaction intensity, whereas peripheral or arterial settings may demand speed control because of severity risk. Both patterns can produce concentrated fatalities, but they imply different governance responses [
8,
18].
Transport equity research adds an institutional dimension by asking whether protection is aligned with need and whether some communities face higher risk because they have fewer practical ways to avoid exposure [
26,
27]. For this reason, road-safety analysis should examine not only how many fatalities occur, but also where and when specific vulnerability mechanisms concentrate and whether governance responses match those concentrations. This framing aligns with urban science debates on the spatial organization of urban problems and the capacity of institutions to respond.
2.2. Governance Capacity, Fragmentation, and Accountability
Urban safety outcomes depend on governance capacity: the ability of institutions to coordinate, implement, and sustain interventions across agencies and over time [
28]. Road-safety governance is often fragmented, with responsibilities distributed across transport departments, police, planning offices, public health surveillance, and infrastructure operators. Fragmentation can undermine policy coherence: speed-limit setting may be disconnected from street design; enforcement may be reactive rather than preventive; and data systems may be inconsistent, limiting accountability [
11,
29]. In this context, spatial evidence can serve as a practical governance tool. Hotspot patterns reveal where institutional coordination is most needed and where the “cost of fragmentation” is most visible [
30].
Governance also has a distributive dimension. The allocation of enforcement and investment can vary by neighborhood, often reflecting political salience, economic centrality, or historical patterns of urban development. This can create a double bind: central areas may concentrate risk due to high interaction density, while peripheral areas may be underserved and face high-speed environments. A spatial justice perspective does not assume that any one area is “neglected” a priori; rather, it examines whether protection aligns with exposure and vulnerability and whether governance capacity is directed where the burden is greatest [
22,
31].
An important implication is the need for interpretive discipline. Governance analyses must distinguish between descriptive patterns and causal claims. Administrative incident data can reveal clustering and associations, but without measured denominators (e.g., pedestrian volumes, vehicle-kilometers traveled) and enforcement indicators, causal language must be tempered [
16,
32]. Accordingly, the analysis uses cautious language—such as “suggests,” “is consistent with,” and “may reflect”—and emphasizes governance relevance rather than causal attribution.
2.3. Safe System Principles as an Interpretive Benchmark
The Safe System approach, including Vision Zero variants, proposes that the transport system should be designed so that inevitable human errors do not lead to death or serious injury [
6,
8,
33]. Two principles are especially relevant for interpreting spatiotemporal patterns in fatal incidents. First, speed management is a foundational mechanism because kinetic energy is the primary determinant of injury severity. Evidence from multiple contexts demonstrates that small changes in impact speed produce large changes in pedestrian fatality risk [
19,
25,
34]. Therefore, when fatalities cluster during low-traffic hours—when operating speeds may increase—a Safe System perspective supports targeted speed management and self-explaining street design, even if speed is not directly measured [
32].
Second, Safe System emphasizes redundancy and shared responsibility. If a particular district consistently concentrates fatalities, this suggests that multiple layers of protection are not functioning adequately. From a governance standpoint, this implies the need for coordinated interventions (design, enforcement, operations) rather than isolated measures [
29]. In this study, the Safe System approach serves as a benchmark for interpreting patterns as governance signals: clusters indicate where protection may be insufficient relative to vulnerability and exposure.
In this study, the Safe System approach serves as an interpretive benchmark rather than as a claim that each causal pathway is directly measured. Because the dataset does not include a harmonized victim road-user type variable, incident class is used as a proxy for vulnerability mechanisms. Pedestrian strike is therefore interpreted as a pedestrian-involved fatal configuration, whereas Collision represents fatal events dominated by motorized-mode interactions. The distinction is analytically useful, but it remains limited by the administrative classification scheme.
2.4. Urban Safety Surveillance as Governance Infrastructure
Road-safety governance depends on surveillance capacity: the ability to record, geocode, and classify incidents consistently over time. Surveillance is not a neutral technical background. It shapes what becomes visible to decision-makers, what can be evaluated, and which communities are prioritized. In many low- and middle-income settings, institutional data systems are fragmented across police, health, and transport agencies, producing inconsistent definitions and incomplete location or time fields [
11,
33]. Such gaps can create “accountability shadows” in which risk persists without being adequately measured.
Recent work in Latin American cities illustrates the value of strengthened surveillance for governance. For example, forensic and administrative data linkages have been used to examine driving-under-the-influence in Bogotá, providing policy-relevant insights beyond conventional crash reports [
35]. Similarly, spatially varying count models applied in Cali indicate that relationships between infrastructure and fatalities can differ across neighborhoods, reinforcing the need for localized governance strategies [
36]. These examples are not directly comparable to Medellín, but they underscore a shared methodological point: as analytic sophistication increases, so does the importance of transparent data documentation and reproducible workflows.
In this study, missing data are treated as a substantive governance issue rather than a purely technical limitation. Improvements in data entry, validation, and geocoding would expand the analytical coverage of safety monitoring and strengthen accountability. Transparent reporting of inclusion criteria and sample construction is therefore central to the governance argument developed in this paper.
3. Methodology
This section describes the data source, sample construction, variable definitions, and analytical procedures used to characterize spatiotemporal patterns in fatal road-traffic incidents in Medellín. Because the analysis relies on administrative records, all inclusion criteria and missing-data rules are documented to ensure transparency and reproducibility.
3.1. Research Design and Analytical Workflow
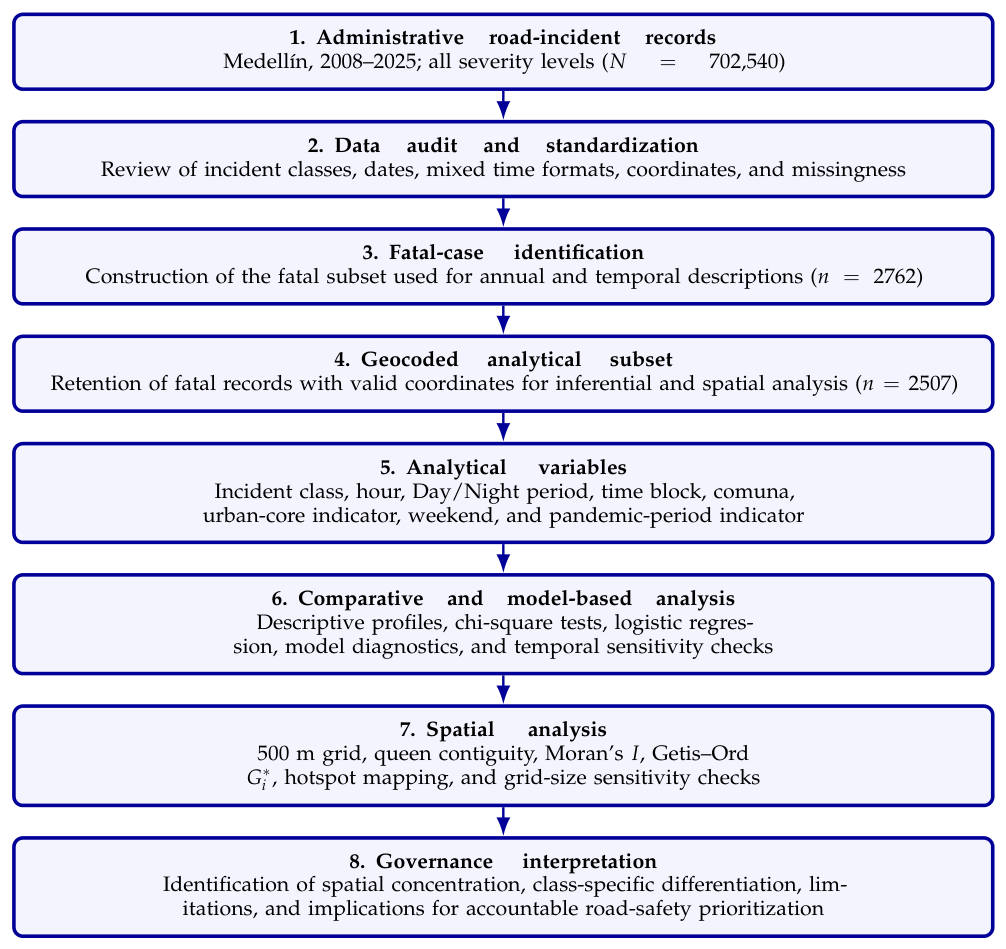
Figure 1 summarizes how the study moves from administrative road-incident records to a governance-oriented interpretation of spatial concentration. The workflow begins with data audit and standardization; continues with fatal-case identification, construction of the geocoded analytical subset, variable definition, descriptive and comparative analyses, logistic modeling, spatial autocorrelation, hotspot detection, and scale-sensitivity checks; and ends with the interpretation of findings for road-safety governance. Presenting the workflow in this way helps clarify the link between the empirical procedures and the policy-oriented reading of the results, while also making clear that the analysis identifies concentrations of fatal incidents rather than exposure-adjusted risk.
3.2. Data Source, Coverage, and Unit of Analysis
We analyzed an administrative dataset of 702,540 road-traffic incidents of all severity levels in Medellín, Colombia, covering the period 2008–2025. The georeferenced dataset and its metadata are described by Arango et al. [
37], and the cleaned analytical repository is available through Mendeley Data [
38]. The records are classified into three mutually exclusive categories: fatal, injured, and property-damage-only. For this study, the unit of analysis is the fatal road-traffic incident. By restricting the inferential analyses to these fatal cases, the final sample yielded 2762 records for the study period.
The fatal-only focus was retained deliberately. The article asks where the road-safety system fails at its most severe outcome and how those failures can inform governance prioritization. Including all nonfatal records in a single comparison group would merge substantively different outcomes (injuredand property-damage-only) and would shift the paper toward a severity-gradient design that requires additional exposure and injury-detail information not available in the current file. Nonfatal incidents remain important for future research, but they are outside the scope of the present fatality-centered analysis.
Incident class is recorded in the administrative field
CLASE_INCIDENTE. For analytical consistency, categories were standardized as Pedestrian strike, Collision, Occupant fall, Rollover, and Other. Spatial fields include latitude and longitude coordinates (WGS84), and administrative attributes include comuna (district) and neighborhood. As with other administrative datasets, the file requires explicit documentation of completeness and preprocessing steps to ensure reproducibility [
30,
39].
3.3. Sample Construction and Missing Data Handling
All analyses begin with the fatal subset (n = 2762). Year fields were complete for fatal records, so annual descriptive summaries use the full fatal sample. Hour-of-day was needed for temporal profiling, Day/Night classification, and the primary regression model. In the raw file, time values appeared in mixed Excel-compatible formats, including native time objects and character-formatted strings. We therefore used a two-stage standardization procedure that first handled native time/datetime values and then parsed character strings using multiple hour-minute-second formats. Using this standardization procedure, valid hour values were recovered for all 2762 fatal records.
Spatial inference and the class-contrast regression required valid coordinates. Of the 2762 fatal records, 2507 contained nonmissing latitude/longitude and were retained in the geocoded analytical subset; 255 records lacked coordinates and were excluded from spatial inference. No spatial imputation was performed, because artificial location assignment could distort clustering results and would require defensible assumptions about spatial uncertainty [
40]. Temporal descriptions that do not require location use the full fatal subset, whereas chi-square tests, regression models, and spatial statistics are estimated on the geocoded subset (
n = 2507).
3.4. Derived Variables and Operational Definitions
This subsection defines the variables created from the administrative file before inferential analysis. Making these choices explicit improves readability and clarifies how each variable enters the subsequent tests and models. For descriptive and inferential purposes, incident classes were analyzed in English as Pedestrian strike, Collision, Occupant fall, Rollover, and Other. The logistic model focuses on Pedestrian strike and Collision, the two dominant fatal classes, because they represent distinct mechanism families and provide sufficient counts for stable estimation. Less frequent classes were retained in the descriptive and spatial analyses but were not entered into the binary class-contrast model.
Hour was retained on its original 0–23 scale for the primary model so that the full temporal ordering of the day was preserved. Day was defined as 06:00–17:59 and Night as 18:00–05:59. Within the geocoded subset, Day records totaled 1243 and Night records totaled 1264. To address interpretability concerns about raw hour, we also created a four-level time-block variable (Overnight = 00:00–05:59; Morning = 06:00–11:59; Afternoon = 12:00–17:59; Evening = 18:00–23:59) for sensitivity analysis.
To distinguish the historical urban core from the rest of the city, we defined a binary center indicator equal to 1 for incidents occurring in Comuna 10 (La Candelaria) and 0 otherwise. This variable is a parsimonious proxy for core urban morphology and activity concentration, not a full built-environment measure or a substitute for comuna-specific effects. We therefore use it cautiously and interpret it as a governance-relevant contrast between the central core and noncore areas.
We also derived a weekend indicator from the calendar date. Because the incident file does not include a meteorological field, weather could not be included in the model. To address the long study period, we additionally created a binary COVID-19-period indicator for March 2020–December 2021 as a sensitivity covariate. For the logistic regression, the dependent variable was defined as for Pedestrian strike and 0 for Collision. This formulation operationalizes the question of when fatal incidents are more likely to involve pedestrians than to reflect collision-type fatal configurations.
3.5. Statistical Analysis
We used a staged analytical design. First, descriptive summaries characterized annual fatal incidents by class and hourly distributions by class. These profiles are reported in the Results Section and provide context for the inferential analyses.
Second, we used Pearson’s chi-square tests to evaluate whether overall incident-class composition was associated with (i) period (Day/Night) and (ii) comuna (top 10 comunas by fatality counts within the geocoded subset). These tests and the regression serve different purposes. The chi-square tests provide omnibus evidence on whether the distribution of all standardized classes varies across groups, whereas the regression addresses a narrower, theory-driven contrast between the two dominant classes. Because rare classes can yield sparse cells, Monte Carlo p-values are reported as a robustness check [
41].
Third, we estimated a logistic regression on the Pedestrian strike/Collisionsubset using the specification in (
1):
The intercept
was included by default. Odds ratios (ORs) with 95% confidence intervals and
p-values are reported. Model fit was assessed using McFadden’s pseudo-
, and multicollinearity was evaluated using variance inflation factors (VIFs) [
42]. We retained continuous hour in the main specification to avoid arbitrary cut-points and loss of temporal resolution; grouped time periods were evaluated as a sensitivity analysis. Because some comunas contribute relatively few fatal cases and the substantive contrast of interest is central-core versus noncore environments, the main model uses the parsimonious center proxy rather than a saturated comuna specification. The regression is interpreted associatively rather than causally. Additional sensitivity models added weekend and COVID-19-period indicators to evaluate whether the main class contrast was sensitive to broader temporal conditions.
3.6. Spatial Inference
To conduct reproducible spatial autocorrelation tests and local hotspot detection, geocoded fatal incidents were aggregated to a regular 500 m grid. Grid-based aggregation reduces sensitivity to point-level positional uncertainty, enables consistent neighborhood definitions, and supports comparability across classes, while recognizing the modifiable areal unit problem (MAUP) as an interpretive constraint [
13]. Spatial weights were defined using queen contiguity among grid polygons.
For each incident class, we computed global Moran’s
I and evaluated significance using Monte Carlo permutation testing (499 permutations). In addition to observed
I and
p-values, empirical permutation bounds (
,
) are reported to contextualize the magnitude of clustering relative to the null distribution [
43,
44].
We computed the Getis–Ord
statistic on the same grid for the total fatality count and classified hotspot cells using a standard threshold of
(two-sided
) [
45]. The results are reported both numerically and cartographically. The hotspot map uses the same 500 m grid as the statistical analysis and is interpreted as a map of fatality concentration, not as an exposure-adjusted risk surface. To examine sensitivity to the modifiable areal unit problem, we also repeated the hotspot workflow using 250 m and 1000 m grids.
4. Results
This section reports descriptive, inferential, and spatial findings from the fatal-incident analytical workflow. Results are presented in the same order as the analytical design: annual patterns, data completeness, hourly profiles, omnibus tests, class-contrast modeling, and spatial clustering.
4.1. Descriptive Trends by Incident Class (Fatal Subset)
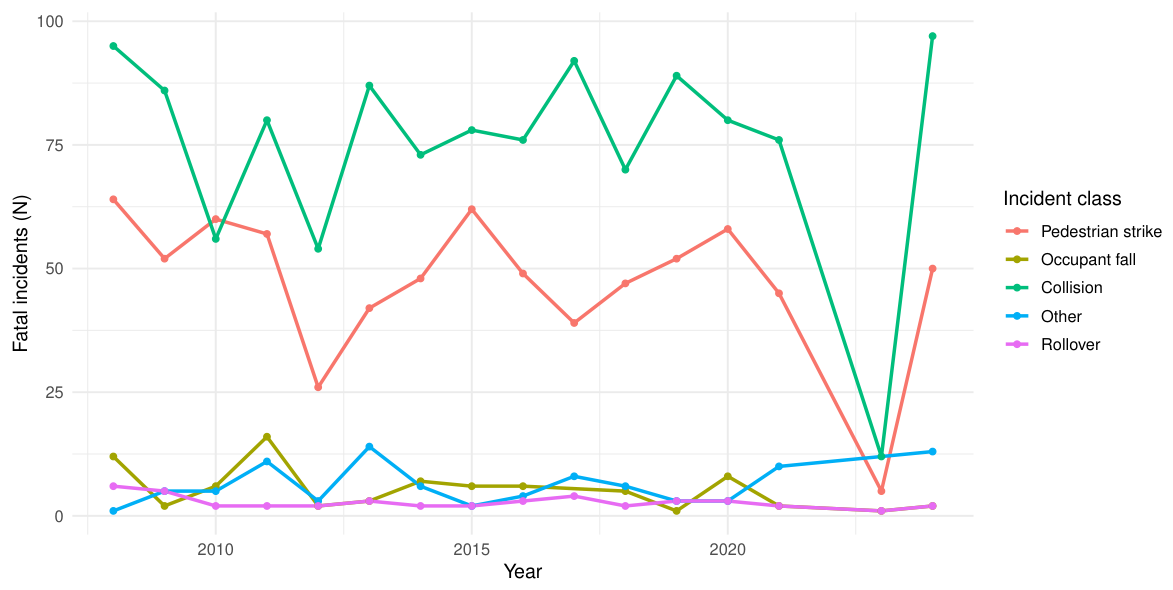
Figure 2 shows annual fatal incidents by class for the full fatal subset (
N = 2762). Two classes dominate throughout the series: Collisionand Pedestrian strike. The remaining classes (Occupant fall, Rollover, and Other) account for smaller totals and greater year-to-year variability because their counts are low. Incidents originally coded as Incendiowere grouped within Otherfor consistency.
The annual series does not show a simple monotonic trend. Instead, the dominant classes fluctuate across the study period, while collisions and pedestrian strikes remain the most prominent fatal mechanisms throughout. The terminal year (2025) shows lower counts than the preceding full years and is interpreted cautiously because end-of-series administrative coverage may be incomplete. The figure is therefore used descriptively rather than as evidence of causal change, especially because the dataset does not include exposure denominators or direct measures of enforcement and speed.
To assess how fully these descriptive patterns could be carried into the inferential and spatial stages of the study, we next examined the completeness of the key temporal and geographic fields within the fatal subset. After standardizing mixed Excel time formats, valid hour values were recovered for all 2762 fatal records. Coordinates were available for 2507 fatalities (90.8%), which defined the geocoded analytical subset used for chi-square tests, regression, and spatial analysis. The remaining 255 fatalities lacked valid coordinates and were excluded from spatial inference. Within the geocoded subset, the Day/Night distribution was balanced: Day n = 1243 (49.6%) and Night n = 1264 (50.4%). Taken together, these diagnostics indicate complete temporal coverage and high, although not full, spatial coverage for the analyses reported below.
4.2. Hourly Patterns and Differentiated Temporal Profiles
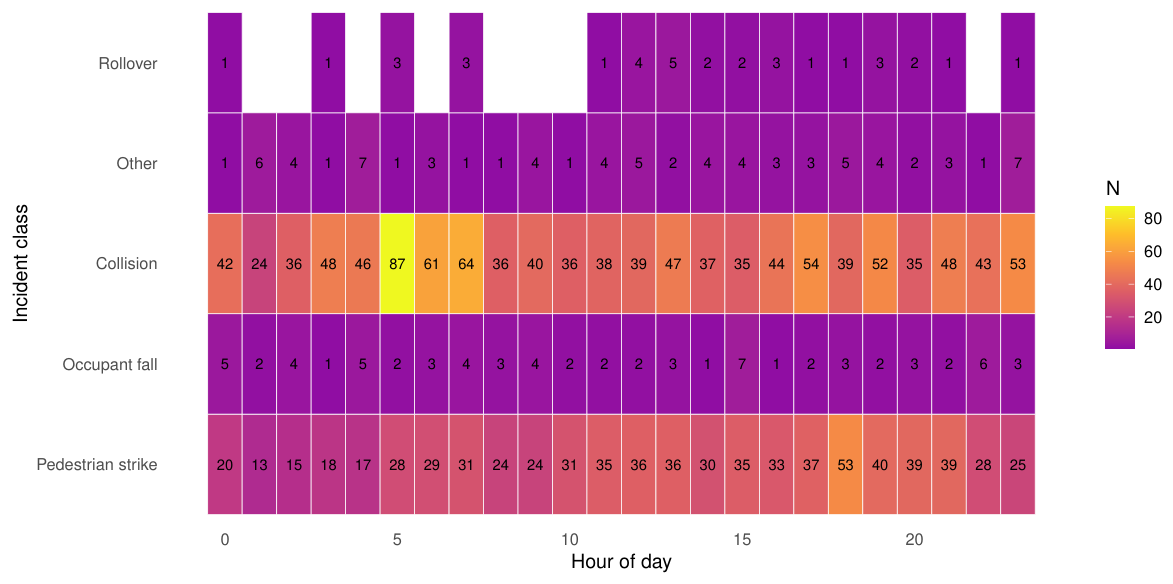
Figure 3 displays the hour-of-day distribution by incident class for the geocoded subset (
N = 2507). Collisionfatalities concentrate in the early morning, peaking at 104 cases at 05:00 and remaining high at 06:00–07:00. By contrast, Pedestrian strike fatalities rise later in the day, peaking at 63 cases at 18:00 and remaining elevated through 19:00–21:00.
These patterns suggest different temporal risk configurations. The early-morning concentration of collisions is consistent with conditions in which lower traffic volumes may permit higher operating speeds, whereas the late-afternoon and evening concentration of pedestrian strikes is consistent with periods of higher pedestrian activity and greater multimodal interaction [
20,
34]. Because neither speed nor pedestrian volume is measured directly, these interpretations remain cautious.
4.3. Chi-Square Inference: Day/Night and Comuna Heterogeneity
The Pearson chi-square test for incident class by period (Day/Night) yielded with and . A Monte Carlo simulation (5000 replicates) produced a nearly identical result (). At the conventional 5% level, these results do not support a statistically significant difference in overall class composition between Day and Night, although the test is close to the threshold and should be read as limited evidence of temporal compositional stability rather than exact equivalence.
By contrast, incident class varied significantly across the top 10 comunas. The chi-square statistic was , and the Monte Carlo p-value was (simulate.p.value = TRUE, ). This result indicates substantial spatial heterogeneity in fatality mechanisms across Medellín’s most affected comunas.
4.4. Logistic Regression: Pedestrian Strike vs. Collision
The logistic regression was estimated on
n = 2279 geocoded fatalities classified as Pedestrian strike (
) or Collision (
).
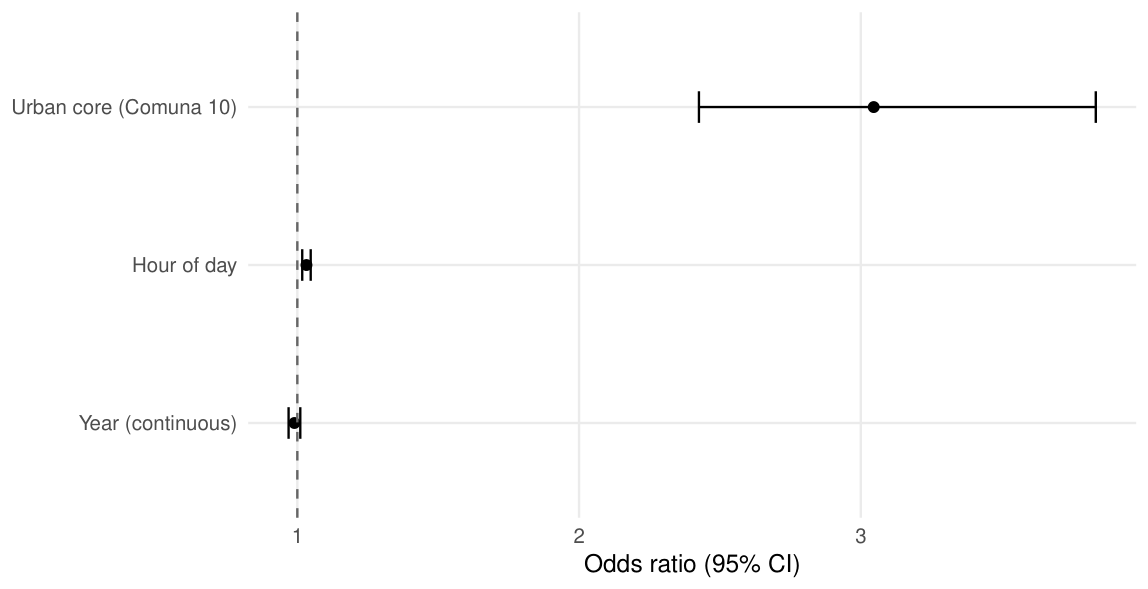
Table 1 and
Figure 4 report the main odds-ratio results. Later hours were associated with higher odds of a Pedestrian strike relative to Collision (OR
, 95% CI: 1.020–1.046;
0.001). Incidents in the urban core were also substantially more likely to be pedestrian strikes (OR
, 95% CI: 2.410–3.618;
). Year was not statistically significant (OR
, 95% CI: 0.977–1.011;
).
Model fit was modest (McFadden ), which is expected for a parsimonious administrative-data model that does not include exposure, roadway-design, speed, or enforcement variables. The regression should therefore be read as an interpretive class-contrast model rather than a predictive model of fatality mechanisms. Variance inflation factors were close to 1, indicating no multicollinearity concerns. Additional sensitivity analyses led to the same substantive conclusion: grouped time periods showed progressively higher odds of pedestrian-strike fatalities from morning through evening relative to overnight, while adding weekend or COVID-19-period indicators did not materially change the coefficients for hour or center.
4.5. Spatial Clustering and Hotspots
Table 2 reports global Moran’s
I for each incident class on a 500 m grid, using queen contiguity and empirical permutation bounds. Moran’s
I evaluates whether grid cells with higher fatality counts tend to be located near other cells with similarly high counts. Major classes exhibited strong and statistically significant spatial clustering: Pedestrian strike (
,
) and Collision (
,
). In both cases, the observed values were far above the upper 97.5th percentile of the permutation-based null distribution (
), indicating clear positive spatial autocorrelation rather than a random spatial arrangement. Occupant fall, Rollover, and Otheralso showed statistically significant clustering, although with smaller magnitudes than the two dominant classes. Because these categories have lower counts, their significant clustering should be read as evidence of spatial concentration, but not as evidence that they contribute as much to the overall burden as collisions and pedestrian strikes.
The global Moran’s
I results establish that fatal incidents are spatially clustered, but they do not identify the specific locations where clustering occurs. To localize these concentrations, the local Getis–Ord
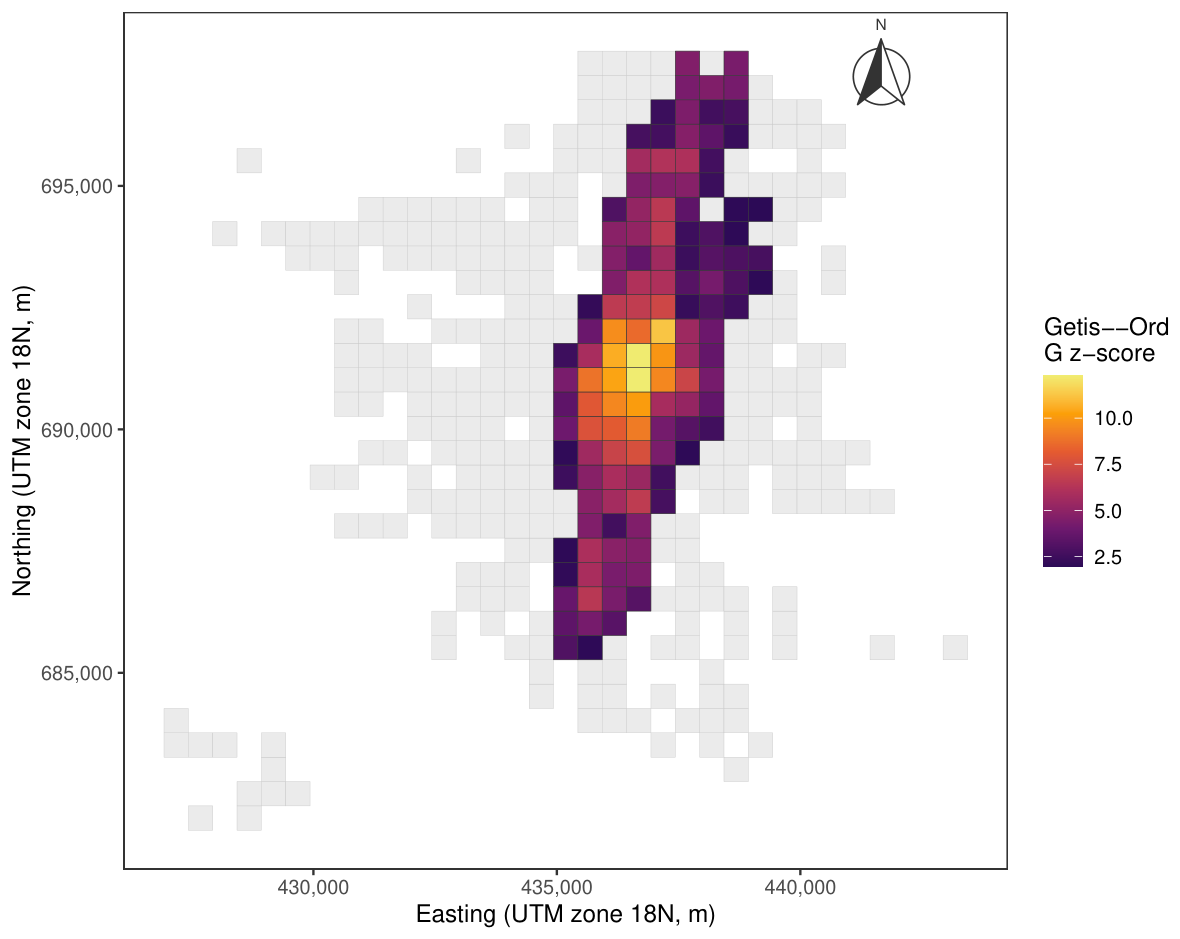
analysis was applied to all geocoded fatal incidents on the 500 m grid. This analysis identified 129 statistically significant hotspot cells (
).
Figure 5 therefore complements the global autocorrelation tests by translating the statistical evidence of clustering into a spatial screening layer for governance prioritization. The mapped cells represent statistically significant concentrations of fatal incidents; they should not be interpreted as exposure-adjusted risk areas because the dataset does not contain pedestrian volumes, traffic flows, or vehicle-kilometers traveled.
Table 3 reports a scale-sensitivity check for the all-fatal hotspot workflow. The number of significant hotspot cells changes with grid resolution, as expected under the modifiable areal unit problem. At 250 m, the finer grid produces more occupied cells and a larger number of significant hotspot cells, which reflects a more fragmented representation of local concentrations. At 1000 m, nearby fatalities are aggregated into fewer and larger cells, reducing the number of hotspot cells while increasing the global Moran’s
I. The maximum
z-score also decreases as the grid becomes coarser, which is consistent with the smoothing of local contrasts across larger spatial units. These differences are scale effects rather than substantive contradictions: across all three grid resolutions, fatal incidents remain spatially structured rather than diffuse. The 500 m grid was retained as the main specification because it provides a practical balance between spatial detail and stable local counts for urban governance interpretation.
These spatial outputs provide the empirical basis for the governance interpretation developed in the Discussion: they identify where fatal incidents concentrate and how stable that concentration is under alternative spatial resolutions, but they do not identify the underlying exposure mechanisms by themselves.
5. Discussion
This section interprets the empirical findings in light of the governance and spatial-justice framework outlined earlier. Rather than treating the results as isolated statistical outputs, the discussion asks what differentiated temporal patterns, class contrasts, and spatial concentration imply for uneven protection, institutional capacity, and Safe System implementation.
Taken together, the results point to three connected empirical patterns. First, fatal road-traffic harm in Medellín is concentrated in a limited set of mechanisms, especially collisions and pedestrian strikes, rather than being evenly distributed across incident classes. Second, broad temporal labels such as Day and Night do not fully capture the temporal structure of fatality mechanisms: incident-class composition did not differ significantly between these two periods, but the logistic model showed that later hours were associated with higher odds of pedestrian-strike fatalities relative to collisions. Third, the spatial statistics show that fatal harm has a clear geography, with significant global clustering, local hotspot cells, and scale-dependent but persistent spatial structure. These findings should therefore be interpreted jointly: the study identifies concentration, class-specific differentiation, and governance-relevant spatial structure, rather than exposure-adjusted risk or causal effects.
5.1. Interpreting Spatiotemporal Heterogeneity Through a Governance Lens
Fatal road-traffic harm in Medellín is unevenly distributed across both time and space. This unevenness has direct implications for how protection is delivered across the city. The key issue is not only where fatalities cluster, but how different incident mechanisms point to different governance priorities.
Several findings are especially important. First, the urban-core proxy shows the strongest association in the logistic model: fatalities in Comuna 10 had nearly three times the odds of being classified as pedestrian strikes rather than collisions when compared with fatalities elsewhere (OR
, 95% CI: 2.410–3.618). This pattern is consistent with high-interaction urban environments where dense land use, pedestrian activity, and multimodal conflicts place greater demands on street design and operations. Centrality does not automatically produce safety; it can also concentrate exposure and conflict. As Nævestad et al. [
32] emphasize, Safe System interpretation points toward layered protection rather than isolated corrective measures, which supports targeted pedestrian protection in the urban core [
3].
Second, time-of-day patterns point to differentiated temporal configurations rather than a single daily risk profile. Hour of day remained positively associated with pedestrian-strike versus collision fatalities (OR
, 95% CI: 1.020–1.046), and the grouped-time sensitivity analysis showed a similar gradient from overnight to evening. This result should be interpreted together with the nonsignificant Day/Night comparison. The binary Day/Night variable aggregates heterogeneous activity, visibility, congestion, and speed conditions into two broad categories, whereas the hourly specification captures a more gradual temporal shift in fatality mechanisms. In Medellín, the model suggests that pedestrian-strike fatalities become relatively more prominent later in the day, but this should not be read as an individual pedestrian risk rate because the dataset lacks pedestrian volumes and traffic-flow denominators. The more defensible interpretation is operational: evening and central-area conditions require closer monitoring of pedestrian–vehicle interaction, signal timing, turning conflicts, and speed management [
20,
32,
46]. Weekend and COVID-19-period sensitivity indicators did not materially alter the main coefficients, suggesting that the contrast between pedestrian strikes and collisions is not explained by those binary adjustments alone.
Third, spatial concentration is robust across fatality classes. Moran’s I values substantially exceeded permutation bounds for the dominant classes, and local Getis–Ord analysis identified 129 hotspot cells for all fatalities. At the same time, the chi-square results add an important institutional layer to this pattern. Overall incident-class composition did not differ significantly between Day and Night in the geocoded subset (), but it varied strongly across the top 10 comunas (Monte Carlo ). This indicates that fatality mechanisms are not spatially uniform and that meaningful local heterogeneity remains even when broad citywide averages appear stable.
The spatial results also require interpretation beyond the number of significant cells. Moran’s
I and Getis–Ord
answer related but different questions: the former tests whether fatality counts are spatially autocorrelated across the grid, while the latter identifies where statistically significant local concentrations occur. Choudhary et al. [
40] and Haile et al. [
13] emphasize that hotspot evidence is most useful when it is interpreted together with exposure, land use, and street-context information. In this study, the persistence of spatial structure across alternative grid sizes strengthens the case for geographically targeted governance, but the change in hotspot counts across 250 m, 500 m, and 1000 m grids confirms that hotspot boundaries are scale-dependent planning supports rather than fixed representations of risk.
Taken together, these results support a governance interpretation of uneven protection. The issue is not only that fatalities cluster, but that different parts of the city appear to concentrate different forms of fatal harm. As in other crash studies, such concentration can guide intervention, but it should not be treated as direct proof of a single underlying mechanism. Hotspots may reflect high exposure, weak protection, or both, and therefore require contextual interpretation using land use, transit activity, commerce, and street design information [
17,
23,
47].
From this perspective, a single citywide intervention package is unlikely to be either efficient or equitable. Different comunas may require different combinations of pedestrian-protection infrastructure, speed management, motorcycle safety measures, and operational responses, in line with Safe System principles and with governance approaches that emphasize coordination and sustained accountability [
11,
29,
32].
5.2. Governance Implications for Targeted and Accountable Intervention
The empirical patterns suggest that policy responses should be spatially targeted, temporally differentiated, and institutionally accountable. The strong association between the urban core and pedestrian-strike fatalities indicates that pedestrian vulnerability is concentrated in central high-friction environments. Governance responses should therefore prioritize pedestrian-protection investments in these areas, where intense pedestrian–vehicle interaction makes conventional traffic management insufficient on its own.
The concentration of pedestrian-strike fatalities in the urban core is consistent with the view that central districts combine high accessibility with high conflict density Nævestad et al. [
32] argue that Safe System responses should prioritize vulnerable users in places where street design and traffic operations allow severe conflicts to occur. For Medellín, this means that the statistical concentration of pedestrian fatalities should be translated into specific urban interventions, including safer and more visible crossings, shorter crossing distances, lower turning speeds, pedestrian-priority signal timing, and protection at intersections with intense pedestrian–vehicle interaction [
3,
25]. These measures should be tied to monitoring indicators so that infrastructure upgrades can be evaluated against changes in hotspot persistence and class-specific fatality patterns. Because the urban core is also economically and institutionally central, investments in pedestrian safety can advance both equity goals and broader sustainability objectives by making walking safer and more attractive.
The hourly patterns further indicate that intervention should not be uniform across the day. Late-afternoon and early-evening periods show stronger alignment with pedestrian-strike fatalities, whereas early-morning hours exhibit greater collision intensity. This implies that governance strategies should be time-sensitive as well as place-sensitive [
46]. Evening activity periods may warrant pedestrian-priority operations and targeted enforcement of yielding and turning behavior, while low-traffic hours associated with higher collision intensity may require stronger speed management, including automated enforcement and self-explaining street design that reduces speed variability and crash severity [
48].
Spatial inference can strengthen this prioritization process, but only if it is used carefully. Strong global clustering and the identification of 129 hotspot cells support geographic targeting, yet hotspot analysis should not be treated as a purely technical ranking exercise. Effective prioritization requires combining hotspot evidence with contextual criteria such as proximity to transit hubs, schools, markets, and areas of intense pedestrian activity. This strengthens transparency and reduces the likelihood that resource allocation is driven mainly by political salience rather than by documented need. Because spatial statistics are sensitive to aggregation choices, governance processes should document grid specifications and sensitivity checks, treating hotspot outputs as planning tools rather than definitive danger maps [
16,
40].
5.3. Data Governance, Institutional Coordination, and Transferability
Beyond the substantive findings, the study also highlights the importance of governance capacity itself. Data completeness is not a peripheral technical issue; it is part of the institutional infrastructure needed for credible road-safety management. The exclusion of records lacking valid coordinates shows how data gaps can constrain spatial accountability and weaken the ability to evaluate whether interventions are reaching the areas of greatest need. Improving geocoding completeness, timestamp standardization, automated validation procedures, and cross-agency data consistency would strengthen monitoring capacity and support more credible policy evaluation over time.
Corredor et al. [
49] show that risk-based supervision can strengthen safety performance in urban infrastructure when responsibilities and compliance expectations are explicit. In the present setting, statistical clusters do not automatically translate into safer streets; they require coordinated action across agencies. While municipal planning and public-works departments lead corridor redesign, traffic and enforcement agencies must implement operational measures and automated enforcement where appropriate [
18,
33,
46]. Establishing cross-agency road-safety units or lead agencies can help maintain shared hotspot registers, coordinate implementation timelines, and publish progress indicators that make prioritization decisions auditable.
A spatial-justice perspective also implies that performance should be assessed not only through citywide fatality totals but through distributional change. Monitoring whether high-burden areas actually experience meaningful reductions is essential for evaluating equity impacts [
50]. In practice, this may involve reporting pedestrian-strike trends separately, tracking hotspot persistence over time, and publishing indicators of intervention coverage, such as the number of protected crossings installed in high-risk zones. Governance strategies should also monitor possible displacement effects, since spatial targeting may shift traffic or conflicts toward adjacent corridors [
27]. Corridor-based speed monitoring, before–after assessments, and spatial spillover analysis can help determine whether localized interventions produce net safety gains across the wider system [
51,
52].
Building on recent Medellín-based evidence on the social burden and spatiotemporal concentration of fatal road-traffic incidents [
53], the present study extends that line of work by shifting the focus toward governance interpretation, class-specific contrasts, and the operational use of spatial evidence for accountable prioritization. In doing so, it offers an auditable workflow for prioritizing severe road-traffic harm in an urban Latin American setting [
36]. Its value lies not only in the Medellín case itself, but also in its potential for replication. Cities that maintain timestamped and geocoded incident records can use the same workflow to compare concentration patterns, document exclusion rules, and update hotspot evidence over time [
54]. Future research can extend this framework by incorporating nonfatal injury gradients, exposure denominators, roadway attributes, and enforcement indicators, thereby enabling stronger causal designs and more direct evaluation of Safe System implementation pathways.
5.4. Limitations
Several limitations qualify the interpretation of these findings. First, the analysis is intentionally centered on fatalities. Nonfatal incidents and property-damage-only events are also important for urban safety management, but combining severity levels would require a different analytical design and more detailed information on injury severity and exposure. The present study therefore addresses the geography and timing of the most severe outcome rather than the full crash-severity spectrum. Second, incident class is used as a functional proxy for vulnerability mechanisms because the dataset does not include a harmonized victim road-user type variable. Although hlPedestrian strike is a reasonable proxy for pedestrian-involved fatalities, some misclassification cannot be ruled out. The category should therefore be interpreted as informative rather than definitive.
Third, the administrative file does not include exposure denominators (e.g., pedestrian volumes, traffic volumes, or vehicle-kilometers traveled); roadway characteristics such as speed limits, lane configuration, or crossing infrastructure; direct measures of enforcement intensity; or weather conditions. The study therefore cannot estimate exposure-adjusted risk rates or establish causal relationships; instead, the observed associations should be interpreted as signals for governance prioritization rather than causal effects [
13,
40]. This caution is particularly important for the pandemic years. Although a binary COVID-19-period indicator did not materially change the main class-contrast model, the 2008–2025 series spans mobility regimes that were not fully comparable in intensity or regulation, and pandemic-era changes in traffic volume, route choice, and exposure may still shape descriptive trends in ways that cannot be fully recovered from the available administrative variables.
Fourth, the urban-core indicator is intentionally parsimonious. It captures Comuna 10 as a central high-interaction environment, but it is not a complete measure of Medellín’s built environment. Future work should replace or complement this binary proxy with land-use intensity, network centrality, speed limits, crossing infrastructure, and measured pedestrian and vehicle flows.
Fifth, the spatial results depend on aggregation choices. Hotspot identification was based on a 500 m grid and is therefore subject to the modifiable areal unit problem (MAUP). The scale-sensitivity check shows that hotspot counts vary across 250 m, 500 m, and 1000 m grids, although the broader clustering interpretation remains stable. Alternative spatial scales could still alter hotspot boundaries and local prioritization decisions [
12]. In addition, 255 fatal records lacked valid coordinates and could not be included in the spatial analysis. If this missingness is systematic, some high-burden contexts may remain underrepresented.
6. Conclusions
This study asked how transparent surveillance analytics and spatial statistics can reveal uneven protection of vulnerable road users and inform governance prioritization in Medellín. The answer is that a routinely collected administrative fatality file, when carefully cleaned and spatially structured, can distinguish between different risk configurations: central high-interaction environments where pedestrian strikes concentrate, and other corridors where collision fatalities remain prominent.
The analysis identified 2762 fatal cases, 2507 geocoded fatalities, no statistically significant Day/Night shift in overall class composition, strong heterogeneity across comunas, pronounced clustering for the dominant classes, and 129 statistically significant hotspot cells on the main 500 m grid, with scale-sensitivity checks confirming that hotspot counts vary by grid resolution. In the class-contrast model, later hours and the urban core were consistently associated with pedestrian-strike fatalities, whereas year and the pandemic-period indicator were not statistically significant in that binary contrast.
These findings do not establish causal effects of speed, exposure, or enforcement. They do, however, show how transparent injury-surveillance analytics can translate administrative data into auditable governance priorities. For Medellín, that means prioritizing pedestrian protection in the urban core, strengthening speed management where collision mechanisms dominate, and improving data completeness to increase accountability. More broadly, the workflow is transferable to other cities that maintain timestamped and geocoded incident records, allowing local governments to compare burden concentration, document assumptions explicitly, and target interventions more transparently. This conclusion should be read alongside the main limitations of the design: the absence of exposure denominators, the simplified urban-core proxy, incomplete coordinate coverage, and the sensitivity of hotspot boundaries to spatial aggregation.