2. Literature Review
While the “suburb” is a central concept in urban studies, defining it remains a notoriously elusive challenge, particularly within the context of American settlement. As urban planner Ann Forsyth observes, “Surprisingly few people who write about suburbs actually define them explicitly as a whole—including many classic, influential, and otherwise important works on suburbs” [
1]. This lack of conceptual clarity reflects the Census Bureau’s reluctance to define the term. The only explicit reference to “suburbs” in a decennial census publication is from 1910, when the Census Bureau was first experimenting with defining metropolitan areas. The section introducing the “Metropolitan District” concept was entitled “Cities and Their Suburbs” [
2], with population figures given only for “In city proper” and “Outside.” Though not explicitly stated, the implication was that all territory outside the central cities constituted the suburbs. A similar sort of distinction was made with Urbanized Area data from 1960 to 1980, where territory was classified as “central city” and “outside central city,” and later in 1990 as “central city” and “urban fringe.” While “outside central city” and “urban fringe” were not specifically labeled “suburbs,” data users regarded these residual areas as suburban. Identifying suburbs as the territory outside the central city has been accepted as a reasonable approach, but it falls short of a standardized definition of “suburb.” Forsyth’s review of the literature on suburban studies covers a range of overlapping dimensions, from physical characteristics and transportation to political boundaries and socio-cultural factors. To navigate this complexity, scholars have approached this classification through three primary methodological lenses: the historical-morphological, the administrative-jurisdictional, and the socioeconomic.
The historical-morphological approach defines suburbs by their era of development and dominant transportation technology, a framework anchored by Kenneth Jackson’s seminal 1985 study
Crabgrass Frontier [
3]. Suburbs were established along streetcar networks, creating suburban neighborhoods distinct from the “walking city” of the nineteenth century. Sam Bass Warner Jr. had demonstrated how the development of the streetcar network led to suburbanization in the Boston area [
4], and Peter O. Muller established periods based on transportation technology [
5]. These suburbs were of lower density than urban cores and separated home and work. Widespread automobile ownership and the expansion of single-family housing accelerated after World War II resulting in “automobile suburbs.” Robert Fishman argues that the decentralization that occurred as a result of the highway system marked the end of true suburbs completely dependent upon the urban core. Dolores Hayden further develops periodization based on morphology [
6]. While this framework captures the qualitative evolution of the built environment, it does not easily translate into quantitative, replicable models that can be tracked longitudinally using standardized census data.
In the absence of a standardized suburban definition, spatial research frequently defaults to administrative and jurisdictional definitions. Scholars focused on fiscal policy, zoning, and regional governance, such as Myron Orfield [
7] and David Rusk [
8], frequently rely on incorporated municipal boundaries to categorize suburban types, because of their political and fiscal effect. In his State of Metropolitan America reports, William Frey [
9] contrasts government-designated “Principal Cities” with suburbs, defined as outlying metropolitan territory. In her study of the decline of inner-ring suburbs, Bernadette Hanlon examined any place that shared a border with a central city [
10].
While relying on jurisdictional boundaries is a widely accepted practice, it has proven to be historically inconsistent. Annexation practices vary wildly across the United States, which has made relying on municipal boundaries fundamentally flawed for longitudinal studies of urban morphology. Older industrial cities in the Northeast and Midwest are often tightly bounded by early suburban incorporation, while expansive Sunbelt cities aggressively annexed large areas of low-density, auto-centric development. This geographic divergence is empirically demonstrated by Fabian J. Terbeck, who evaluated four distinct classification methods based on their ability to capture racial, ethnic, and socioeconomic variability within and between suburbs [
11]. Terbeck found that definitions emphasizing geographic adjacency (such as Hanlon and Vicino, 2007 [
12]) performed best in the tightly bounded Northeast and Midwest. By contrast, approaches taking housing density and building age into account (such as Cooke and Marchant, 2006 [
13]) were more accurate in the South and West. Using jurisdictional boundaries to define suburbs across the country conflates widely varying built environments, treating dense prewar neighborhoods and sprawling postwar subdivisions as equivalent simply because they are within city limits.
Jurisdictional boundaries certainly do have consequences, though. As scholars such as Logan and Alba have demonstrated in their studies of minority and immigrant enclaves, municipal boundaries have a significant impact on how suburban populations sort themselves [
14]. The intersection of municipal borders and demographic sorting is the hallmark of the socioeconomic approach to suburban studies. Recognizing the limitations of treating all non-central city areas as a monolith, contemporary sociologists have increasingly focused on the demographic fragmentation of suburban areas. Scholars have demonstrated how racial exclusion fundamentally shaped suburban expansion. In
White Flight, Kevin Kruse argues that suburbs were built on racial exclusion [
15], as the White population left desegregating central cities, a theme explored by Lichter, Parisi and Taquino [
16]. Mary Pattillo examines Black suburbanization, demonstrating that their position was more precarious, with Black suburban neighborhoods often bordering impoverished areas [
17]. Various studies have categorized areas by their level of affluence and analyzed the divide between booming job centers and declining, “at-risk” inner-ring suburbs. Kneebone and Berube track the “suburbanization of poverty” [
18], while Wei Li highlights the “ethnoburb,” demonstrating that immigrants now frequently bypass the urban core to settle directly in the suburbs [
19]. Taken together, these studies dismantle the myth of suburban homogeneity.
While these socioeconomic typologies are effective in capturing the complex inequalities of the modern metropolis, they are predominantly cross-sectional. Most demographic studies of suburbia offer only short-term views of neighborhood change rather than a broader historical analysis. This temporal limitation is driven by a dual challenge of spatial and statistical instability. Researchers attempting to trace neighborhood evolution must navigate not only changing borders and frequently redrawn census tracts, but also the inconsistency of longitudinal demographic data, as survey methodologies and classifications change over time. Consequently, contemporary frameworks struggle to trace the continuous demographic and racial sorting of specific neighborhoods back to their prewar origins.
A comprehensive typology of American settlement must unite the historical-morphological era of development with contemporary demographic sorting, without falling victim to the distortions of changing spatial and demographic data. International frameworks, such as the United Nations’ “Degree of Urbanization” derived from the Global Human Settlement Layer (GHSL), have attempted to bypass jurisdictional distortions by classifying settlements using purely universal, high-resolution grid cells [
20]. However, while grid cells offer absolute spatial stability, they critically lack the deep historical demographic data required to track the socioeconomic evolution of specific American neighborhoods over the past century. This study resolves that fundamental tension by anchoring high-resolution, historical grid-level physical data to stable, statistically rich 2010 census tract boundaries. By doing so, this paper establishes a standardized, historically driven definition of the “suburb” within a broader settlement typology, providing a longitudinal methodology to map how the American metropolis has decentralized and sorted itself.
3. Data and Methodology
3.1. Data Sources
Historically, longitudinal analyses of this scale have been constrained by shifting boundaries. To address this challenge, this study utilizes the Historical Housing Unit and Urbanization Database (HHUUD10) [
21] and the Longitudinal Tract Data Base (LTDB) [
22], both of which are standardized to consistent 2010 census tract boundaries and offer data across several decades. A primary limitation of these datasets, however, is their reliance on interpolation to reconcile historical counts with a standardized geographic framework. To enhance the spatial accuracy of this baseline, this study also uses high-resolution, grid-cell data from the Historical Settlement Data Compilation for the U.S. (HISDAC-US) [
23], which contains detailed information about the built environment over two centuries. Using 250 m grid cells, the built-up land intensity (BUPL) and first built-up year (FBUY) layers provide the geographic detail needed to identify early 20th-century urban cores and track the subsequent suburban and exurban expansion with high precision.
3.2. Population Estimates
Because HHUUD10 does not provide tract-level population estimates, constructing a longitudinal population dataset was necessary. For 2010, actual census counts were utilized, and 2020 population estimates were derived using block relationship files. For the decades from 1970 to 2000, population estimates were sourced from the LTDB. To ensure the longitudinal comparability of socioeconomic and demographic variables across decades of shifting census definitions, this study relies entirely on the LTDB’s standardized harmonization methodology.
For the decades prior to 1970, as well as for rural counties lacking LTDB coverage in 1970 and 1980, county populations were distributed proportionally based on tract-level housing unit counts derived from HHUUD10. While this approach assumed uniform household sizes and vacancy rates within counties across the rural-to-urban gradient, empirical testing during the design of this methodology revealed that historical differentials varied unpredictably across counties and lacked a systematic, nationally scalable pattern. In the absence of a mathematically justifiable localized index, maintaining a direct proportional distribution provides the most transparent and defensible method for estimating pre-1970 tract populations.
3.3. Housing Unit Density as a Classification Metric
The methodology used in this study relies primarily on housing unit density to establish settlement types, aligning with modern U.S. Census Bureau practices. Starting with the 2020 census, the Bureau shifted from population density to housing unit density to delineate urban areas, establishing a baseline of 425 housing units per square mile for an “initial urban core,” and 200 housing units per square mile for the “remainder of urban area” [
24]. While the settlement categories developed in this study utilize similar metrics (specifically the 200-unit threshold to delineate suburban transitions), this framework differs fundamentally from both the Census Bureau and international administrative frameworks. By utilizing historical time-series data rather than a single cross-sectional snapshot, this methodology classifies settlement types based on their continuous morphological evolution.
3.4. Delineating the Urban Cores: The 1940 Watershed
In this study, the year 1940 serves as a watershed moment before the onset of mass postwar suburbanization. This study builds on the work described in “Applying Current Core Based Statistical Are Standards to Historical Census Data, 1940–2020” [
25], which utilizes a multi-tiered density approach that mirrors, but historically adapts, the Census Bureau’s current urban delineation methodology. For delineating urban territory in the 2020 census, the Census Bureau shifted from population density to housing unit density, recognizing it as a more direct and stable indicator of development. As with the Census Bureau’s methodology, the approach used here relies on a “first pass” threshold of 425 housing units per square mile to establish the initial urban cores in 1940. The remainder of the urban area is then iteratively built out using a baseline threshold of 200 housing units per square mile. This 425-unit threshold aligns with the Census Bureau’s 2020 minimum density requirement for an initial urban core, providing a standardized, nationally recognized baseline to project backward historically. Similarly, the 200-unit threshold follows not only Census Bureau practice, but is utilized in the HHUUD10 urban variables, as well. Using the extent of contiguous areas built up by 1940 yields three distinct core classifications: Prewar, Postwar, and Recent Cores.
Prewar Cores—Prewar Cores are found in the oldest, densest cities in the United States. HHUUD10 capably delineates the extent of urbanization just before World War II but offers no estimates prior to 1940. To distinguish historically established urban centers from more recent Sun Belt cities, however, this study establishes a 1910 baseline for urban development, as automobile ownership in the United States remained below one percent at that point [
26]. Prior to the widespread adoption of the automobile, urban expansion was limited by streetcar rail networks and walkable distances.
The Historical Settlement Data Compilation for the United States (HISDAC-US) is a geographically detailed dataset derived from tax assessor records from 150 million properties in the Zillow Transaction and Assessment Dataset (ZTRAX) [
27]. HISDAC-US maps building density in US settlements over 200 years, from 1810 to 2010, using 250 m grid cells. While coverage is generally good, areas that have undergone substantial redevelopment through urban renewal or highway construction are not reliably included in HISDAC-US due to survivorship bias.
To overcome this, this study utilizes a hybrid approach using IPUMS full count data [
28]. Total housing unit counts for 565 incorporated places identified in both the 1910 and 1940 IPUMS full-count data were tabulated to serve as control totals. Because growth is not uniform across a city, a housing-unit-weighted center point was calculated for each place using the 1940 HHUUD10 tract-level estimates. The 1910 city-level housing units were distributed to 2010 census tracts based on the 1910 full-count total and the tract’s distance from the 1940 weighted center point for that place. To avoid retroactively applying the more widespread 1940 distribution of housing units to the 1910 landscape, this study utilizes a distance-decay function. Aligning with the principles of demographic gravity models and historical urban density gradients [
29], an inverse square method was applied to weight the allocation:
where
di is the distance from the tract centroid to the city’s weighted center point. An inverse square method was selected because early 20th-century urban density did not decline linearly. Development was heavily concentrated within immediate walking distance of streetcar lines and urban centers, causing housing density to drop off sharply as distance increased. Furthermore, this study does not rely solely on this estimate. For most tracts, these distributed estimates were cross-referenced with HISDAC-US Built-Up Land Intensity (BUPL) values to verify the presence of historical structures, as well as the housing unit density in 1940. A tract was designated as a Prewar Core if it met any of the following three criteria:
1910 Baseline: The tract reached the HHUUD10 urban threshold of 425 housing units per square mile by 1910.
1940 Density: To account for uneven coverage, any tract that reached a density of 2000 housing units per square mile by 1940 was included. This threshold is an order of magnitude above the baseline urban threshold and captures the compact development of the streetcar era.
Spatial Contiguity: To ensure a coherent urban footprint, any tract entirely enclosed by Prewar Core tracts was also assigned to the core category.
While the incorporated place is the finest geographic unit for which a nationally scalable 1910 housing distribution could be constructed, the IPUMS full count microdata in fact identify respondents at the enumeration district level. This finer unit of geography offers immense untapped potential for future precision mapping. Enumeration districts were the operational units used by census enumerators in the field, and their boundaries were drawn to contain manageable, geographically coherent populations. Currently, integrating this microdata directly into longitudinal spatial series is impossible at a national scale because boundary files for 1910 enumeration districts exist primarily as undigitized archival maps. If enumeration district boundaries were systematically digitized and a crosswalk constructed between historical enumeration districts and modern census geographies such as 2010 tracts, the spatial imputation employed here could be substantially refined or eliminated entirely. This represents a valuable opportunity for a project of national scope, such as NHGIS, which has the infrastructure and expertise to undertake boundary digitization at scale. At the city level, a more targeted application is also feasible: for cities such as Minneapolis, where HISDAC-US coverage is poor, enumeration-district-level population and housing counts from the 1910 full count data could serve as the basis for a more precise, locally grounded spatial allocation. Pursuing this kind of targeted calibration for cities with known coverage gaps represents a worthwhile direction for future work.
Postwar and Recent Cores—Not all historically dense areas possessed the total population required to anchor a metropolitan area by 1940. Many tracts were densely developed prior to World War II but did not reach the 50,000-population threshold until decades later. To accurately classify these emergent centers, the methodology looks at tracts that reached the 425-unit density baseline by 1940. When the broader contiguous urban area (defined by the 200 housing units per square mile baseline) finally crosses the 50,000 total population threshold, and the original dense core had at least 10,000 residents, those tracts are upgraded to core status. The specific categorization of these tracts depends on the decade the broader urban area crossed the 50,000-population mark:
Postwar Cores: Tracts within urban areas that crossed the 50,000-population threshold between 1950 and 1970.
Recent Cores: Tracts within urban areas that crossed the 50,000-population threshold by 1980 or later.
3.5. Suburbs and Transportation Eras
The spatial expansion of urban areas and the resulting settlement typologies are profoundly shaped by the dominant mode of transportation in each era. The shift from rail to automobile dominance, along with the development of the Interstate Highway System, brought about dramatic shifts in housing unit density and urban development. This study uses a periodization based on transportation and its effect on development in classifying suburbs:
Prewar Suburbs: These are tracts outside of Prewar Cores that capture the initial wave of decentralization in the automobile era. Before the 20th century, urban expansion was strictly limited to walkable distances, but the introduction of streetcar networks and automobiles allowed residents to settle further out. Prior to 1940, suburbs were largely clustered along transit corridors, though rising automobile ownership opened the surrounding peripheral land to residential expansion.
Mid-20th Century Suburbs: These consist of tracts that crossed the urban density threshold and were attached to expanding cores from the 1940s to 1970. The creation of the Federal Housing Administration and the G.I. Bill set the stage for this massive wave of residential decentralization after World War II. The year 1970 serves as a logical break point as it reflects the maturation of this highway network, which fundamentally altered the scale of decentralization.
Late-20th Century Suburbs: This category includes tracts urbanizing after 1970 through the end of the century. Although the Interstate Highway System was authorized in 1956, it did not reach maturity until several years later. Once the highway network was in place, however, it fundamentally shaped this later wave of suburban expansion.
21st Century Suburbs: These are tracts urbanizing from 2000 onward. By the beginning of the 21st century the pace of suburbanization had slowed, but the systematic relaxation of mortgage underwriting standards led to a surge in suburban growth in the 2000s. This expansion was brief but explosive, ultimately collapsing after the 2008 financial crisis. This decentralized, digital era has also diverged from past periods with the proliferation of remote work and increasing commute times.
3.6. Exurbs
After the core and suburban census tracts have been identified, the final step is to locate tracts on the metropolitan periphery that qualify as exurban. As described in the Brookings Institution report “Finding Exurbia” [
30], exurbs have close economic and commuting ties to a nearby urban center but maintain a distinctly low housing unit density. Building on the Brookings baseline of roughly 14 acres of land per home (about 50 housing units per square mile), this study sets the exurban density range between 50 and 100 housing units per square mile. The upper bound represents exactly half of the 200 housing-unit threshold used to define suburban areas. Furthermore, because exurbs are fundamentally tied to the metropolitan center, spatial proximity rules were imposed: to qualify, a census tract must be located within a maximum distance of 10 miles from an established urban area. While exurban commuting sheds can vary by metropolitan size, a fixed 10-mile maximum distance serves as a conservative measure to ensure that remote rural tracts in geographically massive counties are not misclassified as economically integrated exurbs.
While some contemporary definitions of exurbia follow the Brookings report and focus on fast-growing communities on the metropolitan fringe, the longitudinal typology employed here intentionally distinguishes exurbia from transient greenfield development. The trajectory of American suburbia is typically characterized by rapid, sustained expansion. Conversely, in this study exurbia represents a deliberate maintenance of low-density environments. Exurban residents choose to reside in these areas specifically to maintain a quasi-rural setting, despite their economic interaction with the urban core. To capture this stability, the methodology requires that an exurban tract maintain its low-density range (50 to 100 housing units per square mile) for at least two consecutive decades. This 20-year temporal requirement ensures that the classification captures established exurban environments, rather than rural tracts that are merely in the active process of suburbanizing.
Finally, the mechanics of the exurban classification differ slightly from other categories in this typology. Unlike the core and suburban tracts, which are subdivided by their era of development, the exurban fringe is treated as a single, unified settlement category regardless of the decade in which the tract met the criteria. Additionally, to account for gradual residential infill, once a census tract establishes the 20-year baseline and qualifies as exurban, it remains in that category even if its density slowly creeps above the 100 housing units per square mile threshold. The tract is only reclassified when its density formally crosses the 200 housing units per square mile urban threshold, at which point it transitions to a suburban tract.
3.7. Outlying Area Types
Micropolitan Cores Delineated using the same algorithm as their larger metropolitan counterparts, Micropolitan cores are distinguished solely by their total population. Contiguous urban areas that attain a population of at least 10,000 but remain below the 50,000-person metropolitan threshold are assigned to this category. Tracts in these smaller urban areas are also distinguished by their era of development.
Towns and Rural Areas Urban census tracts (or contiguous clusters of urban tracts) that have attained a population of at least 1000, but remain below the 10,000-person micropolitan threshold, are classified as Towns. While the Census Bureau historically employed a 2500-person threshold for block-level urban delineations, this study utilizes a 1000-person threshold to better capture emergent settlement clusters when aggregating at the larger spatial resolution of the census tract. All other remaining tracts default to the Rural classification. These settlement types are further divided by their proximity to large urban areas. Towns and rural tracts that are more than 100 miles from a metropolitan core are classified as “Remote” while those closer to metropolitan cores are classified as “Proximate.” Also, rural tracts that are adjacent to urban areas but do not qualify as Exurban are classified as “Rural Adjacent.” The complete set of density, population, and temporal rules defining each of these categories is summarized in
Table 1. This matrix serves as the foundational classification system applied throughout the subsequent spatial and demographic analyses.
4. Results
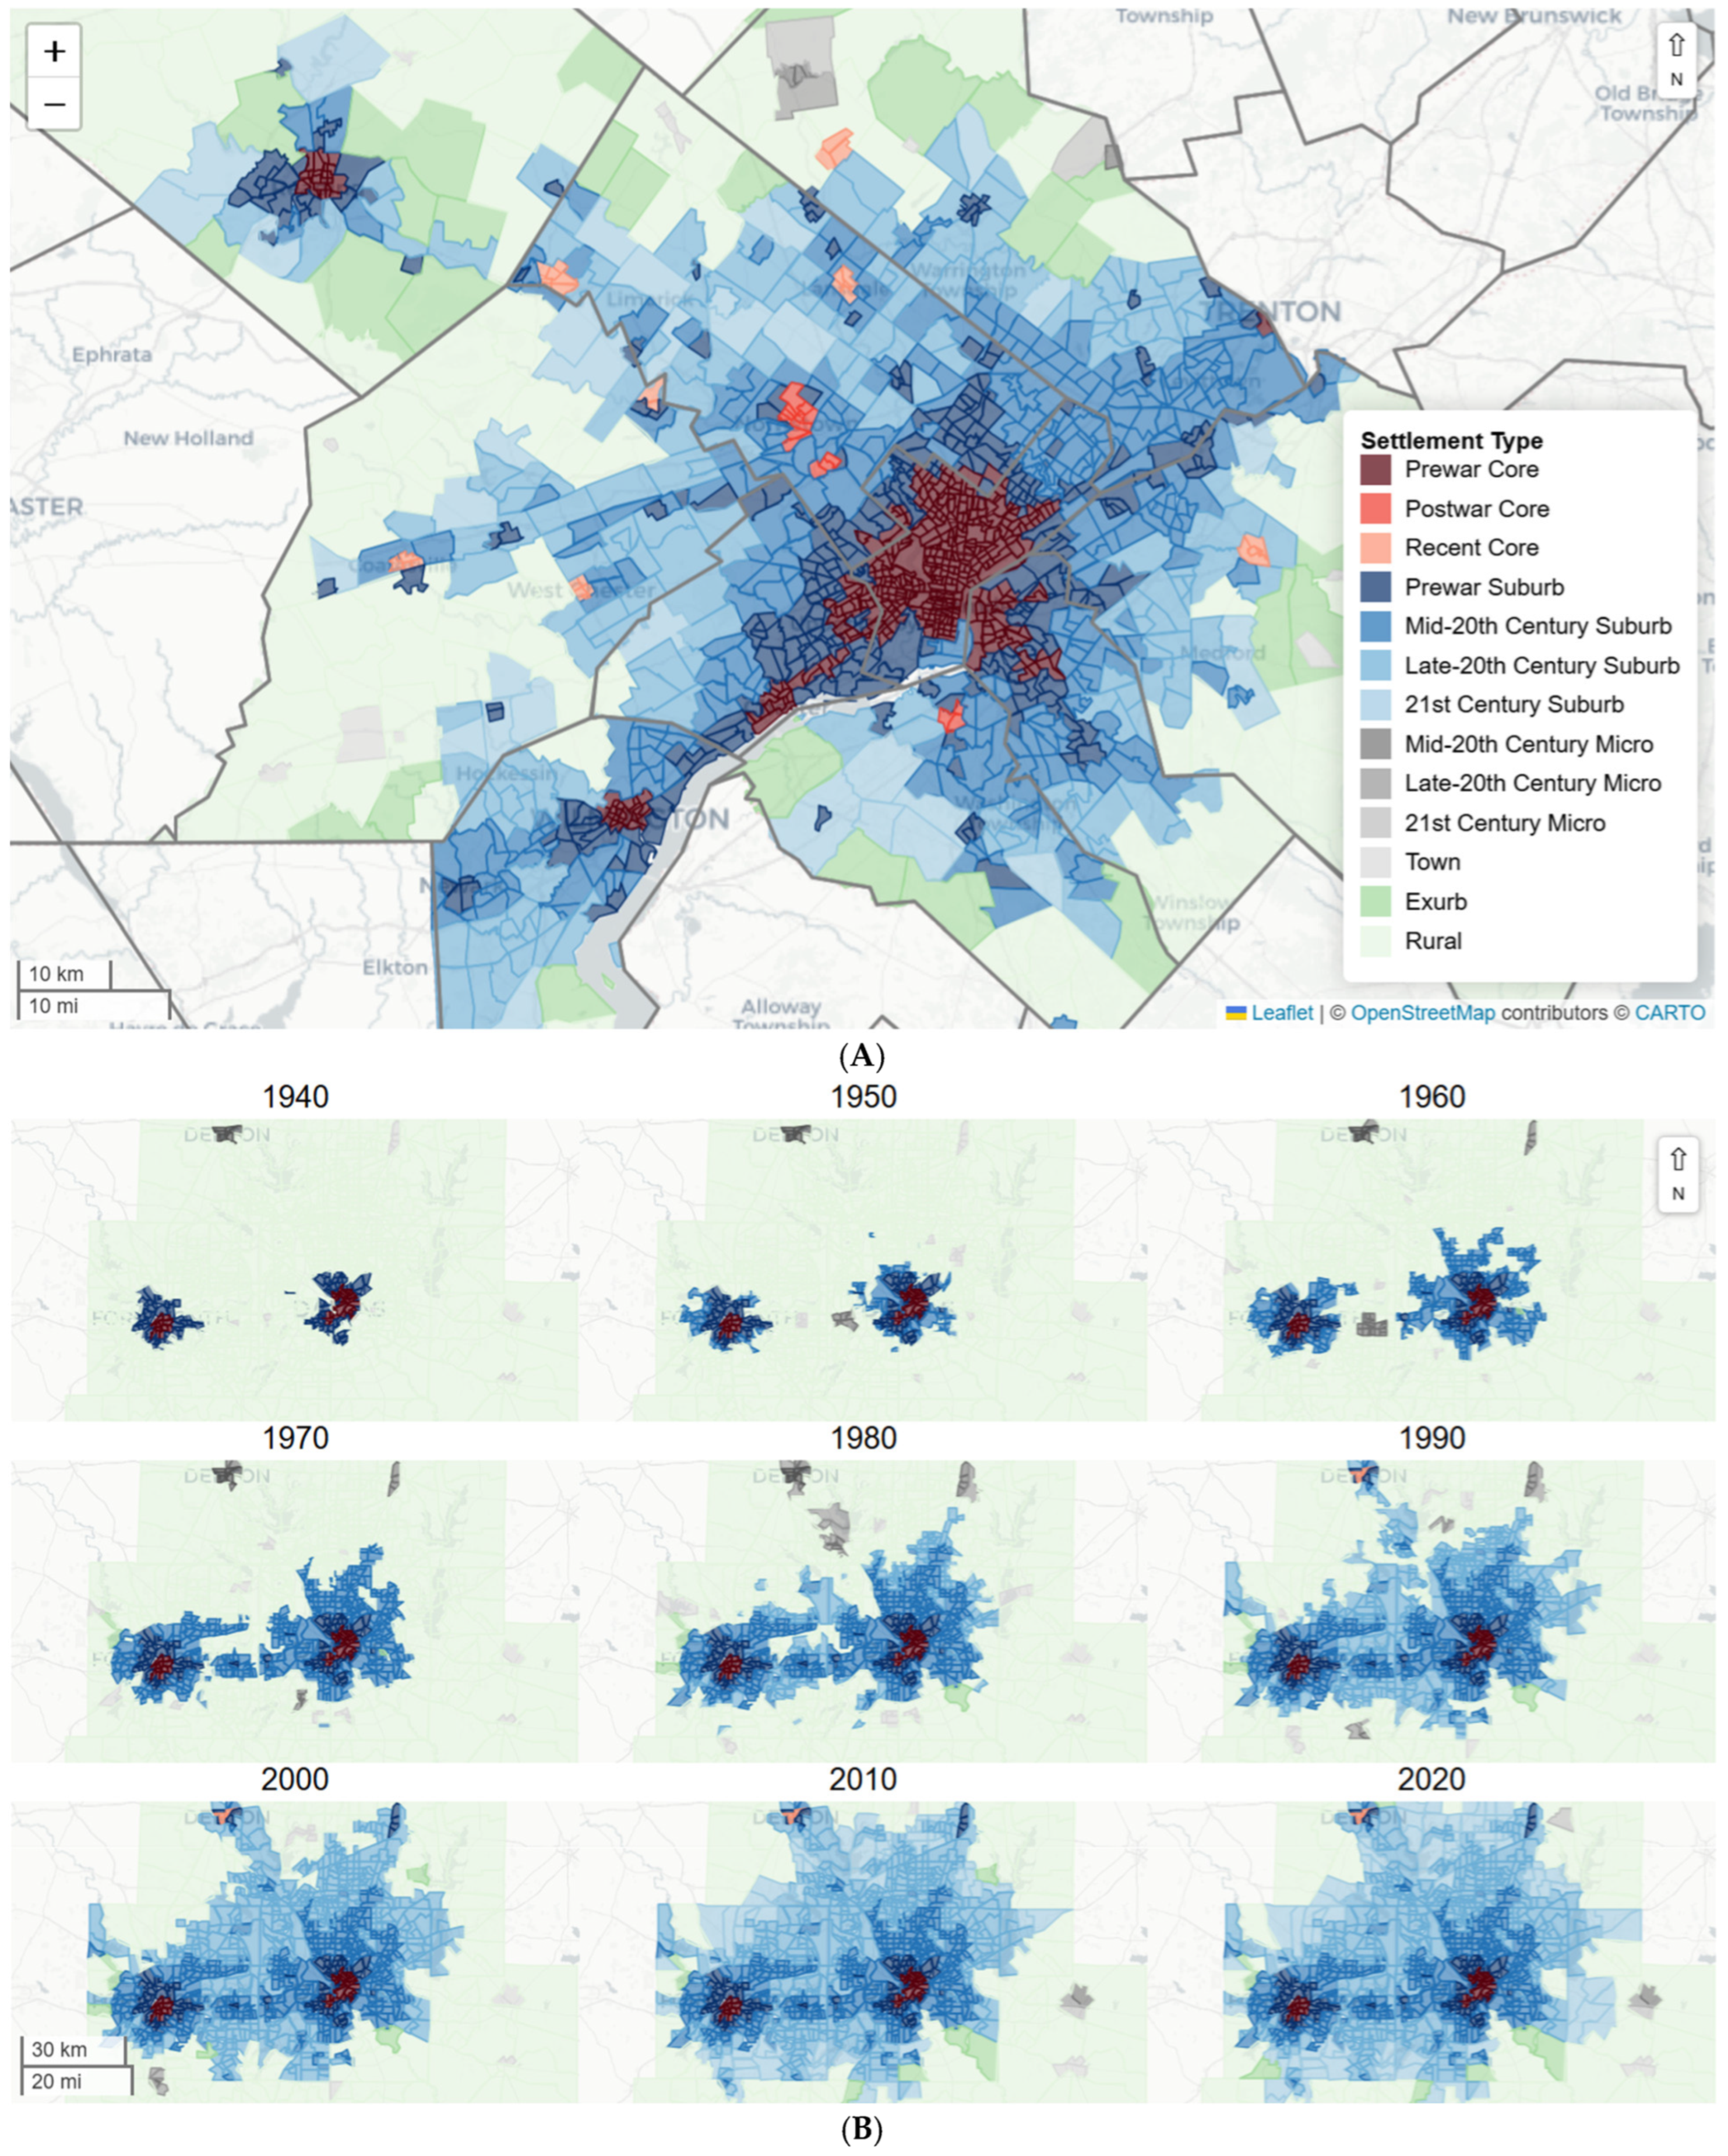
An analysis of the historical settlement typology from 1940 to 2020 reveals a spatial restructuring of the American population. Over this eighty-year period, the distribution of the population shifted decisively outward. The map of the Philadelphia, PA-NJ-DE Urban Area in 2020 (
Figure 1A) illustrates the spatial distribution of these settlement types, from the dense Prewar Core to low-density exurban fringes. The longitudinal panels of the Dallas-Fort Worth Metroplex Urban Region (
Figure 1B) highlight the shift toward polycentric, automobile-driven suburban expansion over the postwar period. While the spatial expansion of metropolitan areas visibly illustrates the outward shift in the built environment,
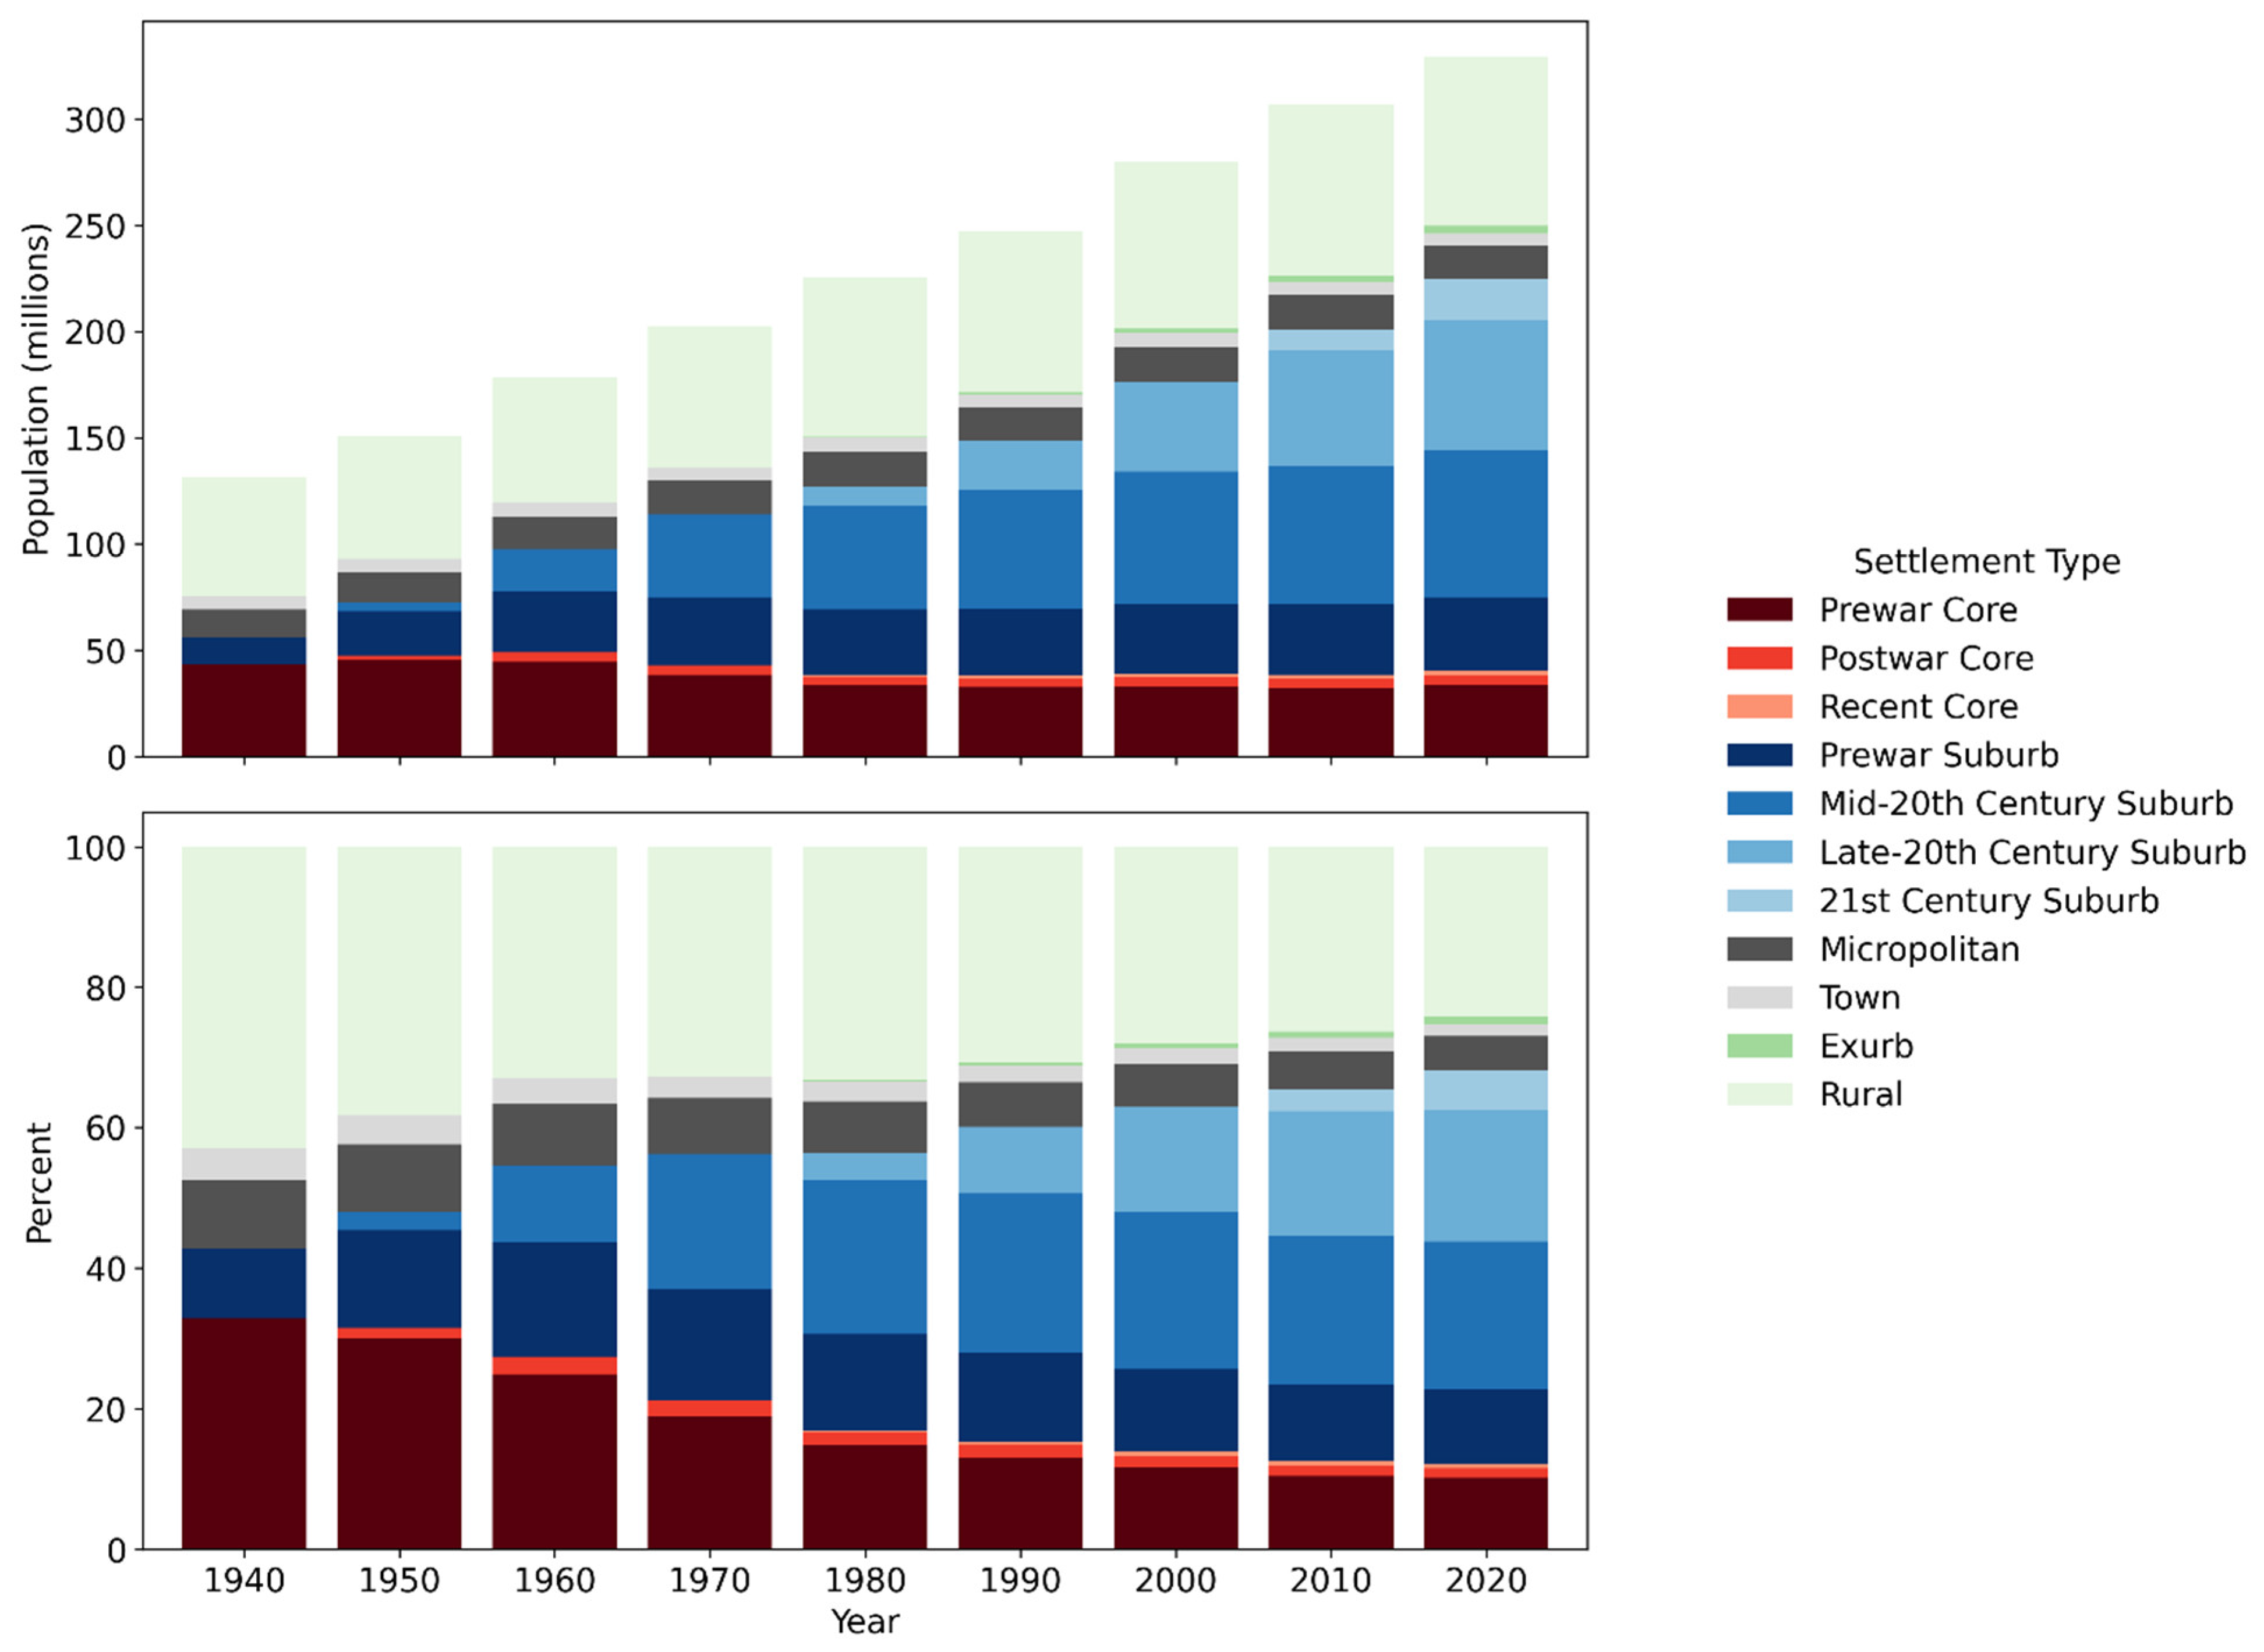
Figure 2 charts this national transformation from 1940 to 2020, showing the shifting distribution of the population across these settlement types. The absolute population totals (top panel) highlight the sheer scale of national growth, while the proportional distribution (bottom panel) reveals that the population growth was absorbed almost entirely by successive rings of suburban expansion.
In 1940, Prewar Cores were the undisputed demographic center of the American city, housing most of the urban population. Over the subsequent decades, however, this dominance was eroded by two simultaneous forces: the absorption of new residents by the suburban rings and population loss within the cores themselves. As household sizes shrank and land uses changed, core populations thinned out, even as the metropolitan regions surrounding them surged in size.
As a greater share of the American population became suburban, the average density of the built environment fell overall, as suburbs exhibit significantly lower population densities than the urban cores they surround. While existing populations thinned within the urban cores, the suburban periphery was characterized by a shift toward increasingly land-intensive development patterns, with each new suburban ring exhibiting lower densities than its predecessor. Each successive transportation era and wave of peripheral development has required more land per capita than the last.
Table 2 shows the scale of this decentralization. Using the centroid of each urban area in the decade it emerged as an urban core,
Table 2 tracks the housing-unit-weighted mean distance of all suburban tracts from their historical urban centers. In 1940, there were 164 metropolitan cores in the United States, and suburban tracts were, on average, 8.6 miles from the urban center. Between 1950 and 2020, 220 new urban cores formed across the nation. While the mean distance of suburbs to the core increased slowly at first, the rate of outward expansion accelerated in the final decades of the 20th century. This period also saw a dramatic rise in the overall suburban land area, but the pace of these changes has slowed substantially in the 21st century, with the mean distance plateauing at 16.8 miles by 2020.
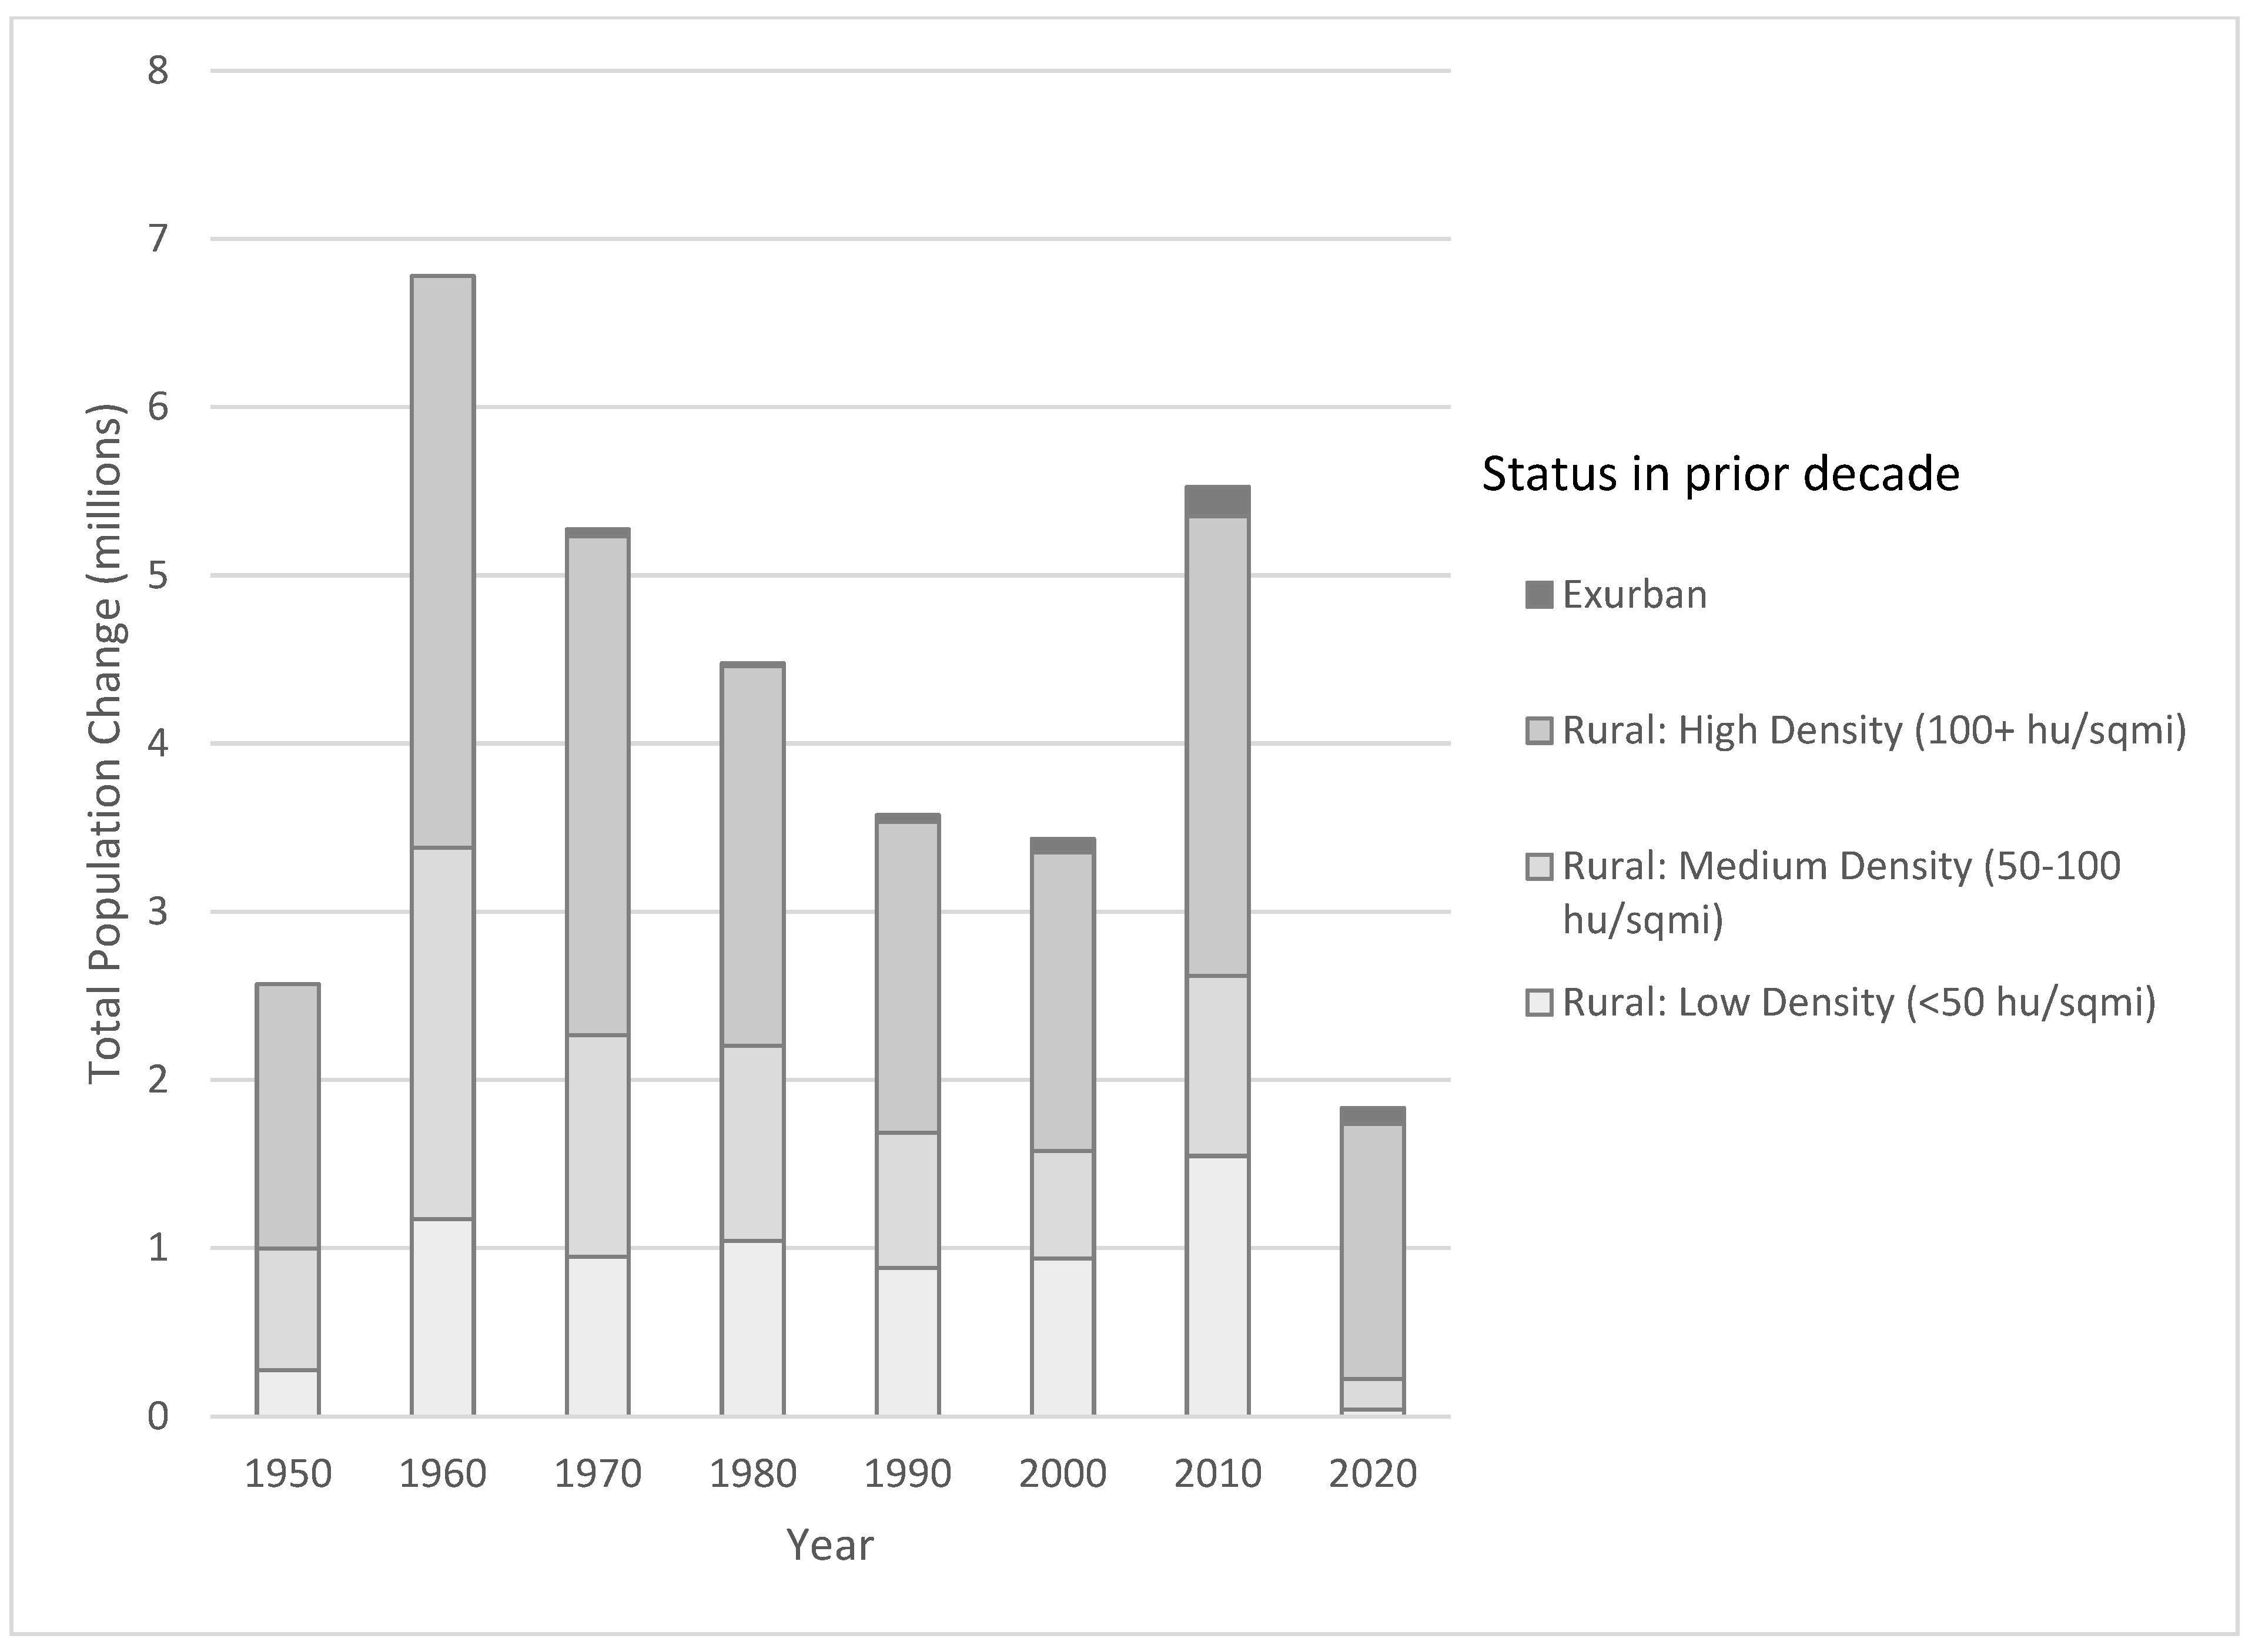
To accurately track the outward spatial expansion of urban areas, it is useful to focus on “greenfield” development, where outlying tracts transition into the suburban classification (crossing the 200 housing units per square mile threshold). While the term “greenfield” colloquially implies the sudden urbanization of entirely pristine land, decennial longitudinal data reveals a more nuanced process. Because the construction of large-scale residential subdivisions is a multi-year process, a tract transitioning from remote agricultural land to a fully built suburb will frequently register with a density between 100 and 199 units (classified here as high-density rural) during an intermediate decennial count. This reflects a “mid-stride” snapshot of active, large-scale residential development captured between censuses.
Crucially, these rapidly developing tracts completely bypass the exurban classification. In this typology, to be classified as exurbia requires maintaining a housing unit density of between 50 and 100 housing units per square mile for at least two consecutive decades, but these “mid-stride” greenfield tracts fail the stability requirement. This empirical distinction reinforces a core theoretical premise of this framework: rapid residential “boomtowns” on the metropolitan fringe are simply the active leading edge of suburban sprawl, fundamentally distinct from the deliberate, long-term, low-density equilibrium sought by exurban communities.
Isolating this greenfield development over time illustrates the sheer scale and shifting momentum of American suburbanization. The 1950s and 1960s represented an era of rapid outward expansion, culminating in the 1960 census, which captured nearly 7 million people residing in new suburban tracts that had been rural just ten years prior. In subsequent decades, population growth in newly transitioned greenfield tracts steadily declined in both percentage and absolute numbers. This suggests that regional growth was increasingly absorbed by the infill and maturation of existing suburban rings rather than the continuous conversion of outlying rural land. One notable exception was the suburban growth during the 2000s, driven by that decade’s unprecedented housing boom, which added over 5.5 million people to newly suburbanized tracts. However, this suburban surge collapsed in the subsequent decade, with the 2020 census recording the lowest level of greenfield expansion in the eighty-year study period (
Figure 3).
4.1. Economic Divergence and the Geography of Wealth
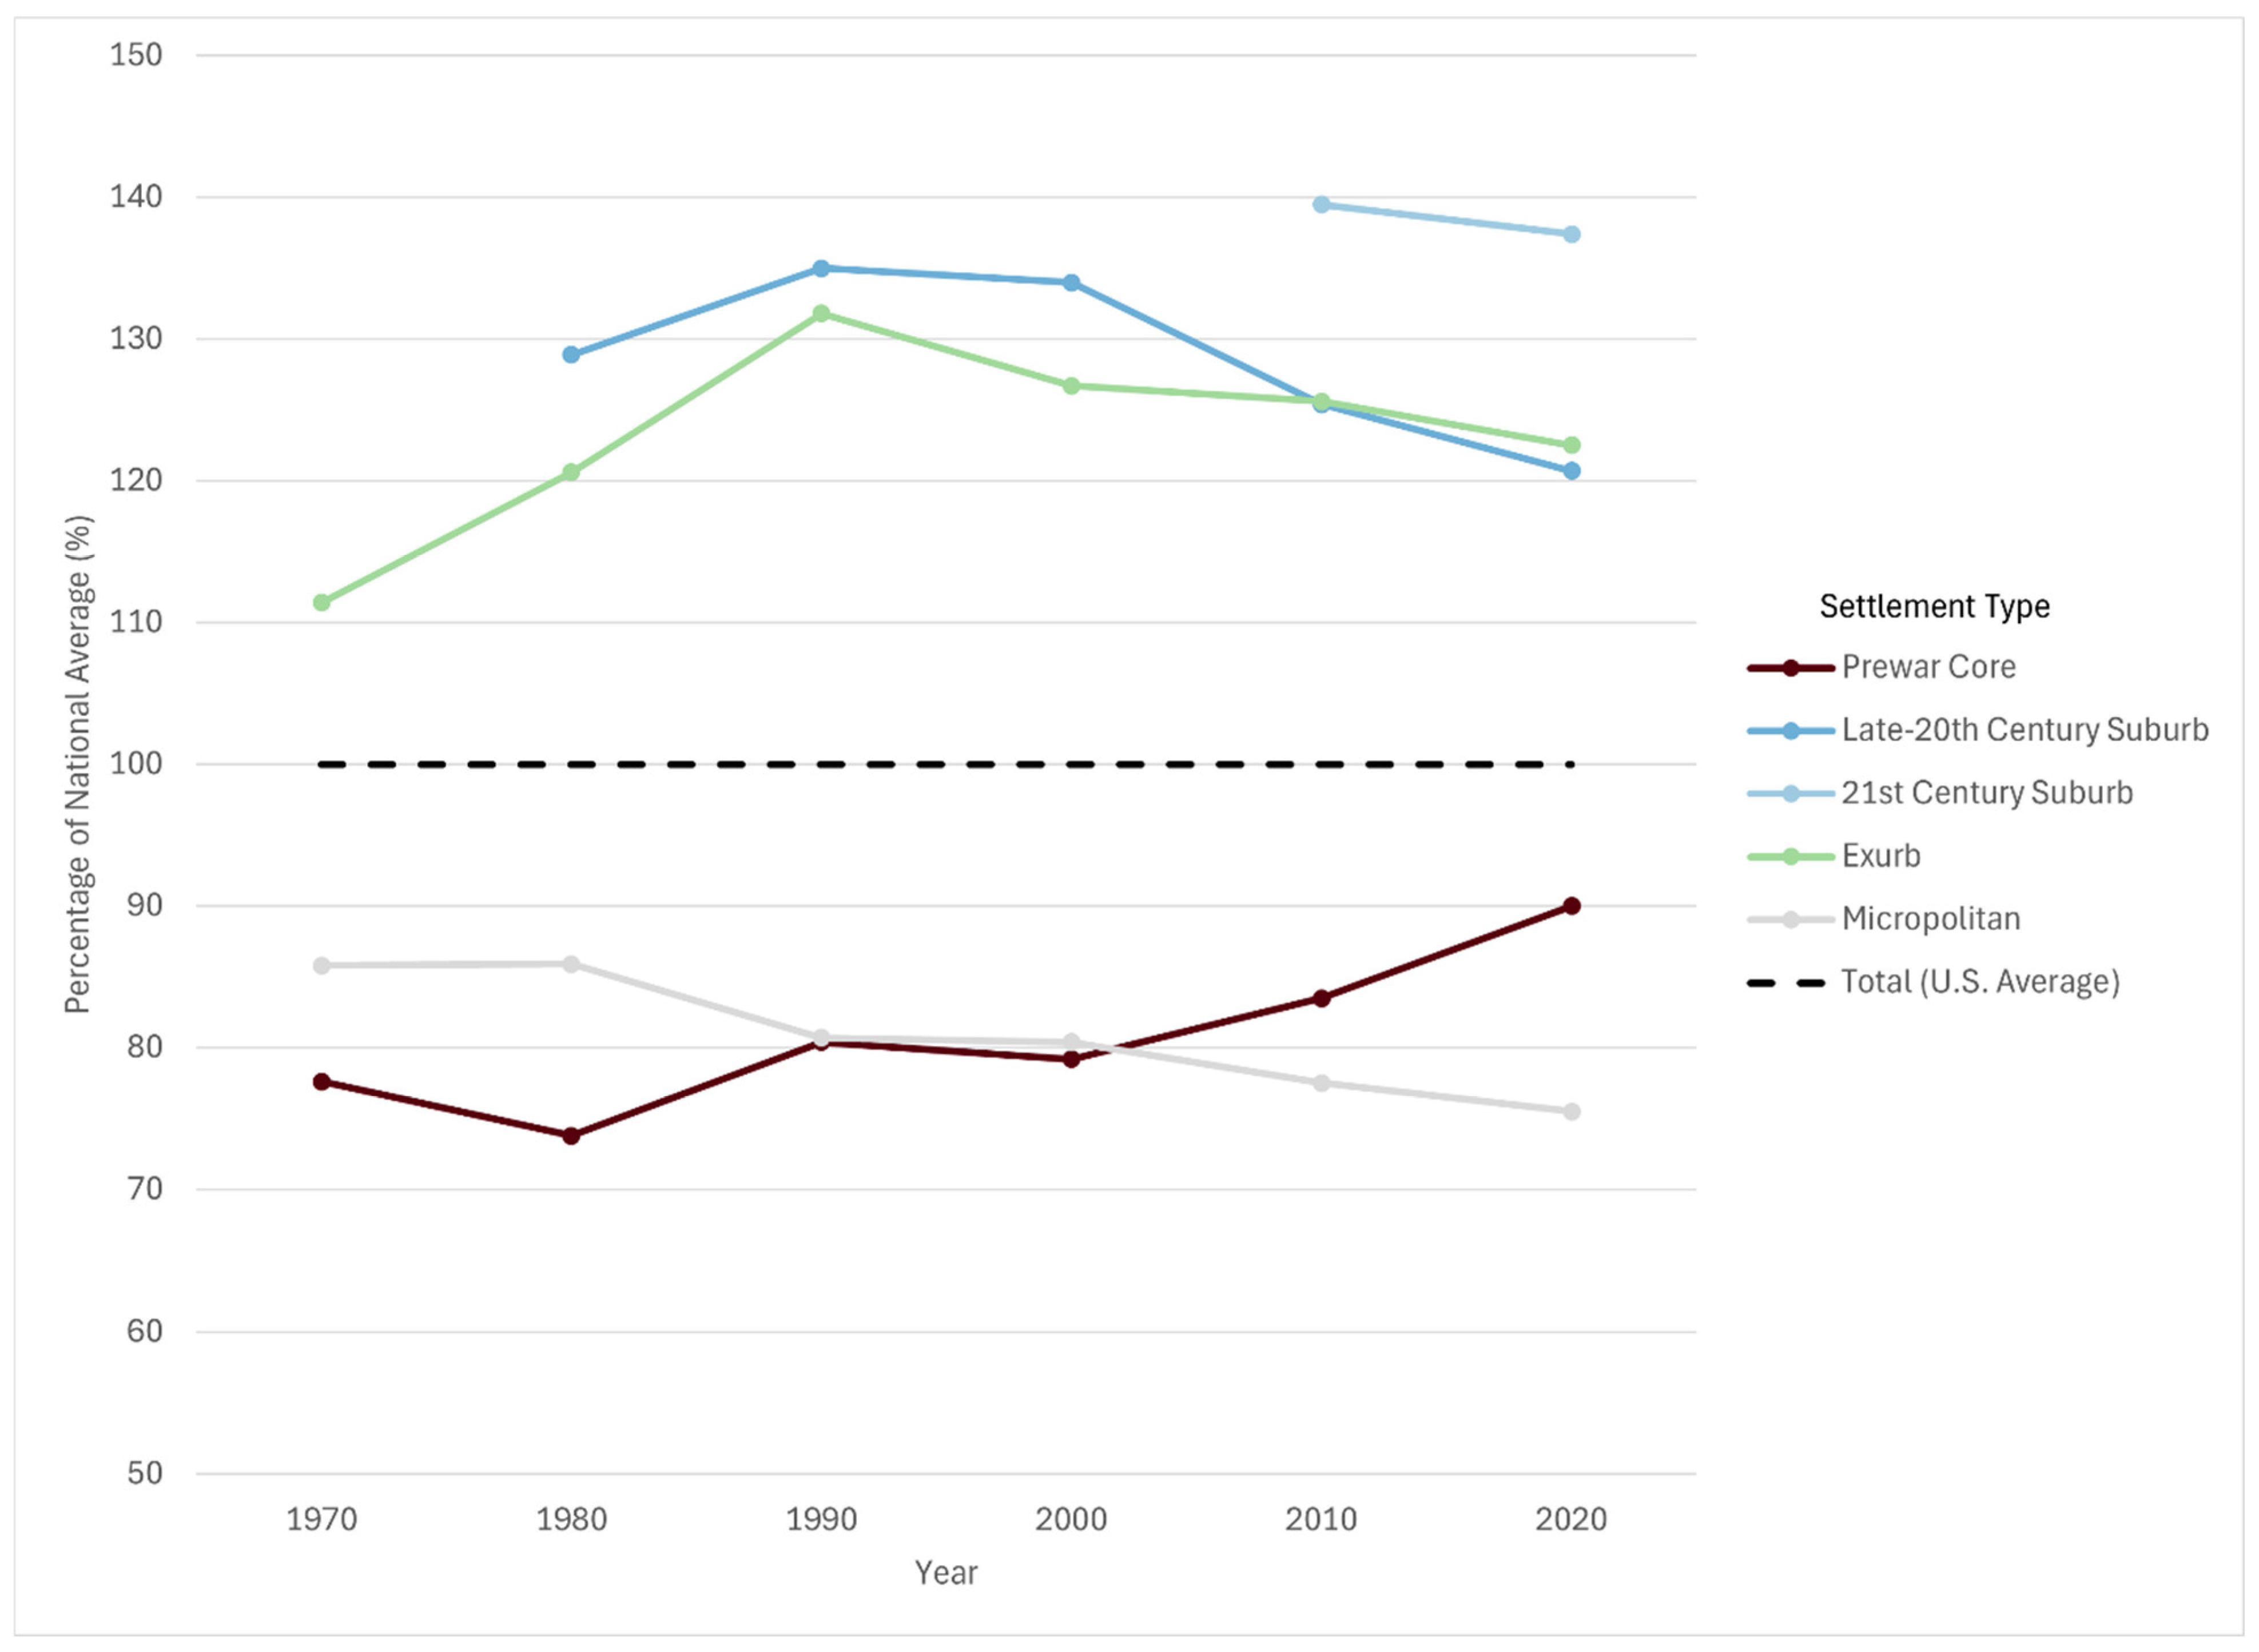
As the American metropolis expanded and densities decreased, a profound spatial sorting by economic class occurred. Tracking median household income across the settlement typology from 1970 to 2020 reveals that the outward migration of the population was inextricably linked to the outward migration of wealth. When tract-level incomes are standardized against the national average, three distinct economic trajectories emerge, highlighting the stark financial divergence between the metropolitan periphery, outlying areas, and the historic urban core.
First, the data clearly demonstrates that the highest median incomes are heavily concentrated in the outer suburbs and the exurban fringe. As successive waves of suburbanization pushed further from the center, the newest, lowest-density developments consistently attracted the highest-income households. By 2020, 21st-century suburbs represented the wealthiest settlement category in the nation, with median incomes at 137.4 percent of the national average (
Figure 4). Similarly, late-20th-century suburbs (120.7 percent) and the exurban fringe (123.3 percent) maintain significant economic advantage over the rest of the country. Though greenfield expansion may have slowed in recent decades, the periphery remains the primary destination for affluent households seeking low-density environments.
In contrast to the wealthy metropolitan periphery, the lowest relative incomes are found in outlying towns and small cities. Micropolitan areas and remote towns have experienced a persistent, multi-decade economic decline relative to the national average. For example, micropolitan cores, which tracked at 85.5 percent of the national average in 1970, have seen their relative economic standing steadily erode, falling to just 75.5 percent by 2020. Remote towns and rural areas have similarly lost ground relative to metropolitan America. At the same time, there has been a striking economic reversal within the oldest parts of the American metropolis, as incomes are rising rapidly in Prewar Cores. Though the median household income stood at 73.8 percent of the national average in 1980, these areas have seen a steady improvement in subsequent decades. By 2020, the median income in Prewar Cores had climbed back to 90.0 percent of the national average, owing to widespread gentrification and targeted reinvestment occurring within these dense older settlements. Even as the broader metropolitan population continues to decentralize, capital and higher-income households are increasingly returning to the traditional urban core.
4.2. The Distribution of Population by Race and Ethnicity
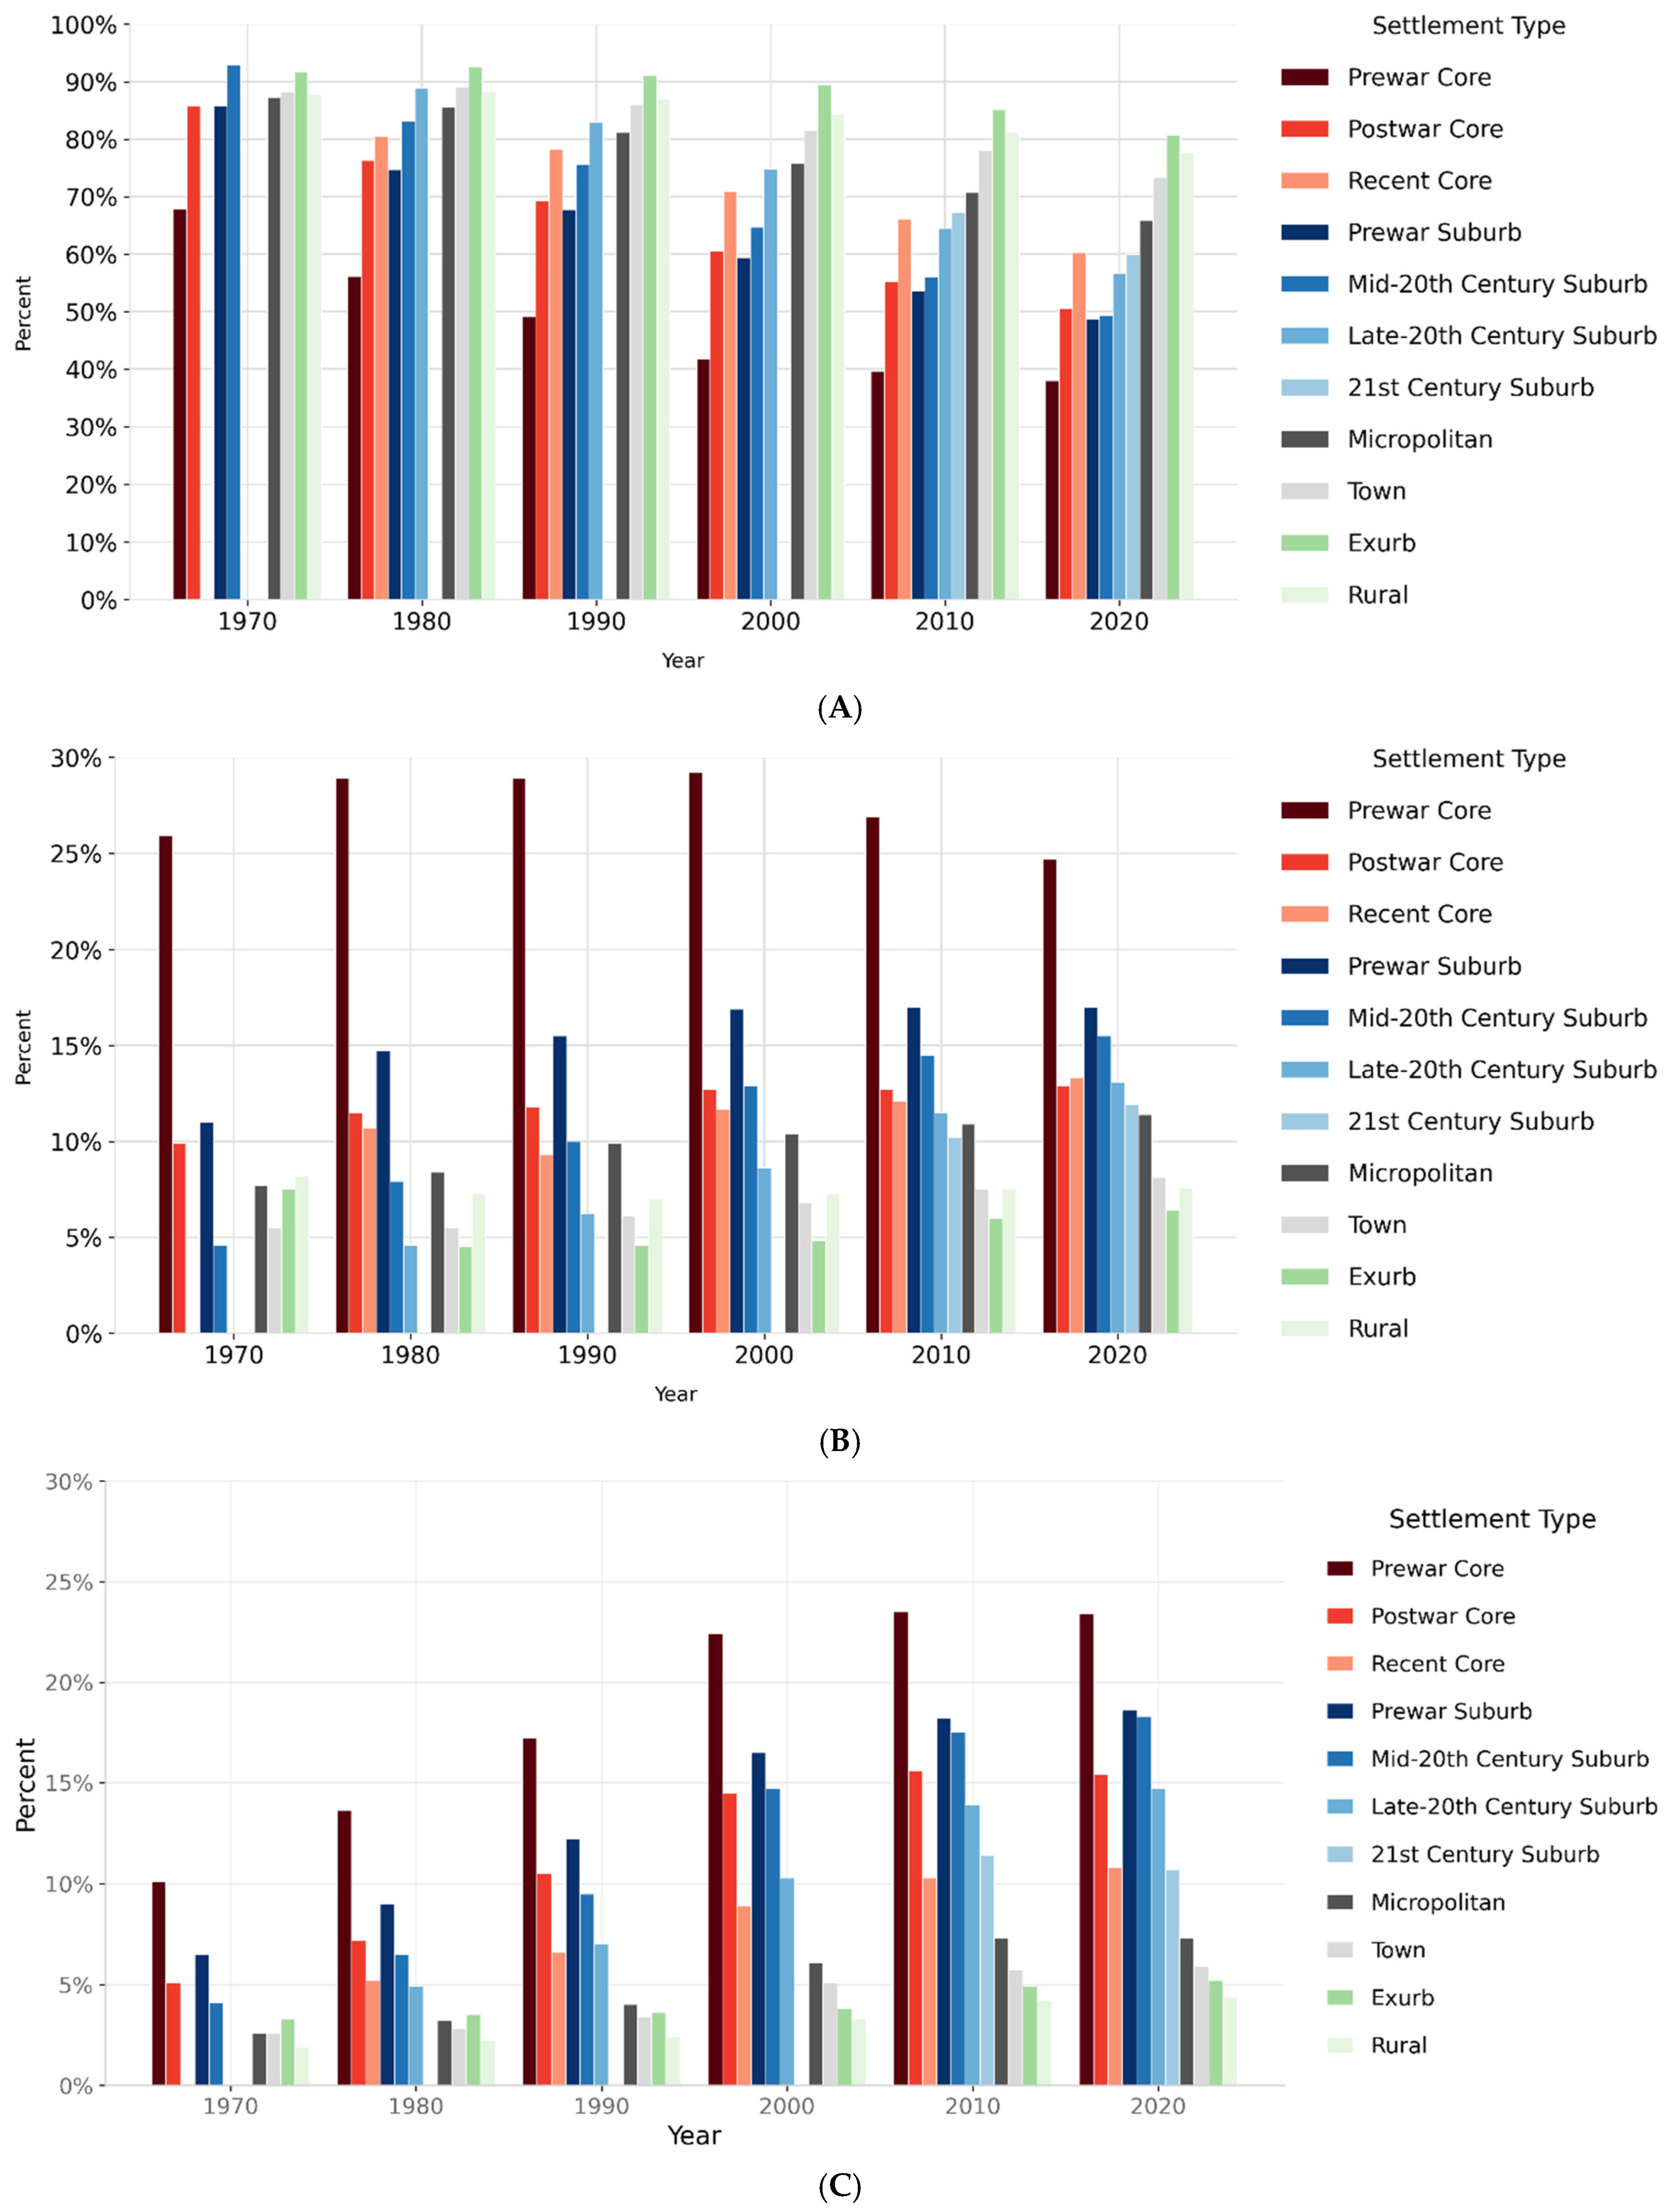
The spatial and economic decentralization of the American metropolis was accompanied by racial sorting, as well. An analysis of the White non-Hispanic and Black non-Hispanic populations from 1970 to 2020 reveals a polarized demographic landscape. The defining trend of the White non-Hispanic population is its systematic underrepresentation in densely populated historic cores and its heavy concentration in peripheral areas (
Figure 5A). In 1970, the White non-Hispanic population still constituted 67.9 percent of the Prewar Core areas, but by 2020, that share had dropped to 38.0 percent.
Instead, White populations have consistently maintained demographic dominance in low-density outlying areas. Even as the nation as a whole diversified, the exurban fringe and remote rural areas remained relatively homogenous. By 2020, the White non-Hispanic population still accounted for 82.2 percent of early Exurbs and roughly 80 percent of Rural tracts. A similar gradient is evident within the suburbs themselves: newer, lower-density areas have higher concentrations of White residents than older, denser settlement types. In 2020, 21st-century suburbs were nearly 60 percent White, while less than half of the population of Prewar and Mid-20th Century suburbs was White.
The distribution of the Black non-Hispanic population represents the inverse of the White spatial pattern. The Black population has been, and remains, disproportionately concentrated in the densest, oldest settlement categories while being underrepresented in the expanding, low-density periphery. In 1970, while Black residents made up 11.2 percent of the national population, they accounted for nearly 26 percent of the population in Prewar Cores. This core concentration remained remarkably stable through the end of the twentieth century, peaking at 29.2 percent in 2000 before slightly receding in recent decades.
However, the data also reveal a distinct, albeit delayed, pattern of Black suburbanization. Rather than leapfrogging into greenfield developments or the exurban fringe, Black suburbanization has primarily occurred within the oldest rings of the metropolitan area. The non-Hispanic Black share of mid-20th Century suburbs grew from 4.6 percent in 1970 to 15.5 percent by 2020, an absolute increase of nearly 8.8 million people. At the same time, however, Black residents still accounted for only 6 percent of the exurban fringe, highlighting an enduring spatial barrier to the newest, least dense, and wealthiest parts of the metropolitan landscape.
The foreign-born share of the total United States population nearly tripled between 1970 and 2020, growing from 4.8 percent to 13.4 percent, but this growing demographic did not distribute evenly across the landscape. Instead, mirroring the geographic constraints of the non-Hispanic Black population, foreign-born residents concentrated overwhelmingly in Prewar Cores and older, inner-ring suburbs. In 1970, the foreign-born population in Prewar Cores was already double the national average (10.1 percent), and by 2020, nearly one in four residents (23.4 percent) in these high-density centers was born outside the United States.
Despite the substantial growth of the foreign-born population nationwide, low-density peripheral areas have not seen large increases in foreign-born populations. In 2020, the foreign-born share in 21st-century suburbs stood at just 10.7 percent. The spatial divide is even starker in exurban and outlying areas, where the foreign-born population remains under 6 percent. However, the most dynamic demographic shift occurred just outside the historic core, within the older suburban rings. Mid-20th-century suburbs, many of which were originally constructed as homogenous, exclusionary destinations during the initial postwar era of “white flight,” have transformed into highly diverse immigrant communities. In 1970, the foreign-born share of mid-century suburbs was just 4.1 percent. Over the next fifty years, this settlement type absorbed 10.9 million foreign-born residents. By 2020, the foreign-born share in mid-20th century suburbs had surged to 18.3 percent, roughly equivalent to Prewar Suburbs (18.6 percent).
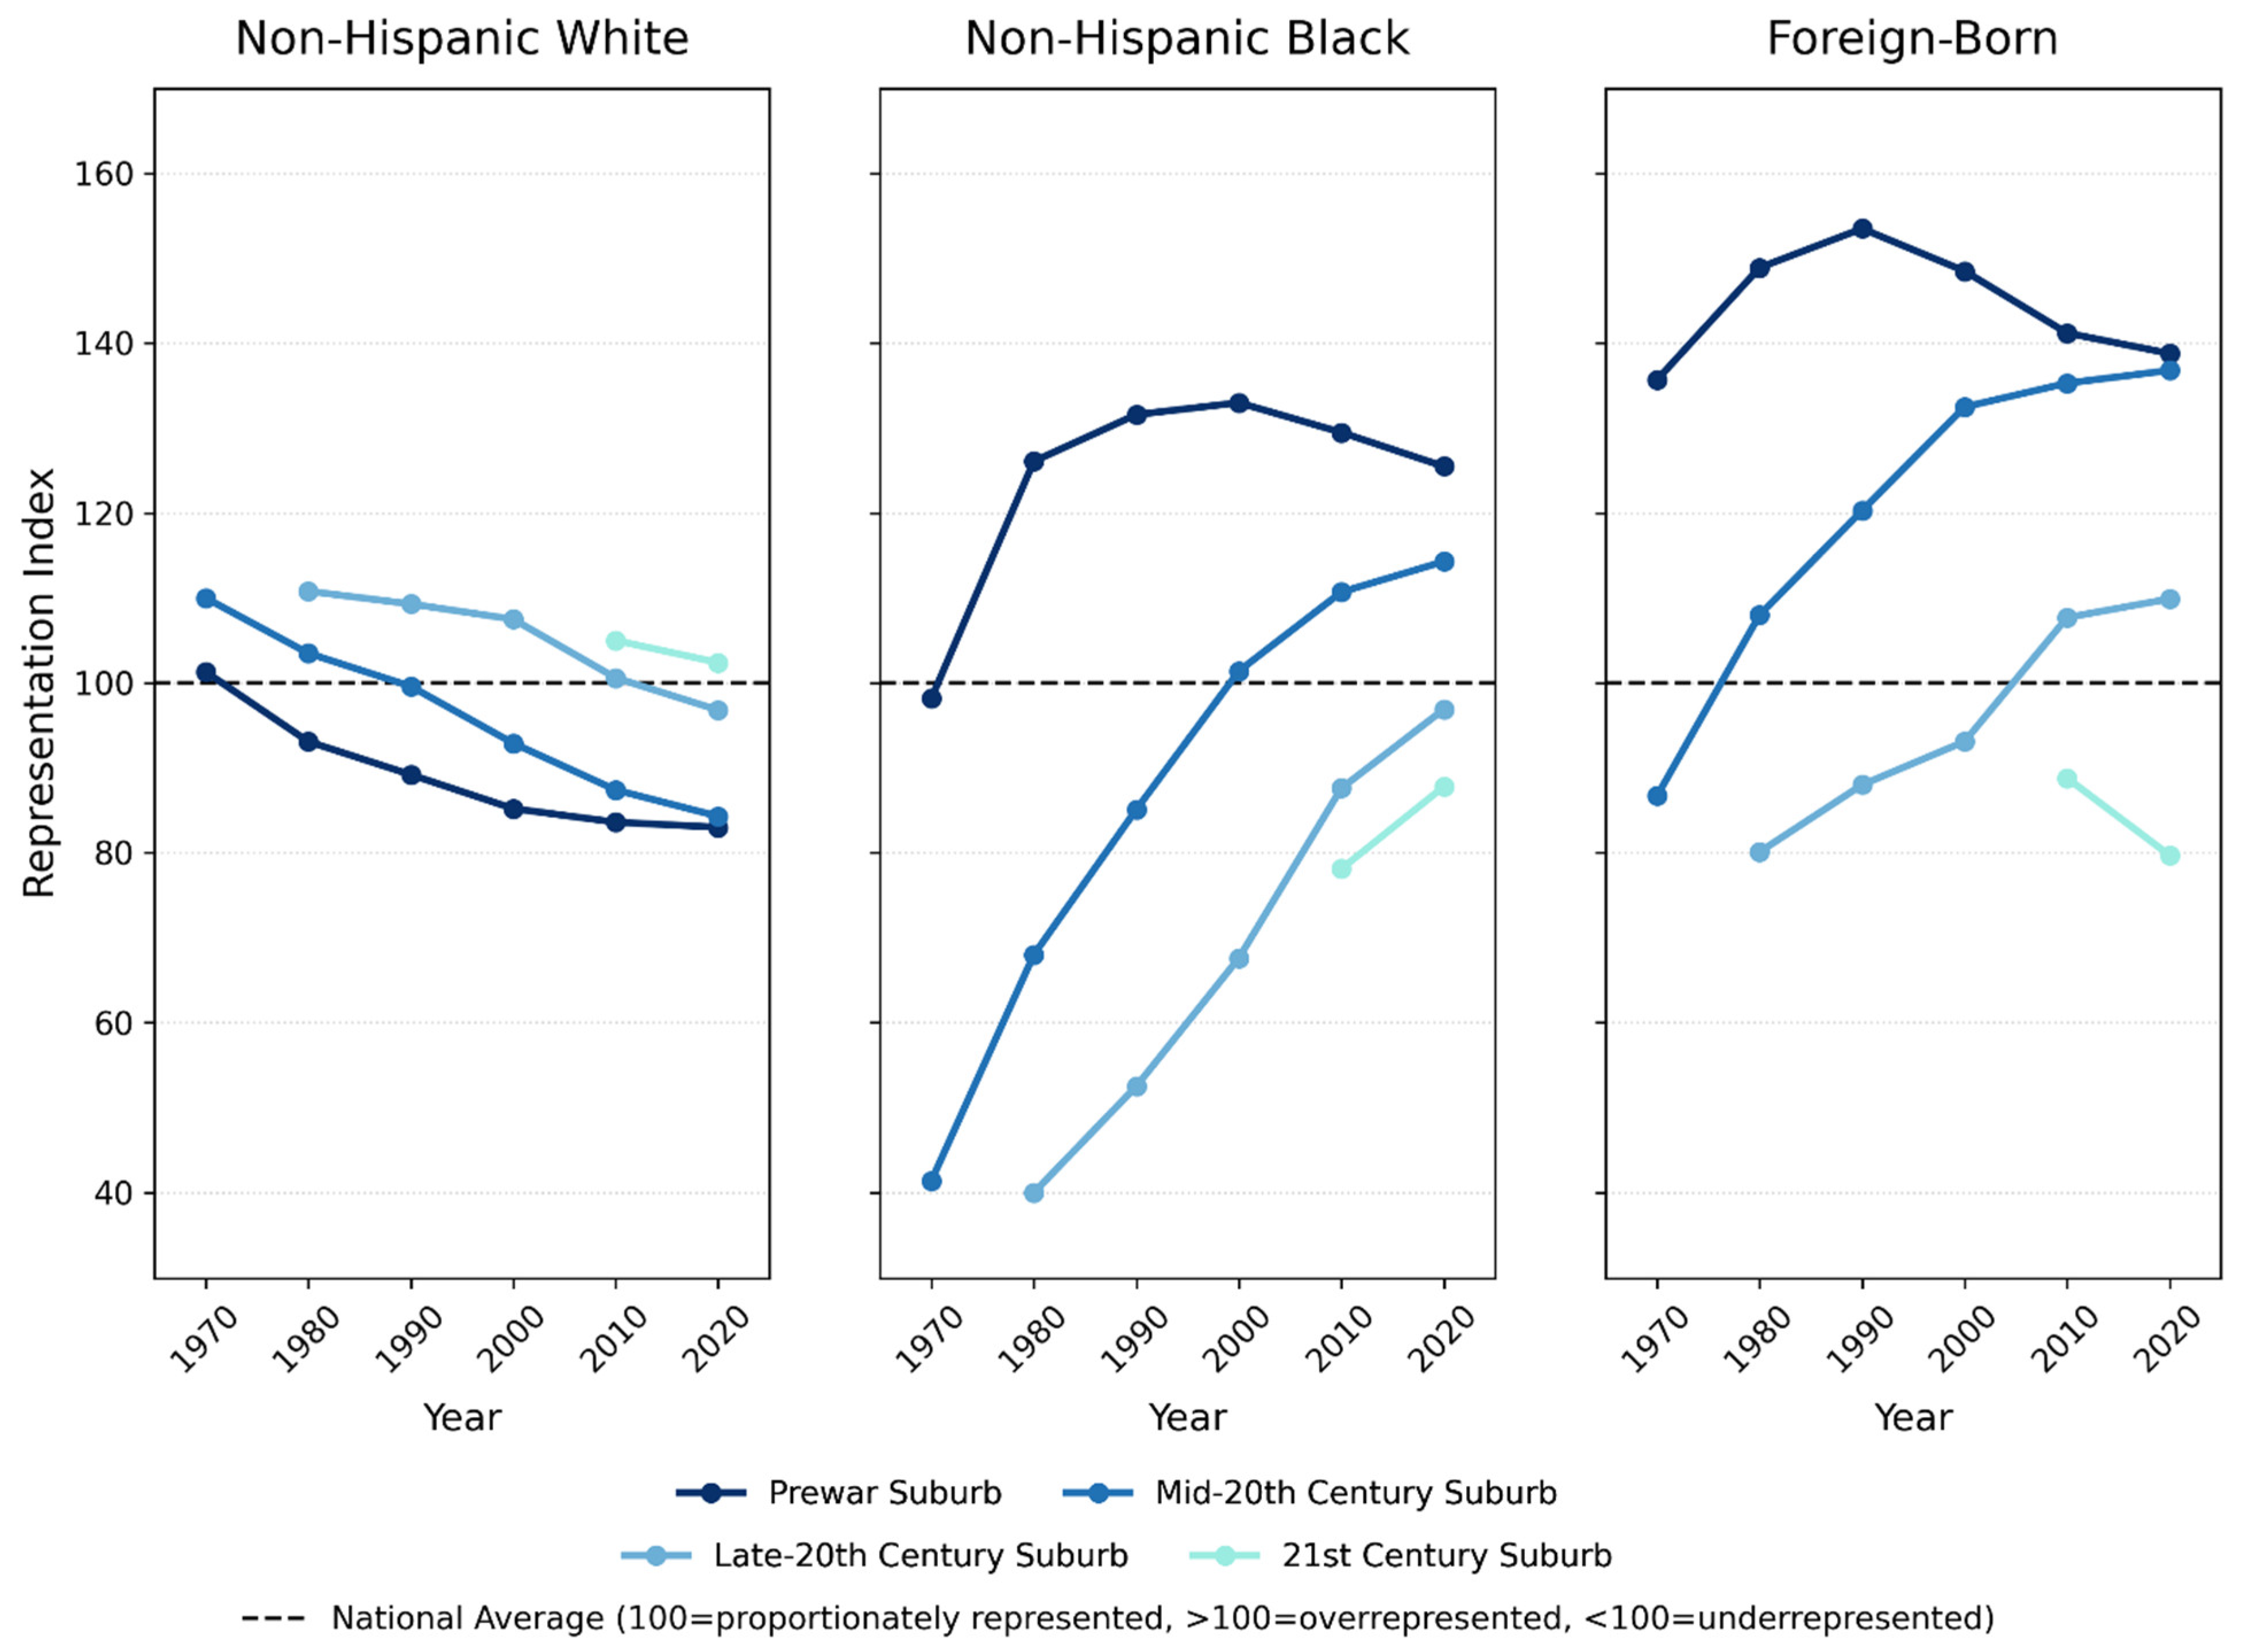
While absolute percentages highlight the raw demographic composition of these areas, standardizing these populations against the national average reveals patterns of spatial sorting.
Figure 6 presents a representation index for the non-Hispanic White, non-Hispanic Black, and foreign-born populations across suburban area types from 1970 to 2020, where a value of 100 indicates that a group is proportionately represented in that area type. Values above 100 indicate disproportionate overrepresentation, while values below 100 indicate underrepresentation.
Arranging these trajectories side-by-side reveals a striking and consistent pattern of spatial succession based on the age of the suburb. The White population is consistently overrepresented in the newest available suburban developments, but this overrepresentation steadily declines over time as the suburbs themselves age. Conversely, Black and foreign-born representations follow a distinct upward trajectory across almost all suburban area types over time. Although Black and foreign-born populations are initially underrepresented in newer suburban rings, they steadily gain representation within those specific cohorts throughout the 1970–2020 period. For both the Black and foreign-born populations, representation in Prewar Suburbs reached a peak in the late 20th century before beginning a distinct decline starting in 2000. Furthermore, while the foreign-born population has generally increased its representation across most newer suburbs, there is a notable exception in the newest periphery: foreign-born representation in 21st-Century Suburbs experienced a decline between 2010 and 2020.
4.3. The Geography of Human Capital: Educational Attainment
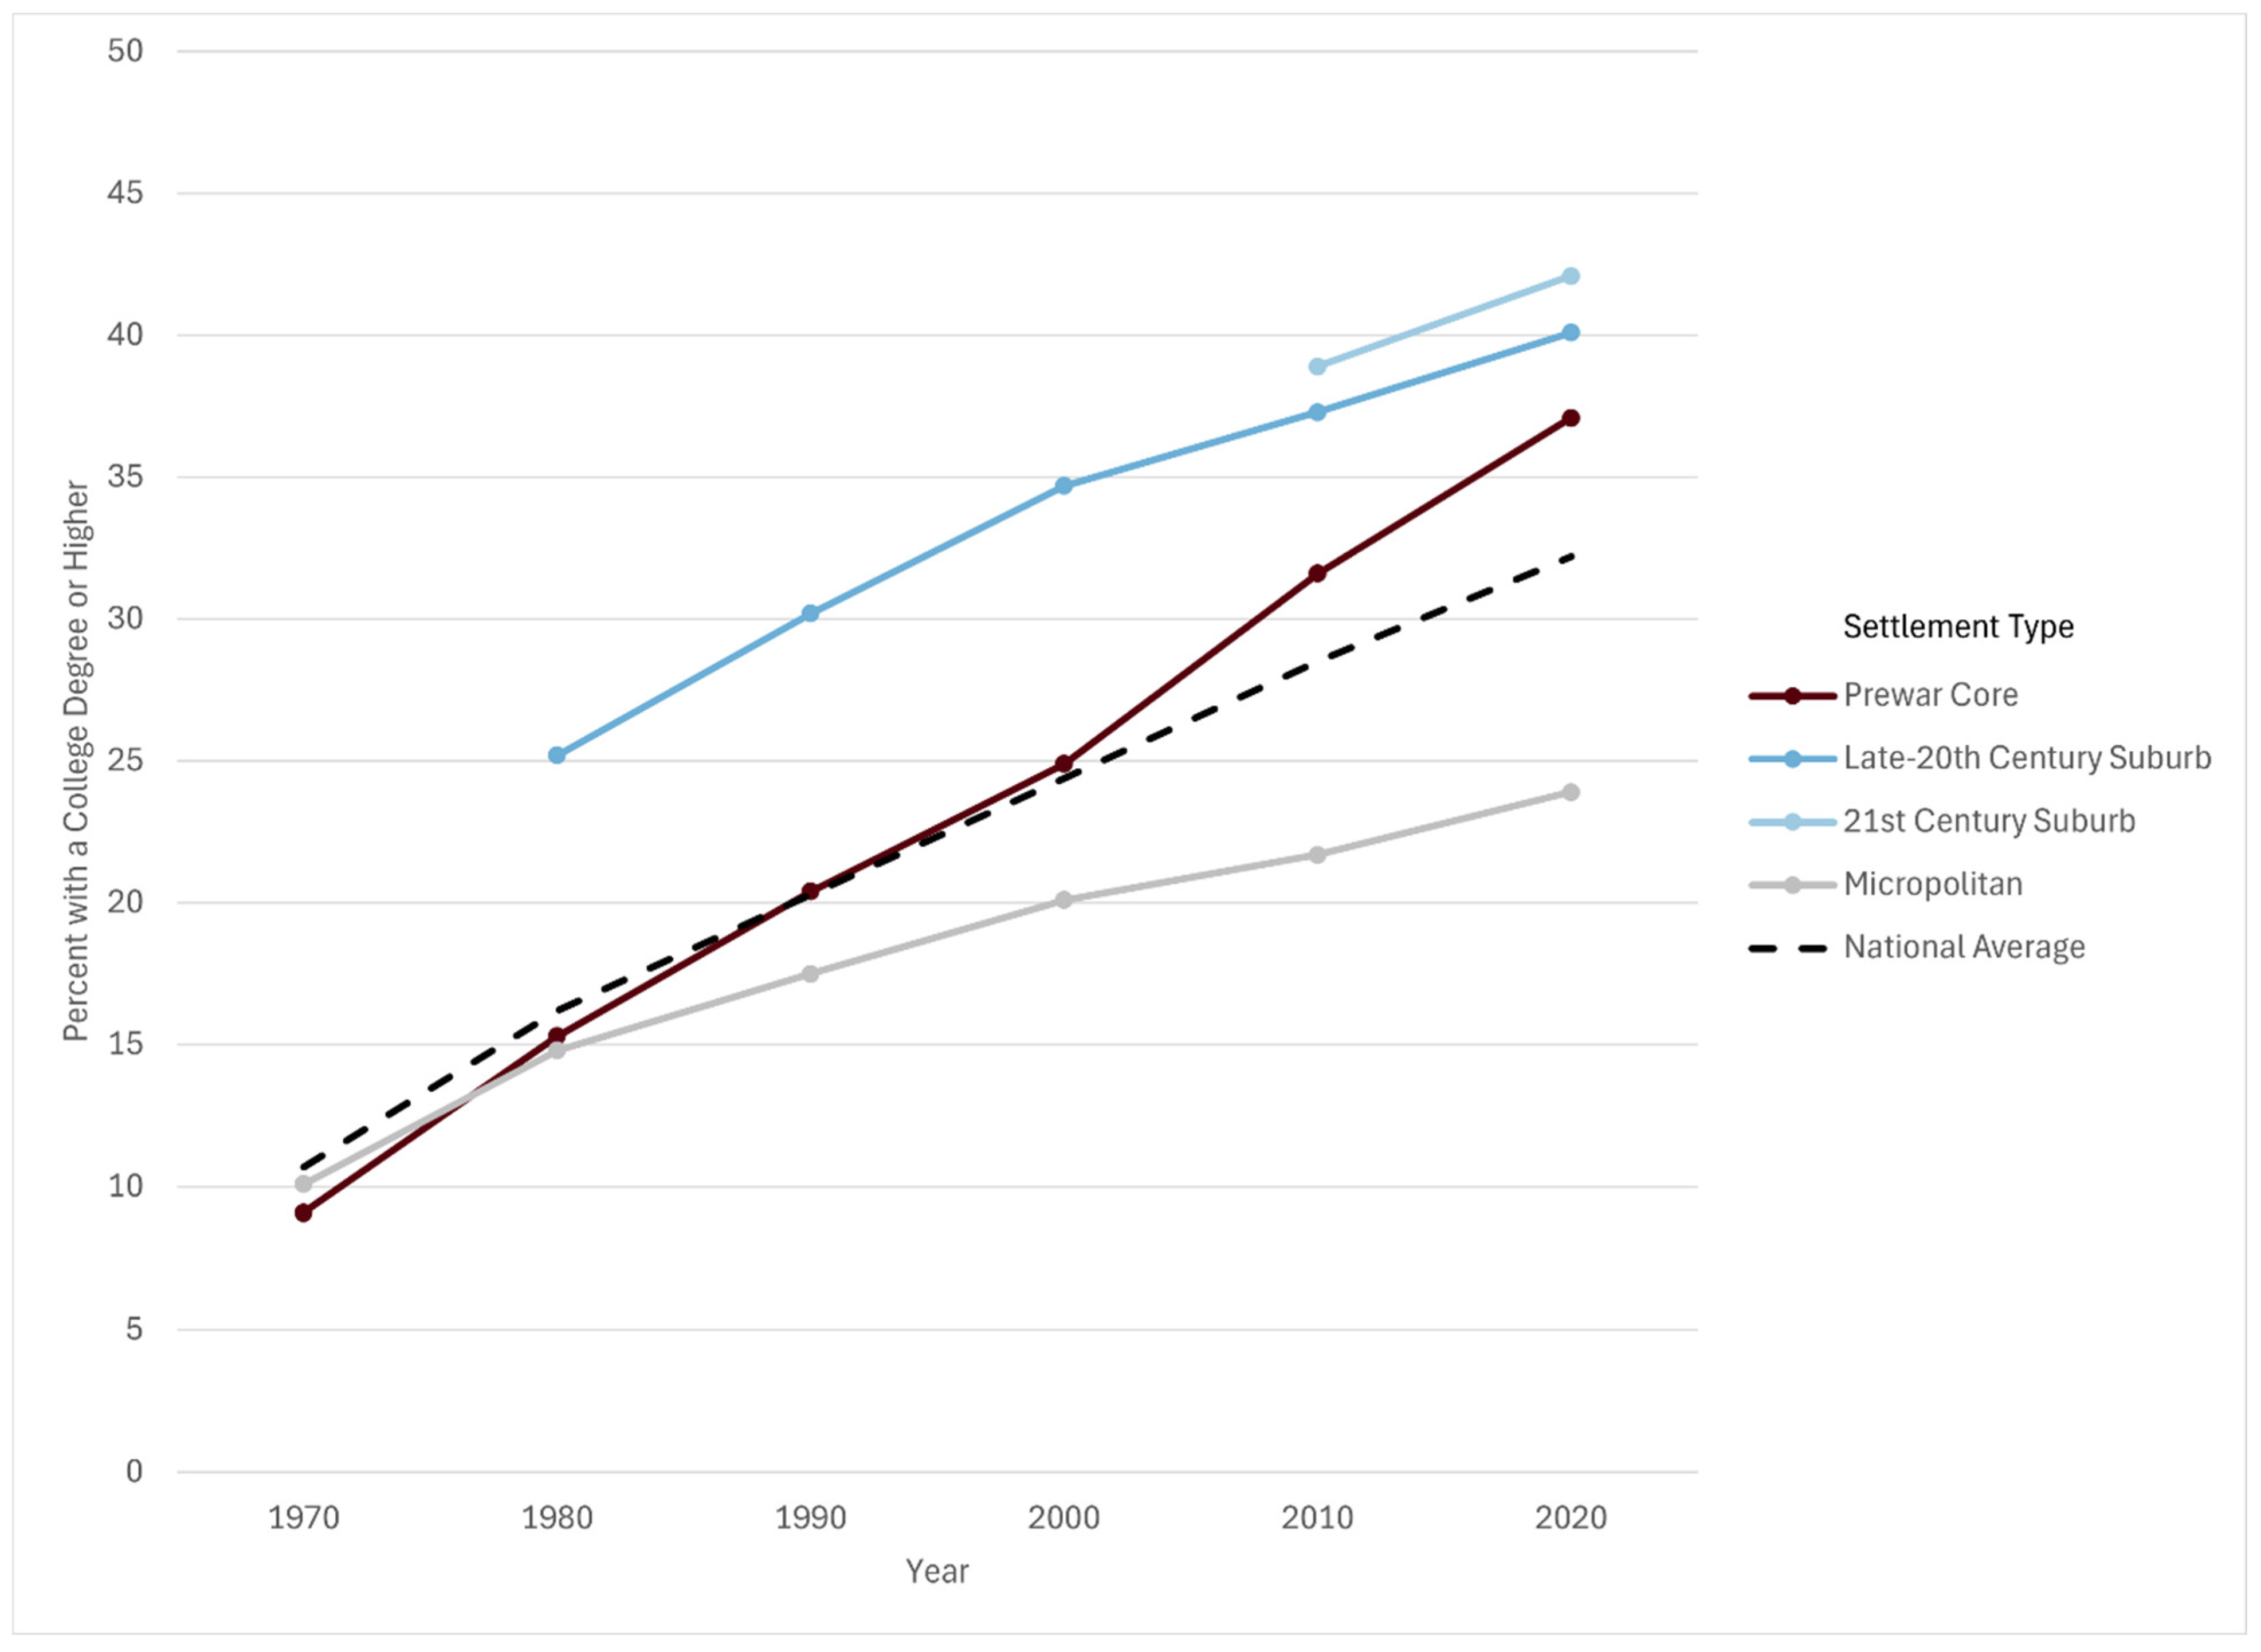
Tracking the share of the population with at least a college degree from 1970 to 2020 reveals a stark geographic sorting of human capital (
Figure 7). Highly educated populations are not distributed evenly across urban areas but instead are disproportionately concentrated in the newest, low-density suburbs and the oldest, highest-density Prewar Cores. Consistent with the concentration of wealth in greenfield developments, the newest suburban rings have established themselves as magnets for the college-educated population. As the national baseline for college attainment rose from 10.7 percent in 1970 to 32.2 percent in 2020, the newer suburbs consistently outpaced the national average. By 2020, 40.1 percent of residents of Late-20th Century Suburbs were college-educated, and 21st-Century Suburbs had an even higher share at 42.1 percent. However, the most dramatic educational transformation over this period occurred within the historic urban cores. In 1970, the college-educated share in Prewar Cores was just 9.1 percent, falling below the national average. Over the subsequent five decades, however, the college-educated share in Prewar Cores had quadrupled to 37.1 percent, surging well past the national baseline.
In sharp contrast to the surging human capital in new suburbs and historic cores, the data reflects a persistent “brain drain” from outlying towns and rural areas. While educational attainment has risen in absolute terms across all geographies, smaller and more remote settlement types have increasingly fallen behind the national average. By 2020, the college-educated share in prewar micropolitan cores (19.3 percent) and remote rural tracts (21.5 percent) lagged more than ten percentage points behind the national average, roughly half the rate of the 21st-Century Suburbs. Ultimately, the educational data confirms a polarized metropolitan landscape, where human capital is highly concentrated in the expanding greenfield edges and the resurgent urban cores.
5. Discussion
A key point of this typology is the distinction between “suburb” and “exurb.” For many decades, suburbs have been characterized by expansion, while exurbs exhibit stability. As noted in the methodology, requiring a 20-year period of low-density maintenance deliberately excludes rapidly transitioning “boomtowns” from the exurban classification. This distinction aligns with Muller’s transportation-era periodization [
5], which similarly emphasizes that each wave of decentralization produces qualitatively distinct settlement forms rather than a single undifferentiated suburban mass. While outward suburban expansion may eventually catch up with these remote tracts, by defining exurbs through their resistance to explosive growth, this framework isolates a specific residential choice: populations that actively maintain low-density, remote environments over long periods while remaining economically linked to the metropolitan system. Consequently, the demographic profile of the exurban fringe in this study reflects established, deliberately low-density communities rather than the leading edge of suburban sprawl.
By contrast, the suburban classifications in this typology illustrate a distinct morphological “life-course.” The data demonstrates that greenfield peripheries do not remain static, but are merely the leading edge of a long-term maturation process. As these outer rings age, their housing stock filters down, their initial homogeneity breaks down, and they are eventually enveloped by subsequent waves of outward development. This continuous aging process speaks directly to the phenomenon documented by Hanlon [
10] and Hanlon and Vicino [
12], whose work on inner-ring suburban decline identified a pattern of disinvestment and demographic transition in older suburban communities. The longitudinal framework developed here provides the structural mechanism underlying those findings: inner-ring suburban decline is not an anomaly or a policy failure confined to specific regions, but rather the predictable mature stage of the suburban life-course, a process set in motion the moment a new greenfield ring is opened beyond it.
Furthermore, applying this temporal typology to demographic data reveals a distinct pattern of succession (
Figure 6). Prewar Suburbs represent the first wave of streetcar-driven decentralization, a process traced in foundational detail by Warner [
4] and Jackson [
3]. These Prewar Suburbs, however, have long since been enveloped by subsequent metropolitan expansion. Today, these areas frequently function as legacy urban neighborhoods, with aging infrastructure and lower relative desirability compared to newer peripheral developments. Consequently, Prewar Suburbs have historically served as the most accessible suburban entry point for minority and immigrant populations, consistent with Alba and Logan’s findings on the differential pathways to suburban residence across racial and ethnic groups [
14].
The true mechanics of the suburban life-course, however, are most visible in the Mid-20th Century cohort. Postwar suburbanization has been framed almost exclusively through the lens of racial exclusion, and rightly so: Kruse [
15] demonstrates that these suburbs were built upon the deliberate displacement and exclusion of Black residents, a spatial logic further documented by Lichter, Parisi, and Taquino [
16] in their analysis of concentrated poverty and geographic exclusion.
Figure 6 initially confirms this exclusionary baseline, with a representation index of just 0.41 in 1970, meaning Black residents were less than half as represented in mid-century suburbs as their share of the national population would predict. Yet, tracking this area type longitudinally demonstrates that exclusionary origins do not dictate permanent trajectories. As the housing stock of Mid-Century Suburbs aged and depreciated relative to new greenfield construction, it underwent a profound demographic shift, with the Black population eventually reaching overrepresentation by 2020. Pattillo [
17] observes that Black suburban neighborhoods have historically occupied a precarious position, adjacent to impoverished areas and lacking the insulation of wealthier White suburbs. This vulnerability helps explain both why this transition occurs in older rings rather than newer ones, and why this transition does not necessarily lead to equity. Meanwhile, the parallel surge of foreign-born residents into these same aging rings resonates with, but also complicates, Li’s [
19] ethnoburb thesis: rather than bypassing the urban core to settle in new suburban developments, the foreign-born population documented here is concentrating heavily in
aging mid-century suburbs, suggesting that the ethnoburb formation is shaped not only by immigrant networks but by the filtering dynamics of the suburban housing market.
Ultimately, this differential rate of change across cohorts has resulted in a remarkable pattern of spatial succession. Consistent with Frey’s [
9] documentation of ongoing White demographic dominance in outer metropolitan rings, the White population is consistently overrepresented in the newest available greenfield developments. As this outward sorting persists, older suburban rings invariably filter down and open to wider demographic integration. This finding extends Kneebone and Berube’s [
18] work on the suburbanization of poverty: not only are poverty and disadvantage suburbanizing, but this study demonstrates that the process is tied to the built environment, concentrated specifically in the aging mid-century suburban cohort rather than distributed evenly across all non-core areas.
While the settlement typology described above was designed specifically for the United States, the underlying conceptual framework can be applied more broadly. By combining standardized longitudinal boundaries with high-resolution historical grids of the built environment, this methodology offers a blueprint for tracking spatial succession globally. For example, in countries characterized by decentralized, automobile-dependent development such as Canada and Australia, utilizing standardized small-area geographies enables researchers to closely examine the long-term socioeconomic trajectories of successive suburban rings and greenfield edges. Furthermore, in rapidly expanding metropolitan regions of Europe and Asia where development frequently bypasses political boundaries, this framework provides a rigorous approach to mapping the “peri-urban” fringe. Although stable populations outside of the urban core may be shaped by different political forces internationally, prioritizing built-environment density over administrative borders allows this methodology to successfully identify exurban areas across diverse global contexts.
While this framework provides a robust longitudinal perspective, certain methodological limitations must be acknowledged. First, the economic analysis relies on standardizing tract-level median household incomes against the national average to track spatial sorting over time. While this successfully isolates the relative concentration of wealth within metropolitan areas, it relies on nominal income figures. It does not account for the substantial regional variations in the cost of living, nor does it factor in the localized cost of housing, which often dictates residential sorting. Consequently, the actual purchasing power and real economic standing of households in older cores versus expanding peripheries may exhibit different gradients than those captured by nominal standardization alone. Reevaluating these economic trajectories with localized cost-of-living adjustments represents a necessary next step. Furthermore, while this study establishes a macro-level national baseline, it does not explore regional variations in suburban morphology. As Terbeck’s evaluation of suburban classification methods demonstrates [
11], the performance of density-based definitions varies significantly by region, and disaggregating this national framework to analyze Northeast, Midwest, South, and West patterns separately offers a critical avenue for future detailed analysis.
6. Conclusions
Over the past eighty years, the American metropolis has been fundamentally remapped. By anchoring a settlement typology not just in static density, but in the historical timeline of development, this study quantifies the profound spatial and demographic decentralization of the United States. The methodology reveals a landscape defined by an enduring core-periphery density gradient, where successive eras of transportation technology drove the outward expansion of the suburbs. This shifting landscape brought about a stark demographic sorting. While the newest, lowest-density fringes became enclaves of high-income, highly educated, and predominantly White populations, core areas and older suburbs became destinations for Black and foreign-born populations.
Uncovering these long-term morphological and demographic trajectories is only possible through the application of consistent, long-term spatial data. The HHUUD10 and LTDB datasets were essential to this research. By maintaining constant 2010 census tract boundaries across decades, these datasets allow researchers to analyze the changes in American spatial patterns with unprecedented clarity.
While the HHUUD10 and LTDB datasets are limited to a specific set of geographic boundaries, the IPUMS full count microdata files and the HISDAC-US grid cell data offer immense potential for mapping the early twentieth-century city and for applying this methodological approach more broadly. However, both datasets currently contain critical gaps that limit their spatial application. The IPUMS historical files identify respondents at the enumeration district level, but the boundaries of those districts have not yet been digitized, making small-area spatial analysis impossible at the national scale. Conversely, while HISDAC-US provides information about the historical built environment at a fine geographic level, it suffers from survivorship bias. Because it relies on modern property records to map historical structures, it is often missing historical information, especially dense downtown cores and minority neighborhoods that were systematically demolished during mid-century urban renewal and highway construction.
Overcoming these historical data limitations represents the next great challenge for the discipline. Filling the physical gaps in the HISDAC-US built environment could be achieved through systematically digitizing resources such as Sanborn Fire Insurance Maps, or by crowdsourcing municipal history and archival demolition records to reconstruct the records of the historic built environment. Simultaneously, if historical enumeration district boundaries were systematically digitized and linked to current geographies, the geographic detail already present in IPUMS full count files could be fully utilized, drastically reducing the need for spatial imputation in studies like this one.
The ultimate promise of filling these gaps is profound. With a fully integrated, geographically precise historical record, the methodology developed in this study would no longer be constrained by 2010 tract boundaries or 1940 baselines. It offers the potential to dynamically map the morphological settlement type of any geographic unit, at any scale, at any point in American history, providing a truly universal framework for understanding how the built environment shapes human populations.