The Impact of Temperature on Visitation Rate, Thermal Sensation, and Satisfaction Levels in Urban Parks in a Hot Summer



Abstract
1. Introduction
Research Objectives
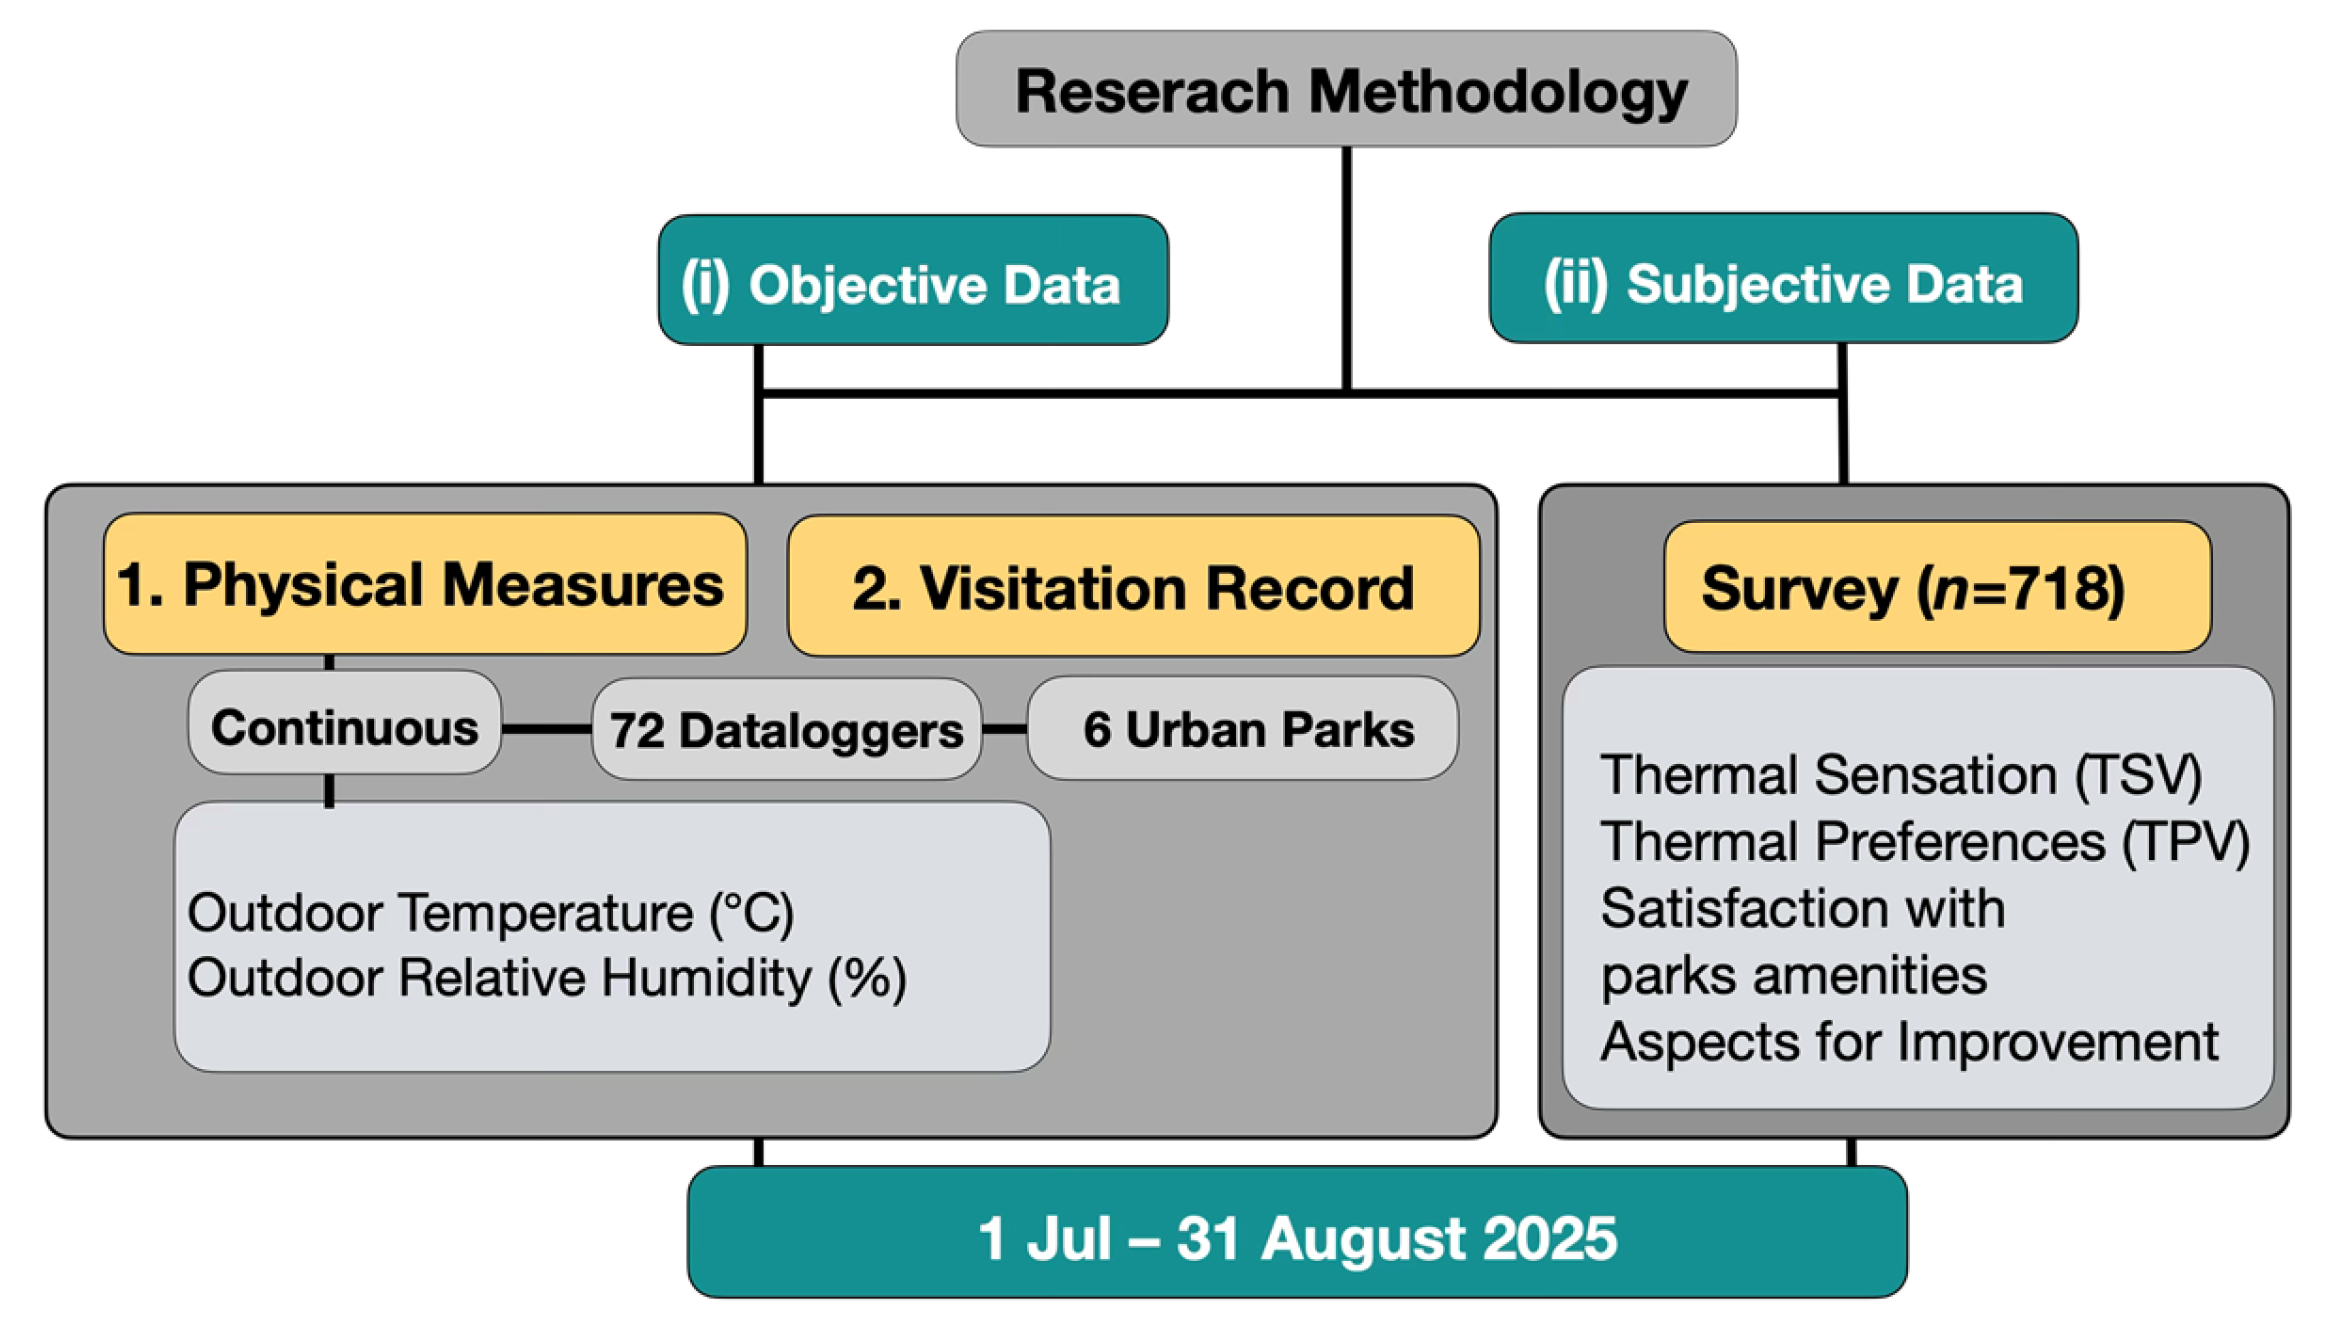
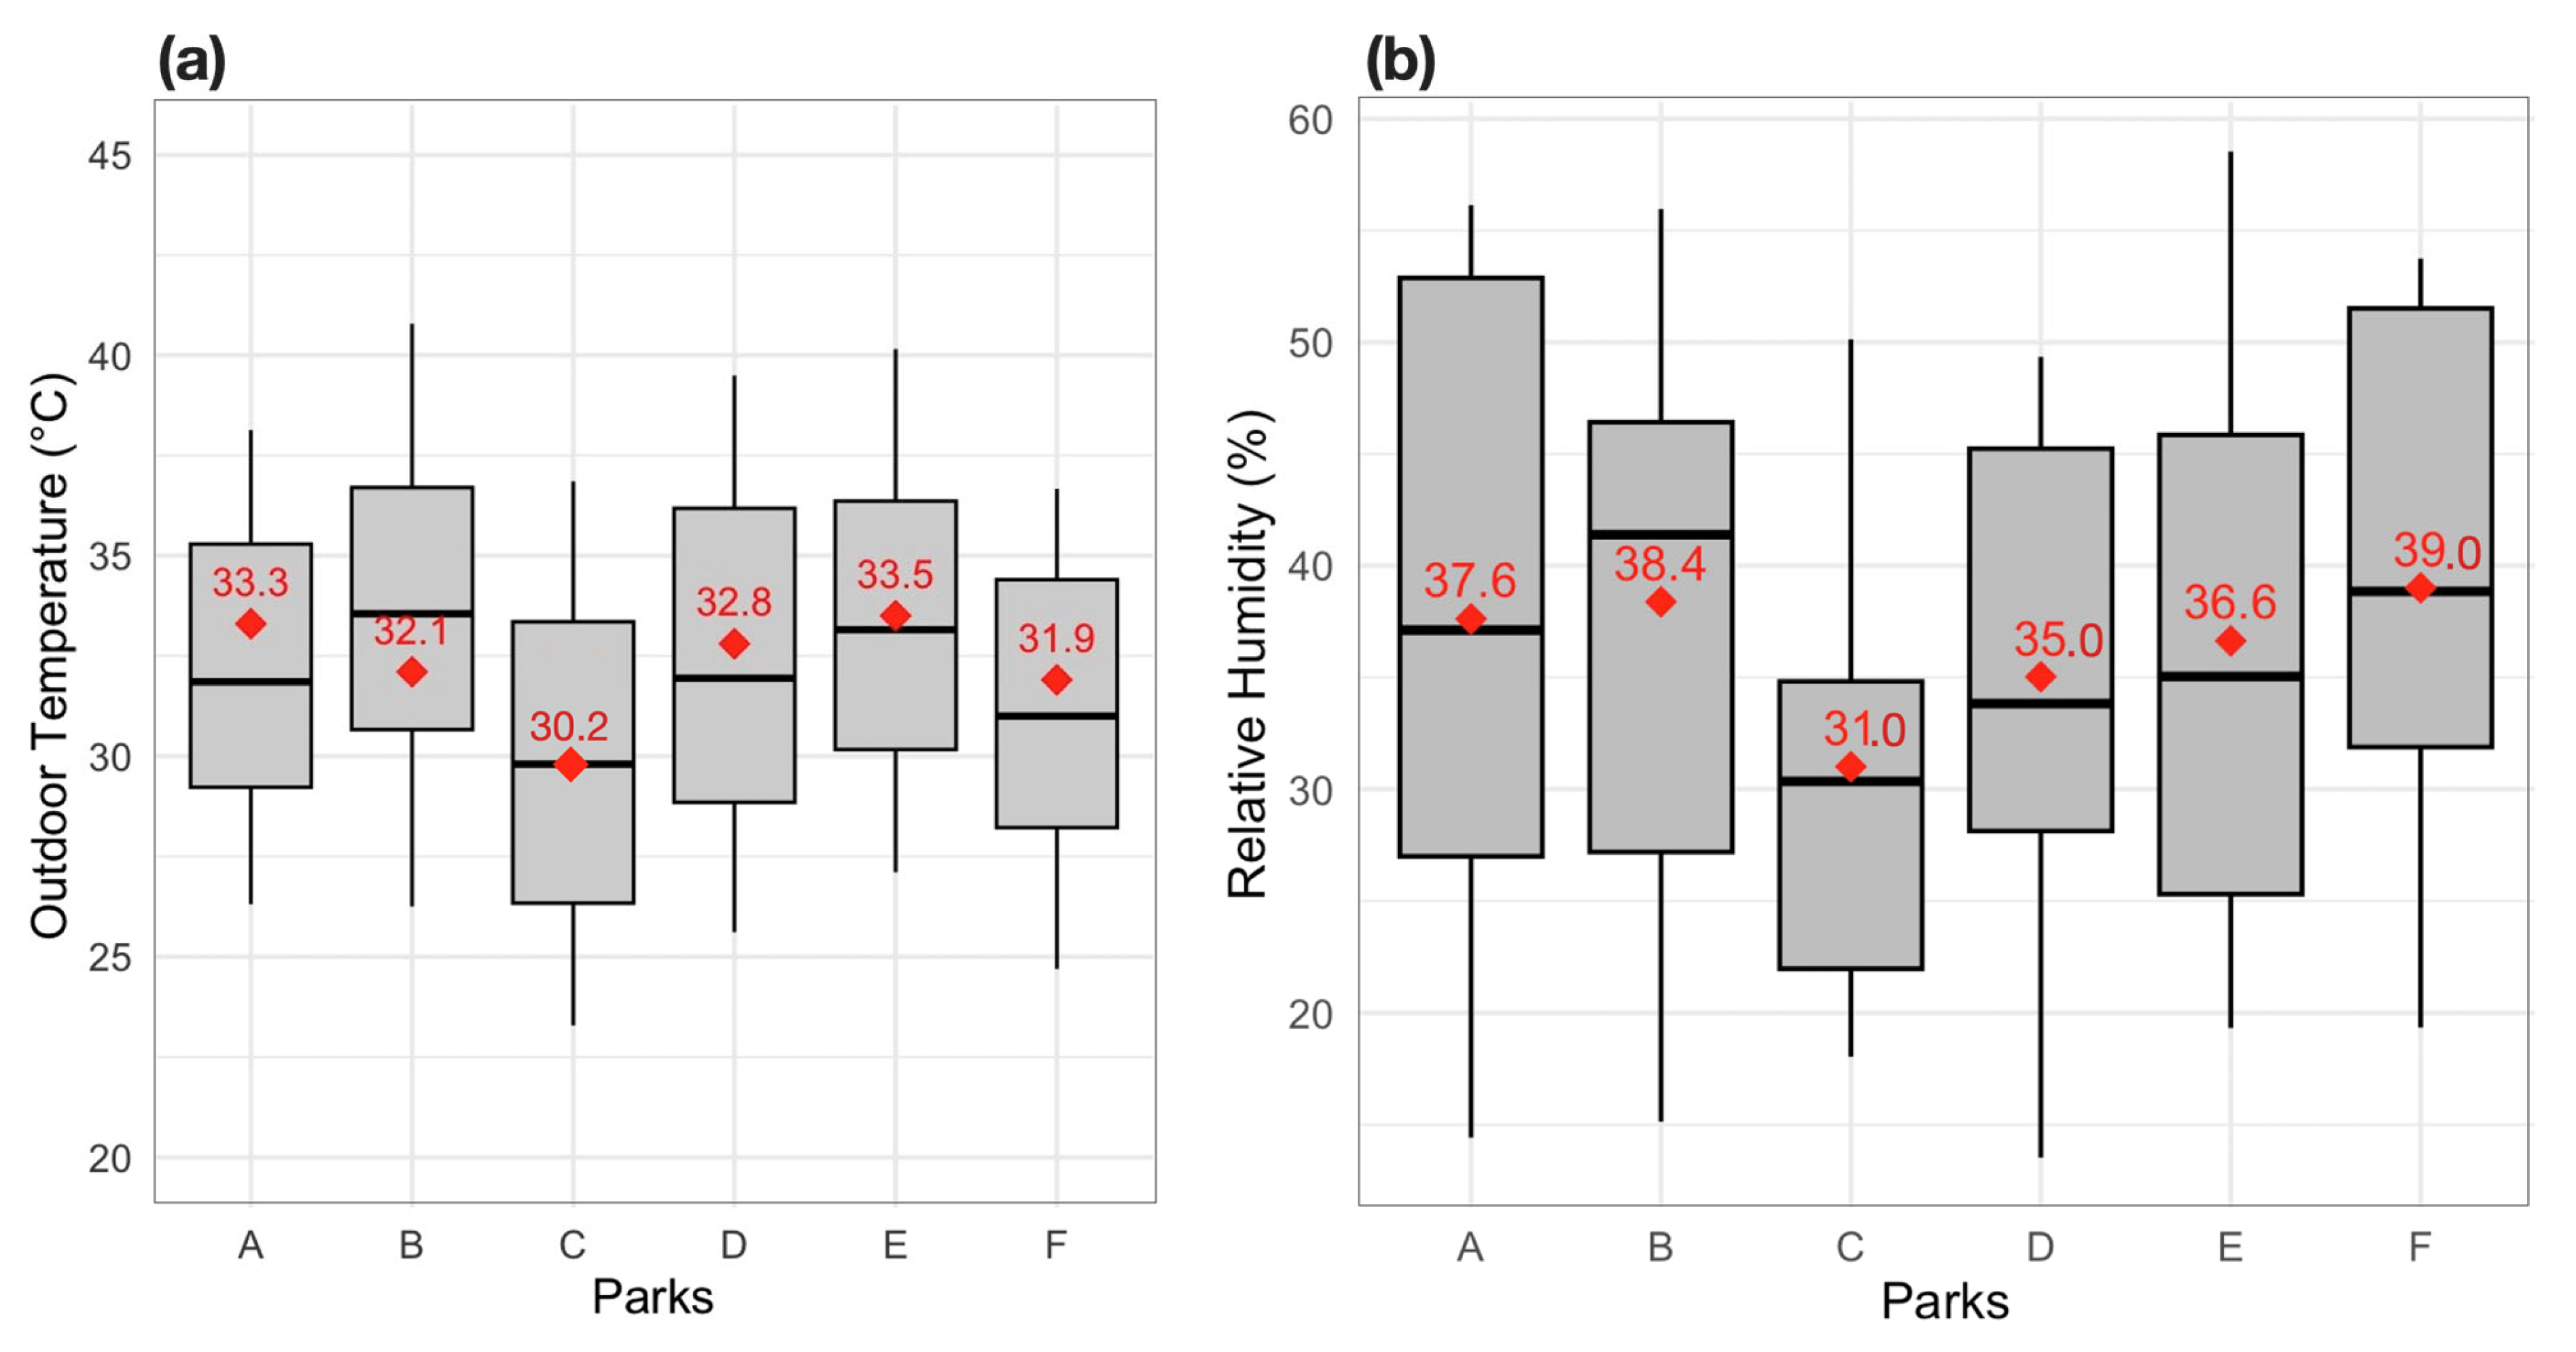
- To assess outdoor thermal conditions (i.e., temperature and relative humidity) and users’ thermal sensation in Amman’s urban parks during the summer.
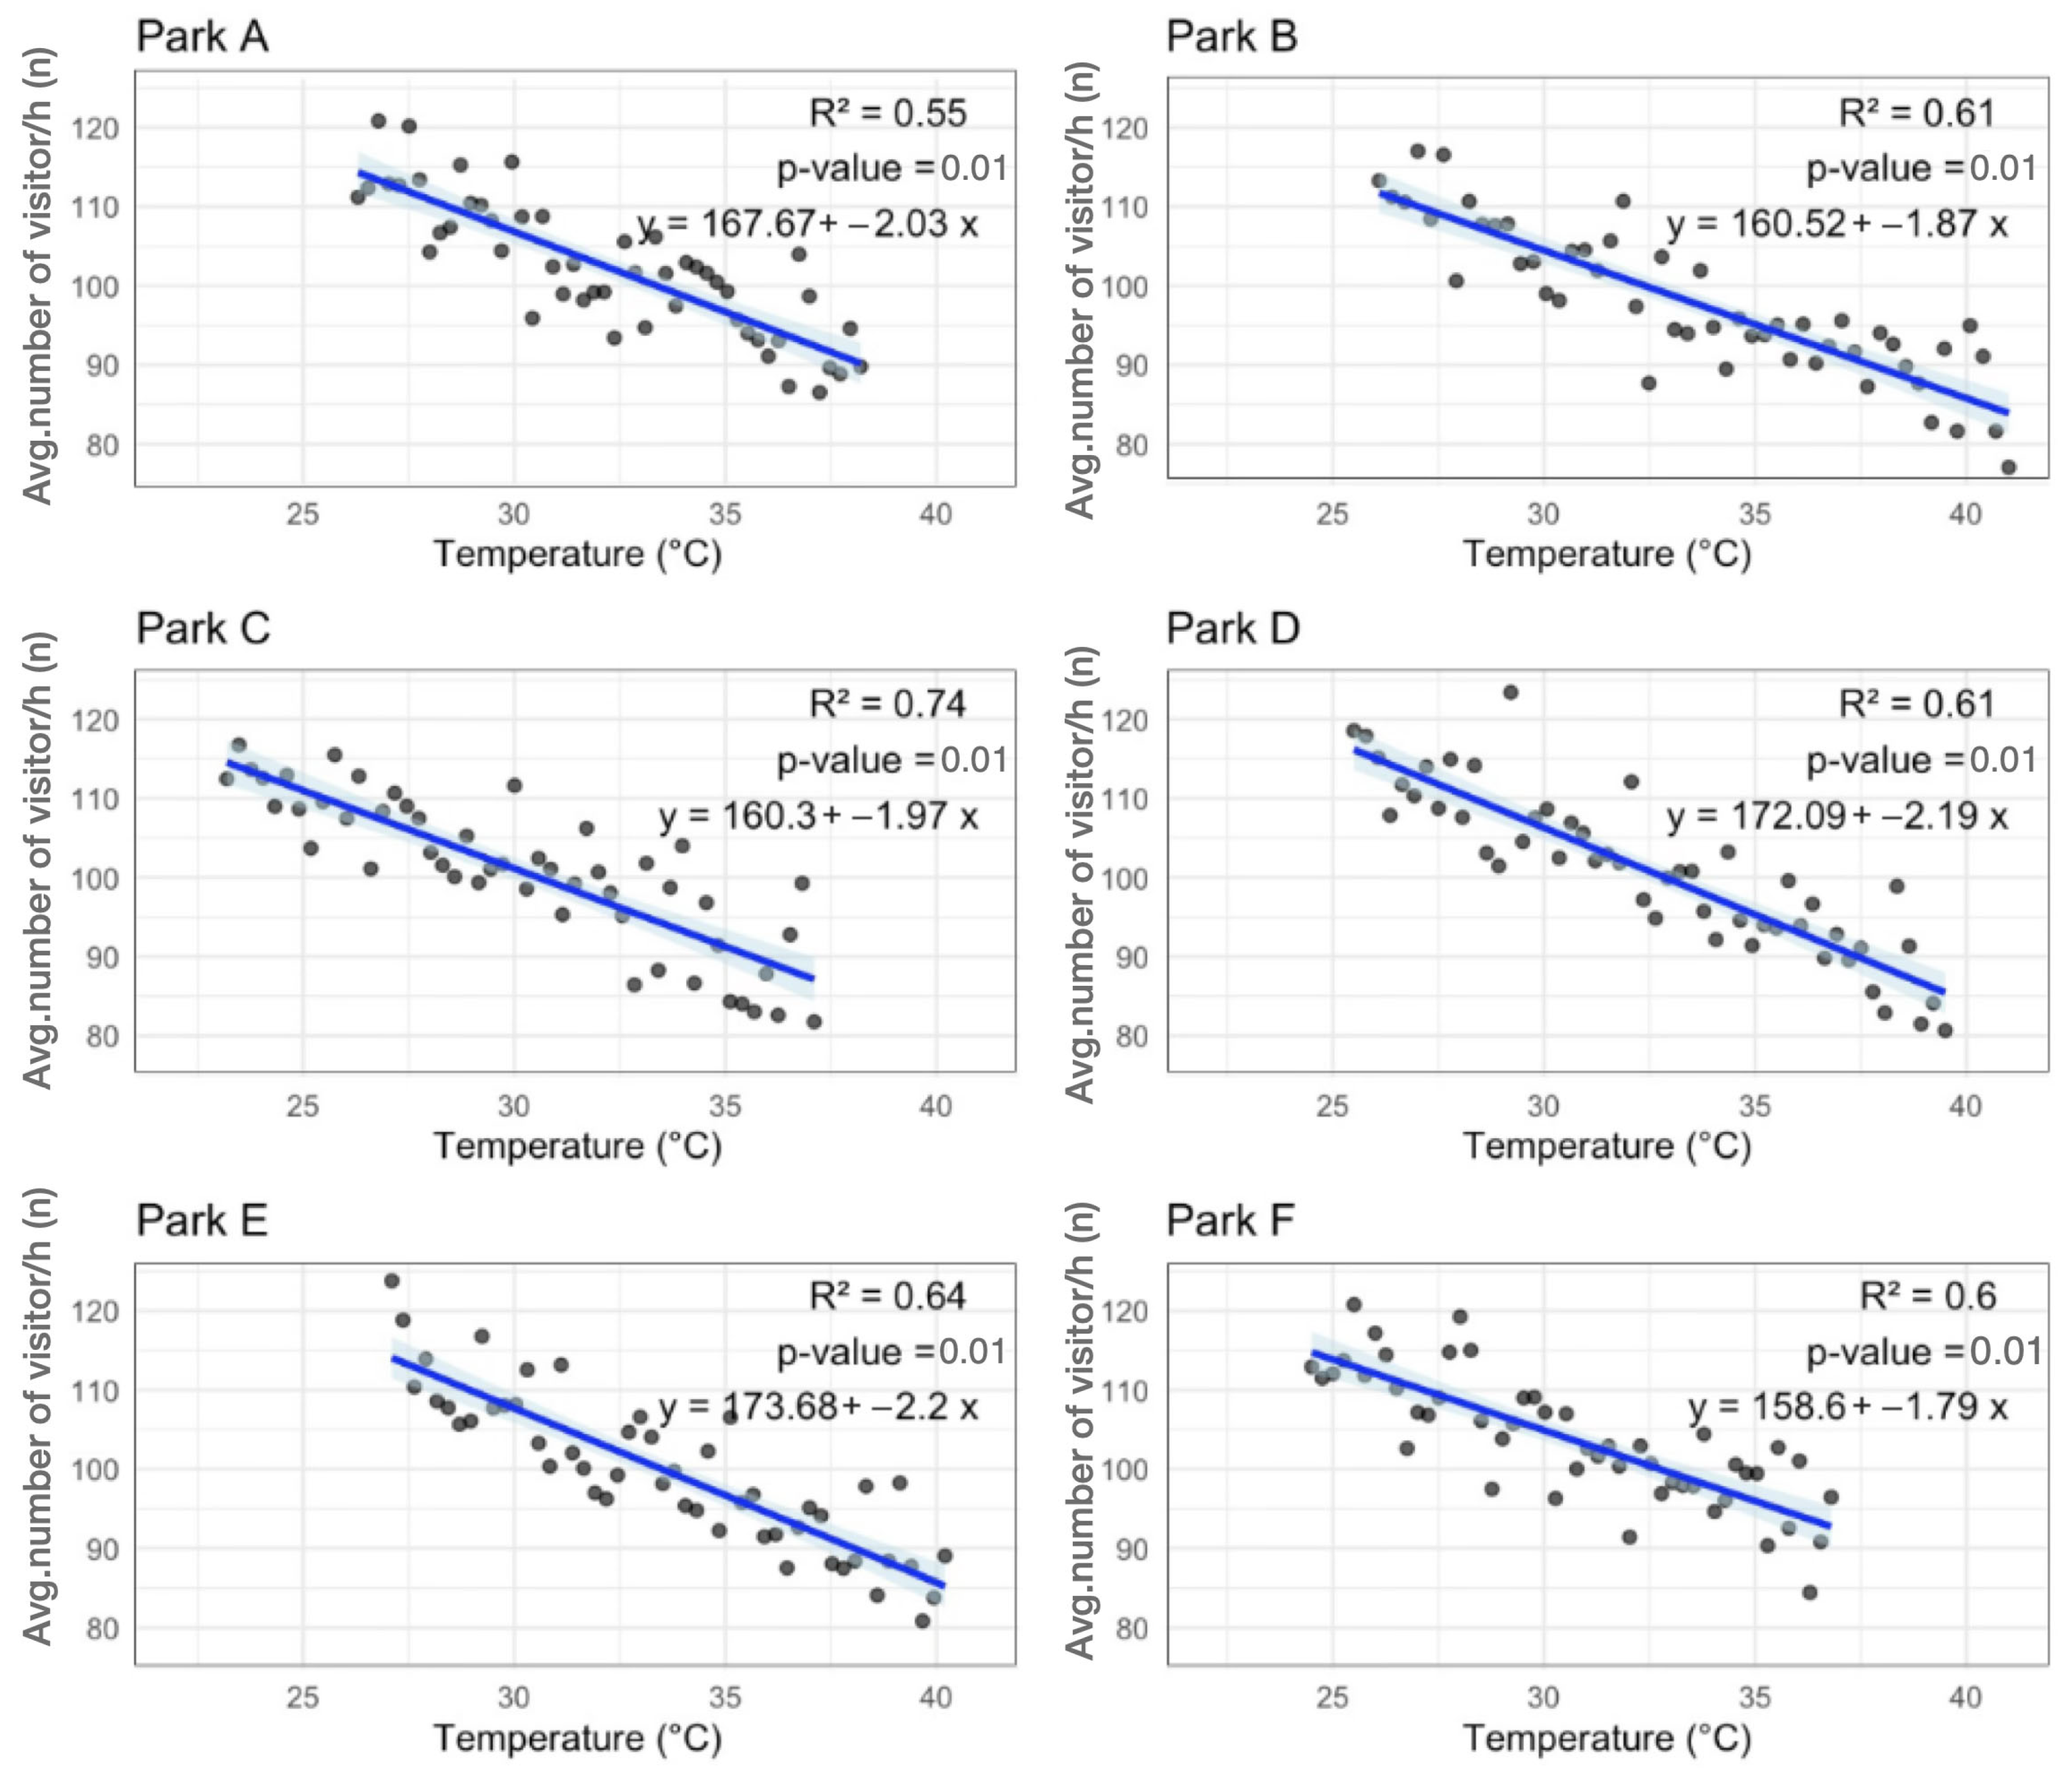
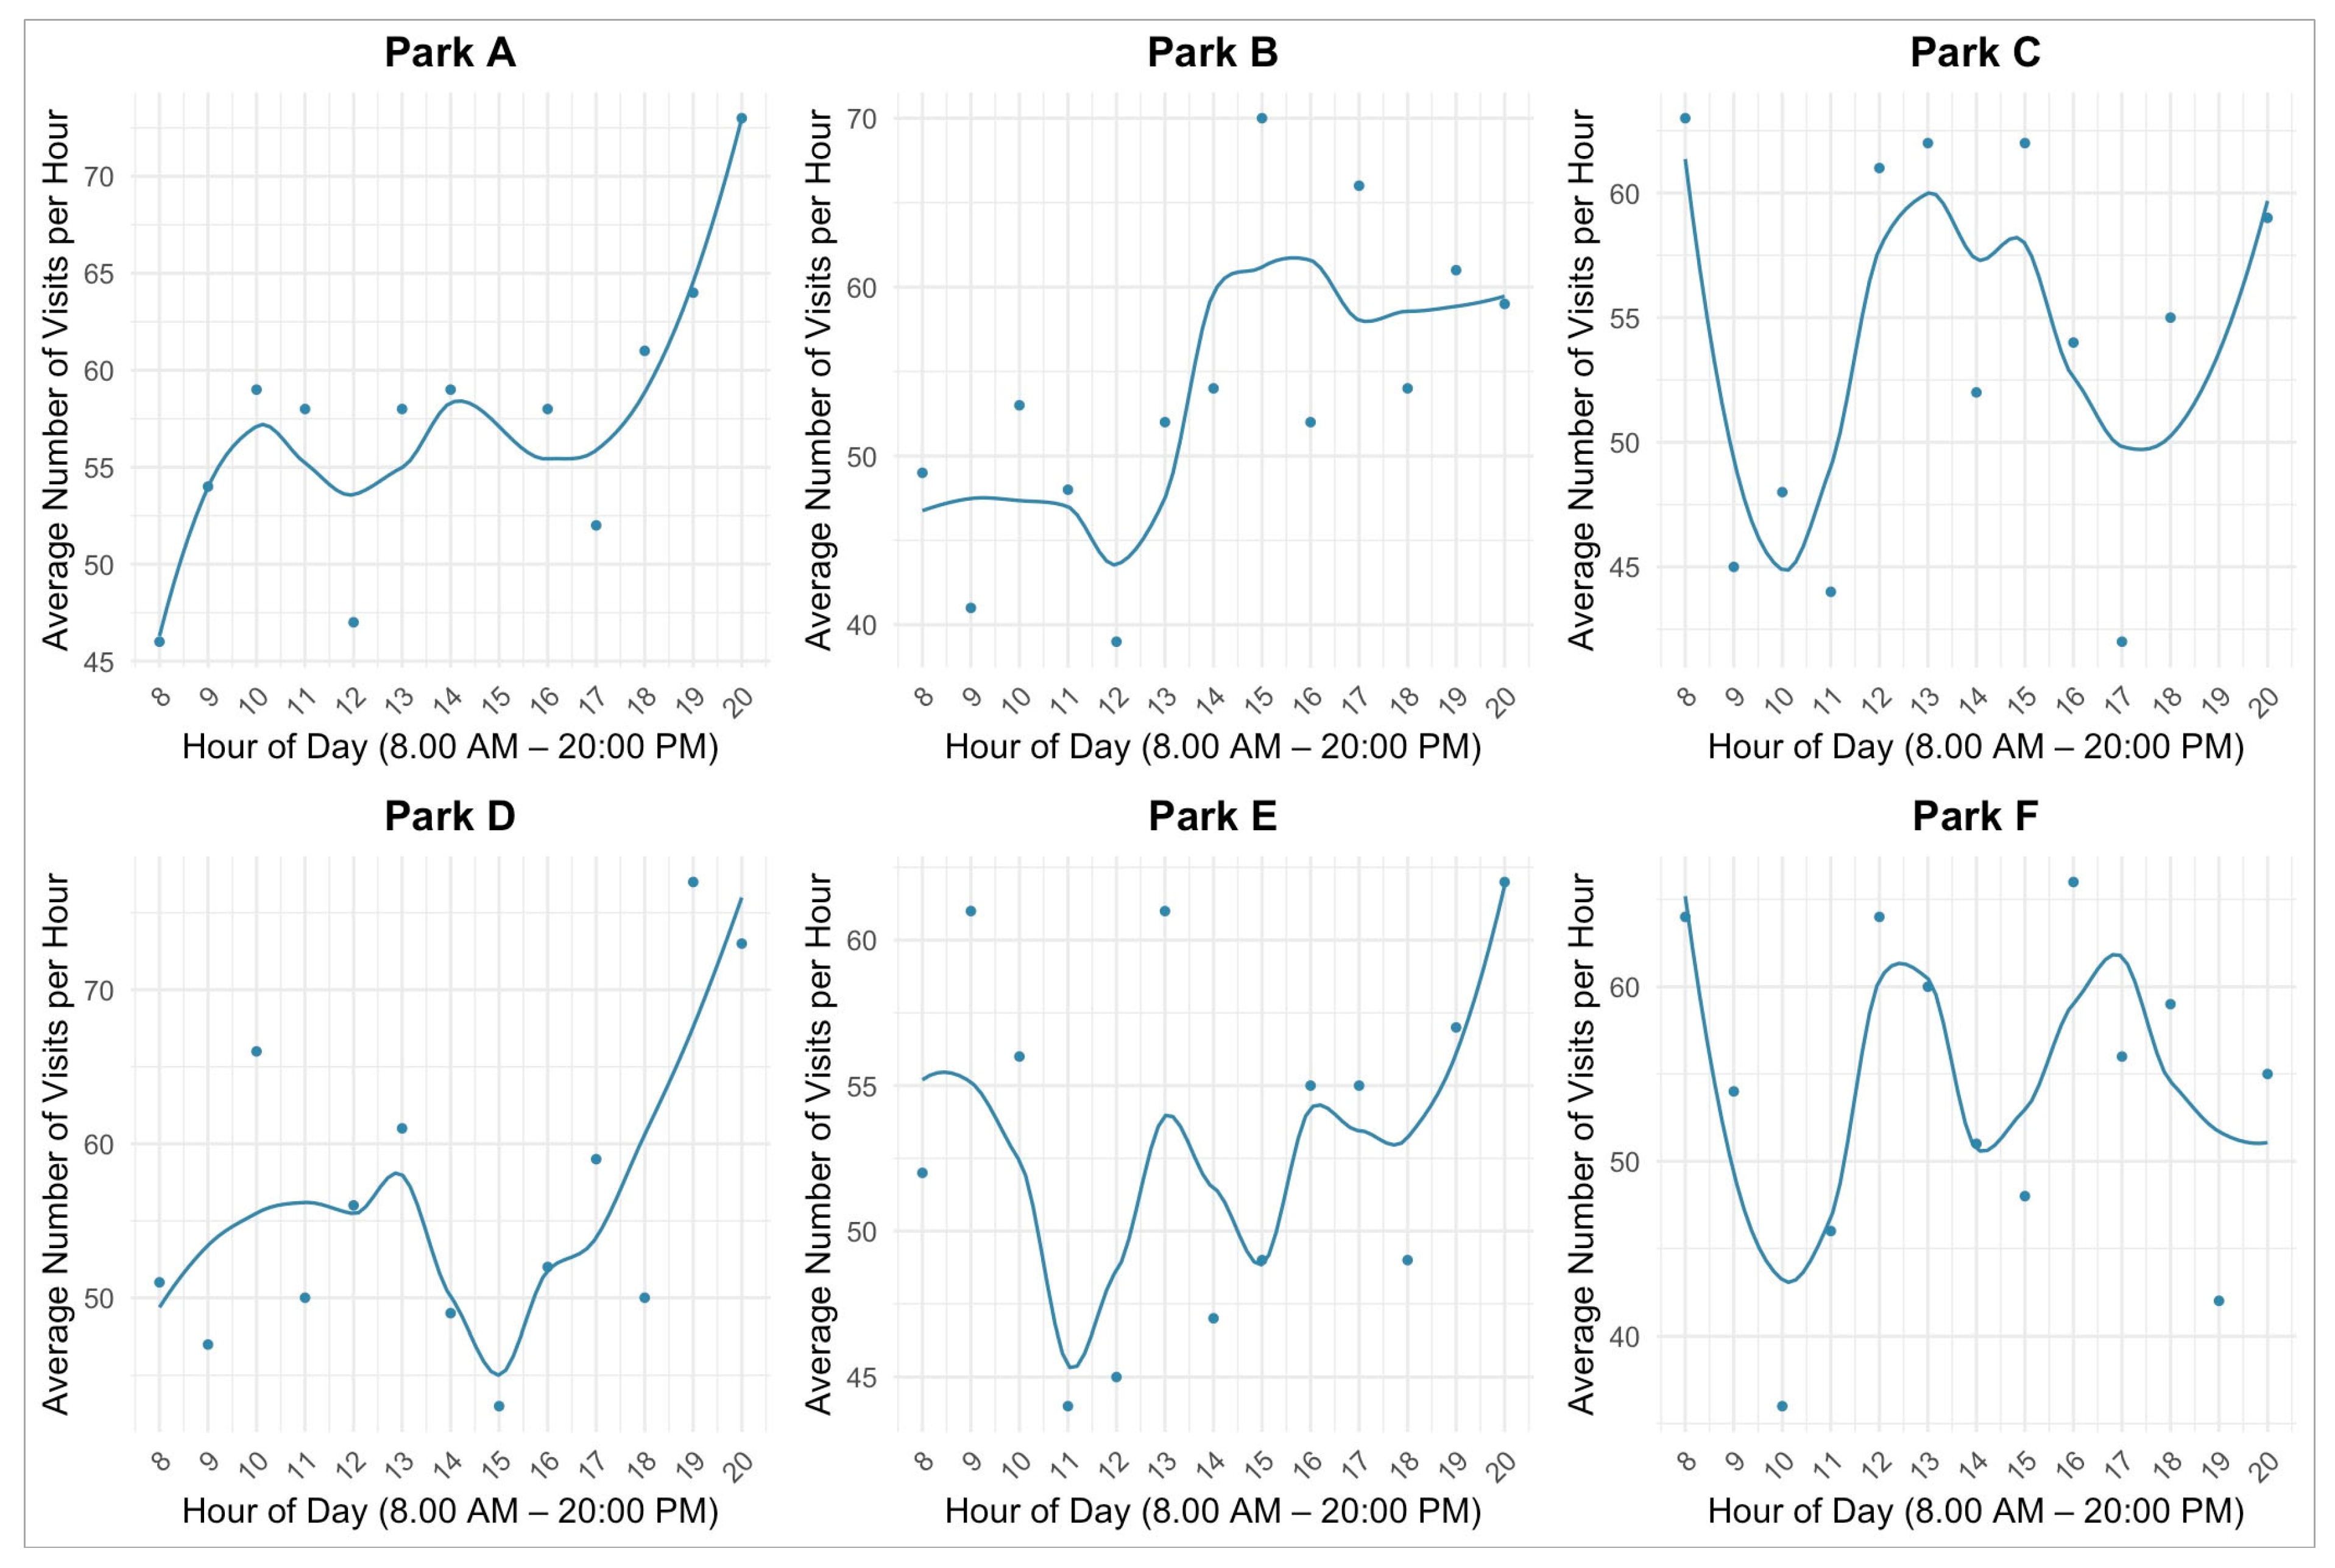
- To examine the link between outdoor temperature and park visitation rate during the heat days.
- To evaluate users’ satisfaction levels with the amenities of urban parks and to investigate the limitations on visiting urban parks in Amman, Jordan.
2. Study Context
3. Methods and Materials
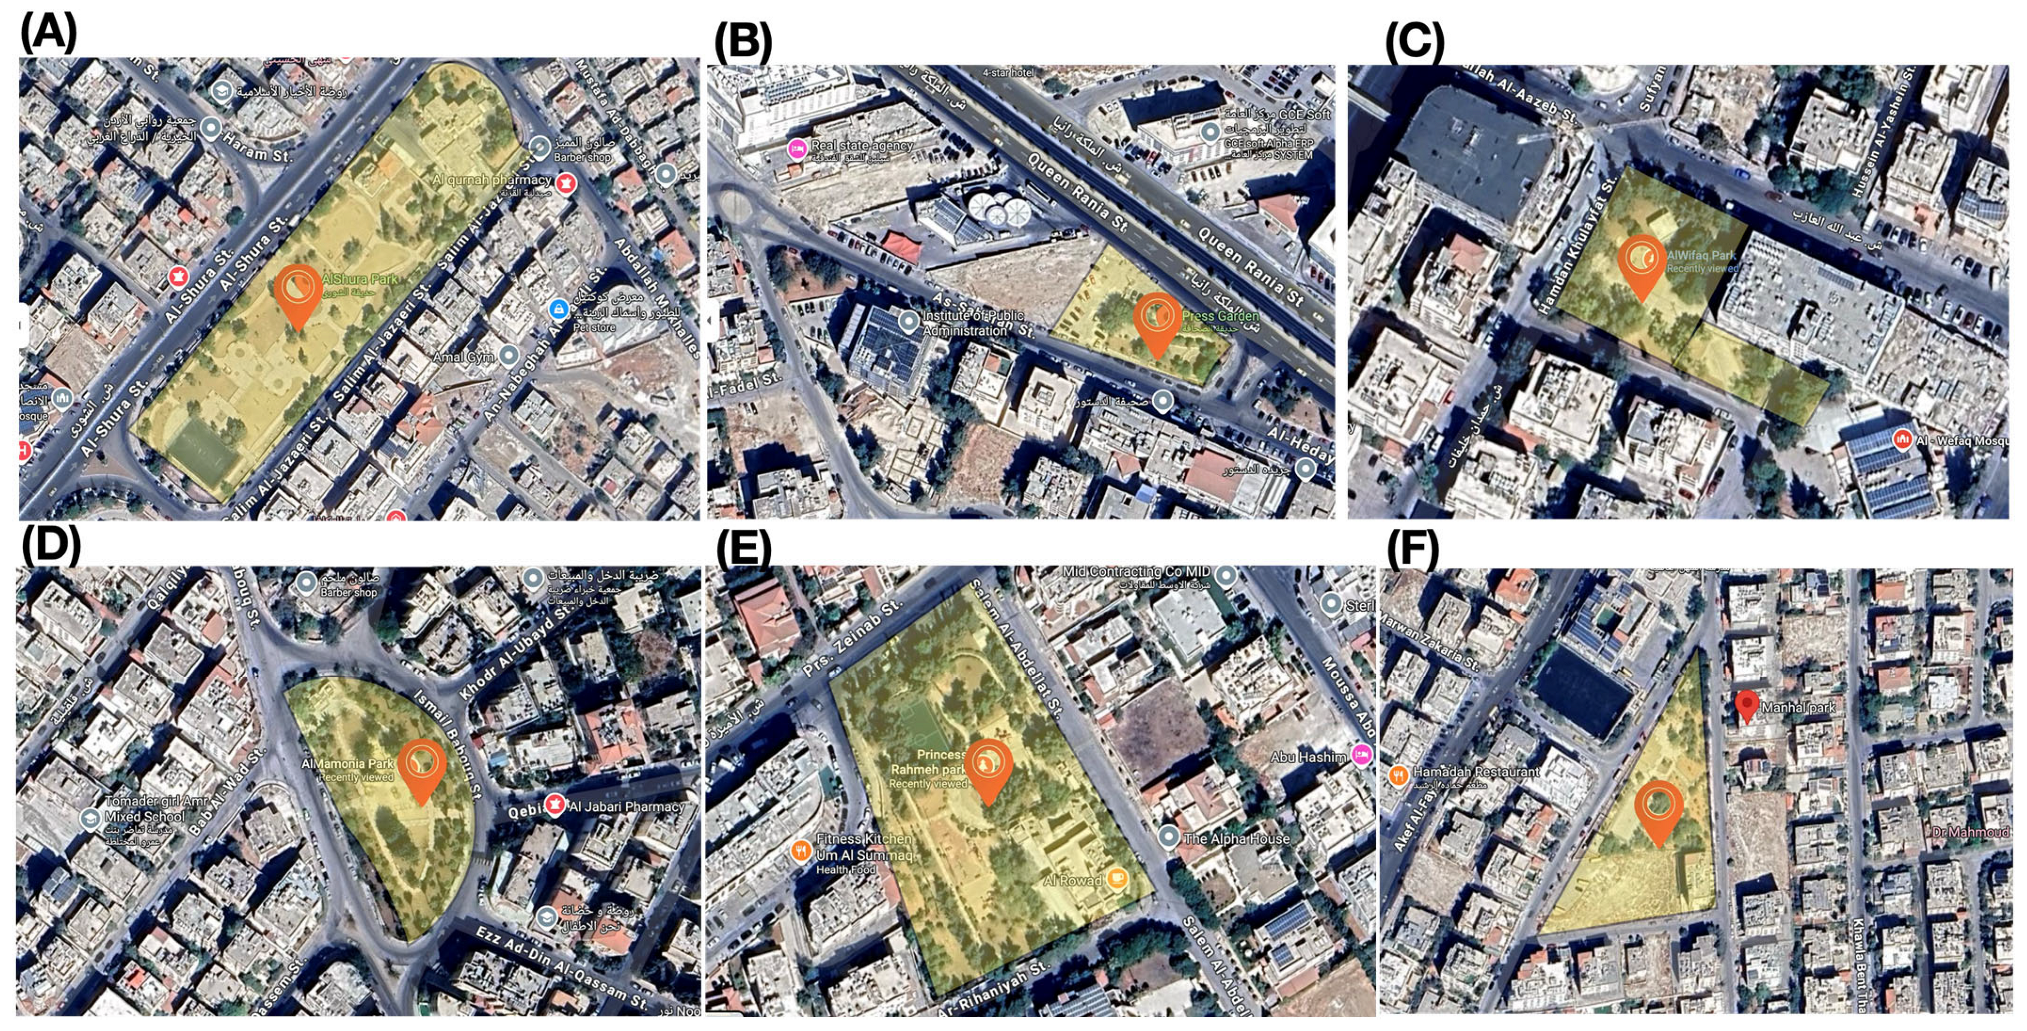
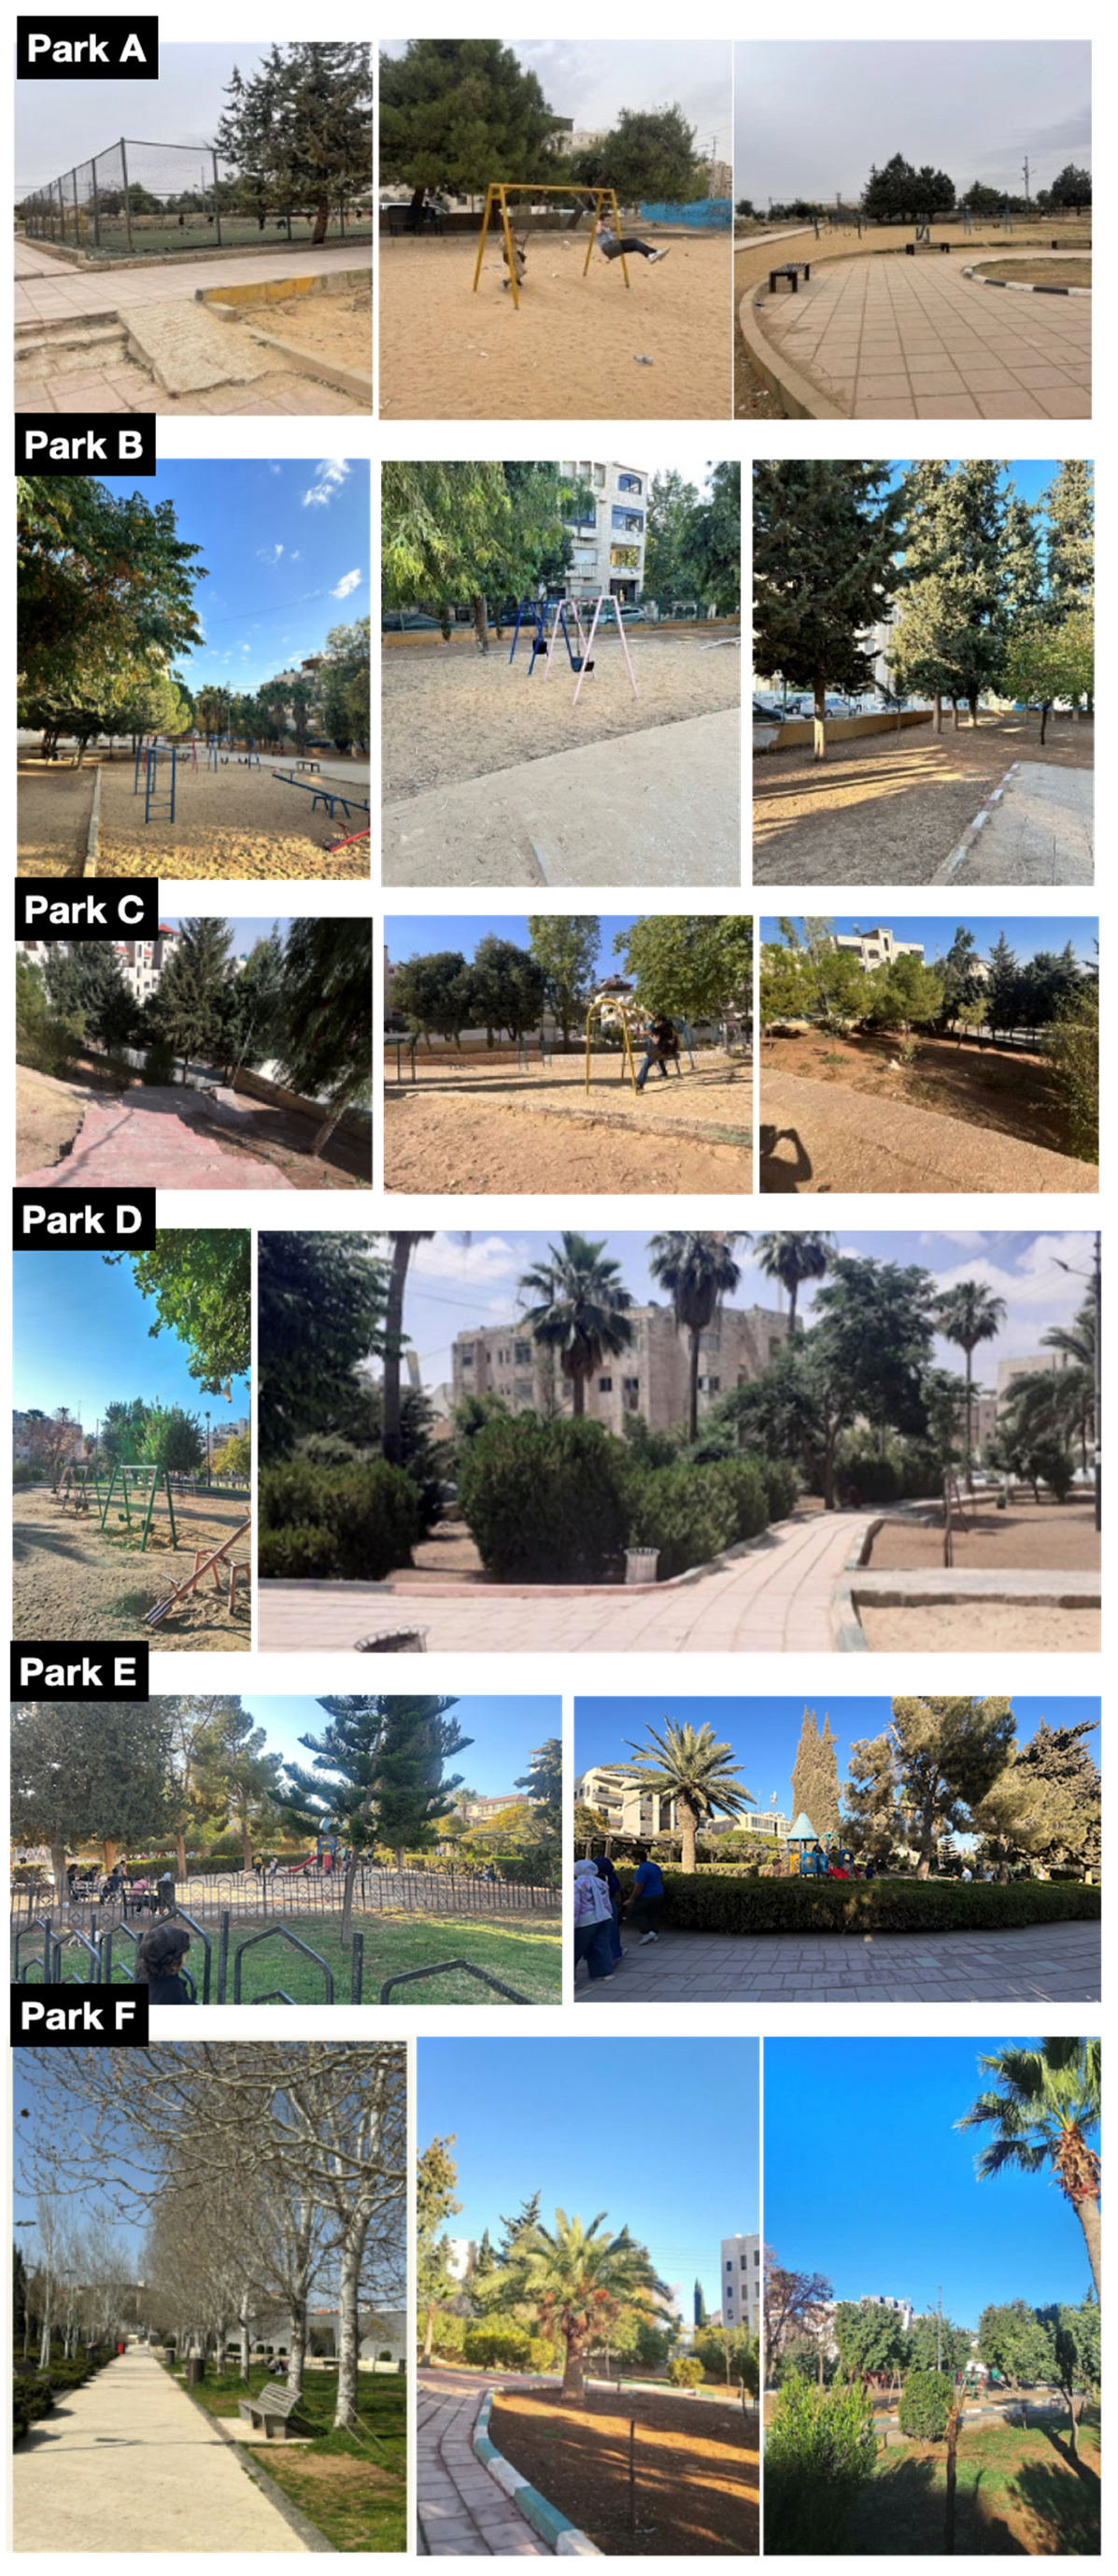
3.1. Urban Parks Selection
3.2. Monitoring of Outdoor Thermal Conditions
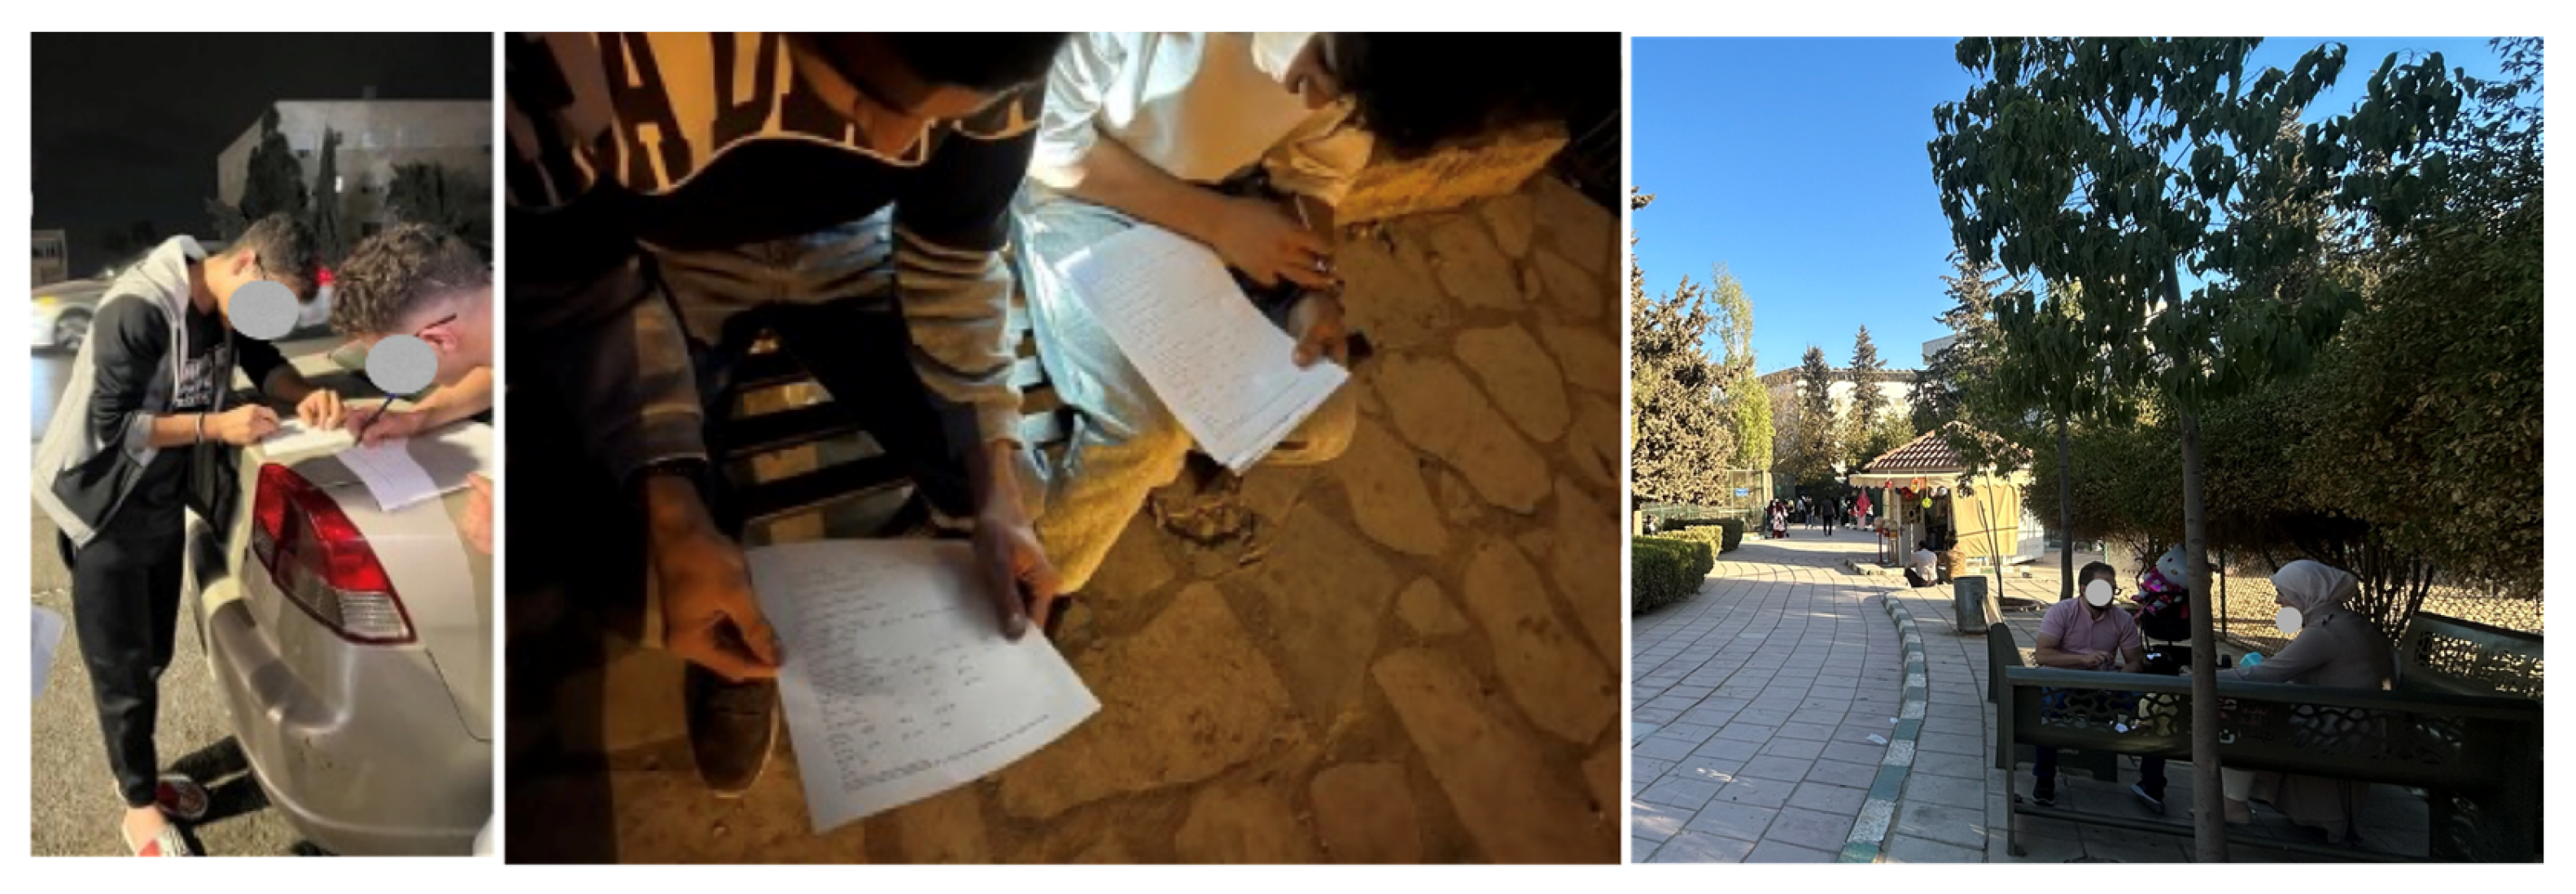
3.3. Survey Design
- The socio-demographic characteristics of the park visitor sample were assessed using 10 items. These included measures of gender, age, education level, employment status, having children, distance between home and the visited park, nationality, marital status, household income level, and disability status.
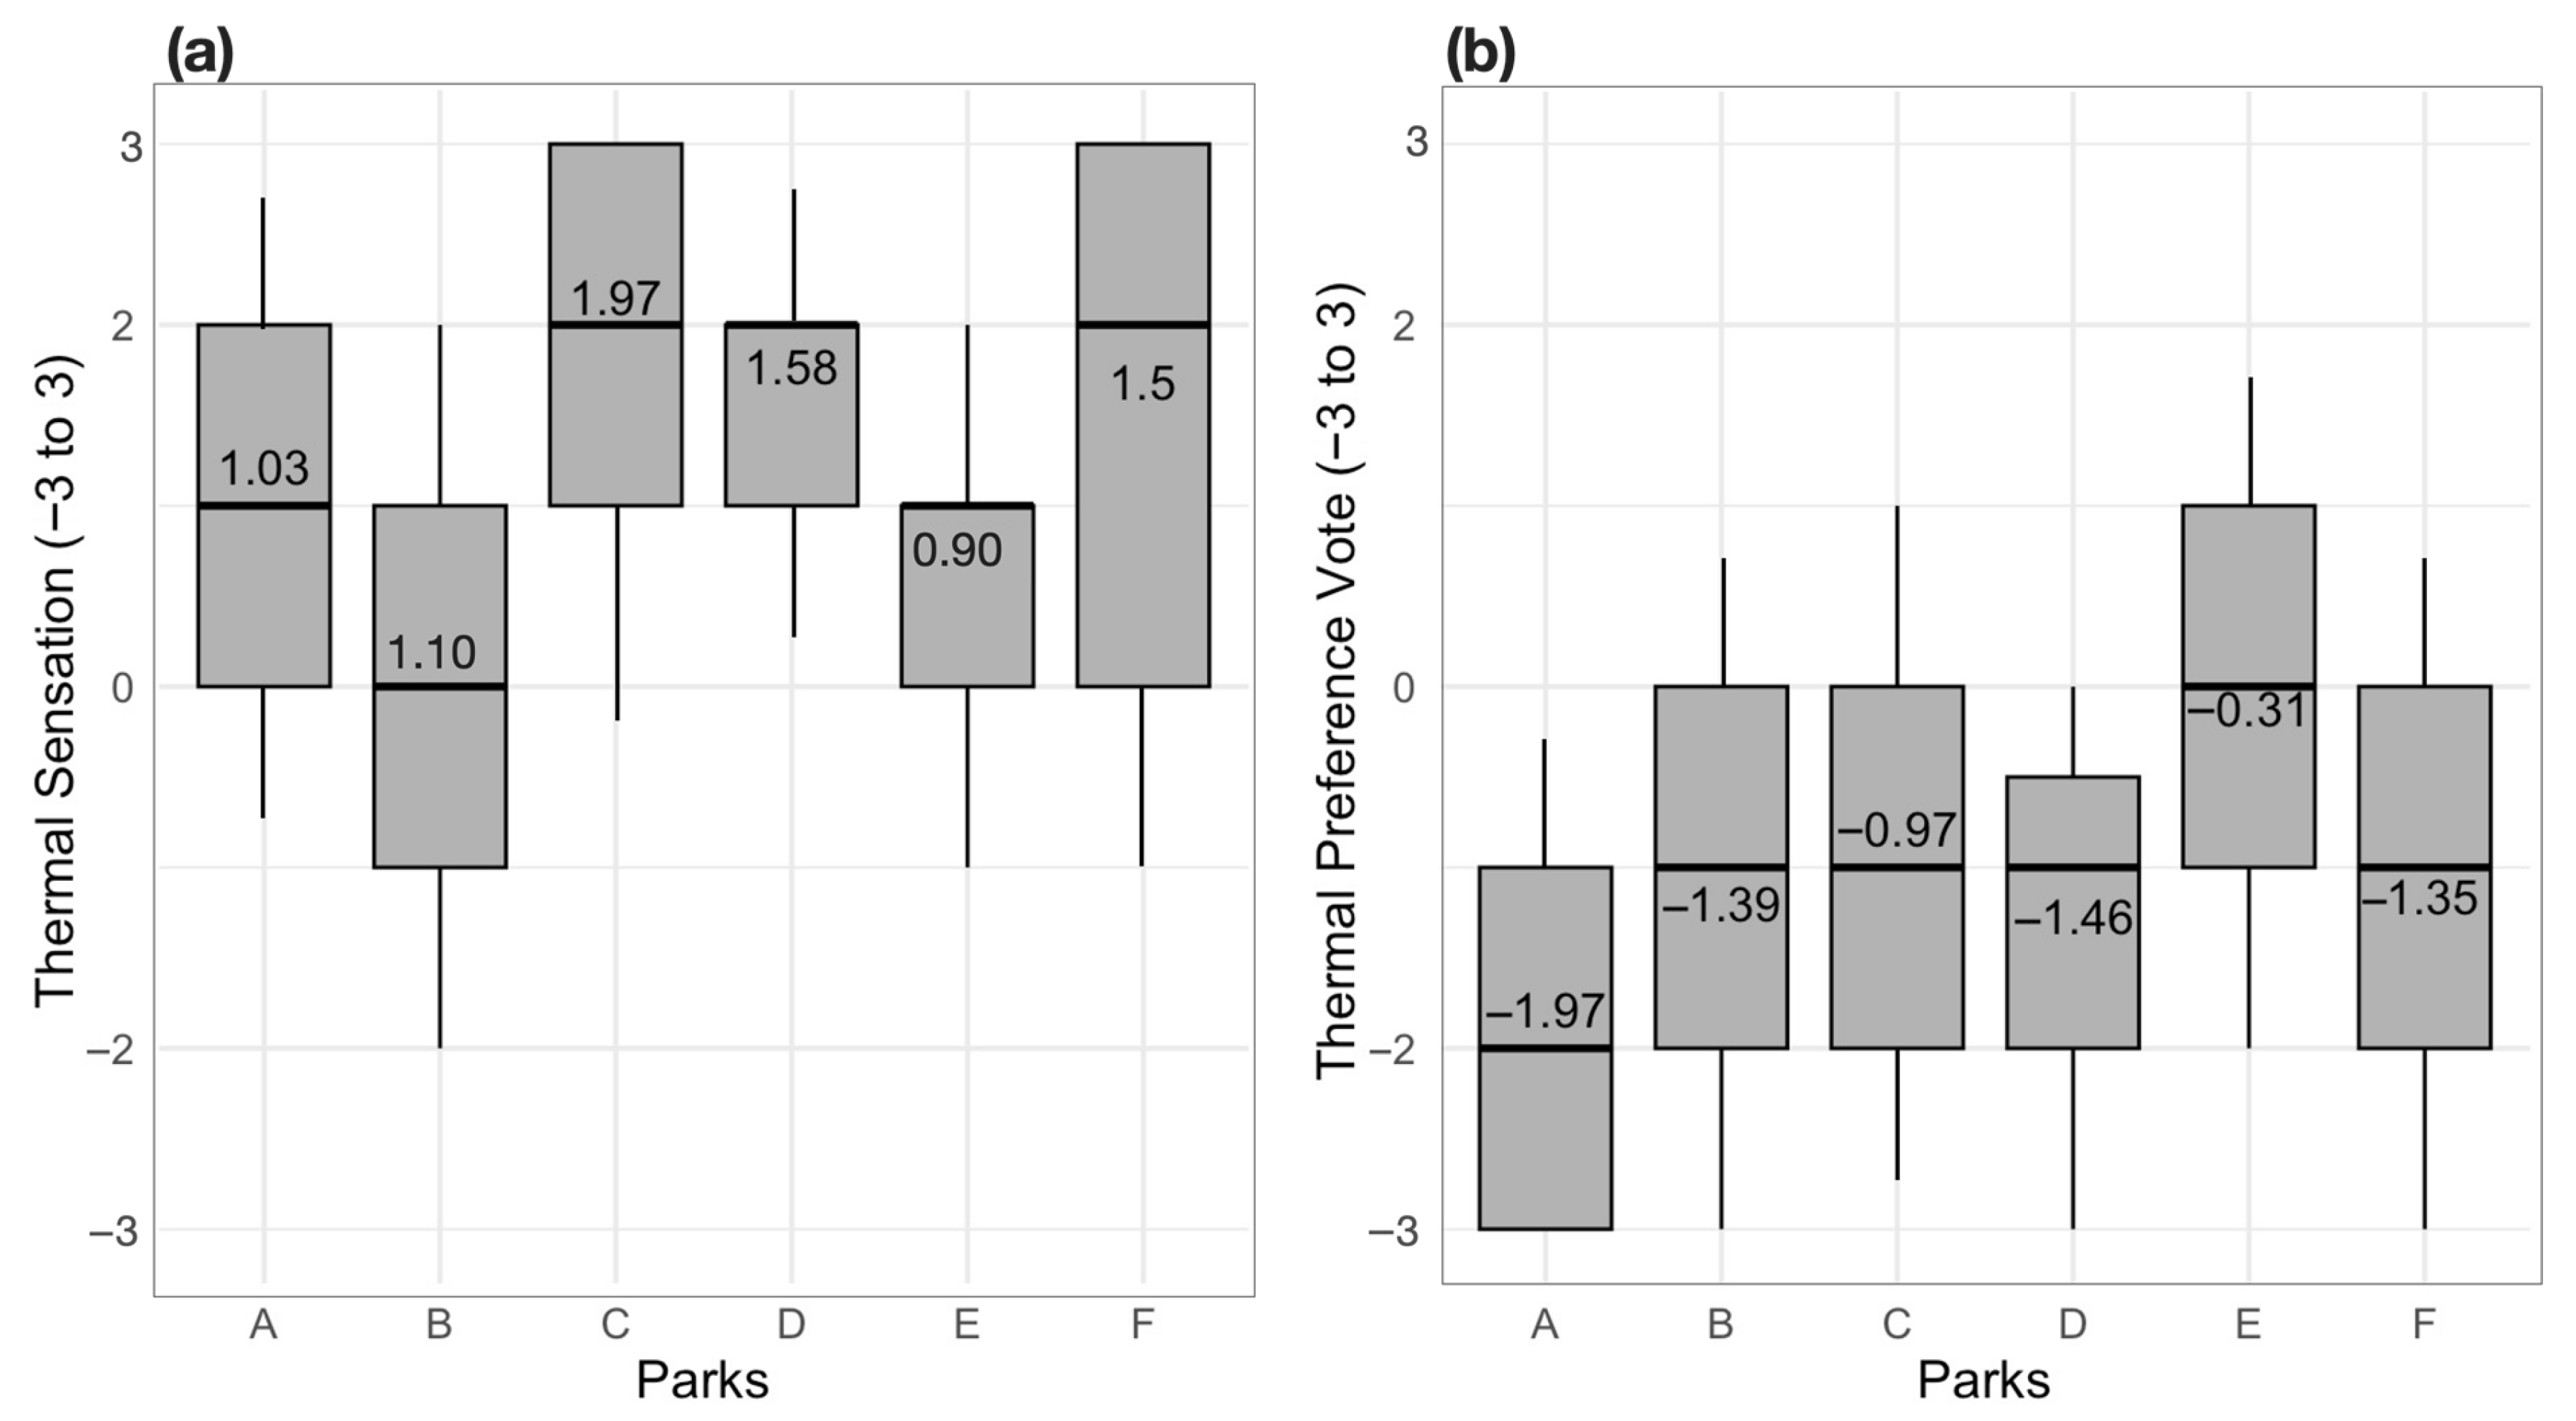
- Thermal sensation votes (TSV) and thermal preference votes (TPV) of participants were assessed using the ASHRAE-55 scale, which ranges from −3 to 3, where −3 denotes a sensation of cold, and 3 indicates a sensation of heat [65].
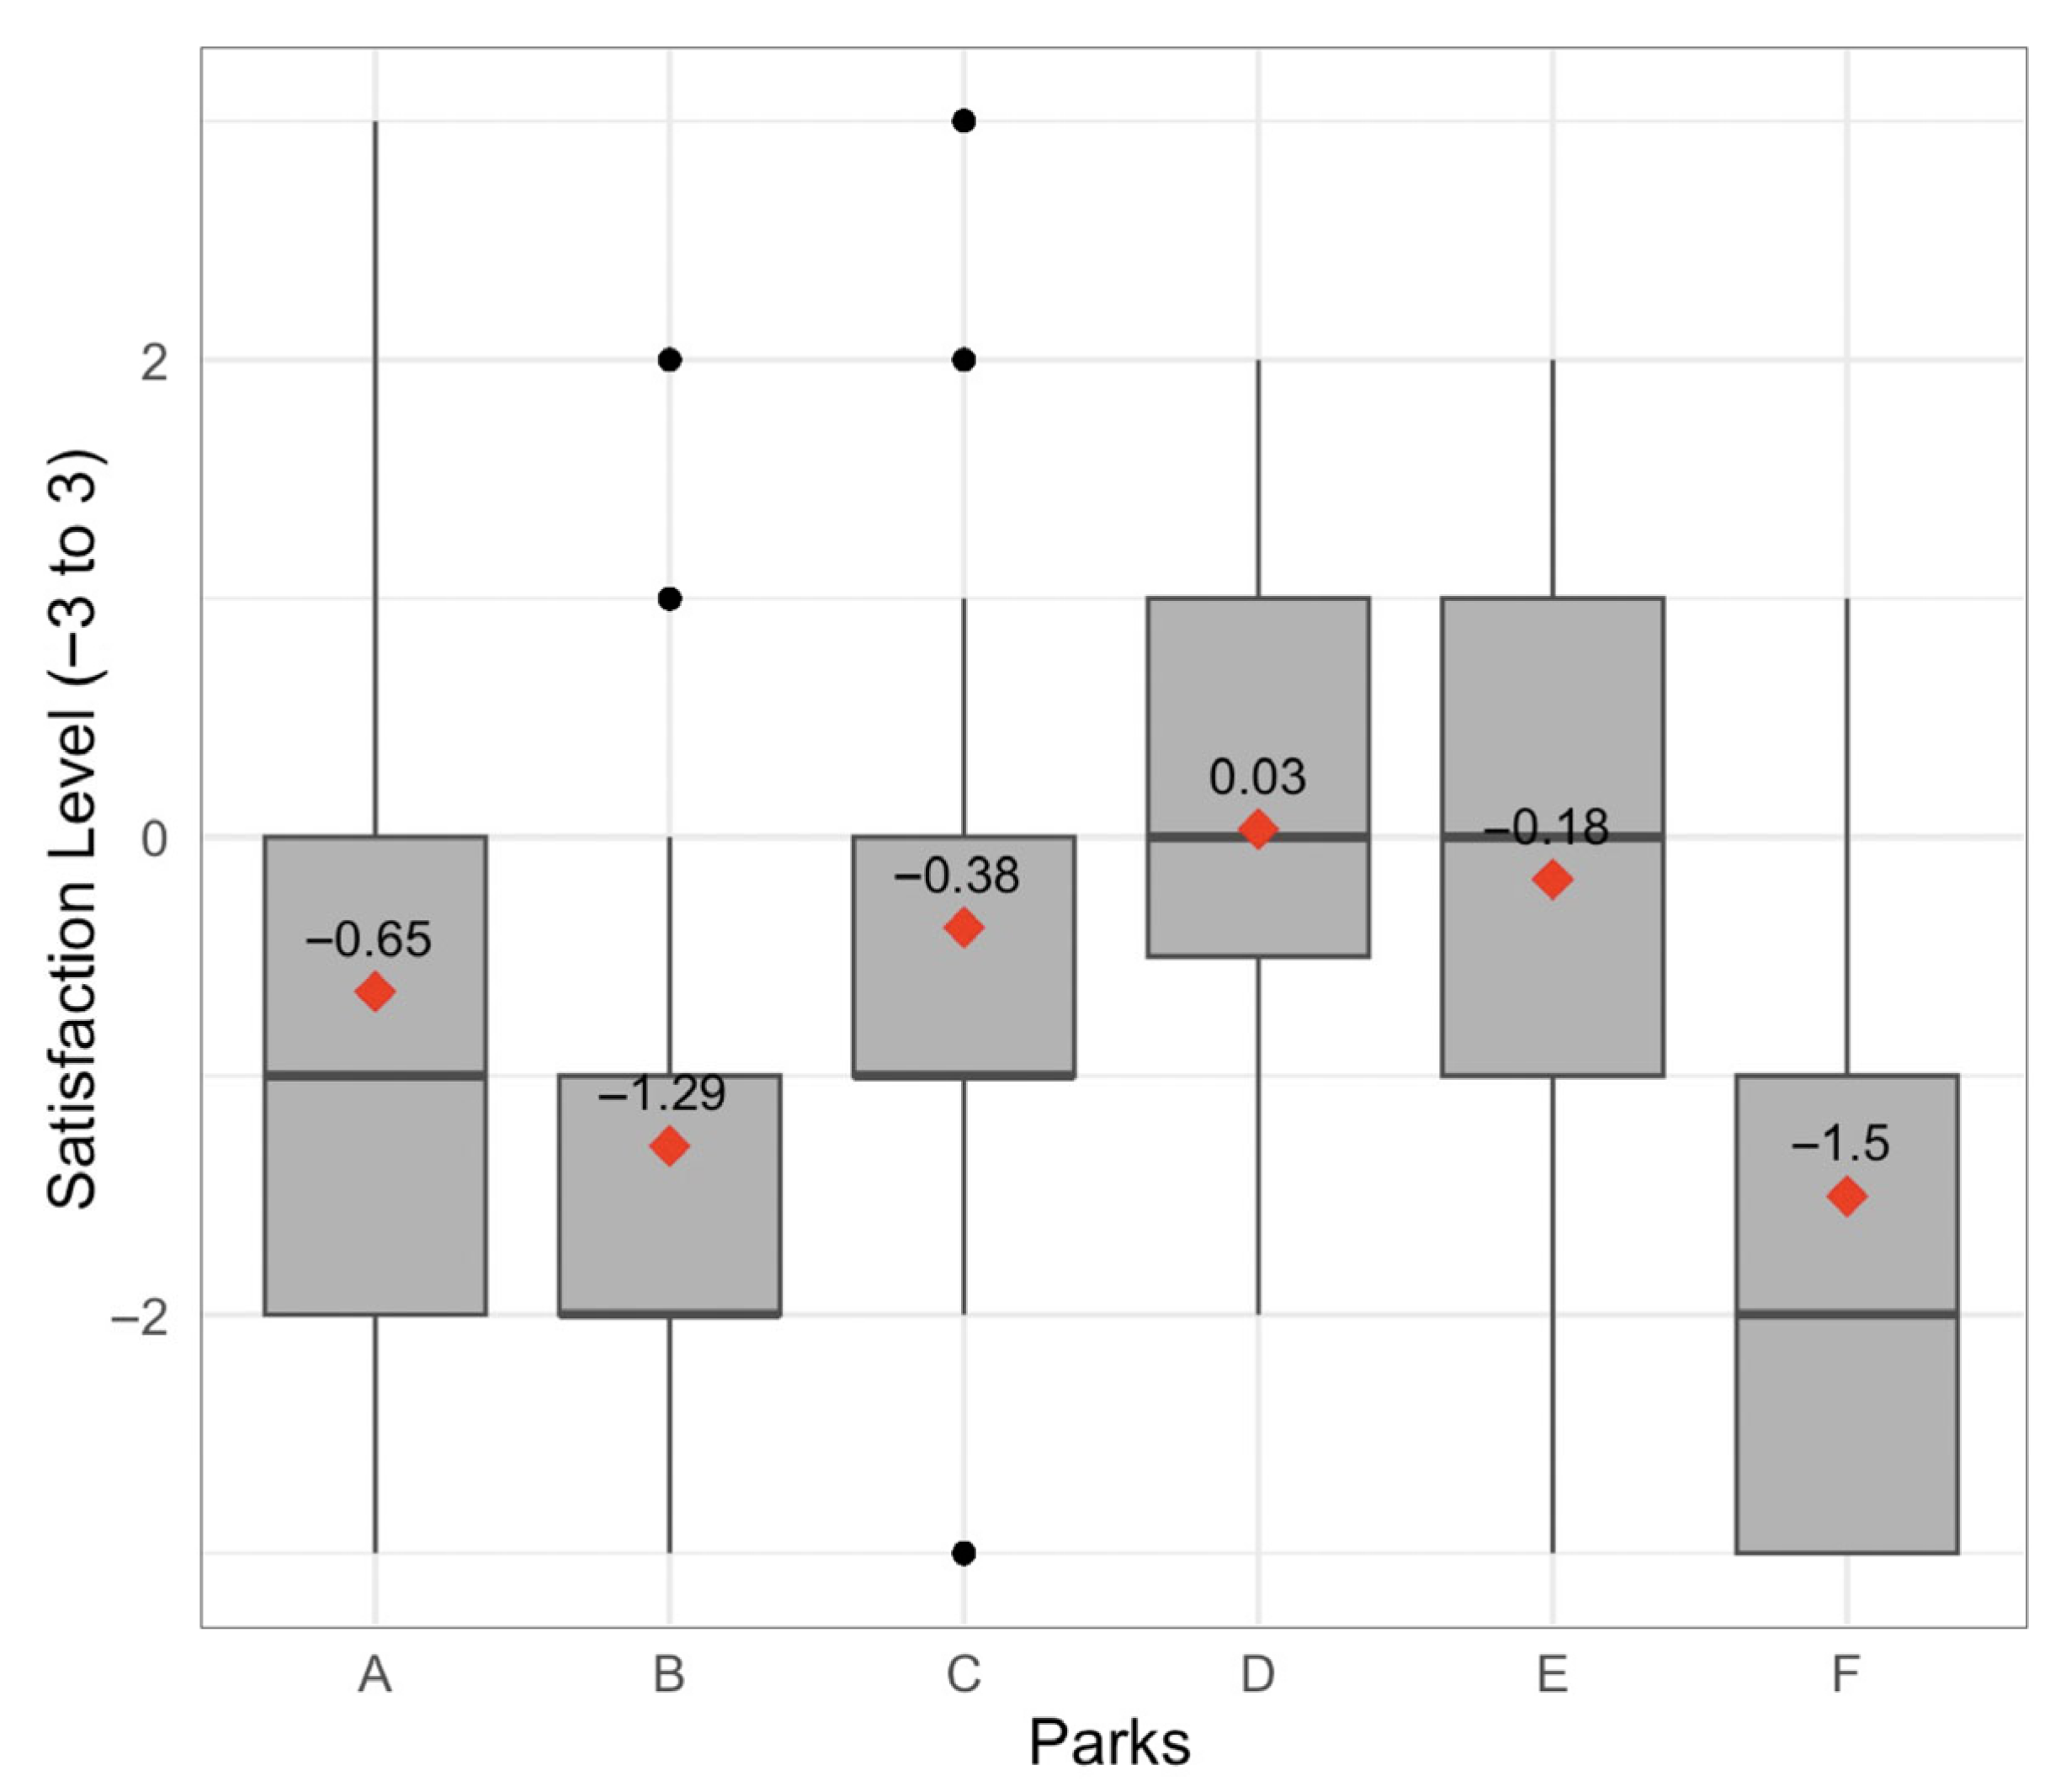
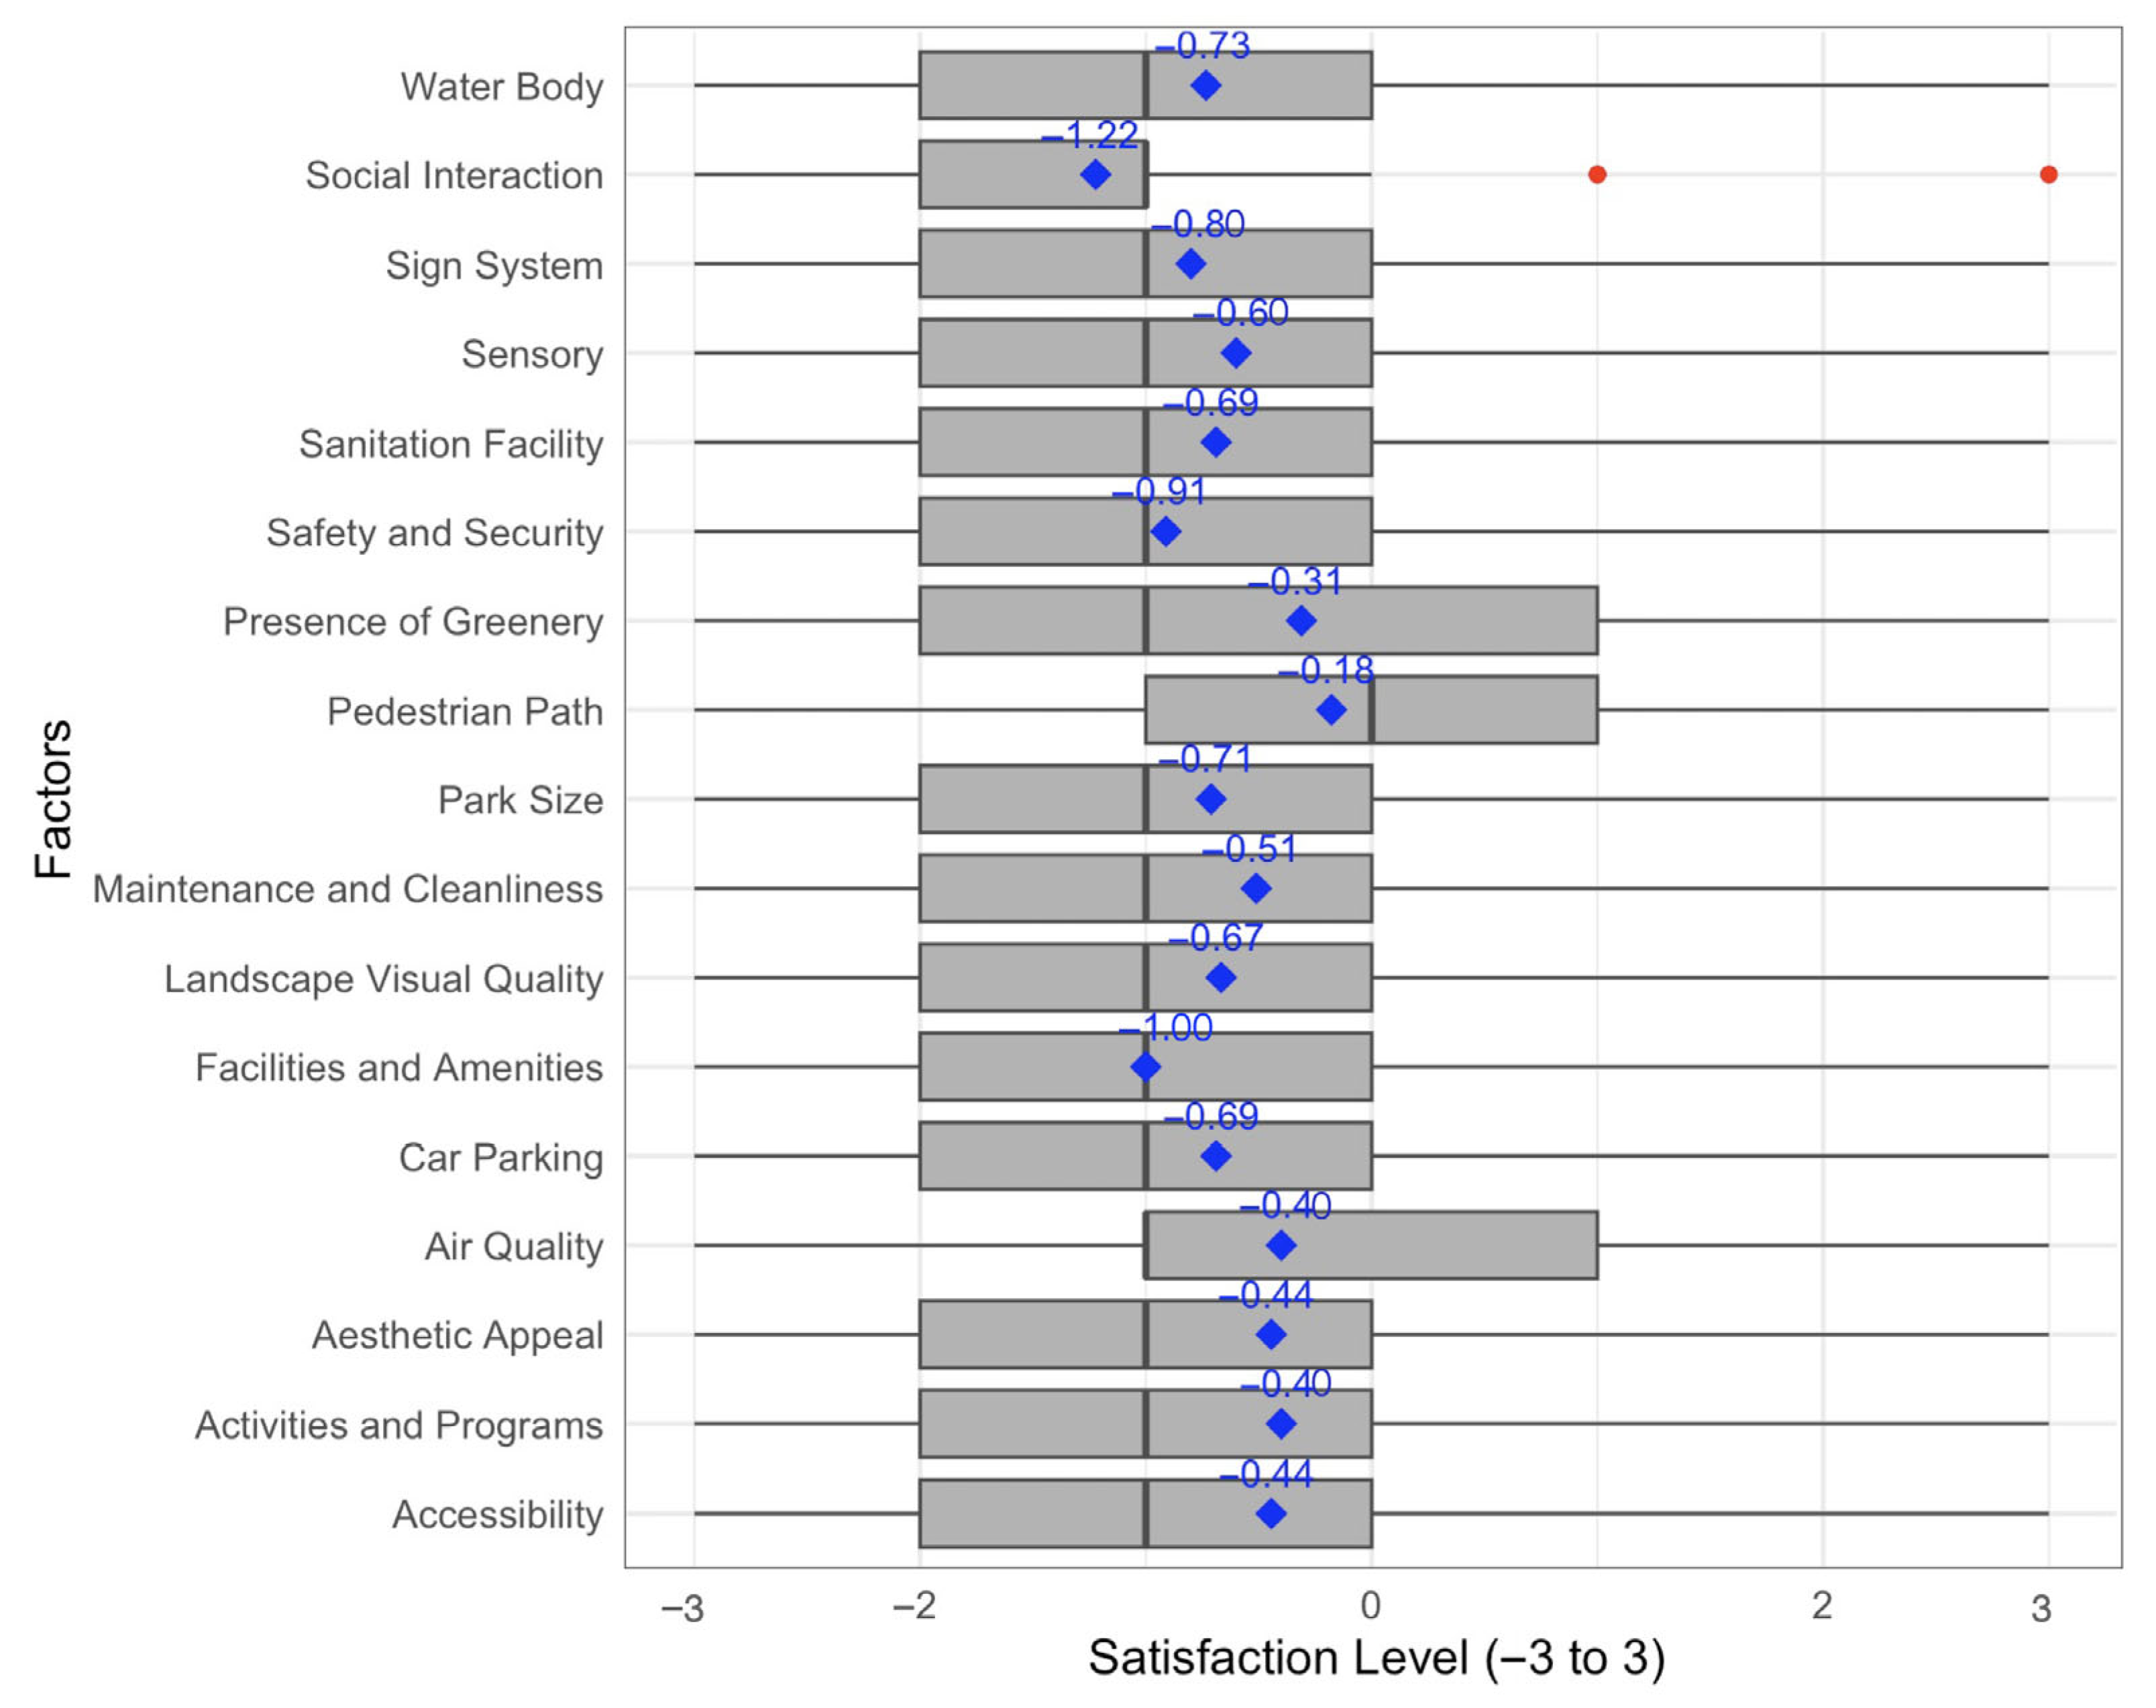
- Satisfaction with park facilities and preferences to assess the parks’ quality from users’ perception, including 17 items. This section seeks to understand the most critical factors influencing visitors’ satisfaction and their preferences for potential improvements. A 7-point Likert scale and open-ended questions were included to gather comprehensive responses.
3.4. Visitation Records
- The municipality provided a dataset of individual visitation records covering the study period from 1 July to 31 August 2025. Each record included a timestamp of the visit (local date and time), a site identifier, and an anonymised visitor identifier. Records with missing or invalid site identifiers and timestamps were excluded (n = 32).
- Duplicate records (identical visitor identifier, site identifier, and timestamp) were removed. To prevent data inflation of visit counts from repeated recordings of the same visitor within very short intervals, we applied a conservative revisit filter: multiple consecutive records for the same anonymised visitor at the same site within a 10 min window were combined into a single visit event. This 10 min threshold was chosen based on prior research [67], which showed negligible changes to aggregated hourly counts for thresholds between 5 and 30 min.
- For visitor records with timestamps exactly on an hour boundary (e.g., 11:00:00), we assigned those events to the hour starting at that timestamp (i.e., 11:00–11:59) for aggregation purposes. After preprocessing, visits were aggregated by site and hour. For each site and each hourly interval (e.g., 00:00–00:59 on 202X-XX-XX), we counted the number of unique visit events assigned to that interval. The hourly time series thus produced was the main dependent variable used in time-varying analyses.
- To validate the aggregated hourly series, weekly patterns for selected sites were plotted to confirm the expected diurnal patterns. Additionally, municipal counts were compared with an independent manual-count subset for two sample days (correlation r = 0.87). Throughout this process, we ensured strict adherence to all relevant data protection regulations and policies.
3.5. Data Analysis Methods
- For continuous data () (°C) and ratio data () (%), the one-way ANOVA test was used to assess differences in mean scores across multiple independent groups [71]. The Shapiro–Wilk test was used to assess normality before conducting the ANOVA. A p-value of 0.21 was reported, indicating a normal distribution across the data [72].
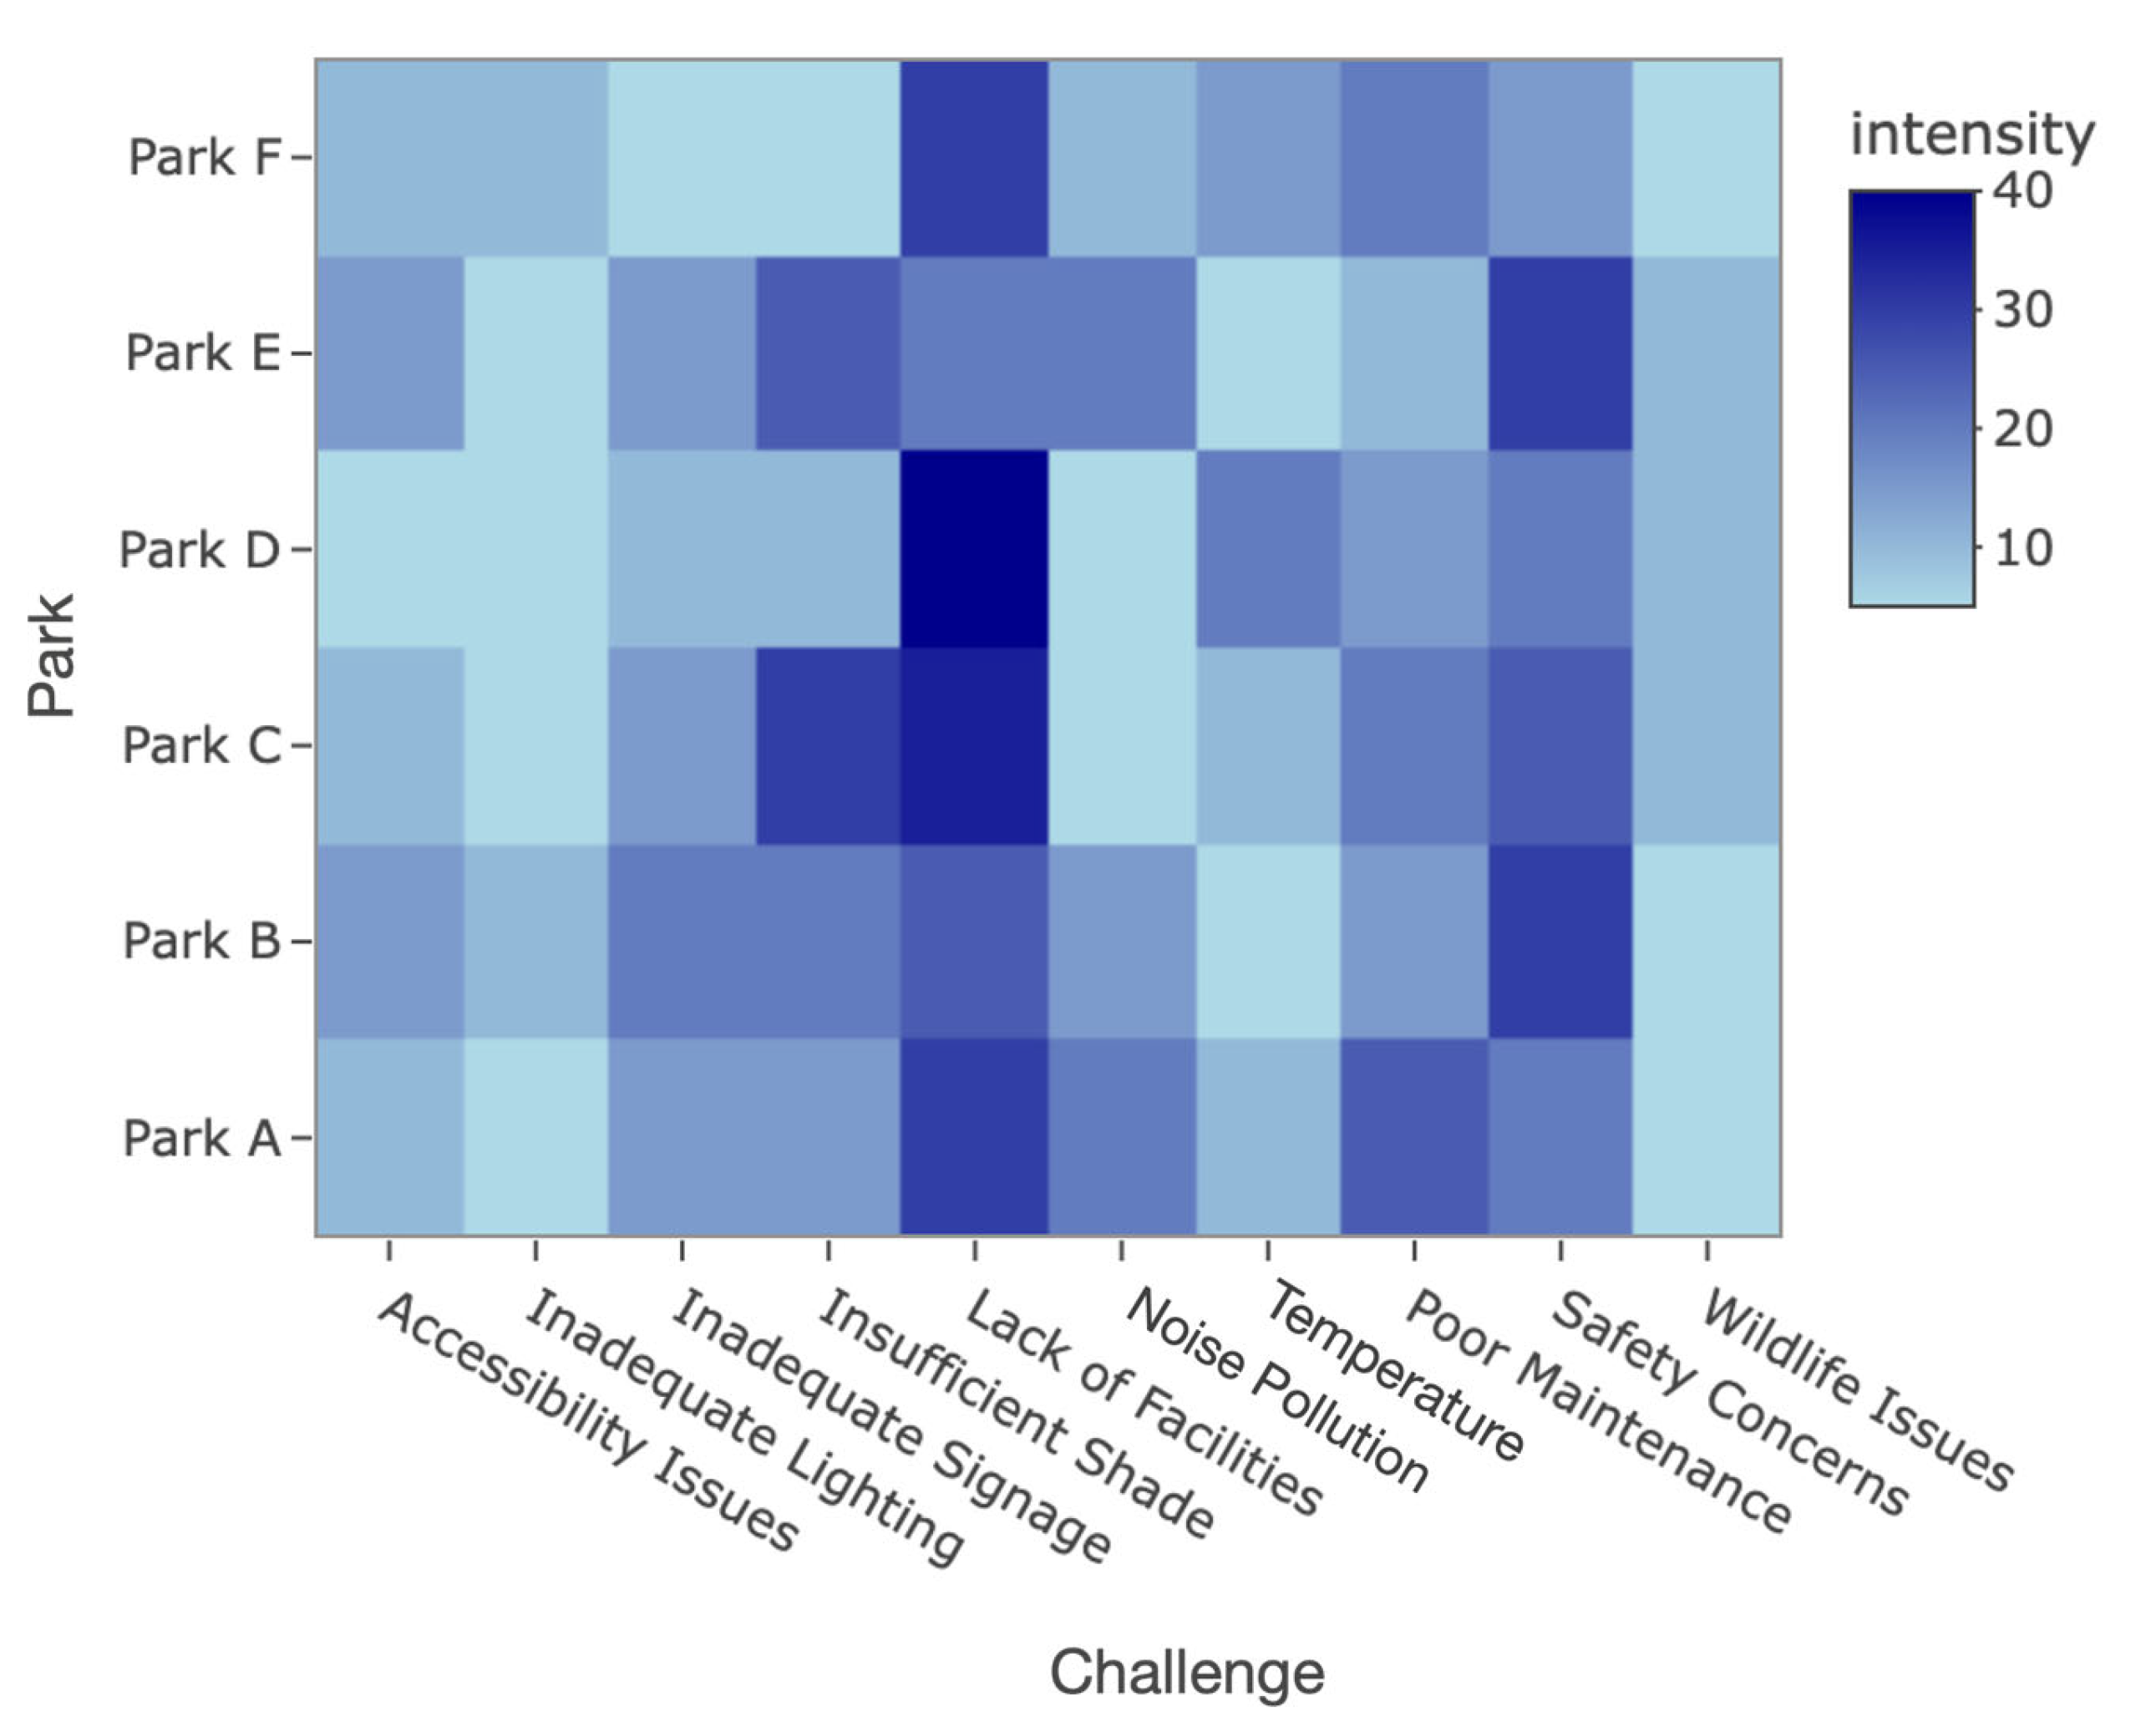
- For open-ended questions, thematic analysis was employed. To identify recurring themes, each response was reviewed to become familiar with the data. Subsequently, a coding framework was developed by grouping responses into pre-established categories based on common concepts. To ensure consistency, two researchers independently conducted a reliability check after coding the responses. Disagreements were resolved through discussion and consensus. Finally, themes were quantified to determine the most frequent observations and incorporated into our results.
- The nonparametric Kruskal–Wallis H test was selected to assess differences in participants’ responses on a categorical or ordinal scale (e.g., satisfaction level) [71]. It was used to test the null hypothesis that there is no difference in the mean response between the investigated parks, assuming that the groups follow the same distribution. It also offers robustness against outliers, enhancing the reliability of the data analysis.
- To investigate the relationship between the monitored outdoor temperature and the obtained park visitation rate in the surveyed parks, a linear regression was calculated [71], using the following equation:
- The Pearson correlation was calculated after testing the data for normality using the Shapiro–Wilk test [72].
- The hourly visitation counts were modelled using a negative binomial generalised linear mixed-effects model (GLMM) to accommodate overdispersed count data and the non-independence of repeated observations within parks. Fixed effects included the intercept, hourly temperature, relative humidity, park-level covariates (park size, amenities index, percent tree cover), and temporal controls for hour of day and day of week. The model incorporated a park-level random intercept to account for repeated measures and between-park heterogeneity. In sensitivity analyses, alternative specifications were estimated, including (i) an additional random slope for temperature at the park level, (ii) models with an offset for sensor uptime, and (iii) Poisson/quasi-Poisson variants.
- The R software (v R-4.5.3) was used for statistical analysis, including mixed-effects models, using the glmmTMB package (v 1.1.14). The sensitivity models were re-run with the lme4 package. The visualisation was done using packages including ggplot2 (v 4.0.2) [75], cowplot (v 1.2.0) [76], and plotly (v 6.6.0) [77].
4. Results and Discussion
4.1. Characteristics of the Study Sample
4.2. Thermal Conditions
4.3. Impact of Temperature on Visit Rate
4.4. Thermal Sensation and Preference Votes
4.5. User Satisfaction Level with Park Amenities
4.6. Aspects for Improvement in Urban Parks
5. Conclusions
Author Contributions
Funding
Institutional Review Board Statement
Informed Consent Statement
Data Availability Statement
Acknowledgments
Conflicts of Interest
Abbreviations
| WHO | World health organization |
| Outdoor temperature | |
| Outdoor relative humidity | |
| GAM | Greater Amman Municipality |
Appendix A. Dataloggers Technical Information
| Technical Specification | Details | |
| Model (iButton Hygrochron DS1923) | Temperature (°C) | Relative Humidity (%) |
| Measurement Range | −40 °C to +85 °C | 0% to 100% |
| Accuracy | ±0.5 °C | ±3% |
| Resolution | 0.1 °C | 0.1% |
| Data Logging Interval | Every 5 min | - |
Appendix B. Survey
| Question | Response Options |
| 1. Socio-Demographic Information | |
| What is your gender? | Male/Female |
| What is your age? | 18 to 25 years 26 to 35 years 36 to 45 years Over 46 years |
| What is your current employment status? | Employed (private sector) Employed (State sector) Unemployed Other |
| What is your education level? | Some High School University Degree (Diploma, Bachelor’s) Master’s Degree/Doctorate Degree |
| What is the distance between your home and the visited park? | [Open-ended response] |
| What is your nationality? | Jordanian Non-Jordanian |
| What is your marital status? | Single Married Divorced/Widowed Other |
| What is your household income level? | 0 to 500 JOD 501 to 800 JOD 801 to 1200 JOD Over 1200 JOD Prefer not to say |
| Do you have any disabilities? (If yes, please specify) | Yes/No (If yes: [Open-ended response]) |
| Do you have children? (If yes, please specify number) | Yes/No (If yes: [Open-ended response]) |
| How often do you visit this park? | Daily/Weekly/Monthly/Occasionally/First Time |
| What are your primary reasons for visiting the park? (Select all that apply) | Exercise/Relaxation/Nature Appreciation/Family Activities/Other (please specify) |
| 2. satisfaction levels | |
| How satisfied are you with the overall facilities of the park? | −3 (Very Dissatisfied) to 3 (Very Satisfied) |
How satisfied are you with the following amenities of the park?
| −3 (Very Dissatisfied) to 3 (Very Satisfied) |
| Thermal sensation | |
| 3. What challenges you face when you visit the park? | Accessibility, lighting, shading, safety, maintenance, others… |
Appendix C. Study Sample Profile
| Sociodemographic Variable (n = 718) | Category | Number of Participants (n) | Percentage (%) |
| Gender Distribution | Female | 434 | 55.5 |
| Male | 284 | 44.5 | |
| Age Distribution | 18–25 | 227 | 31.5 |
| 26–35 | 190 | 26.5 | |
| 36–45 | 213 | 29.7 | |
| Over 46 | 88 | 12.2 | |
| Educational Attainment | University Degree | 310 | 43.2 |
| Master’s Degree/PhD | 143 | 19.9 | |
| Other | 265 | 36.9 | |
| Marital Status | Married | 388 | 54.0 |
| Single | 283 | 39.3 | |
| Divorced/Widowed | 47 | 06.7 | |
| Children Under 18 | Yes | 476 | 66.3 |
| No | 242 | 33.7 | |
| Employment Status | Private Sector Employees | 297 | 41.4 |
| State Employees | 162 | 22.5 | |
| Unemployed | 67 | 09.3 | |
| Other | 192 | 26.8 | |
| Monthly Income | 0–500 JOD | 217 | 30.2 |
| 501–800 JOD | 182 | 25.3 | |
| 801–1200 JOD | 167 | 23.3 | |
| Over 1200 JOD | 152 | 21.2 | |
| Nationality | Jordanian | 609 | 85.0 |
| Non-Jordanian | 108 | 15.0 | |
| Distance between home and the visited park | 0–1 km | 215 | 30.0 |
| 1–3 km | 180 | 25.0 | |
| 3–5 km | 144 | 20.0 | |
| 5–10 km | 108 | 15.0 | |
| More than 10 km | 72 | 10.0 |
References
- World Bank. Urban Overheating and Adaptation Measures—An Analysis at EU, National, and Local Level; World Bank: Washington, DC, USA, 2024. [Google Scholar]
- Hu, J.; Zhang, F.; Qiu, B.; Zhang, X.; Yu, Z.; Mao, Y.; Wang, C.; Zhang, J. Green-gray imbalance: Rapid urbanization reduces the probability of green space exposure in early 21st century China. Sci. Total Environ. 2024, 933, 173168. [Google Scholar] [CrossRef] [PubMed]
- WHO. Heat and Health. 2024. Available online: https://www.who.int/europe/publications/i/item/9789289055406 (accessed on 12 August 2024).
- Ghoneim, R.S. Machine Learning for Adaptive Facade Design: Enhancing Thermal Performance in Urban Architecture. Civ. Eng. Archit. 2025, 13, 1273–1288. [Google Scholar] [CrossRef]
- Beyer, M.; Brick, T.R.; Kühn, S. Urbanicity and psychotic experiences: Social adversities, isolation and exposure to natural environments predict psychosis. J. Environ. Psychol. 2024, 96, 102293. [Google Scholar] [CrossRef]
- Lopes, H.S.; Vidal, D.G.; Cherif, N.; Silva, L.; Remoaldo, P.C. Green infrastructure and its influence on urban heat island, heat risk, and air pollution: A case study of Porto (Portugal). J. Environ. Manag. 2025, 376, 124446. [Google Scholar] [CrossRef]
- Lovell, S.T.; Taylor, J.R. Supplying urban ecosystem services through multifunctional green infrastructure in the United States. Landsc. Ecol. 2013, 28, 1447–1463. [Google Scholar] [CrossRef]
- Zhang, L.; Cao, H.; Han, R. Residents’ Preferences and Perceptions toward Green Open Spaces in an Urban Area. Sustainability 2021, 13, 1558. [Google Scholar] [CrossRef]
- Mitchell, D. People’s Park again: On the end and ends of public space. Environ. Plan. A Econ. Space 2017, 49, 503–518. [Google Scholar] [CrossRef]
- Gómez-Baggethun, E.; Barton, D.N. Classifying and valuing ecosystem services for urban planning. Ecol. Econ. 2013, 86, 235–245. [Google Scholar] [CrossRef]
- Elnaklah, R.; Alwaer, H. Impact of window views on cognitive functions and perceived comfort in healthcare environments. Build. Environ. 2025, 270, 112482. [Google Scholar] [CrossRef]
- ANSI, ASHRAE, ANSI/ASHRAE Standard 62.1-2022; Ventilation and Acceptable Ventilation Indoor Air Quality. ASHRAE Standard: Atlanta, GA, USA, 2022.
- Lemyre, A.; Messina, J.P. Greenspace use during the COVID-19 pandemic: A longitudinal population mobility study in the United Kingdom. Environ. Res. 2023, 239, 117360. [Google Scholar] [CrossRef]
- ISO 37120:2018; Sustainable Cities and Communities. ISO: Geneva, Switzerland, 2018. Available online: https://www.iso.org/standard/68498.html (accessed on 12 August 2024).
- ISO 37101:2016; Sustainable Development in Communities. ISO: Geneva, Switzerland, 2016.
- USGBC. LEED v4 Neighborhood Development. Leed 2018, 2009, 71. [Google Scholar]
- World Health Organisation. Urban Green Space Interventions and Health. World Health Organ. 2017, 3, 172–173. [Google Scholar]
- Moreno, C.; Allam, Z.; Chabaud, D.; Gall, C.; Pratlong, F. Introducing the “15-Minute City”: Sustainability, Resilience and Place Identity in Future Post-Pandemic Cities. Smart Cities 2021, 4, 93–111. [Google Scholar] [CrossRef]
- Gupta, K.; Roy, A.; Luthra, K.; Maithani, S.M. GIS based analysis for assessing the accessibility at hierarchical levels of urban green spaces. Urban For. Urban Green. 2016, 18, 198–211. [Google Scholar] [CrossRef]
- Song, Y.; Wei, Q. Impact of apparent temperatures on park visitation behavior: A comprehensive analysis using large-scale mobility data. Sci. Total Environ. 2024, 940, 173388. [Google Scholar] [CrossRef]
- Lin, T.-P.; Tsai, K.-T.; Liao, C.-C.; Huang, Y.-C. Effects of thermal comfort and adaptation on park attendance regarding different shading levels and activity types. Build. Environ. 2013, 59, 599–611. [Google Scholar] [CrossRef]
- Shishegar, N. The Impacts of Green Areas on Mitigating Urban Heat Island Effect. Int. J. Environ. Sustain. 2014, 9, 119–130. [Google Scholar] [CrossRef]
- Ignatieva, M.; Mofrad, F. Understanding Urban Green Spaces Typology’s Contribution to Comprehensive Green Infrastructure Planning: A Study of Canberra, the National Capital of Australia. Land 2023, 12, 950. [Google Scholar] [CrossRef]
- Büyükağaçcı, S.B.; Arısoy, N. Social Sustainability in Urban Parks: Insights from Alaeddin Hill Park, Konya. Sustainability 2024, 16, 9697. [Google Scholar] [CrossRef]
- Norouzi, M.; Chau, H.-W.; Jamei, E. Design and Site-Related Factors Impacting the Cooling Performance of Urban Parks in Different Climate Zones: A Systematic Review. Land 2024, 13, 2175. [Google Scholar] [CrossRef]
- Bahriny, F.; Bell, S. Patterns of Urban Park Use and Their Relationship to Factors of Quality: A Case Study of Tehran, Iran. Sustainability 2020, 12, 1560. [Google Scholar] [CrossRef]
- Alotaibi, B.S.; Elnaklah, R.; Agboola, O.P.; Abuhussain, M.A.; Tunay, M.; Dodo, Y.A.; Maghrabi, A.; Alyami, M. Enhancing Najran’s sustainable smart city development in the face of urbanization challenges in Saudi- Arabia. J. Asian Archit. Build. Eng. 2025, 24, 2905–2935. [Google Scholar] [CrossRef]
- Al Niyadi, S.; Elnabawi, M.H. Optimizing hybrid ventilation in arid Climates: A systematic review and Dubai case study. City Environ. Interact. 2025, 26, 100191. [Google Scholar] [CrossRef]
- Makowska, B. Practical Functioning of a Sustainable Urban Complex with a Park—The Case Study of Stavros Niarchos Foundation Cultural Center in Athens. Sustainability 2021, 13, 5071. [Google Scholar] [CrossRef]
- Liu, R.; Xiao, J. Factors affecting users’ satisfaction with urban parks through online comments data: Evidence from Shenzhen, China. Int. J. Environ. Res. Public Health 2021, 18, 253. [Google Scholar] [CrossRef]
- Moosavi, S.; Makhzoumi, J.; Grose, M. Landscape practice in the Middle East between local and global aspirations. Landsc. Res. 2016, 41, 265–278. [Google Scholar] [CrossRef]
- Mandeli, K. Public space and the challenge of urban transformation in cities of emerging economies: Jeddah case study. Cities 2019, 95, 102409. [Google Scholar] [CrossRef]
- Vaughan, C.A.; Colabianchi, N.; Hunter, G.P.; Beckman, R.; Dubowitz, T. Park Use in Low-Income Urban Neighborhoods: Who Uses the Parks and Why? J. Urban Health 2018, 95, 222–231. [Google Scholar] [CrossRef]
- Kaczynski, A.T.; Johnson, A.J.; Saelens, B.E. Neighborhood land use diversity and physical activity in adjacent parks. Health Place 2010, 16, 413–415. [Google Scholar] [CrossRef]
- Abdelhamid, M.M.; Elfakharany, M.M. Improving urban park usability in developing countries: Case study of Al-Shalalat Park in Alexandria. Alex. Eng. J. 2020, 59, 311–321. [Google Scholar] [CrossRef]
- Gianfredi, V.; Buffoli, M.; Rebecchi, A.; Croci, R.; Oradini-Alacreu, A.; Stirparo, G.; Marino, A.; Odone, A.; Capolongo, S.; Signorelli, C. Association between Urban Greenspace and Health: A Systematic Review of Literature. Int. J. Environ. Res. Public Health 2021, 18, 5137. [Google Scholar] [CrossRef]
- Gearin, E.; Hurt, C.S. Making Space: A New Way for Community Engagement in the Urban Planning Process. Sustainability 2024, 16, 2039. [Google Scholar] [CrossRef]
- Kumar, P.; Sahani, J.; Perez, K.C.; Ahlawat, A.; de Fatima, M.A.; Athanassiadou, M.; Cao, S.-J.; Collins, L.; Dey, S.; Di Sabatino, S.; et al. Urban greening for climate resilient and sustainable cities: Grand challenges and opportunities. Front. Sustain. Cities 2025, 7, 1595280. [Google Scholar] [CrossRef]
- Bai, Y.; Xing, Y. Harnessing green infrastructure for urban heat island mitigation: Evidence-based strategies for sustainable and climate-resilient cities. Sustain. Cities Soc. 2025, 133, 106843. [Google Scholar] [CrossRef]
- Farhan, Y.; Al-Shawamreh, S. Impact of Rapid Urbanization and Changing Housing Patterns on Urban Open Public Spaces of Amman, Jordan: A GIS and RS Perspective. J. Environ. Prot. 2019, 10, 57–79. [Google Scholar] [CrossRef]
- GAM. Voluntary Local Review The City of Amman, 2022. Available online: https://unhabitat.org/node/161902 (accessed on 2 July 2024).
- Jordanian National Building Council. City Beauty Code. 2008. Available online: https://jnbc.gov.jo/ (accessed on 4 June 2025).
- G.A.M. Amman Green City Action Plan; GAM: Amman, Jordan, 2021. [Google Scholar]
- UN-Habitat, Jordan National Urban Policy. 2022. Available online: https://unhabitat.org/sites/default/files/2024/02/231231-jnup_en_-final.pdf (accessed on 4 May 2024).
- Worldometer. Jordan Population, 2024. Available online: https://www.worldometers.info/world-population/jordan-population/ (accessed on 4 August 2024).
- Alnsour, J.A. Managing urban growth in the city of Amman. Jordan Cities 2016, 50, 93–99. [Google Scholar] [CrossRef]
- G.A.M. Amman Climate Action Plan; GAM: Amman, Jordan, 2019.
- Ministry of Environment. The National Climate Change the Adaptation Plan of Jordan; Ministry of Environment: Amman, Jordan, 2021.
- U.N. ESCWA. Voluntary Local Review: The City of Amman, Jordan, 2024. Available online: https://www.unescwa.org/publications/voluntary-local-review-amman%0Ahttps://app.overton.io/document.php?policy_document_id=unescwa-09ad66ddf784f4d5f15a60570860a608 (accessed on 1 July 2025).
- Tomah, A.N.; Saleh, B.; Abed, A.R. Assessment of the Geographic Distribution of Public Parks in the City of Amman. Eur. J. Sci. Res. 2017, 144, 262–275. [Google Scholar]
- Alamasi, R.; Asfour, O.S.; Al-Mahdy, O.E. Users’ Satisfaction with the Urban Design of Nature-Based Parks: A Case Study from Saudi Arabia. Urban Sci. 2024, 8, 219. [Google Scholar] [CrossRef]
- Neema, M.N.; Maniruzzaman, K.M.; Ohgai, A. Green Urbanism Incorporating Greenery-Based Conceptual Model towards Attaining a Sustainable Healthy Livable Environment—Dhaka City’s Perspective. Curr. Urban Stud. 2013, 1, 19–27. [Google Scholar] [CrossRef]
- Chiesura, A. The role of urban parks for the sustainable city. Landsc. Urban Plan. 2004, 68, 129–138. [Google Scholar] [CrossRef]
- Talal, M.L.; Santelmann, M.V. Visitor access, use, and desired improvements in urban parks. Urban For. Urban Green. 2021, 63, 127216. [Google Scholar] [CrossRef]
- Özbey, M.F.; Turhan, C. Investigating the relationship between thermal comfort and human psychology: A review. J. Build. Des. Environ. 2024, 2, 35255. [Google Scholar] [CrossRef]
- Lopes, H.S.; Remoaldo, P.C.; Ribeiro, V.; Martín-Vide, J. Perceptions of human thermal comfort in an urban tourism destination—A case study of Porto (Portugal). Build. Environ. 2021, 205, 108246. [Google Scholar] [CrossRef]
- GAM. Greater Amman Municipality; GAM: Amman, Jordan, 2025.
- Lin, C.-H.; Lin, T.-P.; Hwang, R.-L. Thermal Comfort for Urban Parks in Subtropics: Understanding Visitor’s Perceptions, Behavior and Attendance. Adv. Meteorol. 2013, 2013, 640473. [Google Scholar] [CrossRef]
- Saimun, M.S.R.; Rahman, M.M. A comprehensive review of tree cover mapping using satellite sensor data. Discov. Geosci. 2025, 3, 90. [Google Scholar] [CrossRef]
- Hycza, T.; Kamińska, A.; Stereńczak, K. The Use of Remote Sensing Data to Estimate Land Area with Forest Vegetation Cover in the Context of Selected Forest Definitions. Forests 2021, 12, 1489. [Google Scholar] [CrossRef]
- Matzarakis, A.; Muthers, S.; Rutz, F. Application and comparison of UTCI and PET in temperate climate conditions. Finisterra 2015, 49, 98. [Google Scholar] [CrossRef]
- Sargazi, M.A.; Heidari, A.; Davtalab, J.; Piri, J. Comparative reliability assessment of PET and UTCI thermal comfort indices using Monte Carlo simulation in urban microclimates. Sci. Rep. 2025, 16, 3431. [Google Scholar] [CrossRef]
- IButtons LINK. Temperature Logging iButtons. 2024. Available online: https://www.ibuttonlink.com/collections/thermochron (accessed on 15 September 2025).
- Mahmoud, A.H.A. Analysis of the microclimatic and human comfort conditions in an urban park in hot and arid regions. Build. Environ. 2011, 46, 2641–2656. [Google Scholar] [CrossRef]
- ANSI/ASHRAE Standard 55-2017; Thermal Environmental Conditions for Human Occupancy. ASHRAE Standard: Atlanta, GA, USA, 2017.
- Elnabawi, M.H.; Hamza, N. Behavioural Perspectives of Outdoor Thermal Comfort in Urban Areas: A Critical Review. Atmosphere 2019, 11, 51. [Google Scholar] [CrossRef]
- Elnaklah, R.; Alnuaimi, A.; Alotaibi, B.S.; Topriska, E.; Walker, I.; Natarajan, S. Thermal comfort standards in the Middle East: Current and future challenges. Build. Environ. 2021, 200, 107899. [Google Scholar] [CrossRef]
- Shaibani, M.J.; Fazaeli, A.A.; Daroudi, R.; Radinmanesh, M.; Sefiddashti, S.E. AI-powered models for overcrowding prediction at TUMS hospitals. Sci. Rep. 2025, 16, 819. [Google Scholar] [CrossRef]
- Zimmerman, D.W. A Note on Interpretation of the Paired-Samples t Test. J. Educ. Behav. Stat. 1997, 22, 349. [Google Scholar] [CrossRef]
- Choi, J.; Aziz, A.; Loftness, V. Investigation on the impacts of different genders and ages on satisfaction with thermal environments in office buildings. Build. Environ. 2010, 45, 1529–1535. [Google Scholar] [CrossRef]
- Miller, S. Experimental Design and Statistics, 2nd ed.; Routledge: London, UK, 2005. [Google Scholar] [CrossRef]
- SHAPIRO, S.S.; WILK, M.B. An analysis of variance test for normality (complete samples). Biometrika 1965, 52, 591–611. [Google Scholar] [CrossRef]
- Evenson, K.R.; Jones, S.A.; Holliday, K.M.; Cohen, D.A.; McKenzie, T.L. Park characteristics, use, and physical activity: A review of studies using SOPARC (System for Observing Play and Recreation in Communities). Prev. Med. 2016, 86, 153–166. [Google Scholar] [CrossRef]
- Rout, A.; Nesbitt, L. Equity, travel, and park visitation in 10 US metro areas: A smartphone mobility study. Urban For. Urban Green. 2024, 101, 128557. [Google Scholar] [CrossRef]
- Wickham, H. ggplot2: Elegant Graphics for Data Analysis; Springer: New York, NY, USA, 2016; Available online: https://ggplot2.tidyverse.org (accessed on 13 June 2025).
- Claus, O.W. cowplot: Streamlined Plot Theme and Plot Annotations for “ggplot2,” 2025. Available online: https://wilkelab.org/cowplot/ (accessed on 1 October 2025).
- Sievert, C. Interactive Web-Based Data Visualization with R, Plotly, and Shiny, 2020. Available online: https://plotly-r.com (accessed on 11 November 2025).
- Derose, K.P.; Han, B.; Williamson, S.; Cohen, D.A. Gender Disparities in Park Use and Physical Activity Among Residents of High-Poverty Neighborhoods in Los Angeles. Women’s Health Issues 2018, 28, 6–13. [Google Scholar] [CrossRef]
- Jordanian Statistics Department. Population Growth, 2025. Available online: https://dosweb.dos.gov.jo/ (accessed on 4 May 2025).
- DOS. Jordan Statistical Yearbook 2016; Department of Statistics: Tokyo, Japan, 2016.
- Mak, B.K.L.; Jim, C.Y. Linking park users’ socio-demographic characteristics and visit-related preferences to improve urban parks. Cities 2019, 92, 97–111. [Google Scholar] [CrossRef]
- Department of Statistics, Jordan. Unemployment Rate Archives; Department of Statistics Jordan: Amman, Jordan, 2025. [Google Scholar]
- Department of Statistics, Jordan. Poverty Statistics; Department of Statistics Jordan: Amman, Jordan, 2022.
- Lee, J.H.; Ahn, Y.; Kang, D.; Kim, H. Disparities in Urban Park Visitation Patterns among Socioeconomically Vulnerable Communities during the COVID-19 Pandemic. Sustainability 2024, 16, 1070. [Google Scholar] [CrossRef]
- Gong, Y.; Mamat, Z.; Shi, L.; Liu, F. Restorative Effects of Park Visiting on Physiology, Psychology, and Society and the Factors Influencing Park Visiting. Sustainability 2023, 15, 841. [Google Scholar] [CrossRef]
- Al-Hajri, S.; Al-Ramadan, B.; Shafiullah, M.; Rahman, S.M. Microclimate Performance Analysis of Urban Vegetation: Evidence from Hot Humid Middle Eastern Cities. Plants 2025, 14, 521. [Google Scholar] [CrossRef] [PubMed]
- Lee, S.; French, S.P. Regional impervious surface estimation: An urban heat island application. J. Environ. Plan. Manag. 2009, 52, 477–496. [Google Scholar] [CrossRef]
- Müllerová, J.; Šiffel, E. Cooling the land surface: Ecosystem health and water availability drive the landscape capacity to mitigate climate change. Ecol. Indic. 2025, 172, 113265. [Google Scholar] [CrossRef]
- van Vliet, E.; Dane, G.; Weijs-Perrée, M.; van Leeuwen, E.; van Dinter, M.; van den Berg, P.; Borgers, A.; Chamilothori, K. The Influence of Urban Park Attributes on User Preferences: Evaluation of Virtual Parks in an Online Stated-Choice Experiment. Int. J. Environ. Res. Public Health 2020, 18, 212. [Google Scholar] [CrossRef]
- Wang, J.; Mameno, K.; Owake, T.; Aikoh, T.; Shoji, Y. When the city gets too hot: Decline in green space visits under extreme summer temperatures. Urban For. Urban Green. 2026, 118, 129312. [Google Scholar] [CrossRef]
- Aram, F.; Solgi, E.; Garcia, E.H.; Mosavi, A. Urban heat resilience at the time of global warming: Evaluating the impact of the urban parks on outdoor thermal comfort. Environ. Sci. Eur. 2020, 32, 117. [Google Scholar] [CrossRef]
- Kabisch, N.; Kraemer, R. Physical activity patterns in two differently characterised urban parks under conditions of summer heat. Environ. Sci. Policy 2020, 107, 56–65. [Google Scholar] [CrossRef]
- Cai, X.; Yang, J.; Zhang, Y.; Xiao, X.; Xia, J. Cooling island effect in urban parks from the perspective of internal park landscape. Humanit. Soc. Sci. Commun. 2023, 10, 674. [Google Scholar] [CrossRef]
- Feng, Y.; Huang, S.; Chen, S.; Guan, C.; Li, Y.; Tan, Q.; Jin, Y.; Yang, X.; Xu, Y. Dataset for visitations of public green spaces in Shanghai, China. Sci. Data 2025, 12, 1260. [Google Scholar] [CrossRef]
- Chung, M.S.C.; Lau, K.K.L. Effects of environmental perception on thermal sensation in sub-tropical and high-density cities: A case study of Hong Kong. In Proceedings of the 10th Windsor Conference: Rethinking Comfort, Windsor, UK, 12–15th April 2018; pp. 506–517. [Google Scholar]
- Baldwin, J.W.; Benmarhnia, T.; Ebi, K.L.; Jay, O.; Lutsko, N.J.; Vanos, J.K. Humidity’s Role in Heat-Related Health Outcomes: A Heated Debate. Environ. Health Perspect. 2023, 131, 055001. [Google Scholar] [CrossRef]
- Zhuang, L.; Huang, J.; Li, F.; Zhong, K. Psychological adaptation to thermal environments and its effects on thermal sensation. Physiol. Behav. 2022, 247, 113724. [Google Scholar] [CrossRef] [PubMed]
- Fan, Q.; Li, X.; Li, H. Crowd Gathering and Thermal Comfort Research in Different Park Shading Spaces. Sustainability 2022, 14, 2687. [Google Scholar] [CrossRef]
- Zhang, L.; Wei, D.; Hou, Y.; Du, J.; Liu, Z.; Zhang, G.; Shi, L. Outdoor Thermal Comfort of Urban Park—A Case Study. Sustainability 2020, 12, 1961. [Google Scholar] [CrossRef]
- Guo, H.; Luo, Z.; Li, M.; Kong, S.; Jiang, H. A Literature Review of Big Data-Based Urban Park Research in Visitor Dimension. Land 2022, 11, 864. [Google Scholar] [CrossRef]
- Nicol, F.; Humphreys, M. Derivation of the adaptive equations for thermal comfort in free-running buildings in European standard EN15251. Build. Environ. 2010, 45, 11–17. [Google Scholar] [CrossRef]
- Ren, Y.; Yang, Q. Research on the Factors Influencing the Perception of Urban Park Recreational Behavior Based on the “Homo Urbanicus” Theory. Sustainability 2023, 15, 6525. [Google Scholar] [CrossRef]
- Peters, K.; Elands, B.; Buijs, A. Social interactions in urban parks: Stimulating social cohesion? Urban For. Urban Green. 2010, 9, 93–100. [Google Scholar] [CrossRef]
- Chen, S.; Sleipness, O.; Christensen, K.; Yang, B.; Park, K.; Knowles, R.; Yang, Z.; Wang, H. Exploring associations between social interaction and urban park attributes: Design guideline for both overall and separate park quality enhancement. Cities 2024, 145, 104714. [Google Scholar] [CrossRef]
- Kimic, K.; Polko, P. The Use of Urban Parks by Older Adults in the Context of Perceived Security. Int. J. Environ. Res. Public Health 2022, 19, 4184. [Google Scholar] [CrossRef]
- Doğrusoy, İ.T.K.E.E.; Zengel, R. Analysis Of Perceived Safety In Urban Parks: A Field Study in Büyükpark And Hasanağa Park. Metu J. Fac. Archit. 2017, 34, 63–84. [Google Scholar] [CrossRef]
- Bogacka, E. Safety of urban park users. In Crime and Fear in Public Places; Routledge: London, UK, 2020; pp. 108–124. [Google Scholar] [CrossRef]
- Šerý, M.; Brisudová, L.; Buil-Gil, D.; Kimic, K.; Polko, P.; Solymosi, R. The Perception of Personal Security in Urban Parks: A Comparative Analysis of Research Methods. In Placemaking in Practice; BRILL: Leiden, The Netherlands, 2023; Volume 1, pp. 290–308. [Google Scholar] [CrossRef]
- Franěk, M. Landscape Preference: The Role of Attractiveness and Spatial Openness of the Environment. Behav. Sci. 2023, 13, 666. [Google Scholar] [CrossRef]
- Lyu, M.; Wang, S.; Shi, J.; Sun, D.; Cong, K.; Tian, Y. Visual Satisfaction of Urban Park Waterfront Environment and Its Landscape Element Characteristics. Water 2025, 17, 772. [Google Scholar] [CrossRef]
- Shayestefar, M.; Pazhouhanfar, M.; van Oel, C.; Grahn, P. Exploring the Influence of the Visual Attributes of Kaplan’s Preference Matrix in the Assessment of Urban Parks: A Discrete Choice Analysis. Sustainability 2022, 14, 7357. [Google Scholar] [CrossRef]
- Kaplan, S.; Kaplan, R. The Experience of Nature: A Psychological Perspective; Cambridge University Press: New York, NY, USA, 1989. [Google Scholar]
- Pretty, J.; Peacock, J.; Hine, R.; Sellens, M.; South, N.; Griffin, M. Green exercise in the UK countryside: Effects on health and psychological well-being, and implications for policy and planning. J. Environ. Plan. Manag. 2007, 50, 211–231. [Google Scholar] [CrossRef]
- Arabasy, M.; Ghoneim, R.S. Enhancing sustainable urban design using machine learning: Comparative analysis of seven metaheuristic algorithms in energy-efficient digital architecture. Front. Built Environ. 2025, 11, 1526209. [Google Scholar] [CrossRef]
- Wu, P.; Xu, D.; Cui, N.; Li, X.; Liu, Y. Study on the Accessibility of Urban Parks Within the Framework of Kunming’s 15-Min Living Circle. Land 2025, 14, 933. [Google Scholar] [CrossRef]
- Kwon, T.K.; Kim, T.H.; Lim, Y.-S. Exploring the Heat Mitigation Effects of Urban Climate Adaptation Facilities. Sustainability 2024, 16, 9919. [Google Scholar] [CrossRef]



| Item | (A) Alshoura Park | (B) Press Park | (C) Al-Wefaq Park | (D) Al-Momaniyah Park | (E) Princess Rahmeh Park | (F) Manhal Park |
|---|---|---|---|---|---|---|
| Construction date | 2010 | 2015 | 2012 | 2011 | 2014 | 2016 |
| Location * | Abdun Al Shamli | Telaa alali | Aljubihaa | Jabal Al-Hussein | Om Al-Summaq | Al-Jubiha |
| Total area (m2) | 12,450 | 2383 | 4800 | 6000 | 8000 | 4000 |
| Vegetated tree area (%) ** | 11% | 15% | 24% | 15% | 18% | 14% |
| Playground (n) | 3 | 1 | 1 | 2 | 2 | 1 |
| Sports fields (n) | 1 (soccer) | - | - | - | 1 (soccer) | - |
| Lighting | ✓ | ✓ | ✓ | ✓ | ✓ | ✓ |
| Water fountain | × | × | × | × | × | × |
| Restrooms | ✓ | × | × | ✓ | × | × |
| Food services (n) | × | × | × | 1 | 1 | × |
| Seating areas | ✓ | ✓ | ✓ | ✓ | ✓ | ✓ |
| Shading elements *** | × | × | × | × | × | × |
| Disability solutions | ✓ | × | × | ✓ | ✓ | × |
| Park | A | B | C | D | E | F |
|---|---|---|---|---|---|---|
| Number of respondents (n) | 150 | 130 | 120 | 110 | 108 | 104 |
| Number of visits (n) | 6 | 5 | 4 | 4 | 4 | 5 |
| Date of visits | 8, 15, 22 July; 5, 15, 27 August | 9, 16, 23 July; 6, 16 August | 10, 17, 24 July; 31 August | 11, 18 July; 1, 25 August | 12, 19, 26 July; 2 August | 13, 20, 27 July; 3, 27 August |
| Park | A | B | C | D | E | F |
|---|---|---|---|---|---|---|
| Data logger (n) | 15 | 10 | 12 | 13 | 12 | 10 |
| (°C) | ||||||
| Mean | 33.3 | 32.1 | 30.2 | 32.8 | 33.5 | 31.9 |
| Max. | 38.2 | 41.0 | 37.1 | 39.5 | 40.2 | 36.8 |
| Min. | 26.3 | 26.1 | 23.2 | 25.5 | 27.1 | 24.5 |
| Range | [26.3, 38.2] | [26.1, 41.0] | [23.2, 37.1] | [25.5, 39.5] | [27.1, 40.2] | [24.5, 36.8] |
| (%) | ||||||
| Mean | 37.6 | 38.4 | 31.0 | 35.0 | 36.6 | 39.0 |
| Max. | 58.1 | 56.2 | 54.1 | 57.5 | 59.2 | 55.5 |
| Min. | 12.5 | 14.1 | 16.3 | 13.5 | 15.2 | 17.0 |
| Range | [12.5, 58.1] | [14.1, 56.2] | [16.3, 54.1] | [13.5, 57.5] | [15.2, 59.2] | [17.0, 55.5] |
| Contrast | Estimate | t-Ratio | p-Value |
|---|---|---|---|
| A–B | 1.67 | 3.18 | 0.02 |
| A–C | 3.29 | 6.24 | 0.00 * |
| A–D | 1.96 | 3.71 | 0.00 * |
| A–E | 0.45 | 0.86 | 0.95 (n.s.) |
| A–F | 2.54 | 4.83 | 0.00 * |
| B–C | 1.61 | 3.06 | 0.03 |
| B–D | 0.28 | 0.53 | 0.99 (n.s.) |
| B–E | −1.21 | −2.31 | 0.19 |
| B–F | 0.87 | 1.65 | 0.56 (n.s.) |
| C–D | −1.33 | −2.53 | 0.12 (n.s.) |
| C–E | −2.83 | −5.38 | 0.00 * |
| C–F | −0.74 | −1.41 | 0.71 (n.s.) |
| D–E | −1.502 | −2.85 | 0.05 |
| D–F | 0.588 | 1.11 | 0.87 (n.s.) |
| Variable | Intercept (95% CI) | Effect of Park | Total Residuals Variance | Unexplained Variance | Std Err | z-Value |
|---|---|---|---|---|---|---|
| Temperature (°C) | 50.3 (40.1, 60.5) | −2.1 | 5.0 | 1.5 | 0.3 | −7.00 |
| Humidity (%) | 1.5 (1.1, 1.9) | 1.5 | 5.0 | 0.8 | 0.2 | 7.50 |
| Park Size | 0.05 (0.03, 0.07) | 0.05 | 5.0 | 0.2 | 0.01 | 5.00 |
| Amenities | 3.2 (2.2, 4.2) | 3.2 | 5.0 | 0.6 | 0.5 | 6.40 |
| Tree Cover | 0.8 (0.4, 1.2) | 0.8 | 5.0 | 0.4 | 0.2 | 4.00 |
| Comparison | Diff | SE | z-Value | p-Value |
|---|---|---|---|---|
| TSV | ||||
| A–B | 1.04 | 0.20 | 5.20 | 0.00 * |
| A–C | −0.94 | 0.20 | −4.70 | 0.00 * |
| A–D | −0.55 | 0.20 | −2.73 | 0.015 |
| C–E | 1.40 | 0.20 | 7.00 | 0.00 * |
| B–F | 1.51 | 0.20 | 7.55 | 0.00* |
| TPV | ||||
| A–D | 0.68 | 0.25 | 2.73 | 0.006 |
| A–E | 1.66 | 0.25 | 6.64 | 0.00 * |
| A–F | 0.66 | 0.25 | 2.64 | 0.00 * |
| B–E | 1.24 | 0.25 | 4.96 | 0.00 * |
| C–E | 1.11 | 0.25 | 4.44 | 0.00 * |
| D–E | 0.98 | 0.25 | 3.92 | 0.00 * |
Disclaimer/Publisher’s Note: The statements, opinions and data contained in all publications are solely those of the individual author(s) and contributor(s) and not of MDPI and/or the editor(s). MDPI and/or the editor(s) disclaim responsibility for any injury to people or property resulting from any ideas, methods, instructions or products referred to in the content. |
© 2026 by the authors. Licensee MDPI, Basel, Switzerland. This article is an open access article distributed under the terms and conditions of the Creative Commons Attribution (CC BY) license.
Share and Cite
Elnaklah, R.; Kaushik, A.K.; Alotaibi, B.S. The Impact of Temperature on Visitation Rate, Thermal Sensation, and Satisfaction Levels in Urban Parks in a Hot Summer. Urban Sci. 2026, 10, 191. https://doi.org/10.3390/urbansci10040191
Elnaklah R, Kaushik AK, Alotaibi BS. The Impact of Temperature on Visitation Rate, Thermal Sensation, and Satisfaction Levels in Urban Parks in a Hot Summer. Urban Science. 2026; 10(4):191. https://doi.org/10.3390/urbansci10040191
Chicago/Turabian StyleElnaklah, Rana, Amit Kant Kaushik, and Badr Saad Alotaibi. 2026. "The Impact of Temperature on Visitation Rate, Thermal Sensation, and Satisfaction Levels in Urban Parks in a Hot Summer" Urban Science 10, no. 4: 191. https://doi.org/10.3390/urbansci10040191
APA StyleElnaklah, R., Kaushik, A. K., & Alotaibi, B. S. (2026). The Impact of Temperature on Visitation Rate, Thermal Sensation, and Satisfaction Levels in Urban Parks in a Hot Summer. Urban Science, 10(4), 191. https://doi.org/10.3390/urbansci10040191