Article

Identification of Leucaena leucocephala in Urban Landscapes Using Street-Level Images and Deep Learning


by
Danielle Elis Garcia Furuya
1,2,*,
Gleison Marrafon
3,
Eduardo Lopes de Lemos
4,
Michelle Tais Garcia Furuya
1,
Robson Diego Silva Gonçalves
1,
Wesley Nunes Gonçalves
4,
José Marcato Junior
5,
Édson Luis Bolfe
2,6,
Veraldo Liesenberg
7,
Lucas Prado Osco
1 and
Ana Paula Marques Ramos
3
1
Post-Graduate Program of Environment and Regional Development, University of Western São Paulo, Raposo Tavares, km 572, Presidente Prudente 19067-175, SP, Brazil
2
Brazilian Agricultural Research Corporation—Embrapa, Embrapa Agricultura Digital, Campinas 13083-886, SP, Brazil
3
Faculty of Science and Technology, São Paulo State University (UNESP), R. Roberto Simonsen, 305, Presidente Prudente 19060-900, SP, Brazil
4
Faculty of Computer Science, Federal University of Mato Grosso do Sul, Av. Costa e Silva, Campo Grande 79070-900, MS, Brazil
5
Faculty of Engineering and Architecture, Federal University of Mato Grosso do Sul, Av. Costa e Silva, Campo Grande 79070-900, MS, Brazil
6
Institute of Geosciences, State University of Campinas (Unicamp), Campinas 13083-855, SP, Brazil
7
Department of Forest Engineering, College of Agriculture and Veterinary, Santa Catarina State University (UDESC), Lages 88520-000, SC, Brazil
*
Author to whom correspondence should be addressed.
Urban Sci. 2026, 10(4), 192; https://doi.org/10.3390/urbansci10040192
Submission received: 11 February 2026 / Revised: 22 March 2026 / Accepted: 24 March 2026 / Published: 2 April 2026
(This article belongs to the Special Issue Geotechnology in Urban Landscape Studies)

Abstract

Mapping urban tree species supports green infrastructure planning. An essential issue refers to the monitoring of exotic species that may become invasive. Street-level imagery provides a complementary perspective to aerial images for species identification that are difficult to distinguish from above. In this context, our study aimed to evaluate deep learning-based object detection and image segmentation approaches to identify a potentially invasive tree species known as Leucaena leucocephala in an urban environment in Brazil, using 422 street-level images acquired from Google Street View (SV) and mobile phones (MPs). Object detection models (YOLOv8 and DETR) and a foundation segmentation model (SAM, zero-shot) were applied to assess how deep learning paradigms perform under heterogeneous urban imaging conditions. YOLOv8 achieved detection performance with mAP50 above 0.83 and recall up to 0.76. DETR showed domain sensitivity, with mAP50 of 0.45 in SV images and 0.84 in MP imagery. For segmentation, SAM zero-shot achieved 0.92 accuracy and 0.93 F1-score in SV images, decreasing to 0.63 accuracy and 0.66 F1-score in MP images. Overall, this study demonstrates that combining detection and segmentation approaches provides complementary information for urban vegetation monitoring, supporting decision-making related to invasive species management and sustainable urban landscape planning.

1. Introduction

Urban trees play a fundamental role in environmental quality and human well-being, contributing to air purification, temperature regulation, biodiversity enhancement, and improved urban aesthetics [1,2]. Effective urban vegetation planning, therefore, depends not only on increasing tree cover but also on the appropriate selection of species, prioritizing native trees that are adapted to local soil, climate, and fauna conditions and that provide long-term ecological benefits [3,4,5]. In contrast, the introduction of exotic species into urban environments can generate negative ecological impacts, particularly when these species exhibit invasive behavior, competing with native vegetation for resources, reducing biodiversity, and altering ecosystem processes [3,6,7].
Leucaena leucocephala (Lam.) de Wit (hereafter referred to as “Leucaena” for simplicity), a tree species native to Mexico and Central America, has been widely introduced in tropical and subtropical regions and is commonly found in urban areas of many countries. In regions where it is considered exotic, Leucaena is classified as a potentially invasive species due to its rapid growth and high competitive capacity, which can lead to environmental degradation and the suppression of native species [8,9,10]. This species has been listed among the 100 worst invasive alien species worldwide, reinforcing the importance of its identification and monitoring in urban landscapes to support biodiversity conservation, environmental management, and healthier urban environments [8,9].
Remote sensing technologies have played a key role in environmental monitoring by enabling large-scale and continuous observation of ecosystems, supporting studies on land-use change, deforestation, and urban expansion [11,12,13]. In urban contexts, remote sensing data are widely used to map vegetation distribution and support urban planning and green infrastructure development [14,15]. However, the identification of individual tree species in orbital imagery, or even when using high-spatial resolution aerial imagery, remains challenging, particularly for species such as Leucaena, whose canopy structure and spectral characteristics are not easily distinguishable from surrounding vegetation when observed from a nadir perspective.
In this context, street-level imagery provides a valuable complementary perspective for urban vegetation studies. Unlike aerial or satellite data, street-level images capture detailed views of tree trunks, branches, leaves, and overall structure, enabling more precise identification of individual species. Platforms such as Google Street View offer extensive spatial coverage in urban areas and have been increasingly used for applications related to urban planning, environmental monitoring, and the assessment of urban visual environments [16,17,18]. In addition to panoramic platforms such as Google SV, street-level images can also be acquired using mobile phones, which offer flexible, low-cost, and high-resolution data collection directly at street level. Although street-level images from Google Street View and mobile phones present geometric and radiometric limitations, they are easily accessible and low-cost, and they enable the construction of datasets that support the identification of targets in urban environments, providing valuable guidance for subsequent, time- and cost-intensive field surveys. Previous studies have demonstrated the potential of street-level imagery combined with deep learning techniques for detecting and classifying urban tree species, highlighting its suitability for large-scale and cost-effective urban vegetation inventories [19,20].
Recent advances in deep learning have further expanded the possibilities for analyzing street-level images. Object detection networks, such as You Only Look Once (YOLO) and Detection Transformers (DETR), have shown strong performance in identifying trees and vegetation elements in complex urban scenes, enabling rapid and accurate detection [21,22,23]. The study of Itakura & Hosoi (2020) [21] proposes a cost-effective method for automatic tree detection and structural measurement using 360° spherical imagery combined with structure-from-motion 3D reconstruction and YOLO-based detection, achieving accurate trunk diameter and height estimation with an F-measure of 0.94. Another study by Choi et al. (2022) [22] proposes a deep learning-based framework using street-level imagery to automatically classify urban tree species and estimate structural parameters (e.g., height and diameter), combining YOLO object detection, semantic segmentation, and graphical analysis to generate urban tree profile inventories with a mean average precision of 0.564.
In parallel, foundation models for image segmentation, such as the Segment Anything Model (SAM), introduced by Meta AI in 2023 [24], allow for flexible segmentation of objects using zero-shot or few-shot approaches, reducing the need for extensive labeled datasets and offering new opportunities for urban environmental analysis [25,26].
Despite these advances, there is still a lack of studies that jointly evaluate detection-based and segmentation-based deep learning approaches for identifying potentially invasive tree species in urban environments using street-level imagery. Comparative assessments of task-specific detection models and foundation segmentation models remain limited, particularly for species such as Leucaena leucocephala, which pose significant challenges for traditional remote sensing approaches.
To address these gaps, this study provides a comparative assessment of detection- and segmentation-based deep learning approaches for mapping a single potentially invasive tree species (Leucaena leucocephala) in urban streetscapes. Unlike prior work that typically focuses on either (i) a single street-level source or (ii) a single computer-vision task, we explicitly evaluate cross-domain variability by contrasting Google Street View and mobile phone images (on-site acquisitions with higher variability in viewpoint, illumination, and background clutter). We further compare task-specific object detectors (YOLOv8 and DETR) against a foundation segmentation model (SAM in zero-shot mode), highlighting practical trade-offs for urban vegetation monitoring when training data are limited. The results aim to contribute to urban environmental monitoring, invasive species management, and landscape planning by demonstrating the potential of street-level imagery combined with deep learning techniques.

2. Materials and Methods

2.1. Experimental Workflow

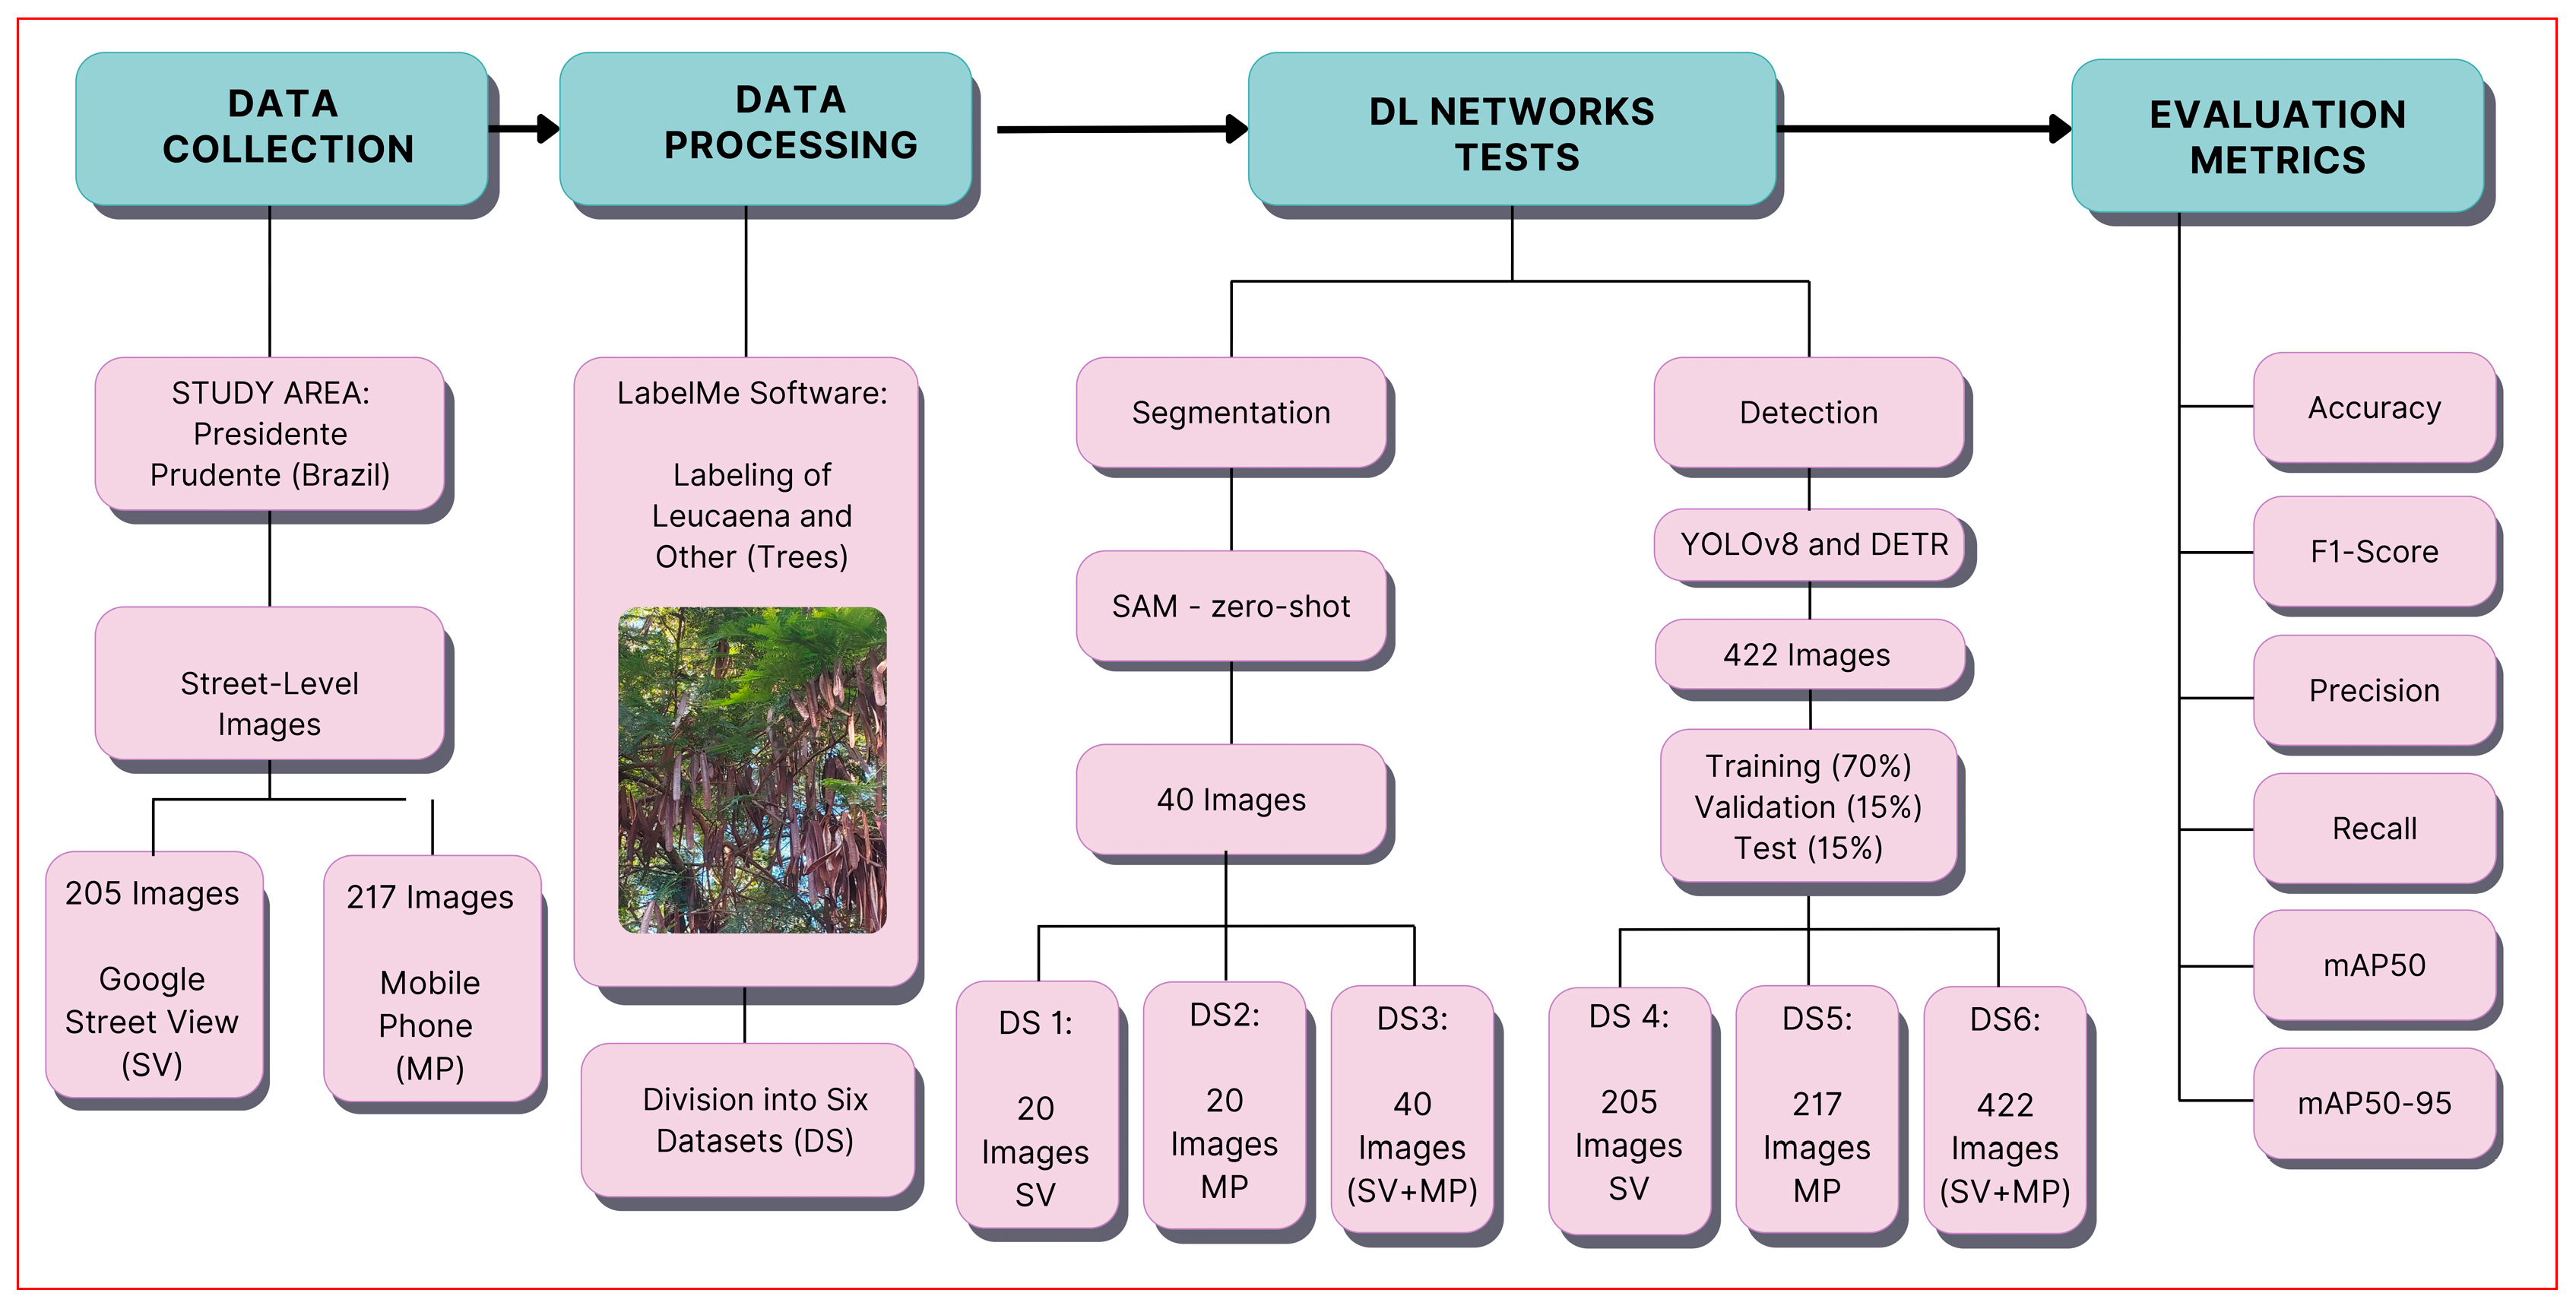
Figure 1 shows the workflow with the steps taken in this study to verify the efficiency of the detection and segmentation networks to identify the Leucaena tree species in urban areas.

2.2. Study Area

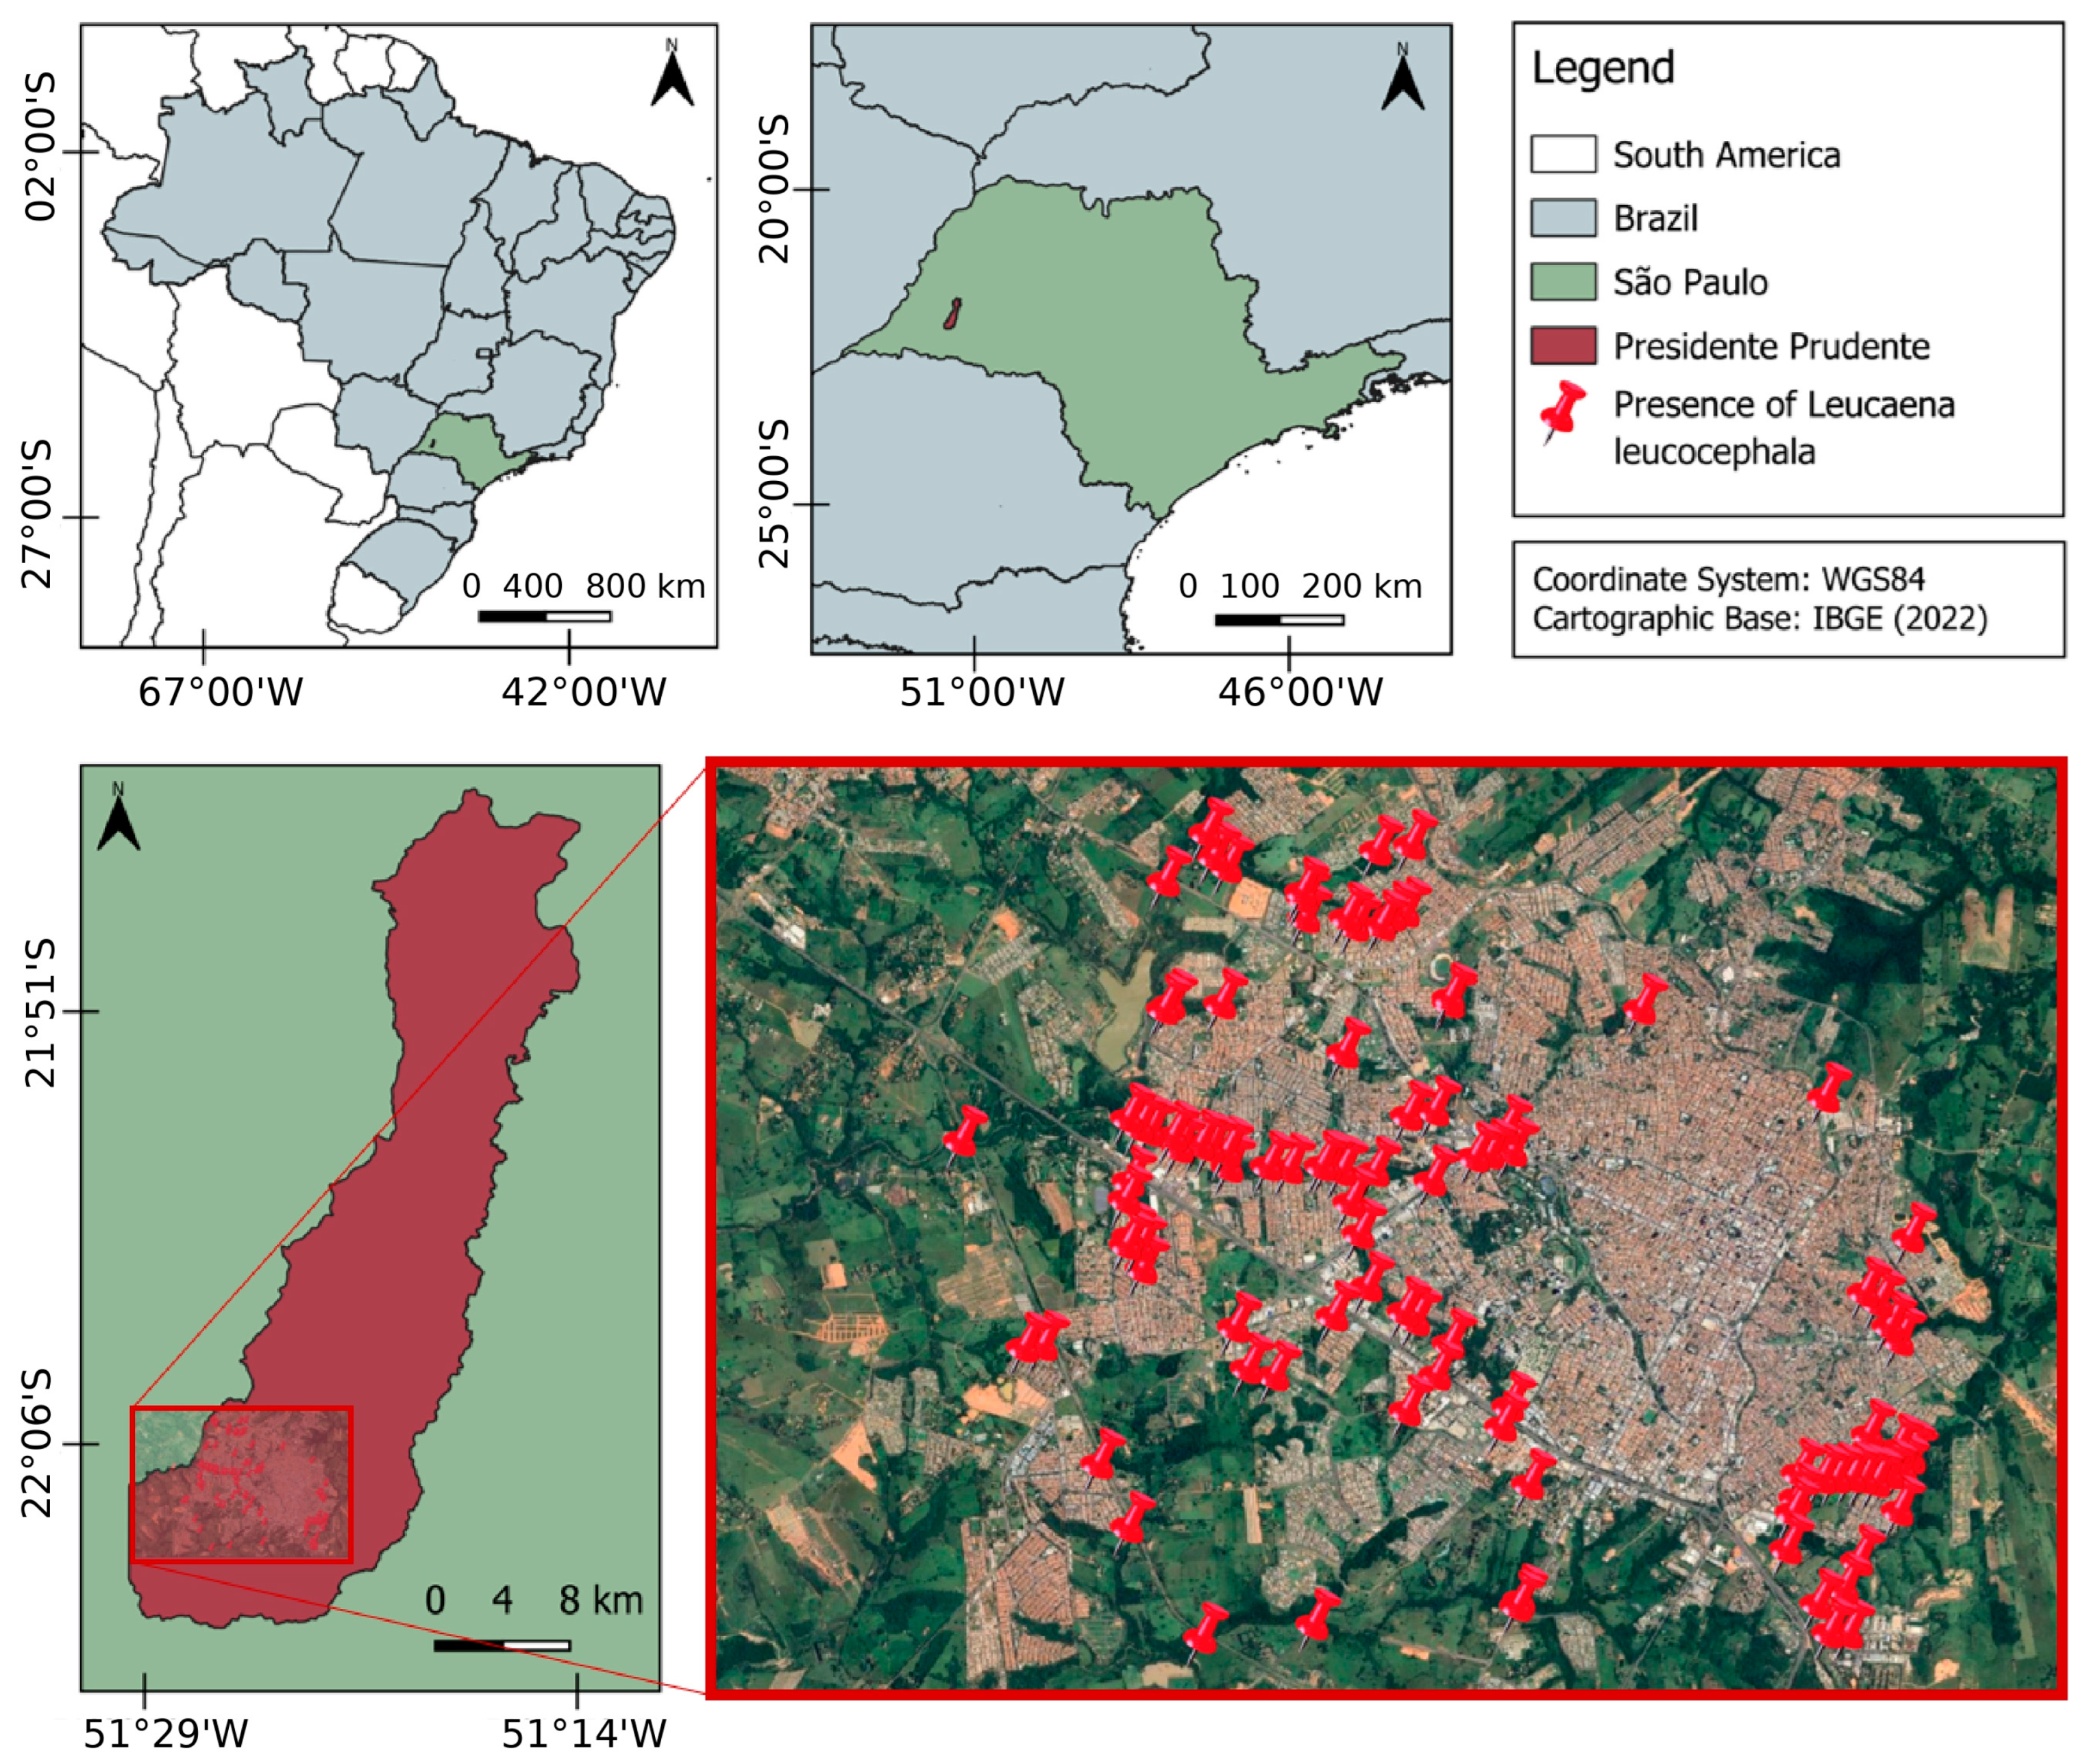
To conduct the tests in this study, images of the city of Presidente Prudente (Figure 2), in the state of São Paulo, Brazil (latitude 22°07′21.06″ S and longitude 51°23′17.71″ W), were used. Presidente Prudente is a medium-sized city with an estimated population of 225,668 in 2022 [27]. This city has an area of approximately 230.05 km2, including the urban and rural perimeters [28] and 60.83 km2 of urbanized area [29]. Presidente Prudente has a high quantity of the tree species Leucaena distributed throughout the urban area, representing a pattern commonly observed in other Brazilian cities and in tropical and subtropical regions worldwide. In this study, it was possible to identify points in the city where Leucaena is present to later collect images from Google SV and MP (Figure 2).

2.3. Data Collection and Preparation

In this study, a total of 422 images were collected. Of the total images, 205 correspond to Google SV images (3328 × 1664), and 217 correspond to MP images (3000 × 3000). SV images are obtained by cars equipped with 360-degree cameras and have advantages as they are frequently updated by the Google platform [30]. In addition to facilitating the collection of images of urban areas around the world, SV helps to identify the characteristics of trees in more detail, including the species Leucaena.
The images collected from Google SV of the city of Presidente Prudente correspond to the years 2021 and 2022 (the most recent years at the time of collection). The MP images were collected by the authors and corresponded to the years 2023 and 2024. The camera was oriented in a vertical position and configured with a resolution of 48 megapixels. Furthermore, images were taken at different periods and days to collect a dataset with different light and shadow characteristics.
The image annotation process was performed using the LabelMe software. Different labeling strategies were adopted according to the deep learning task and the specific requirements of each model architecture. For image segmentation, reference annotations were manually created in the LabelMe software by delineating irregular polygon masks corresponding to individual Leucaena trees. These polygon annotations represent the ground truth (GT) used for performance evaluation. For the SAM zero-shot experiments, the polygon-based GT annotations were converted into bounding boxes, which were used as box prompts to guide the model during segmentation. The SAM output consists of pixel-level segmentation masks, which were subsequently compared with the original polygon-based GT annotations to compute the evaluation metrics. As the SAM zero-shot configuration does not require a training phase [26] and was assessed as an initial segmentation test, a subset of 40 street-level images was considered sufficient for this analysis.
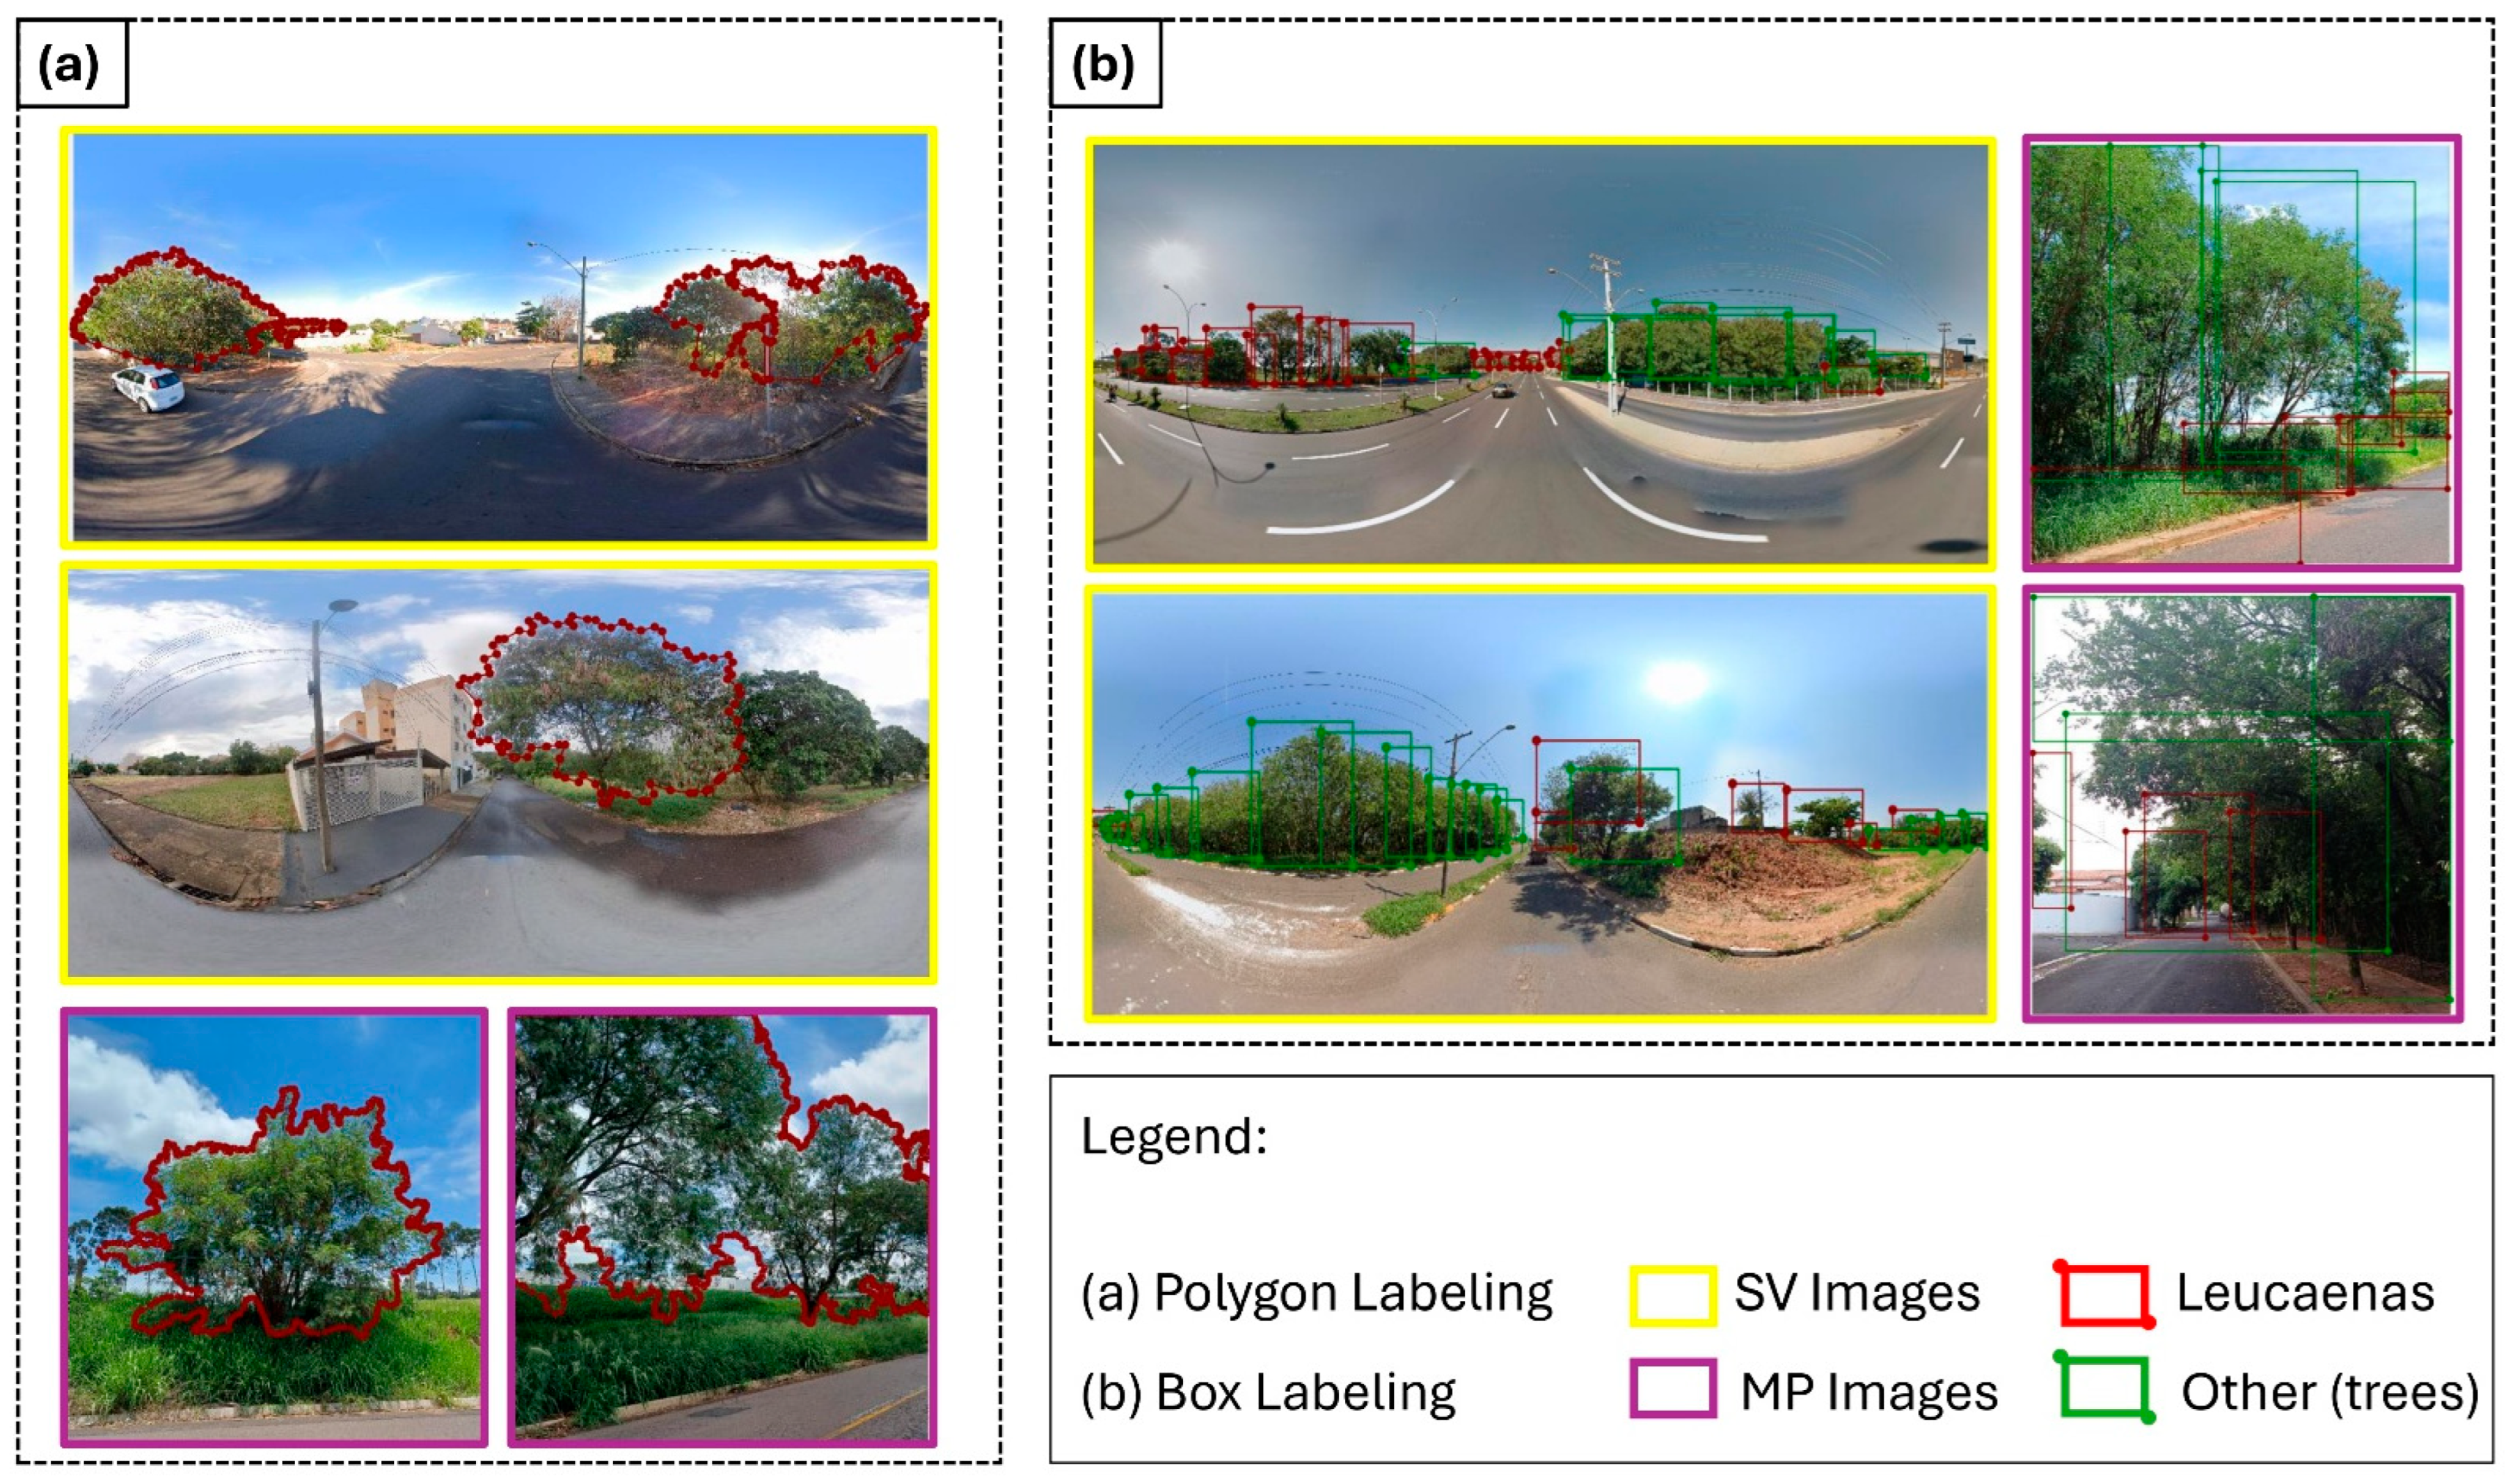
For object detection experiments, annotations were created using bounding boxes. The full dataset of 422 street-level images, including SV and MP images, was labeled in LabelMe, considering two classes, namely Leucaena and Other, where the latter includes other tree species present in the urban environment. These annotations were used to train/validate and test the YOLOv8 and DETR networks. Figure 3 presents examples of the annotation process for both segmentation (polygon-based labeling) and detection (bounding box-based labeling).

2.4. Segmentation and Detection Tasks with Deep Neural Networks

2.4.1. Segment Anything Model (SAM)

The Segment Anything Model (SAM) is a model for image segmentation introduced by Meta AI in 2023, designed to generate object masks across diverse image domains without requiring task-specific training [25]. The model is prompt-based and can perform segmentation using inputs such as points or bounding boxes, enabling zero-shot, one-shot, or few-shot learning [26]. Due to its strong generalization capability, SAM has shown potential for applications where annotated data are limited, including environmental and remote sensing studies.
In this test, 40 street-level images were selected for the segmentation experiments and manually annotated to enable the calculation of evaluation metrics and to support a quantitative assessment of the SAM zero-shot performance. As the zero-shot configuration of the SAM does not require a training phase [26], a limited number of annotated images was sufficient for this initial segmentation evaluation.
Image annotation was performed using the LabelMe software (Figure 3), which has been widely adopted in computer vision and remote sensing studies for object delineation and segmentation tasks [31,32,33]. The annotation process involves identifying and grouping pixels that represent the target object within the image, forming distinct regions for subsequent analysis [34,35]. In this study, polygon-based labeling was employed, as it allows precise delineation of object boundaries and provides an efficient and compact representation for pixel-level segmentation. Accordingly, individual Leucaena trees were delineated using polygon shapes in LabelMe.
For both qualitative and quantitative analyses, the SAM zero-shot model was implemented using the official Meta AI GitHub repository (accessed in February 2024) and adapted following the methodology proposed by Osco et al. 2023 [26]. The experiments were conducted on the Google Colaboratory platform, where the SAM model was guided by box prompts to perform segmentation on street-level images. The adaptation included reading annotation files in JSON format generated by LabelMe and enabling the comparison between the SAM-predicted masks and the reference polygon annotations for metric computation.
Two inputs were required for the segmentation workflow: (i) the street-level image in PNG or JPG format, acquired from Google Street View or mobile phones, and (ii) a JSON file containing the polygon-based ground-truth (GT) annotations of Leucaena. Within the processing pipeline, the irregular polygon annotations were automatically converted into regular bounding boxes, which were used as box prompts to guide the SAM zero-shot model. The model output consists of pixel-level segmentation masks, which were subsequently compared with the original polygon-based GT annotations to quantitatively evaluate the segmentation performance through the calculation of evaluation metrics.
For the SAM zero-shot experiments, three datasets were defined: DS1 with 20 SV images, DS2 with 20 MP images, and DS3 with a total of 40 images combining SV and MP data. The combined dataset (DS3) was included to evaluate the overall robustness of the SAM zero-shot model when applied to heterogeneous street-level imagery, allowing for the assessment of its generalization capability across different acquisition sources and urban visual conditions.

2.4.2. You Only Look Once (YOLO) and Detection Transformer (DETR)

YOLOv8 is an object detection algorithm that has gained prominence in computer vision due to its high detection accuracy and real-time performance [36,37]. Released by Ultralytics in January 2023, YOLOv8 represents an advancement over previous versions of the YOLO family by incorporating architectural improvements that enhance feature extraction and detection efficiency. The network follows a standard detection pipeline composed of an input module, a backbone for feature extraction, a neck for feature aggregation at multiple scales, and an output head for object prediction. These design choices enable YOLOv8 to effectively detect objects of varying sizes in complex scenes.
YOLOv8 provides different model scales by adjusting network depth and width, including YOLOv8n (nano), YOLOv8s (small), YOLOv8m (medium), YOLOv8l (large), and YOLOv8x (extra-large) [36,38]. In this study, the YOLOv8m model was selected as a compromise between detection accuracy and computational efficiency, making it suitable for urban street-level imagery with heterogeneous visual conditions.
The Detection Transformer (DETR) represents a pioneering transformer-based approach for object detection, reformulating detection as a direct set prediction problem [39]. DETR consists of three main components: a convolutional neural network (CNN) backbone for feature extraction, an encoder, a decoder transformer for global reasoning, and a feedforward network for final object predictions. Unlike traditional object detectors, DETR eliminates the need for hand-crafted components such as anchor boxes and non-maximum suppression, simplifying the detection pipeline while enabling robust object localization [40]. In this study, DETR was implemented using a ResNet50 backbone.
Both YOLOv8 and DETR were trained and evaluated using the full dataset of 422 annotated street-level images, comprising SV and MP images. The dataset was divided into 70% for training, 15% for validation, and 15% for testing. Details of the hyperparameters used for each model are provided in Table 1. For the object detection experiments with YOLOv8 and DETR, a total of 422 street-level images were annotated using bounding boxes in the LabelMe software.
For the object detection experiments using YOLOv8 and DETR, in the MP images, a total of 490 samples of the ‘Leucaena’ class and 270 samples of the ‘Other’ class were annotated. In contrast, the SV dataset contained a substantially larger number of instances, with 2044 ‘Leucena’ samples and 2519 ‘Other’ samples. This difference is primarily attributed to the characteristics of the image acquisition platforms. MP images capture a more limited field of view, typically focusing on a smaller portion of the urban scene and often containing one or a few trees per image. Conversely, Google SV images are panoramic (360°) and cover a much wider spatial extent, frequently including multiple trees and surrounding vegetation within a single frame, which increases the number of annotated instances (Figure 4). Despite differences in labeling between MP and SV images, all performance metrics were computed consistently across datasets, allowing for a comparison of model behavior under distinct urban imaging conditions.
The joint use of SV and MP datasets enhances the representativeness of urban conditions, providing complementary information that reflects both large-scale streetscape patterns and localized urban variability. Since the main objective was to assess model behavior across distinct image acquisition domains rather than to compare balanced class distributions, preserving the natural instance density allowed a more realistic evaluation of domain-dependent performance. Although some dataset splits contain a limited number of test images, evaluation metrics were computed at the instance level, where each annotated tree was treated as an individual object. This increases the effective number of evaluation samples beyond the image count alone.
All experiments were conducted under the same hardware conditions to ensure comparability, using a Ryzen 7 5700X CPU, an NVIDIA RTX 3090 GPU, and 32 GB of DDR4 RAM. The training time was approximately 2 h for YOLOv8 and 3.5 h for DETR.
The images were divided into 3 datasets: Dataset 4 = 205 SV images; Dataset 5 = 217 MP images; Dataset 6 = 422 images (sum of Dataset 4 and Dataset 5).

2.5. Evaluation Metrics

The performance of the deep learning models was evaluated using a set of widely adopted segmentation and object detection metrics, including accuracy, precision, recall, F1-score, mean average precision at 50% intersection over union (mAP50), and mean average precision from 50% to 95% IoU (mAP50-95). Accuracy, precision, recall, and F1-score were used to assess the overall segmentation performance, capturing different aspects of prediction correctness, class discrimination, and the balance between false positives and false negatives.
For object detection performance, mAP50 and mAP50-95 were employed as standard evaluation metrics. The mAP50 metric measures the average precision across object classes considering a fixed IoU threshold of 50%, where detections are regarded as correct when the overlap between predicted and ground-truth bounding boxes exceeds this threshold [41,42]. In contrast, mAP50-95 provides a more stringent and comprehensive evaluation by averaging precision over multiple IoU thresholds ranging from 50% to 95% in increments of 5%, thereby assessing the robustness of the model under varying levels of localization accuracy [41,42].
For object detection (YOLOv8 and DETR), metrics were computed at the instance level, considering each tree as an individual object defined by a bounding box. Performance was evaluated using IoU-based matching between predicted and ground-truth bounding boxes, which supports the computation of recall, mAP50, and mAP50-95. For segmentation (SAM zero-shot), evaluation was performed at the pixel level. Ground-truth polygon annotations (LabelMe JSON) were rasterized into binary masks and compared against predicted SAM binary masks. The masks were flattened into one-dimensional arrays to compute pixel-wise confusion matrix elements, from which accuracy, precision, recall, and F1-score were derived.
Together, these metrics offer a comprehensive assessment of model performance by jointly evaluating detection accuracy, localization precision, and the balance between correctly identifying relevant objects and minimizing false detections. The mathematical formulations of the evaluation metrics used in this study are presented in Table 2.

3. Results

3.1. Segmentation with SAM

The experiments were conducted using the SAM zero-shot model implemented in Google Colaboratory. In these experiments, segmentation was guided exclusively by box prompts. Evaluation metrics were computed individually for each of the 40 annotated images, and the average values are summarized in Table 3. Given that SAM was evaluated in a zero-shot configuration without training, a subset of 40 annotated images (20 SV and 20 MP) was selected to provide a controlled comparative assessment between acquisition domains. This exploratory design aimed to analyze domain-dependent behavior rather than to establish large-scale statistical inference.
Overall, the SAM zero-shot model exhibited better segmentation performance when applied to street-level images acquired from Google SV compared to MP images. As shown in Table 3, the average accuracy and F1-score obtained from street view images were approximately 29% and 27% higher, respectively, than those derived from MP imagery. These results indicate a greater robustness of SAM zero-shot when applied to SV data.
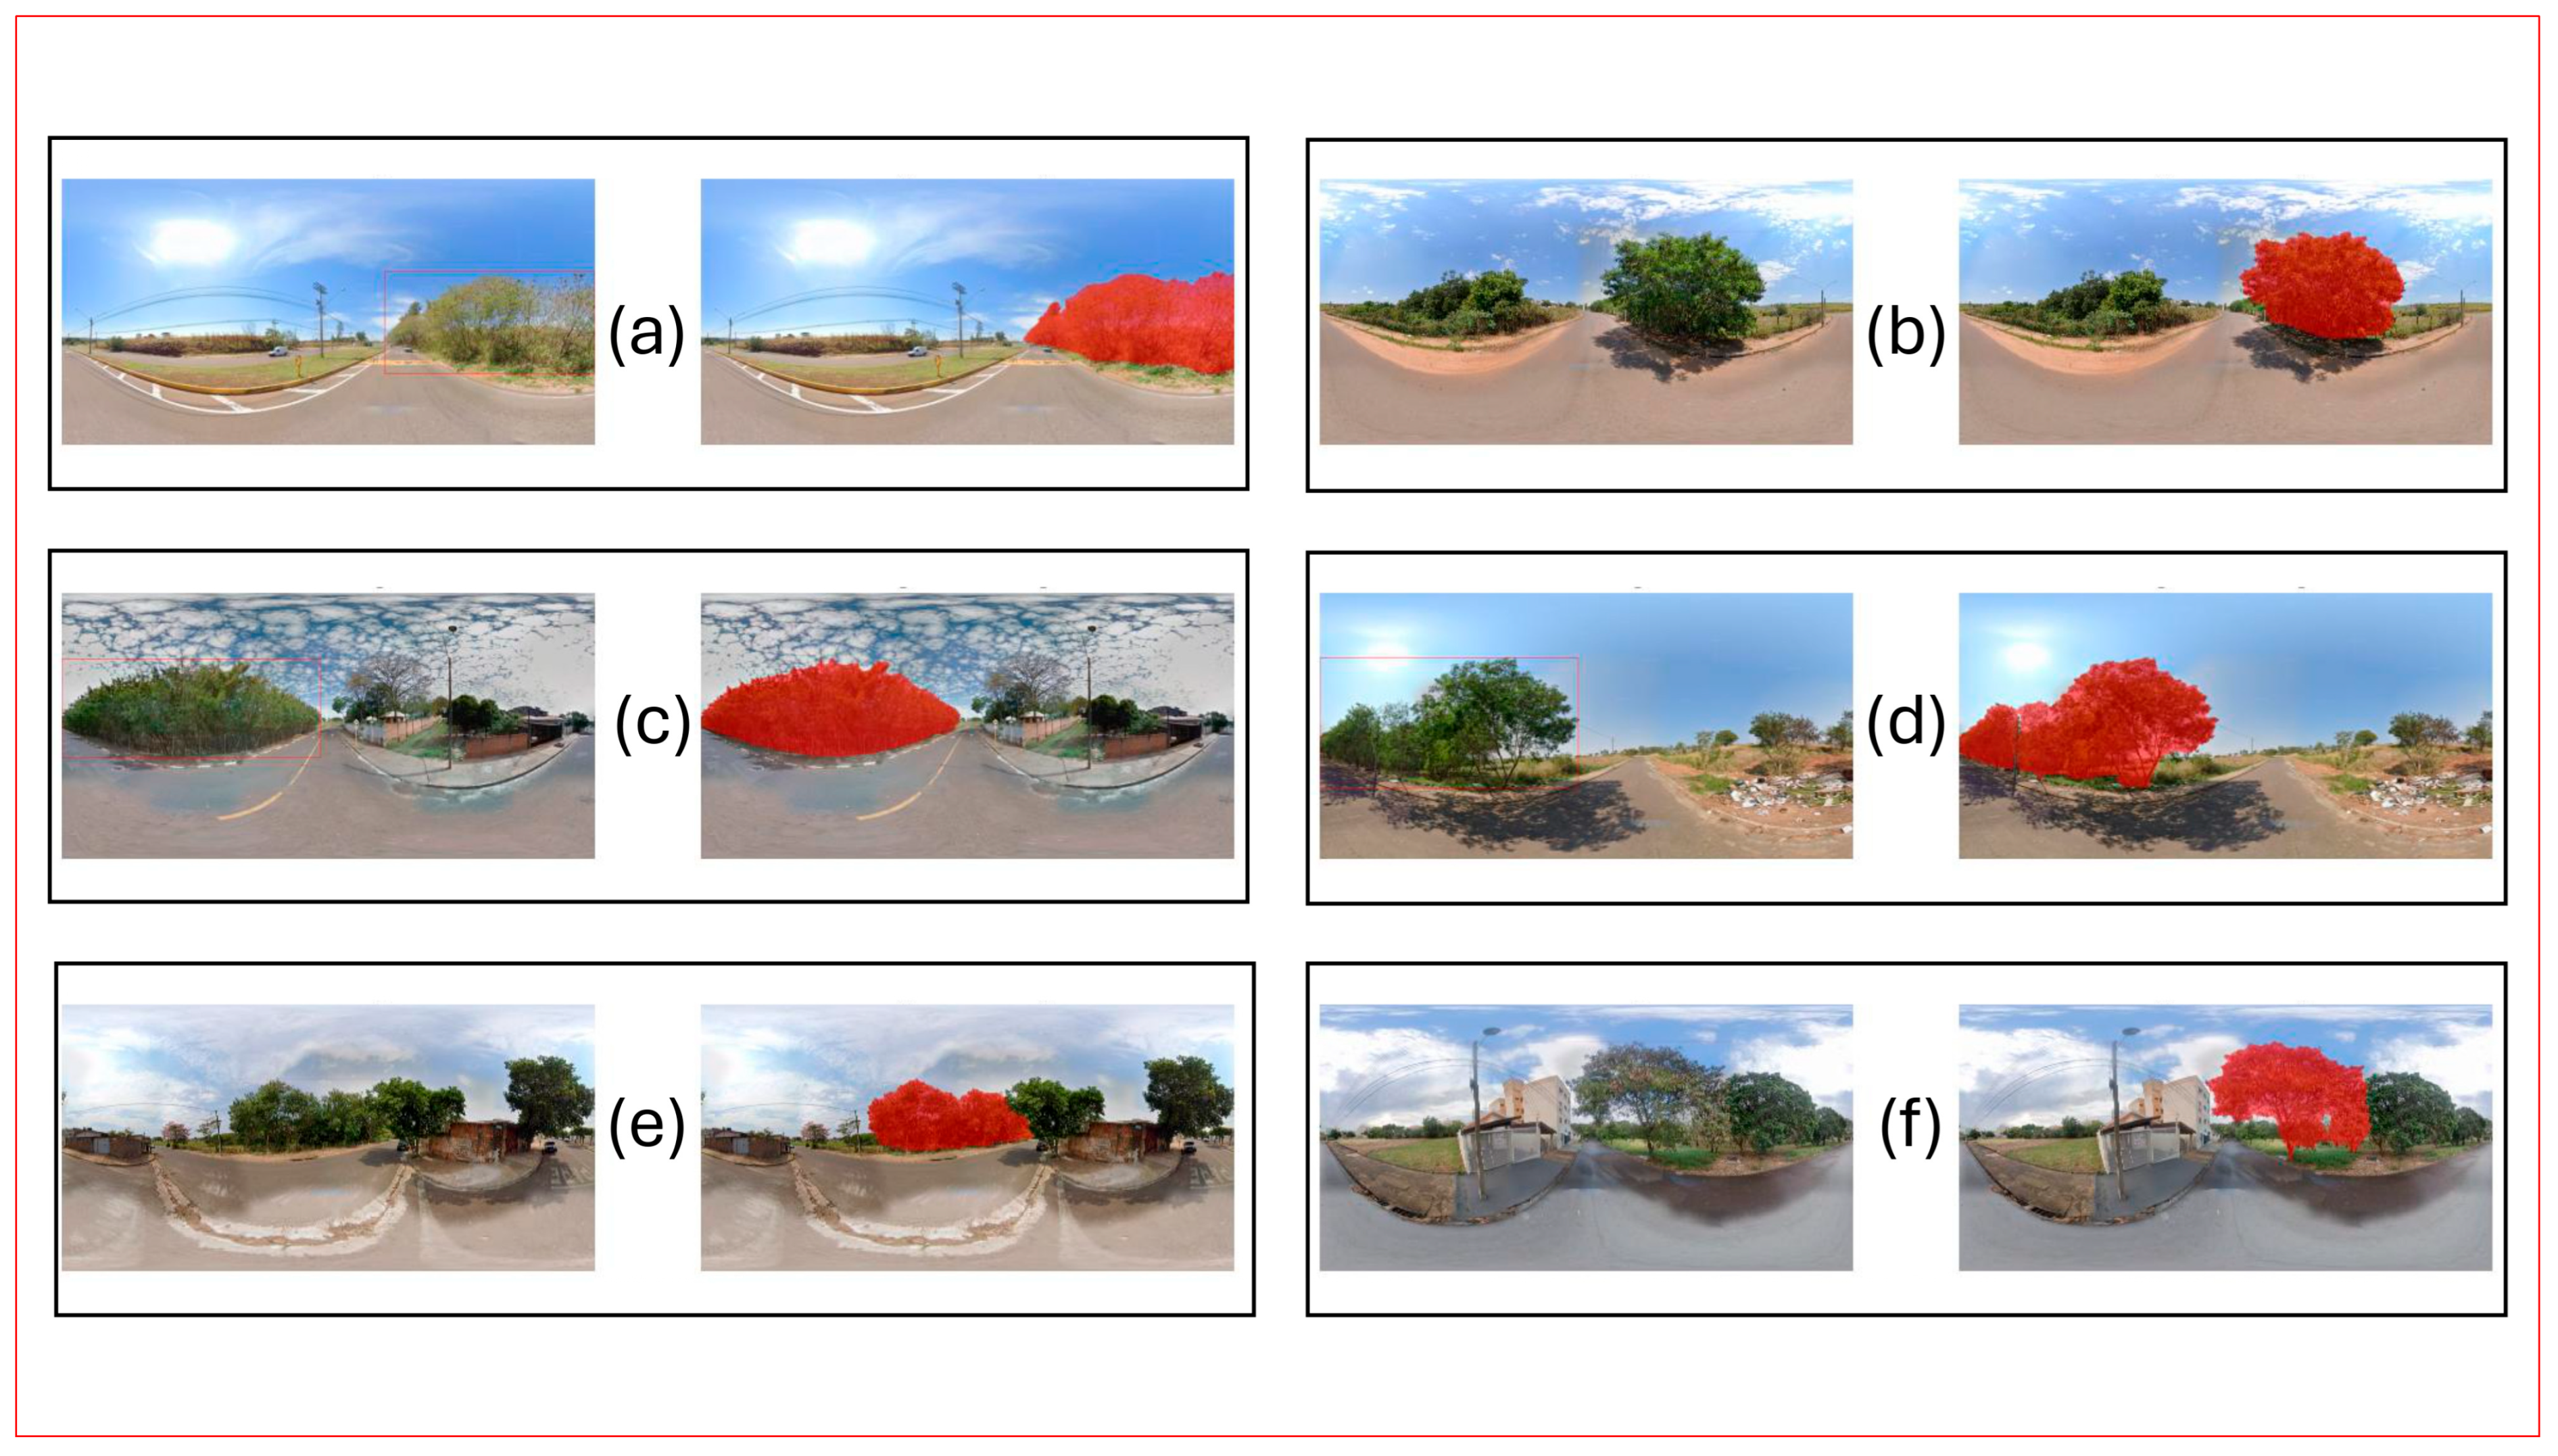
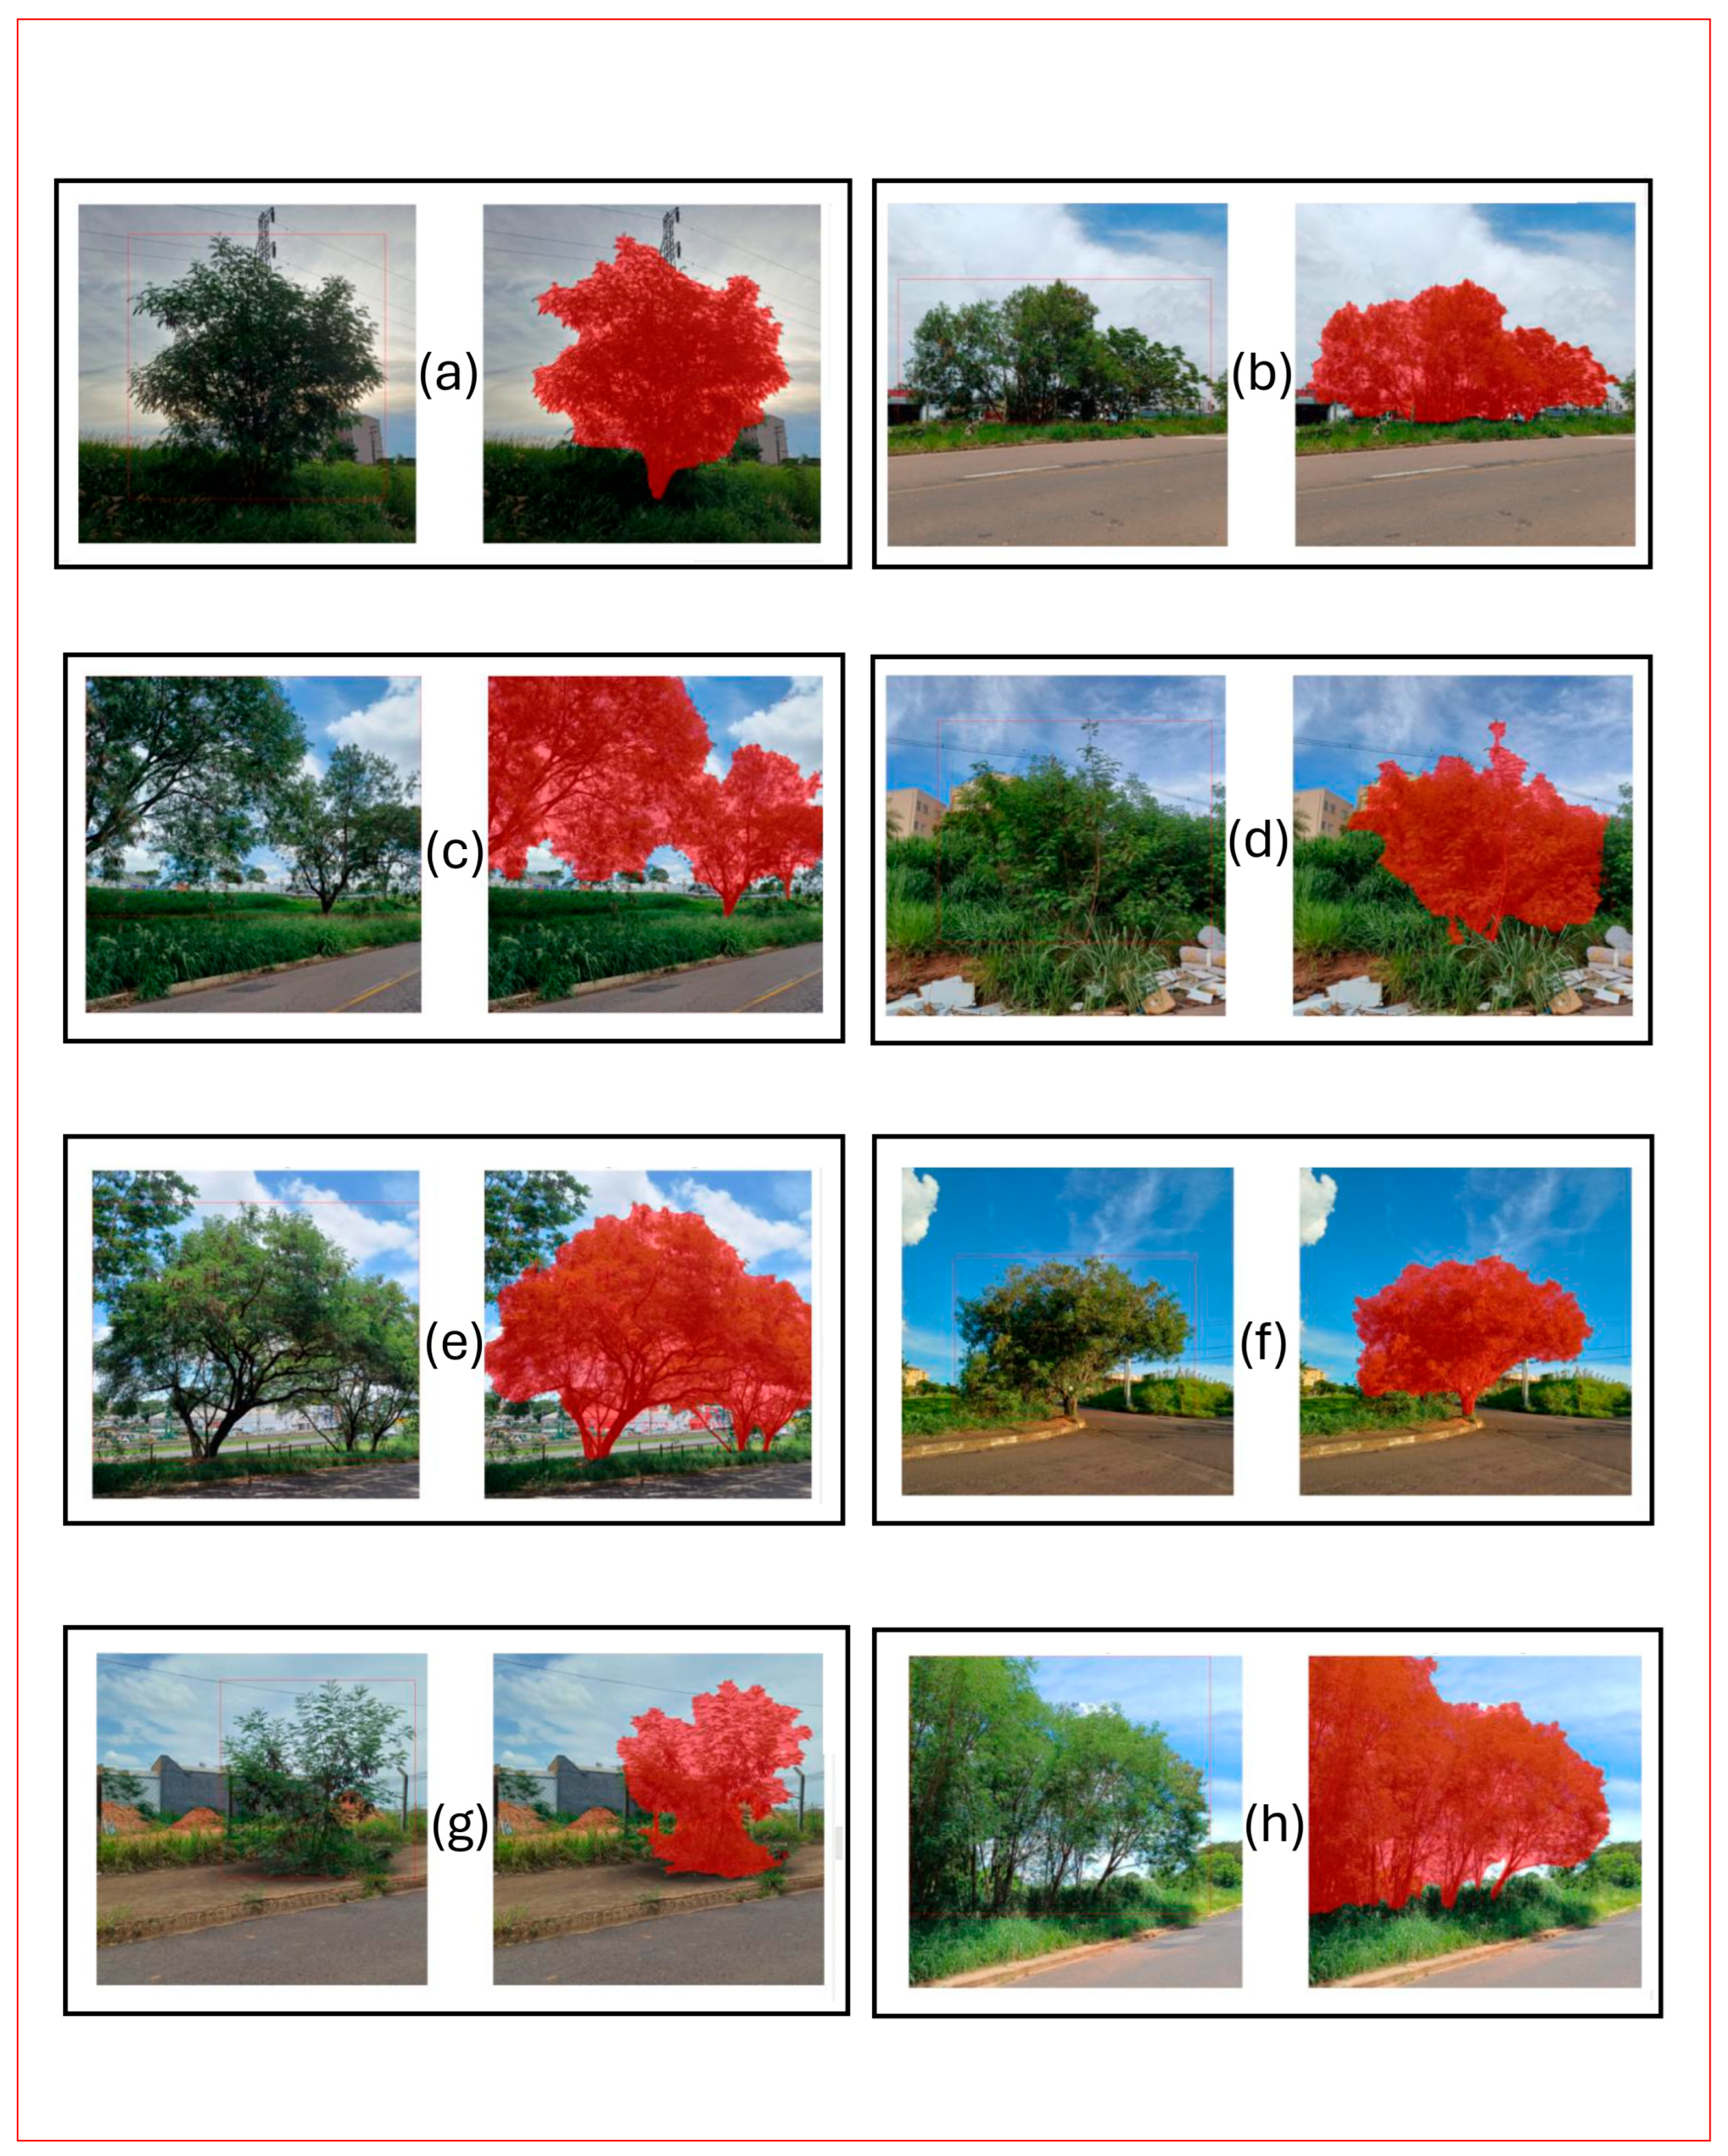
Visual inspection of the segmentation outputs further supports the quantitative results. Figure 4 and Figure 5 illustrate representative examples of SAM zero-shot segmentation using Google SV images. In these cases, the model successfully delineated Leucaena trees, including scenarios in which multiple individuals of the target species were present in the same image. In addition, SAM demonstrated the ability to segment Leucaena even in complex environments where the trees were surrounded by other vegetation types, such as shrubs and grasses.
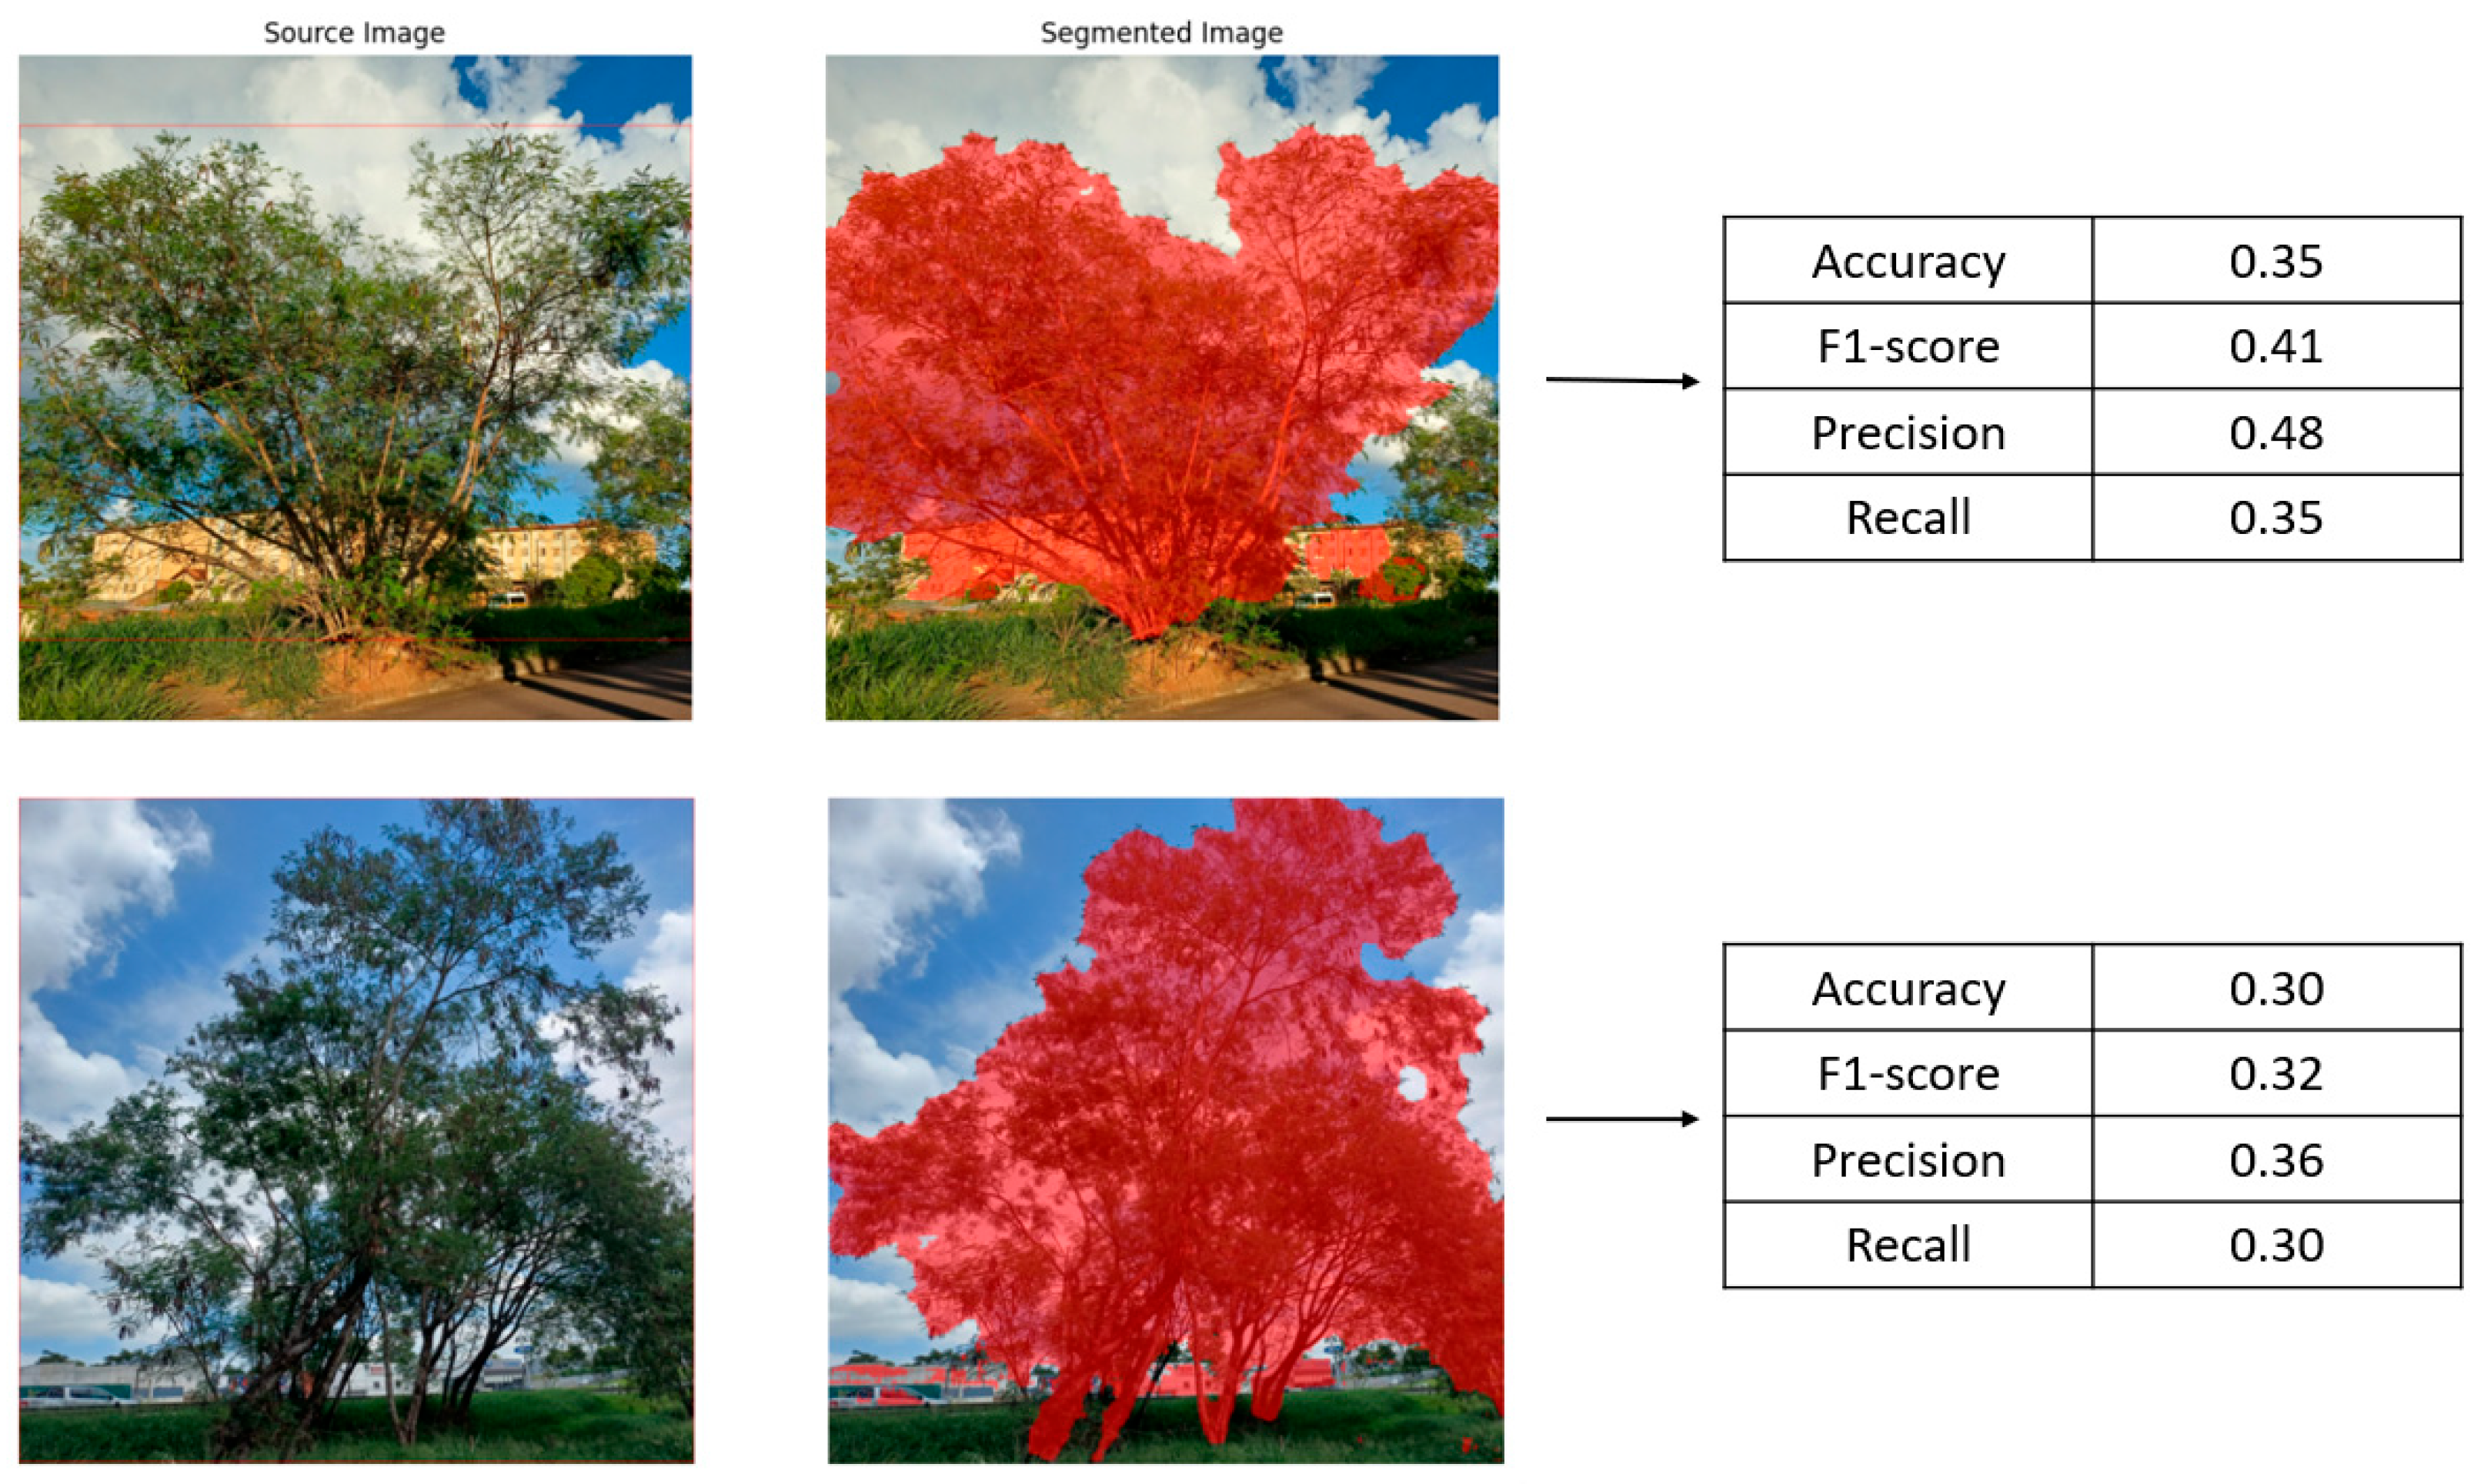
In contrast, segmentation performance on MP images was notably lower, with some evaluation metrics reaching values around 0.35 (Figure 6). In several cases, regions belonging to non-target objects, such as buildings and vehicles, were incorrectly included within the segmented masks when box prompts were defined around Leucaena trees. These misclassifications are likely associated with the presence of complex backgrounds, occlusions, and overlapping objects commonly found in mobile phone imagery. Such factors can introduce visual ambiguity, leading the SAM zero-shot model to incorrectly segment portions of the scene and resulting in reduced accuracy and F1-score values compared to those obtained from SV images.
Although the SAM demonstrates strong generalization capabilities, in highly complex urban scenes, such as those captured by MP, this limitation can hinder the model’s ability to precisely discriminate the target species from visually similar elements in the surrounding environment when multiple arboreal species with similar visual characteristics coexist in the same scene. Consequently, portions of the scene that share texture, color, or structural similarities with tree canopies may be erroneously segmented as the species of interest, leading to reduced accuracy and F1-score values compared to those obtained from SV images.
These results suggest that, while SAM zero-shot is effective for initial and rapid segmentation assessments, additional model adaptation is likely required to achieve more robust and consistent performance in challenging street-level scenarios. Approaches such as one-shot, as well as the incorporation of task-specific training data, may improve segmentation accuracy by enabling the model to better capture the visual characteristics of Leucaena under diverse urban conditions. Therefore, the findings highlight both the potential and the limitations of SAM zero-shot for urban vegetation segmentation, emphasizing the importance of tailored training strategies for applications involving complex and heterogeneous imagery.

3.2. Object Detection with YOLOv8 and DETR

The performance of the YOLOv8 and DETR networks was evaluated using three different datasets, and the average results are summarized in Table 4. Dataset 4 consisted of 205 street-level images acquired from Google SV, Dataset 5 comprised 217 MP images, and Dataset 6 combined all 422 images from both sources (SV + MP).
For YOLOv8, consistent and robust performance was observed across all datasets, with recall values ranging from 0.749 to 0.766 and mAP50 values exceeding 0.83 in all cases. The best overall performance was achieved with the combined dataset (Dataset 6—SV + MP), yielding the highest recall (0.766) and a competitive mAP50-95 value (0.540). These results indicate that YOLOv8 benefits from the inclusion of heterogeneous street-level imagery, as the combination of SV and MP images enhances the model’s ability to learn and generalize the visual characteristics of Leucaena across diverse urban conditions, including perspective distortions, illumination variability, and differences in image quality.
In contrast, DETR exhibited more variable performance depending on the dataset. While the model achieved relatively high results when trained exclusively on MP images (Dataset 5), with a recall of 0.684 and mAP50 of 0.847, its performance declined substantially when trained on SV images alone (Dataset 4) and when combining datasets (Dataset 6). In these scenarios, recall values dropped to approximately 0.22, and mAP50-95 values fell below 0.17. This reduction in performance suggests that DETR is more sensitive to domain heterogeneity, with a more pronounced degradation observed in datasets containing SV images, likely associated with panoramic distortion. However, additional experiments are required to further investigate and confirm this behavior.
Overall, the quantitative results demonstrate that YOLOv8 provides more stable and reliable detection performance across heterogeneous street-level datasets, whereas DETR exhibited lower performance in datasets containing street view imagery and showed improved results under more homogeneous data conditions, such as mobile phone images. These findings highlight the importance of model architecture and training strategies when dealing with diverse urban imagery sources.
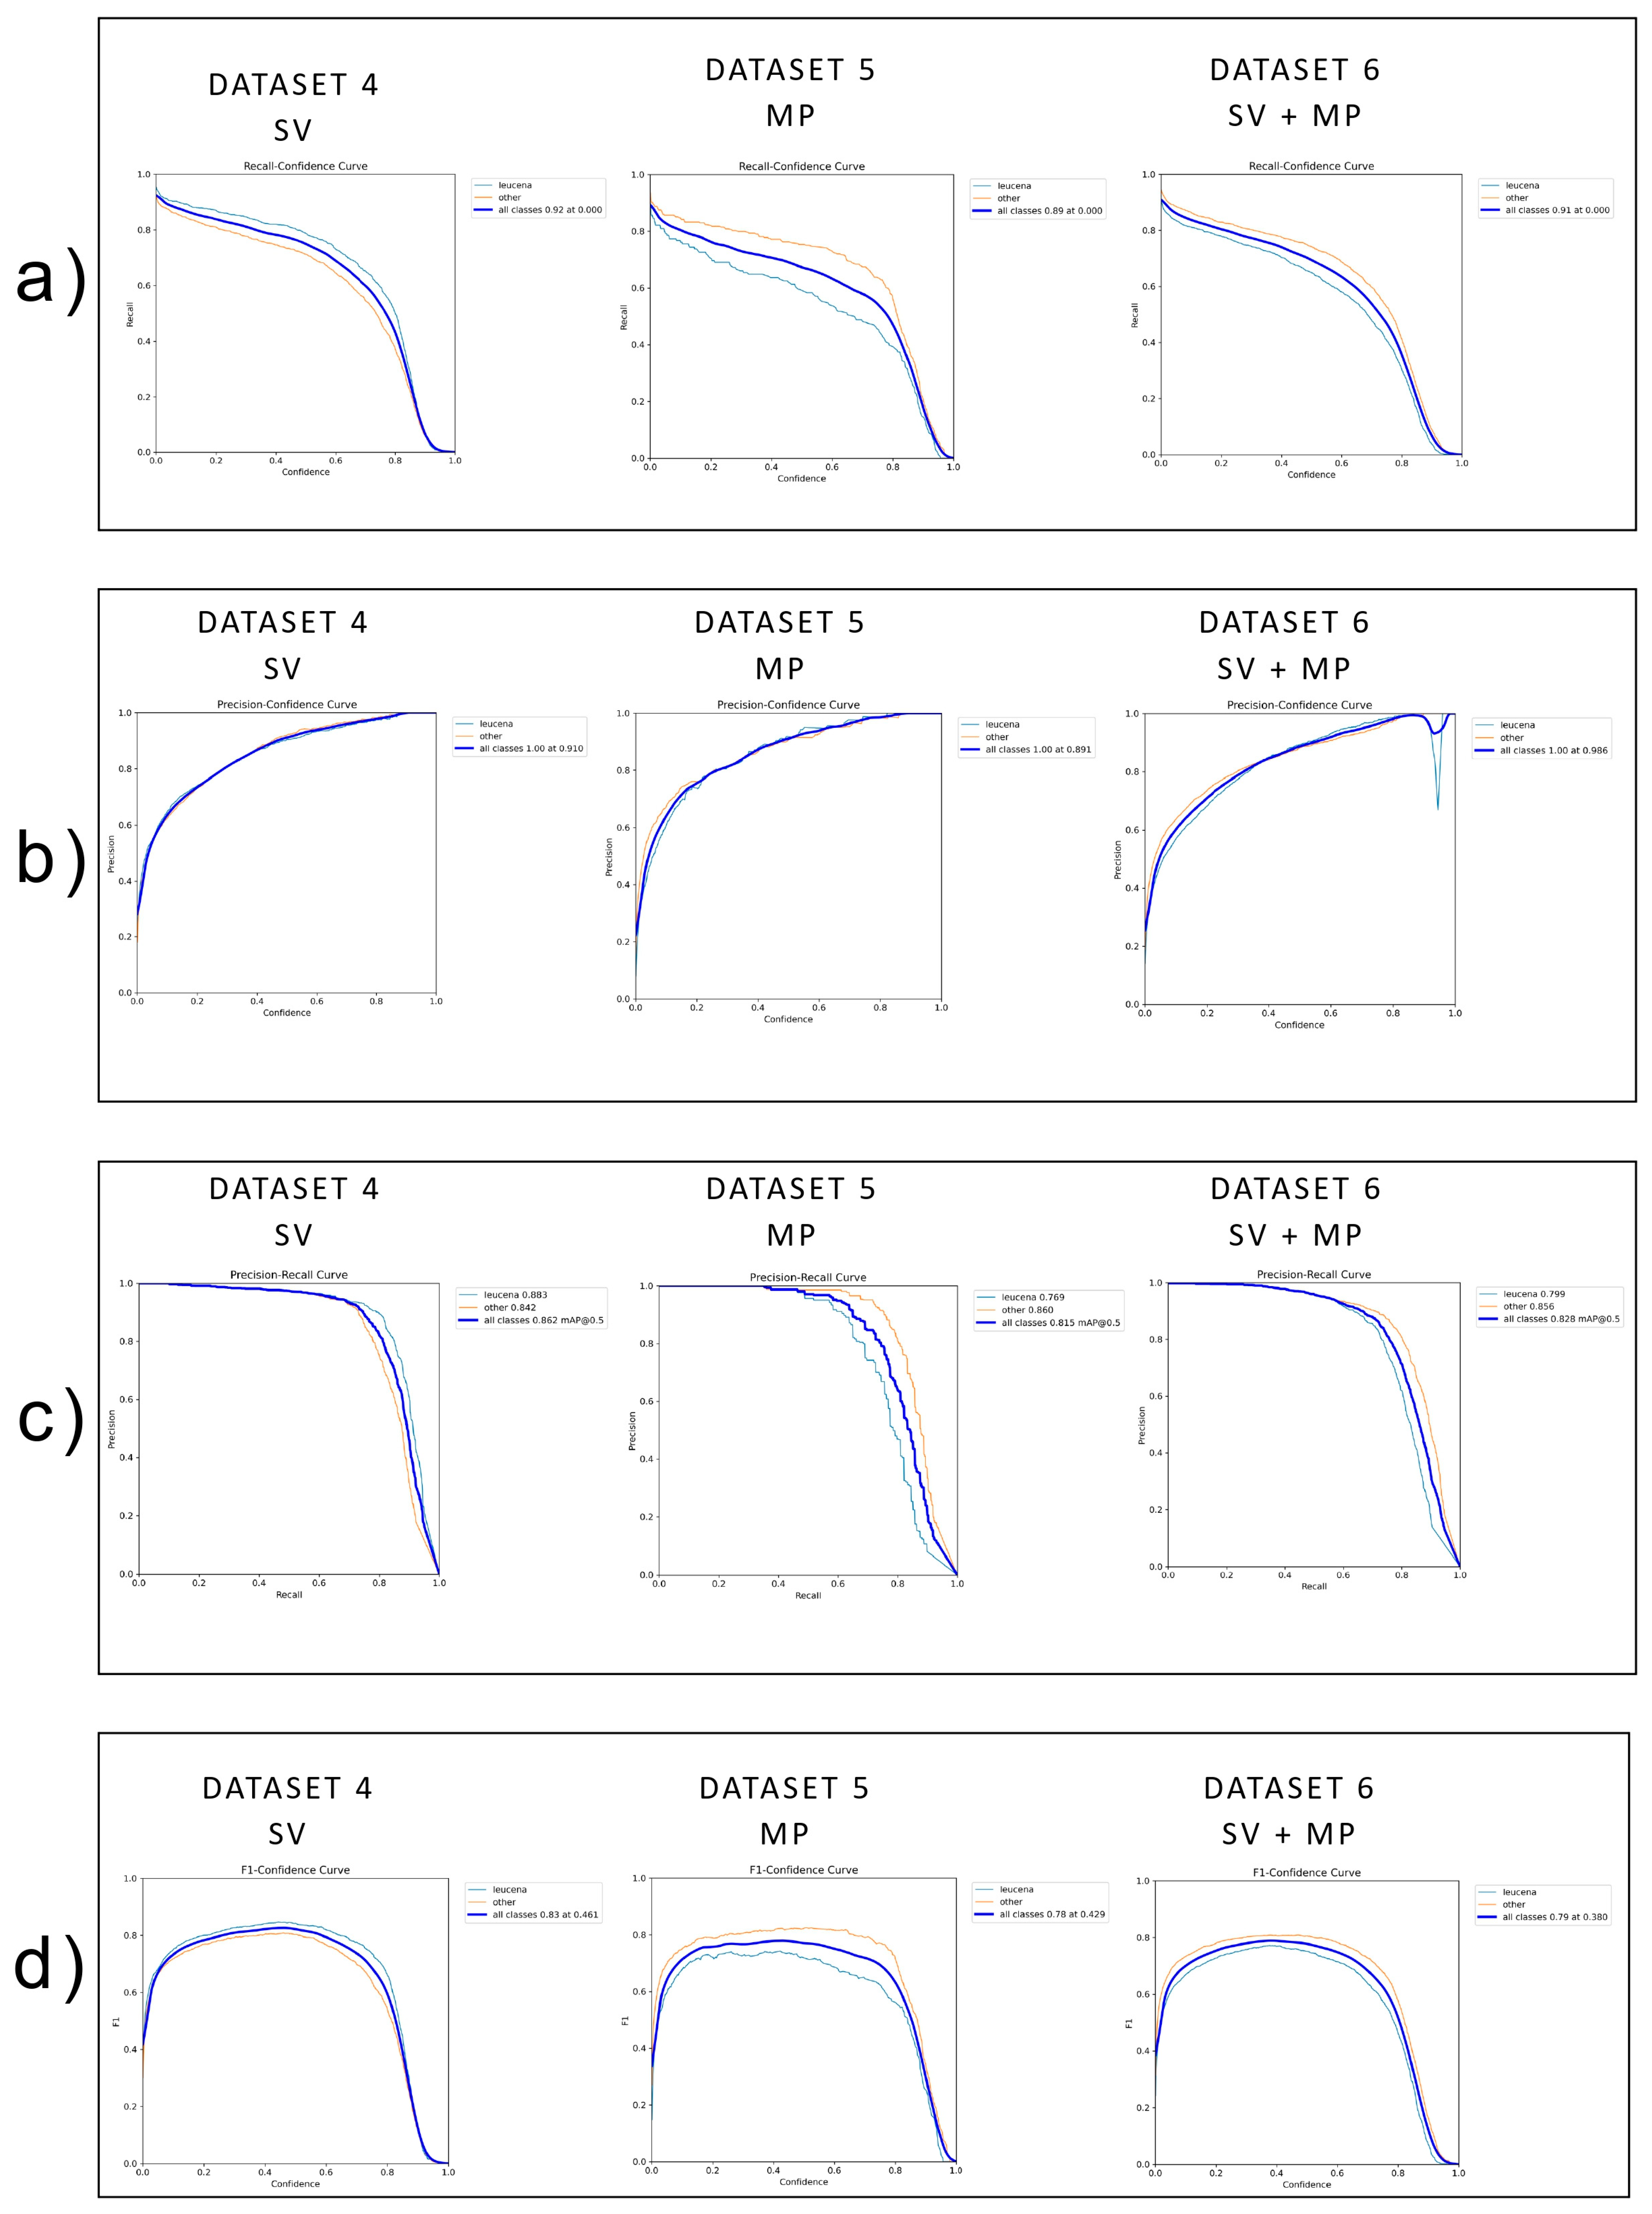
Figure 7 presents the confidence-based performance curves for the YOLOv8 network across the three datasets, including recall–confidence, precision–confidence, precision–recall, and F1-score–confidence curves.
According to Figure 7, for Dataset 4 (SV images), the curves indicate a balanced trade-off between precision and recall, reflecting the model’s ability to consistently detect Leucaena in panoramic street-level scenes. For Dataset 5 (MP images), a slight reduction in recall at higher confidence thresholds is observed, which is consistent with the greater variability and complexity of MP imagery. Nevertheless, the precision–recall and F1-score–confidence curves demonstrate that YOLOv8 maintains competitive performance, indicating effective discrimination between the target species and other arboreal classes.
The curves corresponding to Dataset 6 (SV + MP) show improved stability across all metrics, particularly in the precision–recall and F1–confidence plots. This behavior corroborates the quantitative results presented in Table 4 and highlights the advantage of combining images from different sources to enhance the robustness of the YOLOv8 model. Together, these visual analyses reinforce the conclusion that YOLOv8 is capable of learning discriminative features for Leucaena detection under diverse urban imaging conditions.
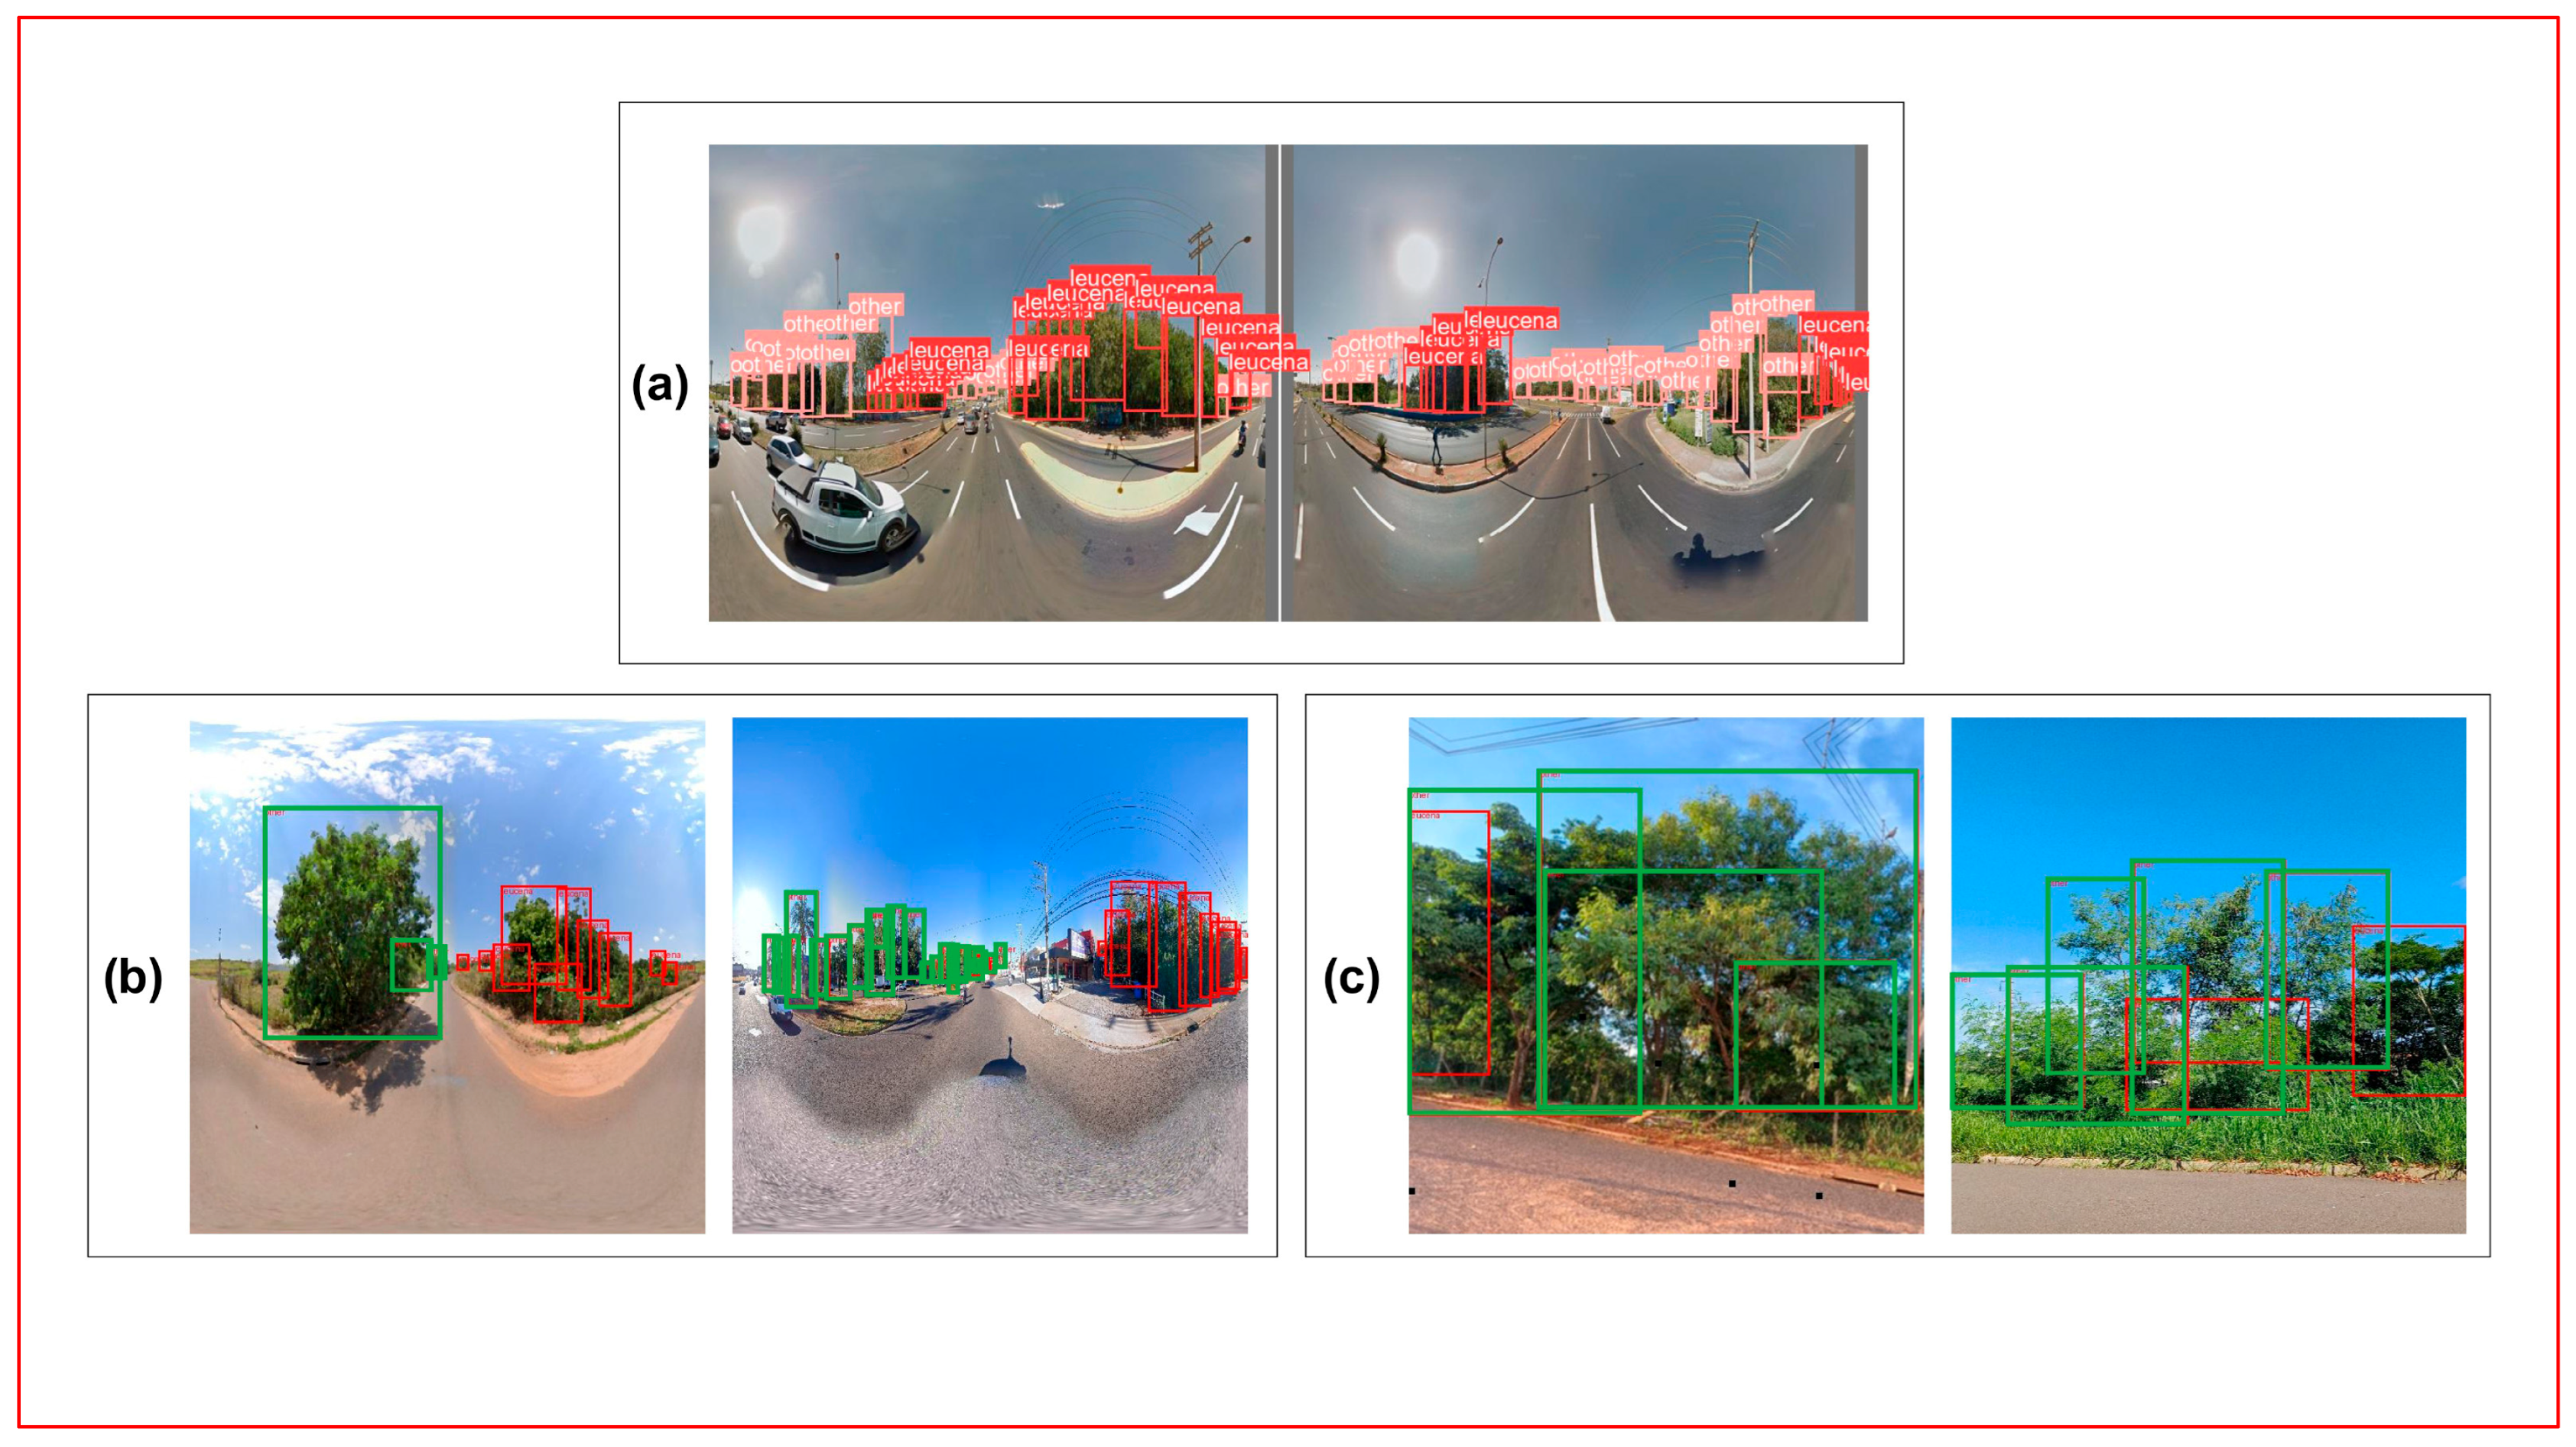
Figure 8 presents visual examples of object detection results obtained exclusively with the YOLOv8 network. The examples illustrate the model’s behavior during the training phase as well as its performance when applied to street-level images acquired from different sources. Overall, YOLOv8 demonstrated a consistent ability to detect Leucaena leucocephala across diverse urban scenarios, including panoramic SV images and conventional MP images. The bounding boxes generated by the model effectively delineated the target species even in complex scenes containing multiple trees, occlusions, and perspective distortions, indicating robust feature extraction and generalization capabilities.
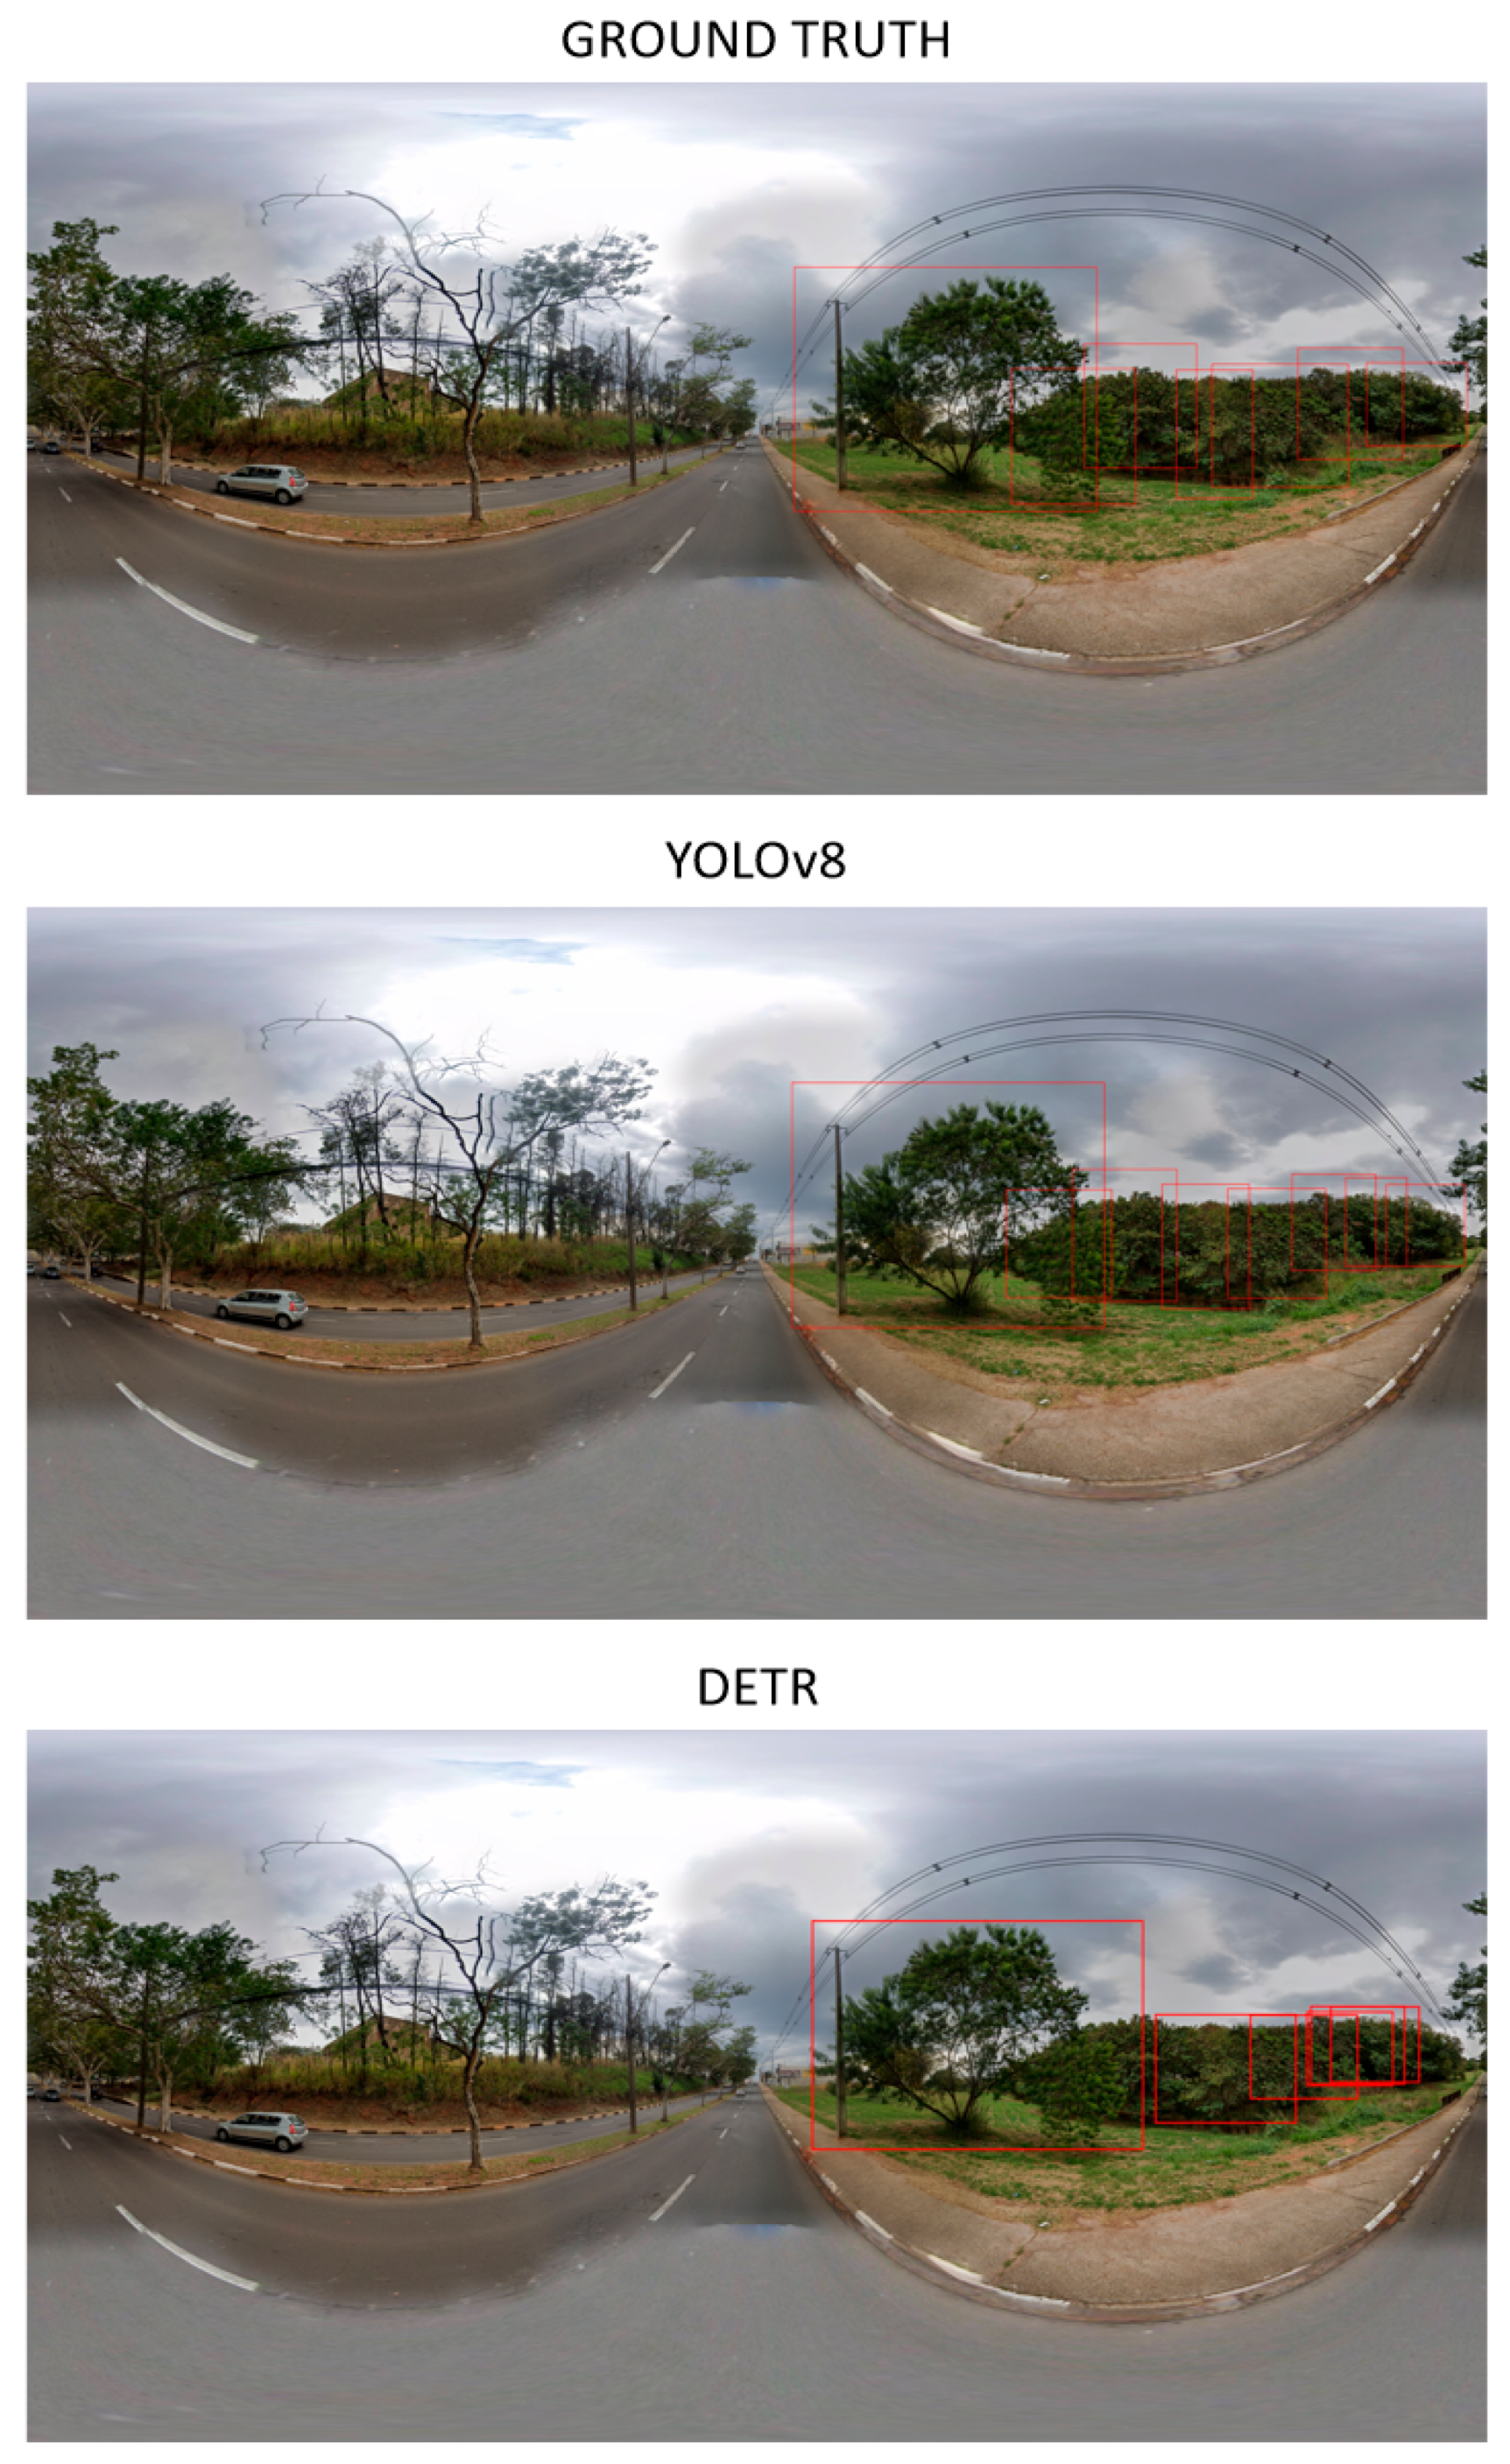
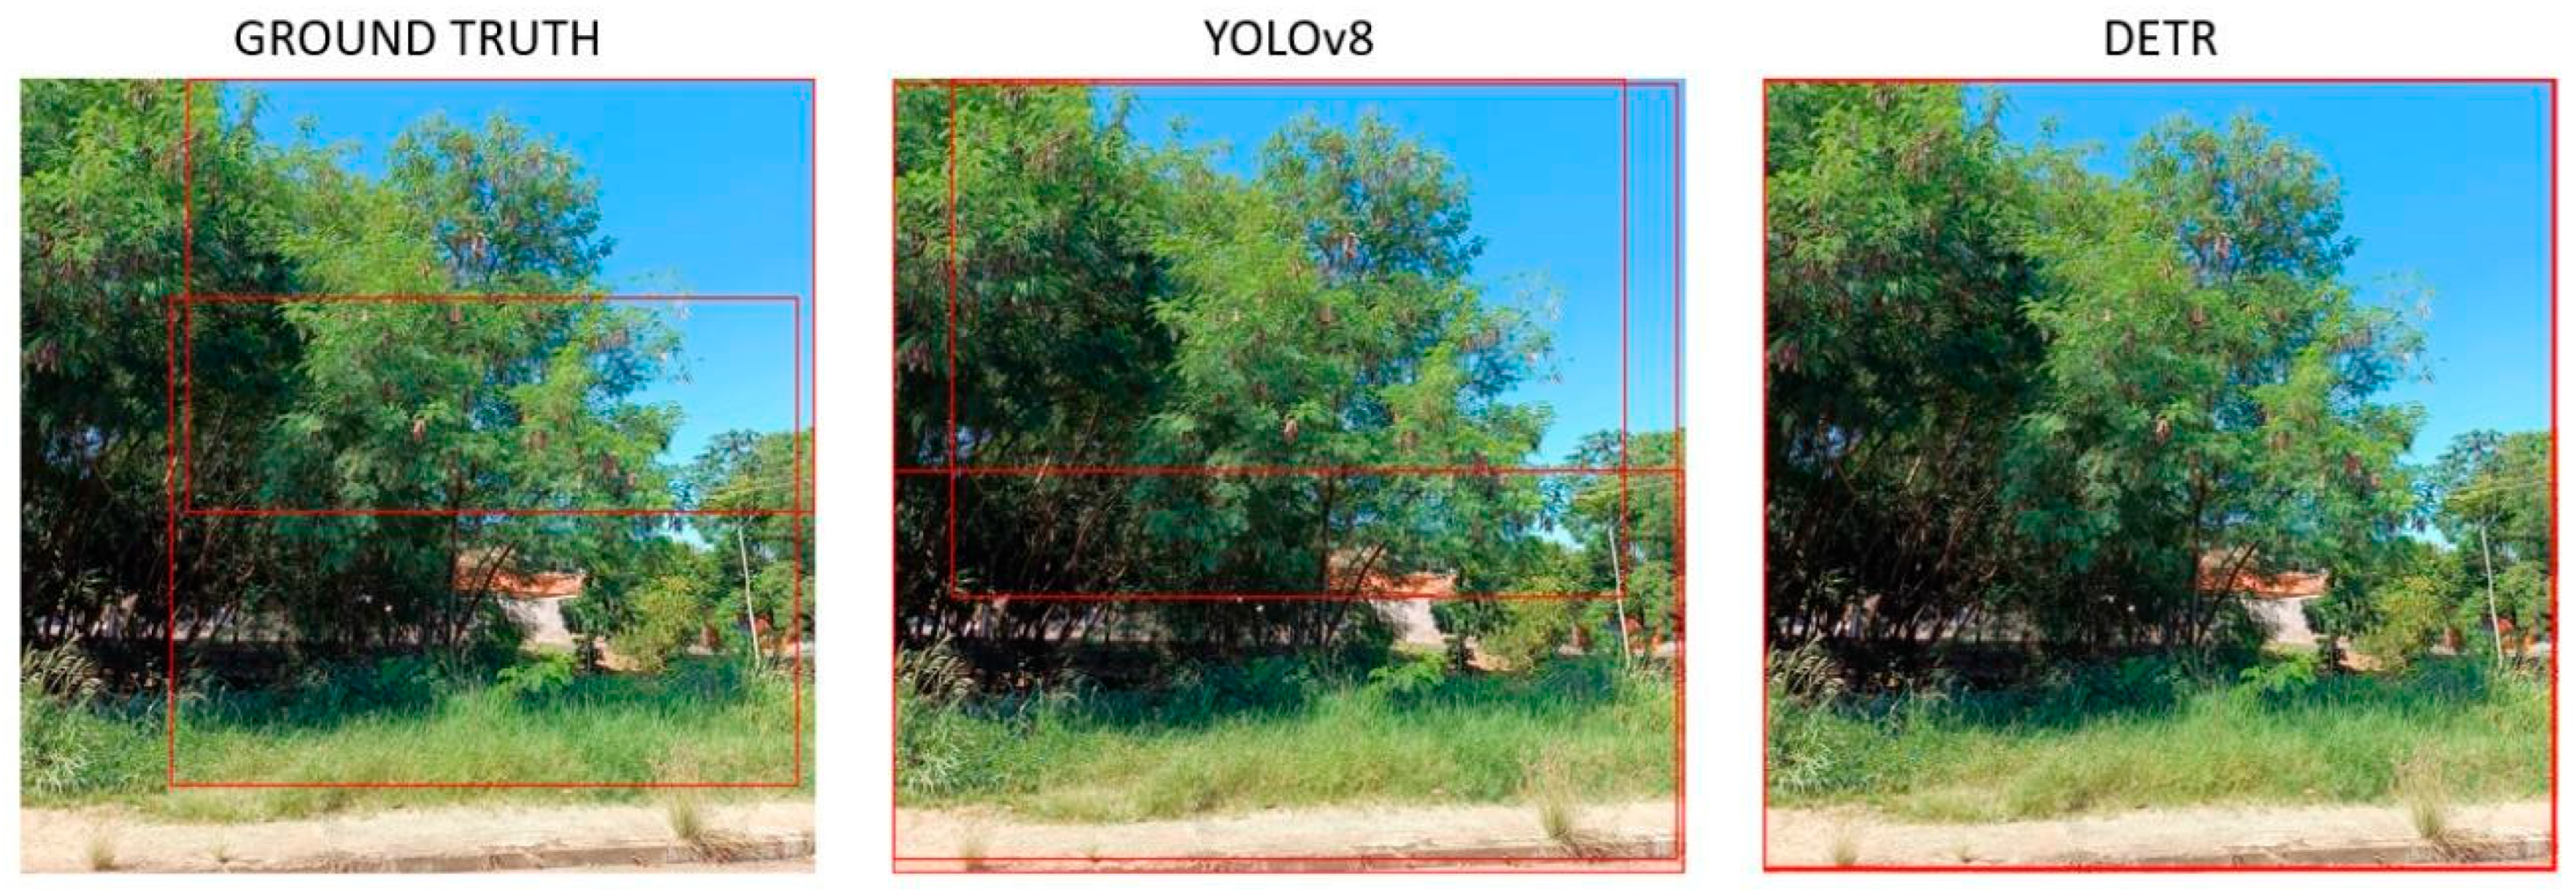
Figure 9 and Figure 10 provide additional qualitative comparisons by presenting detection results obtained during the testing phase using both the YOLOv8 and DETR models. Figure 9 shows examples based on SV images, while Figure 10 illustrates results derived from MP images. These figures highlight differences in detection behavior between the two models, particularly in terms of bounding box coverage and sensitivity to background complexity. While YOLOv8 generally produced more stable and comprehensive detections across varying conditions, DETR exhibited greater variability, especially in scenes characterized by heterogeneous backgrounds and overlapping vegetation. This behavior can be partly explained by the transformer-based architecture of DETR, which relies on Vision Transformers (ViTs) and typically requires larger and more diverse training datasets to achieve robust generalization when compared to convolutional neural network-based models.
Together, these visual analyses complement the quantitative results presented in Table 4, reinforcing the observed performance trends and demonstrating the strengths and limitations of each model when applied to street-level imagery for urban tree species detection.

4. Discussion

The application of artificial intelligence has become fundamental for the analysis and segmentation of urban imagery, enabling the accurate identification and delineation of multiple landscape elements, including vegetation types [44,45]. Deep learning-based approaches allow for the extraction of discriminative visual features from complex urban scenes, supporting urban planning, environmental monitoring, and natural resource management [16,17].
The results obtained with the SAM applied to Google SV images for the segmentation of Leucaena validate the effectiveness of this approach as a low-cost and scalable solution for identifying tree species in urban environments. The wide availability of street view imagery in cities worldwide represents a major advantage for large-scale monitoring applications. In this study, the box prompt proved to be an effective strategy for guiding the SAM zero-shot model, corroborating findings reported in previous studies [46,47].
Despite its innovative potential, SAM is not free from limitations. The segmentation results obtained with mobile phone images revealed reduced performance in some cases, particularly in scenes characterized by strong illumination variability, shadows, background clutter, and overlapping objects. Similar challenges have been reported in the literature, where shadows and visual ambiguities caused segmentation errors even when SAM achieved high overall accuracy and intersection over union (IoU) values [48,49]. These limitations are inherent to the zero-shot configuration, which relies solely on pre-trained representations without domain-specific adaptation.
Previous studies have highlighted additional constraints of SAM, especially when applied beyond its primary RGB training domain. Although SAM has demonstrated strong generalization capabilities, it may struggle with multispectral or hyperspectral data and complex environmental scenes [26,50]. Applications in medical imaging have also reported issues related to ambiguity and modality imbalance in segmentation, reinforcing that SAM performance can be affected when standard parameters are used without fine-tuning [51,52].
Nevertheless, SAM represents a significant advance in computer vision by promoting foundation models that reduce the need for extensive data annotation while maintaining good generalization performance [26,53,54]. In the context of urban vegetation, the use of SAM for identifying potentially invasive species such as Leucaena enables the mapping of priority areas for conservation and supports decision-making processes aimed at sustainable urban landscape management.
The integration of deep learning and image segmentation allows environmental managers to accurately map and monitor invasive species distribution, prioritize control actions, and guide restoration efforts in compliance with environmental regulations, as invasive species can disrupt ecosystem services and biodiversity. Continuous monitoring further ensures that restored areas remain resilient to reinvasion, contributing to long-term biodiversity conservation.
Regarding object detection, the YOLOv8 network demonstrated superior performance compared to DETR, achieving faster inference times and higher detection accuracy. In this study, YOLOv8 was approximately 70 times faster than DETR. YOLOv8, released in 2023, represents an architecture optimized for both speed and accuracy [36,55] and has been widely applied in environmental and agricultural contexts, including tree, leaf, and crop detection [56,57,58]. YOLOv8 showed more stable performance under the experimental conditions adopted in this study, likely due to its convolutional architecture and multi-scale feature aggregation, which are well-suited to heterogeneous urban imagery. In contrast, DETR and SAM performance should be interpreted within the context of dataset size, training configuration, and scene complexity, rather than as indicators of inherent architectural superiority.
Previous studies using YOLO-based models have highlighted their effectiveness in street view imagery, despite challenges associated with panoramic distortions [59,60]. In the present study, distortions inherent to 360° street view images posed additional difficulties for object detection, particularly because Google vehicles capture imagery from a single travel direction, causing asymmetrical distortions [61]. In this study, attempts to mitigate these effects through geometric corrections and image cropping did not lead to performance improvements, suggesting that robustness to distortion must be addressed at the model or training level. Although differences in instance density were observed between the SV and MP datasets, the domain-specific evaluation demonstrated that YOLOv8 maintained stable performance across heterogeneous image sources. Future research may investigate weighted loss functions or resampling strategies to further explore the impact of instance distribution on cross-domain generalization.
DETR, although innovative in introducing transformer-based object detection, exhibited limitations in this study, especially when trained on heterogeneous datasets and considering the use of SV images. While acceptable performance was achieved using only MP images, the presence of panoramic distortions in SV imagery negatively affected DETR accuracy. This behavior aligns with previous findings indicating that DETR suffers from slow convergence and reduced performance in complex scenarios [62]. Recent advances such as DA-DETR, OW-DETR, AO2-DETR, and Semi-DETR have demonstrated improved performance through domain adaptation and enhanced training strategies [63,64,65,66], indicating promising directions for future work. It is important to note that DETR may benefit from extended training schedules or larger datasets, as reported in the literature. Future studies should explore optimized training configurations and advanced transformer-based detection variants to further investigate convergence behavior in heterogeneous street-level imagery.
In other studies, YOLOv8 demonstrated strong performance for tree detection and counting using UAV RGB imagery. For example, recent studies on Camellia oleifera showed that YOLOv8 outperformed other YOLO variants, with performance strongly influenced by dataset design and image preprocessing strategies [67]. These results reinforce that detection accuracy is highly domain-dependent and sensitive to data characteristics, supporting our observation that model behavior varies according to image source and dataset configuration.
Recent studies have also explored hybrid architectures combining detection and segmentation models. For instance, FM-SAM integrates YOLOv10 and SAM for tree crown delineation in UAV imagery, demonstrating the advantages of coupling real-time detection with strong segmentation capabilities [68]. While that framework focuses on forest canopy structure in aerial imagery, our study evaluates architectural behavior in heterogeneous street-level urban imagery and species-specific invasive detection contexts.
Overall, the results confirm that deep learning-based detection and segmentation models are powerful tools for urban vegetation analysis. YOLOv8 proved particularly effective for detecting Leucaena in street-level imagery, while SAM zero-shot offered a flexible and low-cost solution for segmentation, albeit with limitations in complex scenes. From a practical perspective, the spatial identification of potentially invasive trees can directly support public managers by enabling the creation of georeferenced urban tree inventories, an essential resource that many municipalities still lack. Such databases can guide monitoring programs, prioritize field inspections, and support decision-making related to biodiversity conservation and urban infrastructure planning. Future studies should explore one-shot or few-shot training strategies for SAM, as well as advanced transformer-based detection architectures, to further enhance performance under diverse urban imaging conditions. In addition, upcoming research may incorporate individual tree health assessment and silvicultural management needs, such as pruning interventions to prevent branch falls and conflicts with overhead power lines and public lighting systems, which remain common challenges in many cities.
In the present study, model adaptation to street-level imagery was primarily achieved through supervised training using domain-specific data for YOLOv8 and DETR, while SAM was evaluated in a zero-shot configuration to assess its intrinsic generalization capacity. Although no advanced data augmentation or domain adaptation techniques were applied, future research could incorporate distortion-aware augmentation, photometric variability simulation, domain adaptation strategies, or fine-tuning approaches to further enhance robustness in panoramic and heterogeneous urban scenes.

5. Conclusions

This study evaluated the potential of combining street-level imagery and deep learning to support the monitoring of Leucaena leucocephala, a potentially invasive tree species in urban landscapes. The results confirm that street-level images provide a valuable complementary perspective for urban vegetation assessment, particularly for species that are difficult to distinguish using aerial or orbital remote sensing.
Under the evaluated conditions, YOLOv8 showed stable detection performance (mAP50 > 0.83; recall up to 0.76), whereas DETR exhibited domain sensitivity (mAP50 = 0.45 in SV and 0.84 in MP imagery). For segmentation, SAM achieved higher performance in SV images (accuracy 0.92; F1-score 0.93) but lower results in MP imagery (accuracy 0.63; F1-score 0.66), highlighting the influence of image source on model behavior.
The SAM zero-shot model showed promising segmentation performance, especially when applied to street view (SV) images, achieving higher accuracy and F1-score compared to mobile phone (MP) images. Qualitative analyses demonstrated that SAM was able to delineate individual Leucaena trees under diverse urban contexts. However, reduced performance in MP images highlights limitations of the zero-shot configuration in highly heterogeneous scenes, where shadows, occlusions, and visually similar background elements increase segmentation ambiguity. These results indicate that, while SAM zero-shot is suitable for rapid and low-cost initial assessments, more robust performance in complex urban scenarios will likely require one-shot or few-shot fine-tuning or task-specific training.
For object detection, YOLOv8 consistently provided the most stable and robust performance across datasets, benefiting from heterogeneous training data and showing strong generalization across SV and MP imagery. In contrast, DETR achieved satisfactory results only under more homogeneous conditions and performed worse on datasets containing SV images, suggesting higher sensitivity to panoramic distortion and domain variability. This behavior indicates that transformer-based detectors may require additional adaptation strategies to effectively handle heterogeneous street-level data.
From an applied perspective, the integration of publicly available SV imagery and MP data offers a scalable and cost-effective framework for urban invasive species monitoring. This approach demonstrates potential to support urban vegetation monitoring initiatives. However, its effective application in urban planning and biodiversity conservation would require integration with spatial analysis frameworks and decision-support systems.
Although the dataset size limits broad generalization, this study provides controlled experimental evidence on architectural behavior for species-level detection under heterogeneous street-level conditions. Future studies should expand spatial coverage and incorporate domain-adaptive training strategies, distortion-aware data augmentation, and fine-tuned segmentation approaches (e.g., one-shot or few-shot learning) to enhance robustness and support large-scale deployment in panoramic and complex urban environments. These improvements may further strengthen GeoAI applications for urban invasive species monitoring and sustainable landscape management.

Author Contributions

Conceptualization, A.P.M.R.; methodology, D.E.G.F., G.M., E.L.d.L. and L.P.O.; software, D.E.G.F. and E.L.d.L.; validation, D.E.G.F. and L.P.O.; formal analysis, D.E.G.F., G.M., E.L.d.L., L.P.O. and A.P.M.R.; investigation, D.E.G.F., G.M., E.L.d.L., L.P.O. and A.P.M.R.; resources, D.E.G.F., G.M., E.L.d.L., L.P.O. and A.P.M.R.; data curation, D.E.G.F. and A.P.M.R.; writing—original draft preparation, D.E.G.F. and M.T.G.F.; writing—review and editing, D.E.G.F., G.M., E.L.d.L., M.T.G.F., R.D.S.G., W.N.G., J.M.J., É.L.B., V.L., L.P.O. and A.P.M.R.; visualization, D.E.G.F., G.M., E.L.d.L., M.T.G.F., R.D.S.G., W.N.G., J.M.J., É.L.B., V.L., L.P.O. and A.P.M.R.; supervision, W.N.G., J.M.J., L.P.O. and A.P.M.R.; project administration, A.P.M.R.; funding acquisition, D.E.G.F., M.T.G.F., A.P.M.R., J.M.J. and W.N.G. All authors have read and agreed to the published version of the manuscript.

Funding

This research was funded by CAPES (Coordination for the Improvement of Higher Education Personnel—Finance code 001), CNPq (National Council for Scientific and Technological Development), grant numbers 308481/2022-4, 305296/2022-1, 403213/2023-1, 305814/2023-0, 312263/2025-2, 302963/2025-1, 312816/2025-1 and the São Paulo Research Foundation (FAPESP), grant number #2024/05205-4 (D.E.G.F.).

Institutional Review Board Statement

Not applicable.

Informed Consent Statement

Not applicable.

Data Availability Statement

The data presented in this study are available upon request from the corresponding author.

Acknowledgments

The authors acknowledge Google for providing access to Google Street View imagery, which made this study possible. During the preparation of this manuscript, the authors used ChatGPT-5 Plus (OpenAI) to improve the text’s grammatical quality and fluency. The authors have reviewed and edited the output and take full responsibility for the content of this publication.

Conflicts of Interest

The authors declare no conflicts of interest.

Abbreviations

CPUCentral Processing Unit
DETRDetection Transformer
DLDeep Learning
DSDataset
FNFalse Negative
FPFalse Positive
GBGigabyte
GPUGraphics Processing Unit
MPMobile Phone
RRecall
RGBRed Green Blue
SAMSegment Anything Model
SVStreet View
TNTrue Negative
TPTrue Positive
YOLOYou Only Look Once

References

  1. Wood, E.M.; Esaian, S. The importance of street trees to urban avifauna. Ecol. Appl. 2020, 30, e02149. [Google Scholar] [CrossRef] [PubMed]
  2. Jovanović, S.; Janković-Milić, V.; Stanković, J.J.; Stanojević, M. The role of urban tree areas for biodiversity conservation in degraded urban landscapes. Land 2025, 14, 1815. [Google Scholar] [CrossRef]
  3. Delavaux, C.S.; Crowther, T.W.; Zohner, C.M.; Robmann, N.M.; Lauber, T.; van den Hoogen, J.; Kuebbing, S.; Liang, J.; de Miguel, S.; Nabuurs, G.-J.; et al. Native diversity buffers against severity of non-native tree invasions. Nature 2023, 622, 94–100. [Google Scholar] [CrossRef] [PubMed]
  4. Di Sacco, A.; Hardwick, K.A.; Blakesley, D.; Brancalion, P.H.S.; Breman, E.; Cecilio Rebola, L.; Chomba, S.; Dixon, K.; Elliott, S.; Ruyonga, G.; et al. Ten golden rules for reforestation to optimize carbon sequestration, biodiversity recovery and livelihood benefits. Glob. Change Biol. 2021, 27, 1328–1348. [Google Scholar] [CrossRef]
  5. Liu, J.; Slik, F. Are street trees friendly to biodiversity? Landsc. Urban Plan. 2022, 218, 104304. [Google Scholar] [CrossRef]
  6. Dyderski, M.K.; Jagodziński, A.M. Impact of invasive tree species on natural regeneration species composition, diversity, and density. Forests 2020, 11, 456. [Google Scholar] [CrossRef]
  7. Meirelles, R.N.; Machado, M.M.; Pires, P.R.S. Record of dead bees on Spathodea campanulata P. Beauv. flowers on the public promenade in São Luiz Gonzaga, State of Rio Grande do Sul. Rev. Ciênc. Agrovet. 2025, 24, 917–925. [Google Scholar] [CrossRef]
  8. Kato-Noguchi, H.; Kurniadie, D. Allelopathy and allelochemicals of Leucaena leucocephala as an invasive plant species. Plants 2022, 11, 1672. [Google Scholar] [CrossRef]
  9. Sharma, P.; Kaur, A.; Batish, D.R.; Kaur, S.; Chauhan, B.S. Critical insights into the ecological and invasive attributes of Leucaena leucocephala, a tropical agroforestry species. Front. Agron. 2022, 4, 890992. [Google Scholar] [CrossRef]
  10. Obiakara, M.C.; Olubode, O.S.; Chukwuka, K.S. Climate change and the potential distribution of the invasive shrub Leucaena leucocephala (Lam.) de Wit in Africa. Trop. Ecol. 2023, 64, 698–711. [Google Scholar] [CrossRef]
  11. Jensen, R.J. Remote Sensing of the Environment: An Earth Resource Perspective, 2nd ed.; Pearson New International Edition; Pearson Education Limited Edinburgh Gate: Harlow, UK, 2014; p. 619. [Google Scholar]
  12. Wellmann, T.; Lausch, A.; Andersson, E.; Knapp, S.; Cortinovis, C.; Jache, J.; Scheuer, S.; Kremer, P.; Mascarenhas, A.; Kraemer, R.; et al. Remote sensing in urban planning: Contributions towards ecologically sound policies? Landsc. Urban Plan. 2020, 204, 103921. [Google Scholar] [CrossRef]
  13. Song, W.; Song, W.; Gu, H.; Li, F. Progress in the remote sensing monitoring of the ecological environment in mining areas. Int. J. Environ. Res. Public Health 2020, 17, 1846. [Google Scholar] [CrossRef] [PubMed]
  14. Wan, H.; Tang, Y.; Jing, L.; Li, H.; Qiu, F.; Wu, W. Tree species classification of forest stands using multisource remote sensing data. Remote Sens. 2021, 13, 144. [Google Scholar] [CrossRef]
  15. Agustiyara, A.; Mutiarin, D.; Nurmandi, A.; Kasiwi, A.N.; Ikhwali, M.F. Mapping urban green spaces in Indonesian cities using remote sensing analysis. Urban Sci. 2025, 9, 23. [Google Scholar] [CrossRef]
  16. Xia, Y.; Yabuki, N.; Fukuda, T. Development of a system for assessing the quality of urban street-level greenery using street view images and deep learning. Urban For. Urban Green. 2021, 59, 126995. [Google Scholar] [CrossRef]
  17. Li, Y.; Peng, L.; Wu, C.; Zhang, J. Street view imagery (SVI) in the built environment: A theoretical and systematic review. Buildings 2022, 12, 1167. [Google Scholar] [CrossRef]
  18. Liang, X.; Zhao, T.; Biljecki, F. Revealing spatio-temporal evolution of urban visual environments with street view imagery. Landsc. Urban Plan. 2023, 237, 104802. [Google Scholar] [CrossRef]
  19. Branson, S.; Wegner, J.D.; Hall, D.; Lang, N.; Schindler, K.; Perona, P. From Google Maps to a fine-grained catalog of street trees. ISPRS J. Photogramm. Remote Sens. 2018, 135, 13–30. [Google Scholar] [CrossRef]
  20. Ringland, J.; Bohm, M.; Baek, S.R.; Eichhorn, M. Automated survey of selected common plant species in Thai homegardens using Google Street View imagery and a deep neural network. Earth Sci. Inform. 2021, 14, 179–191. [Google Scholar] [CrossRef]
  21. Itakura, K.; Hosoi, F. Automatic Tree Detection from Three-Dimensional Images Reconstructed from 360° Spherical Camera Using YOLOv2. Remote Sens. 2020, 12, 988. [Google Scholar] [CrossRef]
  22. Choi, K.; Lim, W.; Chang, B.; Jeong, J.; Kim, I.; Park, C.R.; Ko, D.W. An Automatic Approach for Tree Species Detection and Profile Estimation of Urban Street Trees Using Deep Learning and Google Street View Images. ISPRS J. Photogramm. Remote Sens. 2022, 190, 165–180. [Google Scholar] [CrossRef]
  23. Wang, S.; Cao, X.; Wu, M.; Yi, C.; Zhang, Z.; Fei, H.; Zheng, H.; Jiang, H.; Jiang, Y.; Zhao, X.; et al. Detection of Pine Wilt Disease Using Drone Remote Sensing Imagery and an Improved YOLOv8 Algorithm: A Case Study in Weihai, China. Forests 2023, 14, 2052. [Google Scholar] [CrossRef]
  24. Meta AI. Segment Anything. Research by Meta AI. 2023. Available online: https://ai.meta.com/research/publications/segment-anything/ (accessed on 11 June 2025).
  25. Kirillov, A.; Mintun, E.; Ravi, N.; Mao, H.; Rolland, C.; Gustafson, L.; Girshick, R. Segment Anything. In Proceedings of the IEEE/CVF International Conference on Computer Vision (ICCV), Paris, France, 2–6 October 2023; pp. 4015–4026. [Google Scholar]
  26. Osco, L.P.; Wu, Q.; de Lemos, E.L.; Gonçalves, W.N.; Ramos, A.P.M.; Li, J.; Junior, J.M. The Segment Anything Model (SAM) for Remote Sensing Applications: From Zero to One Shot. Int. J. Appl. Earth Obs. Geoinf. 2023, 124, 103540. [Google Scholar] [CrossRef]
  27. Brazilian Institute of Geography and Statistics (IBGE). Presidente Prudente: Panorama. 2022. Available online: https://cidades.ibge.gov.br/brasil/sp/presidente-prudente/panorama (accessed on 20 March 2025).
  28. Furuya, M.T.G.; Furuya, D.E.G.; de Oliveira, L.Y.D.; da Silva, P.A.; Cicerelli, R.E.; Gonçalves, W.N.; Junior, J.M.; Osco, L.P.; Ramos, A.P.M. A Machine Learning Approach for Mapping Surface Urban Heat Island Using Environmental and Socioeconomic Variables: A Case Study in a Medium-Sized Brazilian City. Environ. Earth Sci. 2023, 82, 325. [Google Scholar] [CrossRef]
  29. Brazilian Institute of Geography and Statistics (IBGE). 2019. Available online: https://cidades.ibge.gov.br/brasil/sp/presidente-prudente/panorama (accessed on 28 March 2025).
  30. Li, M.; Yao, W. 3D Map System for Tree Monitoring in Hong Kong Using Google Street View Imagery and Deep Learning. ISPRS Ann. Photogramm. Remote Sens. Spat. Inf. Sci. 2020, 3, 765–772. [Google Scholar] [CrossRef]
  31. Li, C.; Narayanan, A.; Ghobakhlou, A. Overlapping Shoeprint Detection by Edge Detection and Deep Learning. J. Imaging 2024, 10, 186. [Google Scholar] [CrossRef]
  32. Zhang, J.; Qiang, Z.; Lin, H.; Chen, Z.; Li, K.; Zhang, S. Research on Tobacco Field Semantic Segmentation Method Based on Multispectral Unmanned Aerial Vehicle Data and Improved PP-LiteSeg Model. Agronomy 2024, 14, 1502. [Google Scholar] [CrossRef]
  33. Wang, P.; Li, C.; Yang, Q.; Fu, L.; Yu, F.; Min, L.; Guo, D.; Li, X. Environment Understanding Algorithm for Substation Inspection Robot Based on Improved DeepLab V3+. J. Imaging 2022, 8, 257. [Google Scholar] [CrossRef]
  34. Jasim, W.A.N.; Mohammed, R.J. A Survey on Segmentation Techniques for Image Processing. Iraqi J. Electr. Electron. Eng. 2021, 17, 2. [Google Scholar] [CrossRef]
  35. Wu, Q.; Castleman, K.R. Image Segmentation. In Microscope Image Processing; Academic Press: Cambridge, MA, USA, 2023; pp. 119–152. [Google Scholar] [CrossRef]
  36. Wang, G.; Chen, Y.; An, P.; Hong, H.; Hu, J.; Huang, T. UAV-YOLOv8: A Small-Object-Detection Model Based on Improved YOLOv8 for UAV Aerial Photography Scenarios. Sensors 2023, 23, 7190. [Google Scholar] [CrossRef]
  37. Wang, X.; Gao, H.; Jia, Z.; Li, Z. BL-YOLOv8: An Improved Road Defect Detection Model Based on YOLOv8. Sensors 2023, 23, 8361. [Google Scholar] [CrossRef]
  38. Terven, J.; Córdova-Esparza, D.M.; Romero-González, J.A. A Comprehensive Review of YOLO Architectures in Computer Vision: From YOLOv1 to YOLOv8 and YOLO-NAS. Mach. Learn. Knowl. Extr. 2023, 5, 1680–1716. [Google Scholar] [CrossRef]
  39. Carion, N.; Massa, F.; Synnaeve, G.; Usunier, N.; Kirillov, A.; Zagoruyko, S. End-to-End Object Detection with Transformers. In Proceedings of the European Conference on Computer Vision (ECCV), Glasgow, UK, 23–28 August 2020; Springer: Cham, Switzerland, 2020; pp. 213–229. [Google Scholar] [CrossRef]
  40. Yu, L.; Tang, L.; Mu, L. A Review of Detection Transformer: From Basic Architecture to Advanced Developments and Visual Perception Applications. Sensors 2025, 25, 3952. [Google Scholar] [CrossRef] [PubMed]
  41. Huang, H.; Lan, G.; Wei, J.; Zhong, Z.; Xu, Z.; Li, D.; Zou, F. TLI-YOLOv5: A Lightweight Object Detection Framework for Transmission Line Inspection by Unmanned Aerial Vehicle. Electronics 2023, 12, 3340. [Google Scholar] [CrossRef]
  42. Su, X.; Zhang, J.; Ma, Z.; Dong, Y.; Zi, J.; Xu, N.; Zhang, H.; Xu, F.; Chen, F. Identification of Rare Wildlife in the Field Environment Based on the Improved YOLOv5 Model. Remote Sens. 2024, 16, 1535. [Google Scholar] [CrossRef]
  43. Minaee, S.; Boykov, Y.; Porikli, F.; Plaza, A.; Kehtarnavaz, N.; Terzopoulos, D. Image Segmentation Using Deep Learning: A Survey. IEEE Trans. Pattern Anal. Mach. Intell. 2022, 44, 3523–3542. [Google Scholar] [CrossRef]
  44. Boonpook, W.; Tan, Y.; Nardkulpat, A.; Torsri, K.; Torteeka, P.; Kamsing, P.; Sawangwit, U.; Pena, J.; Jainaen, M. Deep Learning Semantic Segmentation for Land Use and Land Cover Types Using Landsat 8 Imagery. ISPRS Int. J. Geo-Inf. 2023, 12, 14. [Google Scholar] [CrossRef]
  45. Soylu, B.E.; Guzel, M.S.; Bostanci, G.E.; Ekinci, F.; Asuroglu, T.; Acici, K. Deep-Learning-Based Approaches for Semantic Segmentation of Natural Scene Images: A Review. Electronics 2023, 12, 2730. [Google Scholar] [CrossRef]
  46. Mazurowski, M.A.; Dong, H.; Gu, H.; Yang, J.; Konz, N.; Zhang, Y. Segment Anything Model for Medical Image Analysis: An Experimental Study. Med. Image Anal. 2023, 89, 102918. [Google Scholar] [CrossRef]
  47. Carraro, A.; Sozzi, M.; Marinello, F. The Segment Anything Model (SAM) for accelerating the smart farming revolution. Smart Agric. Technol. 2023, 6, 100367. [Google Scholar] [CrossRef]
  48. Kim, J.; Kim, Y. Integrated framework for unsupervised building segmentation with Segment Anything Model-based pseudo-labeling and weakly supervised learning. Remote Sens. 2024, 16, 526. [Google Scholar] [CrossRef]
  49. Gong, A.; Yu, J.; He, Y.; Qiu, Z. Citrus yield estimation based on images processed by an Android mobile phone. Biosyst. Eng. 2013, 115, 162–170. [Google Scholar] [CrossRef]
  50. Baziak, B.; Bodziony, M.; Szczepanek, R. Mountain streambed roughness and flood extent estimation from imagery using the Segment Anything Model (SAM). Hydrology 2024, 11, 17. [Google Scholar] [CrossRef]
  51. Ma, J.; He, Y.; Li, F.; Han, L.; You, C.; Wang, B. Segment Anything in Medical Images. Nat. Commun. 2024, 15, 654. [Google Scholar] [CrossRef] [PubMed]
  52. Shi, P.; Qiu, J.; Abaxi, S.M.D.; Wei, H.; Lo, F.P.-W.; Yuan, W. Generalist vision foundation models for medical imaging: A case study of Segment Anything Model on zero-shot medical segmentation. Diagnostics 2023, 13, 1947. [Google Scholar] [CrossRef]
  53. Zhang, C.; Liu, L.; Cui, Y.; Huang, G.; Lin, W.; Yang, Y.; Hu, Y. A comprehensive survey on Segment Anything Model for vision and beyond. arXiv 2023, arXiv:2305.08196. [Google Scholar] [CrossRef]
  54. Yan, Z.; Li, J.; Li, X.; Zhou, R.; Zhang, W.; Feng, Y.; Diao, W.; Fu, K.; Sun, X. RingMo-SAM: A foundation model for segment anything in multimodal remote-sensing images. IEEE Trans. Geosci. Remote Sens. 2023, 61, 5625716. [Google Scholar] [CrossRef]
  55. Hussain, M. YOLO-v1 to YOLO-v8: The rise of YOLO and its complementary nature toward digital manufacturing and industrial defect detection. Machines 2023, 11, 677. [Google Scholar] [CrossRef]
  56. Zhong, H.; Zhang, Z.; Liu, H.; Wu, J.; Lin, W. Individual tree species identification for complex coniferous and broad-leaved mixed forests based on deep learning combined with UAV LiDAR data and RGB images. Forests 2024, 15, 293. [Google Scholar] [CrossRef]
  57. Guo, B.; Ling, S.; Tan, H.; Wang, S.; Wu, C.; Yang, D. Detection of the grassland weed Phlomoides umbrosa using multi-source imagery and an improved YOLOv8 network. Agronomy 2023, 13, 3001. [Google Scholar] [CrossRef]
  58. Korznikov, K.; Kislov, D.; Petrenko, T.; Dzizyurova, V.; Doležal, J.; Krestov, P.; Altman, J. Unveiling the potential of drone-borne optical imagery in forest ecology: A study on the recognition and mapping of two evergreen coniferous species. Remote Sens. 2023, 15, 4394. [Google Scholar] [CrossRef]
  59. Morera, Á.; Sánchez, Á.; Moreno, A.B.; Sappa, Á.D.; Vélez, J.F. SSD vs. YOLO for detection of outdoor urban advertising panels under multiple variabilities. Sensors 2020, 20, 4587. [Google Scholar] [CrossRef]
  60. Shu, Z.; Yan, Z.; Xu, X. Pavement crack detection method of street view images based on deep learning. J. Phys. Conf. Ser. 2021, 1952, 022043. [Google Scholar] [CrossRef]
  61. Hipp, J.R.; Lee, S.; Ki, D.; Kim, J.H. Measuring the built environment with Google Street View and machine learning: Consequences for crime on street segments. J. Quant. Criminol. 2021, 38, 537–565. [Google Scholar] [CrossRef]
  62. Liu, S.; Ren, T.; Chen, J.; Zeng, Z.; Zhang, H.; Li, F.; Li, H.; Huang, J.; Su, H.; Zhu, J.; et al. Detection transformer with stable matching. In Proceedings of the IEEE/CVF International Conference on Computer Vision (ICCV), Paris, France, 2–6 October 2023; pp. 6491–6500. [Google Scholar]
  63. Gupta, A.; Narayan, S.; Joseph, K.J.; Khan, S.; Khan, F.S.; Shah, M. OW-DETR: Open-world detection transformer. In Proceedings of the IEEE/CVF Conference on Computer Vision and Pattern Recognition (CVPR), New Orleans, LA, USA, 18–24 June 2022; pp. 9235–9244. [Google Scholar]
  64. Dai, L.; Liu, H.; Tang, H.; Wu, Z.; Song, P. AO2-DETR: Arbitrary-oriented object detection transformer. IEEE Trans. Circuits Syst. Video Technol. 2023, 33, 2342–2356. [Google Scholar] [CrossRef]
  65. Zhang, J.; Huang, J.; Luo, Z.; Zhang, G.; Zhang, X.; Lu, S. DA-DETR: Domain adaptive detection transformer with information fusion. In Proceedings of the IEEE/CVF Conference on Computer Vision and Pattern Recognition (CVPR), Vancouver, BC, Canada, 18–22 June 2023; pp. 23787–23798. [Google Scholar]
  66. Zhang, J.; Lin, X.; Zhang, W.; Wang, K.; Tan, X.; Han, J.; Ding, E.; Wang, J.; Li, G. Semi-DETR: Semi-supervised object detection with detection transformers. In Proceedings of the IEEE/CVF Conference on Computer Vision and Pattern Recognition (CVPR), Vancouver, BC, Canada, 18–22 June 2023; pp. 23809–23818. [Google Scholar]
  67. Yang, R.; Yuan, D.; Zhao, M.; Zhao, Z.; Zhang, L.; Fan, Y.; Liang, G.; Zhou, Y. Camellia oleifera Tree Detection and Counting Based on UAV RGB Image and YOLOv8. Agriculture 2024, 14, 1789. [Google Scholar] [CrossRef]
  68. Que, H.; Gao, H.; Shan, W.; Liu, M.; An, J.; Deng, F.; Feng, S.; Yang, X.; Mu, L. FM-SAM: Individual Tree Crown Delineation and Classification Based on Segmentation Anything Model (SAM) and YOLOv10 in UAV Imagery for Forest Monitoring. Comput. Electron. Agric. 2026, 240, 111162. [Google Scholar] [CrossRef]
Figure 1. Workflow illustrating the steps performed in this study using YOLOv8, DETR, and SAM (zero-shot) to detect and segment Leucaena in a total of 422 street-level images from Google SV and MP.
Urbansci 10 00192 g001
Figure 2. Location of the study area: Presidente Prudente, Brazil. The figure shows maps at the national, state, and city levels for Brazil, the state of São Paulo, and the city of Presidente Prudente. The figure also shows the points with the presence of Leucaena in the city where the 422 SV and MP images were collected.
Urbansci 10 00192 g002
Figure 3. Examples of image annotations performed using the LabelMe software: (a) Polygon-based labeling of Leucaena for image segmentation using SAM. (b) Bounding box-based labeling of Leucaena for object detection using YOLOv8 and DETR. Images outlined in yellow correspond to SV imagery, while images outlined in purple correspond to MP imagery. In the bounding box annotations, two classes were considered: Leucaena (shown in red) and Other (shown in green), which includes other tree species present in the images.
Urbansci 10 00192 g003
Figure 4. Examples (af) of segmentation results obtained with the SAM zero-shot model for Leucaena SV images. The segmentation was guided by box prompts, highlighting the ability of the model to delineate individual trees under different urban contexts and background conditions. For each example, the image on the left shows the delimited box, and the image on the right shows the segmentation done by SAM.
Urbansci 10 00192 g004
Figure 5. Examples (ah) of segmentation results obtained with the SAM zero-shot model for Leucaena using MP street-level images. The segmentation was guided by box prompts, illustrating both successful delineations. For each example, the image on the left shows the delimited box, and the image on the right shows the segmentation done by SAM.
Urbansci 10 00192 g005
Figure 6. Examples of segmentation results obtained with the SAM zero-shot model for Leucaena using MP street-level images, illustrating cases of lower performance. The figure shows the original images, the corresponding segmented outputs, and the associated evaluation metrics (accuracy, F1-score, precision, and recall) computed for each image.
Urbansci 10 00192 g006
Figure 7. Performance curves obtained for the YOLOv8 object detection model using three datasets: Dataset 4 (SV), Dataset 5 (MP), and Dataset 6 (SV + MP). (a) Recall–confidence curves, (b) precision–confidence curves, (c) precision–recall curves, and (d) F1-score–confidence curves for the three datasets, illustrating the model performance under different confidence thresholds and data sources. The evaluated classes correspond to Leucaena (Leucena in Portuguese) and Other (trees).
Urbansci 10 00192 g007
Figure 8. Visual examples of object detection results obtained with the YOLOv8 network for Leucaena leucocephala in street-level images: (a) Examples illustrating the YOLOv8 training phase; (b) detection results using SV images; and (c) detection results using MP images. All examples consider two classes: Leucena (Leucaena, in Portuguese), highlighted in red bounding boxes, and Other (trees), representing other arboreal species present in the images in green.
Urbansci 10 00192 g008
Figure 9. Example of detection results obtained during the testing phase using an SV image. The figure compares the ground-truth annotations with the predictions generated by the YOLOv8 and DETR models, illustrating their performance in detecting Leucaena in street-level imagery.
Urbansci 10 00192 g009
Figure 10. Visual comparison between ground truth and detection results produced by the YOLOv8 and DETR models during the testing phase using an MP image. The boxes in red represent only the Leucaena class. Other species are not represented in the figure.
Urbansci 10 00192 g010
Table 1. Hyperparameters adopted for training and evaluating the YOLOv8 and DETR networks using street-level images.
HyperparametersYOLOv8DETR
Batch Size168
Image Size640 × 640 pixels640 × 640 pixels
Epochs100100
Learning Rate0.010.0005
OptimizerAdamWAdamW
Inference Time0.01 s0.7 s
Table 2. Evaluation metrics used to evaluate the networks.
MetricEquation
Accuracy A c c u r a c y = T P + T N T P + T N + F P + F N
Precision P r e c i s i o n = T P T P + F P
Recall R e c a l l = T P T P + F N
F1-score F 1 s c o r e = 2   P r e c i s i o n × R e c a l l P r e c i s i o n + R e c a l l
TP = true positive; TN = true negative; FP = false positive; FN = false negative [43].
Table 3. Average of the evaluation metrics calculated using 40 street-level images segmented by SAM zero-shot using the box prompt.
MetricStreet View Images
(20 Images)
Mobile Phone Images
(20 Images)
All Images
(40 Images)
Accuracy0.92630.63410.7763
F1-score0.93940.66180.7969
Precision0.95400.69400.8205
Recall0.92630.63410.7763
Table 4. Average values of recall (R), mAP50, and mAP50–95 obtained for the YOLOv8 and DETR networks across three datasets: Dataset 4 (SV), Dataset 5 (MP), and Dataset 6 (SV + MP).
YOLOv8RecallmAP50mAP50-95
Dataset 4–SV0.7490.8300.517
Dataset 5–MP0.7510.8490.614
Dataset 6–SV + MP0.7660.8440.540
DETRRecallmAP50mAP50-95
Dataset 4–SV0.2180.4550.169
Dataset 5–MP0.6840.8470.563
Dataset 6–SV + MP0.2190.3550.130
Disclaimer/Publisher’s Note: The statements, opinions and data contained in all publications are solely those of the individual author(s) and contributor(s) and not of MDPI and/or the editor(s). MDPI and/or the editor(s) disclaim responsibility for any injury to people or property resulting from any ideas, methods, instructions or products referred to in the content.