1. Introduction
Urban pedestrianization has emerged as a key strategy within sustainable mobility policies and public space regeneration initiatives worldwide. This approach aims to reduce automobile dependency, improve environmental quality, and promote social interaction in consolidated urban areas [
1]. Numerous studies have highlighted the potential economic, social, and environmental benefits of reallocating street space to pedestrians when interventions are properly planned [
2,
3]. However, the success of pedestrianization largely depends on public acceptance, which is not always uniform across different urban contexts [
4]. Divergent perceptions among users may generate resistance or support that directly affects policy outcomes [
5]. Consequently, understanding citizen perception has become a critical component in evaluating pedestrianization initiatives.
At the international level, research on pedestrianization has documented experiences in historic centers and commercial districts, emphasizing both positive impacts and implementation challenges. Research indicates that high acceptance stems from perceived fairness, pollution reduction, and improved ambiance, which collectively foster behavioral shifts toward walking and enhanced liveability [
6,
7]. This dynamic is evident in Lahore’s Liberty Market, where success was tied to user approval of security and maintenance [
8], and in Madrid, where a 66% satisfaction rate led to significant gains in active transport [
9]. Conversely, negative perceptions—often rooted in concerns over parking, accessibility, or security—can lead to policy failure if local needs are overlooked [
10]. These differences are often associated with accessibility conditions, adaptation periods, and user profiles. As a result, pedestrianization assessments should extend beyond physical and traffic indicators. This perspective highlights the importance of incorporating citizen perception as a central analytical dimension.
In Latin America, pedestrianization processes have gained prominence in intermediate cities as a response to congestion, environmental degradation, and declining public space quality [
11,
12,
13,
14]. However, these cities present distinct socio-economic and cultural characteristics that shape how urban transformations are perceived by citizens [
15]. Previous studies indicate that insufficient citizen participation and limited post-implementation evaluation can lead to social resistance, especially among local economic actors [
16]. Moreover, empirical evidence on public acceptance of pedestrianization in intermediate Latin American cities remains scarce. This gap underscores the need for localized studies that systematically analyze citizen perceptions. Consequently, context-specific research becomes essential to inform urban policy decisions.
Despite growing international evidence on pedestrianization outcomes, a notable gap persists in the literature regarding empirically grounded, perception-based studies in intermediate Latin American cities. Most existing work either focuses on large metropolitan areas or relies on qualitative approaches that limit cross-contextual comparison. This study addresses that gap by applying systematic survey-based analysis to a mid-sized Ecuadorian city, offering a replicable methodological framework applicable to similar urban contexts globally.
The city of Loja, located in southern Ecuador, has implemented pedestrianization interventions in central areas with high commercial, residential, and touristic value. These actions are part of municipal strategies aimed at improving urban mobility and enhancing public space quality [
17]. As observed in other Latin American cities, these interventions have generated mixed reactions among merchants, residents, and pedestrians. While some stakeholders perceive improvements in urban environment and social dynamics, others express concerns related to accessibility and economic performance [
9,
18,
19]. This coexistence of perceptions positions Loja as a relevant case study for analyzing pedestrianization acceptance. The local context provides an opportunity to examine how user characteristics influence the evaluation of urban interventions.
Despite the growing relevance of pedestrianization, studies in Ecuador have predominantly focused on descriptive analyses or technical evaluations of urban space. The application of exploratory analytical technique to examine citizen perception remains limited [
20]. This methodological gap constrains the ability to identify significant associations and explanatory patterns that support evidence-based decision-making. Additionally, differences among user groups are often addressed superficially, without robust comparative analysis. Therefore, there is a clear need to adopt more rigorous analytical approaches in pedestrianization research. Addressing this gap strengthens the justification for the present study.
The main objective of this research is to analyze the factors associated with citizen acceptance of urban pedestrianization in Loja, Ecuador, across four user groups—pedestrians/visitors, residents, and permanent and temporary business owners—with the aim of generating evidence-based guidance that municipal decision-makers in Loja and comparable intermediate cities can apply when planning, piloting, or evaluating pedestrianization interventions. To achieve this objective, a structured survey was administered to business owners or employees, residents, and pedestrians or visitors. The collected data were analysed using descriptive and exploratory analytical techniques, including composite index construction, user segmentation, and correlation analysis to identify patterns and relationships among variables. These methods allowed for the identification of patterns and relationships among socio-demographic variables, urban experience, and acceptance levels within this case study context. The applied methodology ensured a rigorous and reproducible analytical process. Thus, the study provides a solid empirical basis for evaluating pedestrianization outcomes.
Conceptually, this study distinguishes three inter-related but analytically distinct constructs. “Satisfaction” refers to the immediate affective evaluation of the pedestrianized environment as experienced during the intervention. “Acceptance” refers to the attitudinal disposition toward making pedestrianization permanent, which involves a cognitive and normative judgment that extends beyond immediate experience. “Environmental perception” captures the respondent’s evaluation of pollution-related changes in their immediate surroundings. These constructs are treated as distinct dimensions rather than as interchangeable proxies of a single latent attitude, consistent with frameworks in policy acceptance and behavioral willingness-to-change literature.
The scope of this study is limited to the analysis of citizen perception related to a specific pedestrianization intervention in the city of Loja. Although the findings are not intended for direct generalization to all urban contexts, they offer relevant insights for intermediate cities with similar characteristics. The contributions of this research lie in the application of exploratory analytical technique to pedestrianization studies and in the identification of population segments with differentiated perceptions. Furthermore, the study enriches the literature on sustainable mobility by positioning citizen perception as a central evaluative dimension. Ultimately, the results may inform urban policy design and evaluation processes oriented toward pedestrian-centered cities.
2. Materials and Methods
2.1. Study Design and Context
This study employed a quantitative, cross-sectional research design aimed at analyzing citizen perceptions of urban pedestrianization implemented during a large-scale cultural event. The research was conducted within the framework of the Festival Internacional de Artes Vivas de Loja 2025 (FIAVL 2025), a major cultural event in southern Ecuador that significantly alters urban mobility patterns and public space use. This festival was officially recognized by the national government in 2018 [
21]. The intervention context provided a real-world setting to examine perceptions related to accessibility, environmental quality, and urban experience. The study focused on users directly exposed to the pedestrianized environment, ensuring that perceptions were grounded in lived experience. This design supports an exploratory and case-study-oriented approach suitable for urban perception research.
It should be noted, however, that the festival context introduces an important boundary condition: perceptions and satisfaction levels measured during FIAVL may not be representative of those under regular weekday pedestrianization conditions, and this limitation is discussed further in
Section 4.
2.2. Study Area and Pedestrianization Measures
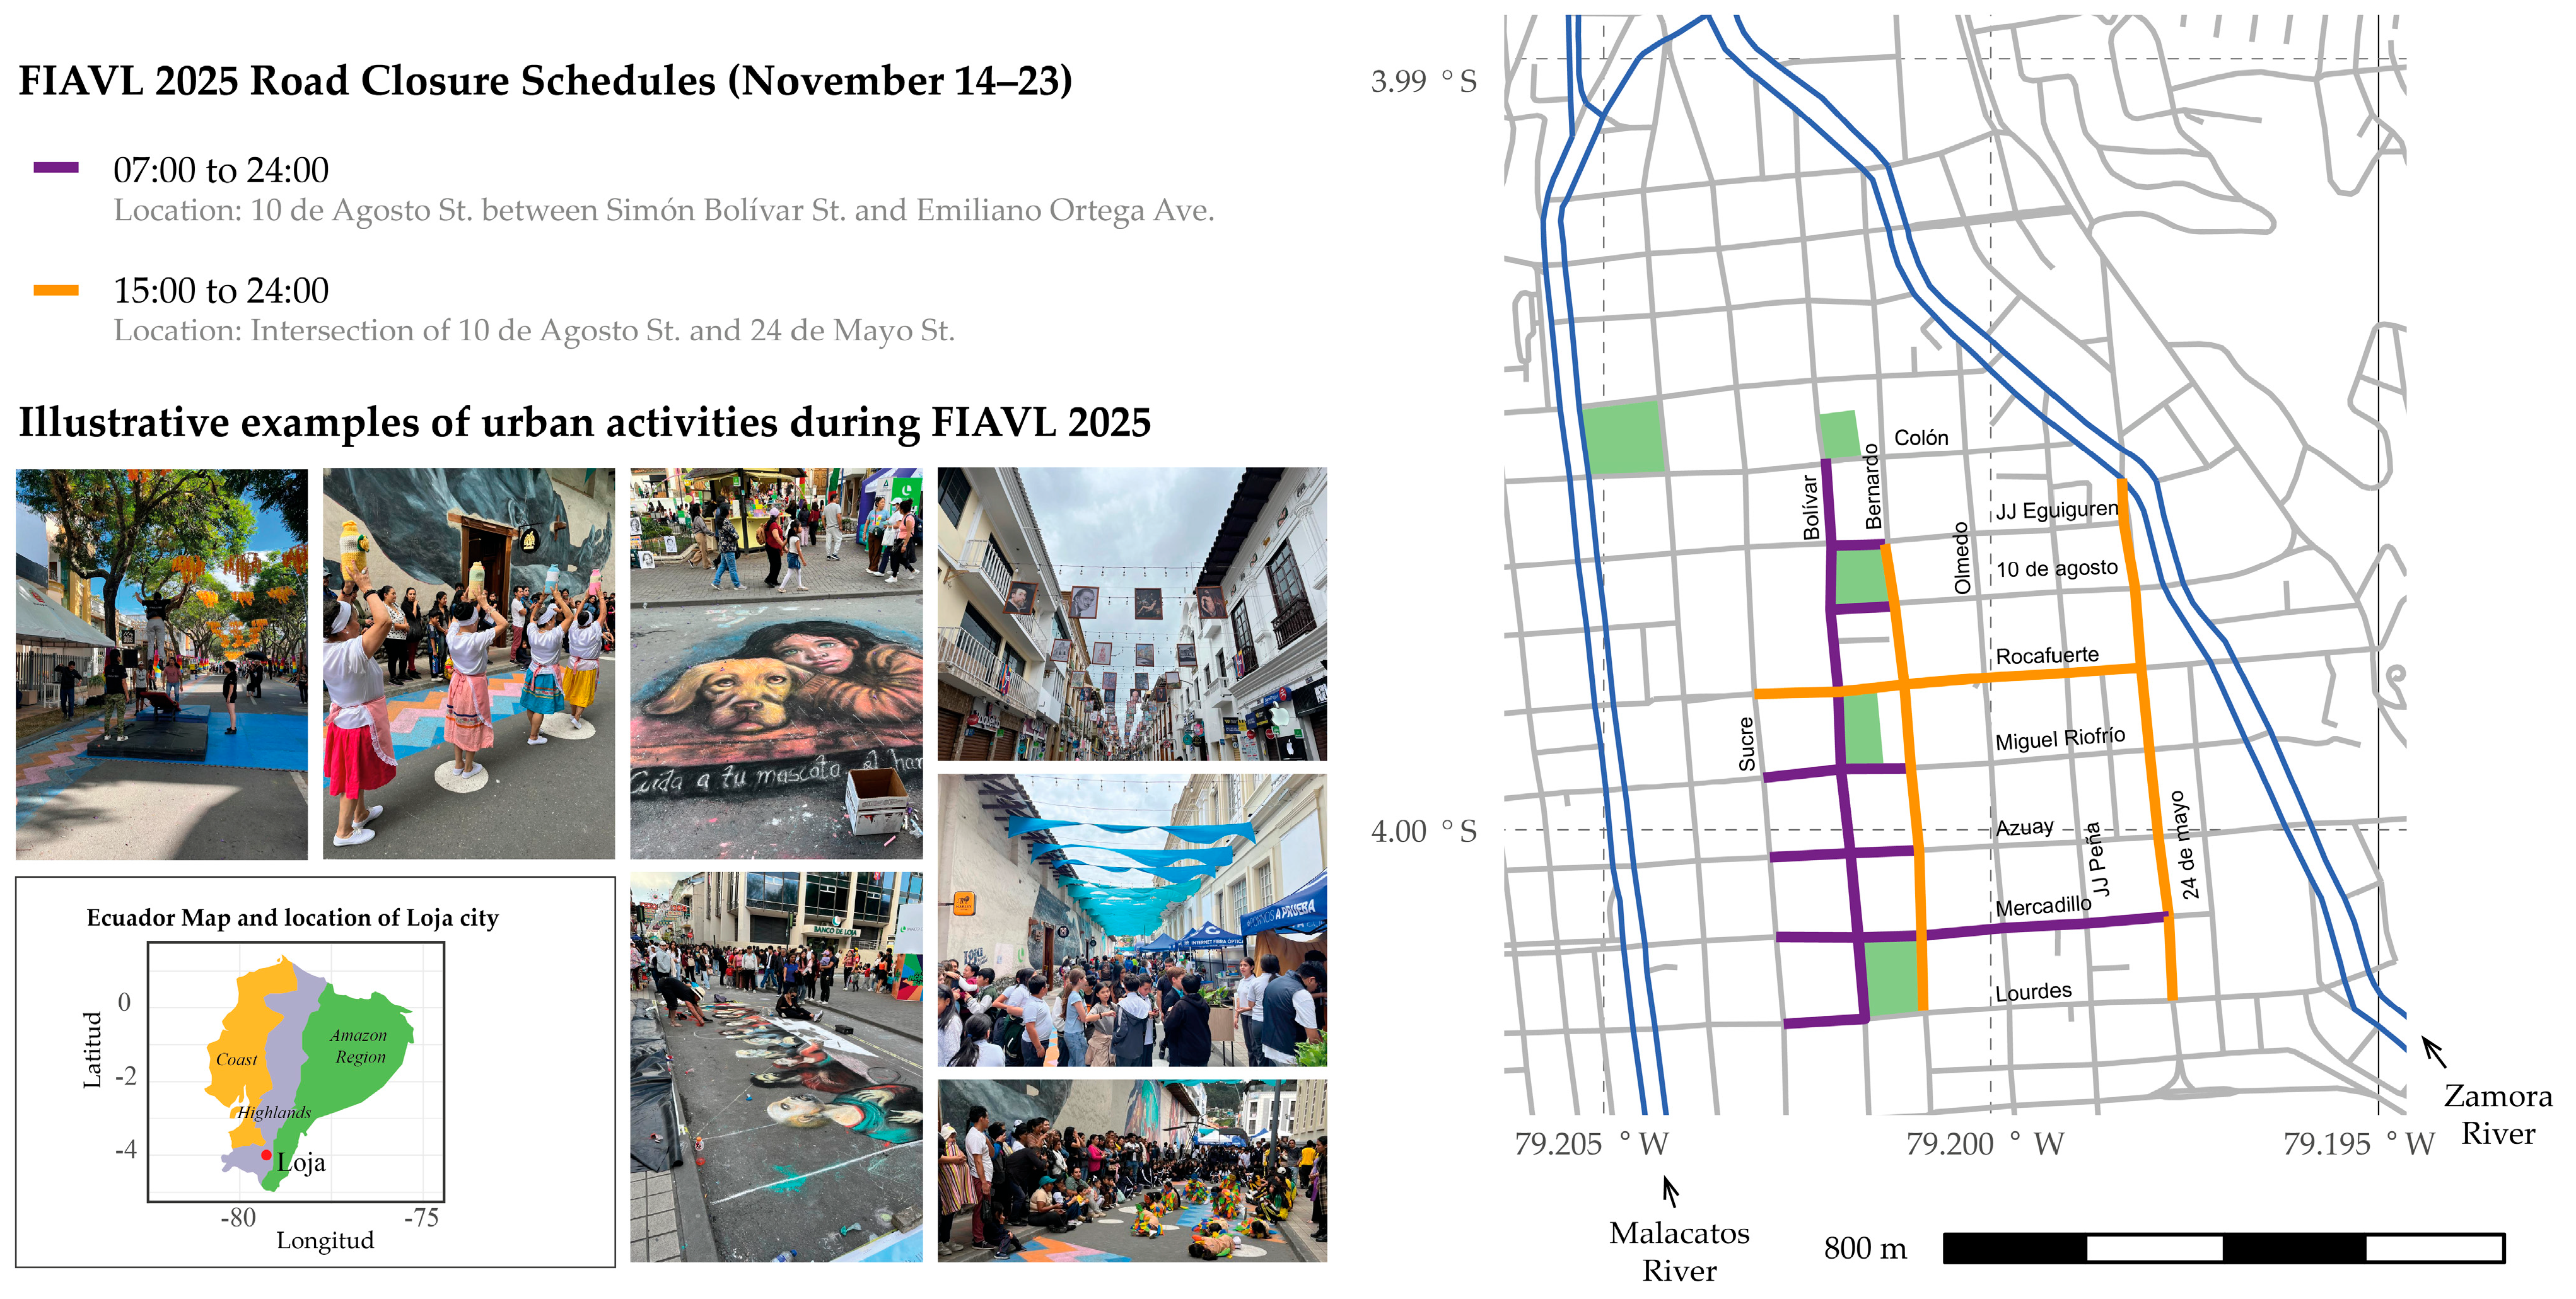
The survey was conducted primarily along 24 de Mayo Street and Bolívar Street, which concentrate the highest pedestrian flows and cultural activities during the festival. Between 14 November and 23 November 2025, temporary pedestrianization measures were implemented in these areas, as shown in
Figure 1. The interventions operated under two time schedules: from 07:00 to 24:00 and from 15:00 to 24:00, depending on street segment characteristics and event programming. In both cases, controlled vehicle access windows were established to allow resident access, facilitate logistics, and ensure loading and unloading operations for commercial activities. These operational conditions were relevant for interpreting perceptions related to accessibility, congestion, and acceptance of pedestrianization.
The city of Loja (population approximately 214,000) is located in the southern highlands of Ecuador [
22], at approximately 2100 m above sea level, and serves as the provincial capital of Loja Province (See
Figure 1). As an intermediate city, Loja shares key characteristics with many other secondary urban centers in Latin America: high dependence on private vehicle use, a compact historic center with mixed commercial and residential land use, limited public transportation infrastructure, and a growing municipal interest in public space regeneration. These conditions make it a representative and analytically relevant case for examining pedestrianization acceptance in contexts where such interventions are increasingly being considered but remain understudied. Unlike large metropolitan cases (e.g., Bogotá, Lima, Santiago), intermediate cities such as Loja face distinct resource, governance, and cultural constraints that make direct extrapolation from metropolitan research problematic, justifying dedicated empirical study.
2.3. Target Population and Survey Instrument
The target population consisted of four distinct user groups: pedestrians or visitors, permanent business owners or employees, temporary business owners or employees, and residents of the intervention area. A structured questionnaire was designed to capture perceptions regarding urban experience, acceptance of pedestrianization, environmental impacts, and mobility behavior. The survey instrument was implemented using Survey123 for ArcGIS Online (Web Designer, Esri, Redlands, CA, USA) [
23], a platform that enables real-time data collection and automatic georeferencing of responses. This functionality ensured spatial consistency and allowed for the verification of response locations. The survey form is publicly accessible at:
https://survey123.arcgis.app?itemID=bbc3f43f75584001804ebb8606390aec (accessed on 22 March 2026).
Although Survey123 for ArcGIS enabled georeferencing of individual responses, a spatial analysis of perception patterns was not pursued for the following reasons. For pedestrians/visitors and temporary business owners georeferenced location reflects the point of interview within the festival zone rather than a meaningful fixed spatial attribute, as these respondents could be encountered at any point along the pedestrianized corridor. A geographically weighted or hotspot analysis would therefore conflate interviewer positioning with respondent spatial identity, producing analytically misleading results. For permanent business owners and residents, a spatially disaggregated analysis would have been more meaningful; however, the subsample sizes are insufficient for robust spatial autocorrelation or geographically weighted regression, which typically require substantially larger samples per spatial unit. Georeferencing was therefore used exclusively as a quality control mechanism to verify that surveys were completed within the defined intervention boundary, which it served effectively.
2.4. Sample Size Determination
Sample size estimation was based on official attendance data from the 2023 edition of the FIAVL, which registered 124,189 attendees across 205 performances of 132 artistic works [
24]. As 2025 attendance figures were not yet available at the time of study design, the 2023 edition served as the most recent reference for estimating the expected population of users exposed to the intervention. Assuming a 95% confidence level and a 5% margin of error, the minimum required sample size was calculated as 383 surveys. It should be noted that the survey was administered specifically along 24 de Mayo Street and Bolívar Street during the 2025 edition of the FIAVL, and the calculated sample size therefore represents a target for the street-level population directly exposed to the pedestrianization measures, consistent with the exploratory nature of this study.
2.5. Data Collection Procedure
Data collection was carried out by 22 previously trained undergraduate students from the Civil Engineering program at Universidad Técnica Particular de Loja (UTPL). The students conducted face-to-face interviews using mobile devices (various manufacturers including Samsung, Apple, and Xiaomi), primarily along 24 de Mayo Street and Bolívar Street. Prior to fieldwork, students received comprehensive training on survey objectives, standardized interview protocols, and ethical considerations.
The study was conducted in accordance with the Declaration of Helsinki and the Ecuadorian Organic Law on Personal Data Protection, ensuring participant anonymity and the use of aggregated data only. Under the standardized procedures of the local Ethics Committee (CEISH-UTPL), ethical review and approval were waived for this study, as the research was classified as “Research Without Risk” due to its anonymous nature. Consequently, informed consent was obtained from all participants prior to data collection, emphasizing the voluntary and confidential nature of their participation.
2.6. Data Cleaning and Validation
A total of 435 surveys were initially collected during the FIAVL 2025. Two respondents did not accept the informed consent and were therefore excluded from the dataset, yielding 433 records. One additional response was subsequently removed during the data validation stage due to inconsistencies in georeferenced coordinates, indicating that the survey had been completed outside the defined intervention area. After applying these exclusion criteria, a final dataset of 432 valid surveys was retained for analysis. This cleaning process ensured spatial and methodological consistency and improved the reliability of the results.
2.7. Statistical Analysis and Data Processing
The data processing and analytical workflow were conducted using the R statistical computing environment, version 4.3.0 [
25]. The methodological approach followed a descriptive–analytical framework to evaluate patterns of urban perception associated with pedestrianization. Data manipulation and tidying were performed using the tidyverse suite (v2.0.0), with dplyr employed for data transformation and tidyr for variable restructuring through pivoting operations. Data import and export procedures were handled using the readxl (v1.4.0) and writexl (v1.4.0) libraries, respectively.
Statistical visualizations were developed using ggplot2 (v3.4.0), complemented by the scales (v1.2.0) package for axis formatting and gridExtra (v2.3) for assembling multi-panel figures. All graphical outputs were exported in Scalable Vector Graphics (SVG) format to ensure high resolution suitable for publication. Exploratory bivariate analyses and tests of categorical independence were performed using the car (v3.1.0) and vcd (v1.4.0) packages, while inter-variable correlations were assessed and visualized using corrplot (v0.92).
The analytical sequence included the standardization of categorical response scales, the construction of single-item rescaled indices for citizen perception, and the segmentation of responses by stakeholder group. Exploratory bivariate analyses were conducted to examine associations between user type and key perception variables; results are reflected in the cross-tabulations and distributional comparisons presented in
Section 3.1,
Section 3.2,
Section 3.3 and
Section 3.4. Tests of categorical independence (chi-square) were used to guide the identification of meaningful group differences and to inform the segmentation criteria reported in
Section 3.6; given the exploratory nature of the study and the small sample size in some subgroups (particularly residents,
n = 17), results are presented descriptively rather than as formal inferential conclusions. The Spearman correlation between the Satisfaction and Acceptance indices was tested for statistical significance at α = 0.05; the resulting coefficient (ρ = 0.295,
p < 0.001) indicates a statistically significant but weak positive association. Given the exploratory scope of the study and the presence of subgroups with limited sample sizes, effect sizes are interpreted qualitatively (weak: ρ < 0.30; moderate: 0.30–0.50; strong: > 0.50) rather than through formal inferential models (
Section 3.6). Given the exploratory case study design, all statistical analyses—including Spearman correlations and chi-square-based group comparisons—serve as tools for pattern detection and hypothesis generation rather than for population parameter estimation or causal inference. To ensure transparency and reproducibility, a unified R script automating the entire workflow is publicly available in the
supplementary repository.
To ensure the transparency and reproducibility of the analytical workflow, the complete dataset and the comprehensive R script used for data processing and statistical analysis are available in the
Supplementary Materials.
3. Results
3.1. Sample Characterization
The final dataset comprised 432 valid responses collected during the FIAVL 2025 pedestrianization intervention. The sample was categorized into four groups: pedestrians/visitors (65.7%,
n = 284), permanent business owners or employees (21.3%,
n = 92), temporary business owners or employees (9.0%,
n = 39), and residents (3.9%,
n = 17). While
Table 1 provides a detailed breakdown of these characteristics disaggregated by user type, the overall sample averages are described below. Gender distribution across the total sample was relatively balanced, with 50.5% male and 48.4% female respondents. The predominant age group was 18–25 years (39.1%), followed by 26–35 years (32.6%). Regarding transportation, walking was the most frequent means of access (29.2%), followed by public bus (25.5%) and private automobile as driver (25.2%). Finally, average vehicle ownership patterns indicated that 48.4% of respondents did not own a private vehicle, while 38.9% owned an automobile and 8.6% owned a motorcycle.
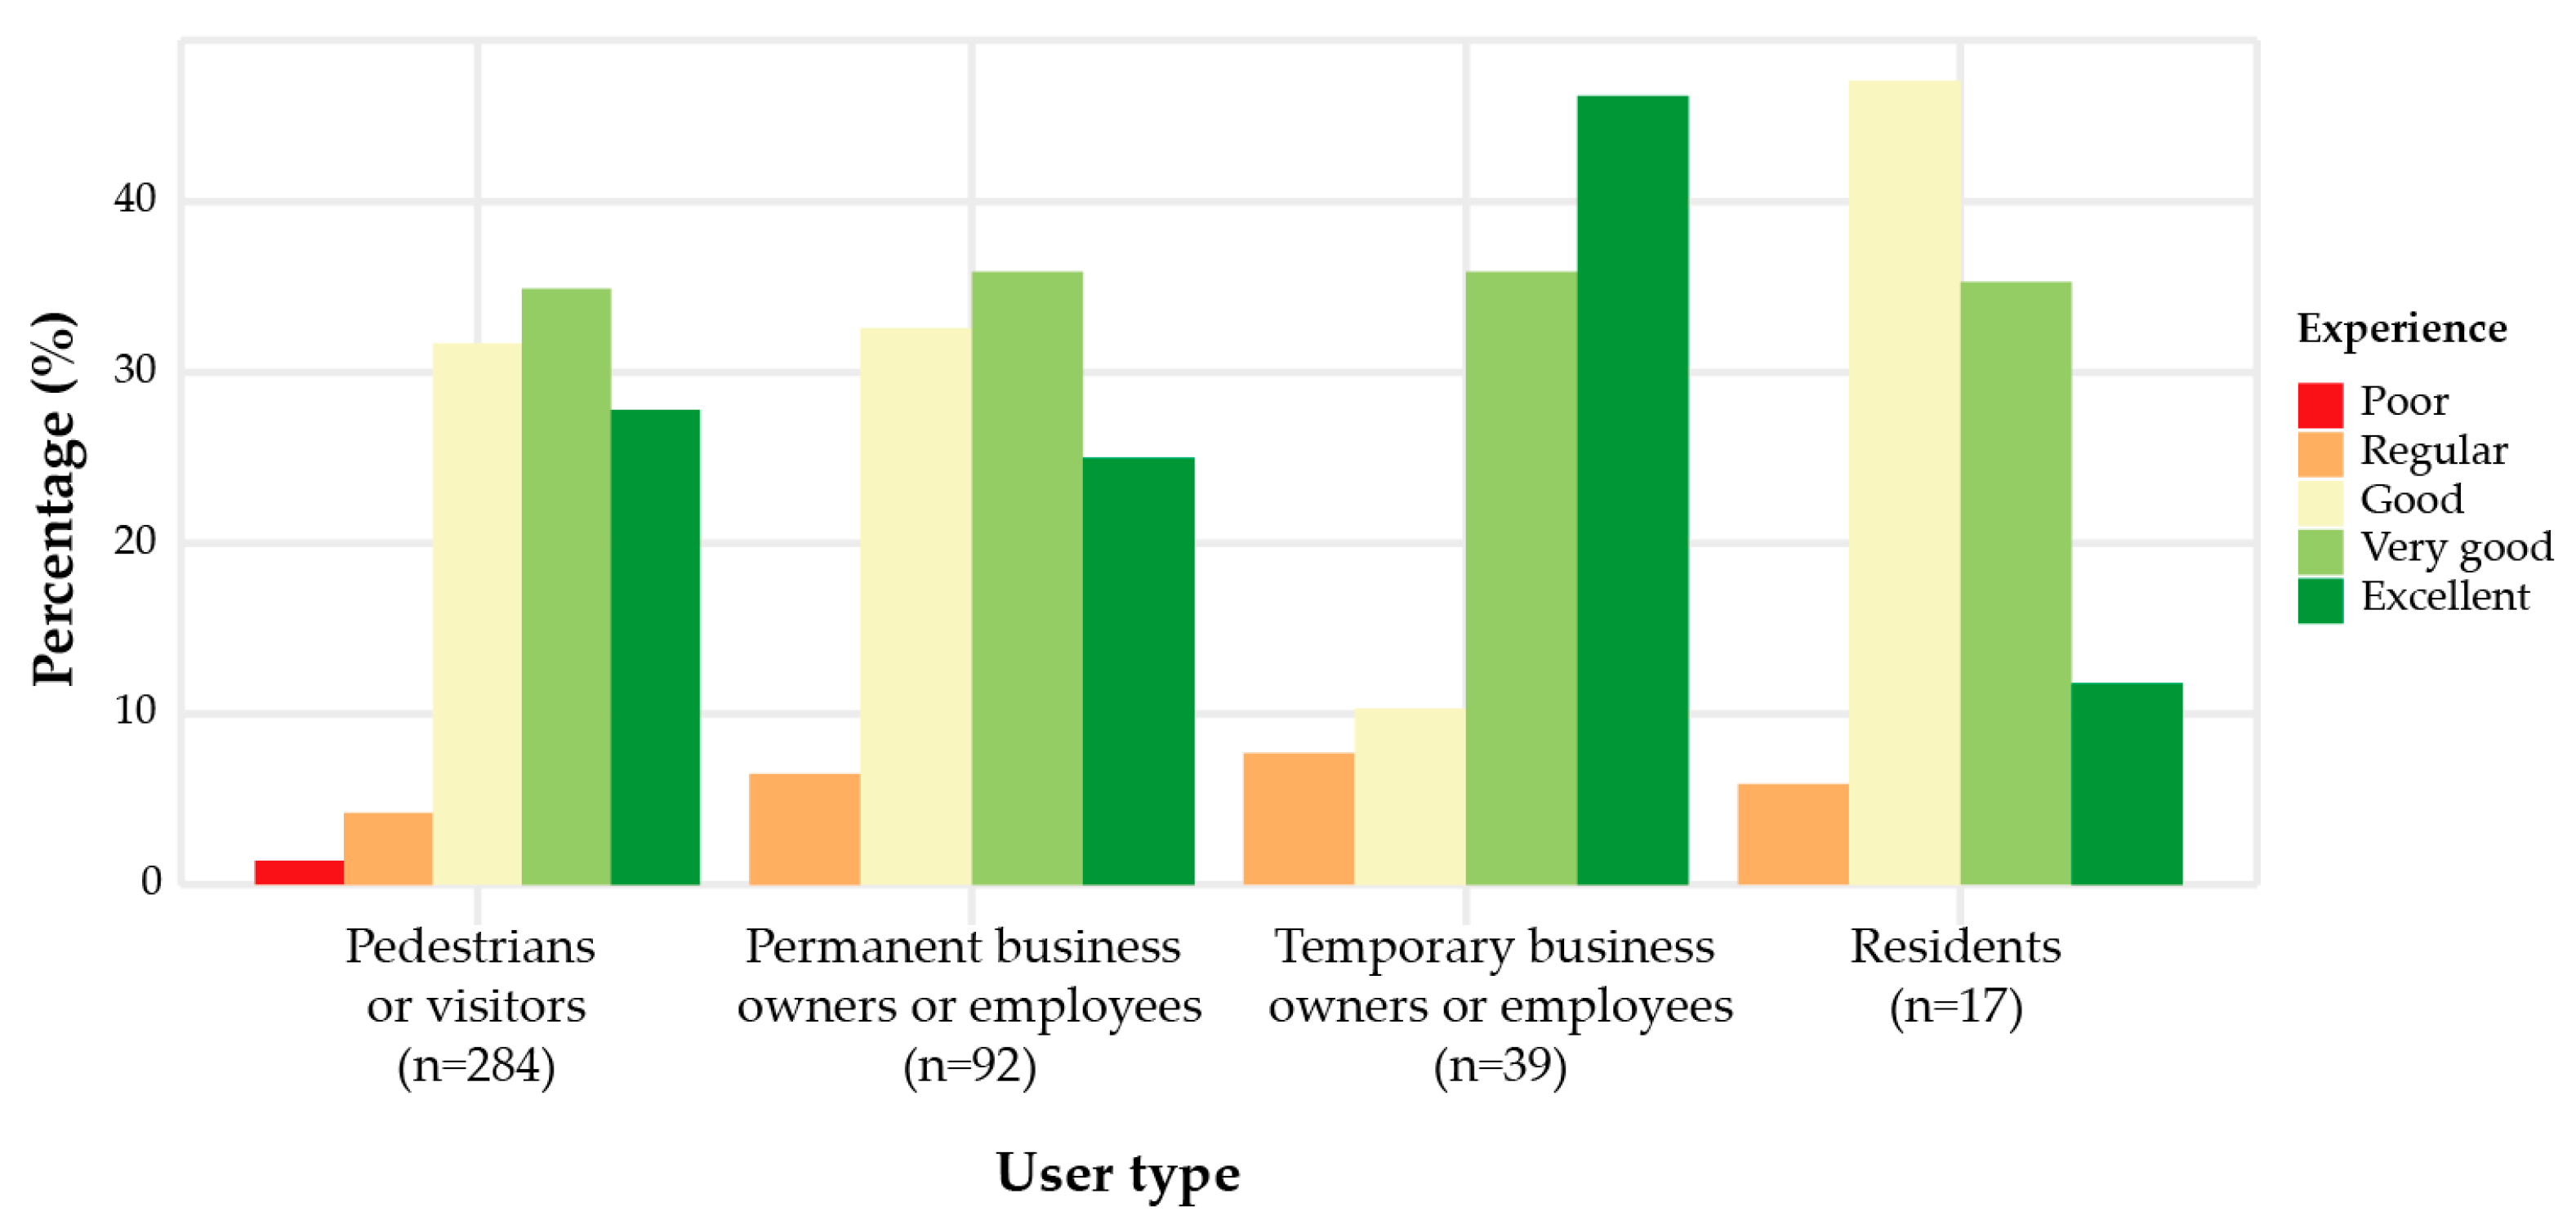
Overall experience in the pedestrianized zone was predominantly positive across all user groups, with 93.9% of respondents rating their experience as “good” or higher. Specifically, 35.2% rated their experience as “very good,” 30.6% as “good,” and 28.2% as “excellent.” Only 6.0% reported “regular” or “poor” experiences.
Figure 2 provides a detailed breakdown of these ratings by user type, illustrating that the majority of responses across all categories were concentrated within the “very good” and “good” classifications.
3.2. Perception Patterns by User Group
3.2.1. Business Owners and Employees
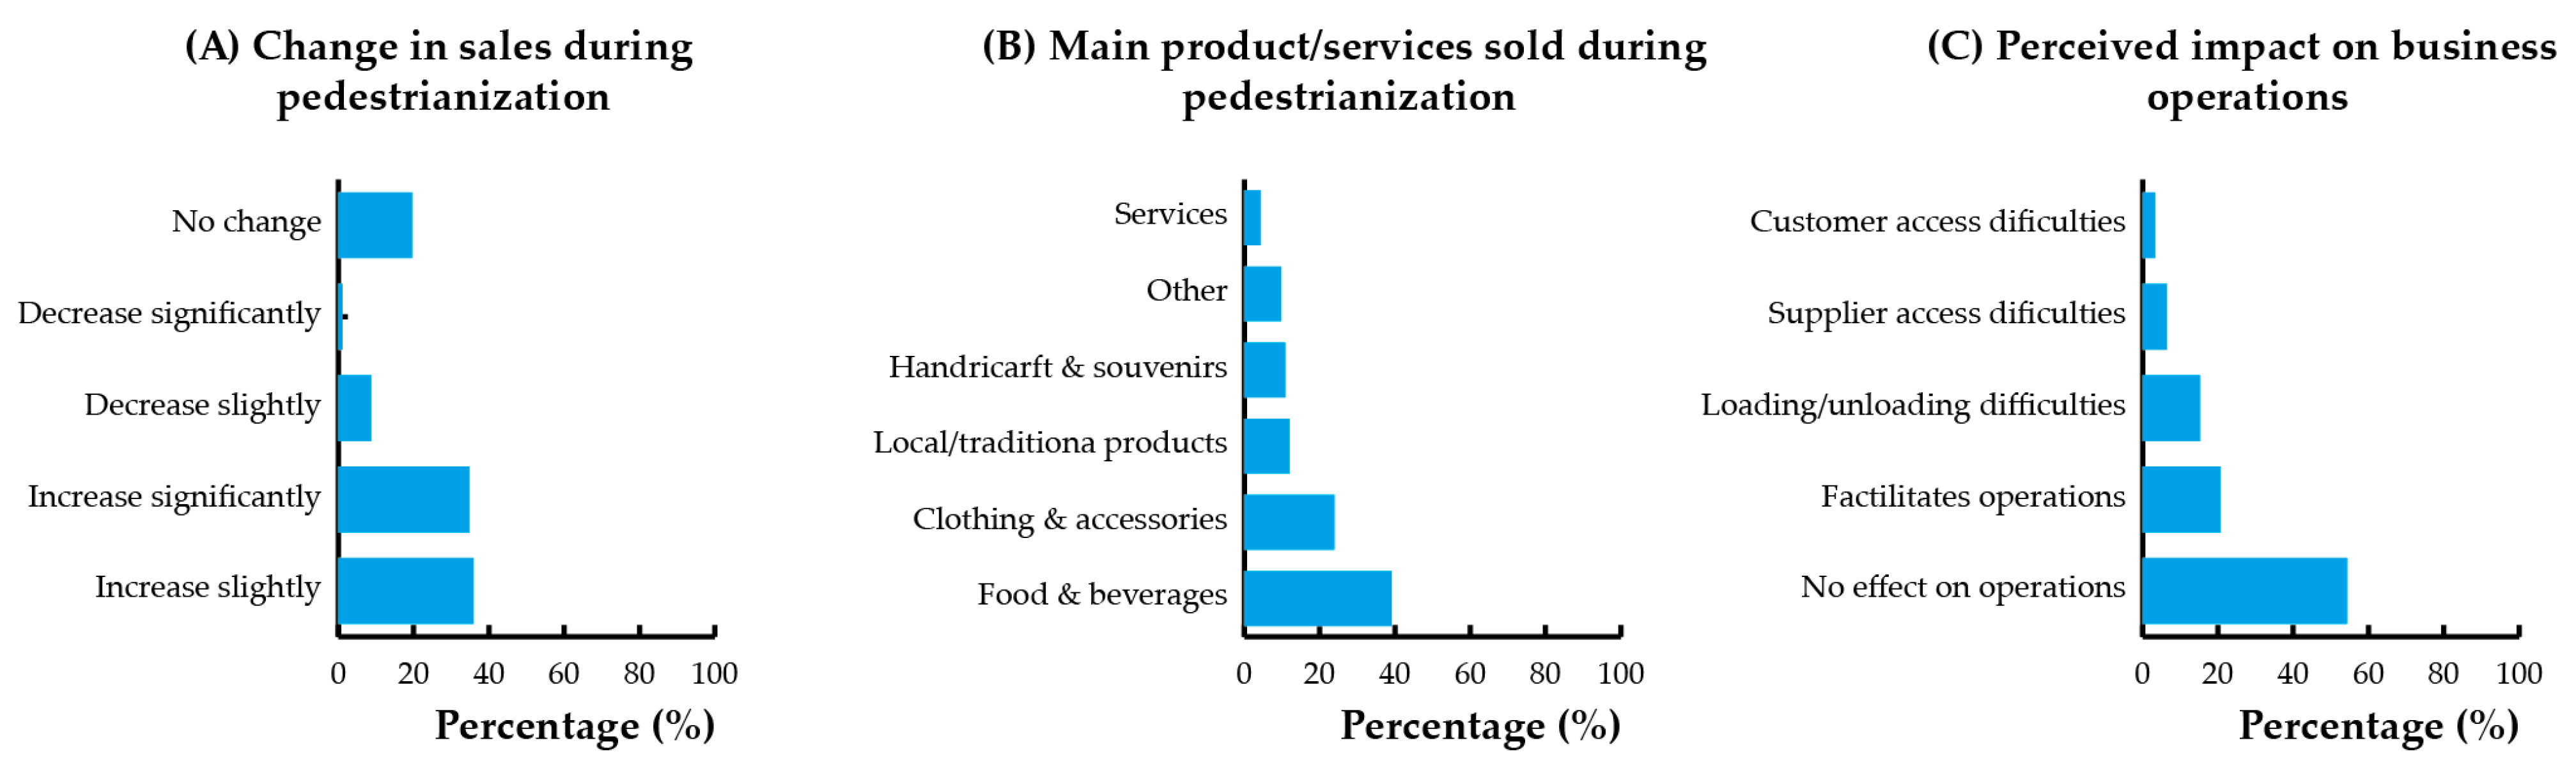
Among permanent business owners or employees (n = 92), perceptions of economic impact during pedestrianization were mixed but generally positive. A total of 70.7% reported increases in sales, with 35.9% indicating slight increases and 34.8% reporting significant increases. Only 9.8% experienced sales decreases, while 19.6% reported no change. The most commonly sold products during the intervention were food and beverages (39.1%), followed by clothing and accessories (23.9%), and local/traditional products (12.0%).
Regarding operational impacts, 54.3% of business owners stated that pedestrianization did not affect their operations, while 20.7% indicated it facilitated their activities. However, 15.2% reported difficulties with loading and unloading, 6.5% faced supplier access problems, and 3.3% experienced customer access challenges (
Figure 3).
Temporary business owners or employees (n = 39) demonstrated particularly high satisfaction levels, with 82.1% rating their experience as “very good” or “excellent.” This user segment exhibited the highest positive perception, likely reflecting the commercial opportunities created by concentrated pedestrian flows during the cultural festival.
3.2.2. Residents
Residents (n = 17) presented the most heterogeneous perceptions regarding daily life impacts. While 35.3% indicated that pedestrianization generated some inconveniences, 29.4% reported no effect, and 35.3% perceived improvements in their quality of life (23.5% slight improvements, 11.8% significant improvements). The primary concerns expressed by residents were difficulty entering/exiting their properties (52.9%), lack of nearby parking (23.5%), noise from pedestrian concentration (17.6%), and waste accumulation (5.9%).
When asked about permanent pedestrianization, resident opinions were distributed across categories: 35.3% were indifferent, 35.3% considered it positive with certain conditions, 17.6% viewed it as very positive, and 11.8% perceived it as negative or very negative (
Table 2).
3.2.3. Pedestrians and Visitors
Pedestrians and visitors (n = 284) constituted the primary beneficiary group of the intervention and reported the highest satisfaction levels. Visit frequency patterns showed that 41.2% visited occasionally (1–2 times during the event), 33.1% visited frequently (3–5 times), 13.7% attended whenever pedestrianization was implemented, and 12.0% were first-time visitors. The primary activities performed in the pedestrianized zone included walking/strolling (36.8%), eating/drinking (25.2%), shopping (14.2%), and socializing with friends/family (7.0%). Most visitors (43.0%) stayed between 30 min and 1 h, while 29.6% remained between 1 and 2 h.
Among pedestrians/visitors, 94.4% reported positive experiences (31.7% good, 34.9% very good, 27.8% excellent), demonstrating strong alignment between pedestrianization objectives and user satisfaction (See previous
Figure 2).
3.3. Valued Aspects and Perceived Disadvantages
Analysis of valued aspects revealed that perceived safety for walking was the most frequently cited positive attribute (19.8% of total mentions), followed by increased social interaction (15.8%), spaces for cultural activities (13.4%), quieter environment due to reduced noise (12.2%), and increased tourist attractiveness (10.2%). Environmental benefits such as cleaner atmosphere (8.3%) and improved air quality (1.2%) were also recognized, though less prominently (
Table 3).
Conversely, the most frequently mentioned disadvantages included difficulties with vehicular access (21.3%), vehicular congestion on adjacent streets (19.1%), parking problems (19.1%), increased presence of street vendors (11.9%), and excessive noise from pedestrian concentration (10.7%). Concerns about loading/unloading difficulties (9.3%) and lack of accessibility for people with disabilities (3.4%) were also noted. Notably, only 1.5% of respondents reported no disadvantages.
3.4. Acceptance of Permanent Pedestrianization
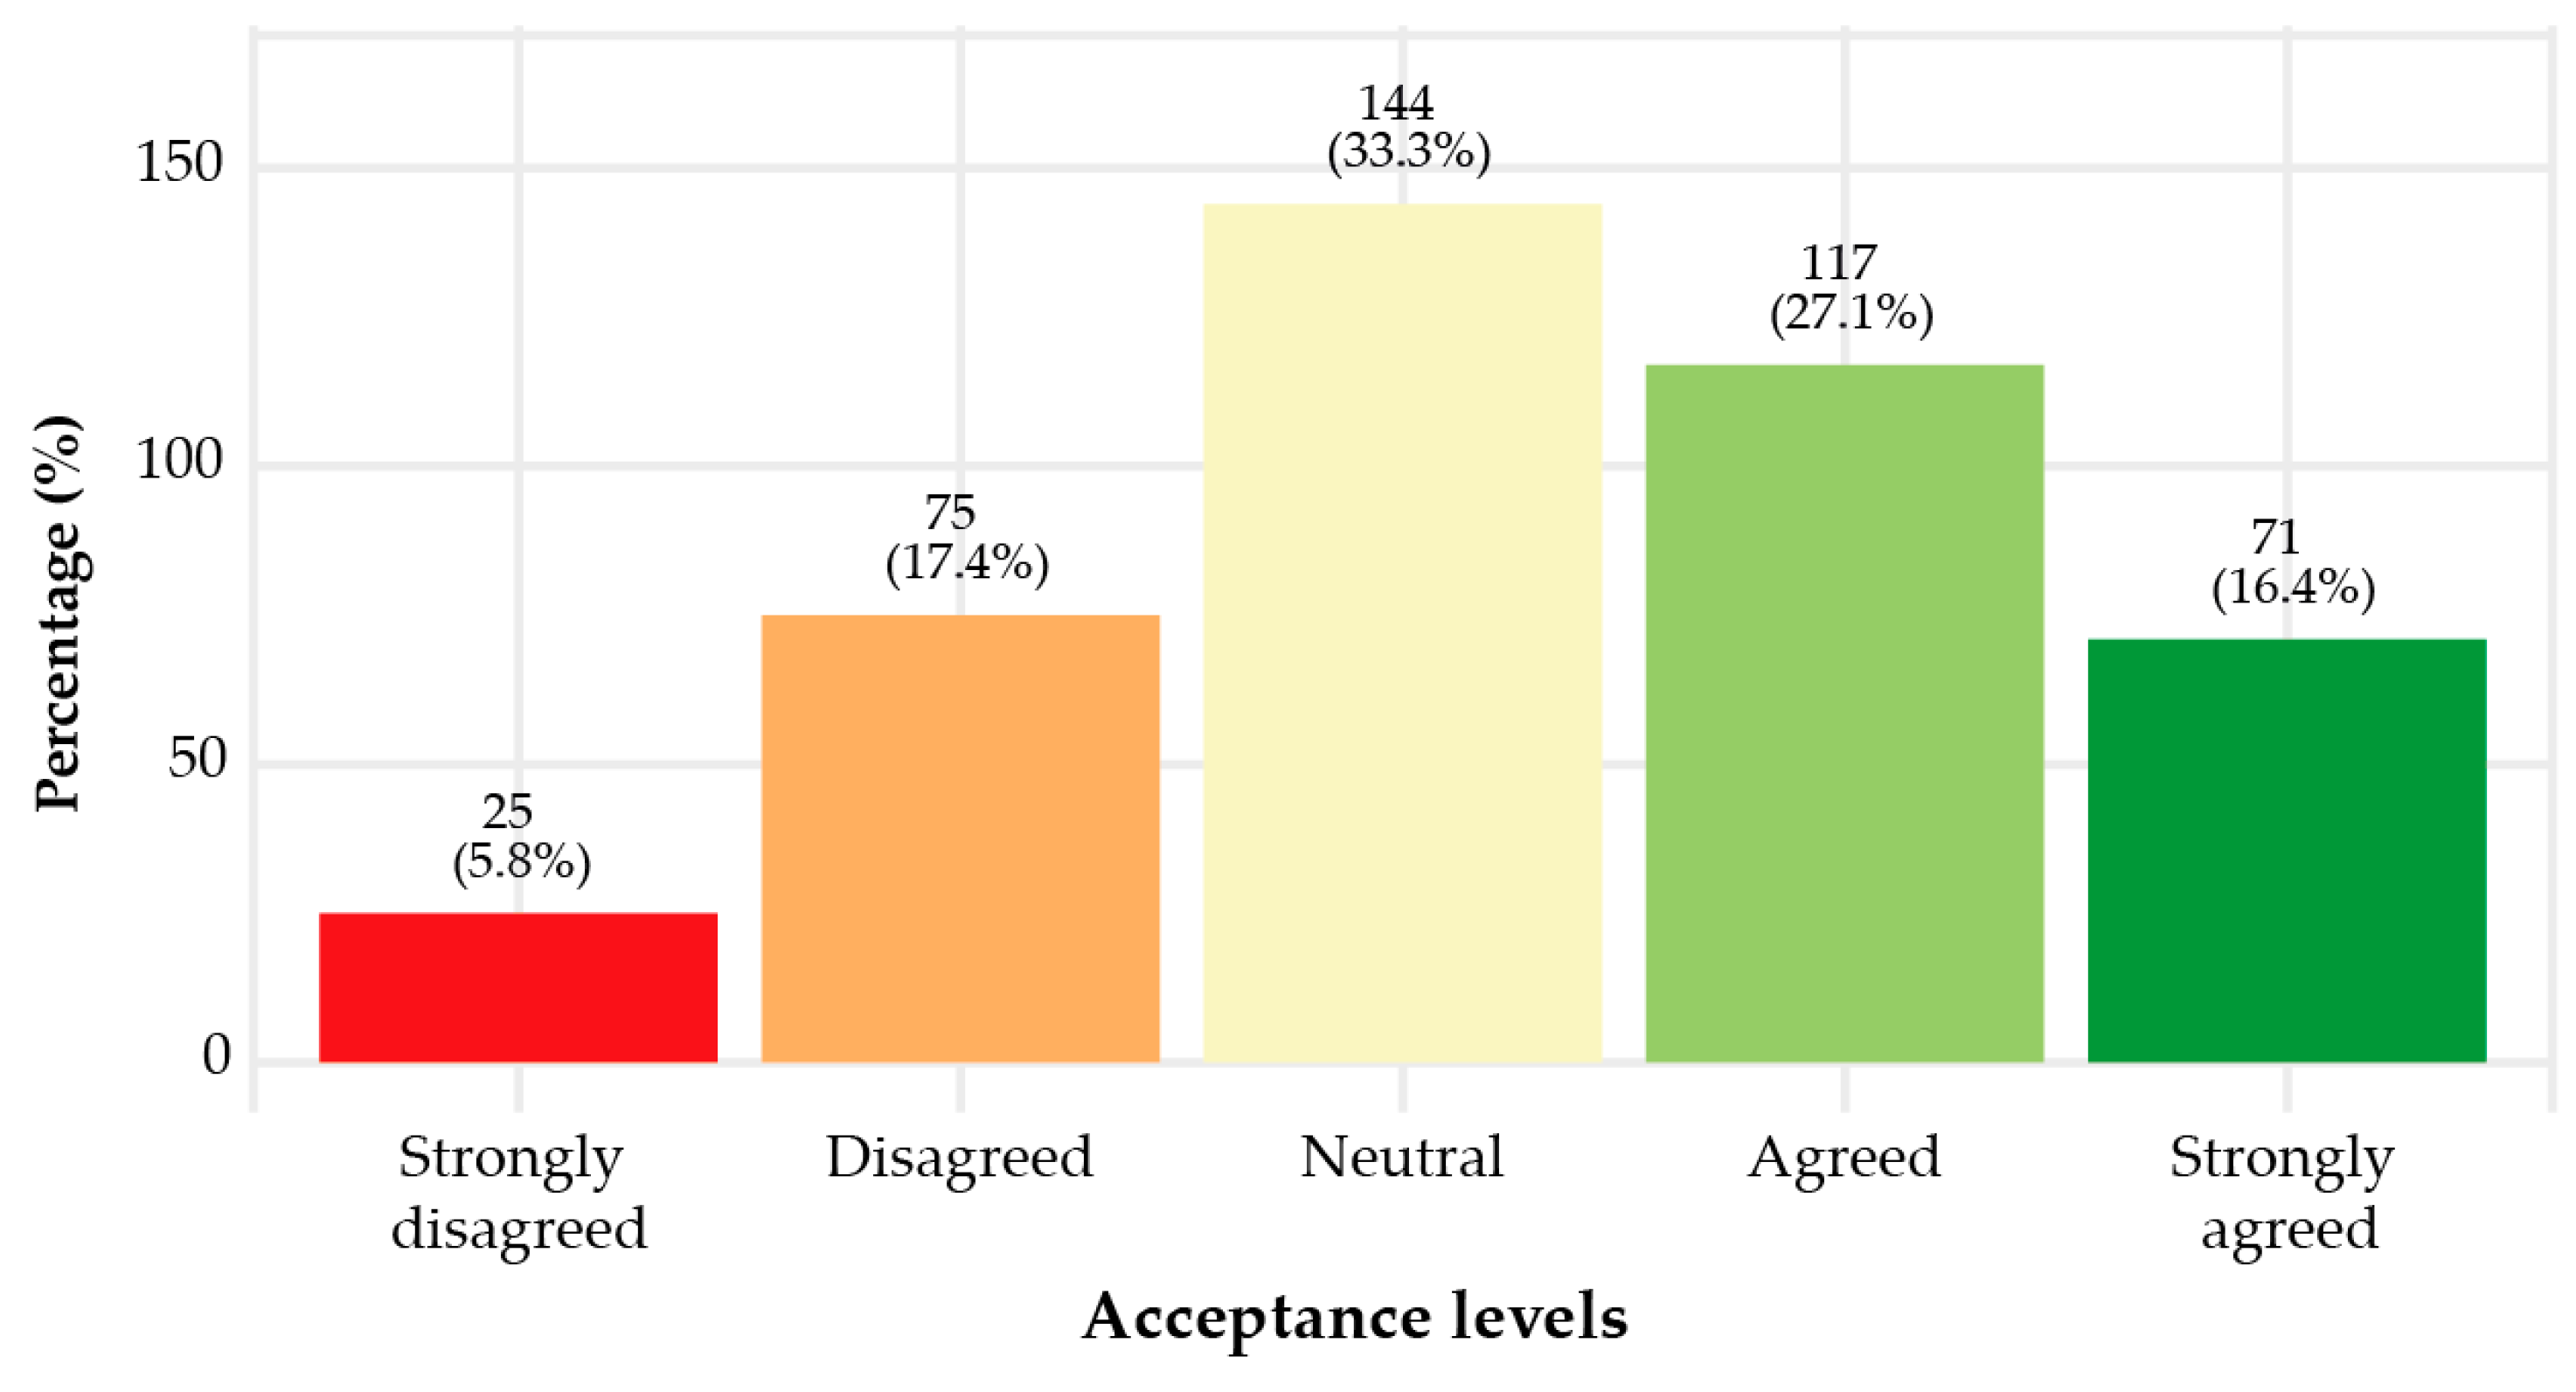
Overall acceptance of permanent pedestrianization showed a distribution across all response categories. Among all respondents, 43.5% expressed agreement or strong agreement with permanent implementation (27.1% agreed, 16.4% strongly agreed), while 23.2% expressed disagreement or strong disagreement (17.4% disagreed, 5.8% strongly disagreed). The largest proportion (33.3%) remained neutral toward permanent pedestrianization.
Acceptance levels varied by user type (
Figure 4). Pedestrians/visitors demonstrated the highest support, with 45.8% expressing agreement or strong agreement. Temporary business owners/employees showed 48.7% acceptance, though with lower intensity (43.6% agreed, only 5.1% strongly agreed). Permanent business owners/employees exhibited 37.0% acceptance, while residents showed the lowest acceptance at 29.4%.
3.5. Critical Success Factors
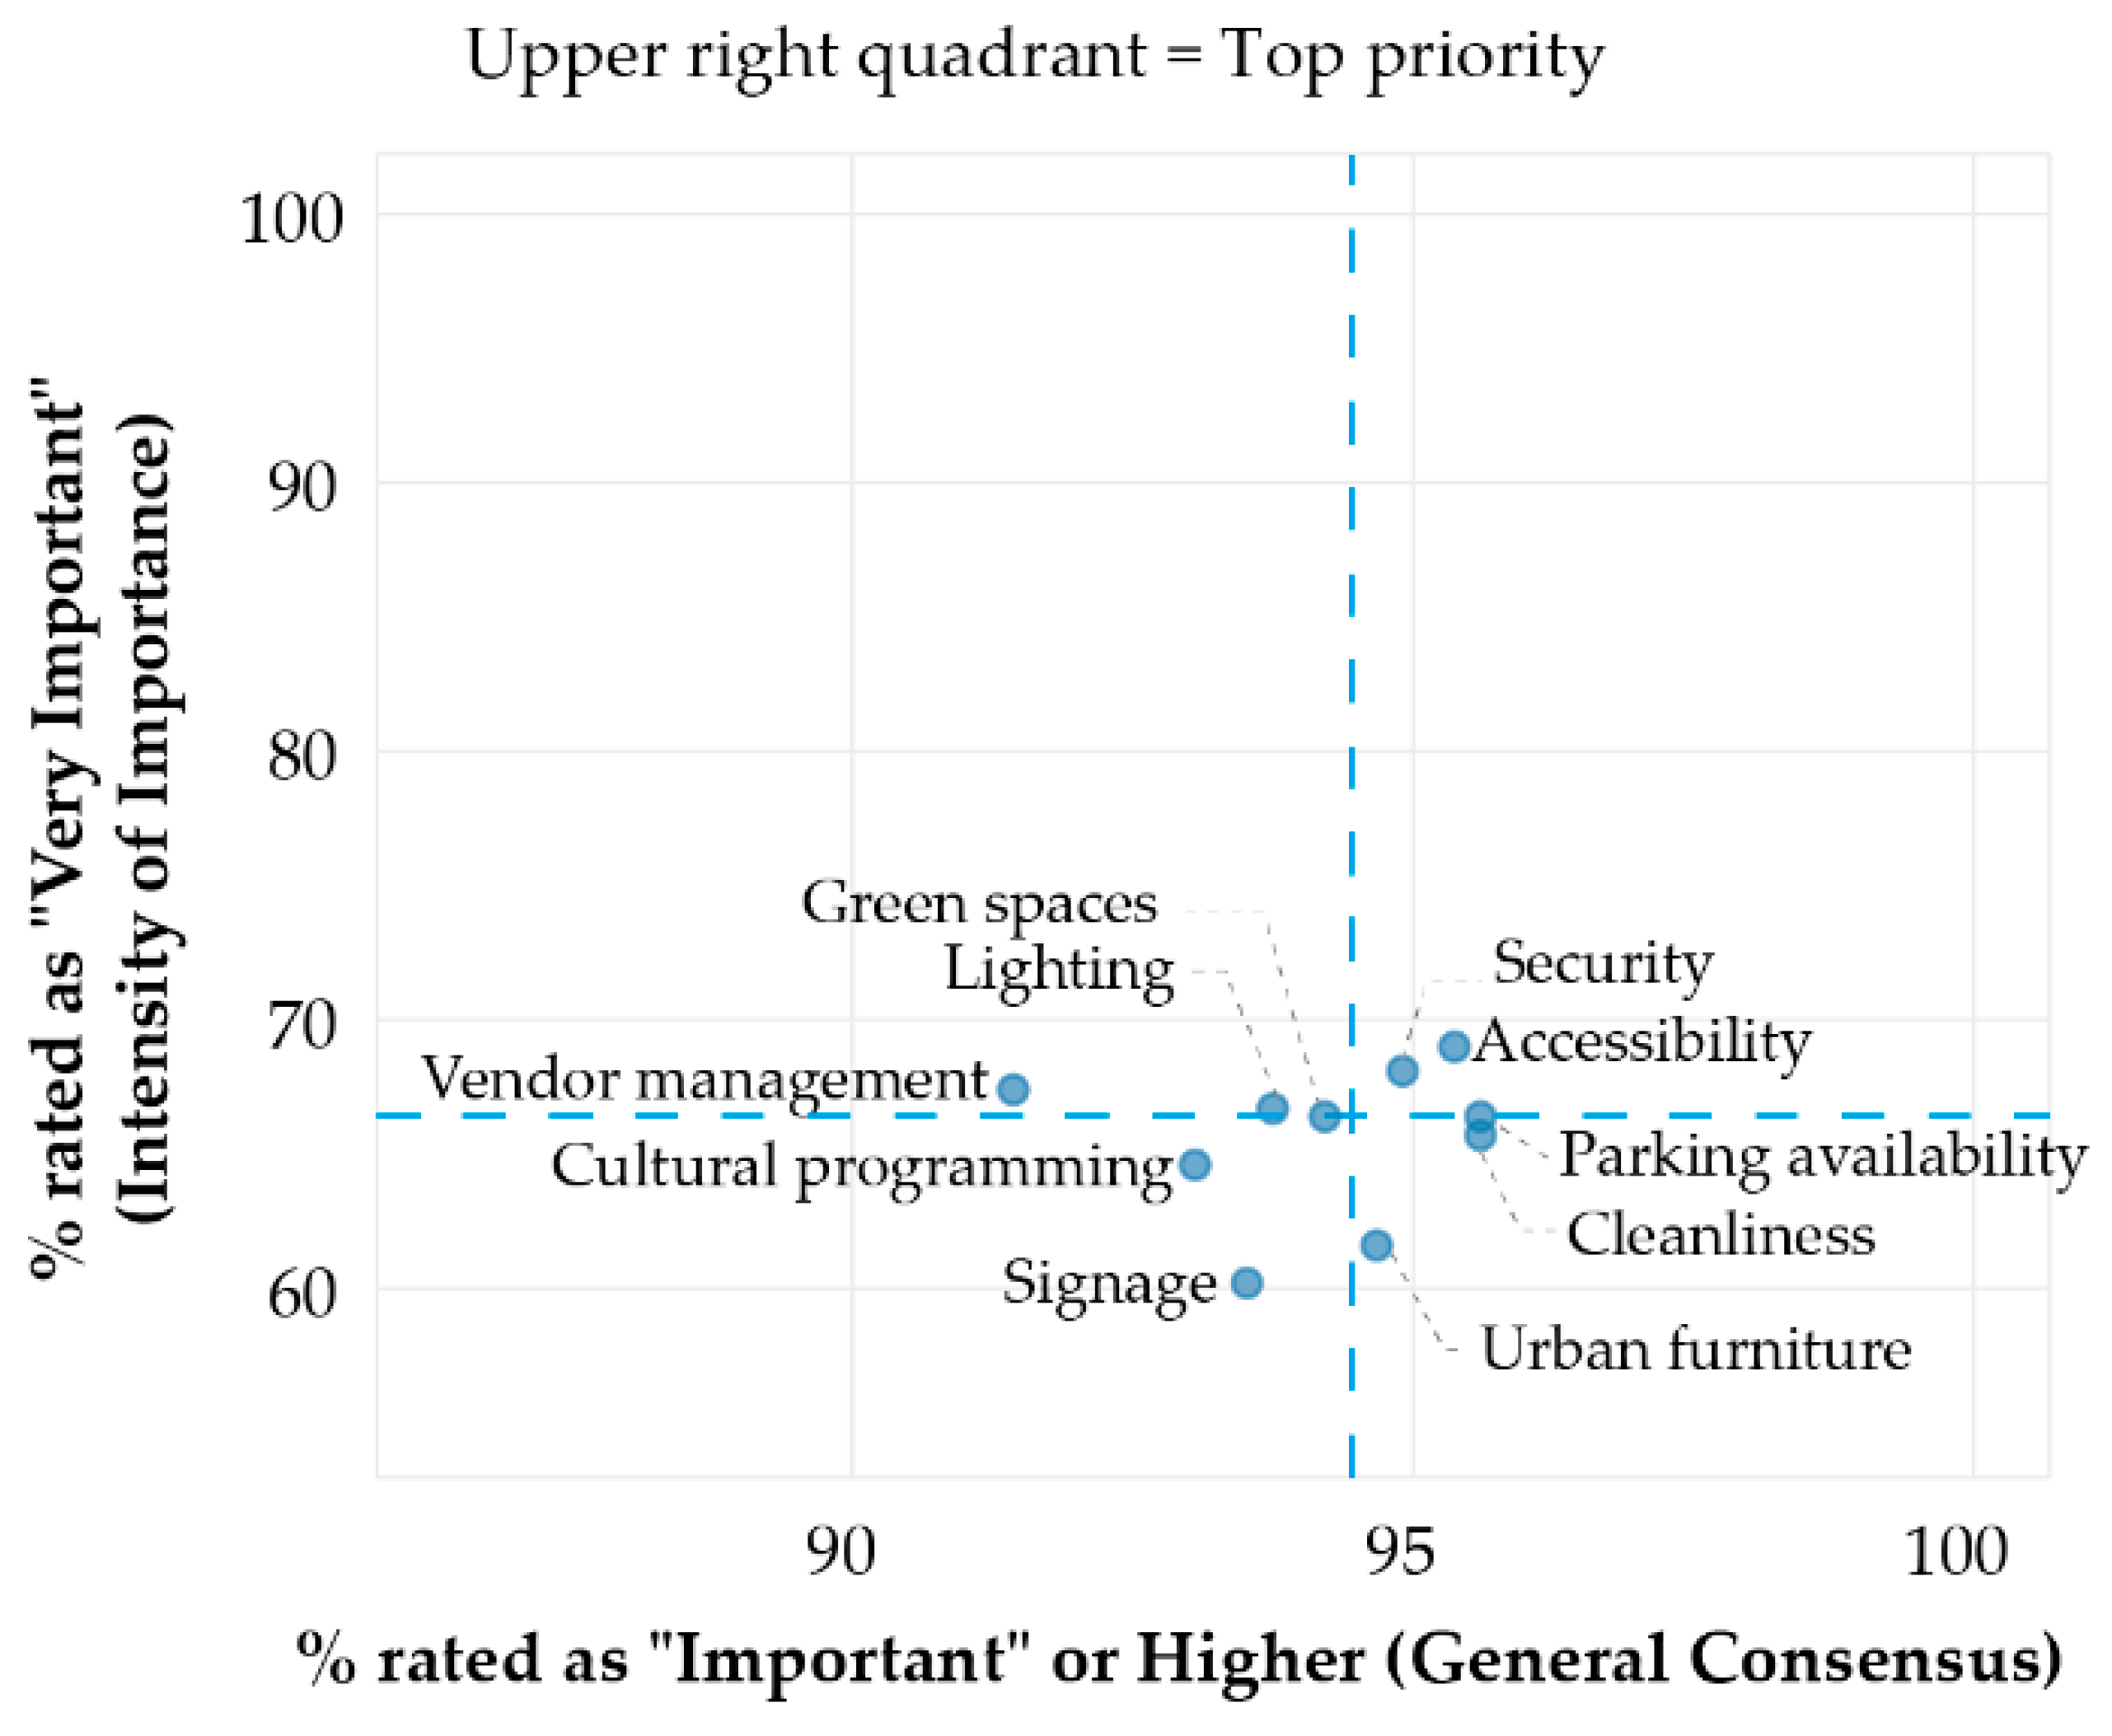
When respondents were asked to rate the importance of various factors for successful pedestrianization, accessibility emerged as the highest priority, with 69.0% considering it “very important.” This was followed closely by security (68.1%), vendor management (67.4%), lighting (66.7%), parking availability (66.4%), and green spaces (66.4%). Other highly valued factors included cleanliness (65.7%), cultural programming (64.6%), urban furniture (61.6%), and signage (60.2%). When combining “important” and “very important” categories, all factors exceeded 91% recognition, indicating a broad consensus on the multidimensional requirements for successful urban interventions.
Figure 5 presents a prioritization matrix that contrasts the intensity of support (“very important”) against the overall consensus (“important or higher”), identifying accessibility and parking as top-tier priorities. This relationship is further detailed in
Table 4, which ranks each factor by its primary importance.
3.6. User Segmentation and Composite Indices
To facilitate comparative analysis across user groups, three standardized single-item indices were constructed by linearly rescaling individual survey responses onto a 0–100 range. The Satisfaction Index was derived from the general experience rating (5-point scale: poor = 0, fair = 25, good = 50, very good = 75, excellent = 100). The Acceptance Index was derived from the permanent pedestrianization agreement item (5-point Likert: strongly disagree = 0, disagree = 25, neutral = 50, agree = 75, strongly agree = 100). The Environmental Perception Index was derived from the perceived pollution reduction item (same 5-point rescaling logic). All items were equally weighted given that each index corresponds to a single measure; no aggregation or inter-item weighting was required. Because each index derives from one item, Cronbach’s alpha and other internal consistency measures are not applicable. The threshold of 60 points was selected as the boundary between “neutral” and “positive” ratings (i.e., the midpoint between the neutral = 50 and agree = 75 anchor points), and the 40-point threshold represents the boundary between negative and neutral responses. These cut-points are grounded in the ordinal structure of the original response scales rather than in arbitrary statistical criteria. The full R script implementing this procedure is publicly available in the
supplementary repository, ensuring complete reproducibility.
Given that each index derives from a single survey item, factor analysis for dimensionality validation is not applicable—a single item cannot produce a factor structure. Similarly, inter-item weighting is not relevant as there is no aggregation across multiple items. Each index is simply a linear rescaling of one ordinal response to a 0–100 range. Missing data were handled through listwise exclusion: respondents who did not answer a given item were excluded from the calculation of that specific index but retained in analyses where their responses were complete. The number of missing values per item was negligible (fewer than 1% across all three items) and did not meaningfully affect the distributions reported.
Results showed that temporary business owners/employees presented the highest Satisfaction Index (84.1), followed by pedestrians/visitors (76.7), permanent business owners (75.9), and residents (70.6). However, acceptance indices were more moderate across all groups: pedestrians/visitors (58.5), temporary businesses (57.1), permanent businesses (56.5), and residents (52.9). Environmental perception indices ranged from 75.7 for pedestrians/visitors to 67.9 for temporary businesses (
Table 5).
To further characterize user attitudes, respondents were segmented into three attitudinal categories based on their combined satisfaction and acceptance indices. The classification thresholds were derived directly from the ordinal anchor points of the original response scales rather than from statistical distribution properties or external benchmarks. On the rescaled 0–100 range, the value of 50 corresponds to the “neutral” response anchor, 75 to “agree/very good,” and 25 to “disagree/fair.” The threshold of 60 points therefore represents the midpoint between the neutral (50) and positive (75) anchors—the point at which a response begins to lean toward agreement or satisfaction. The 40-point threshold represents the midpoint between the negative (25) and neutral (50) anchors, marking the boundary below which a response leans toward dissatisfaction or disagreement. This segmentation approach, adapted from Net Promoter Score methodology [
26], enables identification of user groups with distinct attitudinal profiles toward pedestrianization.
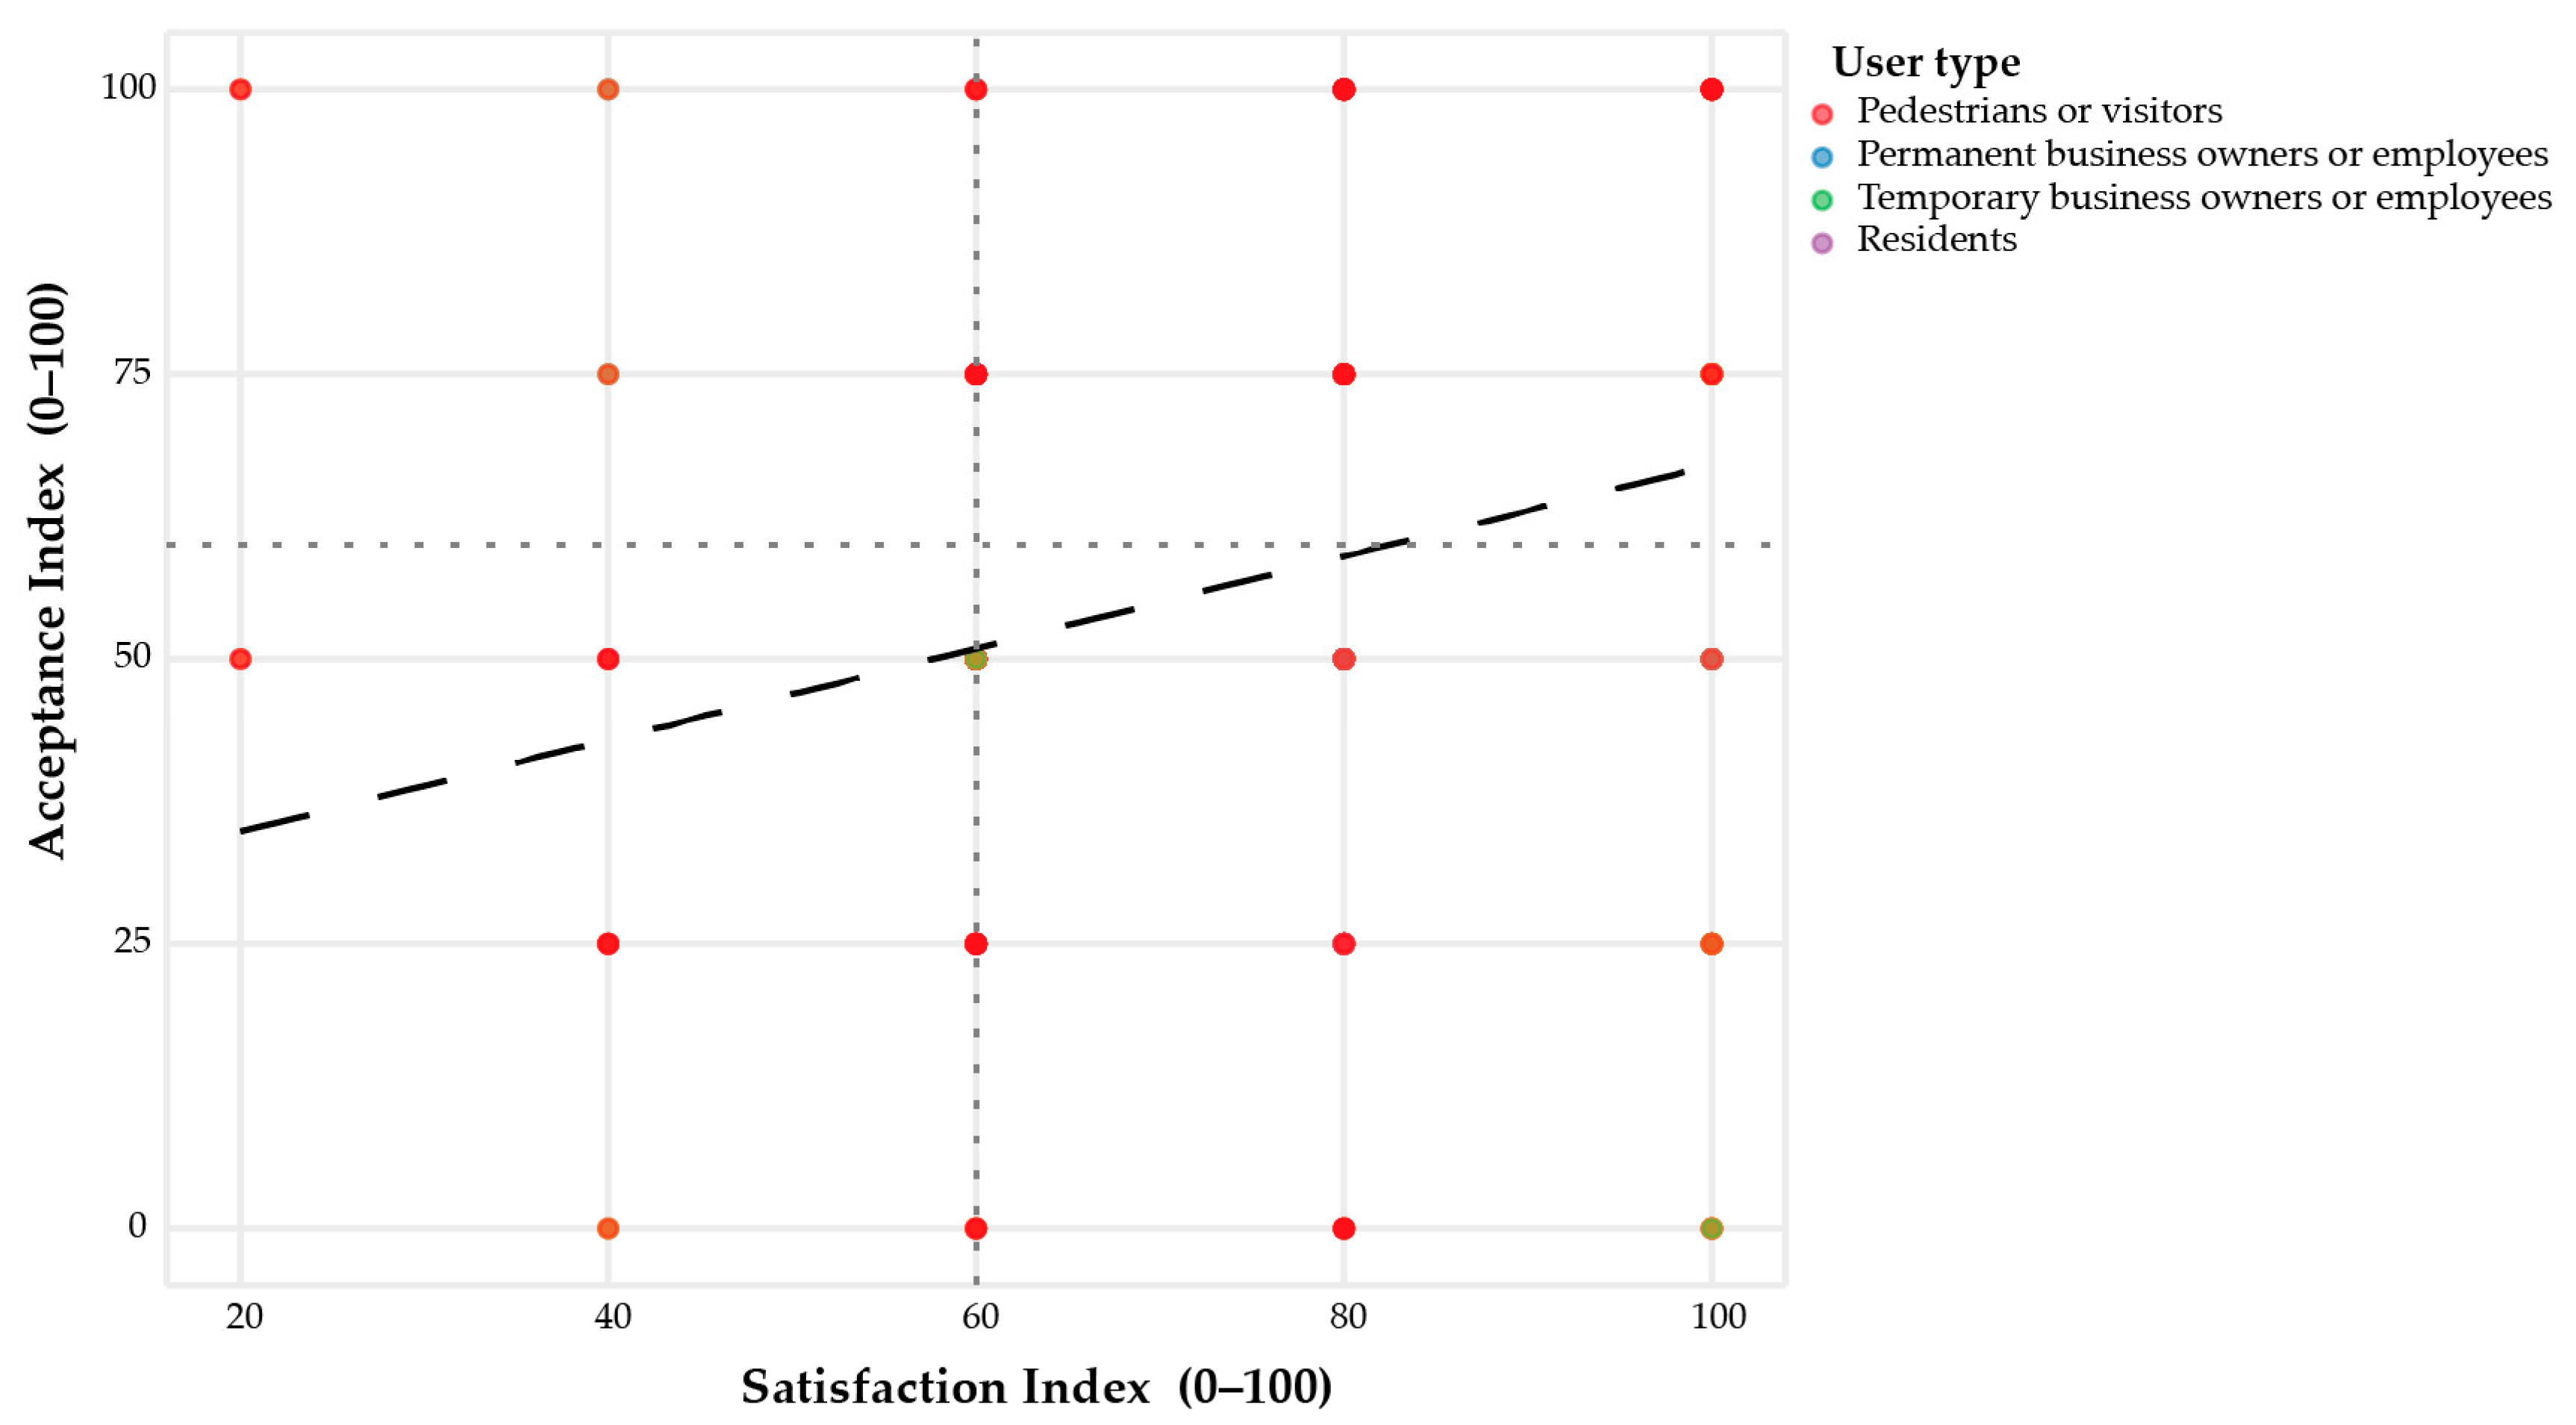
The correlation analysis between the Satisfaction Index and Acceptance Index revealed a Spearman coefficient of 0.295 (
p < 0.001,
n = 432) as illustrated by the trend line in
Figure 6. This statistically significant but weak association indicates that higher immediate satisfaction is only marginally predictive of willingness to support permanent implementation, suggesting that factors beyond current experiential quality—such as long-term accessibility concerns, economic interests, or mobility habits—play a more decisive role in shaping acceptance.
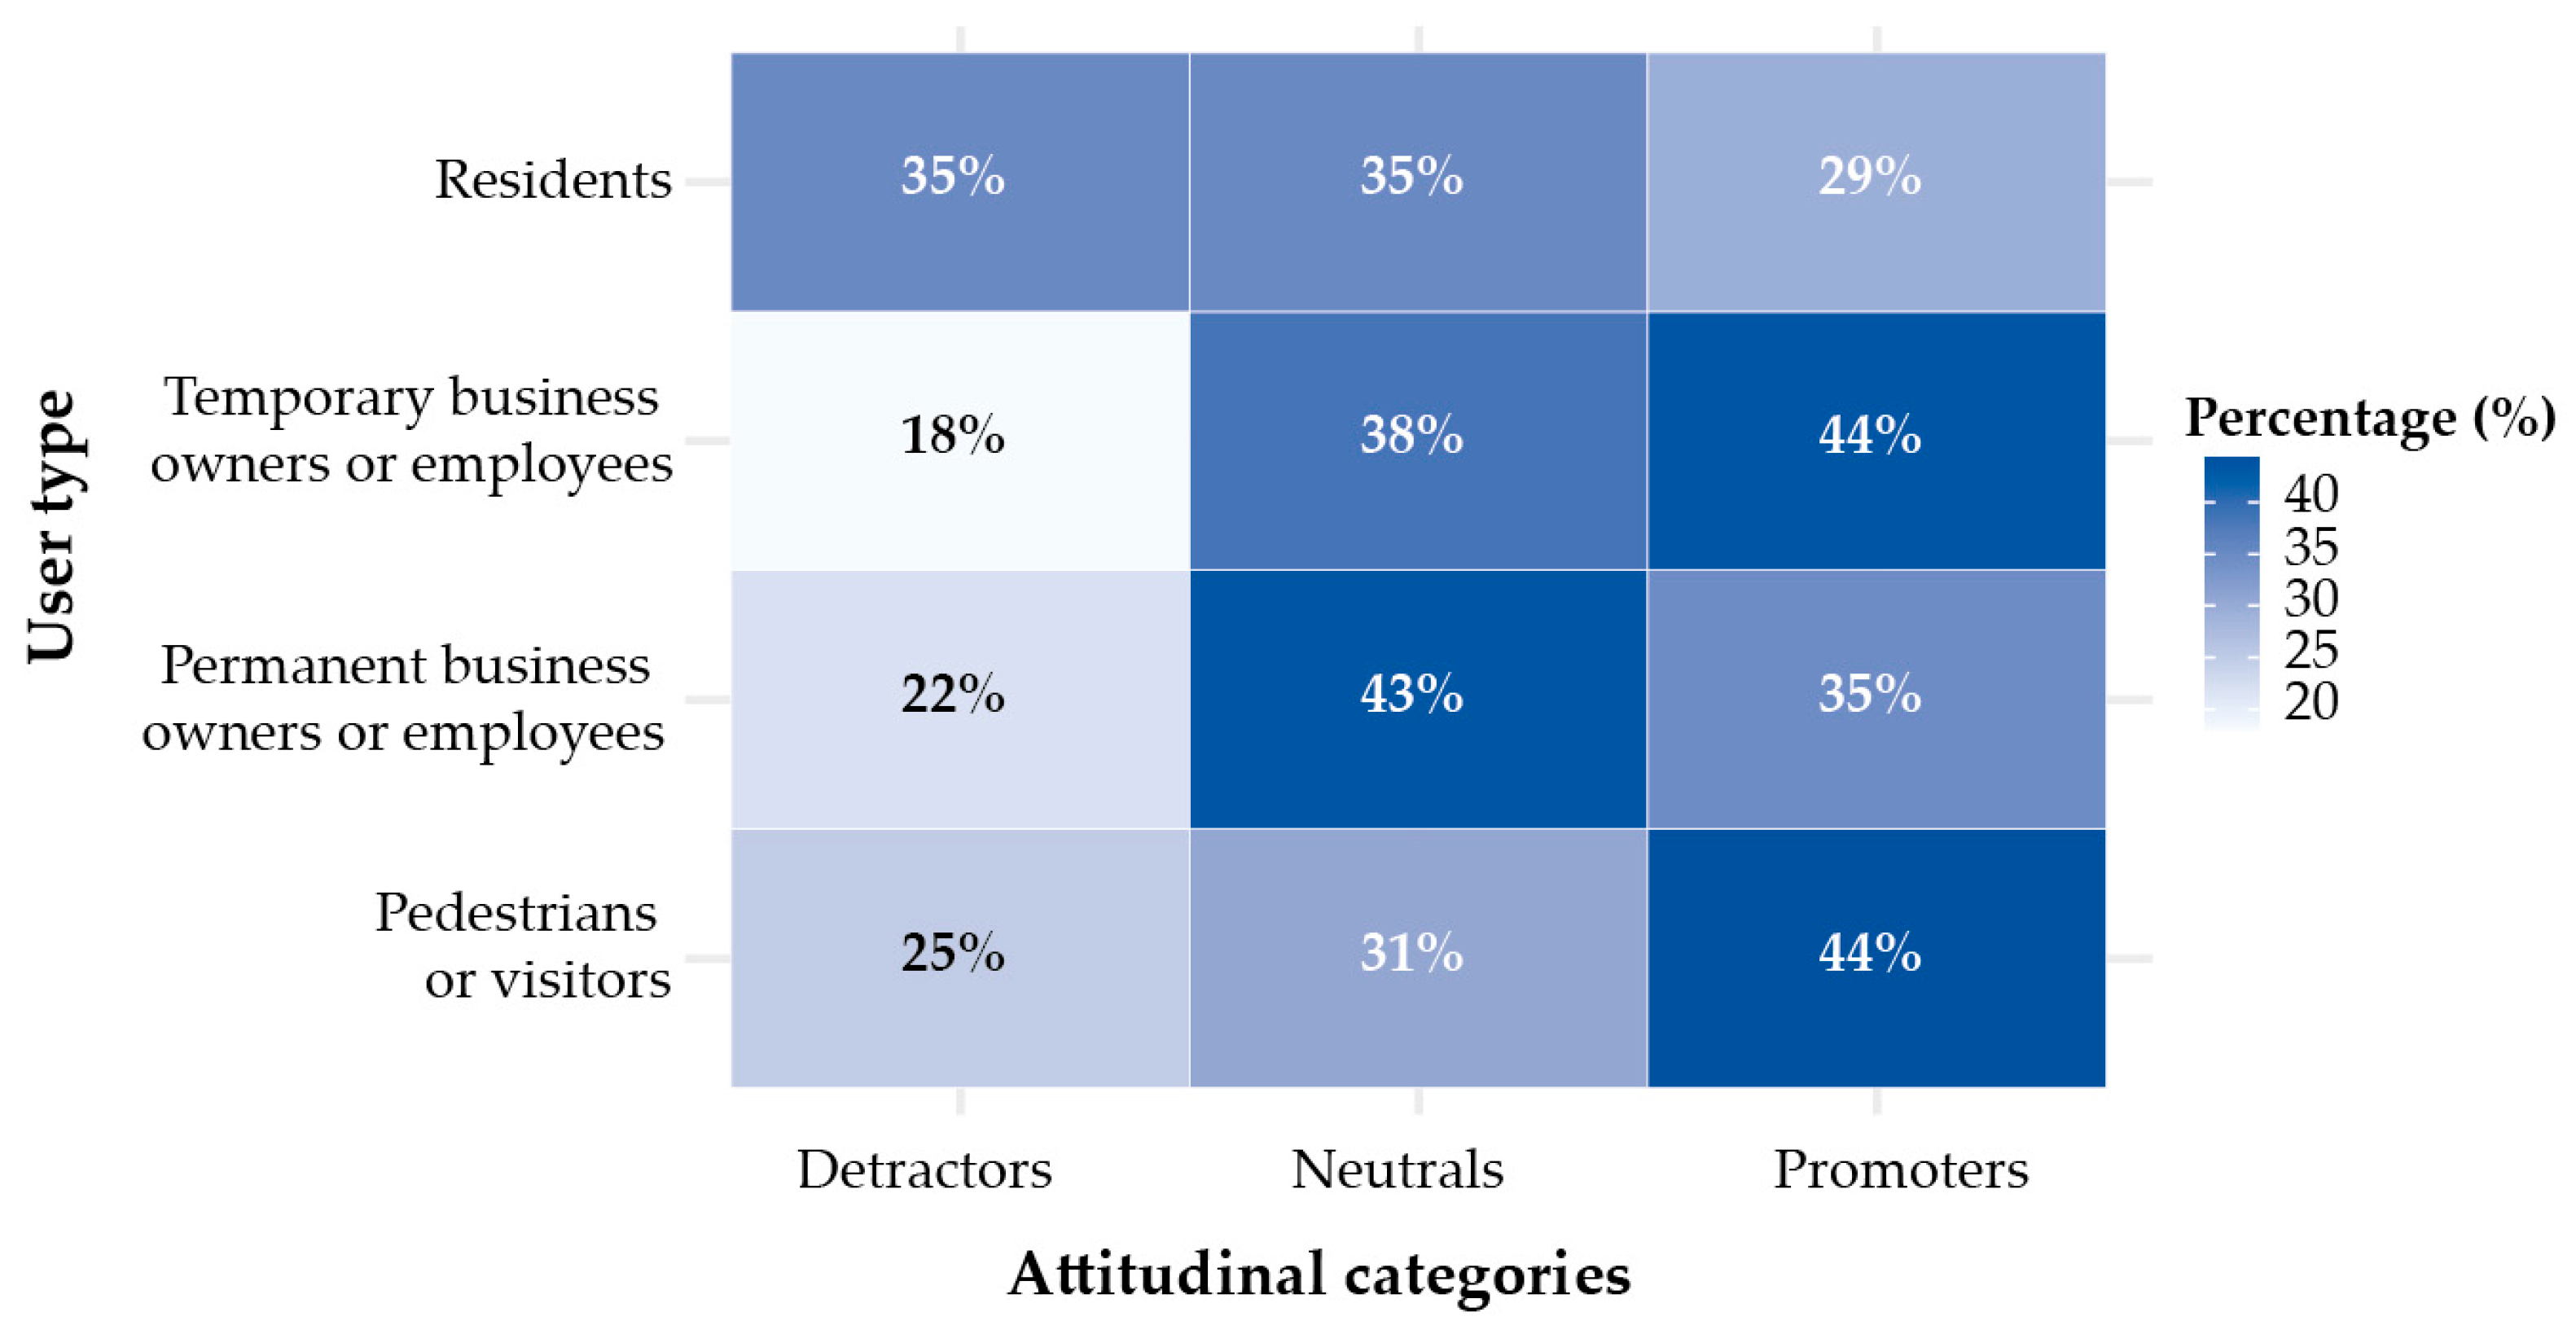
Respondents were further segmented into three attitudinal categories based on their combined scores: Promoters (those with high satisfaction and acceptance, 41.7%), Neutrals (moderate scores, 34.3%), and Detractors (low scores, 24.1%). Distribution across user types revealed that pedestrians/visitors had the highest proportion of Promoters (44.4%), while residents had the highest proportion of Detractors (35.3%) and Neutrals (35.3%) (
Figure 7). It should be explicitly noted that this segmentation framework is not intended to equate structurally distinct forms of opposition. Resident dissent, in particular, reflects legitimate concerns about daily property access, parking deprivation, and noise externalities that are categorically different in nature from the moderate indifference of occasional visitors. The “Detractor” classification for residents (35.3%) should therefore be interpreted as an indicator of structural opposition rooted in spatial redistribution trade-offs, not simply as low satisfaction on a continuous scale.
3.7. Temporal and Operational Preferences
When asked about appropriate days for pedestrianization, preferences were distributed as follows: weekends only (29.9%), during special events only (28.0%), holidays only (27.5%), every day (8.1%), and specific weekdays (6.5%). Regarding preferred time schedules, respondents favored afternoons from 11:00 to 19:00 (32.2%), evenings from 19:00 to 23:00 (29.6%), all day (25.5%), and mornings from 07:00 to 11:00 (12.7%). These patterns suggest that partial or event-based pedestrianization may generate broader acceptance than full-time implementation.
4. Discussion
The present study provides empirical evidence on citizen perceptions of urban pedestrianization in Loja, Ecuador, revealing patterns that both align with and diverge from international experiences documented in the literature. The high overall satisfaction levels (93.9% positive experiences) are consistent with findings from successful pedestrianization interventions in contexts such as Madrid, where similar satisfaction rates were associated with improved walkability and reduced pollution [
9]. However, the moderate acceptance of permanent implementation (43.5%) and the weak correlation between satisfaction and acceptance (r = 0.295) suggest that immediate positive experiences do not automatically translate into support for long-term policy changes. This gap underscores the complexity of pedestrianization acceptance, which extends beyond experiential quality to encompass concerns about accessibility, economic impacts, and lifestyle adaptations [
27,
28].
The differentiated perceptions across user groups reflect patterns observed in previous research. Business owners exhibited mixed responses, with 70.7% reporting increased sales during the intervention, yet only 37.0% supporting permanent pedestrianization. This ambivalence mirrors findings from commercial districts in Lahore and other cities, where economic benefits during implementation did not fully mitigate concerns about long-term accessibility and customer access [
8]. The fact that loading/unloading difficulties were reported by 15.2% of permanent business owners highlights operational challenges that must be addressed through thoughtful design of controlled access windows and logistics protocols. These logistical pressures are exacerbated by restricted delivery windows and the absence of strategically placed loading bays, which often force carriers to double-park or encroach on pedestrian areas, thereby creating safety risks and congestion at the zone’s boundaries [
29,
30]. These findings align with [
10], who demonstrated that inadequate attention to local operational needs can undermine pedestrianization initiatives regardless of broader environmental benefits.
Residents presented the most heterogeneous perceptions, with 35.3% reporting inconveniences and equal proportions expressing indifference or conditional support for permanent implementation. The primary concerns—property access difficulties (52.9%) and parking shortages (23.5%)—echo challenges documented in pedestrianization studies across diverse contexts [
1,
4,
31]. This heterogeneity suggests that residents experience pedestrianization as a trade-off between improved public space quality and reduced private vehicle convenience. The finding that residents constitute the user group with the highest proportion of Detractors (35.3%) indicates that proximity to intervention areas amplifies concerns about daily functionality. This pattern has significant implications for participatory planning processes, as resident buy-in is critical for long-term policy sustainability [
5].
The divergence between satisfaction and acceptance observed across all user groups warrants deeper contextual interpretation. In Loja, as in many intermediate Latin American cities, high private vehicle ownership (38.9% car owners in this sample) and limited public transport alternatives create a structural dependency on automobiles that shapes attitudes toward interventions perceived as restricting vehicular access. Thus, even respondents who report positive pedestrian experiences may rationally oppose permanent pedestrianization if they anticipate reduced accessibility under non-festival conditions. This suggests that the gap between experiential satisfaction and policy acceptance reflects not simple attitudinal ambivalence but a rational response to mobility trade-offs. Research on pedestrian environments indicates that positive walking experiences are strongly influenced by environmental quality and microclimatic conditions, which can enhance restorative outcomes during well-designed walking environments, particularly when green infrastructure and comfortable environmental settings are present [
32]. Likewise, evaluations of pedestrian infrastructure show that perceptions of walkability vary according to users’ demographic and physical characteristics, with mobility limitations often associated with lower perceived service quality [
33]. Consequently, temporary pedestrianization events such as FIAVL may amplify short-term experiential benefits—through improved environmental conditions and festive social settings—while leaving underlying mobility preferences unchanged, explaining why high satisfaction during temporary interventions may coexist with lower acceptance of permanent pedestrianization policies.
Several potentially confounding variables were not controlled for in this analysis, which constrains causal interpretation of the observed associations. Distance from the pedestrianized core was not measured, though it likely moderates the perceived costs and benefits of restricted vehicle access—particularly for residents and business owners whose daily operations depend on proximity. Pre-existing mobility patterns and car dependency beyond vehicle ownership were not captured, meaning that respondents who rely on private cars for work-related trips may hold systematically different attitudes than those whose car use is discretionary. Prior exposure to pedestrianization in other cities was likewise not assessed, though such experience could either lower resistance (familiarity effect) or raise expectations. These unmeasured variables represent directions for future confirmatory research using more controlled designs. The present study’s findings are best understood as exploratory associations within a specific event context, not as controlled estimates of the effect of pedestrianization on citizen attitudes.
The identification of accessibility, security, and parking as top-tier critical success factors reinforces the multidimensional nature of successful pedestrianization. While previous research has emphasized environmental and social benefits [
2,
3], the present study demonstrates that operational factors remain central to citizen acceptance, particularly in intermediate cities where automobile dependency is high and public transportation infrastructure may be limited. The consensus across user groups regarding the importance of these factors (all exceeding 91% when combining “important” and “very important” responses) suggests that future interventions must adopt integrated approaches that simultaneously address walkability, safety, and mobility alternatives.
Temporal and operational preferences revealed in the study indicate that partial or event-based pedestrianization may be more socially acceptable than permanent full-time implementation. The preference for weekends (29.9%), special events (28.0%), and afternoon/evening schedules (61.8% combined) suggests that flexible models could maximize benefits while minimizing disruption to daily routines. Sundays or weekends are the preferred days for pedestrianizing streets, as they feature lower vehicle traffic, easier delivery rerouting, and higher recreational demand from pedestrians [
34]. This finding is particularly relevant for intermediate Latin American cities, where cultural and economic dynamics differ from the European historic centers that dominate existing literature [
11,
14]. Adaptive approaches that respond to local rhythms and user needs may offer a more viable pathway than rigid, permanent interventions.
The study also contributes methodologically by demonstrating the value of composite indices and user segmentation in pedestrianization research. The tripartite classification into Promoters (41.7%), Neutrals (34.3%), and Detractors (24.1%) provides a nuanced understanding of public opinion that extends beyond binary acceptance/rejection frameworks. This segmentation approach, combined with exploratory analytical techniques, enables more targeted policy responses and communication strategies tailored to different stakeholder groups.
Despite its contributions, this study has several limitations. This study has several important limitations that bear on the interpretation of the findings. First, data were collected exclusively during the FIAVL 2025—a major cultural festival characterized by heightened pedestrian activity, commercial opportunities, and a festive atmosphere that likely amplified positive perceptions relative to ordinary conditions. The Satisfaction Index reflects experiences during a bounded, high-energy event and should not be interpreted as predictive of satisfaction under routine weekday pedestrianization. Second, it is also important to acknowledge a practical constraint that shaped the resident subsample: residents in the intervention area were notably difficult to access during the survey period, as many were reluctant to participate given the festival context. The small sample (n = 17) therefore reflects not only a limitation of study design but a real-world access constraint that future studies should address through dedicated resident engagement strategies prior to data collection. Future studies should deliberately oversample residents to enable meaningful group comparisons. Third, the cross-sectional design precludes analysis of how attitudes evolve over time, particularly through the adaptation period that typically follows the introduction of pedestrianization measures. Fourth, the study is limited to a single street corridor in one city during one event, which restricts direct generalizability; the findings should be interpreted as contextually situated insights for comparable intermediate cities rather than universal patterns. Fifth, although responses were georeferenced, the spatial heterogeneity between street segments (24 de Mayo vs. Bolívar Streets) could not be rigorously analyzed. For the majority of respondents (pedestrians and temporary vendors), interview location does not correspond to a fixed spatial relationship with the intervention, making spatial regression inappropriate. For permanent businesses and residents, subsample sizes are insufficient for geographically weighted analysis. Future research using larger, spatially stratified samples and longitudinal designs—incorporating stratified resident sampling and comparisons between festival and non-festival periods—would enable a more robust examination of how proximity to vehicle access points, pedestrian flow intensity, and segment-specific amenities shape user perceptions.
5. Conclusions
This study analyzed citizen perceptions of urban pedestrianization in Loja, Ecuador, using exploratory analytical techniques applied to data from 432 respondents across four user groups. The findings reveal a complex landscape of perceptions characterized by high immediate satisfaction but moderate acceptance of permanent implementation, underscoring that experiential quality alone does not guarantee policy support.
Three key conclusions emerge from this research. First, user type significantly influences pedestrianization acceptance, with pedestrians and visitors demonstrating the highest support and residents exhibiting the most heterogeneous and cautious perceptions. This differentiation highlights the need for stakeholder-specific engagement strategies that address the distinct concerns and priorities of each group. Second, accessibility, security, and parking emerge as non-negotiable requirements for successful pedestrianization, indicating that interventions must integrate mobility alternatives and operational flexibility rather than simply restricting vehicle access. Third, partial or event-based pedestrianization models may offer a more viable and socially acceptable pathway for intermediate cities than permanent full-time implementation, suggesting that adaptive approaches better align with local rhythms and needs.
From a policy perspective, the findings offer guidance that extends beyond the festival context in which they were collected. While the study was conducted during a temporary, event-based pedestrianization—which itself resembles a “pilot temporary intervention”—this does not render the policy recommendation circular. The data reveal why temporary interventions generate differentiated acceptance: they lower perceived costs by virtue of their objectively reversible nature, concentrate benefits during high-activity periods, and avoid the permanent accessibility trade-offs that often drive resident and business-owner resistance. It should be noted that “perceived reversibility” was not measured via a dedicated survey item; rather, it is inferred from two complementary sources of evidence—the objective, time-limited design of the FIAVL intervention itself, and the systematic gap between respondents’ high Satisfaction Index scores and their more moderate Acceptance Index scores across all user groups (
Table 5). This satisfaction–acceptance divergence suggests that respondents distinguish between the current, bounded experience and the prospect of permanent change, consistent with a perception that the status quo remains recoverable. The recommendation to adopt phased implementation is therefore grounded not in the mere existence of the FIAVL intervention, but in these observed attitudinal mechanisms—particularly the conditional nature of acceptance and the strong preference for event-based or weekend-only pedestrianization (57.9% of respondents combined). Future studies should include a direct survey item on perceived reversibility to allow for more precise testing of this mechanism.
From a practical standpoint, the findings suggest four concrete actions for municipal authorities in Loja and comparable intermediate cities. First, accessibility management should be treated as non-negotiable: any pedestrianization scheme must include clearly defined, time-limited vehicle access windows for residents and loading/unloading operations, communicated in advance to all affected parties. Second, parking provision or compensation—such as nearby parking facilities or improved last-mile connections from peripheral lots—is essential to reduce resistance among car-dependent users, who represent the majority of this sample. Third, vendor regulation frameworks should be established prior to implementation, as uncontrolled street vending was the fourth most cited disadvantage; clear licensing and spatial allocation systems can mitigate this concern while preserving commercial dynamism. Fourth, implementation strategies should initially prioritize high-activity periods such as cultural festivals or weekends, allowing municipalities to test operational arrangements and progressively adjust the scope of pedestrianization based on observed outcomes.
This research contributes to the growing body of literature on sustainable urban mobility in Latin America by providing empirical evidence from an intermediate city context and applying rigorous inferential methods to pedestrianization perception research. While the findings are not directly generalizable to all urban contexts, they offer relevant insights for cities with similar characteristics and underscore the importance of positioning citizen perception as a central dimension in evaluating pedestrianization outcomes. Future research should extend this line of inquiry through longitudinal studies, expanded resident samples, and comparative analyses across different Latin American cities to build a more robust evidence base for pedestrian-centered urban policy.