1. Introduction
Reproducibility is a central expectation of scientific work because it allows findings to be checked, errors to be identified and knowledge to be built cumulatively. However, repeated surveys and community discussions show that researchers often struggle to reproduce published results, even when working in familiar domains [
1,
2]. In computational research, the challenge is intensified because reproducibility depends not only on the narrative description of a method, but also on executable artefacts: datasets, source code, configuration files, software dependencies, runtime parameters, hardware assumptions and workflow instructions [
3,
4].
The growth of artificial intelligence and machine learning makes this problem more urgent. Model behaviour may change when random seeds, library versions, preprocessing choices, hardware, hyperparameters or data splits vary [
4,
5]. This means that a paper can be well written and still be difficult to reproduce if its computational evidence chain is incomplete. Interdisciplinary computational research adds a further challenge because concepts, metadata conventions and software practices differ across communities. A term that is clear in one field may be ambiguous or absent in another.
The FAIR Guiding Principles provide a widely adopted basis for improving the findability, accessibility, interoperability and reusability of research outputs [
6]. Nevertheless, FAIR is a high-level set of principles rather than an executable verification system. FAIR can improve the conditions for reuse, but it does not automatically determine whether a workflow can be re-run, whether a result matches a reference output, or why a Reproducibility Score has been assigned. Existing tools such as Git, Docker, Jupyter notebooks, ReproZip, RO-Crate and Whole Tale each support parts of the reproducibility pipeline, but they do not provide a single evidence-linked and explainable view across papers, claims, artefacts and verification outcomes [
7,
8,
9,
10].
Contribution Boundary and Positioning
This paper clarifies the contribution of eFAIR-X. It is not presented as a new universal replacement for FAIR. Instead, it is positioned as an implementation-oriented extension and assessment architecture for computational reproducibility. It contributes in the space between FAIR principle extensions, FAIR assessment frameworks and operational workflow verification. This boundary is important because the recent literature has developed in at least two related directions. The first direction extends FAIR itself, for example through FAIR4RS for research software and FAIR 2.0 for semantic interoperability [
11,
12]. The second direction focuses on practical FAIR assessment and FAIRification workflows, including FAIR assessment of research data objects and flexible FAIRification frameworks [
13,
14]. eFAIR-Xcomplements these strands by adding claim-level verification, explainable scoring and a dashboard that links each score to concrete evidence (
Supplementary Materials).
The paper makes five contributions:
- 1.
It defines eFAIR-Xas a verification-centred FAIR extension for computational research artefacts, with explicit scope and limitations.
- 2.
It specifies a semantic research knowledge graph that links natural-language claims to structured claims, artefacts, workflows, environments, outputs and verification reports.
- 3.
It provides an explainable Dashboard for Reproducibility with local and global explanations, evidence drill-down, human contestability and provisional metrics that are bounded and calibratable.
- 4.
It reports a simple browser-based proof-of-concept prototype that demonstrates JSON-based ingestion, dashboard scoring, knowledge-graph visualisation, evidence inspection and claim-evidence mapping.
- 5.
It proposes a validation protocol based on benchmark experiments, expert agreement analysis, case-based evaluation, correlation analysis and sensitivity testing.
The remainder of the article is organised as follows.
Section 2 reviews FAIR extensions, FAIR assessment, reproducibility tooling and scholarly knowledge graphs.
Section 3 introduces the eFAIR-X framework and its architecture.
Section 4 specifies the semantic knowledge graph.
Section 5 explains the AI and explainability mechanisms.
Section 6 defines the dashboard metrics and calibration requirements.
Section 8 reports the proof-of-concept prototype.
Section 9 presents the validation plan.
Section 10 describes the dashboard user views.
Section 11 and
Section 12 discuss limitations, governance and future work.
2. Related Work and Framework Positioning
2.1. FAIR Principles and FAIR Extensions
FAIR provides a high-level and widely adopted set of principles for making research objects more findable, accessible, interoperable and reusable [
6]. The principles are deliberately general, which is a strength that supports their broad adoption, but this also means that they require implementation choices before they can support operational reproducibility. FAIR4RS extends FAIR thinking to research software, recognising that software requires different treatment from static datasets because it evolves through versions, dependencies, releases and execution environments [
11]. FAIR 2.0 further addresses semantic interoperability, including the need for clearer mappings between terms, schemas and logical statements [
12]. These developments are directly relevant to eFAIR-X because reproducibility depends on both executable artefacts and the semantic meaning of computational claims.
2.2. FAIR Assessment and FAIRification Implementation
A separate but related strand of work focuses on assessing or improving FAIRness in practice. FAIR assessment approaches define metrics, maturity indicators and tests for research data objects [
13]. FAIRification frameworks provide practical guidance for improving existing or planned datasets, including goal definition, review, iterative improvement and post-FAIRification assessment [
14]. These studies are implementation-oriented but generally do not attempt to verify whether the published computational workflow can be re-executed or whether outputs match declared results. eFAIR-X therefore builds on FAIR assessment but narrows its focus to computational reproducibility evidence.
2.3. Workflow-Centred Reproducibility Tooling
Version control, computational notebooks, containers, workflow engines, ReproZip, RO-Crate and Whole Tale provide important components for reproducible research [
7,
8,
9,
10,
15,
16]. These tools improve transparency and portability, but they often operate in isolation. A repository may contain code but no data access statement; a container may preserve dependencies but not workflow commands; a notebook may run interactively but not provide stable output agreement rules. eFAIR-X treats these tools as evidence sources rather than competitors. Its aim is to connect them into a common representation and expose the evidence through a dashboard.
2.4. Scholarly Knowledge Graphs and Discovery
Scholarly knowledge graphs can link papers, datasets, authors, organisations, software, concepts and citations. They are useful for discovery and research assessment, but they face challenges around incomplete metadata, entity disambiguation, curation and domain bias [
17,
18]. Citation networks and science-mapping methods can also identify clusters of related work [
19,
20,
21,
22,
23]. The distinctive feature of eFAIR-X is that its knowledge graph is verification-centred. It is not just a discovery graph. It represents claims, artefacts, workflow dependencies, execution environments, outputs and verification reports so that a reviewer can traverse from a scientific statement to the evidence required to reproduce it.
Table 1 provides a detailed overview of eFAIR-X compared to FAIR extensions.
2.5. Comparative Positioning
This section presents a positioning matrix that does not treat FAIR as a tool that should be directly outperformed. Instead, it compares each framework by its primary purpose, artefact scope, operational verification, semantic support and explainability.
3. Proposed eFAIR-X Framework
eFAIR-X is designed as a layered architecture that connects existing research infrastructure rather than replacing it. Its role is to make computational reproducibility more measurable, inspectable and actionable.
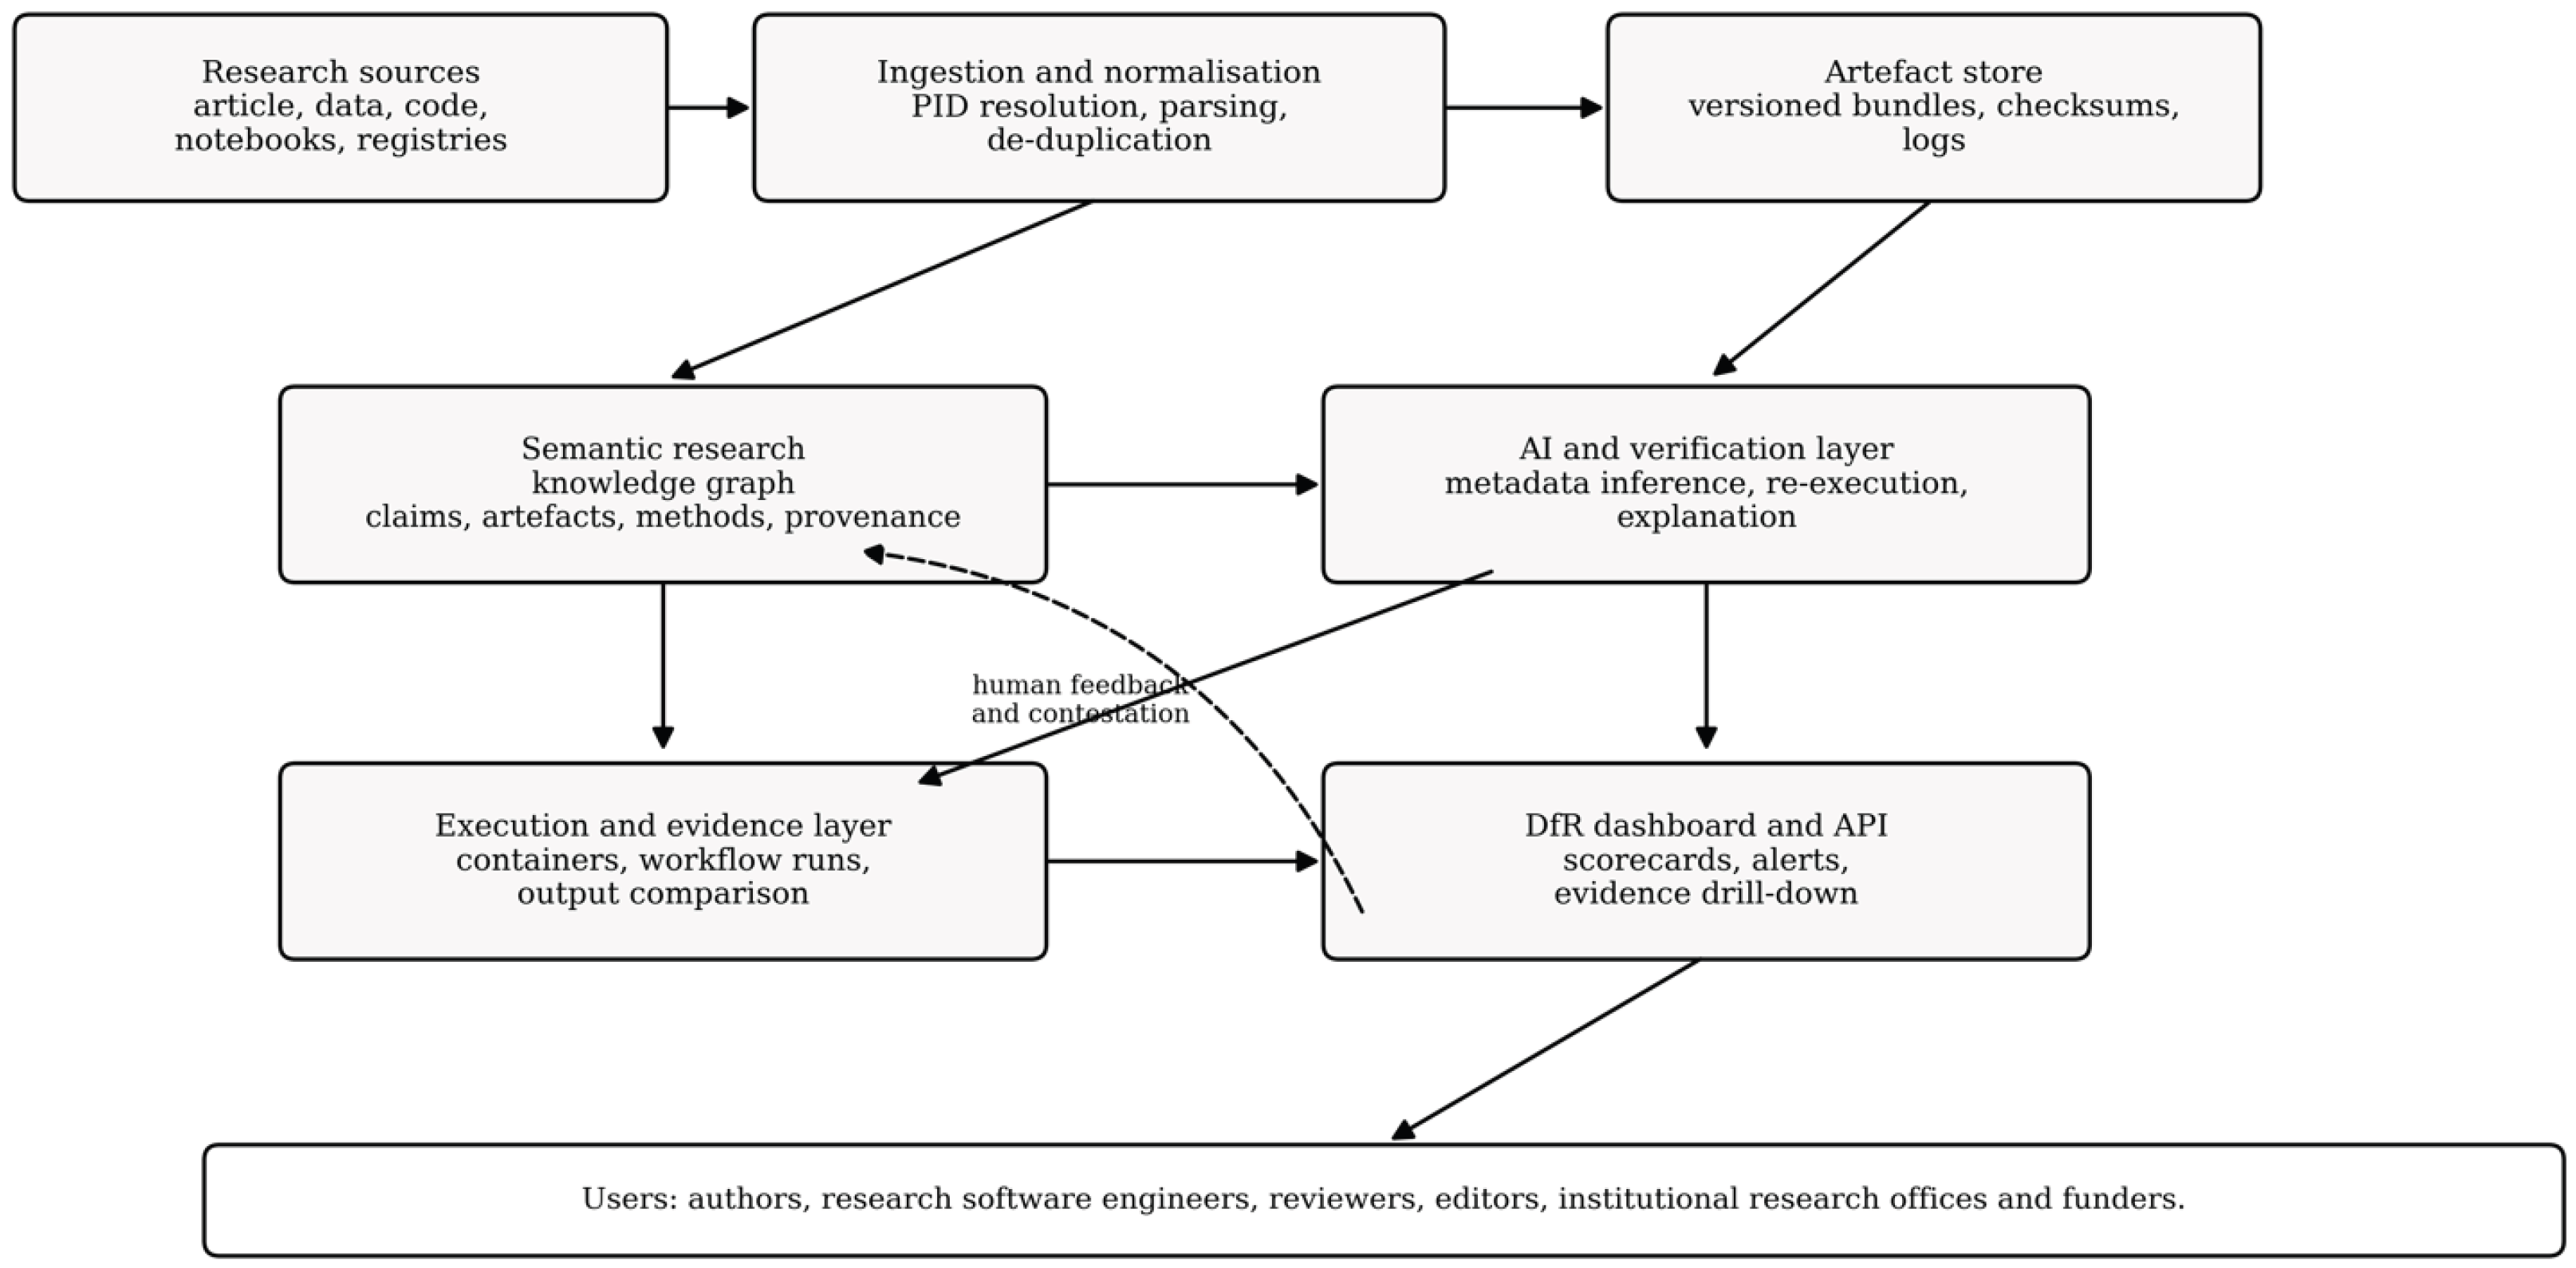
Figure 1 summarises the architecture.
The framework follows six design principles:
- 1.
Artefact-first representation: a research output is treated as a linked bundle of paper, data, code, workflow, environment and verification evidence rather than as a single document.
- 2.
Claim-level traceability: computational claims must be linked to the evidence needed to check them.
- 3.
Operational verification: where possible, workflows are re-run in controlled environments and compared with reference outputs.
- 4.
Explainability by design: every score must be decomposed into inspectable components and linked to evidence.
- 5.
Graded reproducibility: partial reproducibility is allowed when data are restricted or re-execution is costly, but the reason for partial evidence must be explicit.
- 6.
Human governance: scores support review and decision-making but do not replace expert judgement.
3.1. Minimum Artefact Set
For computational research, eFAIR-X expects a minimum artefact set containing the article; raw and processed datasets or access conditions; source code; configuration files; dependency declarations; workflow steps; environment descriptions such as containers or lockfiles; expected outputs; and verification reports. The framework does not assume that all artefacts will be public. Restricted data can be represented through controlled access metadata, synthetic test cases, summary statistics, secure-run evidence or third-party audit reports.
3.2. Verification Bundle
The verification bundle is the operational unit used by eFAIR-X. It contains the artefacts and rules required to attempt reproduction. A bundle should include:
Identifiers and versions for all relevant artefacts;
Workflow commands or executable workflow descriptions;
Container recipes, lockfiles or other environment definitions;
Input artefacts or access pathways;
Reference outputs, hashes, metrics or expected statistical ranges;
A comparison policy defining tolerances and stochastic handling;
A machine-readable verification report.
This bundle-based design makes the scoring framework easier to audit. It also clarifies whether a low score reflects missing artefacts, restricted access, failed execution, output mismatch or insufficient metadata.
4. Semantic Research Knowledge Graph
The knowledge graph is the central index for eFAIR-X. It links entities that are usually scattered across publications, repositories, data archives and workflow environments. The graph is clarified and specified with explicit node types, edge types and metadata attributes.
4.1. Node Types and Metadata Attributes
The graph contains the following node classes:
Paper: DOI, title, authors, publication venue, version and licence.
Claim: natural-language statement, formalised statement, claim type, uncertainty and linked contribution.
Dataset: persistent identifier, access status, licence, version, schema and sensitivity level.
Code: repository URL, commit hash, release tag, licence and dependency manifest.
Workflow: step sequence, inputs, outputs, parameters and execution command.
Environment: container recipe, lockfile, operating system, hardware notes and random seed policy.
Result: metric type, value, confidence interval, output file and tolerance rule.
Verification report: run status, logs, hashes, errors, reviewer notes and date of verification.
4.2. Edge Types and Semantic Relationships
Edges express meaningful relationships rather than generic links. Core edge types include asserts, usesInput, implementedBy, runsWith, produces, derivedFrom, comparesWith, verifies, cites, isVersionOf and requiresAccessCondition. These relationships support traversal from a paper to a claim, from the claim to its method and result, and from the result to the workflow evidence needed to test it.
4.3. Natural-Language Statements and Formalised Claims
To support interdisciplinary interpretation, eFAIR-X separates a natural-language claim from its formal representation. For example, a sentence such as “using Method M on Dataset D improves F1 to 0.91” is represented as a claim node with semantic roles: Method = M, Object = Dataset D, Action = improves, Result = F1 score, Value = 0.91 and Evidence = verification report V1. This is not intended to fully solve natural-language understanding. Rather, it provides a practical bridge between human-readable claims and machine-actionable verification.
4.4. Difference from General Scholarly Knowledge Graphs
Many scholarly knowledge graphs focus on discovery, citation analysis, author disambiguation or research assessment [
18]. eFAIR-X differs because it is organised around verification. Its graph asks the following questions:
What claim was made? Which artefacts support it? Can the workflow be run? Does the output match the reference within an agreed policy? What evidence explains the score? This verification-centred design is the main novelty of the graph component.
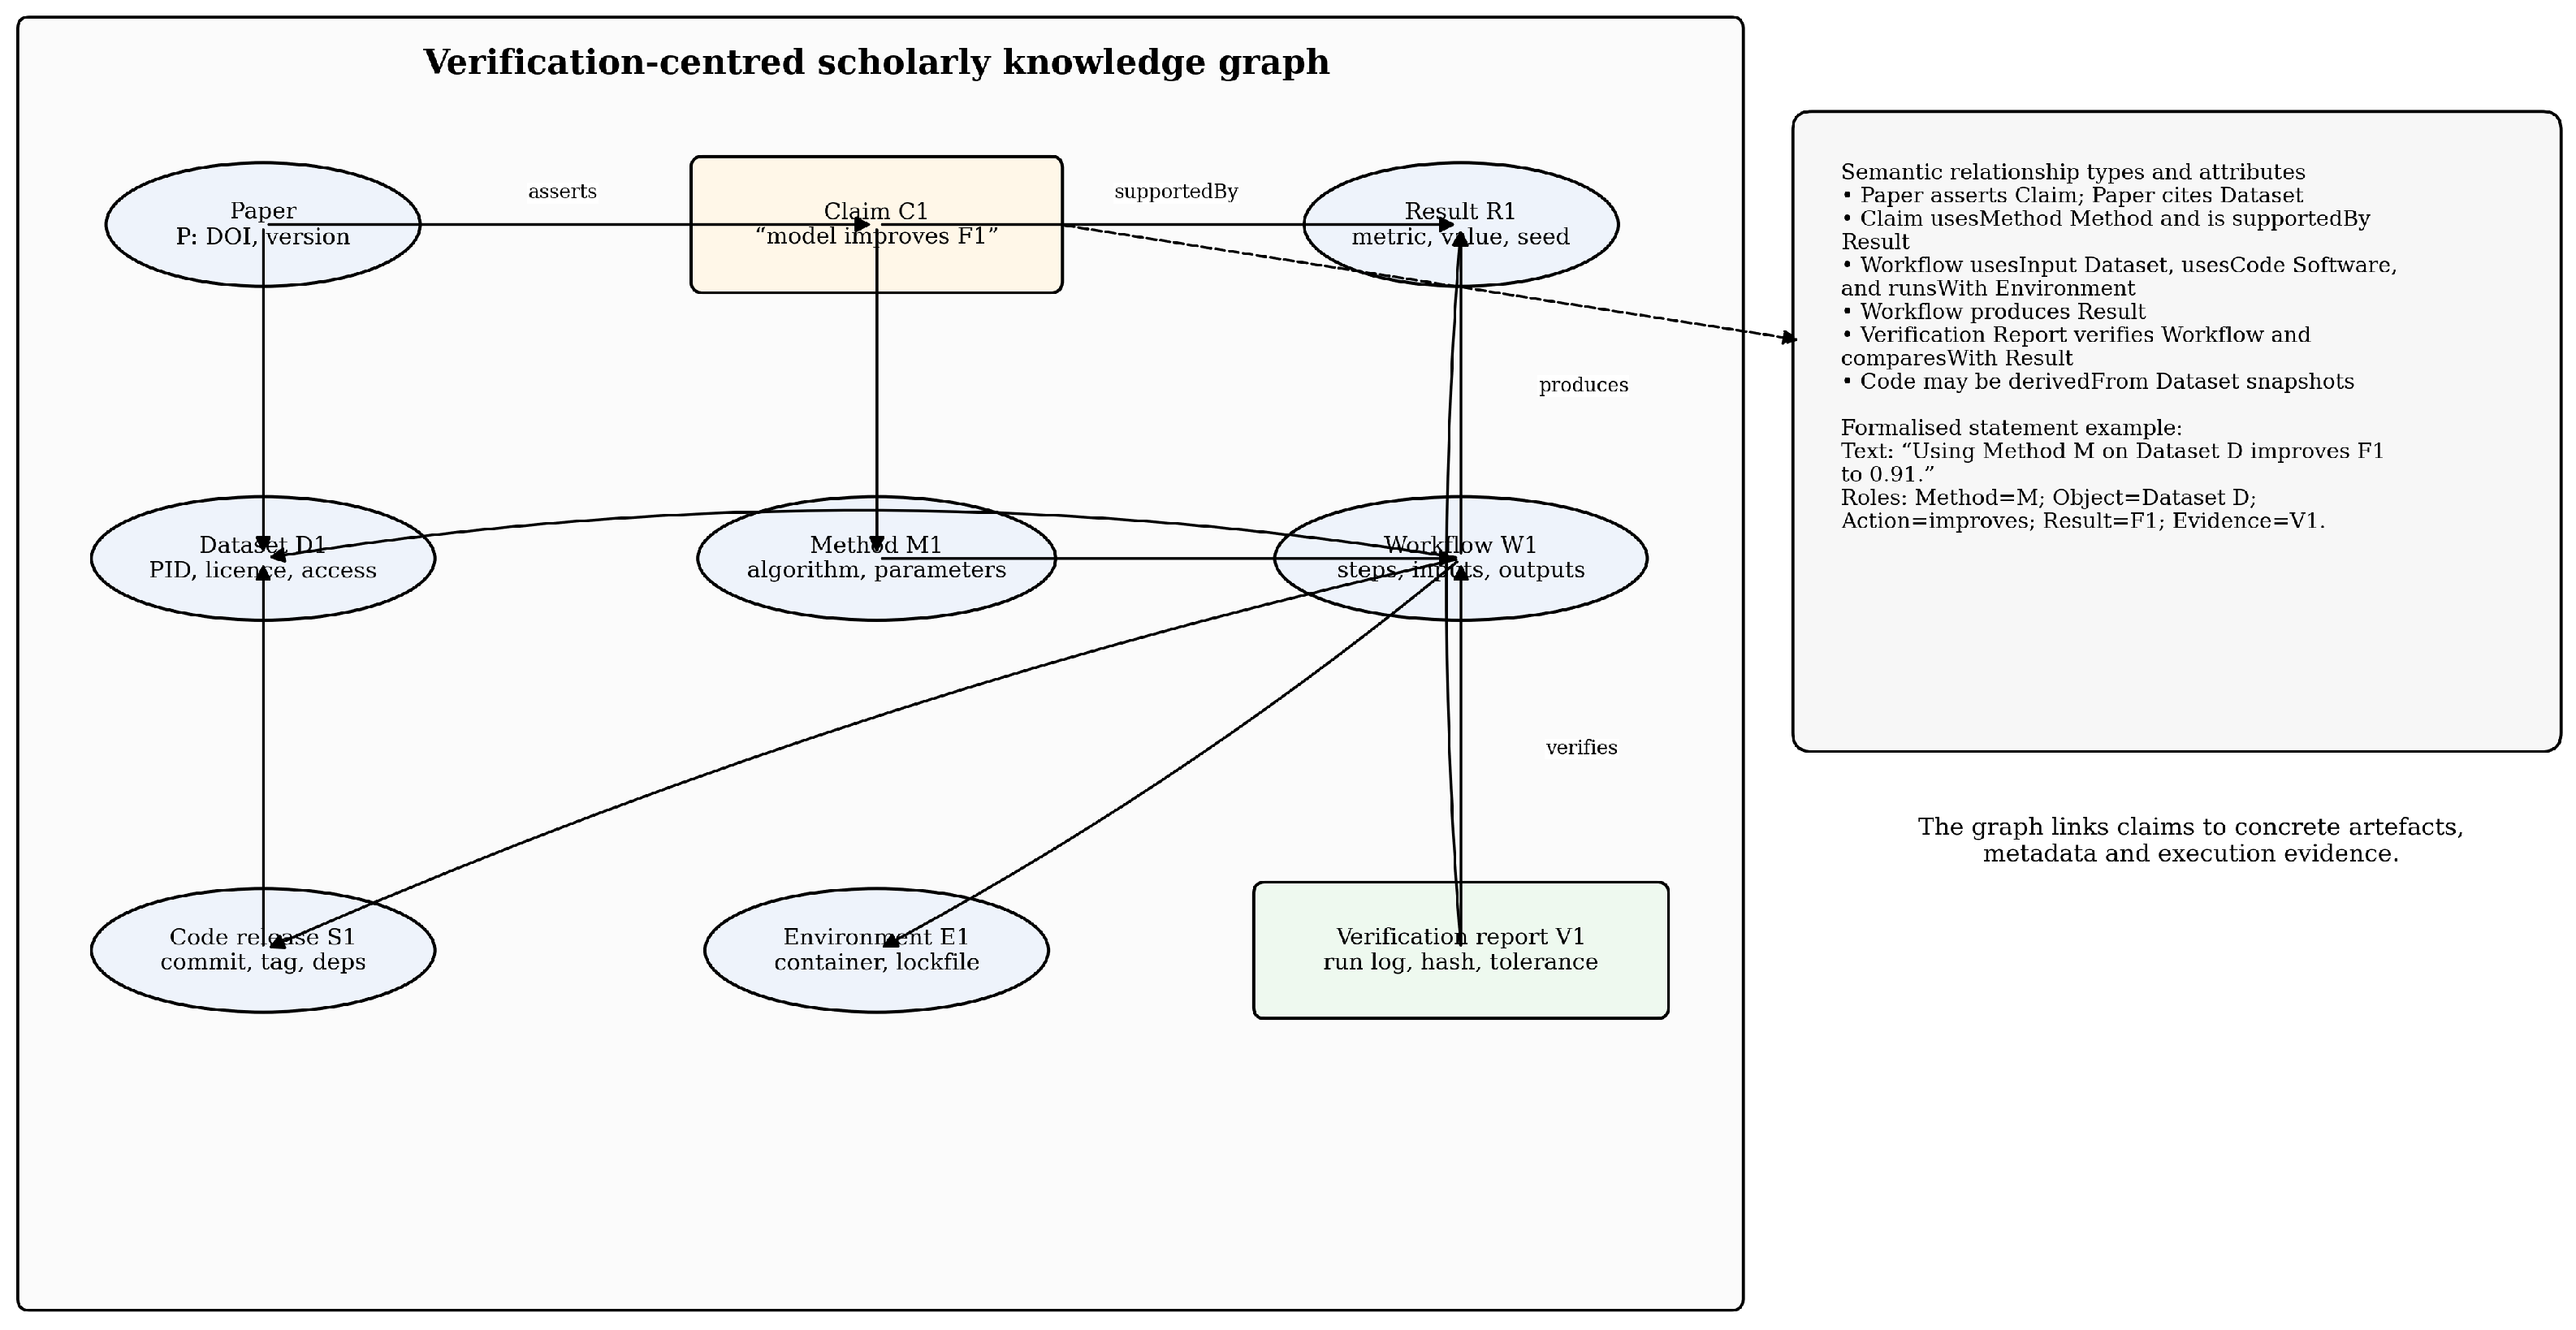
Figure 2 depicts the concept-based research knowledge graph for eFAIR-X.
5. AI Components and Explainability by Design
The AI components in eFAIR-X are decision-support mechanisms. They do not make final editorial or institutional decisions. Their purpose is to help identify missing metadata, link artefacts, prioritise verification tasks and explain dashboard scores.
5.1. AI-Supported Metadata Inference
The metadata inference component suggests missing fields such as licences, software versions, parameter declarations, dataset access conditions and workflow commands. The output is marked as inferred until it has been confirmed by a human user. This distinction is important because inferred metadata may be wrong, incomplete or context-dependent.
5.2. Verification Adaptation
The verification component attempts to rebuild environments and run workflows. For deterministic outputs, exact hashes may be used. For stochastic or numerically sensitive workflows, the system applies repeated runs, seed policies, tolerance thresholds, rank correlation or distributional comparison. The comparison policy is stored with the verification bundle so that the judgement can be inspected and repeated.
5.3. Local and Global Explainability
The model distinguishes between local and global explainability:
Local explainability explains a score for one paper, one claim or one workflow. For example, a paper may receive a lower Reproducibility Score because the code is available but the dataset licence is missing and the workflow cannot run end-to-end.
Global explainability explains patterns across a collection. For example, the dashboard may show that missing dependency manifests are the strongest contributor to failed re-execution in a subject cluster.
This approach follows the broader explainable AI principle that explanations must be meaningful for the user and aligned with the decision context [
24,
25,
26].
5.4. Transparency, Interpretability and Contestability
eFAIR-X operationalises explainability through five mechanisms:
- 1.
Score decomposition:every score is broken into sub-scores and evidence checks.
- 2.
Evidence links: every sub-score links to logs, files, metadata records or human review notes.
- 3.
Reasoning trace: the dashboard records which entities and checks contributed to the score.
- 4.
Uncertainty labels: inferred, partial, restricted and failed evidence states are shown separately.
- 5.
Human contestation: authors and reviewers can challenge, correct or annotate system outputs.
Recent work on responsible AI deployment, trustworthy federated systems and domain-specific explainable AI also supports the need for modular evaluation, governance, transparency and evidence-linked explanation, although these examples are treated as contextual rather than core reproducibility frameworks [
27,
28,
29].
6. Dashboard Metrics, Calibration and Validation Requirements
The Dashboard for Reproducibility reports interpretable indicators derived from the knowledge graph, artefact store and verification reports. The metrics are presented as provisional operational indicators. They are not claimed to be validated measures of true reproducibility until calibrated and tested. This distinction addresses the risk that heuristic equations may appear more authoritative than the evidence supports.
6.1. Metric Design Principles
The metric design follows five rules:
Scores must be bounded in the interval or mapped to a clearly defined ordinal scale.
Each score must have an evidence source and a documented uncertainty state.
Weights must be transparent, justified and calibrated for a specified use context.
Aggregated scores must preserve drill-down access to sub-scores and evidence.
Scores must be evaluated against expert judgement, benchmark cases and sensitivity tests before operational use.
6.2. Reproducibility Score
The Reproducibility Score (RS) combines core reproducibility dimensions:
where
A is artefact availability,
E is environment fidelity,
W is workflow executability and
O is output agreement. The coefficients
a,
e,
w and
o are non-negative weights. Equal weights may be used only as a transparent starting point. For applied use, the weights must be calibrated with expert ratings and tested through sensitivity analysis.
Table 2 provides an overview of the main features of reproducibility metrics.
6.3. Output Agreement
Output agreement is calculated according to a domain-appropriate comparison policy:
where
is the chosen distance function,
is the reference output,
is the reproduced output and
is the accepted tolerance threshold. The tolerance must be declared prior to evaluation. For deterministic workflows,
may be an exact mismatch or hash difference. For stochastic models, it may be a relative error, distributional distance or rank-based comparison.
6.4. Metadata Completeness
Metadata completeness (
) measures the presence and validity of required metadata fields:
where
is a binary or graded score for metadata field
i and
is the priority weight of that field. This design allows journals, institutions or disciplines to define their own required profiles while retaining transparent scoring.
6.5. Contribution-Evidence Coverage
Contribution-evidence coverage (
) estimates the share of claimed contributions that have mapped verification evidence:
where
C is the set of structured claims and
E is the set of claims supported by verification evidence. This metric is intentionally simple because its value depends mainly on the quality of claim annotation and evidence mapping.
6.6. Relevance Longevity and Originality Risk
Relevance longevity (
) is a time-aware indicator of ongoing reuse:
where
is the time-decayed citation influence,
is the time-decayed reuse evidence and
is the cross-domain knowledge-graph uptake. Originality risk (OR) is a human-review flag:
where
,
and
represent text, citation and concept-overlap signals.
must never be interpreted as a definitive plagiarism decision. It is a prioritisation signal for human review.
6.7. Overall Index and Calibration
For high-level reporting, the dashboard may calculate an overall eFAIR-X Index (
):
where all
weights are non-negative and sum to one. The index is optional and should not hide the component scores. A journal, funder or institution may choose not to use an aggregate index if component-level evidence is more appropriate.
7. Architecture and Implementation Considerations
7.1. Ingestion and Normalisation
The ingestion layer connects to article metadata, data repositories, code repositories, workflow files and container registries. It normalises identifiers, resolves versions and stores artefact metadata in a common internal model. Where an artefact is restricted, the system stores an access condition rather than falsely marking the artefact as absent.
7.2. Containerised Verification
Verification runs are executed in controlled compute backends using container recipes, lockfiles or equivalent environment definitions. The system records the execution date, runner configuration, dependency versions, input files, output files, errors and comparison results. Repeated runs are supported for stochastic workflows.
7.3. Evidence Storage and Auditability
Evidence records must be immutable after verification. If an author updates a workflow or metadata record, the dashboard creates a new evidence version rather than overwriting the previous one. This supports audit trails and reduces the risk of post hoc manipulation.
7.4. Governance and Access Control
eFAIR-X uses role-based access control. Authors may upload and correct artefacts; reviewers may inspect evidence and add comments; editors or institutional leads may view summary indicators; public users may only see permitted metadata and summary evidence. Sensitive data should be handled through controlled access, secure enclaves or trusted third-party verification.
8. Proof-of-Concept Web Prototype and Demonstration
A simple browser-based proof-of-concept prototype has been developed. The prototype is intentionally lightweight and transparent: it uses a static web interface, a JavaScript scoring script and structured JSON study files. It is not presented as a full production platform or as a completed empirical validation. Its purpose is to demonstrate that the proposed dashboard logic can be implemented, inspected and tested using reproducible inputs.
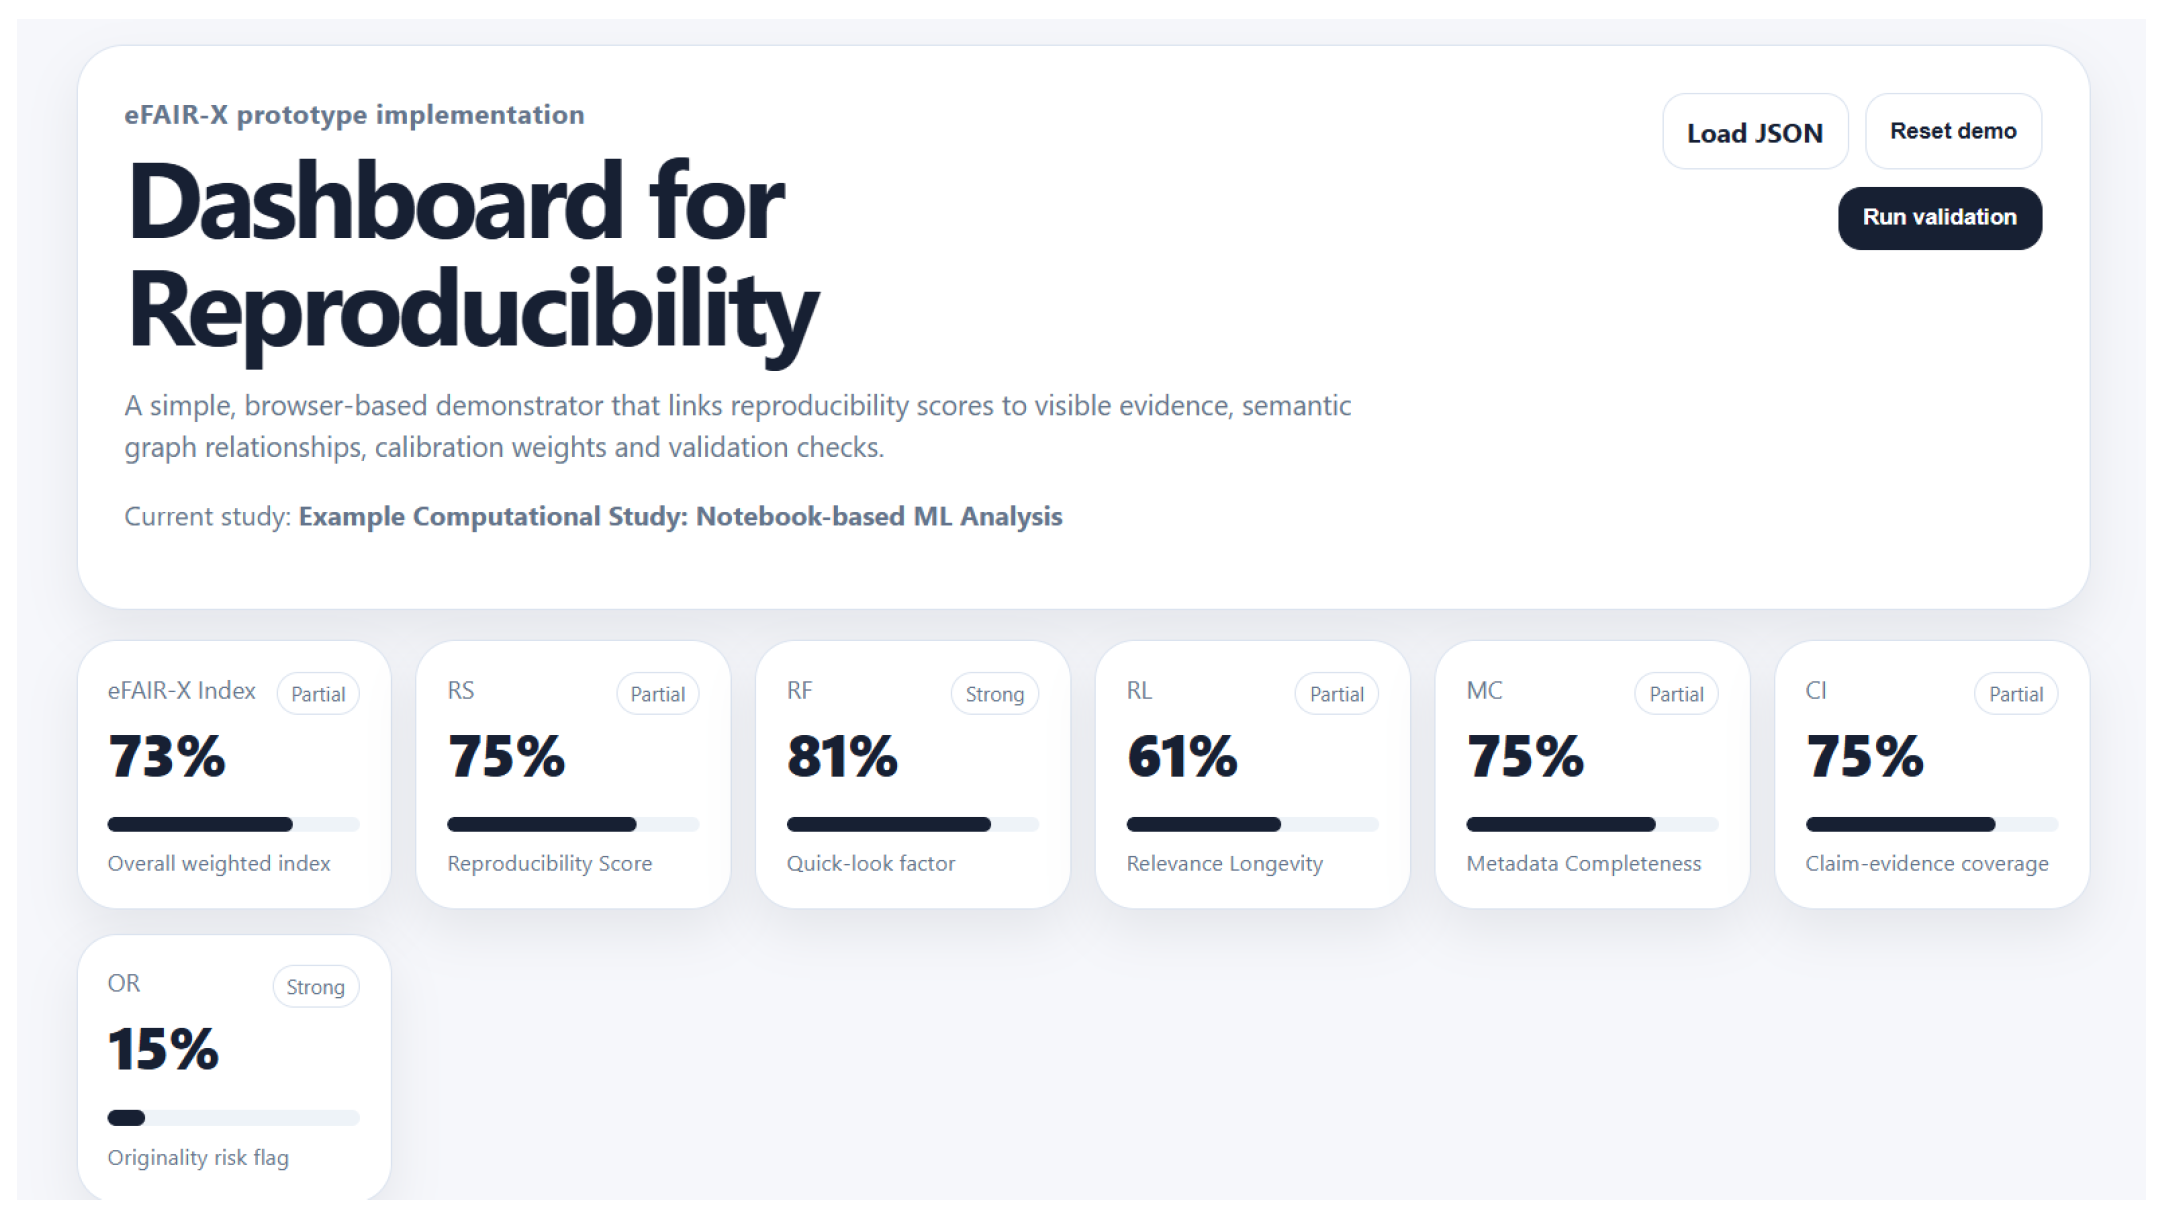
The prototype accepts a study-level JSON file containing identifiers, artefact records, environment checks, workflow run outcomes, output-comparison values, metadata fields, structured claims, originality-risk signals and knowledge-graph nodes/edges. It then calculates the main dashboard indicators, including Reproducibility Score (RS), Reproducibility Factor (RF), relevance longevity (RL), metadata completeness (MC), claim-evidence coverage (CI), originality risk (OR) and the optional overall eFAIR-X Index. The visible panels link each score to supporting evidence so that reviewers can see why a score is high, partial or weak.
Figure 3,
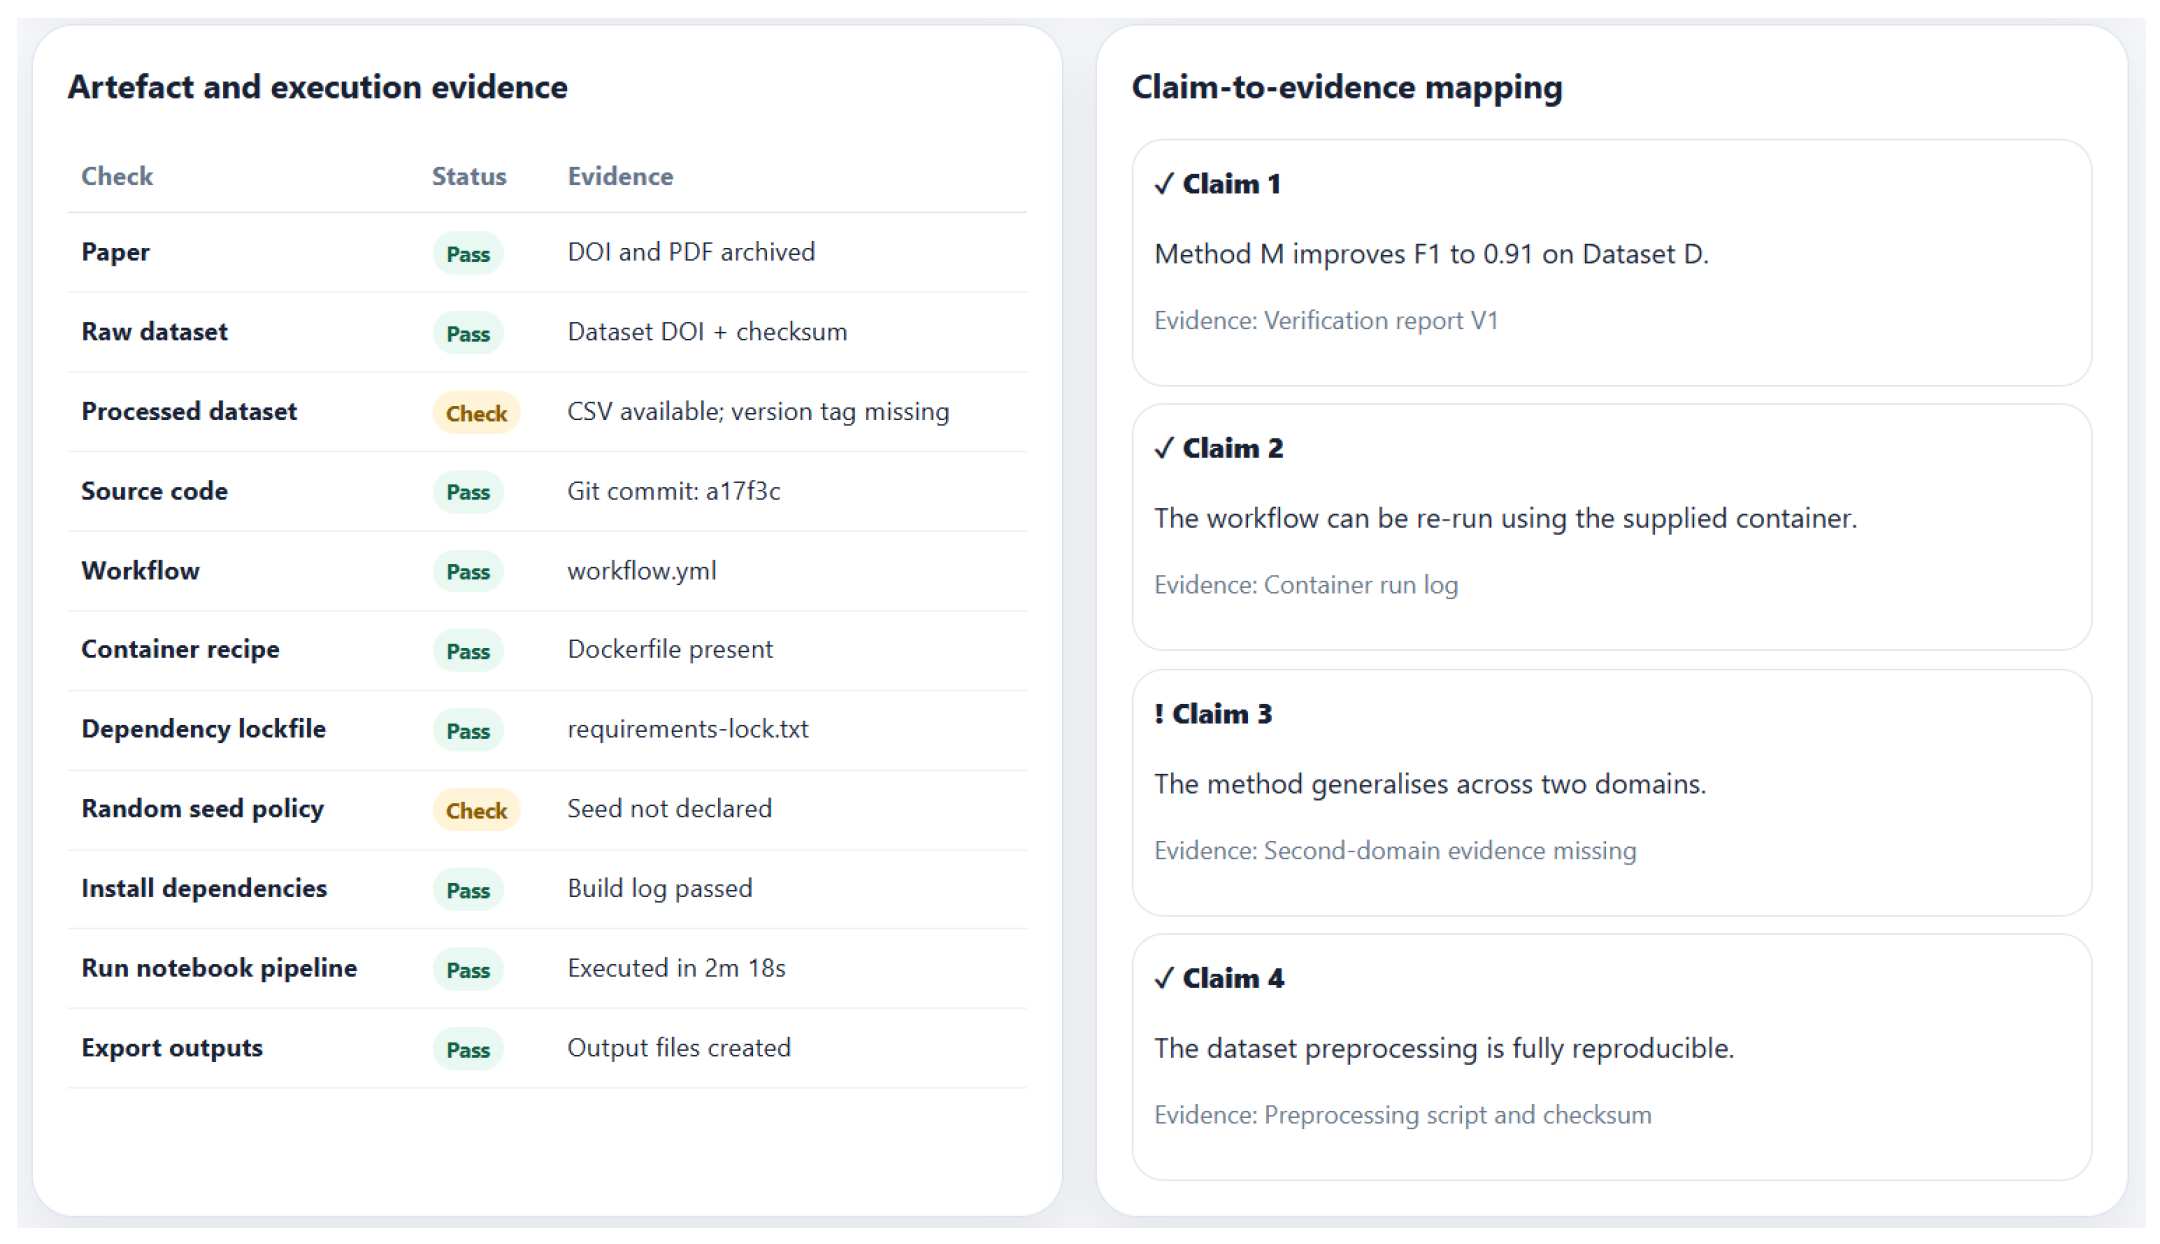
Figure 4,
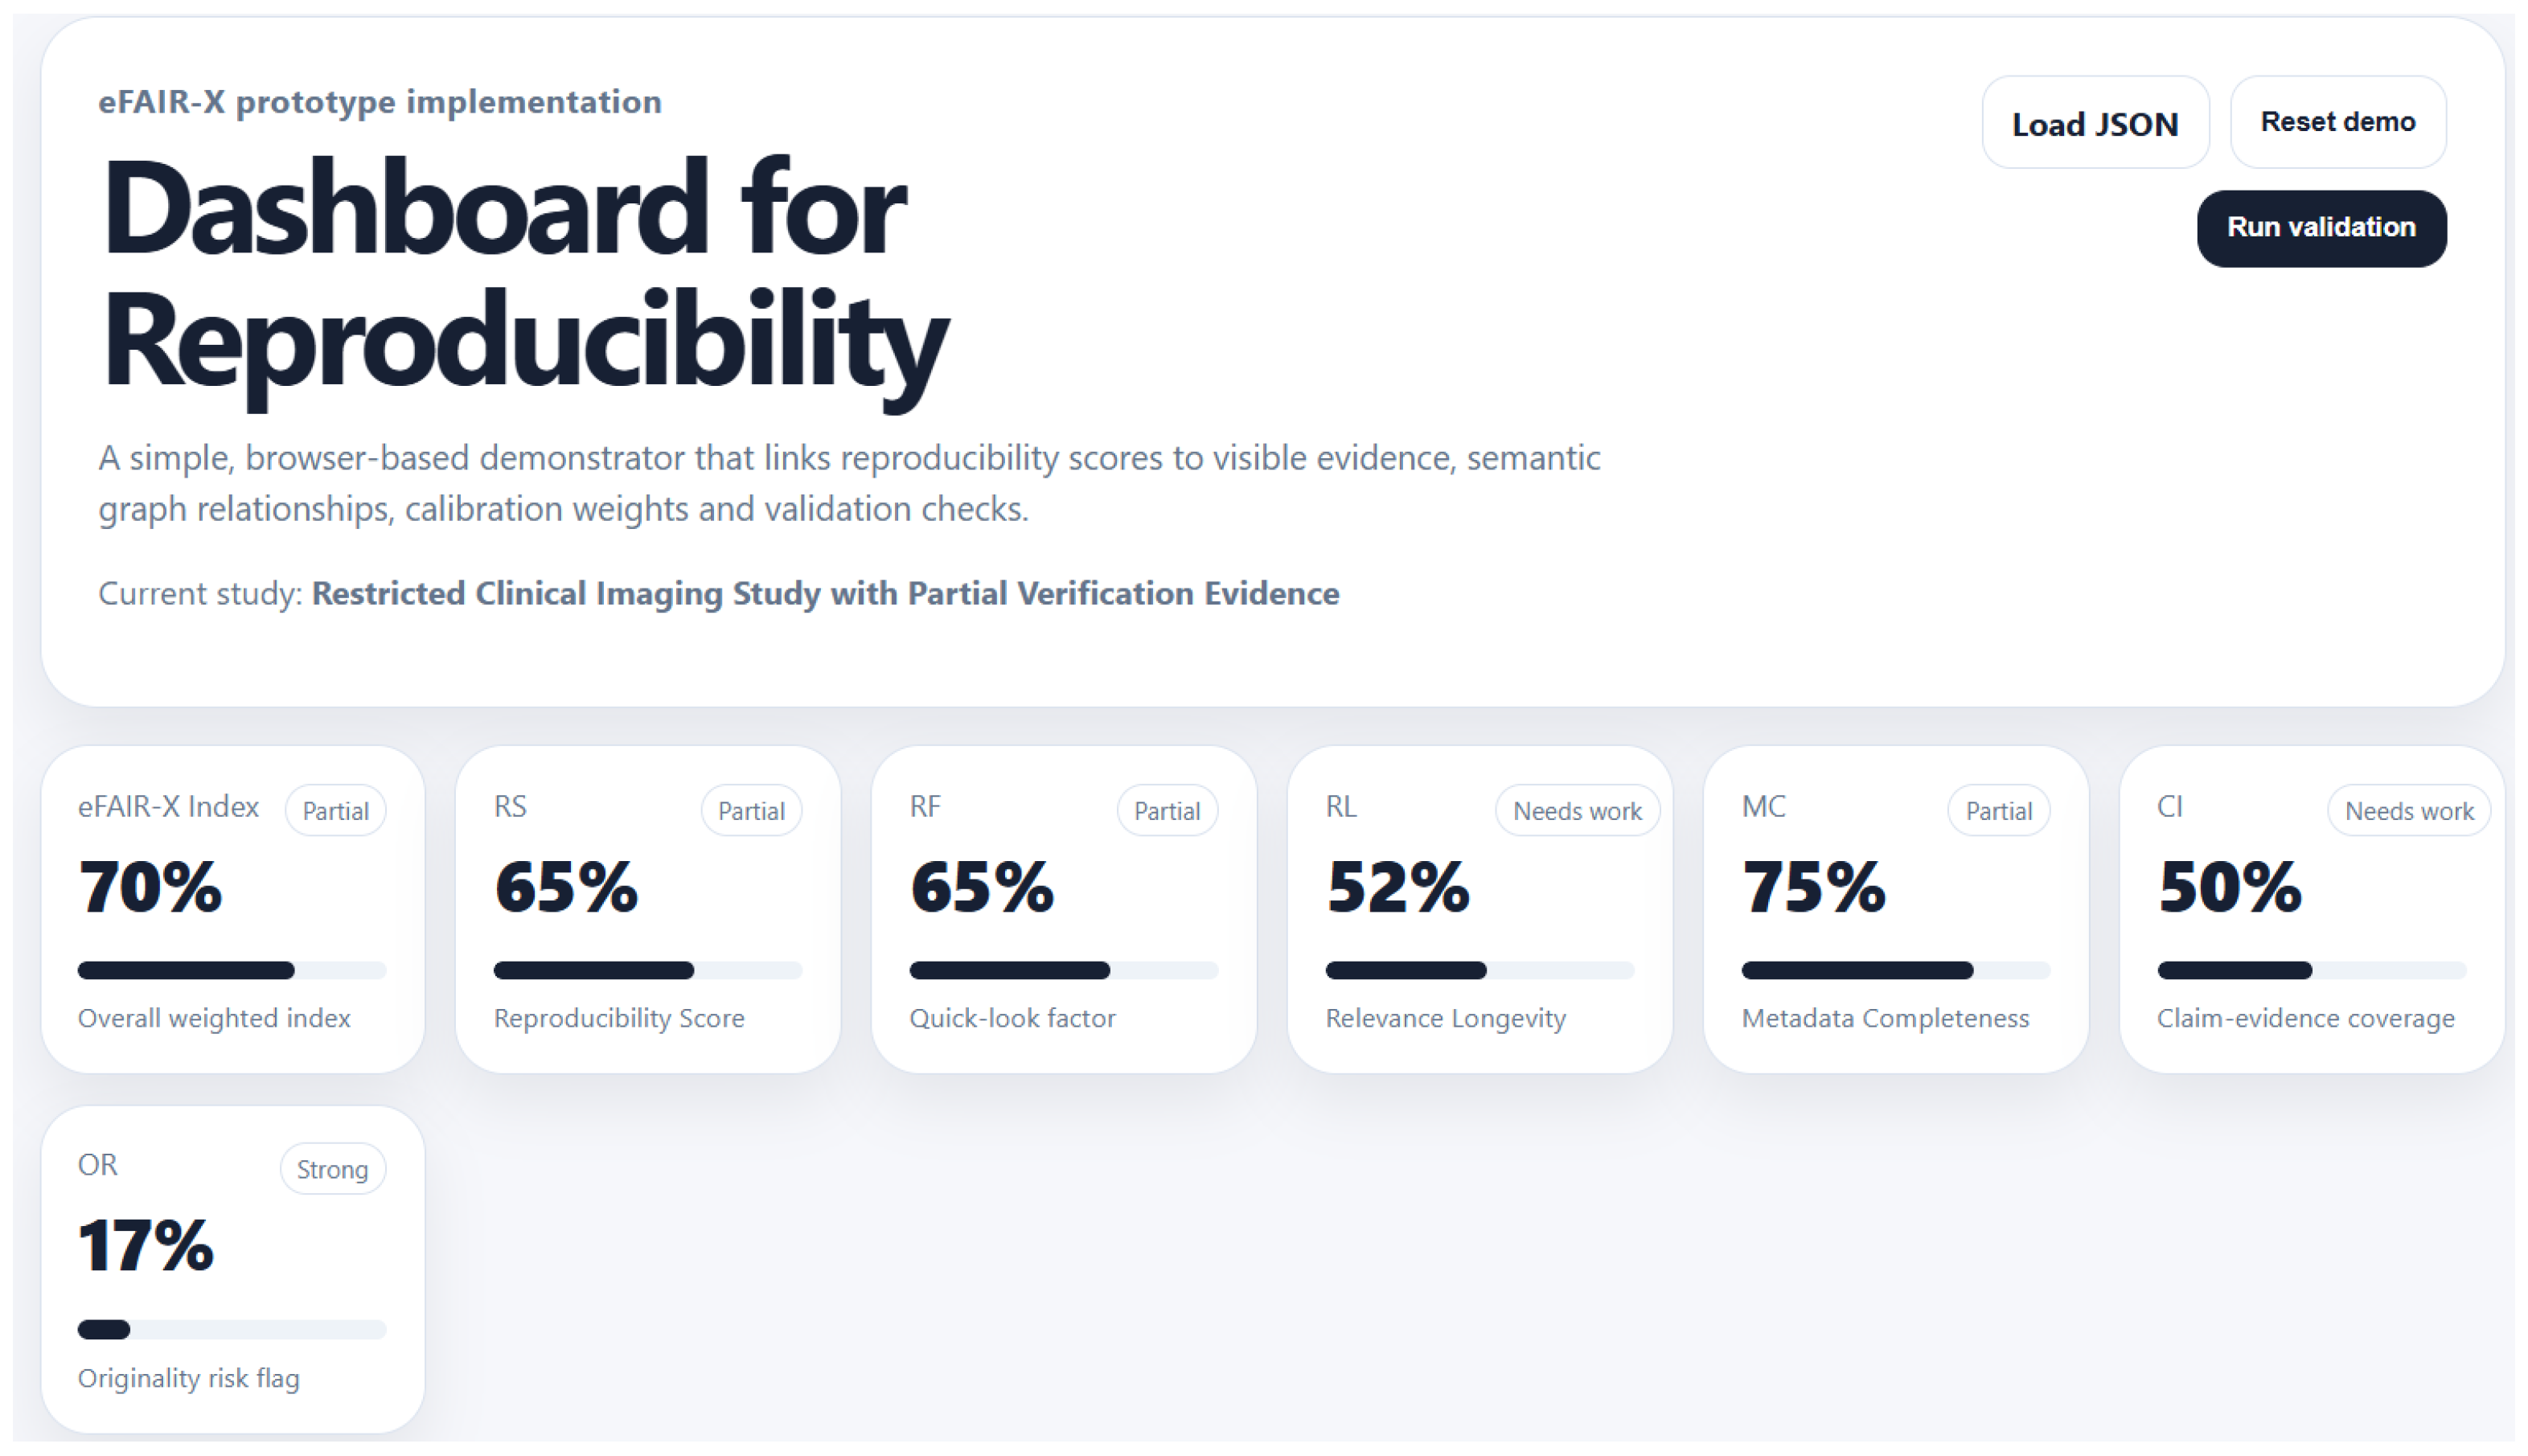
Figure 5,
Figure 6,
Figure 7,
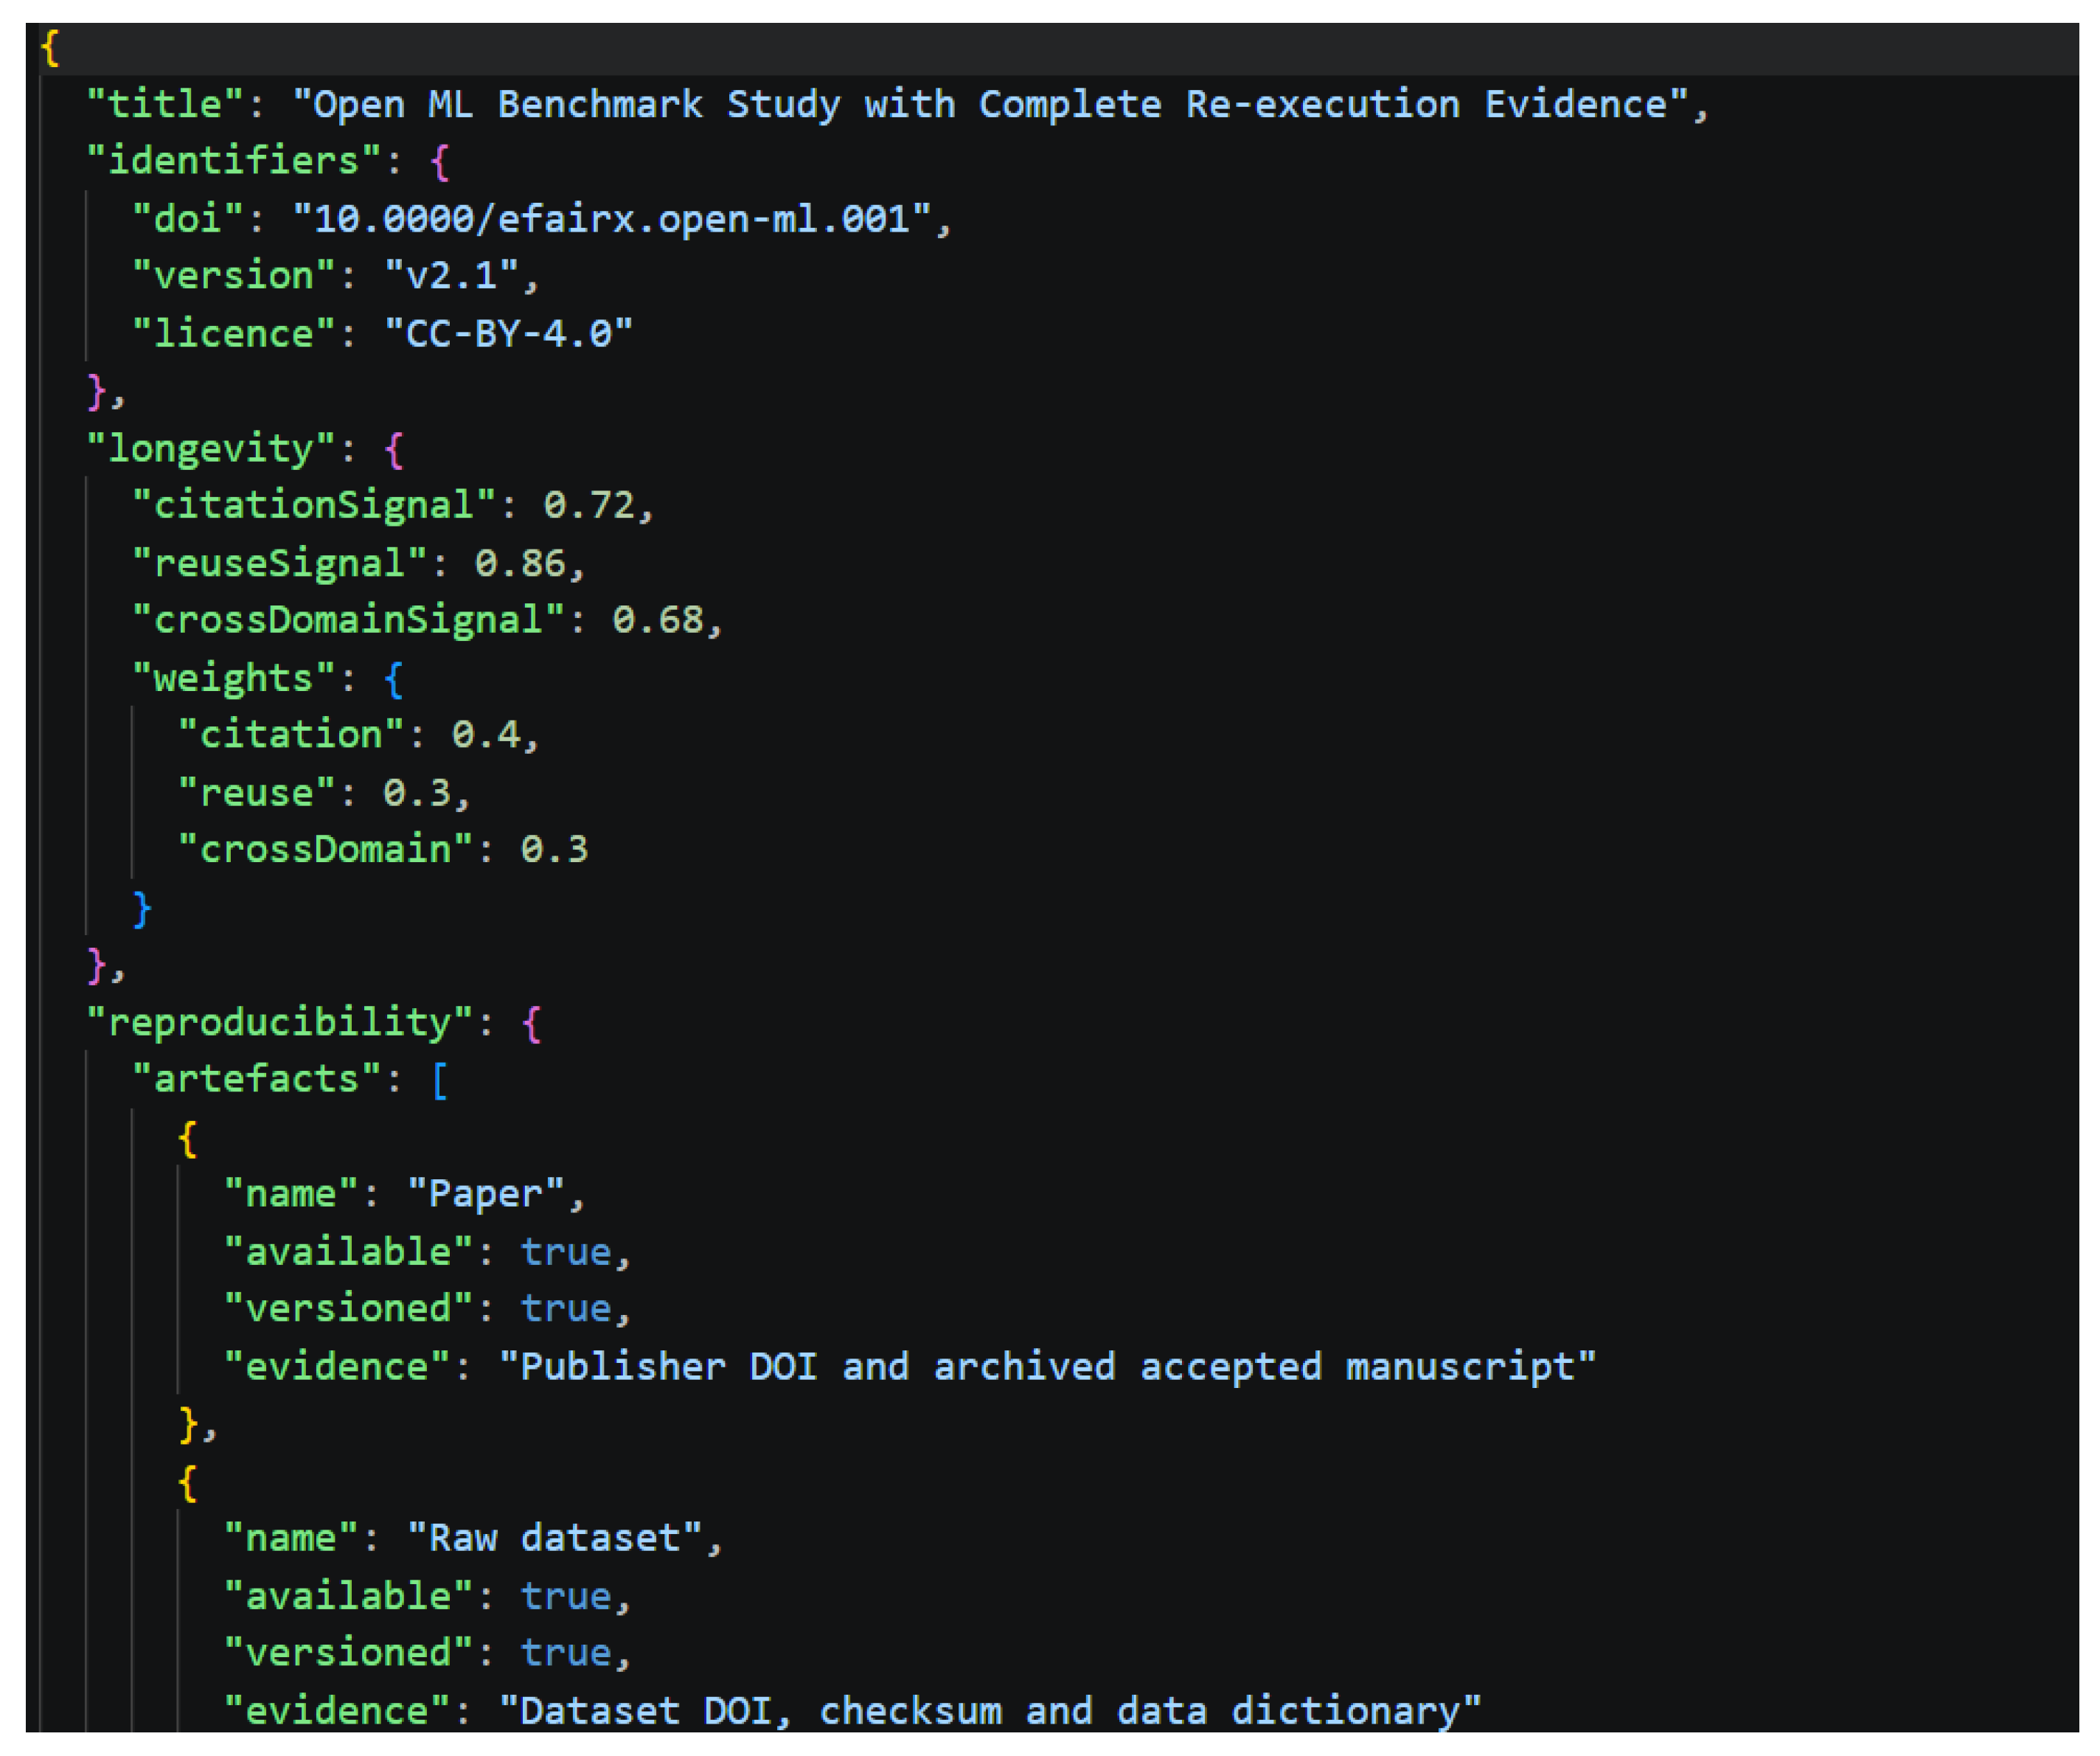
Figure 8 and
Figure 9 depict the main components and data outputs of the proof-of-concept dashboard, which was designed as part of this work.
A second demonstration case was used to test a more realistic partial-reproducibility scenario. This case includes restricted clinical data, partial workflow execution and claims that cannot be fully verified. The purpose is to demonstrate that the dashboard can represent partial evidence without falsely treating restricted artefacts as absent or fully reproducible.
Table 3 provides a summary of the capabilities of the prototype introduced in this work.
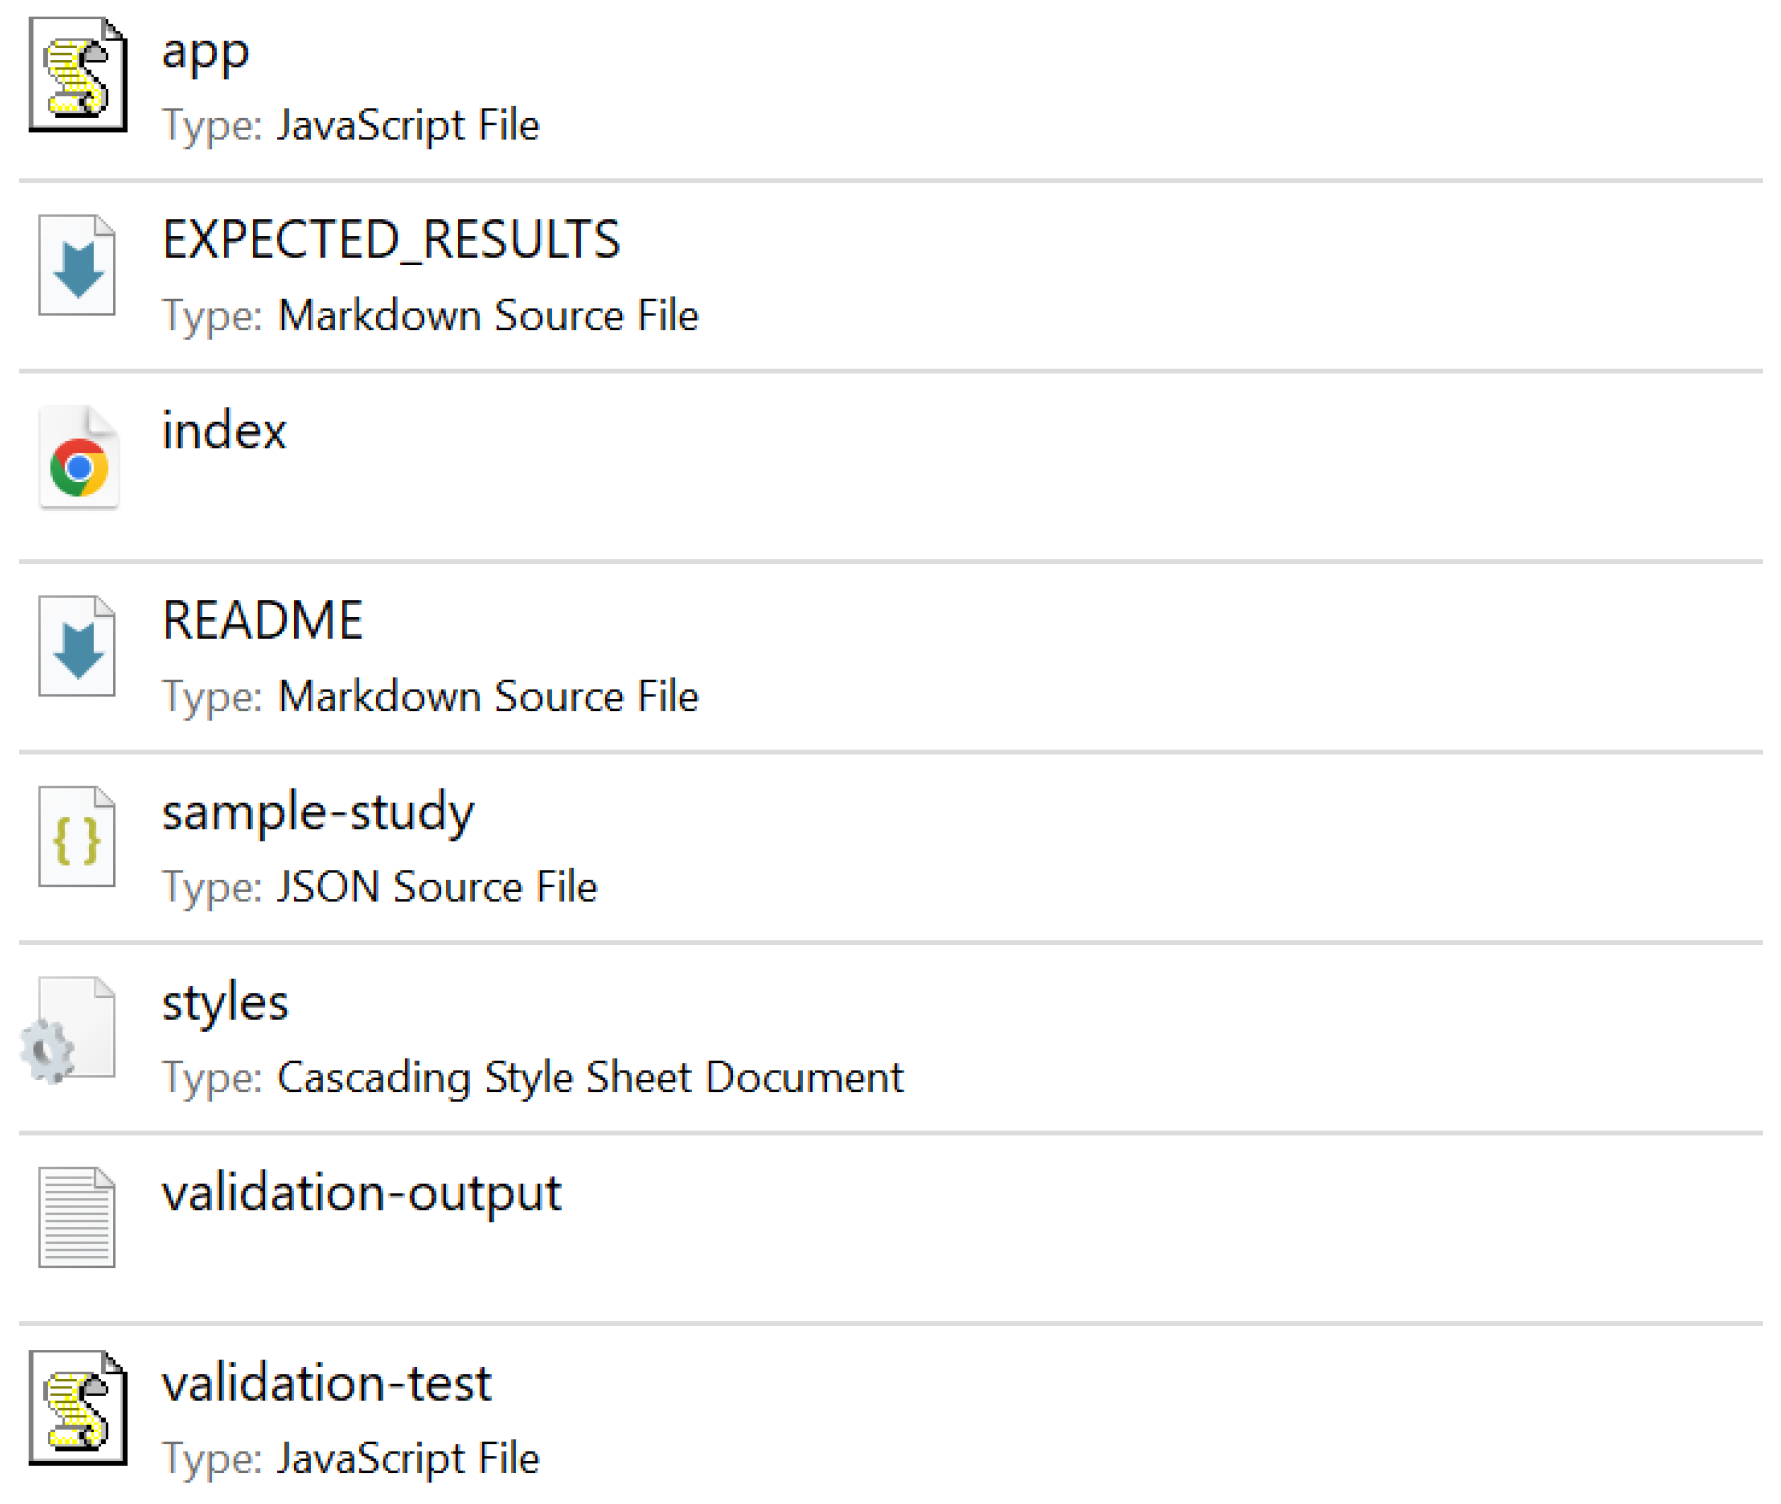
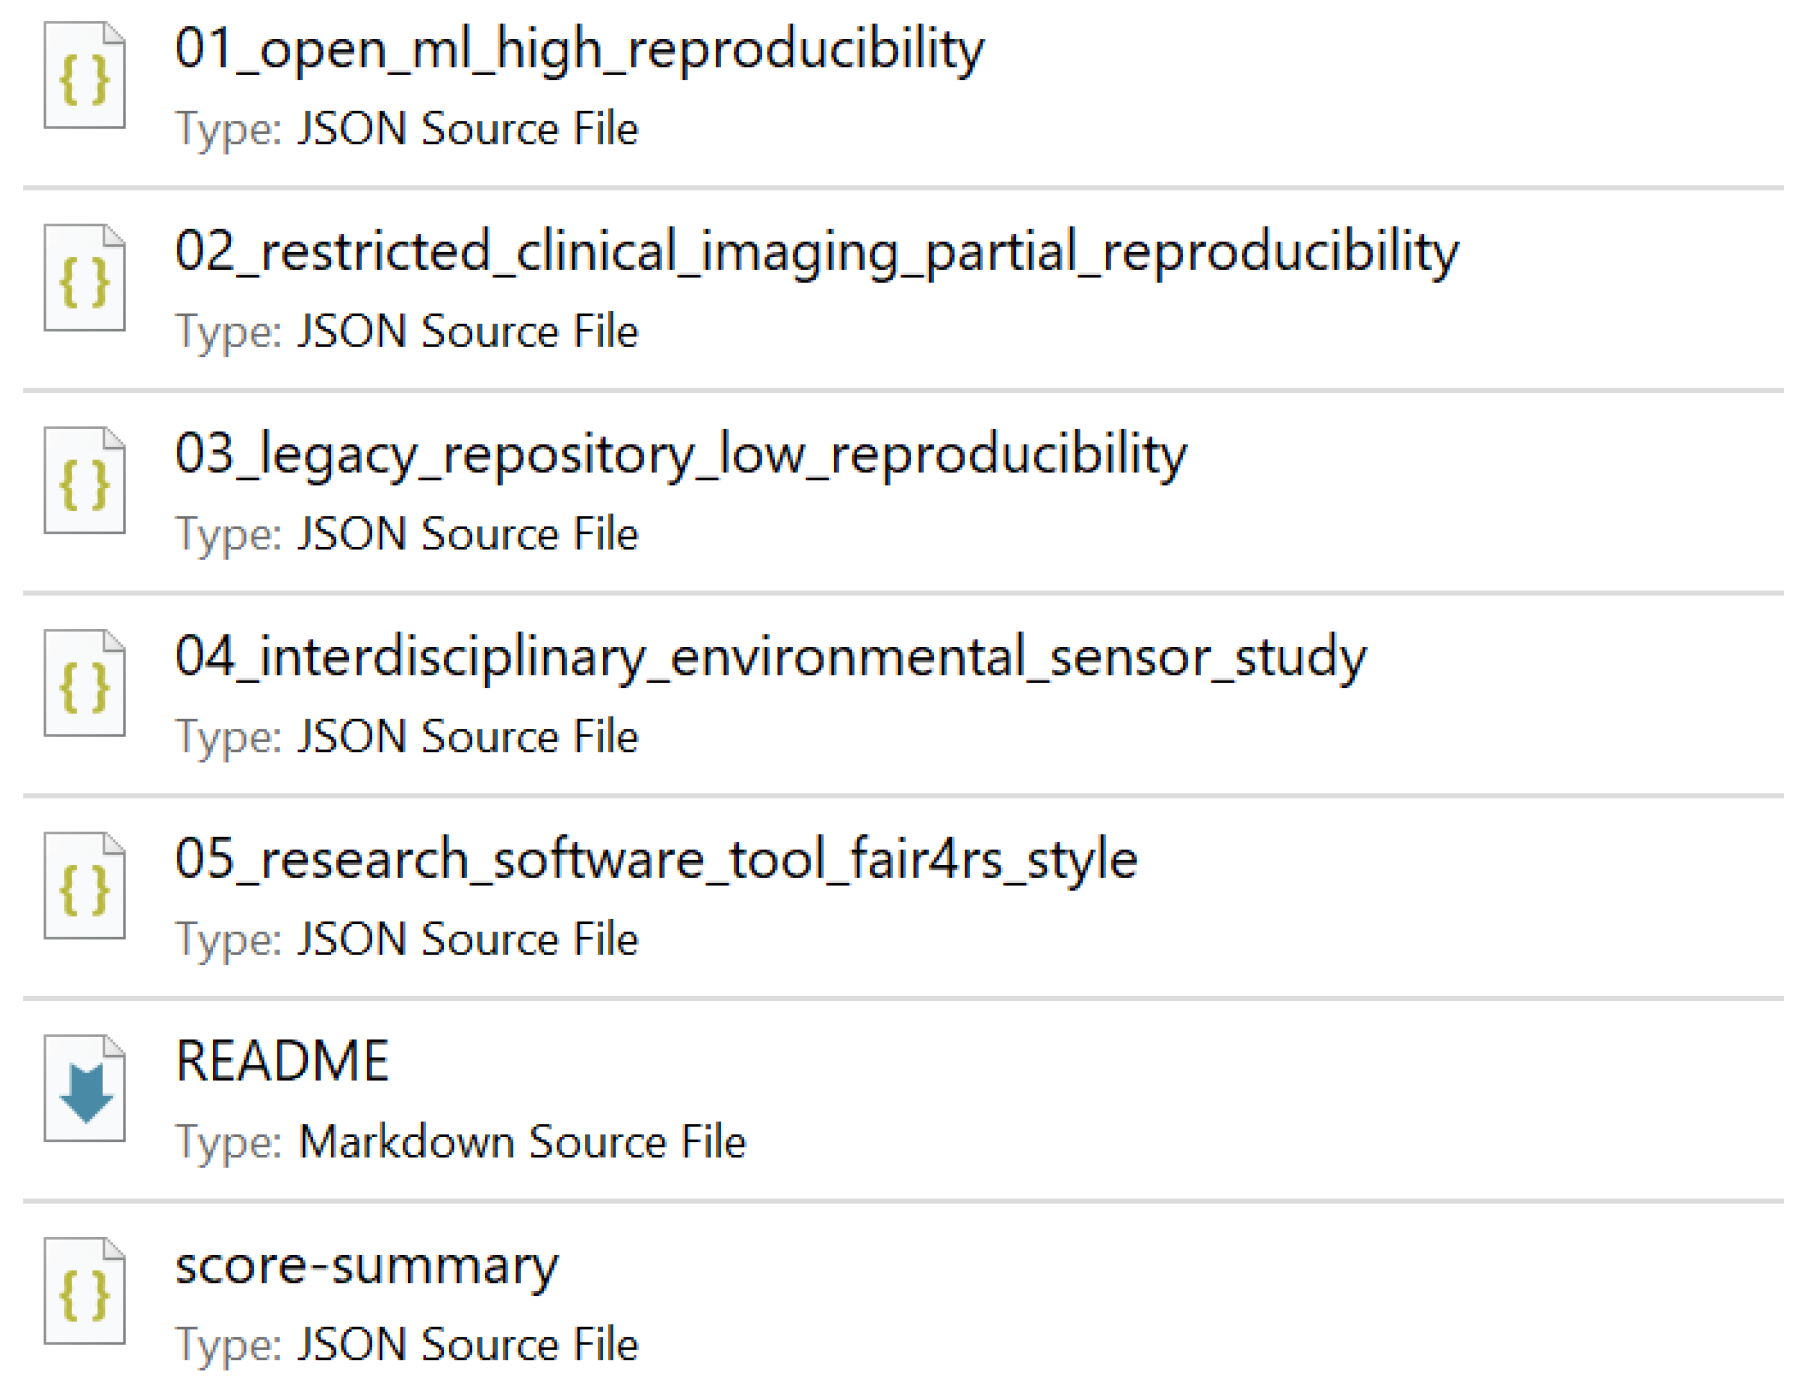
The implementation package contains the browser interface, styling file, JavaScript scoring logic, a sample study file, expected validation results and a validation test script. Additional JSON examples were also prepared to test strong, partial, weak, interdisciplinary and research-software cases. These files make the demonstration easy to inspect and extend.
9. Evaluation Design
The proof-of-concept prototype demonstrates that the dashboard can be implemented and exercised using structured study records. The next step is to evaluate it on a real corpus of computational papers and artefacts. The evaluation design directly addresses the need for benchmarks, expert agreement analysis, correlation studies, case-based evaluation and user-centred assessment.
Table 4 provides an overview of the evaluation components. The prototype can be accessed at
Supplementary Materials.
9.1. Real-Corpus Sampling Strategy
The evaluation should use a stratified corpus of computational papers across at least three domains, for example bioinformatics, computational social science and machine learning. A feasible pilot would select 15–30 papers, with a balance of studies that provide complete artefacts, partial artefacts, restricted data and weak or legacy repositories. Within each domain, the sample should include variation in citation level, software availability and data access. Citation clusters can help avoid over-representing one sub-community [
19,
21]. For each paper, the evaluators should collect the article, repository links, dataset links, workflow files, environment files, expected outputs and any stated access conditions.
9.2. Benchmark Experiments and Case-Based Evaluation
A subset of papers should be chosen from benchmark collections, reproducibility challenges or well-documented case studies where expected outcomes are known. These cases allow the system to test whether high scores are associated with successful re-execution and whether low scores correctly identify missing evidence. The current JSON demonstration studies can be used only for development testing; they should not be treated as validation data. For validation, the prototype should process real artefact bundles and record re-build status, workflow run status, output agreement, errors and time-to-reproduction.
9.3. Benchmarking Metadata Inference, Verification and Explanation Quality
Metadata inference should be evaluated by comparing machine-suggested fields against expert-annotated metadata profiles. Precision, recall and F1-score should be reported for fields such as licence, dependency versions, dataset access, parameters and workflow commands. Verification success should be benchmarked using build success, end-to-end workflow completion, output agreement and time-to-reproduction. Scoring stability should be tested by varying weights, tolerance thresholds and missing-evidence assumptions, then reporting rank stability and confidence intervals. Explanation quality should be assessed through traceability coverage, clarity ratings and task accuracy when users are asked to locate the evidence behind a score.
9.4. Expert Agreement and Metric Validation
A panel of at least three research software engineers and domain experts should independently rate artefact completeness, environment fidelity, workflow executability, metadata quality, output agreement and claim-evidence coverage. Agreement between experts should be reported before using expert labels as ground truth, for example through Cohen’s kappa, Fleiss’ kappa, Krippendorff’s alpha or intraclass correlation depending on the number of raters and score type. The system’s automated scores can then be compared with the agreed human ratings using correlation, mean absolute error and disagreement analysis. This process directly tests whether the proposed metrics reflect human reproducibility judgement.
9.5. Correlation, Predictive Validity and User-Centred Evaluation
The evaluation should test whether eFAIR-X metrics correlate with independent outcomes, such as successful manual reproduction, time-to-reproduction, number of missing artefacts found by reviewers and author correction rate. Correlation with citation counts alone is insufficient because highly cited work is not necessarily reproducible. Researchers and reviewers should also complete realistic dashboard tasks: identifying missing artefacts, judging reproducibility readiness, finding the evidence behind a claim and prioritising replication effort. Measures should include task accuracy, time, perceived workload, trust, interpretability and confidence. Interviews should capture whether explanations are understandable and whether dashboard outputs support better decision-making.
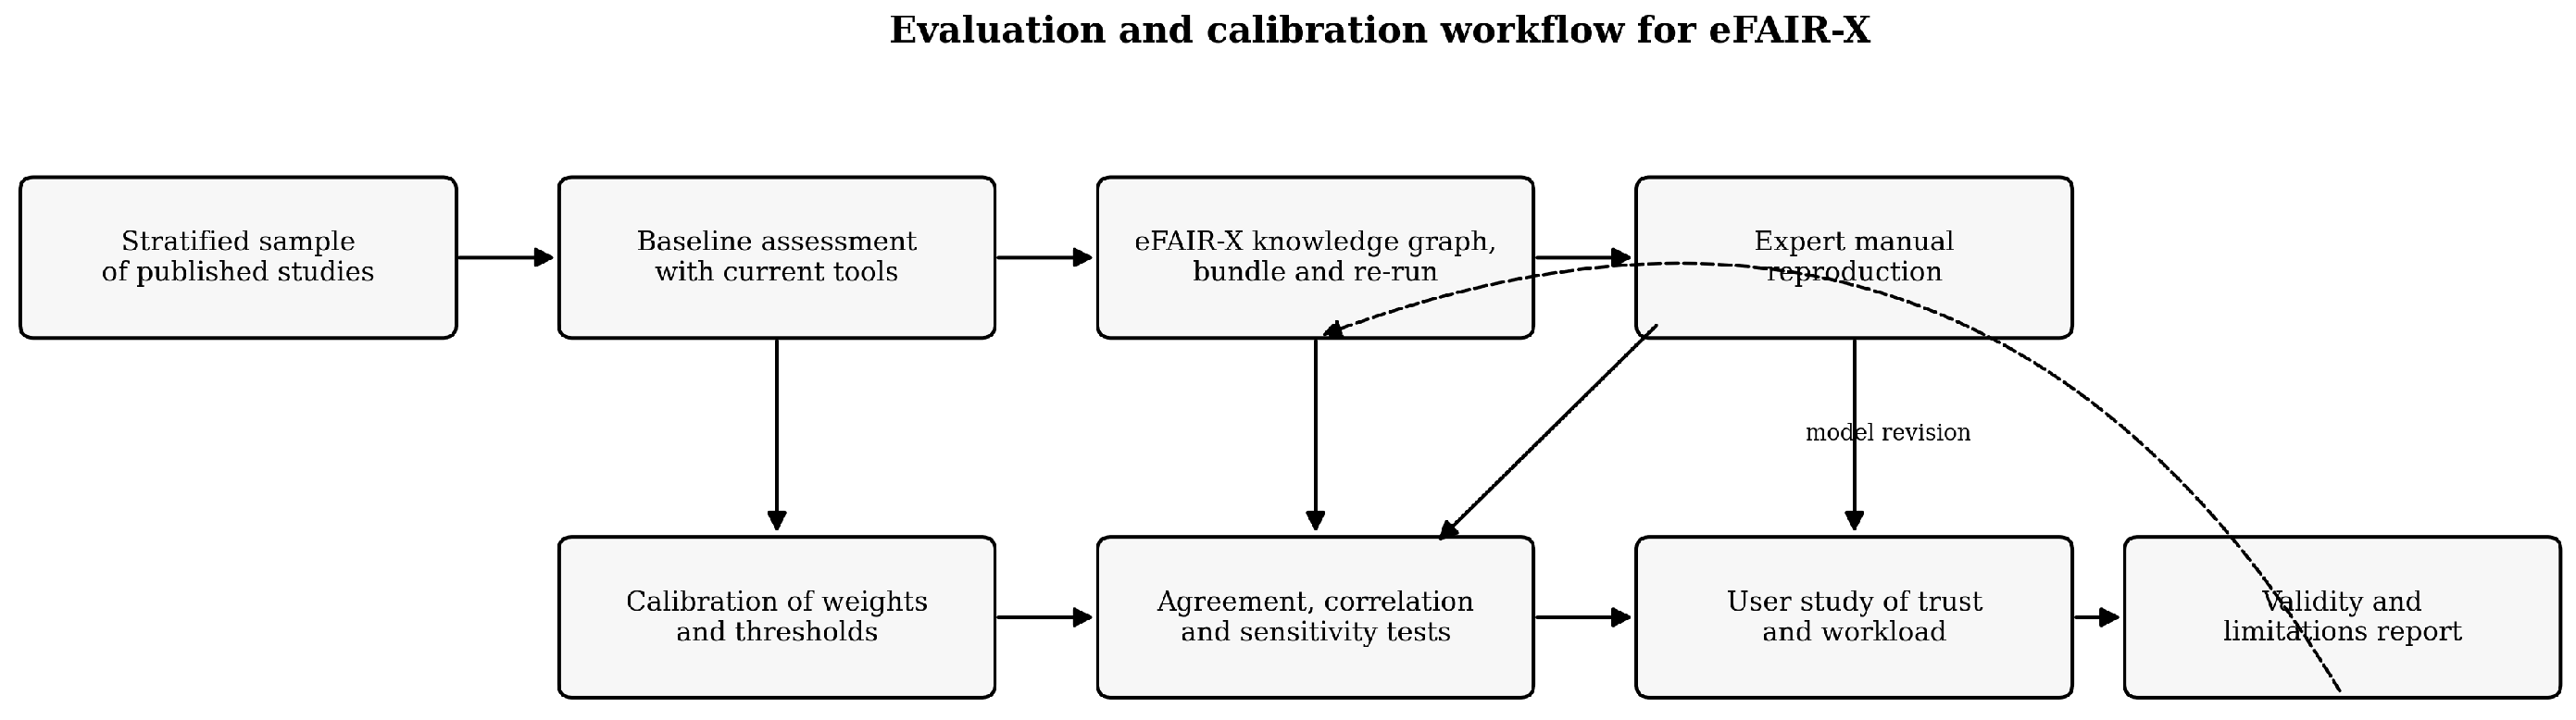
Figure 10 depicts the general workflow for the system proposed in this work.
10. Dashboard for Reproducibility User Views
The Dashboard for Reproducibility is the user-facing component of eFAIR-X. The dashboard design separates overview, explanation and evidence inspection.
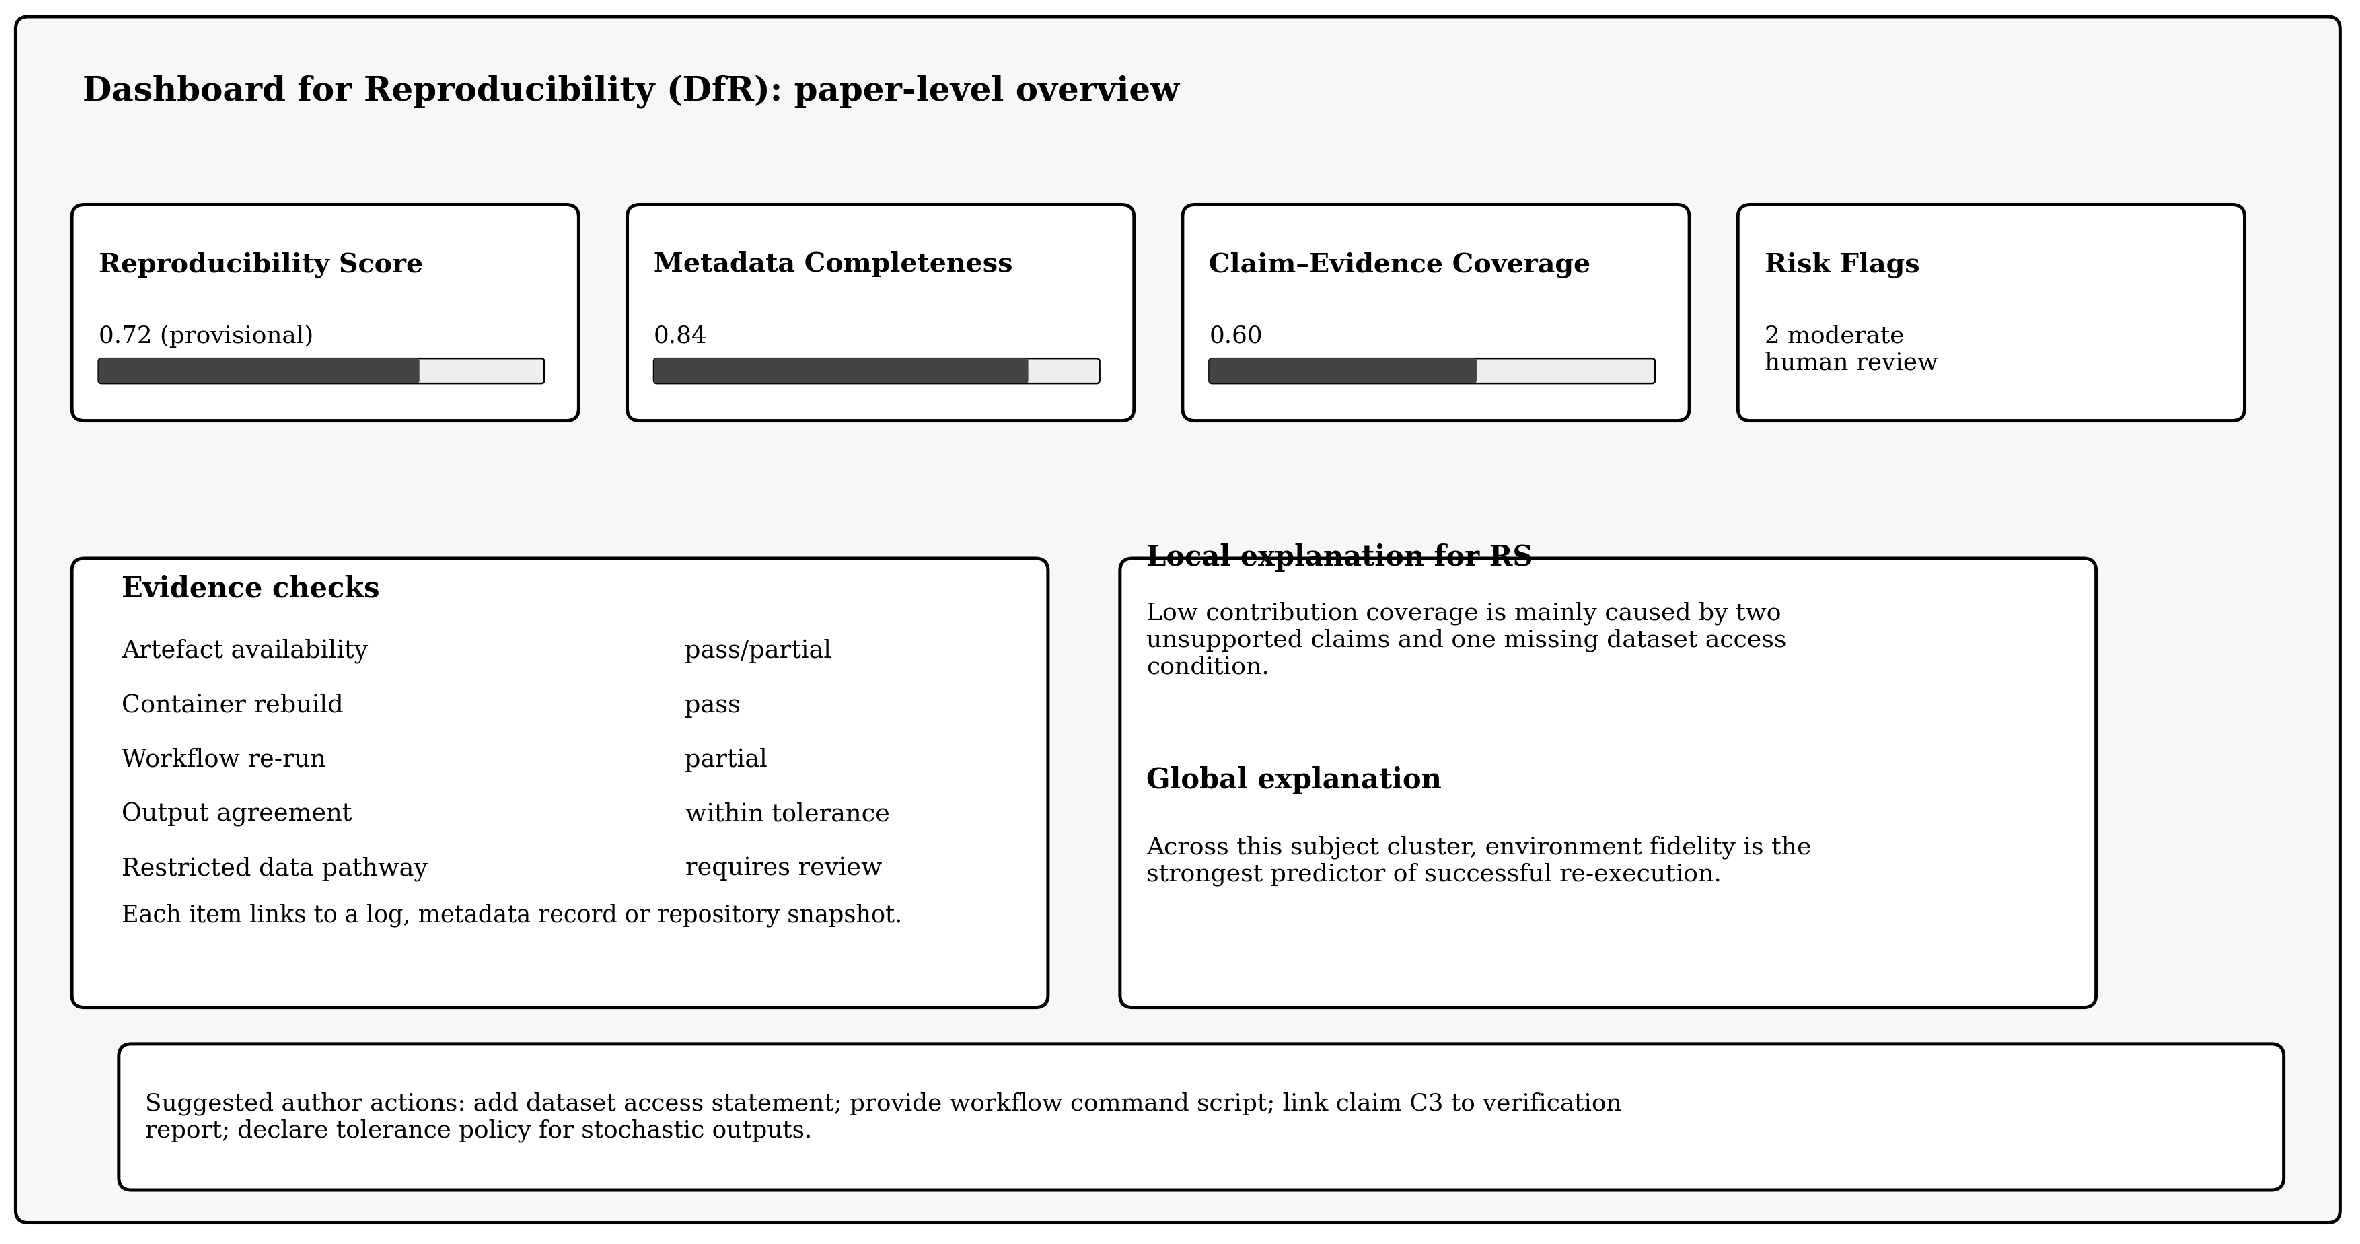
Figure 11 presents the conceptual dashboard view.
10.1. Paper-Level Overview
The overview page presents the main component scores, a short explanation, evidence status and suggested author actions. This view is intended for quick review but does not replace detailed inspection.
10.2. Evidence Drill-Down
The drill-down view opens from any score or warning. For example, selecting the Reproducibility Score reveals artefact availability, environment fidelity, workflow executability and output agreement. Selecting output agreement shows the reference output, reproduced output, tolerance policy and comparison result. This makes the dashboard inspectable rather than opaque.
10.3. Role-Specific Use
Authors use the dashboard to identify gaps before submission. Reviewers use it to focus manual checking on unsupported claims. Editors use it as supplementary evidence when deciding whether additional reproducibility checks are needed. Institutions and funders use aggregated reports to identify training needs and infrastructure bottlenecks.
11. Discussion
11.1. Expected Benefits
eFAIR-X supports three practical benefits. First, it turns reproducibility from a vague statement into a structured evidence chain. Secondly, it reduces reviewer burden by showing where evidence exists and where it is missing. Thirdly, it supports interdisciplinary research by making claims, artefacts and semantic relationships more explicit.
11.2. Limitations
The framework is no longer only conceptual because a proof-of-concept web prototype has been implemented and tested using structured JSON studies. However, the prototype remains an early demonstration rather than a validated, production-ready research infrastructure. Its metrics are provisional and should not be used for high-stakes assessment without calibration and validation. Automated metadata inference can produce errors. Re-execution may fail because of unavailable data, proprietary software, hardware constraints or unstable external services. Knowledge graphs may inherit bias from source metadata and may represent well-curated fields more favourably than under-resourced fields. These limitations require careful governance and transparent reporting.
11.3. Risk of Metric Gaming
Any dashboard used in assessment may create incentives for superficial compliance. A researcher might try to maximise scores by uploading minimal artefacts without improving scientific quality. To reduce this risk, eFAIR-X must preserve evidence drill-down, human judgement and qualitative review. The dashboard should reward meaningful evidence, not box-ticking.
11.4. Policy Alignment
Open Science reforms recognise the need to reward openness, transparency and responsible research practice [
30,
31]. eFAIR-X can support such reforms by producing evidence-linked indicators, but it should be used as decision-support rather than as a rigid ranking tool.
12. Conclusions
This paper has repositioned eFAIR-X as a verification-centred, explainable and implementation-oriented extension of FAIR for computational research reproducibility. It clarifies that the framework sits between FAIR principle extension, FAIR assessment and operational workflow verification. It also strengthens the technical basis of the model by specifying knowledge-graph semantics, metadata attributes, local and global explainability mechanisms, dashboard evidence drill-downs and a rigorous validation plan.
The most important revision is the treatment of metrics as provisional operational indicators rather than validated measures. Before being used in journal, institutional or funder workflows, the weights, thresholds and output-agreement rules must be calibrated through expert judgement, benchmark experiments, manual reproduction studies, correlation testing and sensitivity analysis. This more cautious framing makes the contribution more defensible and more useful.
The immediate next step is to extend the current browser-based prototype into a staged pilot using a real corpus of computational papers and artefacts. The pilot should automate more of the ingestion process, strengthen repository and data-archive connectors, execute verification bundles where feasible, and compare dashboard scores with human expert judgement. Subsequent work should evaluate the framework across domains, refine metadata profiles, test user trust and examine governance models for sensitive or restricted artefacts. In the longer term, eFAIR-X can contribute to more reliable research reuse by making computational claims traceable, reproducibility evidence inspectable and assessment decisions more transparent.
Supplementary Materials
The following supporting information can be downloaded at:
https://www.mdpi.com/article/10.3390/sci8060124/s1. The accompanying Overleaf project includes the browser-based eFAIR-X prototype, structured JSON demonstration studies, validation-output files and prototype screenshots used to illustrate the proof-of-concept implementation.
Author Contributions
Conceptualisation, P.B., M.B. and M.T.; methodology, P.B., M.B., M.T. and N.B.; writing—original draft preparation, P.B.; writing—review and editing, M.B., M.T. and N.B.; visualisation, P.B.; supervision, N.B. All authors have read and agreed to the published version of the manuscript.
Funding
This research received no external funding.
Institutional Review Board Statement
Not applicable.
Informed Consent Statement
Not applicable.
Data Availability Statement
The proof-of-concept prototype uses structured JSON demonstration files and screenshots included with the accompanying Overleaf project. No real empirical corpus is reported in this manuscript. Future prototype evaluation data should be made available subject to ethical, legal and access restrictions.
Conflicts of Interest
The authors declare no conflicts of interest.
References
- Baker, M. 1500 scientists lift the lid on reproducibility. Nature 2016, 533, 452–454. [Google Scholar] [CrossRef]
- Dirnagl, U. Rethinking research reproducibility. EMBO J. 2019, 38, e101117. [Google Scholar] [CrossRef] [PubMed]
- Goodman, S.N.; Fanelli, D.; Ioannidis, J.P.A. What does research reproducibility mean? Sci. Transl. Med. 2016, 8, 341ps12. [Google Scholar] [CrossRef]
- Pineau, J.; Vincent-Lamarre, P.; Sinha, K.; Lariviere, V.; Beygelzimer, A.; d’Alche Buc, F.; Fox, E.; Larochelle, H. Improving reproducibility in machine learning research. J. Mach. Learn. Res. 2021, 22, 1–20. [Google Scholar]
- Hutson, M. Artificial intelligence faces reproducibility crisis. Science 2018, 359, 725–726. [Google Scholar] [CrossRef]
- Wilkinson, M.D.; Dumontier, M.; Aalbersberg, I.J.; Appleton, G.; Axton, M.; Baak, A.; Blomberg, N.; Boiten, J.W.; da Silva Santos, L.B.; Bourne, P.E.; et al. The FAIR Guiding Principles for scientific data management and stewardship. Sci. Data 2016, 3, 160018. [Google Scholar] [CrossRef] [PubMed]
- Boettiger, C. An introduction to Docker for reproducible research. ACM SIGOPS Oper. Syst. Rev. 2015, 49, 71–79. [Google Scholar] [CrossRef]
- Chirigati, F.; Rampin, R.; Shasha, D.; Freire, J. ReproZip: Computational reproducibility with ease. In Proceedings of the 2016 International Conference on Management of Data, San Francisco, CA, USA, 26 June–1 July 2016; pp. 2085–2088. [Google Scholar] [CrossRef]
- Brinckman, A.; Chard, K.; Gaffney, N.; Hategan, M.; Jones, M.B.; Kowalik, K.; Kulasekaran, S.; Ludascher, B.; Mecum, B.D.; Nabrzyski, J.; et al. Computing environments for reproducibility: Capturing the Whole Tale. Future Gener. Comput. Syst. 2019, 94, 854–867. [Google Scholar] [CrossRef]
- Soiland-Reyes, S.; Sefton, P.; Crosas, M.; Castro, L.J.; Coppens, F.; Fernandez, J.M.; Garijo, D.; Gruening, B.; La Rosa, M.; Leo, S.; et al. Packaging research artefacts with RO-Crate. Data Sci. 2022, 5, 97–138. [Google Scholar] [CrossRef]
- Barker, M.; Chue Hong, N.P.; Katz, D.S.; Lamprecht, A.L.; Martinez-Ortiz, C.; Psomopoulos, F.; Harrow, J.; Castro, L.J.; Gruenpeter, M.; Martinez, P.A.; et al. Introducing the FAIR Principles for research software. Sci. Data 2022, 9, 622. [Google Scholar] [CrossRef]
- Vogt, L.; Stroemert, P.; Matentzoglu, N.; Karam, N.; Konrad, M.; Prinz, M.; Baum, R. FAIR 2.0: Extending the FAIR Guiding Principles to Address Semantic Interoperability. arXiv 2024, arXiv:cs.DL/2405.03345. [Google Scholar] [CrossRef]
- Devaraju, A.; Mokrane, M.; Cepinskas, L.; Huber, R.; Herterich, P.; de Vries, J.; Akerman, V.; L’Hours, H.; Davidson, J.; Diepenbroek, M. From Conceptualization to Implementation: FAIR Assessment of Research Data Objects. Data Sci. J. 2021, 20, 4. [Google Scholar] [CrossRef]
- Welter, D.; Juty, N.; Rocca-Serra, P.; Xu, F.; Henderson, D.; Gu, W.; Strubel, J.; Giessmann, R.T.; Emam, I.; Gadiya, Y.; et al. FAIR in action—A flexible framework to guide FAIRification. Sci. Data 2023, 10, 291. [Google Scholar] [CrossRef]
- Perez-Riverol, Y.; Gatto, L.; Wang, R.; Sachsenberg, T.; Uszkoreit, J.; Leprevost, F.d.V.; Fufezan, C.; Ternent, T.; Eglen, S.J.; Katz, D.S.; et al. Ten Simple Rules for Taking Advantage of Git and GitHub. PLoS Comput. Biol. 2016, 12, e1004947. [Google Scholar] [CrossRef] [PubMed]
- Rule, A.; Birmingham, A.; Zuniga, C.; Altintas, I.; Huang, S.C.; Knight, R.; Moshiri, N.; Nguyen, M.H.; Rosenthal, S.B.; Perez, F.; et al. Ten simple rules for writing and sharing computational analyses in Jupyter Notebooks. PLoS Comput. Biol. 2019, 15, e1007007. [Google Scholar] [CrossRef] [PubMed]
- Peng, C.; Xia, F.; Naseriparsa, M.; Osborne, F. Knowledge graphs: Opportunities and challenges. Artif. Intell. Rev. 2023, 56, 13071–13102. [Google Scholar] [CrossRef] [PubMed]
- Manghi, P. Challenges in building scholarly knowledge graphs for research assessment in open science. Quant. Sci. Stud. 2024, 5, 991–1021. [Google Scholar] [CrossRef]
- van Eck, N.J.; Waltman, L. Citation-based clustering of publications using CitNetExplorer and VOSviewer. Scientometrics 2017, 111, 1053–1070. [Google Scholar] [CrossRef]
- Kleminski, R.; Kazienko, P.; Kajdanowicz, T. Analysis of direct citation, co-citation and bibliographic coupling in scientific topic identification. J. Inf. Sci. 2022, 48, 349–373. [Google Scholar] [CrossRef]
- Bascur, J.P.; Verberne, S.; van Eck, N.J.; Waltman, L. Academic information retrieval using citation clusters: In-depth evaluation based on systematic reviews. Scientometrics 2023, 128, 2895–2921. [Google Scholar] [CrossRef]
- Xie, Q.; Waltman, L. A comparison of citation-based clustering and topic modeling for science mapping. Scientometrics 2025, 130, 2497–2522. [Google Scholar] [CrossRef]
- Aria, M.; Cuccurullo, C. bibliometrix: An R-tool for comprehensive science mapping analysis. J. Informetr. 2017, 11, 959–975. [Google Scholar] [CrossRef]
- Doshi-Velez, F.; Kim, B. Towards a rigorous science of interpretable machine learning. arXiv 2017, arXiv:stat.ML/1702.08608. Available online: http://arxiv.org/abs/1702.08608 (accessed on 3 February 2026). [CrossRef]
- Guidotti, R.; Monreale, A.; Ruggieri, S.; Turini, F.; Giannotti, F.; Pedreschi, D. A survey of methods for explaining black box models. ACM Comput. Surv. 2018, 51, 93. [Google Scholar] [CrossRef]
- Miller, T. Explanation in artificial intelligence: Insights from the social sciences. Artif. Intell. 2019, 267, 1–38. [Google Scholar] [CrossRef]
- Alsmadi, I.; Alsobeh, A. TAMUSA-Chat: A Domain-Adapted Large Language Model Conversational System for Research and Responsible Deployment. arXiv 2026, arXiv:cs.CL/2603.09992. Available online: http://arxiv.org/abs/2603.09992 (accessed on 15 January 2026).
- AlSobeh, A.; Shatnawi, A.; Magableh, A. AspectFL: Aspect-Oriented Programming for Trustworthy and Compliant Federated Learning Systems. Information 2025, 16, 1048. [Google Scholar] [CrossRef]
- AlSobeh, A.; AbuGhazaleh, A.; Dhahir, N.; Rababa, M. XAIPath: Temporal-Environmental Explainable AI Framework for Co-Contaminated Food Pathogen Detection in Microscopic Imaging. In Proceedings of the 54th International Conference on Parallel Processing Companion, San Diego, CA, USA, 2–10 September 2025. [Google Scholar] [CrossRef]
- European Commission. Open and Universal Science (OPUS)—Project Fact Sheet, Grant Agreement 101058471; CORDIS Project Record; European Commission: Brussels, Belgium, 2025.
- OPUS Project. In Open and Universal Science (OPUS); Project Website; European Commission: Brussels, Belgium, 2022.
Figure 1.
eFAIR-X layered architecture. The model connects research sources, normalised artefacts, a semantic research knowledge graph, an AI and verification layer, execution evidence and dashboard/API services. Human feedback and contestation are explicitly included to prevent opaque automation.
Figure 1.
eFAIR-X layered architecture. The model connects research sources, normalised artefacts, a semantic research knowledge graph, an AI and verification layer, execution evidence and dashboard/API services. Human feedback and contestation are explicitly included to prevent opaque automation.
Figure 2.
Enhanced concept-based research knowledge graph for eFAIR-X. The figure adds explicit node types, typed semantic relationships, metadata attributes and a natural-language to formal-claim mapping. It demonstrates how one can move from a paper claim to the artefacts and verification report needed to assess reproducibility.
Figure 2.
Enhanced concept-based research knowledge graph for eFAIR-X. The figure adds explicit node types, typed semantic relationships, metadata attributes and a natural-language to formal-claim mapping. It demonstrates how one can move from a paper claim to the artefacts and verification report needed to assess reproducibility.
Figure 3.
Proof-of-concept dashboard using Study 1. The screenshot shows the implemented paper-level overview with component scores, status labels and the validation control. This converts the dashboard concept into a working interface driven by a structured JSON input file.
Figure 3.
Proof-of-concept dashboard using Study 1. The screenshot shows the implemented paper-level overview with component scores, status labels and the validation control. This converts the dashboard concept into a working interface driven by a structured JSON input file.
Figure 4.
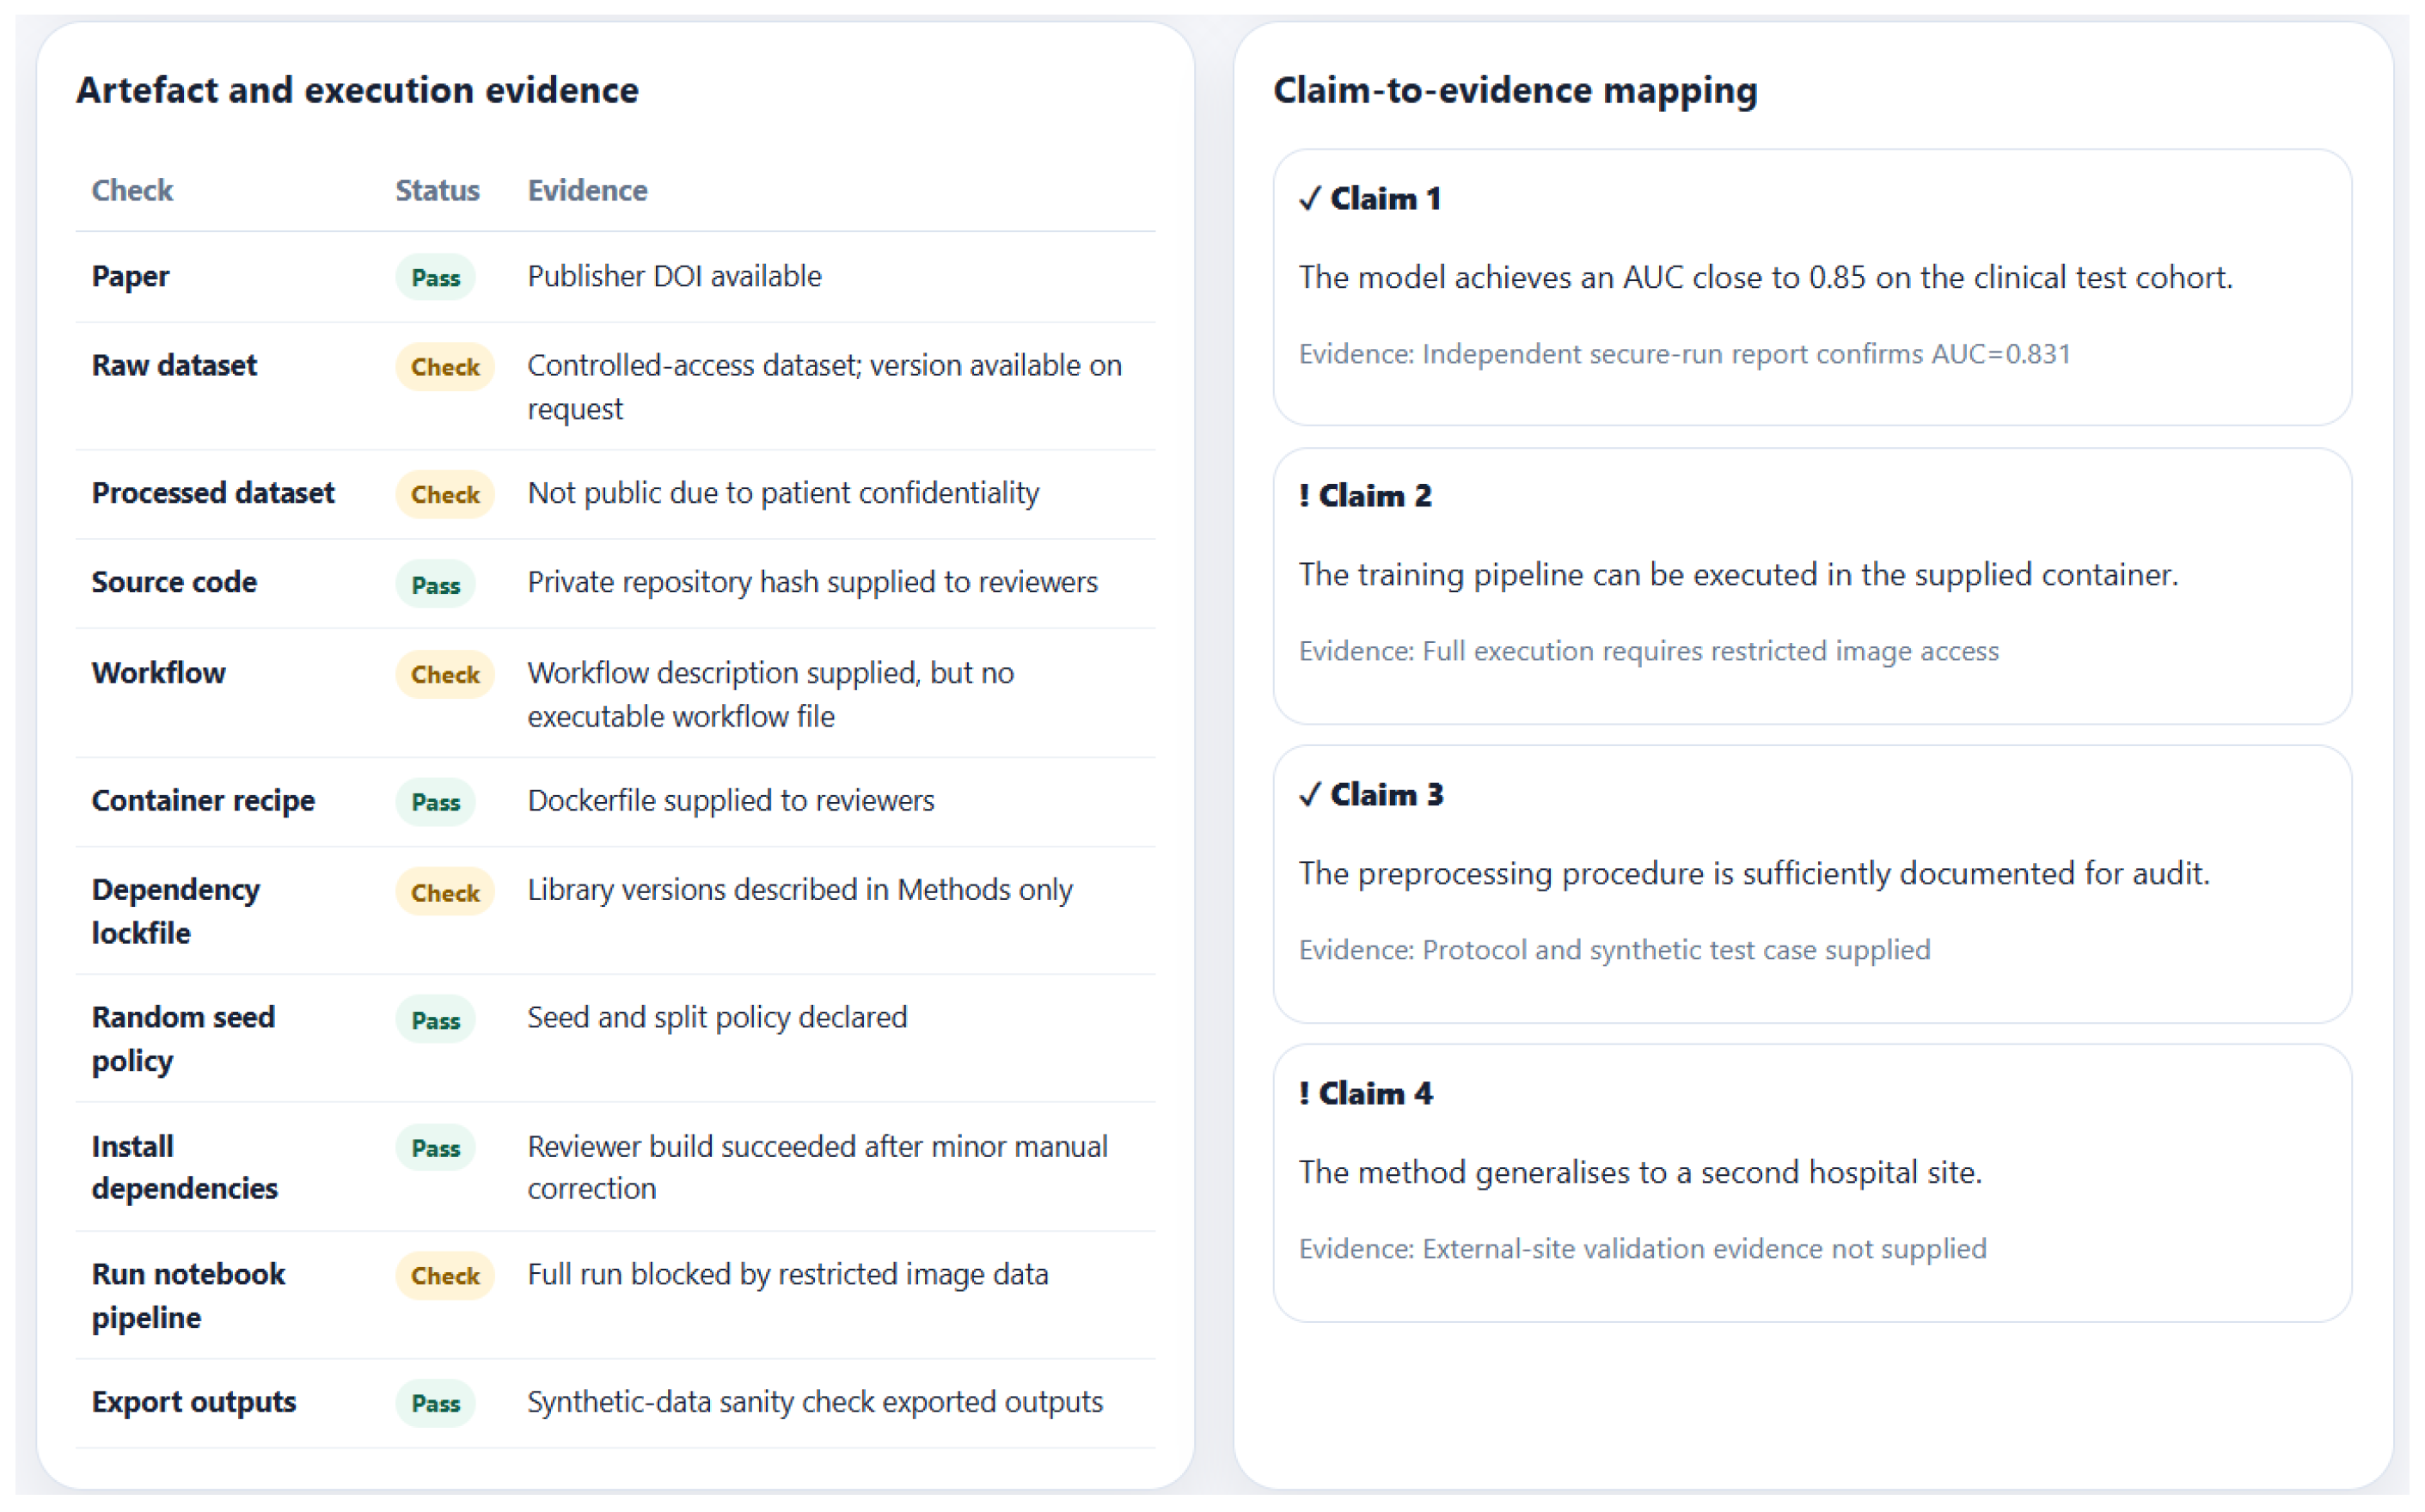
Study 1 evidence and claim-mapping view. The implemented interface separates artefact and execution evidence from claim-to-evidence mapping, allowing users to inspect whether individual claims are supported by specific verification artefacts.
Figure 4.
Study 1 evidence and claim-mapping view. The implemented interface separates artefact and execution evidence from claim-to-evidence mapping, allowing users to inspect whether individual claims are supported by specific verification artefacts.
Figure 5.
Proof-of-concept dashboard using Study 2. The screenshot shows how the dashboard reports lower but still inspectable scores for a restricted-data study with partial verification evidence.
Figure 5.
Proof-of-concept dashboard using Study 2. The screenshot shows how the dashboard reports lower but still inspectable scores for a restricted-data study with partial verification evidence.
Figure 6.
Study 2 evidence and claim-mapping view. The screenshot shows how restricted access, partial execution and missing external validation are surfaced as evidence states rather than hidden behind a single aggregate score.
Figure 6.
Study 2 evidence and claim-mapping view. The screenshot shows how restricted access, partial execution and missing external validation are surfaced as evidence states rather than hidden behind a single aggregate score.
Figure 7.
Prototype project structure for the implemented eFAIR-X dashboard. The structure shows the browser-based interface files, validation script, sample data and supporting documentation.
Figure 7.
Prototype project structure for the implemented eFAIR-X dashboard. The structure shows the browser-based interface files, validation script, sample data and supporting documentation.
Figure 8.
Sample JSON study inputs used to test the dashboard. These files allow the prototype to demonstrate different reproducibility profiles, including high-, partial- and low-reproducibility cases.
Figure 8.
Sample JSON study inputs used to test the dashboard. These files allow the prototype to demonstrate different reproducibility profiles, including high-, partial- and low-reproducibility cases.
Figure 9.
Example JSON input structure used by the prototype dashboard. The file defines study metadata, artefacts, evidence checks, claim mappings and score inputs.
Figure 9.
Example JSON input structure used by the prototype dashboard. The file defines study metadata, artefacts, evidence checks, claim mappings and score inputs.
Figure 10.
Proposed validation workflow for eFAIR-X. The evaluation combines stratified sampling, baseline comparison, eFAIR-X processing, expert manual reproduction, calibration, statistical validation and user-centred evaluation.
Figure 10.
Proposed validation workflow for eFAIR-X. The evaluation combines stratified sampling, baseline comparison, eFAIR-X processing, expert manual reproduction, calibration, statistical validation and user-centred evaluation.
Figure 11.
Dashboard for Reproducibility paper-level view.The figure clarifies the dashboard layout by separating component scores, evidence checks, local explanations, global explanations and suggested author actions.
Figure 11.
Dashboard for Reproducibility paper-level view.The figure clarifies the dashboard layout by separating component scores, evidence checks, local explanations, global explanations and suggested author actions.
Table 1.
Positioning matrix for eFAIR-X against related FAIR extensions, assessment frameworks and reproducibility tools. The table is intended as a qualitative scoping comparison, not a claim of empirical superiority.
Table 1.
Positioning matrix for eFAIR-X against related FAIR extensions, assessment frameworks and reproducibility tools. The table is intended as a qualitative scoping comparison, not a claim of empirical superiority.
| Framework or Tool | Primary Purpose | Artefact Scope | Operational Verification | How eFAIR-X Differs or Complements It |
|---|
| FAIR principles | General principles for findable, accessible, interoperable and reusable research objects | Broad; originally data-centred | Not a primary aim | eFAIR-X operationalises FAIR for computational reproducibility by adding executable evidence and explainable verification. |
| FAIR4RS | FAIR guidance for research software | Research software, releases, metadata and citation | Not a complete re-execution system | eFAIR-X reuses software FAIRness as one component of claim-level reproducibility assessment. |
| FAIR 2.0 | Extension of FAIR for semantic interoperability | Data, metadata, schema and semantic mappings | Not a workflow verification system | eFAIR-X adopts semantic mapping but adds claim-to-evidence links, execution records and dashboard explanations. |
FAIR assessment of
research data objects | Practical FAIR metrics and assessment | Research data objects and repositories | Limited to FAIR assessment tests | eFAIR-X adds workflow re-execution and output agreement, while treating FAIR assessment as part of metadata completeness. |
| FAIRification framework | Process guidance for improving FAIRness | Existing and future datasets | Not the central aim | eFAIR-X can use FAIRification outputs as improved inputs for later reproducibility verification. |
| ReproZip | Capturing and packaging computational environments | Software executions and dependencies | Supports re-execution but not semantic claim modelling | eFAIR-X can ingest ReproZip-style packages as evidence and link them to claims and dashboard scores. |
| RO-Crate | Research object packaging with structured metadata | Bundled artefacts and metadata | Packaging rather than judgement | eFAIR-X uses packaging as a verification bundle format and adds scoring, explanation and calibration. |
| Whole Tale | Reproducible computational environments and tales | Data, code, environments and narratives | Supports reproducible environments | eFAIR-X adds cross-study knowledge graph links and explicit claim-evidence scoring. |
| eFAIR-X proposed | Verification-centred FAIR extension and dashboard | Papers, claims, datasets, code, workflows, environments, outputs and evidence | Central aim, subject to empirical validation | Proposed contribution: explainable, evidence-linked and calibratable reproducibility assessment for interdisciplinary computational research. |
Table 2.
Core Dashboard for Reproducibility metrics, evidence sources and validation requirements.
Table 2.
Core Dashboard for Reproducibility metrics, evidence sources and validation requirements.
| Metric | Meaning | Evidence Inputs | Validation Requirement |
|---|
| A | Artefact availability | Presence, accessibility and versioning of data, code, workflow and outputs | Compare against expert audit of artefact completeness. |
| E | Environment fidelity | Container recipes, lockfiles, operating system, hardware notes and dependency capture | Test re-build success across controlled execution environments. |
| W | Workflow executability | Workflow commands, notebooks, scripts, pipeline definitions and execution logs | Compare automated run status with manual reproduction attempts. |
| O | Output agreement | Output hashes, metrics, tolerance rules, repeated-run summaries and stochastic policies | Validate against benchmark studies with known expected outputs. |
| MC | Metadata completeness | PID, licence, methods, inputs, outputs, parameters and access conditions | Compare machine scoring with human metadata assessment. |
| CI | Claim-evidence coverage | Structured claims, mapped outputs and verification evidence | Measure agreement between claim mappings and expert annotations. |
| RL | Relevance longevity | Time-decayed citations, reuse events and cross-domain links | Test correlation with independent reuse indicators, not raw citation alone. |
| OR | Originality risk | Text similarity, citation patterns and concept overlap | Treat as a risk flag; validate false positives/negatives through human review. |
Table 3.
Prototype capability summary.
Table 3.
Prototype capability summary.
| Activity | Prototype Evidence | Remaining Work |
|---|
| Working implementation | Static web dashboard, JavaScript scoring logic, JSON ingestion, graph view and validation panel. | Convert the prototype into a server-backed research infrastructure with repository connectors and persistent evidence storage. |
| Evidence of dashboard operation | Study 1 and Study 2 screenshots show implemented scorecards, evidence tables and claim-evidence mapping. | Evaluate the interface with real researchers and reviewers rather than only demonstration cases. |
| Testing with varied inputs | Five additional JSON studies represent strong, partial, weak, interdisciplinary and research-software cases. | Replace or supplement demonstration studies with a real corpus of computational papers and artefacts. |
| Inspectable scoring | The scoring script exposes the equations and expected validation outputs. | Calibrate weights and thresholds using expert ratings and benchmark outcomes. |
Table 4.
Concrete evaluation tasks for moving from prototype demonstration to empirical validation.
Table 4.
Concrete evaluation tasks for moving from prototype demonstration to empirical validation.
| Evaluation Target | Operational Method | Reportable Output |
|---|
| Metadata inference | Compare inferred fields with expert-annotated metadata for each paper and artefact. | Precision, recall, F1-score and error categories. |
| Verification success | Attempt environment rebuild, workflow execution and output comparison for each artefact bundle. | Build success rate, run success rate, output-agreement distribution and time-to-reproduction. |
| Scoring stability | Recalculate scores under weight, tolerance and missing-data perturbations. | Sensitivity plots, rank stability and robust/fragile score components. |
| Explanation quality | Ask users to use the dashboard to find out why a score was assigned and which evidence supports it. | Task accuracy, completion time, clarity ratings and qualitative feedback. |
| Human metric validation | Compare automated scores against independent expert ratings. | Inter-rater agreement, machine–human correlation, mean absolute error and disagreement analysis. |
| Disclaimer/Publisher’s Note: The statements, opinions and data contained in all publications are solely those of the individual author(s) and contributor(s) and not of MDPI and/or the editor(s). MDPI and/or the editor(s) disclaim responsibility for any injury to people or property resulting from any ideas, methods, instructions or products referred to in the content. |