Article

Enhancing the Performance of an H-Darrieus Hydrokinetic Turbine Through Geometric Optimization of an External Channel

by
Angie J. Guevara Muñoz
1,2,*,
Isabella Carvajal Samboni
1,
Miguel A. Rodriguez-Cabal
1 and
Edwin Chica
2
1
Department of Mechatronics and Electromechanics, Faculty of Engineering, Instituto Tecnólogico Metropolitano, Medellín 050013, Colombia
2
Department of Mechanical Engineering, Faculty of Engineering, University of Antioquia, Medellín 050010, Colombia
*
Author to whom correspondence should be addressed.
Submission received: 8 October 2025 / Revised: 11 January 2026 / Accepted: 25 February 2026 / Published: 27 February 2026
(This article belongs to the Section Computer Science, Mathematics and AI)

Abstract

The transition to sustainable energy systems requires the development of efficient hydrokinetic technologies to increase the reliability and competitiveness of renewable energy generation. Vertical-axis H-Darrieus turbines can improve their performance through impeller channels or external flow guidance devices that modify the local mass flow distribution around the rotor. This work introduces a systematic geometric optimization framework that quantitatively evaluates the combined effect of key channel design parameters on turbine performance by employing response surface methodology (RSM) to quantify the influence of two geometric parameters of an impeller channel—specifically, the deflection angle ( β ) and the channel length (H)—on the turbine power coefficient ( C p ). This approach allows for the identification of nonlinear interactions between geometric variables, which have not been explicitly addressed in previous research on impeller channels in H-Darrieus turbines. An experimental design with thirteen treatments was implemented, and numerical simulations were performed using Computational Fluid Dynamics (CFD) in ANSYS FLUENT®. Statistical analysis of the RSM model showed that both β and H have significant effects ( p < 0.05 ) on turbine performance. The model predicted an optimal configuration with β equal to 100° and H equal to 0.2 m, corresponding to the maximum Cp achieved. These findings confirm the potential of impulse channels to improve the aerodynamic efficiency of H-Darrieus turbines and establish a quantitative basis for design optimization in hydrokinetic applications.

1. Introduction

Energy is an essential resource for socioeconomic development, and its global demand is steadily growing. Currently, much of electricity generation still relies on fossil fuels, whose exploitation presents environmental and long-term availability problems. In this context, renewable and low-environmental-impact energy sources are becoming increasingly important. Among these, hydrokinetic turbines offer an attractive alternative for harnessing the kinetic energy of river and marine currents, as they do not require large-scale hydraulic infrastructure. These turbines convert flow energy into mechanical energy and, subsequently, into electrical energy, offering significant potential for distributed generation and in environments with long-lasting currents [1].
Hydrokinetic turbines are primarily classified into two main geometric configurations: horizontal axis (HAWT) and vertical axis (VAWT). Both have their own characteristics that can be better highlighted in opposite environments. While HAWTs have traditionally been developed for high-power applications and high-velocity flows, VAWTs show operational advantages in low-velocity environments, more turbulent flow, and ease of installation and maintenance [2]. Within VAWTs, H-Darrieus (or H-rotors) have attracted attention due to their geometric simplicity and their ability to be improved by modifications to the rotor design and the hydrodynamic profiles of their blades [3,4,5].
Despite their potential advantages, H-Darrieus have a recurring limitation in that they have lower hydrodynamic efficiency (power coefficient, Cp) under real-world operating conditions compared to other technologies, especially outside their optimal tip-speed ratio (TSR) range. Complex fluid–structure interaction phenomena influence this low efficiency, angle-of-attack variations during rotation, and drag losses that are strongly dependent on the rotor’s geometric and operational parameters [1,6,7,8].
The literature has explored multiple approaches to mitigate these limitations and increase the Cp of H-Darrieus blades. One line of work compares the performance of different hydrofoils, including symmetrical NACA profiles (0015, 0018, 0021), as well as the Selig, DU, and EN families, and analyzes how their technological characteristics (thickness, chord, and camber) affect lift and drag forces and, consequently, extractable power [3,5,9]. Other research has focused on geometric modifications of the profile itself, such as cavities, slots, or protuberances on the leading edge. These studies reported improvements in specific phenomena, including self-starting capability or lift stability within certain TSR ranges, although such enhancements do not always translate into a net increase in Cp under all operating conditions [10,11,12,13].
In addition to changes in the hydrofoil geometry, adjustments to operational and rotor parameters such as solidity, chord length, pitch angle, variable pitch strategy, Reynolds number, and azimuth angle have been studied to optimize the lift-to-drag ratio throughout the rotation. Numerical–experimental studies indicate that small pitch variations (e.g., fixed pitch around 2 ° ) can improve Cp at low TSRs, while variable pitch mechanisms show a further performance increase by reducing drag and stabilizing behavior at TSRs below 1 [14,15,16]. Likewise, increasing the solidity and thickness of the blades usually increases the relative drag, reducing the net efficiency except under very-low-velocity conditions where the effects change sign [3,7,17].
Among the profiles studied, the NACA 0018 has shown, in multiple investigations, favorable performance when specific modifications are applied, such as slots or cavity designs. These improvements are particularly effective in low TSR ranges, making this profile a promising candidate for optimizations focused on low-velocity environments, characteristic of hydrokinetic currents [11,16]. Another type of modification implemented to improve power extraction in hydrokinetic turbines is the use of augmentation channels or external flow-guiding devices. In low-flow-velocity environments, these elements can enhance turbine operability by modifying the local hydrodynamic conditions and increasing the effective flow velocity through the rotor [18]. Despite their potential, existing studies addressing augmentation channels in hydrokinetic applications remain limited and are mostly focused on horizontal-axis turbines or in aerodynamic conditions. Furthermore, the interaction between such external channels and vertical-axis H-Darrieus turbines, particularly under unsteady operating conditions, has not been systematically analyzed.
Several investigations reported in the literature present multiple strategies to improve the performance of H-Darrieus turbines, including profile modifications, incorporation of geometric elements, tuning of operating parameters, and the use of pitch mechanisms. However, a single, universal solution to maximize Cp in all operating regimes has not yet been established. In this regard, Tunio et al. [19] reported that the use of ducts significantly increases power output, but also raises hydraulic loads and structural stresses, requiring optimized mechanical designs to ensure system viability. In numerical studies, Guevara et al. [20] demonstrated that greater rotor solidity leads to higher peak power outputs and improves self-start capability when passive diffuser-type mechanisms are incorporated, with Venturi geometry configurations standing out for their notable increase in power coefficient. Additionally, Liu et al. [21] demonstrated that implementing guide vanes accelerates flow around the rotor and reduces torque fluctuations, identifying optimal geometric configurations to maximize performance.
On the other hand, simpler and lower-cost solutions, such as blocking plates, have been explored. In this regard, Patel et al. [22] experimentally demonstrated that concave plates located upstream of the rotor improve the power coefficient more effectively than flat plates. Similarly, Guevara et al. [23] confirmed, through CFD simulations and DOE-ANOVA analysis, that rotor strength and the position of the blocking plate are key performance factors, achieving significant improvements in torque and power coefficients compared to the baseline case.
It is for the above points that in the present investigation an external accessory is incorporated into the rotor, and its effect on the performance of an H-Darrieus equipped with blades based on the NACA0018 profile is evaluated, with the explicit objective of increasing the power coefficient Cp and improving the self-starting behavior and operational stability. In this context, the present study adopts a two-dimensional numerical approach to isolate the dominant hydrodynamic behavior associated with the external channel and to evaluate its influence on the turbine performance in a comparative manner. While three-dimensional effects such as tip vortices and end losses can affect the absolute performance of H-Darrieus turbines, previous studies have shown that 2D models are suitable for capturing relative performance trends and flow physics related to geometric modifications. Therefore, the results of this work are intended to be interpreted in terms of performance trends and underlying mechanisms rather than as absolute performance predictions [24]. Within this framework, this work performs a numerical evaluation of the effect of an external accessory combined with the NACA 0018 hydrofoil, intending to identify the conditions and mechanisms that consistently contribute to the improvement of Cp in hydrokinetic applications.
The remainder of this paper is organized as follows: Section 2 presents the materials and methods, including the design of experiments, the simulation setup, and the theoretical background supporting the proposed approach. Section 3 reports and discusses the obtained results. Finally, Section 4 summarizes the main conclusions and outlines directions for future work.

2. Materials and Methods

2.1. Hydrodynamic Coefficients of Hydrokinetic Turbines

The performance of a hydrokinetic turbine is commonly characterized using dimensionless parameters that relate the extracted power to the flow velocity and rotor geometry. Among these, the power coefficient Cp and the torque coefficient (Ct) are particularly relevant in the analysis of H Darrieus turbines, as they establish the relationship between the torque generated on the shaft (T) and the corresponding mechanical power output ( P T ). Specifically, it can be calculated using the Equations (1) and (2), respectively.
C p = P T 0.5 ρ A U 3
C t = T 0.5 A U 2
where ρ denotes the fluid density, A denotes the projected surface area of the rotor, and U denotes the free stream velocity. In addition, the solidity ( σ ) is a key parameter in the characterization of H-Darrieus turbines, as it has a significant influence on overall performance [25]. This parameter expresses the ratio between the total blade area and the swept area of the rotor and depends on the number of blades (N), the chord length (c), and the turbine radius (R). The solidity is defined by Equation (3) as suggested by Strickland [26].
σ = N c R
The tip-speed ratio (TSR), also denoted by the symbol λ , is defined as the relationship between the peripheral speed of the blades and the velocity of free flowing water [27]. This non-dimensional parameter, expressed in Equation (4), is fundamental to evaluate the hydrodynamic performance of the rotor.
λ = ω R U

2.2. Design of Experiments and Turbine Geometric Configuration

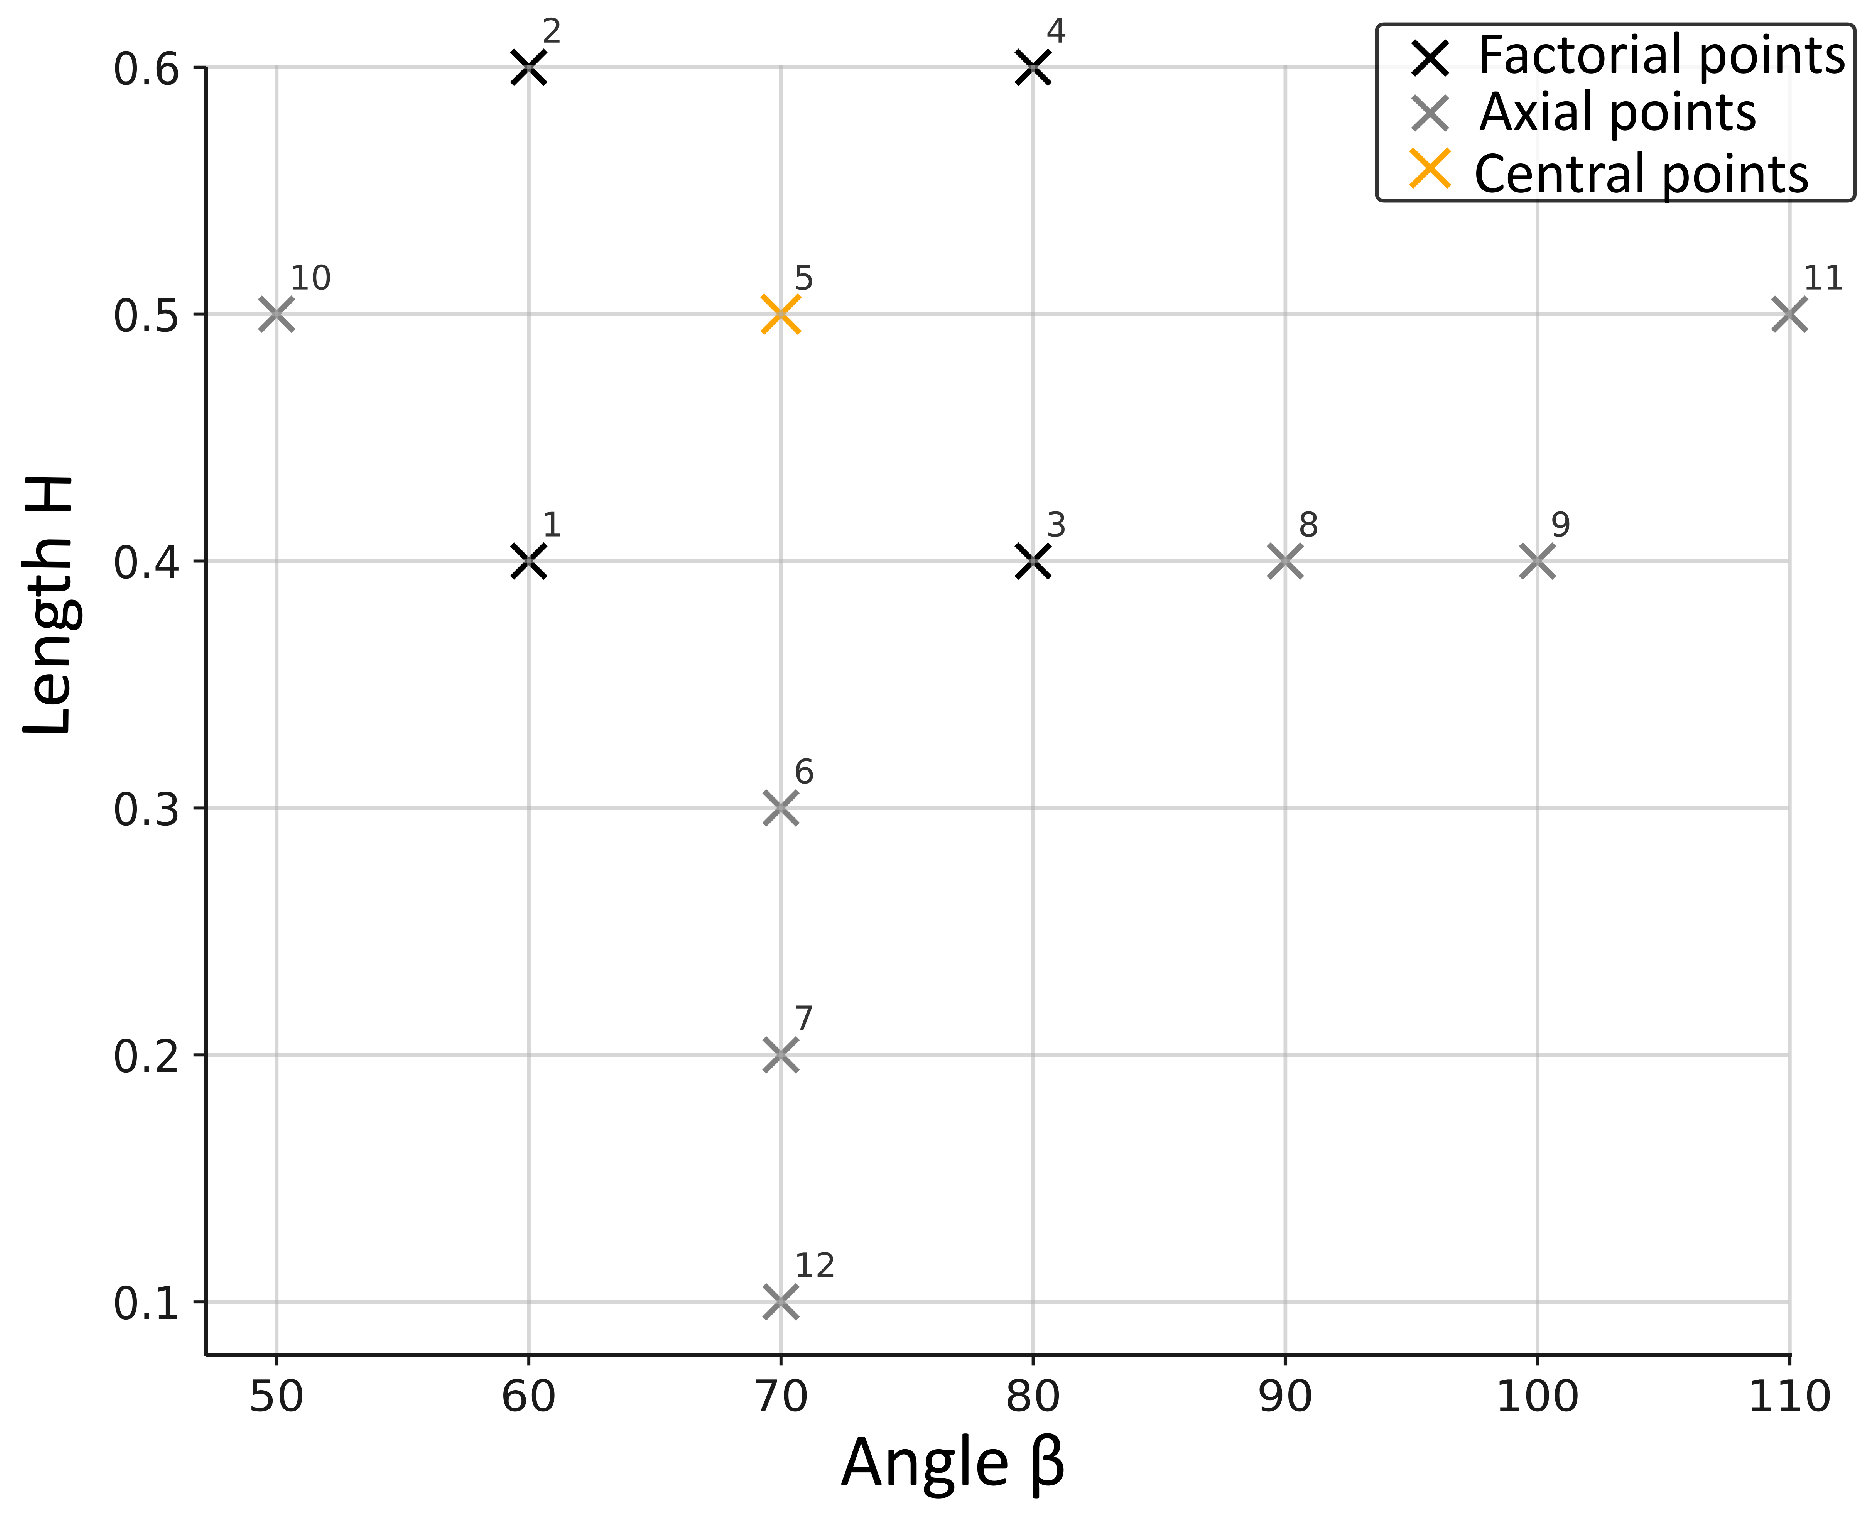
To evaluate turbine performance under different geometric configurations of the external channel, a factorial design of experiments (DoE) was carried out. In this experimental setup, the deflection angle ( β ) and the length (H) of the channel were established as control variables, while Cp was defined as the response variable. Figure 1 presents the process diagram summarizing the methodology applied in the design of experiments. The factorial design incorporated combinations of the minimum and maximum levels of the factors ( β and H), together with replicated center points, to assess the potential curvature in the response surface and improve the estimation of the experimental error. Following this approach, thirteen treatments were defined within the ANSYS 2025 R1 environment: twelve corresponding to the combinations specified in the factorial design matrix with center points, and one additional configuration established as the baseline treatment, which does not have any augmentation channel or external accessory. The values of the experiments are determined from the previous study presented in [20,28], where the best augmentation channel was the flat plate with a geometric configuration equal to treatment 3. From this point, a design of experiments with a central point was carried out, where in the RSM evaluation, the optimality zone indicated that axial displacement was required, from which the additional treatments allow the nature of the model to be captured.
Two-dimensional (2D) geometric models were developed using ANSYS SpaceClaim 2025 R1. The selection of the blades and the external channel evaluated was based on the methodology proposed by Guevara-Muñoz et al. [20]. A NACA 0018 hydrofoil with a solidity equal to 1.0 was used.
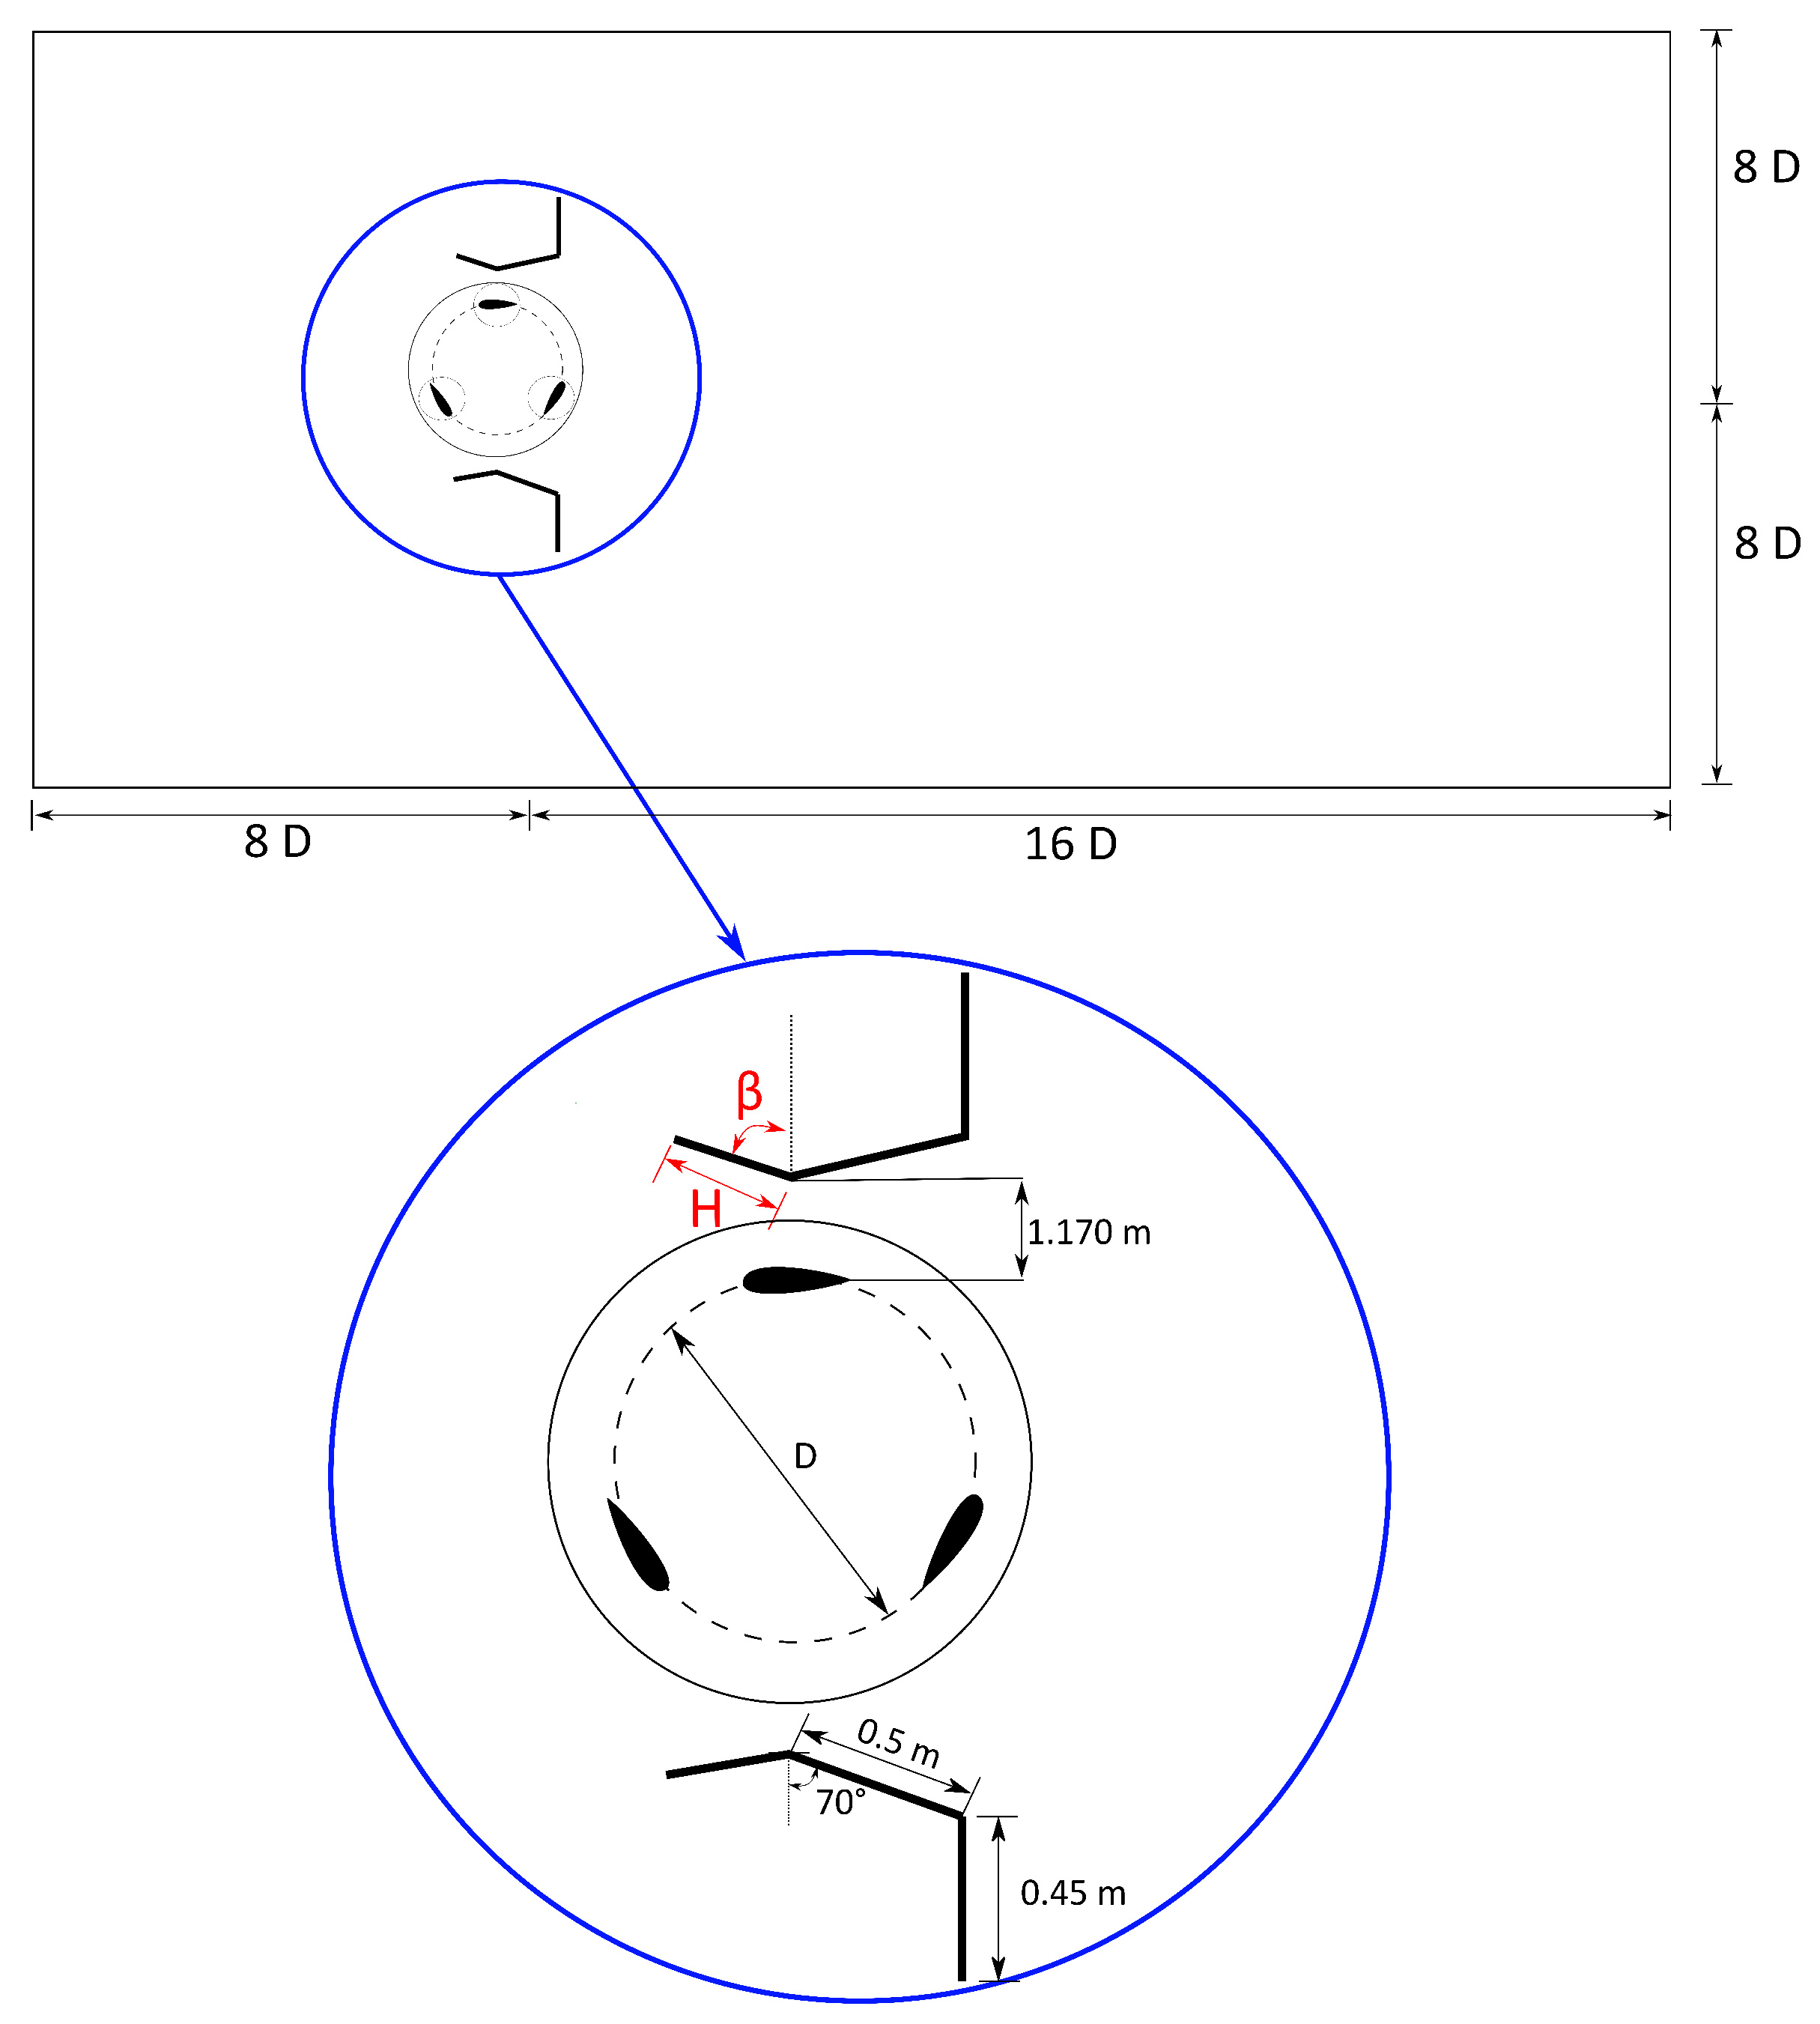
Figure 2 presents the dimensions and variable design parameters of the external channel, defined by the angle β and the length H, as well as the overall dimensions of the computational domain used for the simulations following the methodological recommendations described in [29]. The lower zoom in the Figure 2 highlights the rotating domain and its associated components within the numerical model. In this diagram, D corresponds to the rotor diameter, with a value of D = 0.9 m, and the relative position of the rotating domain with respect to the stationary domain is illustrated
Table 1 presents the parameters of the experimental design considered, their symbols, and the values assigned in the factorial design. It also shows the combinations of the angle of deflection β and length H factors that make up the different treatments defined in DoE.

2.3. Mesh and Computational Configuration

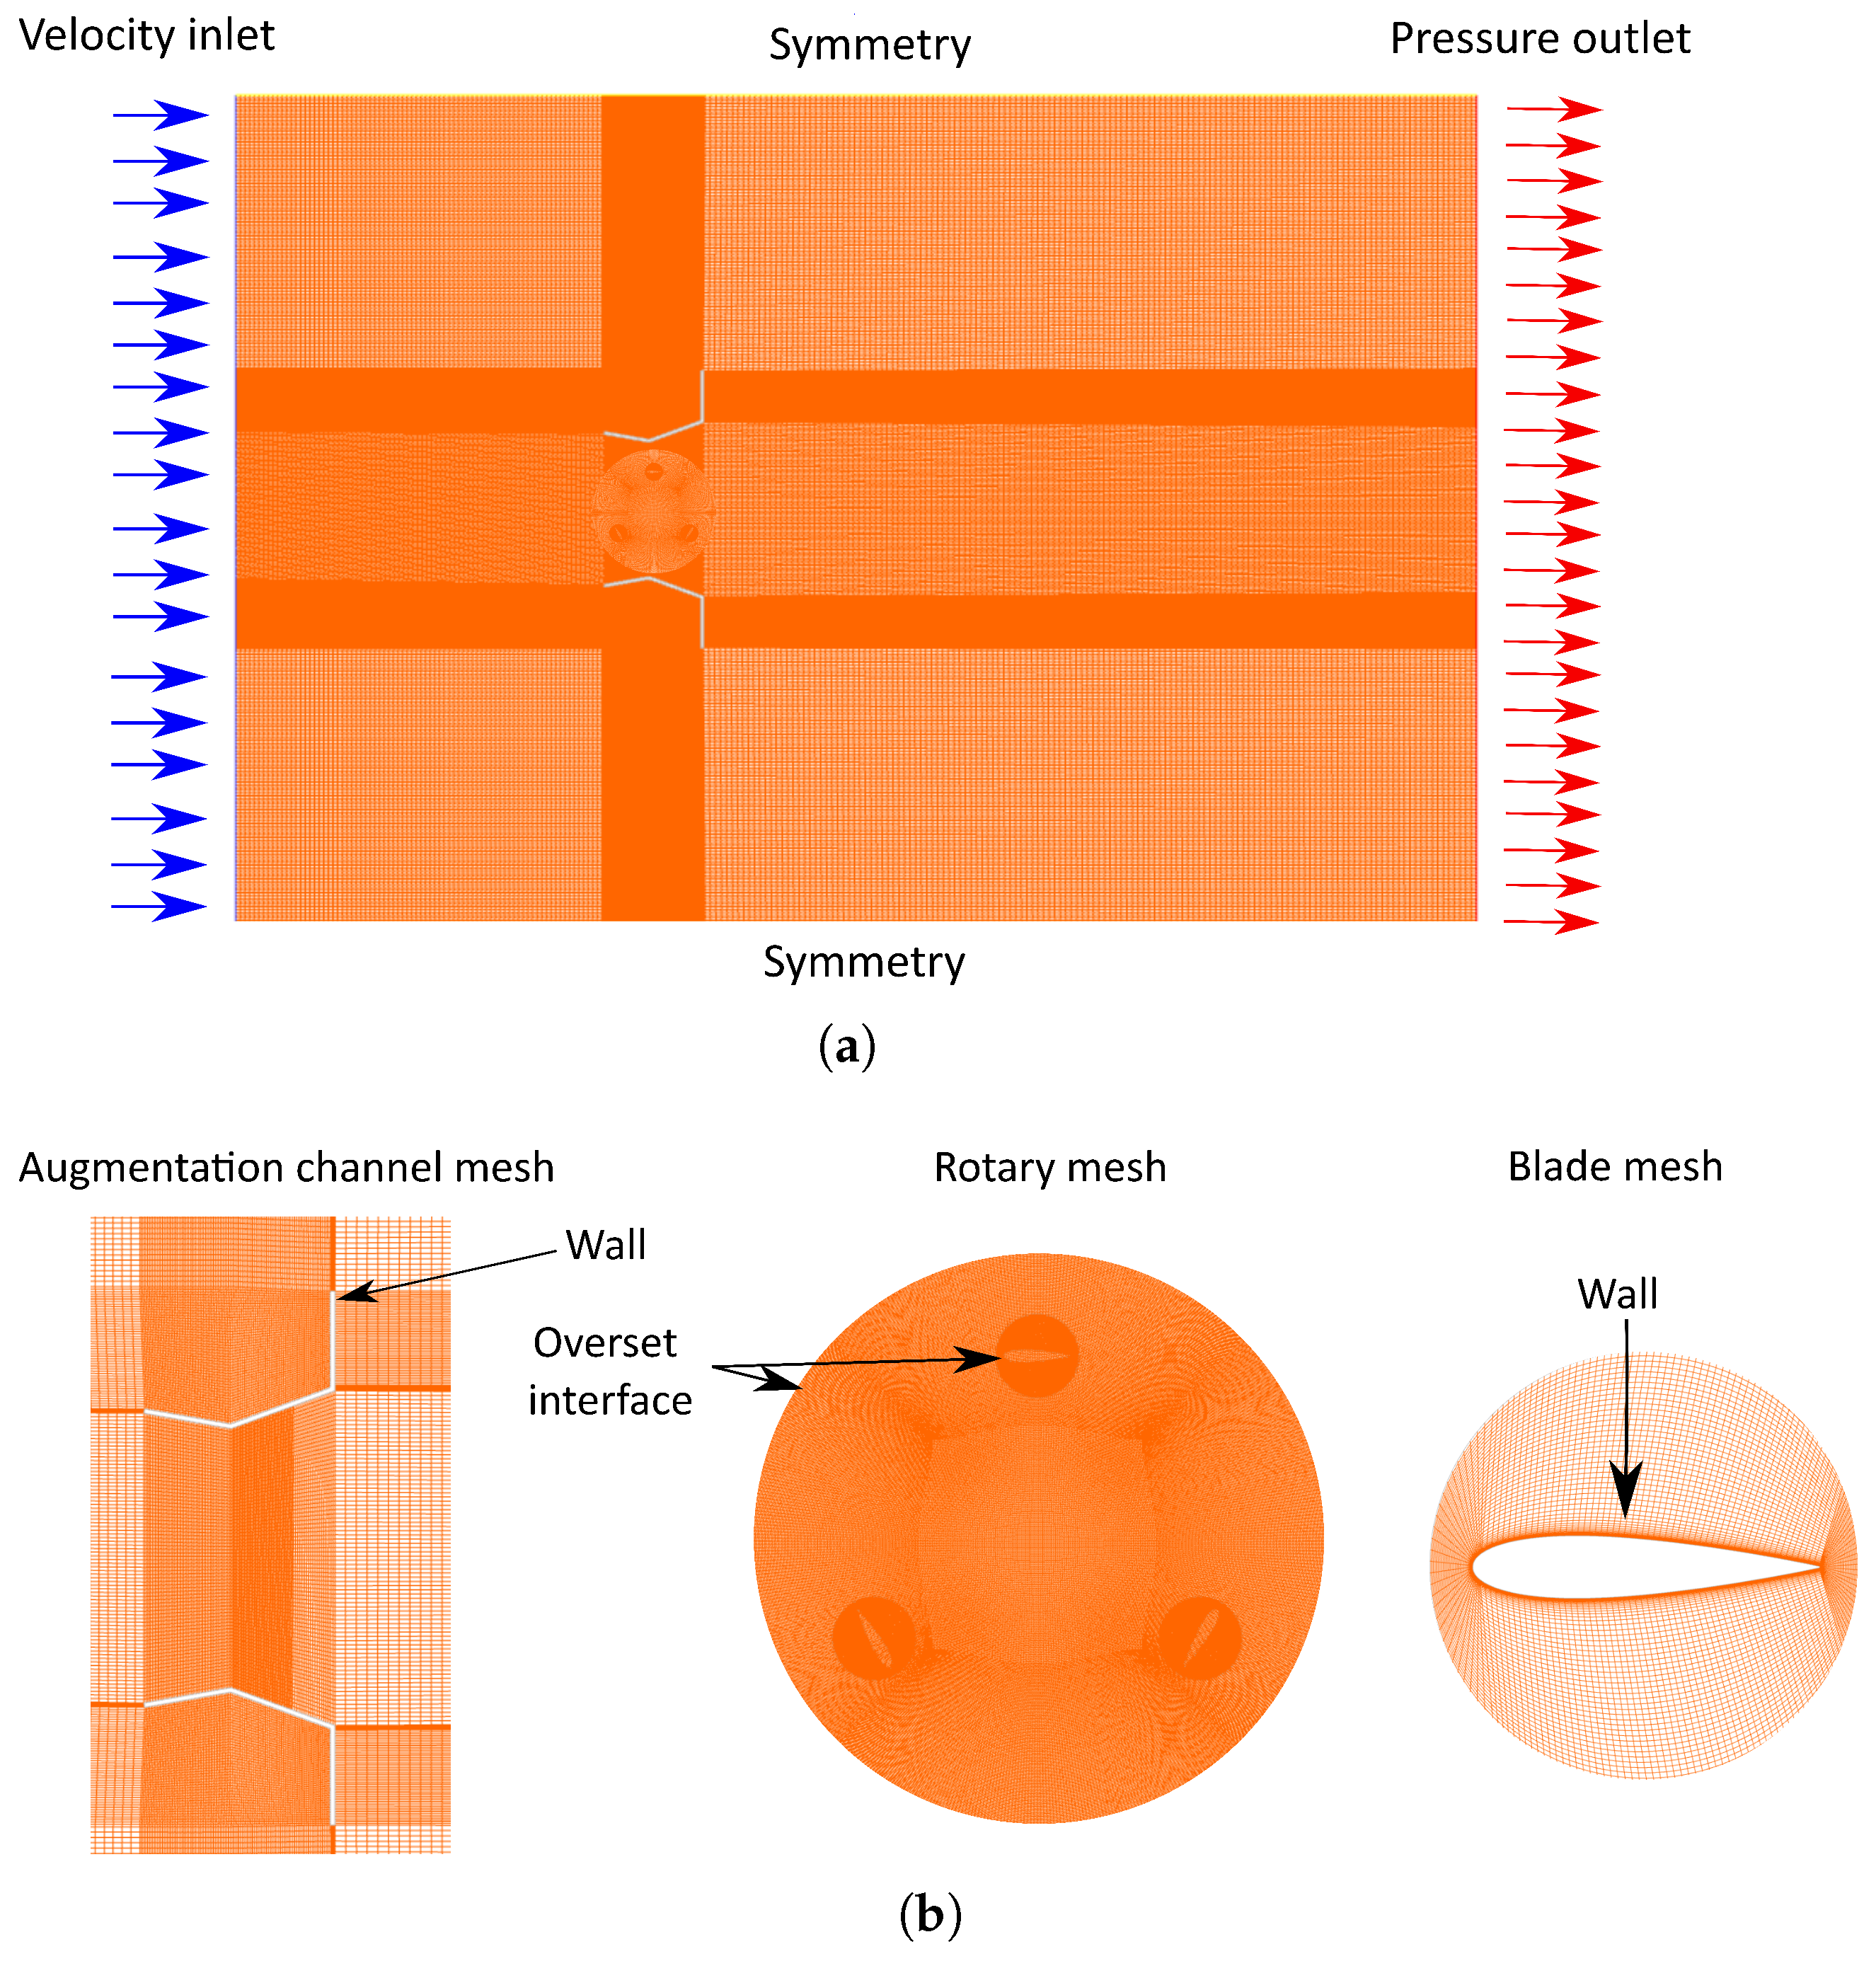
The models were discretized using the overset mesh approach in ANSYS ICEM CFD to facilitate the coupling between the moving and stationary regions, while maintaining numerical stability and accuracy at the interface zones. Each turbine component was meshed separately and structured into two main regions: the rotary domain and the static domain. The rotary domain consisted of three blades uniformly distributed around a circumference that represented the turbine rotor. The static domain was defined as a flow channel, within which the variation in the design parameters associated with the flat plate accessory external channel was included. Likewise, the computational domain was meshed without the external channel as a channel without an accessory, which represents the baseline treatment. This treatment allowed evaluating the influence of the accessory geometry on the flow field and, consequently, on the turbine performance. Figure 3 illustrates the main features of the computational domain used in the simulations. A uniform velocity profile was assumed at the domain inlet, which remained constant for all treatments, while a zero gauge pressure condition was imposed at the outlet. Symmetrical boundary conditions are applied to the upper and lower surfaces of the domain, since the flow is in the open domain. Figure 3a shows the overlapping meshes, while Figure 3b shows each mesh separately along with the corresponding boundary conditions, including the overlapping mesh interfaces (overset condition) and the anti-slip wall conditions applied to the turbine blades.
A mesh convergence study was performed on treatments 3 and 9 to verify the stability and independence of the results with respect to the number of cells. To this end, different mesh configurations were generated and applied to the computational domain, with localized refinement in the rotor–channel interaction region and in the vicinity of the external accessory. Three successive grids were constructed with progressively decreasing cell sizes, corresponding to a fine grid (M1), an intermediate grid (M2), and a coarse grid (M3). The same number of nodes was used for the study of both treatments 3 and 9. The results were evaluated using the Grid Convergence Index (GCI) method [30] to determine the apparent order of convergence and to estimate the extrapolated solution as the cell size approaches zero. Relative refinement ratios, which quantify the relationship between consecutive mesh sizes, are defined by Equation (5).
r 21 = h 2 h 1 ; r 32 = h 3 h 2
where h 1 , h 2 , and h 3 denote the characteristic cell sizes of the fine, intermediate, and coarse meshes, respectively.
The apparent order of convergence quantifies the rate at which the numerical solution approaches the exact value as the mesh is progressively refined. This parameter is formally defined by Equation (6).
p = ln ϕ 3 ϕ 2 ϕ 2 ϕ 1 ln ( r ) , r = average r 21 , r 32
where ϕ 1 , ϕ 2 , and ϕ 3 correspond to the variable selected as the convergence criterion. In this study, the average moment was employed as the convergence variable for the fine, intermediate, and coarse meshes, respectively.
Richardson extrapolation can only be applied when the convergence behavior is monotonic, meaning that the numerical solution approaches the asymptotic (grid-independent) value consistently as the mesh is refined. Under this condition, the extrapolated value of the variable of interest, ϕ e x t , can be obtained using the Richardson extrapolation expression shown in Equation (7).
ϕ e x t = r 21 p ϕ 1 ϕ 2 r 21 p 1
In this equation, ϕ 1 and ϕ 2 represent the numerical solutions obtained with the fine and coarse grids, respectively; r 21 denotes the grid refinement ratio; and p is the observed order of convergence. The equation allows estimating the asymptotic (exact) value of the variable by eliminating the leading-order discretization error term. To evaluate the difference between consecutive grid solutions, the relative errors are computed as defined in Equation (8).
E 21 = ϕ 1 ϕ 2 , E 32 = ϕ 2 ϕ 3
The Grid Convergence Index (GCI) proposed by Roache provides a normalized and quantitative estimate of the discretization error. It expresses estimated uncertainty as a percentage and incorporates a safety factor, F s , which depends on the number of grids used in the refinement study. For a three mesh analysis, a recommended value of F s = 1.25 is generally applied. The GCI for the fine and coarse grid pairs is computed using Equation (9).
GCI 21 , fine = F B E 21 ϕ 1 r 21 p 1 , GCI 32 , course = F B E 32 ϕ 2 r 32 p 1
where E 21 and E 32 represent the relative errors between successive grid solutions r 21 and r 32 are the grid refinement ratios, and p is the observed order of convergence. The GCI thus provides a standardized metric to evaluate grid convergence and compare the numerical uncertainty between different grid resolutions. To ensure that the grid refinement study lies within the asymptotic convergence range, the asymptotic range indicator, I, is evaluated according to Equation (10). A value of I close to unity indicates that the solutions are within the asymptotic range, confirming that the numerical results are consistent with the expected convergence behavior. In practical terms, values of 0.95 I 1.05 are generally recommended to ensure reliable asymptotic convergence [30].
I = GCI 21 GCI 32 r 32 p
The data corresponding to the characteristics of each mesh are presented in Table 2.
Simulations were performed using the ANSYS Fluent module, assuming isothermal and incompressible flow. The behavior of the system was considered transient by the turbulence model, due to the turbine dynamics, using URANS (non-steady Reynolds-averaged Navier–Stokes equations) linked to the realizable k ϵ turbulence model. According to [27], a convergence standard of 1 × 10 4 was defined. A total simulation time of 10 s was selected, and the time step was configured accordingly at 0.005 s [4]. This setup was chosen to ensure that all simulated cases reached a statistically periodic and stable behavior, based on prior numerical experience with similar configurations. Table 3 summarizes the conditions established in the simulation process.
The fluid dynamics solver is based on the Navier–Stokes equations, which are reduced to the Unsteady Reynolds-Averaged Navier–Stokes (URANS) equations. These equations facilitate the incorporation of turbulent effects into the Navier–Stokes equations. The tensor form of this operation is presented in Equation (11) [28,31].
U i t + U i U i x j = 1 ρ P x i + x j v U i x j + U j x i 2 3 δ i j U i x i + x j u i u i ¯
In this research, the realizable k ϵ turbulence model was used due to its ability to accurately capture rotational effects and wake development in hydrokinetic turbines operating at moderate Reynolds numbers, while maintaining a reasonable computational cost compared to other turbulence models available in the solver [32,33]. Since the present study focuses on global performance parameters rather than detailed near-wall flow resolution, this model represents an efficient and reliable choice. The transport equations of k and ϵ associated with this model are presented in Equations (12)–(16).
t ( ρ k ) + x j ( ρ k U j ) = x j μ + μ t σ k k x j + G k + G b ρ ε Y M + S k
( ρ ε ) t + x j ( ρ ε U j ) = x j μ + μ t σ ε ε x j + ρ C 1 S t ρ C 2 ε 2 k + ν ε + C 1 ε ε 2 k C 3 ε G b + S t
where:
C 1 = m a x 0.43 , η η + 5
η = S k ε
S = 2 S i j S i j
where G k represents the generation of turbulent kinetic energy by velocity gradients, G b represents the energy associated with buoyancy, and Y M represents the contribution of compressible turbulence to dissipation. The parameters, σ k and σ ε are the turbulent Prandtl numbers for k and ε , respectively; S k and S ε are user-defined source terms, which were set to zero in the present study.

3. Results and Discussion

3.1. Grid Convergence Analysis

The results of the grid convergence study are presented in Table 4, which summarizes the average moment over a turbine revolution for three mesh densities in treatments 3 and 9. In both cases, the results show a clear trend toward solution stabilization as the mesh is refined, indicating consistent numerical behavior.
For treatment 3, the apparent order of convergence was p = 1.574 , with GCI values of 1.594 % for the fine-to-medium mesh pair and 0.855 % for the medium-to-coarse pair, confirming that the discretization error is within acceptable limits. Similarly, treatment 9 exhibited an apparent order of convergence of p = 1.992 , with GCI values of 1.074 % for the fine-to-medium pair and 0.486 % for the medium-to-coarse pair, indicating an even stronger convergence behavior and lower numerical uncertainty. Considering this balance between numerical accuracy and computational efficiency, the intermediate mesh (M2) was selected for subsequent simulations in both treatments.

3.2. CFD Analysis

Table 5 presents the momentum and Cp values obtained for a TSR of 3.0 in the thirteen treatments evaluated. This TSR value was selected because it corresponds to the operating condition in which the H-Darrieus turbine achieved its best overall performance during the preliminary simulations, making it a suitable benchmark for comparing the effect of geometric modifications. These results particularly highlight treatments 6, 8, 9, and 11, where the adjustment of the angle β and the length H of the external channel positively impacts the dynamic behavior of the turbine, demonstrating improvements in momentum variation.
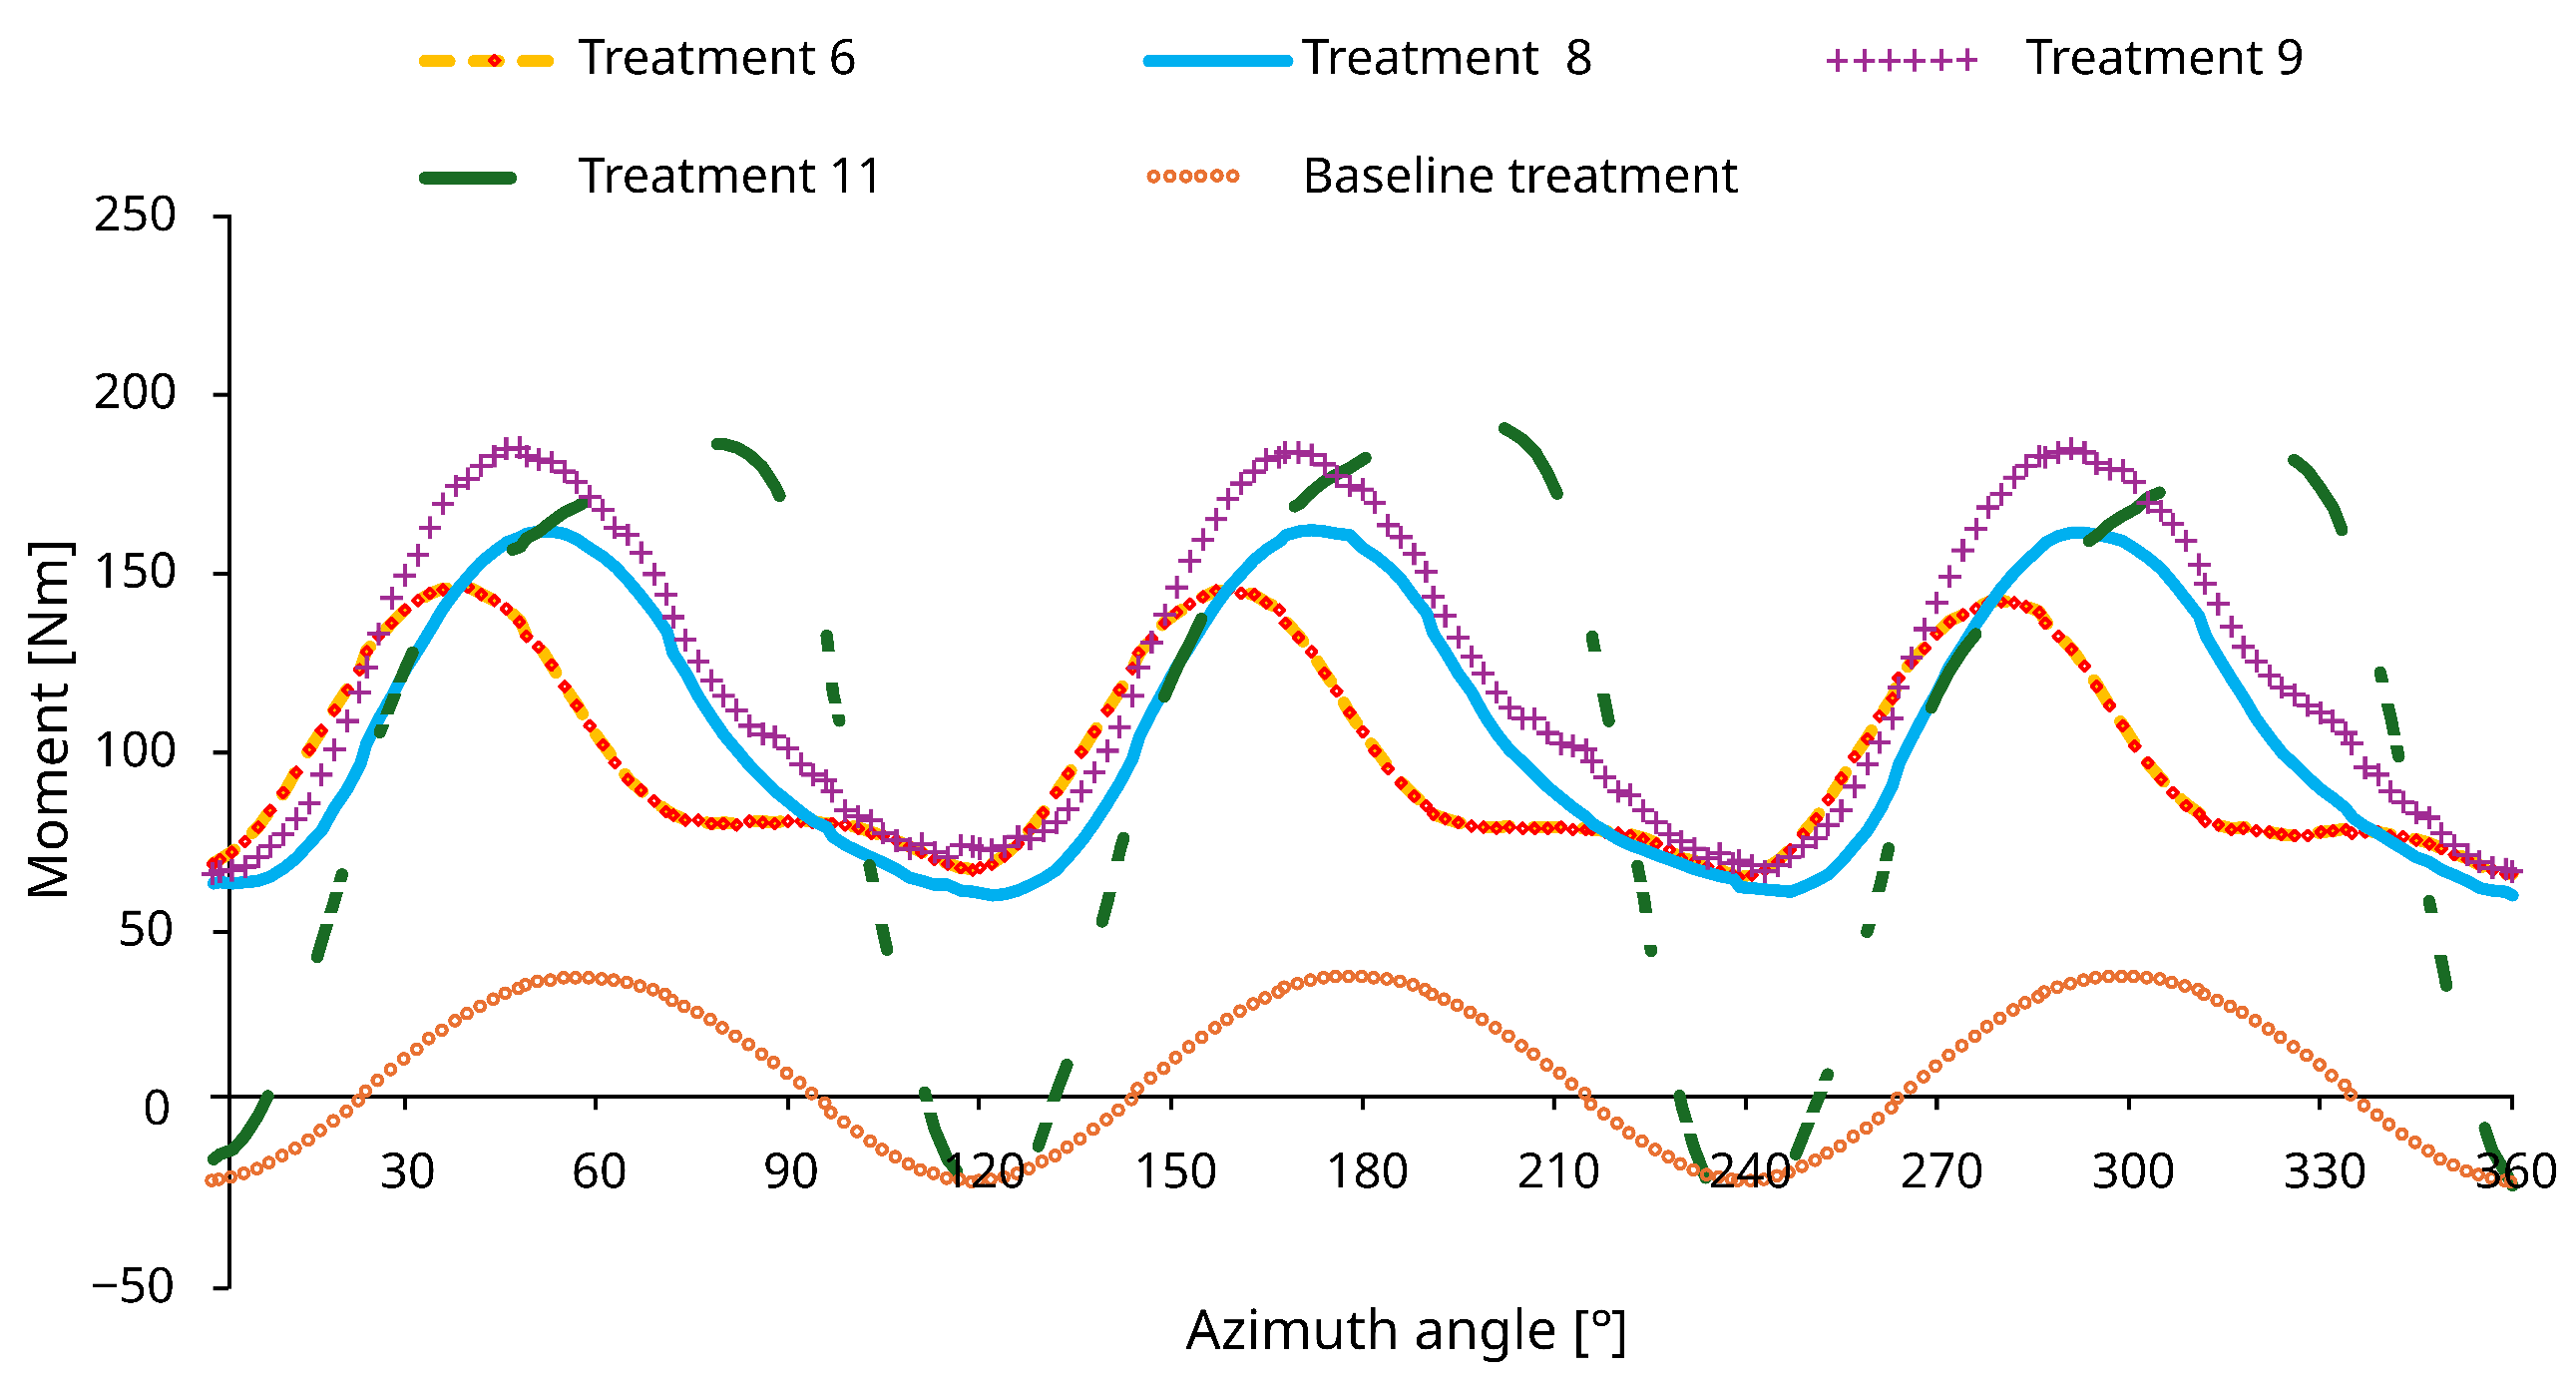
Figure 4 contrasts the evolution of the torque during the last revolution of the turbine for the selected treatments. It is observed that all configurations maintain a characteristic cyclic behavior, although with differences in the amplitude of variation. In treatments 6, 8, and 9, the torque range remains positive throughout the revolution, while treatment 11, despite showing the highest maximum torque value, presents abrupt drops in the valleys, reaching negative torques. This behavior could imply more severe dynamic loads and, consequently, a greater risk of vibrations or structural fatigue problems in real-life applications.
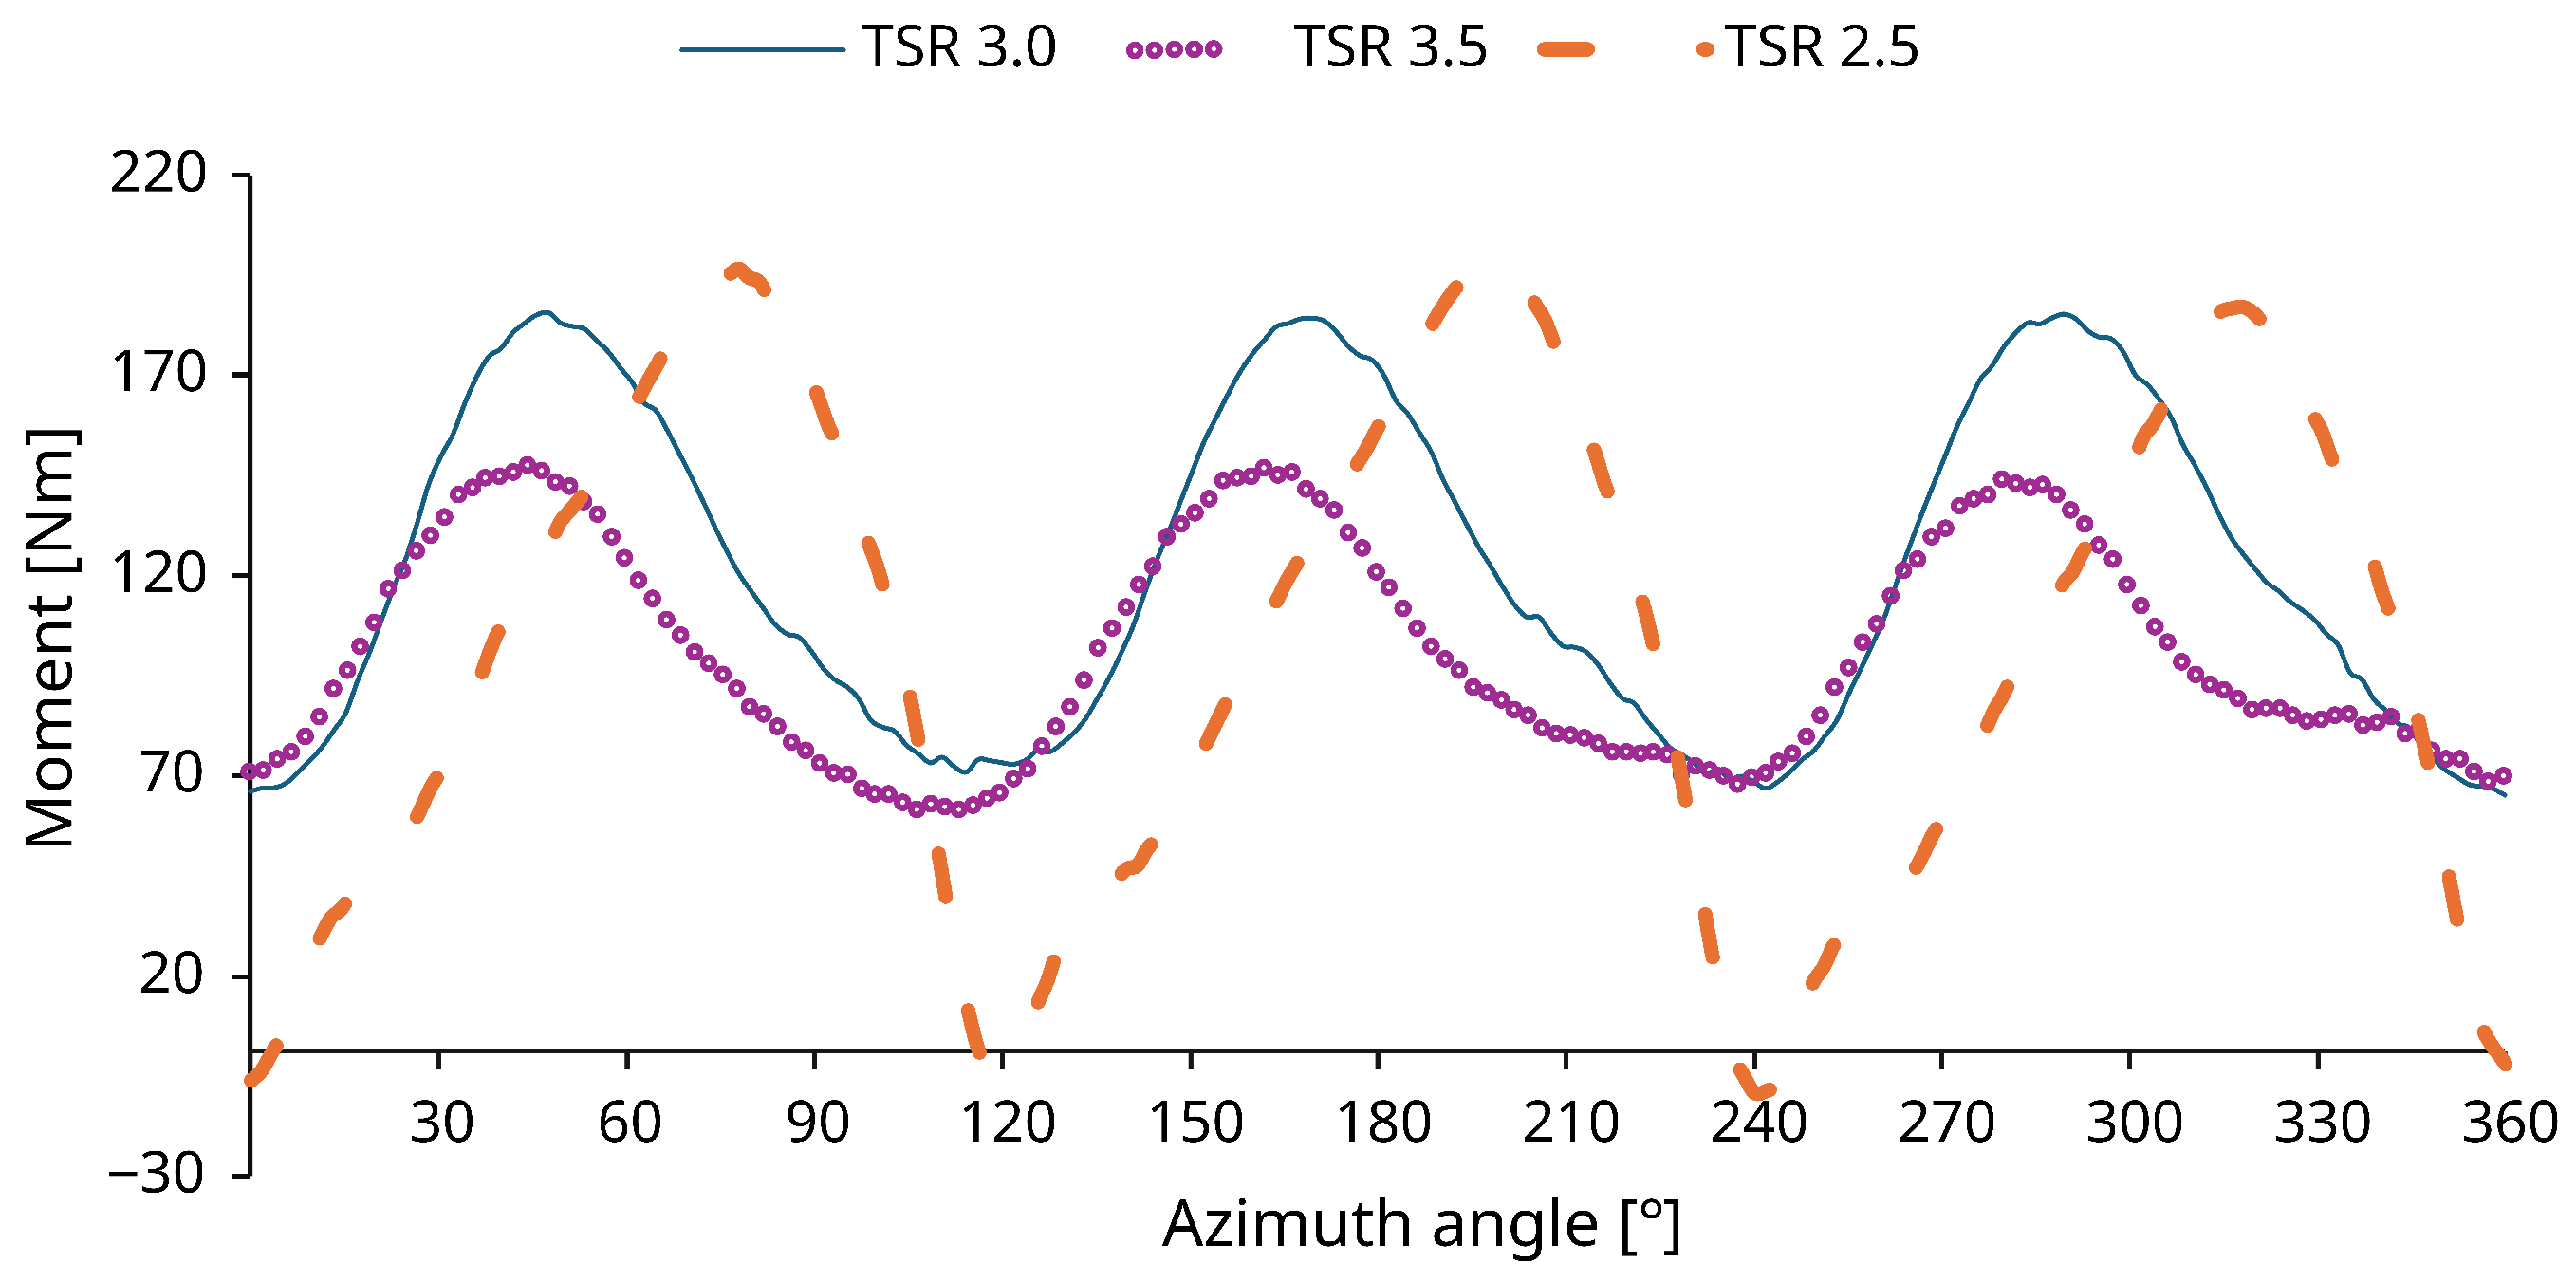
Figure 5 presents the evolution of the momentum for treatment 9 during the last revolution of the turbine, evaluated in a TSR range between 2.5 and 3.5. It is observed that for TSR < 3.0 the momentum presents negative intervals, which indicates that, under these conditions, the relationship between the tangential velocity of the blades ( U θ ) and the velocity of the incident flow ( U ) is not sufficient to generate effective angles of attack that produce positive lift throughout the rotation cycle. Consequently, certain phases occur where the drag exceeds the lift, reducing the overall efficiency. In contrast, starting at TSR = 3.0, the increase in the tangential component U θ relative to U ensures more favorable angles of attack, so that the moment remains clearly positive throughout the revolution. This implies that the turbine operates in a self-sustaining manner and with greater efficiency, by maximizing the contribution of lift and minimizing losses associated with drag. Furthermore, this operating condition may reduce the occurrence of negative torque regions and, consequently, mitigate certain dynamic loads acting on the turbine.
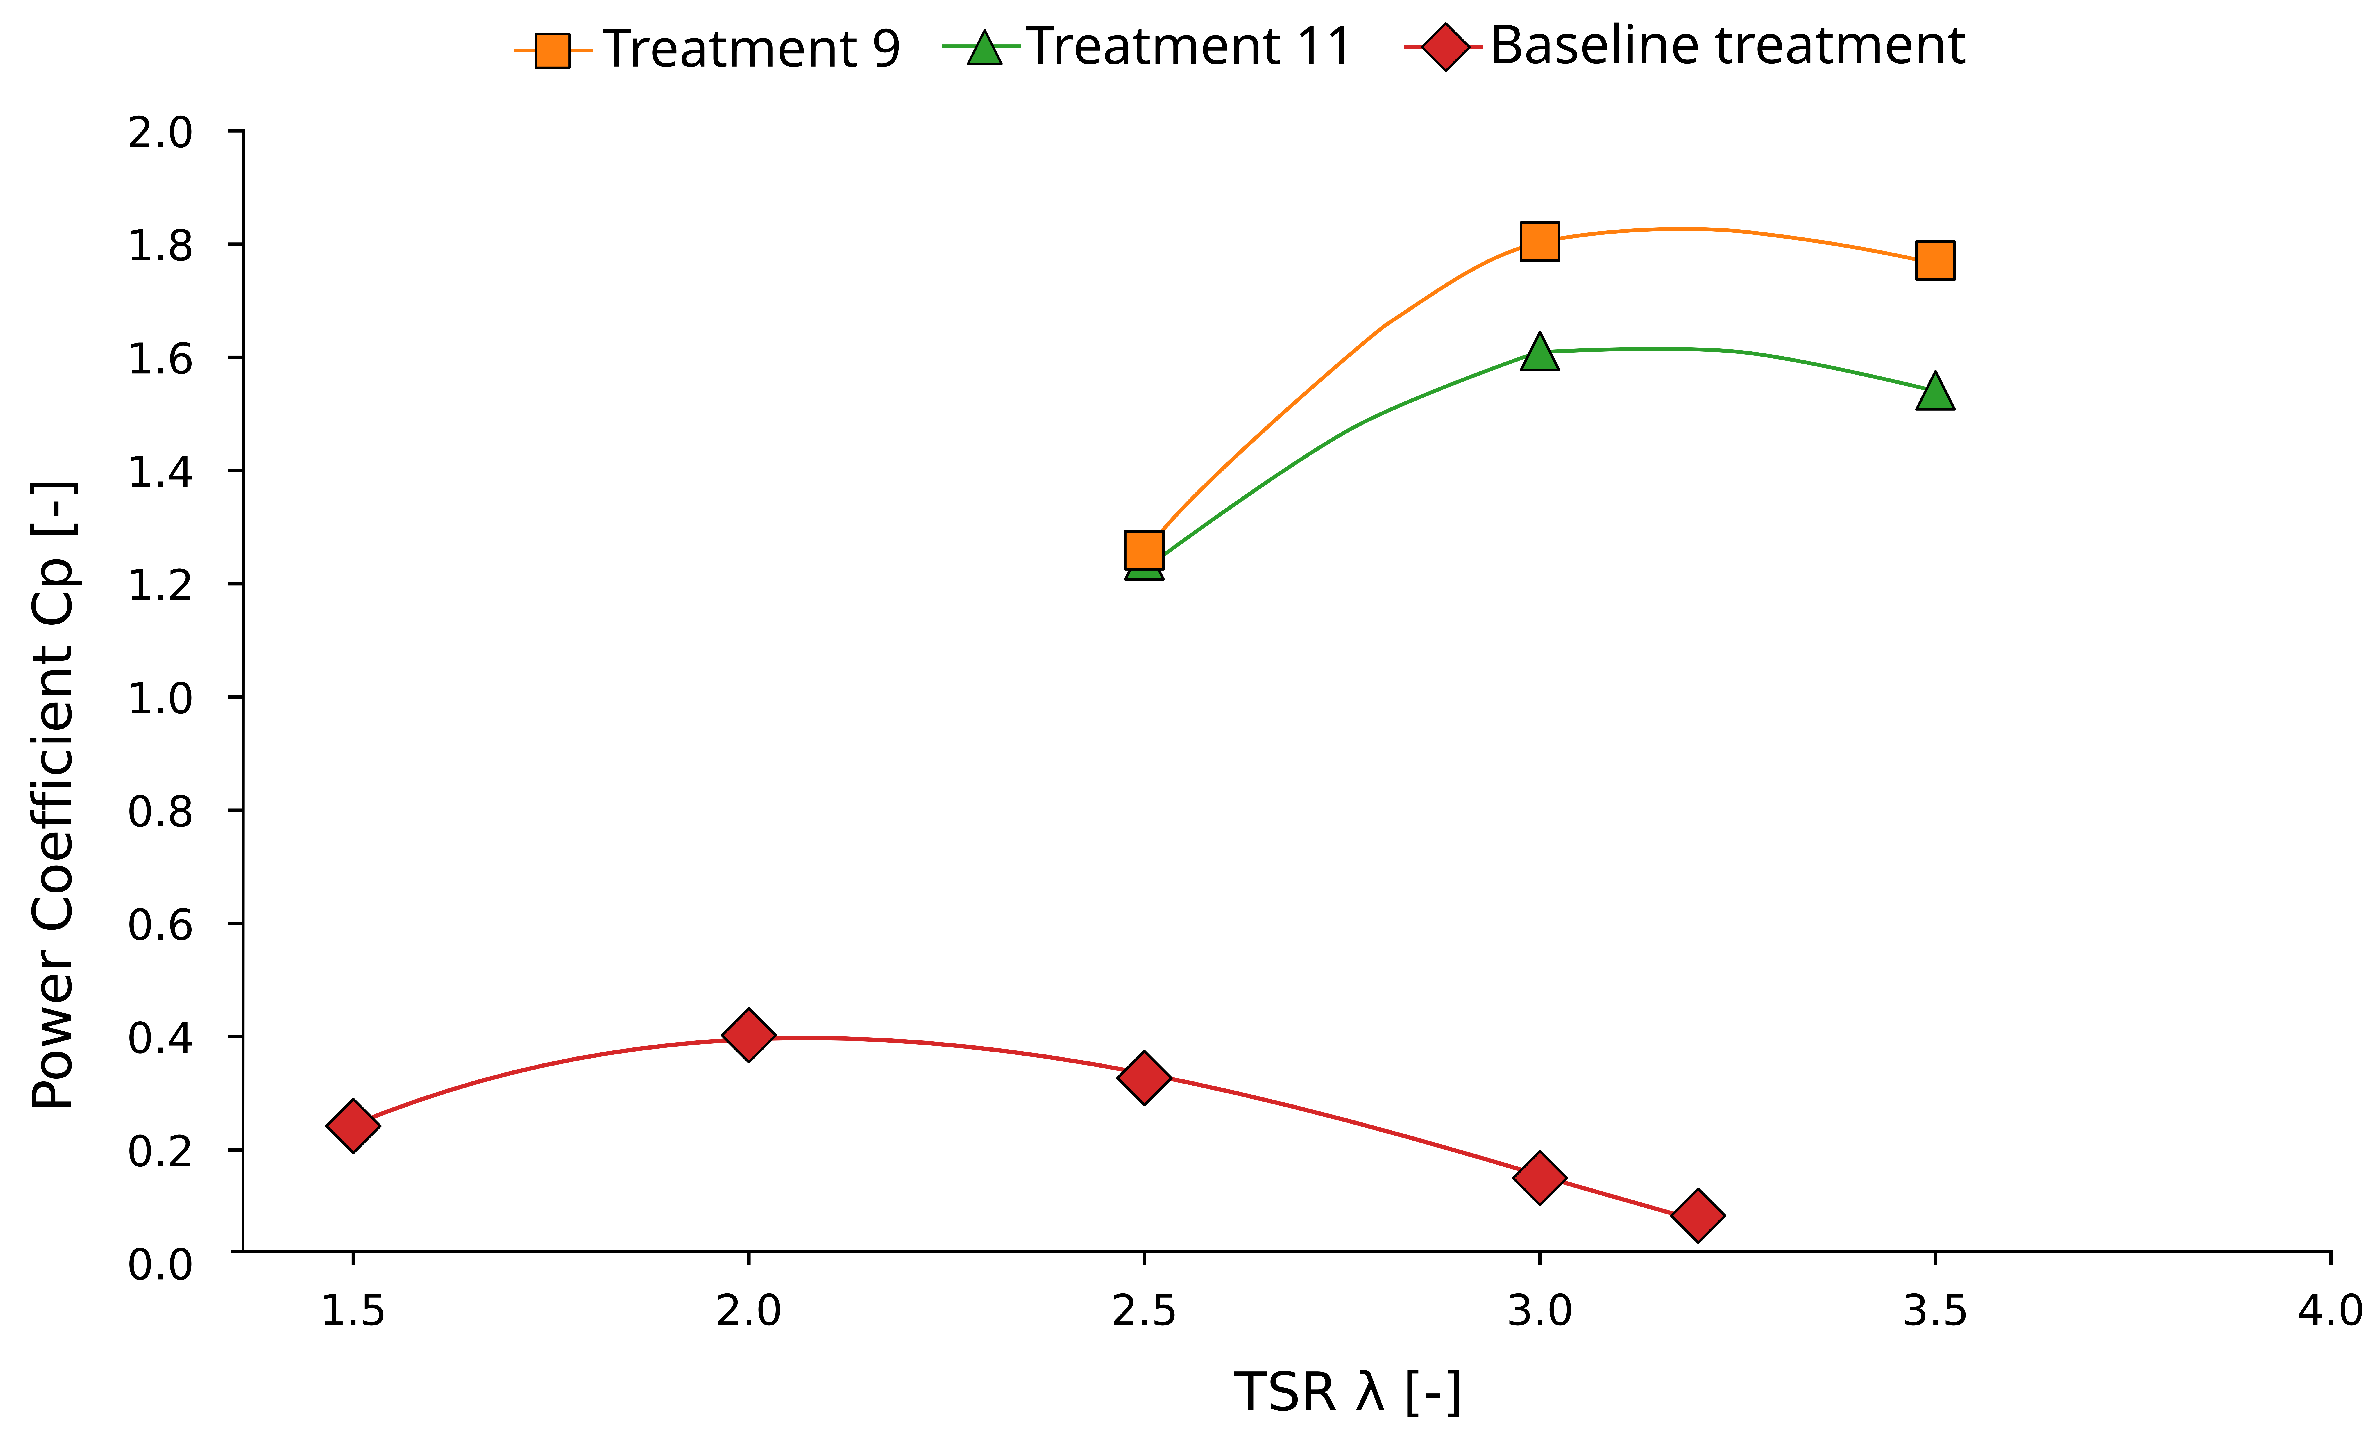
Figure 6 shows the variation in Cp as a function of TSR. It is observed that the incorporation of the external channel significantly modifies the turbine power curve, shifting it towards higher TSR values. This behavior indicates that the geometric variations in the augmentation channels not only amplify the mass flow passing through the rotor, but also alter the structure and dynamics of the incident flow, generating local operating conditions that differ from those assumed in the classical formulation of the Betz limit. In this sense, Cp values that exceed the theoretical limit do not represent a violation of it since this limit is derived for an ideal actuator disk in a uniform, unconstrained flow without acceleration devices. Similar behavior has been reported in configurations with highly turbulent or non-uniform flows [34,35] as well as in systems that incorporate augmentation devices that modify the flow dynamics upstream and inside the turbine [18]. Additionally, the calculation of Cp is usually performed using the inlet velocity of the flow in the channel, rather than the local accelerated velocity within the hydrokinetic system, which reinforces that the observed increase in the power coefficient is associated with the redistribution and concentration of the energy available in the flow, rather than with a physical exceeding of the theoretical Betz limit.
Furthermore, the presence of an external channel expands the turbine’s operating range, increasing its efficiency across a broader spectrum of TSRs. Among the configurations evaluated, treatments 9 and 11 show optimized hydrodynamic performance, achieving Cp values considerably higher than the baseline treatment. Treatment 9 is the most promising, as it not only maintains high Cp values but also exhibits greater robustness against TSR variations, positioning it as a reliable alternative for applications in hydrokinetic environments with variable flow conditions.
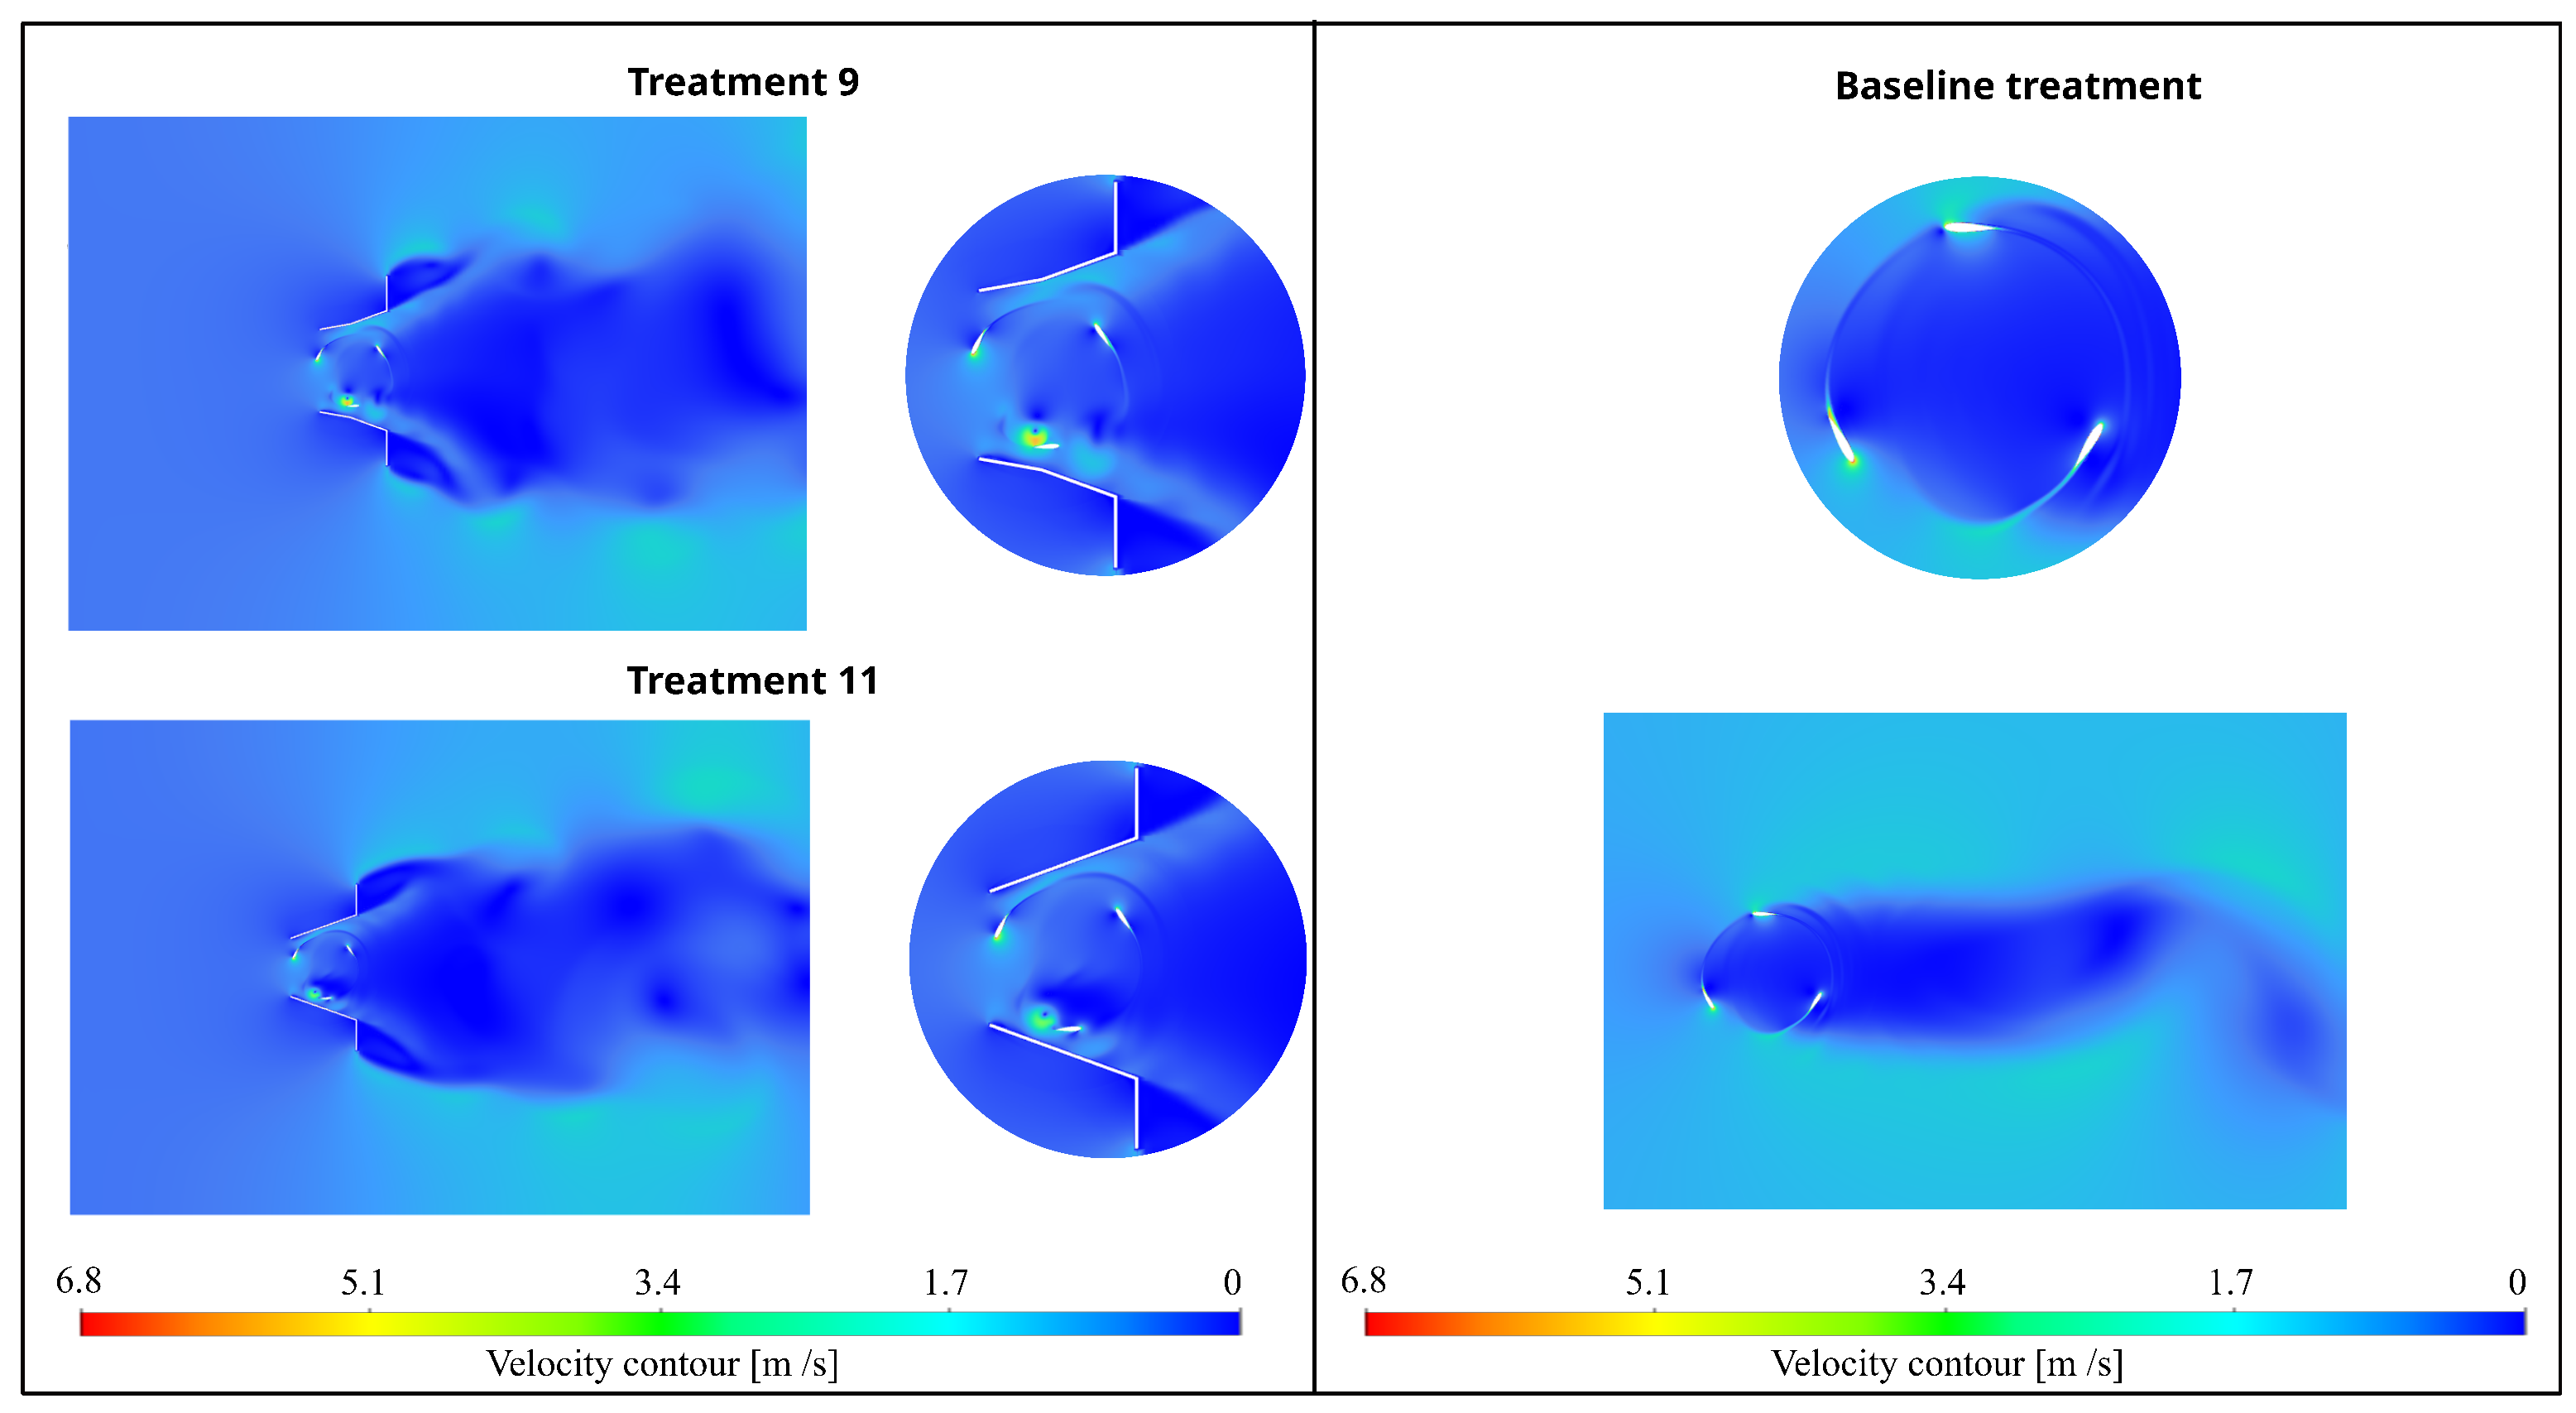
Figure 7 presents the velocity contours for treatments 9 and 11 (left) compared to the baseline treatment (right). Treatment 9 is observed to generate greater local accelerations around the blades compared to treatment 11 and the model without an external channel. This increase in flow velocity in the vicinity of the blades is associated with a greater pressure difference along the blade profile, which in turn enhances lift generation and consequently results in a higher Cp.
In contrast, treatment 11, although it achieves high maximum torque values, does not achieve a uniform increase in flow velocity around the rotor. This explains why its performance, although efficient at certain operating points, is more sensitive to TSR fluctuations and presents abrupt variations that can compromise the dynamic stability of the turbine.
The comparison with the baseline treatment demonstrates the positive effect of the external channel on increasing the effective mass flow through the rotor, confirming the potential of these geometric modifications as hydrodynamic optimization mechanisms. Among the scenarios analyzed, treatment 9 stands out by combining a sustained increase in speed around the blades with more stable behavior in the face of operating variations.

3.3. Statistical Analysis

Data analysis was performed using RStudio version 4.4.2. Based on the simulation results, a response surface methodology (RSM) combined with a linear regression model was employed to evaluate the effects of the external channel angle β and length H on the efficiency of the proposed H-Darrieus turbine. A total of thirteen treatments were analyzed, and the corresponding results are summarized in Table 5.
For the development of the RSM model, two alternative formulations were considered: Model 1 and Model 2, which differed in the inclusion of specific geometric effects and interaction terms. Table 6 presents the summary of Model 1, which includes the estimated coefficients, standard errors, t-values, and p-values, considering a statistical significance threshold of 0.05. The results show that the linear terms are significant, as is the quadratic term H 2 . In contrast, the quadratic term β 2 and the interaction term β H exhibit low t-values, indicating a limited contribution to the model response. Although the cubic terms β 3 and H 3 present marginal significance, their inclusion does not substantially improve the model accuracy and increases its complexity. Following the principle of model parsimony and to avoid overfitting, these cubic terms were therefore excluded from the final model formulation.
The analysis of regression Model 1 shows that it provides an excellent fit to the data. The coefficient of determination ( R 2 = 0.9929 ) indicates that the model explains more than 99 % of the observed variability, demonstrating a high fit capacity of the response surface generated. Similarly, the F statistic (79.4 with 7 and 4 degrees of freedom) and the associated p-value (0.0003973) confirm that the model is highly statistically significant. These results validate the relevance of the fitted regression equation and support its use in predicting Cp within the range of conditions evaluated. In particular, the third-order model obtained constitutes a reliable tool for identifying the maximum Cp value in the study interval, accurately capturing both the main effects and potential curvatures of the response surface.
From RSM Model 1 it is possible to obtain Equation (17), where it is possible to determine Cp from the input values, highlighting that the values of the angle β and length H values are in coded values.
Y = 1.520189 + 0.220193 β 0.197811 H 0.0312823 H 2
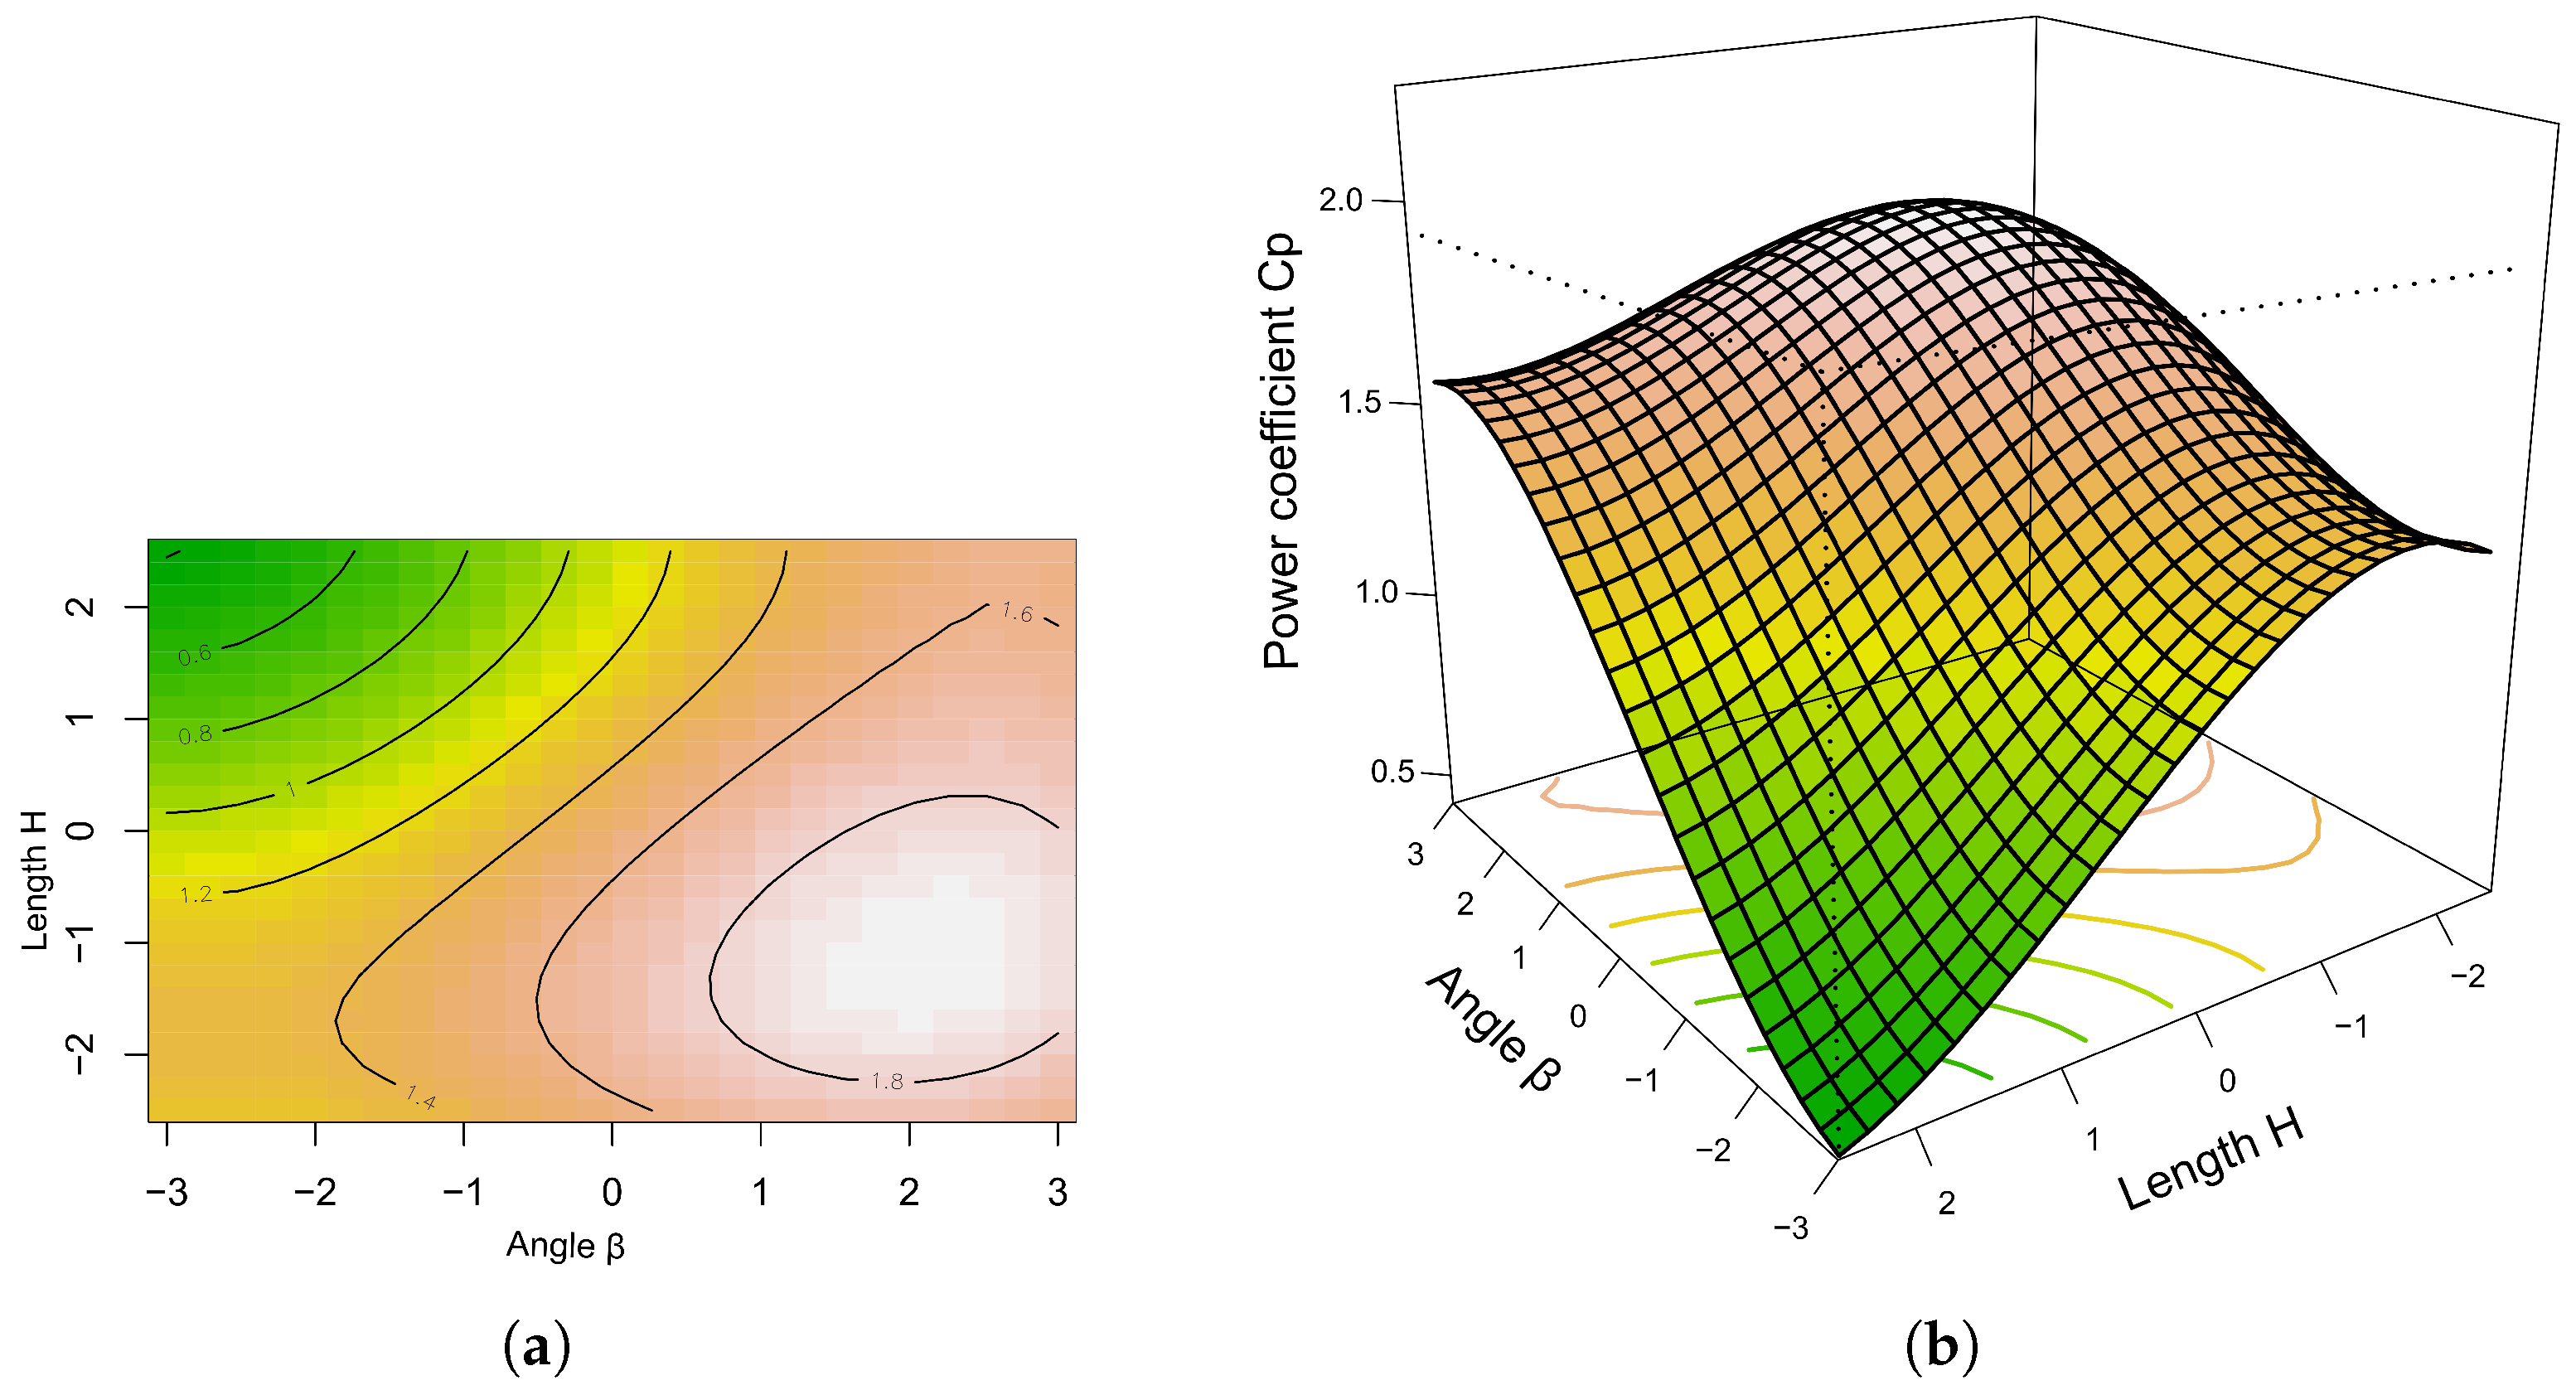
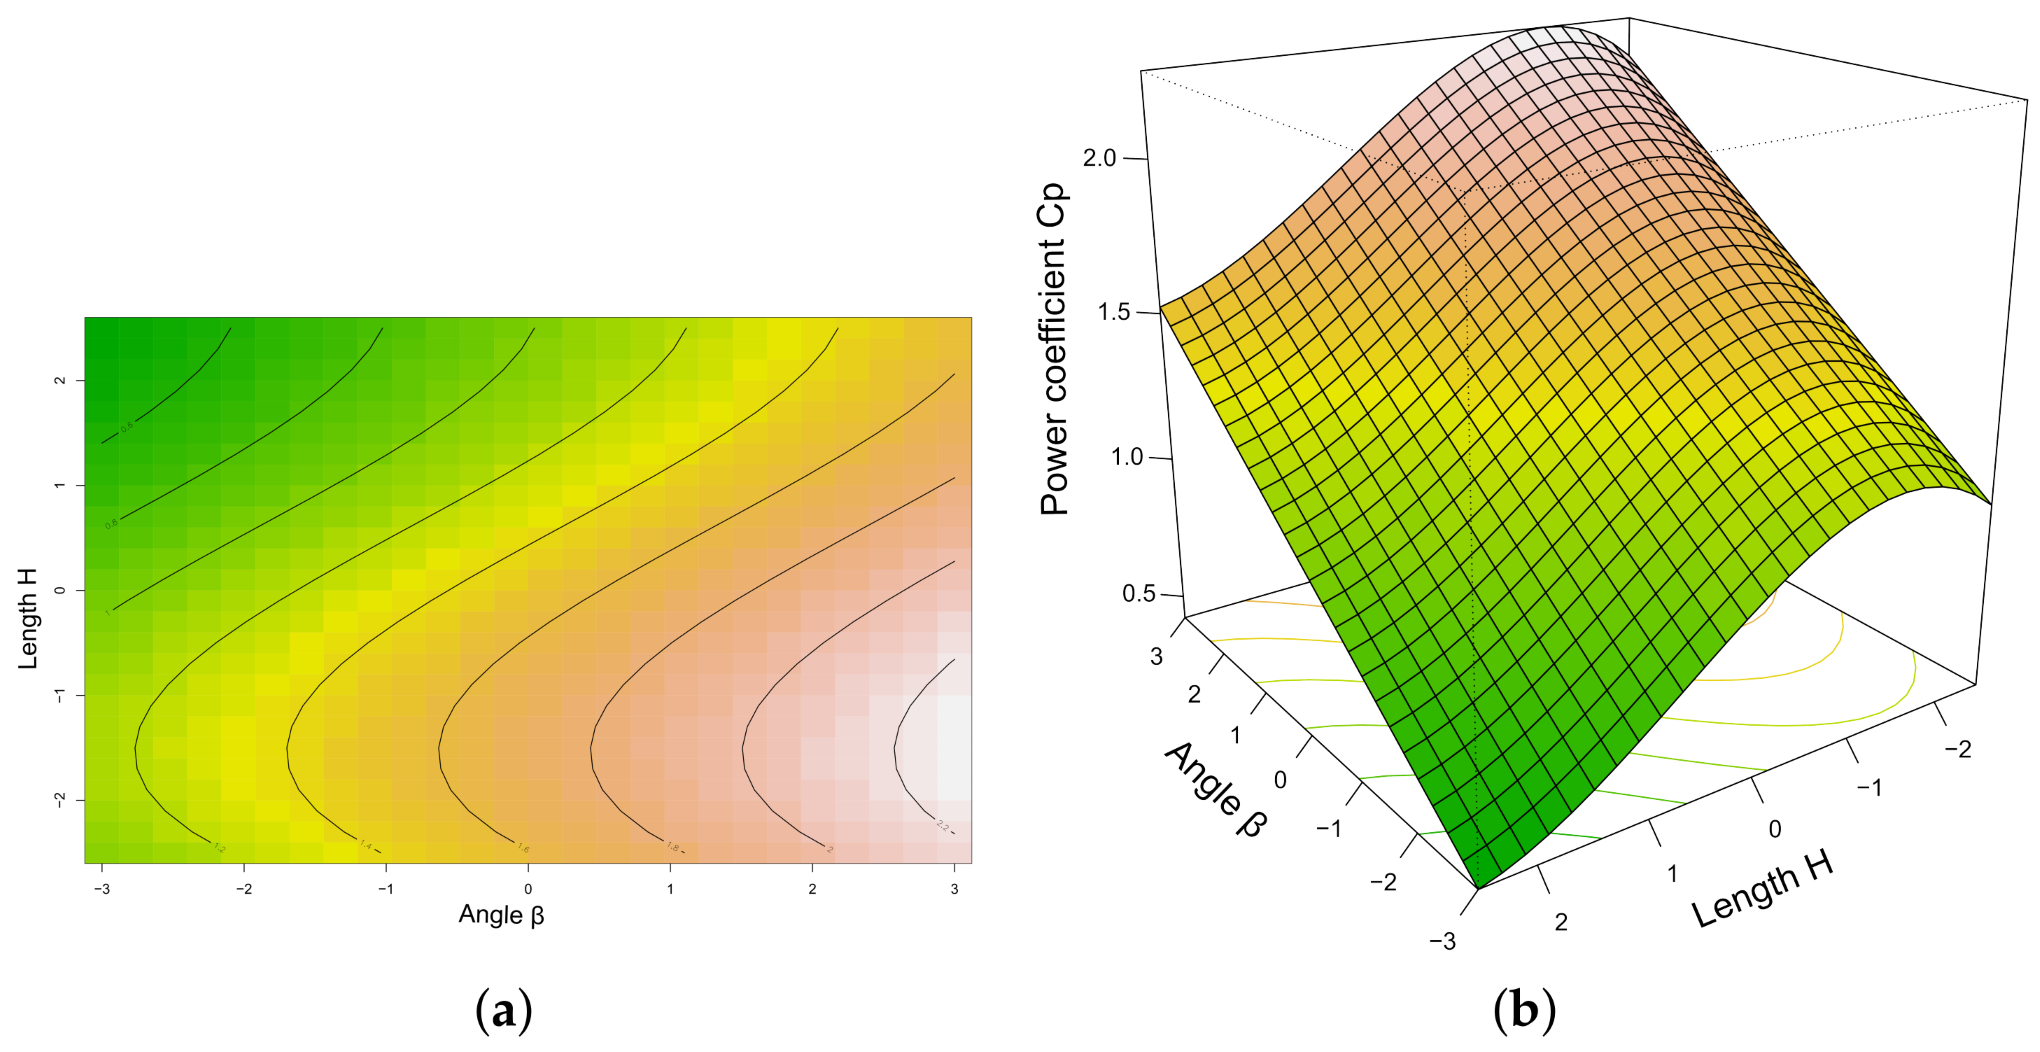
Figure 8a and Figure 8b show the contour map and the response surface, respectively, that correspond to Model 1. It is observed that Cp tends to increase when the channel length H is reduced and, simultaneously, the angle β increases. However, this increase is not strictly linear but rather reflects a complex interaction between both variables. The analysis shows that the angle β exerts the greatest overall effect on turbine performance, by most significantly modifying the direction and magnitude of the flow incident on the rotor, while the length H acts as a modulating factor that adjusts the intensity of the Cp increase.
Model 2 considers only the significant effects identified in Model 1 (see Table 7), also incorporating the cubic term H 3 to account for higher-order nonlinear effects associated with the length. Although this term is marginally significant, its inclusion enables a more accurate representation of the curvature of the response surface related to the length H. Consequently, this effect contributes to improving the overall goodness of fit of the model and provides a more realistic description of the nonlinear influence of H on Cp, without compromising the accuracy of the statistical model.
Table 8 presents the fit metrics for regression Model 2. It can be seen that R 2 and adjusted R 2 values are slightly lower than those obtained in Model 1, indicating that Model 2 offers a marginally poorer fit in the representation of the response surface. However, Model 2 has a greater number of degrees of freedom and a lower p-value, which could offer greater statistical robustness by reducing the risk of overfitting and increasing the reliability of the inferences.
In practical terms, the difference in predictive ability between the two models is minimal, so the choice between them must consider not only the level of fit but also stability and statistical parsimony. Under this criterion, Model 1 may be considered more appropriate, balancing precision and robustness in estimating the effects on Cp.
Equation (18) presents the equation found by the response surface method for Model 2.
Y = 1.505625 + 0.187153 β 0.233159 H 0.033983 H 2 + 0.018021 H 3
Figure 9 shows the response surface obtained for Model 2. Compared to Model 1, this model exhibits more linear and predictable behavior, which facilitates the interpretation of the main effects. Local maxima are not identified within the analyzed domain; instead, a uniform gradient is observed that guides the search for optimal conditions towards higher values of β and lower values of length H. This pattern confirms that Model 2 describes a more stable trend and is less dependent on complex interactions, reinforcing its usefulness to identify geometric configurations that maximize the Cp of the turbine.
Response surface analysis identified the combination of factors that maximizes Cp for the external accessories for the proposed H-Darrieus turbine. Model 1 results indicate that the optimal value is reached for a deflection angle β close to 100° and a channel length of approximately 0.2 m. Under these conditions, the model predicts a maximum Cp of 1.9, which represents a significant improvement over the baseline treatment. This geometric combination favors greater flow acceleration toward the blades and a more efficient redistribution of momentum during the rotation cycle, thus optimizing the turbine’s hydrodynamic performance. In addition, RSM results from Model 2 show a response surface where efficiency peaks at a deflection angle β close to 112° and a channel length H of around 0.15 m. At that point, the model predicts a maximum Cp of 2.2, higher than both the baseline treatment and Model 1. The mesh and subsurface contour lines reveal a pronounced gradient toward the crest, indicating that small variations in β or H outside that region rapidly reduce efficiency.
The comparison between the Akaike Information Criterion (AIC) and the Bayesian Information Criterion (BIC), both designed to assess model fit quality by penalizing model complexity, was conducted. In both treatments, lower values indicate better model performance and contribute to mitigating the risk of overfitting [36]. The results show that Model 1 yields lower AIC ( 29.882 ) and BIC ( 25.518 ) values than Model 2, indicating a more favorable balance between statistical goodness of fit and structural simplicity. The observed differences (7.604 in AIC and 6.151 in BIC) are sufficiently large to be considered relevant, supporting the selection of Model 1 as the most appropriate formulation. Although Model 2 provides a slightly higher predicted Cp, Model 1 exhibits superior parsimony, which favors its robustness and generalization capability within the studied design space, favoring its generalization capacity to new conditions within the study interval.
The findings of this study are consistent with previous research highlighting the positive impact of external accessories or augmentation channels on the performance of H-Darrieus hydrokinetic turbines. Previous numerical investigations using transient two-dimensional simulations have shown that the incorporation of Venturi-type or flat-plate passive mechanisms, combined with appropriate rotor solidity and operating conditions, leads to significant improvements in turbine performance. In particular, studies have reported optimal behavior for configurations employing flat-plate accessories with rotor solidities around 1.0 and a TSR close to 3.0, demonstrating enhanced power coefficients under augmented flow conditions [20,37]. Building upon these findings, the present study further explores the influence of geometric refinement of augmentation channels, showing that targeted modifications of the passive mechanism geometry can lead to additional performance gains. The optimized configuration analyzed herein achieves a power coefficient of up to 1.8 at TSR = 3.0, reinforcing the role of geometric optimization as an effective strategy for enhancing energy extraction in hydrokinetic turbines.
Similar trends have been reported by Tanürün et al. [38], in a study that reported that the M3 configuration (diffuser-nozzle-flange) achieved a 41.18 % increase in moment compared to the baseline case, which is consistent with the results for treatment 9. In this case, the flat-plate accessory with β = 70 ° and H = 0.5 m produced a Cp of 1.8 at TSR = 3.0, which is a considerable improvement over the baseline Cp of around 0.2. Previous studies, along with the results of the present work, indicate that strategically designed flow guides can improve momentum exchange around the blades and reduce pressure losses, resulting in significant performance improvements. Similar behaviors have been reported in aerodynamic studies on the use of deflectors and fairings, where proper flow channeling contributes to greater system efficiency. For example, Zidane et al. [39] demonstrated that a dual-deflector system improved the torque coefficient by 22%, avoiding the negative torque observed at low TSR values. Similarly, Fertahi et al. [40] found that the S1223-RTL fairing profile achieved a maximum Cp of 0.728 at α = 30 ° . Although these studies employed different geometric approaches, such as deflectors and fairings, they all converge on the same principle: external accessories act as flow regulators, concentrating kinetic energy and improving the rotor’s aerodynamic efficiency. Furthermore, the cycloidal diffuser analyzed by Dessoky et al. [41] exhibited an increase in Cp of up to 82%. This is qualitatively similar to the trend observed with the most effective configuration (treatment 9), where modifications to β and H significantly improved turbine efficiency.
In the analyzed configuration, the flow is incident from left to right on the turbine. The external channel acts as a guiding device, modifying the direction and velocity of the incoming stream. The angle β controls the extent to which the flow is redirected toward the rotor. Low values of β produce a moderate deviation, generating a partial increase in effective velocity. While larger angles intensify the concentration of flow over the blade sweep area, increasing the available hydrodynamic momentum. Conversely, the length H determines the extent of the guided stream layer development; longer lengths allow for more progressive flow stabilization and reduce separation losses, although they can also generate blocking effects and higher structural loads. In contrast, shorter lengths induce a more abrupt acceleration effect that benefits start-up and energy capture at low TSRs, but with less uniformity in the velocity field. In conjunction, the interaction between β and H defines the degree of flow concentration and, therefore, the turbine’s ability to increase the power coefficient beyond its performance in free conditions, which would allow the implementation of H-Darrieus turbines in locations with low fluid velocity by magnifying the fluid dynamic conditions of the system.


4. Conclusions

The implementation of an external channel in the H-Darrieus turbine proved to be an effective strategy for enhance the hydrodynamic performance, achieving a maximum power coefficient of 2.2, which represents a substantial increase over the baseline treatment. Statistical analysis using the response surface methodology (RSM) confirmed that the deflection angle β exerts the greatest overall influence on turbine efficiency, while the length H acts as a modulating factor that adjusts the magnitude of the effect. The optimal combination of parameters was identified as β 100 ° and H 0.2 m conditions under which the best performance was obtained. Likewise, the mesh convergence study and statistical validation of the models (AIC, BIC, R 2 , and F-test) ensured the reliability of the results and avoided overfitting problems, highlighting Model 1 as the most suitable due to its balance between fit and parsimony. The comparative analysis showed that treatments 9 and 11 offered notable improvements over the base treatment; however, treatment 9 emerged as the most promising by combining high Cp values with more stable operation in the face of TSR variations. In practical terms, these findings show that incorporating external channels not only increases the turbine’s energy efficiency but also expands its operating range and contributes to greater structural reliability, making it a viable alternative for applications in hydrokinetic environments with variable flow conditions.
The implementation of augmentation channels in hydrokinetic turbines is an effective strategy for improving their performance, as it allows the incident flow to be accelerated and, consequently, increases the power extracted without requiring an increase in the size of the turbine. In this context, the present study demonstrates that geometric optimization plays a fundamental role, given that parameters such as the length and deflection angle of the augmentation channel directly influence fluid–structure interaction and system performance. However, considering that the analysis was limited to these geometric variables, it is recognized that future work could incorporate other geometric parameters, such as the area ratio and coupling with different rotor configurations, in order to further improve hydraulic and mechanical performance along with experimental validation. Thus, augmentation channels are consolidating their position as a promising alternative for increasing the efficiency and competitiveness of hydrokinetic systems.

Author Contributions

Conceptualization, A.J.G.M. and M.A.R.-C.; methodology, I.C.S., A.J.G.M. and E.C.; software, M.A.R.-C. and A.J.G.M.; validation, A.J.G.M., I.C.S. and E.C.; formal analysis, A.J.G.M. and M.A.R.-C.; investigation, M.A.R.-C., I.C.S. and A.J.G.M.; resources, A.J.G.M.; data curation, I.C.S.; writing—original draft preparation, M.A.R.-C., I.C.S. and A.J.G.M.; writing—review and editing, A.J.G.M. and E.C.; visualization, M.A.R.-C.; supervision, E.C.; project administration, A.J.G.M.; funding acquisition, M.A.R.-C., I.C.S., A.J.G.M. and E.C. All authors have read and agreed to the published version of this manuscript.

Funding

This research received no external funding.

Data Availability Statement

The original contributions presented in this study are included in this article. Further inquiries can be directed to the corresponding author.

Acknowledgments

This work was supported by the Instituto Tecnológico Metropolitano de Medellín (Colombia), under the research groups of Advanced Computing and Digital Design (SeCADD) and mathematical modeling, which belongs to the research group of Advanced Materials and Energy (MATyER), and contributes to the development of the project entitled “Desarrollo de un sistema de picogeneración eléctrica mediante una turbina hidrocinética híbrida H-Darrieus/Savonious para una ZOMAC en el Oriente Antioqueño”. It was also supported by Universidad de Antioquía under the research group GEA.

Conflicts of Interest

The authors declare no conflicts of interest.

Abbreviations

The following abbreviations are used in this manuscript:
CFDComputational Fluid Dynamics
VAWTVertical Axis Water Turbines
HAWTHorizontal Axis Water Turbines
TSRTip-Speed Ratio
CpPower Coefficient
CtTorque Coefficient
GCIGrid Convergence Index
DoEDesign of Experiments
RSMResponse Surface Methodology
BICBayesian Information Criterion
AICAkaike Information Criterion

References

  1. Jin, X.; Zhao, G.; Gao, K.; Ju, W. Darrieus vertical axis wind turbine: Basic research methods. Renew. Sustain. Energy Rev. 2015, 42, 212–225. [Google Scholar] [CrossRef]
  2. Howell, R.; Qin, N.; Edwards, J.; Durrani, N. Wind tunnel and numerical study of a small vertical axis wind turbine. Renew. Energy 2010, 35, 412–422. [Google Scholar] [CrossRef]
  3. Alqurashi, F.; Mohamed, M.H. Aerodynamic Forces Affecting the H-Rotor Darrieus Wind Turbine. Model. Simul. Eng. 2020, 2020, 1368369. [Google Scholar] [CrossRef]
  4. Mohamed, M.H. Performance investigation of H-rotor Darrieus turbine with new airfoil shapes. Energy 2012, 47, 522–530. [Google Scholar] [CrossRef]
  5. Singh, E.; Roy, S.; Yam, K.S.; Law, M.C. Numerical analysis of H-Darrieus vertical axis wind turbines with varying aspect ratios for exhaust energy extractions. Energy 2023, 277, 127739. [Google Scholar] [CrossRef]
  6. Mohan Kumar, P.; Sivalingam, K.; Lim, T.C.; Ramakrishna, S.; Wei, H. Strategies for Enhancing the Low Wind Speed Performance of H-Darrieus Wind Turbine—Part 1. Clean Technol. 2019, 1, 185–204. [Google Scholar] [CrossRef]
  7. Sengupta, A.R.; Biswas, A.; Gupta, R. Studies of some high solidity symmetrical and unsymmetrical blade H-Darrieus rotors with respect to starting characteristics, dynamic performances and flow physics in low wind streams. Renew. Energy 2016, 93, 536–547. [Google Scholar] [CrossRef]
  8. Nasef, M.; El-Askary, W.; Ashmawy, A.; Abd Elhamid, A.M. Experimental study on enhancing the performance of hydrokinetic integrated Darrieus-Savonius rotor in open water-channel. Renew. Energy 2024, 236, 121443. [Google Scholar] [CrossRef]
  9. Benchikh Le Hocine, A.E.; Jay Lacey, R.W.; Poncet, S. Multiphase modeling of the free surface flow through a Darrieus horizontal axis shallow-water turbine. Renew. Energy 2019, 143, 1890–1901. [Google Scholar] [CrossRef]
  10. Eltayesh, A.; Castellani, F.; Natili, F.; Burlando, M.; Khedr, A. Aerodynamic upgrades of a Darrieus vertical axis small wind turbine. Energy Sustain. Dev. 2023, 73, 126–143. [Google Scholar] [CrossRef]
  11. Mohamed, O.S.; Ibrahim, A.A.; Etman, A.K.; Abdelfatah, A.A.; Elbaz, A.M.R. Numerical investigation of Darrieus wind turbine with slotted airfoil blades. Energy Convers. Manag. X 2020, 5, 100026. [Google Scholar] [CrossRef]
  12. Sengupta, A.R.; Kumar, Y.; Biswas, A.; Gupta, R. Performance investigation of cavity shaped blade on H-Darrieus wind turbine in built environmental condition. Energy Sources Part A Recover. Util. Environ. Eff. 2022, 47, 2038311. [Google Scholar] [CrossRef]
  13. Yan, Y.; Avital, E.; Williams, J.; Cui, J. Aerodynamic performance improvements of a vertical axis wind turbine by leading-edge protuberance. J. Wind Eng. Ind. Aerodyn. 2021, 211, 104535. [Google Scholar] [CrossRef]
  14. Ardaneh, F.; Abdolahifar, A.; Karimian, S.M.H. Numerical analysis of the pitch angle effect on the performance improvement and flow characteristics of the 3-PB Darrieus vertical axis wind turbine. Energy 2022, 239, 122339. [Google Scholar] [CrossRef]
  15. Rezaeiha, A.; Kalkman, I.; Blocken, B. Effect of pitch angle on power performance and aerodynamics of a vertical axis wind turbine. Appl. Energy 2017, 197, 132–150. [Google Scholar] [CrossRef]
  16. Zouzou, B.; Dobrev, I.; Massouh, F.; Dizene, R. Experimental and numerical analysis of a novel Darrieus rotor with variable pitch mechanism at low TSR. Energy 2019, 186, 115832. [Google Scholar] [CrossRef]
  17. Singh, M.A.; Biswas, A.; Misra, R.D. Investigation of self-starting and high rotor solidity on the performance of a three S1210 blade H-type Darrieus rotor. Renew. Energy 2015, 76, 381–387. [Google Scholar] [CrossRef]
  18. Khan, R.; Kumar, A. Performance enhancement of hydrokinetic turbine using augmentation techniques: A review. Int. J. Green Energy 2023, 21, 1667–1694. [Google Scholar] [CrossRef]
  19. Tunio, I.A.; Shah, M.A.; Hussain, T.; Harijan, K.; Mirjat, N.H.; Memon, A.H. Investigation of duct augmented system effect on the overall performance of straight blade Darrieus hydrokinetic turbine. Renew. Energy 2020, 153, 143–154. [Google Scholar] [CrossRef]
  20. Guevara-Muñoz, A.J.; Hincapie-Zuluaga, D.A.; Rodríguez-Cabal, M.A.; Sierra-Del-rio, J.A.; Colmenares-Quintero, R.F.; Torres-Lopez, E. 2D Numerical Analysis of an H-Darrieus Hydrokinetic Turbine with Passive Improvement Mechanisms. Eng. Trans. 2023, 71, 553–569. [Google Scholar] [CrossRef]
  21. Liu, Z.; Wang, Z.M.; Shi, H.D.; Qu, H.L. Numerical study of a guide-vane-augmented vertical Darrieus tidal-current turbine. J. Hydrodyn. 2019, 31, 522–530. [Google Scholar] [CrossRef]
  22. Patel, V.; Rathod, V.; Patel, C. Optimal utilization of hydrokinetic energy resources through performance improvement of the darrieus turbine using concave and flat blocking plates. Ocean Eng. 2023, 283, 115099. [Google Scholar] [CrossRef]
  23. Guevara-Muñoz, A.J.; Rodriguez-Cabal, M.A.; Zuluaga, D.H. Assessment of H-Darrieus hydrokinetic turbines by configuration with a blocking plate using a Design of Experiment approach. Math. Model. Eng. Probl. 2025, 12, 9–16. [Google Scholar] [CrossRef]
  24. Ramirez, D.; Rubio-Clemente, A.; Chica, E. Design and numerical analysis of an efficient H-Darrieus vertical-axis hydrokinetic turbine. J. Mech. Eng. Sci. 2019, 13, 6036–6058. [Google Scholar] [CrossRef]
  25. Qamar, S.B.; Janajreh, I. A comprehensive analysis of solidity for cambered darrieus VAWTs. Int. J. Hydrogen Energy 2017, 42, 19420–19431. [Google Scholar] [CrossRef]
  26. Strickland, J.H. Darrieus Turbine: A Performance Prediction Model Using Multiple Streamtubes; Technical Report; Sandia Labs.: Albuquerque, NM, USA, 1975. [Google Scholar]
  27. Roy, S.; Saha, U.K. Wind tunnel experiments of a newly developed two-bladed Savonius-style wind turbine. Appl. Energy 2015, 137, 117–125. [Google Scholar] [CrossRef]
  28. Mohamed, M.H.; Hashem, I. Aerodynamic performance enhancements of H-rotor Darrieus wind turbine. Energy 2018, 142, 531–545. [Google Scholar] [CrossRef]
  29. Guevara-Muñoz, A.; Hincapie-Zuluaga, D.; Rio, J.S.D.; Rodriguez-Cabal, M.A.; Torres-Lopez, E. Numerical comparison and efficiency analysis of three vertical axis turbine of H-Darrieus type. EUREKA Phys. Eng. 2023, 2023, 28–39. [Google Scholar] [CrossRef]
  30. Roache, P.J. Perspective: A Method for Uniform Reporting of Grid Refinement Studies. J. Fluids Eng. 1994, 116, 405–413. [Google Scholar] [CrossRef]
  31. Mohamed, M.H.; Dessoky, A.; Alqurashi, F. Blade shape effect on the behavior of the H-rotor Darrieus wind turbine: Performance investigation and force analysis. Energy 2019, 179, 1217–1234. [Google Scholar] [CrossRef]
  32. Daróczy, L.; Janiga, G.; Petrasch, K.; Webner, M.; Thévenin, D. Comparative analysis of turbulence models for the aerodynamic simulation of H-Darrieus rotors. Energy 2015, 90, 680–690. [Google Scholar] [CrossRef]
  33. Marsh, P.; Ranmuthugala, D.; Penesis, I.; Thomas, G. The influence of turbulence model and two and three-dimensional domain selection on the simulated performance characteristics of vertical axis tidal turbines. Renew. Energy 2017, 105, 106–116. [Google Scholar] [CrossRef]
  34. Dabiri, J.O. Theoretical framework to surpass the Betz limit using unsteady fluid mechanics. Phys. Rev. Fluids 2020, 5, 022501. [Google Scholar] [CrossRef]
  35. Lecanu, P.N.; Mouazé, D.; Bréard, J. Theoretical Calculation of Wind (Or Water) Turbine Considering Kinetic and Potential Energy to Exceed the Betz Limit. HAL Open Science. 2023. Available online: https://hal.science/hal-01982516/document (accessed on 1 January 2020).
  36. Dziak, J.J.; Coffman, D.L.; Lanza, S.T.; Li, R.; Jermiin, L.S. Sensitivity and specificity of information criteria. Briefings Bioinform. 2020, 21, 553–565. [Google Scholar] [CrossRef]
  37. Guevara-Muñoz, A.J.; Rodriguez-Cabal, M.A.; Chica, E.; Villa, D.S.; Hincapié Zuluaga, D. Design of Experiments Applied to the Analysis of an H-Darrieus Hydrokinetic Turbine with Augmentation Channels. Sci 2025, 7, 121. [Google Scholar] [CrossRef]
  38. Tanürün, H.E.; Acır, A. Investigation of the hydrogen production potential of the H-Darrieus turbines combined with various wind-lens. Int. J. Hydrogen Energy 2022, 47, 23118–23138. [Google Scholar] [CrossRef]
  39. Zidane, I.F.; Ali, H.M.; Swadener, G.; Eldrainy, Y.A.; Shehata, A.I. Effect of upstream deflector utilization on H-Darrieus wind turbine performance: An optimization study. Alex. Eng. J. 2023, 63, 175–189. [Google Scholar] [CrossRef]
  40. Fertahi, S.e.D.; Belhadad, T.; Kanna, A.; Samaouali, A.; Kadiri, I. Assessment of fairing geometry effects on H-Darrieus hydro turbine performance using 2D URANS CFD simulations. Energy Convers. Manag. 2023, 293, 117434. [Google Scholar] [CrossRef]
  41. Dessoky, A.; Bangga, G.; Lutz, T.; Krämer, E. Aerodynamic and aeroacoustic performance assessment of H-rotor darrieus VAWT equipped with wind-lens technology. Energy 2019, 175, 76–97. [Google Scholar] [CrossRef]
Figure 1. Experimental points.
Sci 08 00051 g001
Figure 2. Rotor and external channel flat plate dimensions.
Sci 08 00051 g002
Figure 3. Discretization of control surfaces and boundary conditions. (a) Full overlapping mesh. (b) Mesh of the augmentation channel, rotor, and blades.
Sci 08 00051 g003
Figure 4. Moment variation in the last revolution, best treatments, and baseline treatments.
Sci 08 00051 g004
Figure 5. Relationship between tip-speed ratio (TSR) and average moment for treatment 9.
Sci 08 00051 g005
Figure 6. Performance of best treatments at different TSRs.
Sci 08 00051 g006
Figure 7. Comparison of velocity contours between treatments 9 and 11 and the baseline treatment.
Sci 08 00051 g007
Figure 8. Three-dimensional surface of the power coefficient as a function of angle β and length H for Model 1. (a) Contour map. (b) Response surface.
Sci 08 00051 g008
Figure 9. Three-dimensional surface of the power coefficient as a function of angle β and length H for Model 2. (a) Contour map. (b) Response surface.
Sci 08 00051 g009
Table 1. Summary of DoE design treatments.
TreatmentAngle β Length H
Baseline--
1600.4
2600.6
3800.4
4800.6
5700.5
6700.3
7700.2
8900.4
91000.4
10500.5
111100.5
12700.1
Table 2. Mesh characteristics for treatments 3 and 9.
MeshNumber of NodesCharacteristic Size hRefinement r
M1 (fine)383,1970.001615433
M2 (intermediate)164,5320.002465329 r 21 = 1.526
M3 (couser)72,5690.003712141 r 32 = 1.506
Table 3. Simulation parameters.
ParametersValue
Simulation typesTransitory
Turbulence model k ϵ realizable
Inlet velocity1.0 m/s
Angular velocity4.44–7.77 rad/s
Temperature25 °C
Pressure1 atm
Reynolds8.96 × 105
Table 4. Summary of mesh convergence using GCI.
TreatmentNumber of Nodes ϕ pI ϕ ext GCI %
3383,197 (M1)93.4241.5740.95892.233
164,532 (M2)94.550 1.594
72,569 (M3)95.135 0.855
9383,197 (M1)120.2151.9920.952119.182
164,532 (M2)121.580 1.074
72,569 (M3)122.176 0.486
Table 5. Numerical results obtained from fluent.
TreatmentAngle β Length HAverage MomentCp
Baseline--10.080.15
1600.467.071.00
2600.635.980.53
3800.494.551.40
4800.674.391.10
5700.562.670.93
6700.398.771.47
7700.298.031.45
8900.4106.541.58
91000.4121.581.80
10500.540.370.6
111100.5108.561.61
12700.196.611.43
Table 6. Statistical summary of Model 1.
TermEstimateStd. Errort Valuep-Value
Intercept1.5201890.03142148.382 1.09 × 10 6
β (Angle)0.2201930.0280537.8490.00142
H (Length)−0.1978110.040363−4.9010.00804
β H 0.0295420.0209561.4100.23143
I ( β 2 ) −0.0105720.006428−1.6450.17539
I ( H 2 ) −0.0312820.007895−3.9620.01665
I ( β 3 ) −0.0104450.004400−2.3740.07650
I ( H 3 ) 0.0164430.0065442.5130.06588
Table 7. Statistical summary of Model 2.
TermEstimateStd. Errort Valuep-Value
Intercept1.5056250.03538842.546 1.03 × 10 9
β (Angle)0.1871530.01381913.543 2.81 × 10 6
H (Length)−0.2331590.040692−5.7300.000713
I ( H 2 ) −0.0339830.010077−3.3720.011880
I ( H 3 ) 0.0180210.0076542.3540.050758
Table 8. Fit metrics of the regression Model 2.
MetricsValue
Residual standard error0.07595 on 7 degrees of freedom
Multiple R-squared0.9778
Adjusted R-squared0.9651
F-statistic77.06 on 4 and 7 DF
p-value 7.214 × 10 6
Disclaimer/Publisher’s Note: The statements, opinions and data contained in all publications are solely those of the individual author(s) and contributor(s) and not of MDPI and/or the editor(s). MDPI and/or the editor(s) disclaim responsibility for any injury to people or property resulting from any ideas, methods, instructions or products referred to in the content.