1. Introduction
Decarbonization of the economy and diversification of the energy matrix by introducing green hydrogen is an opportunity to reduce the use of fossil fuels. Although the literature highlights the advantages and benefits of hydrogen implementation, quantifying its environmental and social impacts at larger scales remains challenging. This underscores the importance of the need for a methodological approach to study the potential benefits of integrating green hydrogen into the energy matrix, as such analysis would support the evaluation of substantial investment requirements for green hydrogen generation and the estimation of the existence of a profitable demand [
1]. Hydrogen (H
2) is the most abundant element in the universe and a source of energy that can replace fossil fuels. Hydrogen has been found to perform better than other fuel sources in terms of lower pollutant emissions, as well as higher flammability and expansivity characteristics [
2]. However, hydrogen can be produced from different sources, ranging from fossil fuels to renewable energies, and with or without the use of carbon capture technologies. Green hydrogen is an alternative for industrial decarbonization, which implies the generation of hydrogen from water through electrolysis, using electricity from renewable sources and zero or low carbon emissions [
3]. Additionally, other innovative techniques, such as graphene and iron catalysis, demonstrate their role in improving hydrolysis [
4]. In addition, numerous studies in recent years have contributed to our understanding of regional and national capacity for generating green hydrogen from renewable energies [
5,
6,
7,
8].
In this sense, there are many international organizations, such as the Inter-American Development Bank (BID), which support efforts to implement aspects of public policy, strengthen regulatory frameworks, and adopt technical tools to adequately integrate renewable and non-conventional energy sources such as hydrogen [
9]. Colombia has started this energy transition, and in 2025, more than 12% of its installed electricity generation capacity was from non-conventional renewable sources, compared to less than 0.5% in 2018 [
10].
In 2015, 196 countries signed the Paris Agreement to prevent global temperature from rising 2 °C above pre-industrial levels and to make efforts to limit the increase to 1.5 °C [
11]. Those agreements led the way to finding new renewable energy sources and making a transition from fossil fuels. Colombia’s geographical position within the Intertropical Convergence Zone (ITCZ), combined with its abundant water resources and high solar radiation, places the country as potentially favorable to transition to renewable energies. Colombia ranks sixth globally in terms of its water resource availability, with an annual supply of 2360 km
3 of water per year [
12], only surpassed by countries with larger territorial extensions, such as Brazil, the United States, Canada, Russia, and China. Additionally, Colombia has a high radiation potential of 359 GW of installed solar power and 26.6 GW of wind power [
13].
The energy transition becomes more urgent to protect biodiversity hotspots from the effects of climate change. Out of twenty-five hotspots worldwide, two are located in Colombia: the tropical Andes mountains, with 20,000 endemic plants and 1567 endemic vertebrates; and the northwest Colombian biogeographic region, the Chocó and Darién area, which contains 2250 endemic plants and 418 endemic vertebrates [
14]. It is important to implement and adopt more renewable energies to reduce the impact of global warming/climate change on the hotspots and the species that live there.
The model offers a single platform from which to simulate renewable energy potential in a sustainable manner within a given geographical area, develop scenarios for modifying the energy matrix of a country or region, simulate rational and efficient water supply and demand for energy uses, including aspects of climate change, calculate green hydrogen production in a sustainable manner, and finally calculate greenhouse gas emissions.
The proposed framework includes environmental and socio-cultural sustainability and considers water availability and the climatic effects of the El Niño Southern Oscillation (ENSO). The objective of this research is to study the potential benefits of integrating green hydrogen into Colombia’s energy matrix. The document is structured around the presentation and explanation of the study area (MODERHydrogen-H2). Results for Colombia are presented, including analysis of energy demand, water availability, potential green hydrogen supply, greenhouse gas emissions, and energy matrix distribution.
2. Materials and Methods
2.1. Study Area
The case study for this work is Colombia, a South American country that has a population exceeding 50 million inhabitants. It is located from 4°13′30″ south latitude to 12°27′46″ north latitude and from 66°50′54″ to 79°0′23″ west of the Greenwich meridian.
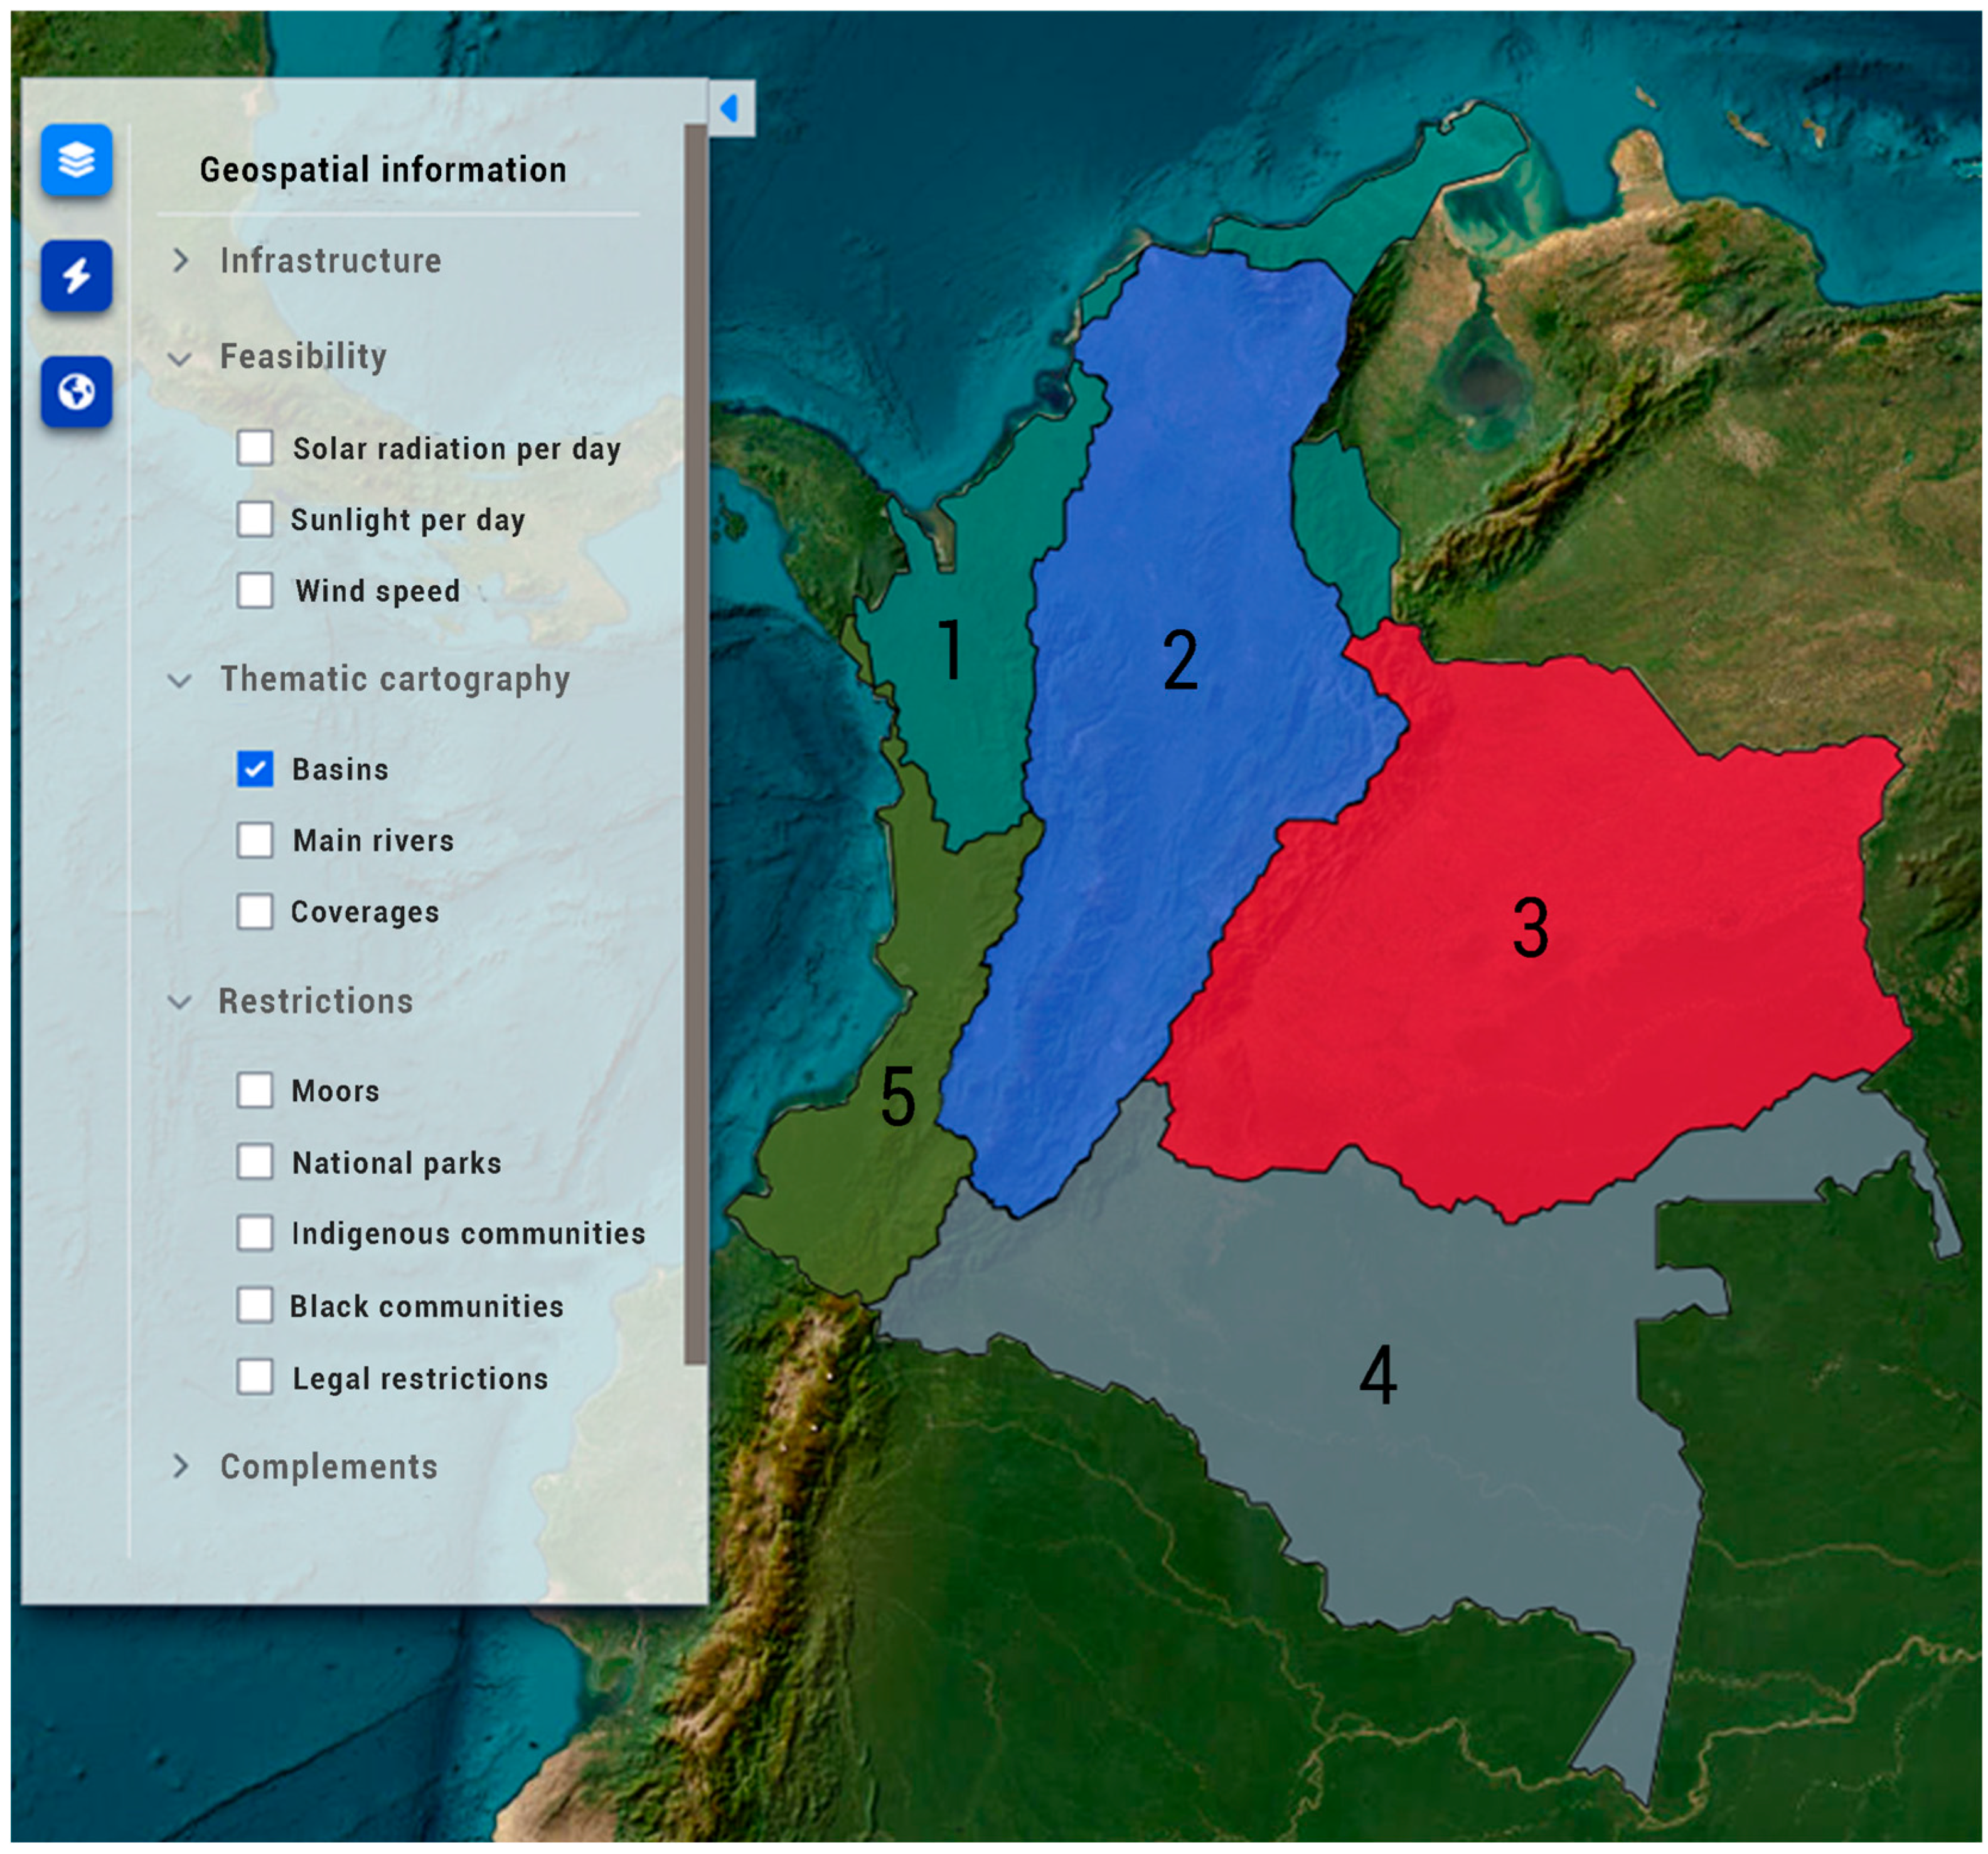
The country is situated within the ITCZ, where winds from the north and south hemispheres converge, generating high cloud cover and precipitation. This phenomenon, together with the orographic effects of the Andes Mountain Range, causes different precipitation regimes in various regions of Colombia. The country is subdivided by five main river basins, which share similar rainfall regimes: (1) Caribbean Basin, (2) Magdalena—Cauca River Basin, (3) Orinoco River Basin, (4) Amazon River Basin, and (5) Pacific Basin, as shown in
Figure 1.
Colombia is geographically located in an area where renewable energy resources are abundant [
13]. The country has been characterized by its vulnerability to the impacts of global warming and intends to transition to renewable solar and wind energy through the utilization of the World Bank’s green bonds [
15].
2.2. MODERHydrogen-H2 Conceptualization
MODERHydrogen-H
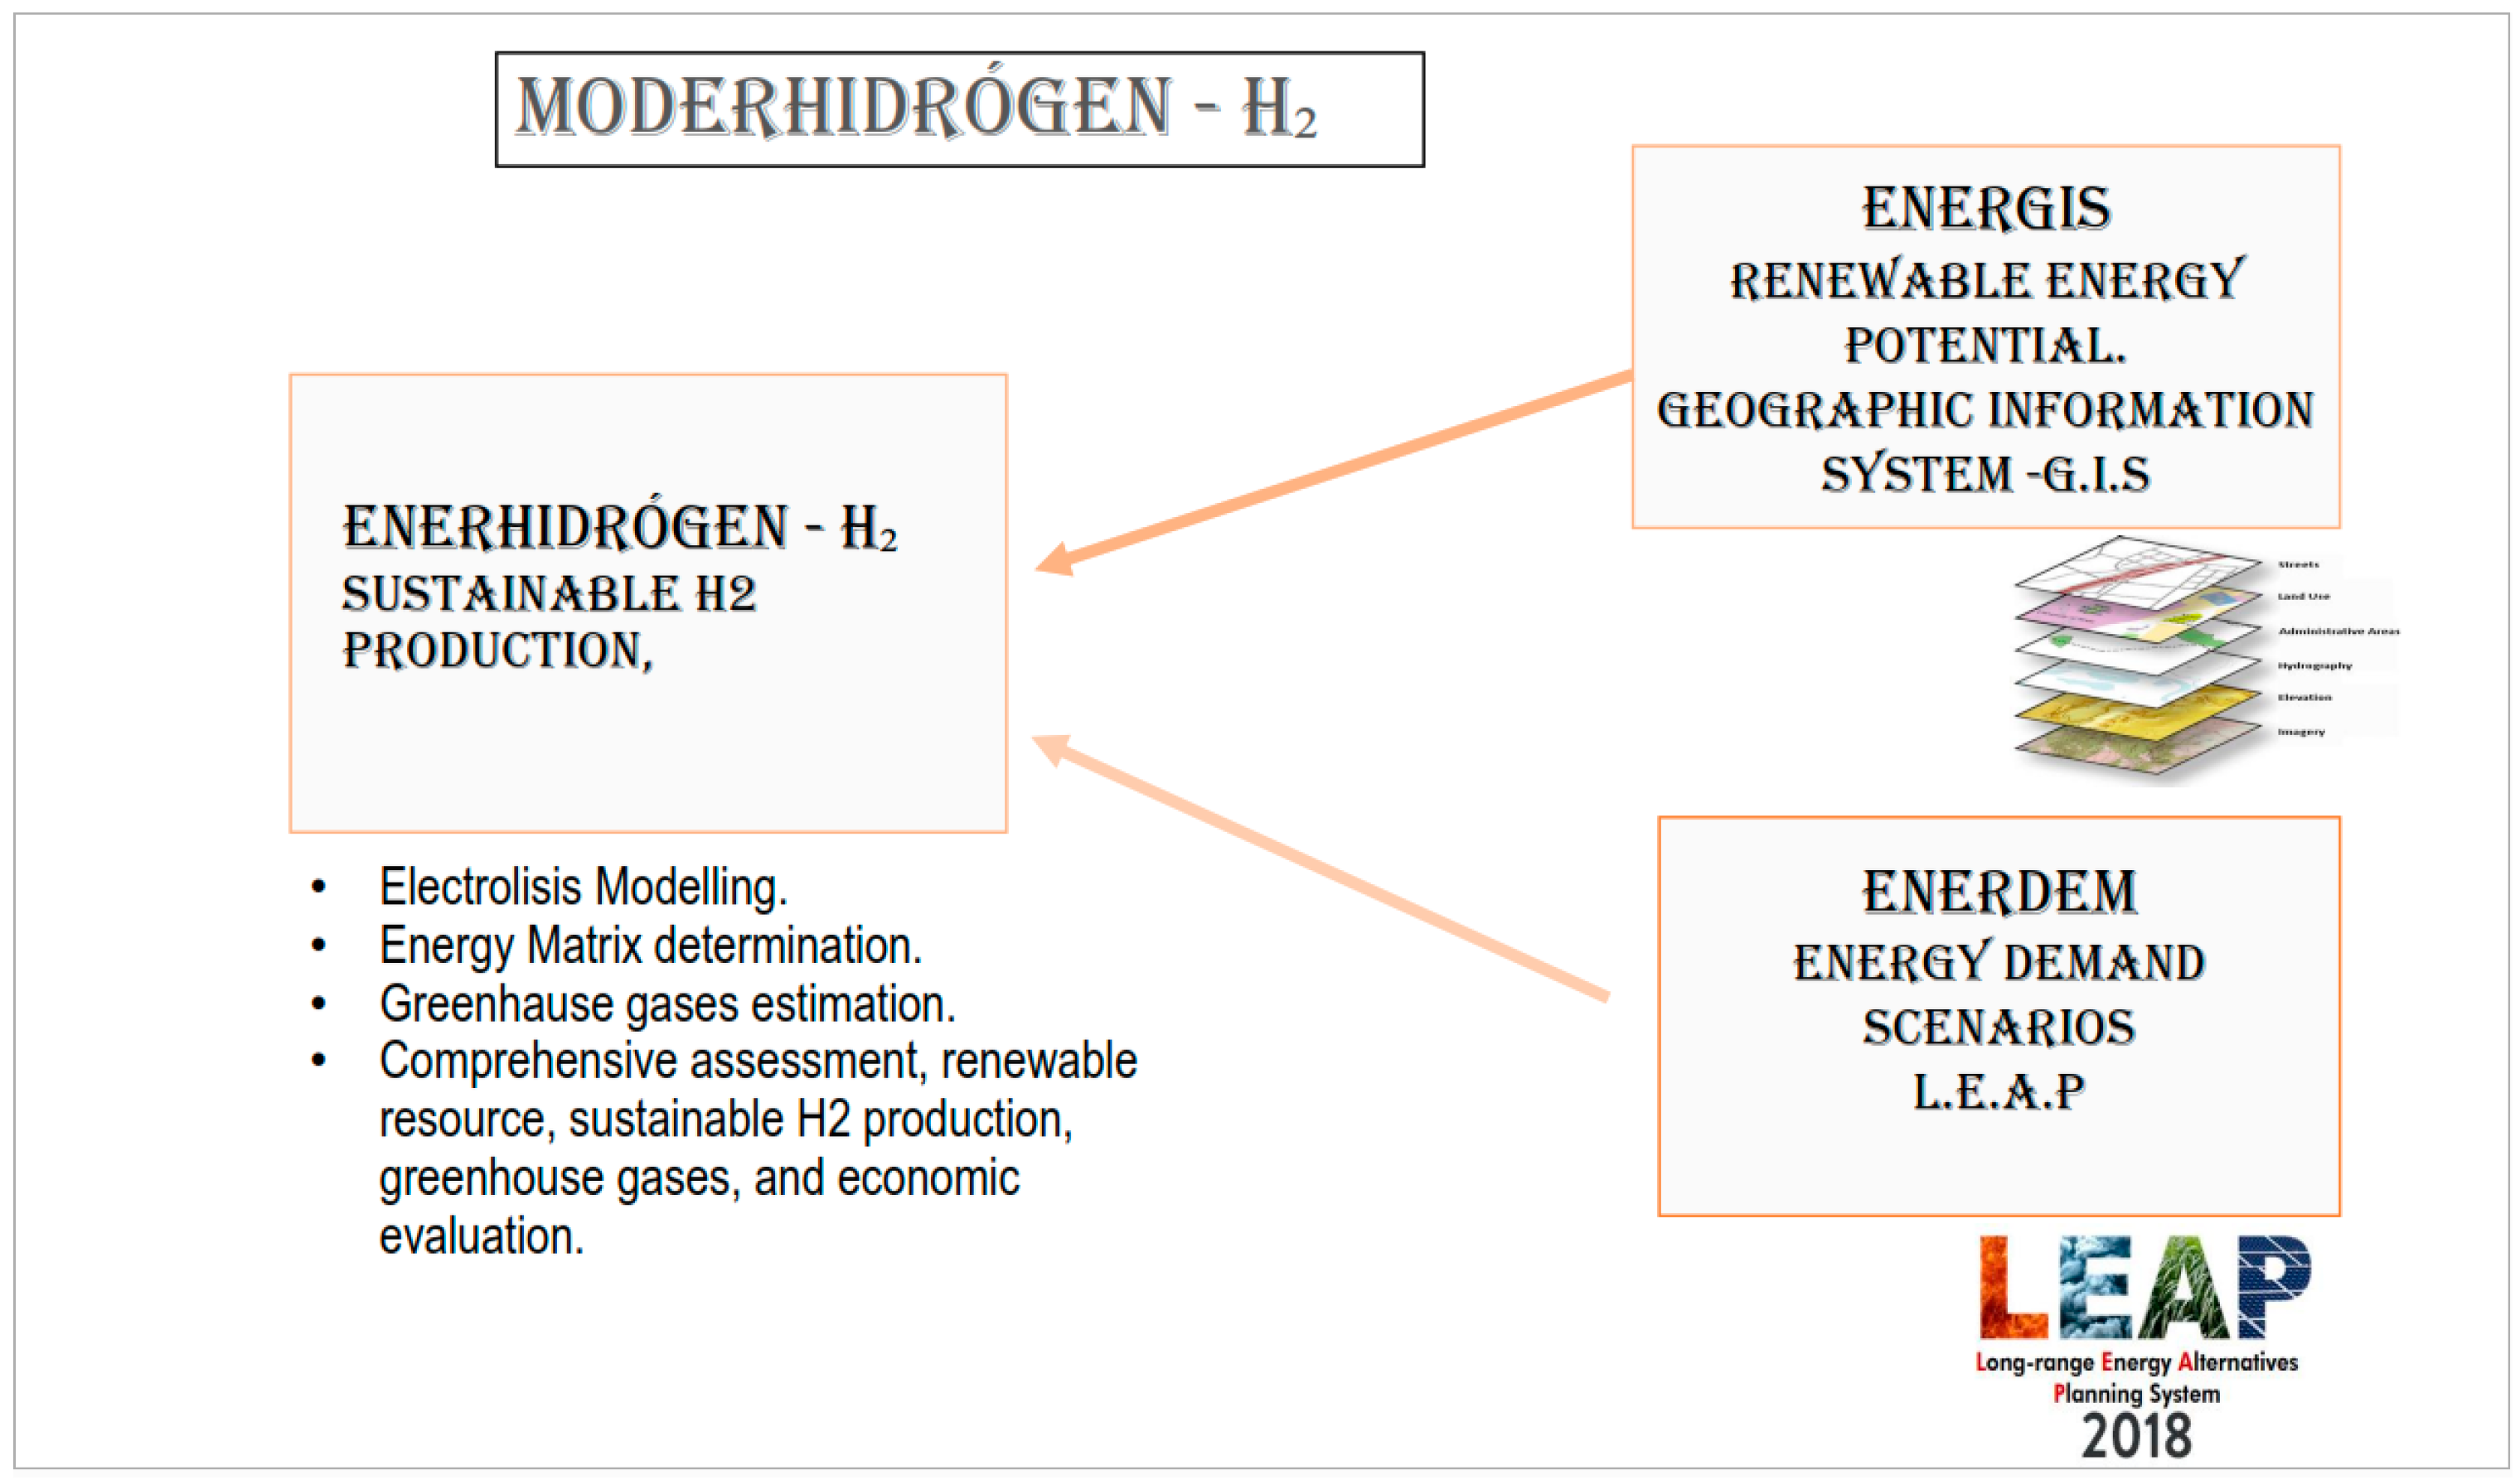
2 is a framework that integrates renewable energies, including green hydrogen. It simultaneously assesses the spatial and temporal potential of renewable energies, calculates energy supply and demand, and greenhouse gas emissions. MODERHydrogen-H
2 is divided into three modules (ENERGIS, ENERDEM, and ENERHYDROGEN) and draws upon the structure of the renewable energy platform MODERGIS [
13]. ENERGIS incorporates Geographic Information Systems adapted and extended to cover green hydrogen production. ENERDEM oversees the management of energy supply and demand through the Long-Range Energy Alternatives Planning System (LEAP) [
16], a supply and demand modeling tool that utilizes data from the energy balances provided by the Unidad de Planeamiento Minero Energético (UPME) [
17] and the Organización Latinoamericana de Energía (OLADE) [
18]. ENERHYDROGEN is a module designed to calculate green hydrogen production based on the inputs of the ENERGIS and ENERDEM modules.
Figure 2 presents the conceptualisation of MODERHydrogen-H
2, and each module is explained in more detail in
Section 2.3,
Section 2.4 and
Section 2.5.
2.3. ENERGIS
ENERGIS is a module that conducts simulation and spatial analysis using geographic information, in alignment with the restrictions-based methodology, and incorporates data from the Colombian Geographic Institute (IGAC) [
19]. The information includes departmental divisions, municipalities, urban centers, road infrastructure, indigenous and Afro-descendant populations, forest reserves, natural parks, watersheds, main rivers, watercourses, solar radiation, and wind speed. This information establishes a framework of analysis and spatial reference and some initial restrictions, referring to those areas in which it is not possible to develop energy projects, seeking integral energy sustainability.
2.3.1. Restrictions Method
The restrictions method consists of the exclusion of zones that cannot be used due to economic, ecological, or regulatory interests [
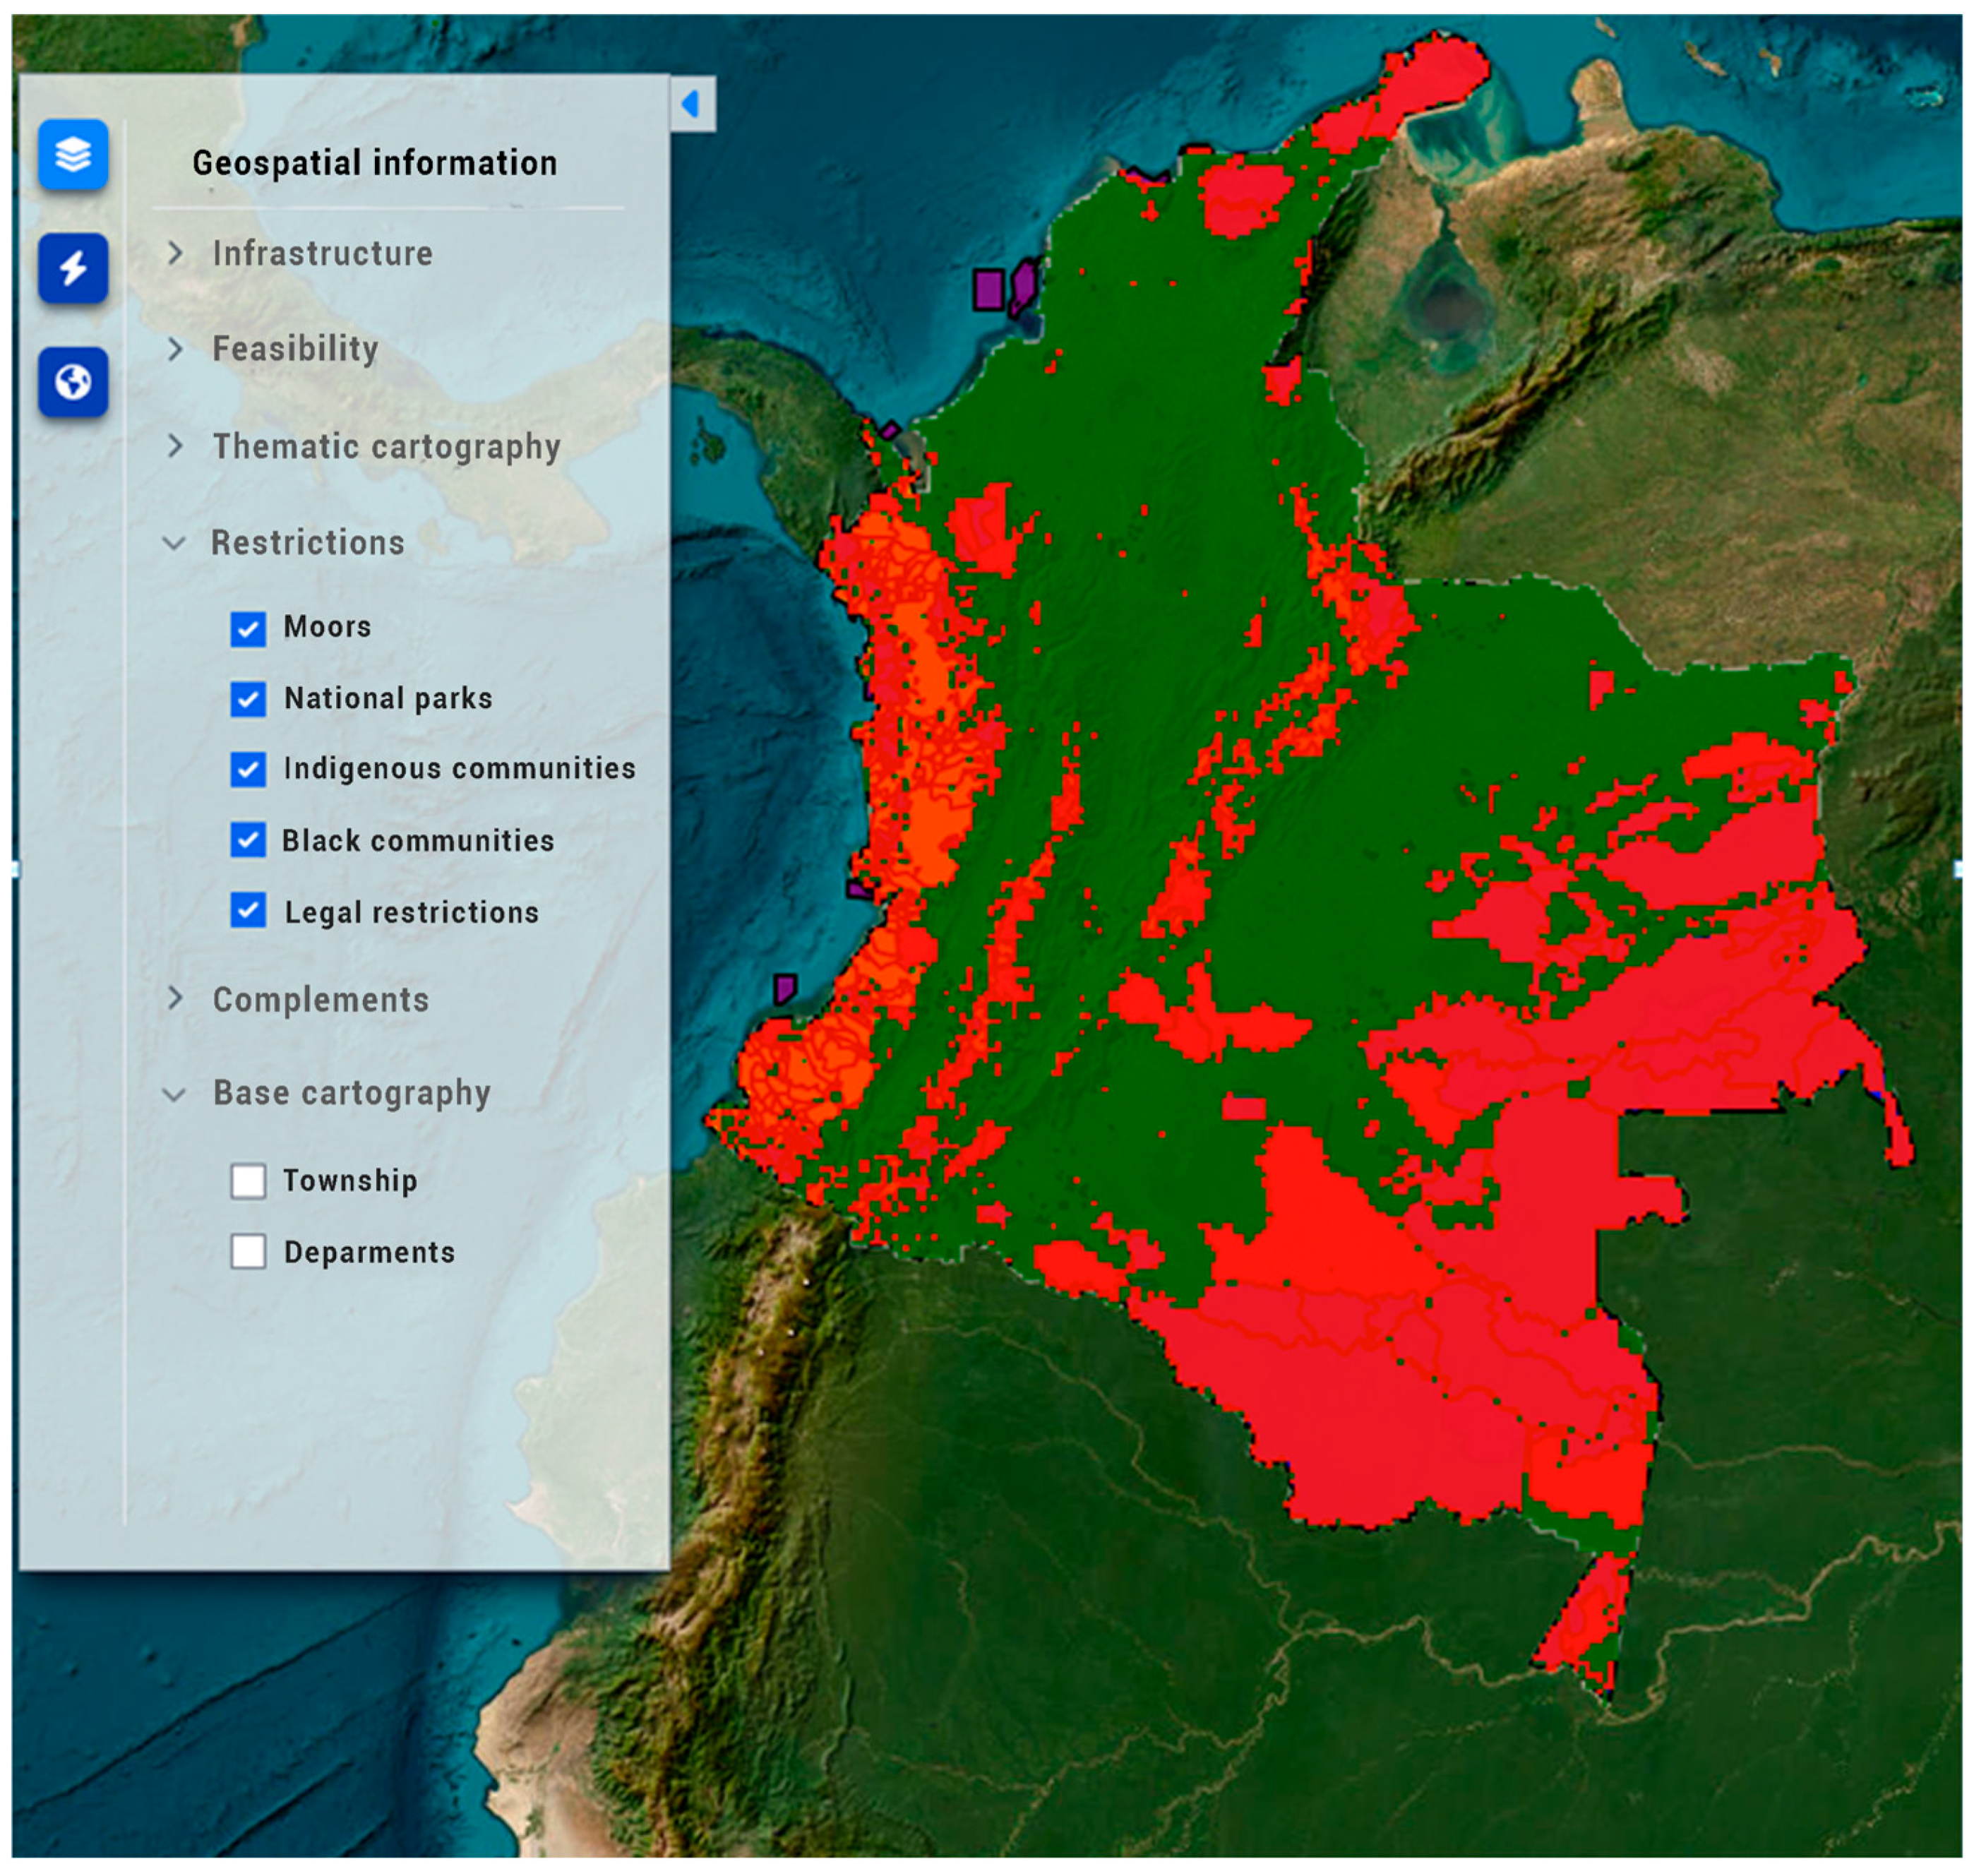
20]. In this sense, urban areas, moorland protection areas, nature reserve areas, territories inhabited by indigenous and Afro-descendant communities, areas affected by the Forest Reserve Law, and basins of high aridity index are excluded. The integration of these data sources results in the identification of areas suitable for green hydrogen projects, free from spatial and regulatory constraints. As shown in
Figure 3, areas with environmental and social restrictions are marked in red, areas suitable for energy project development are indicated in green, and regions subject to legal restrictions are highlighted in purple.
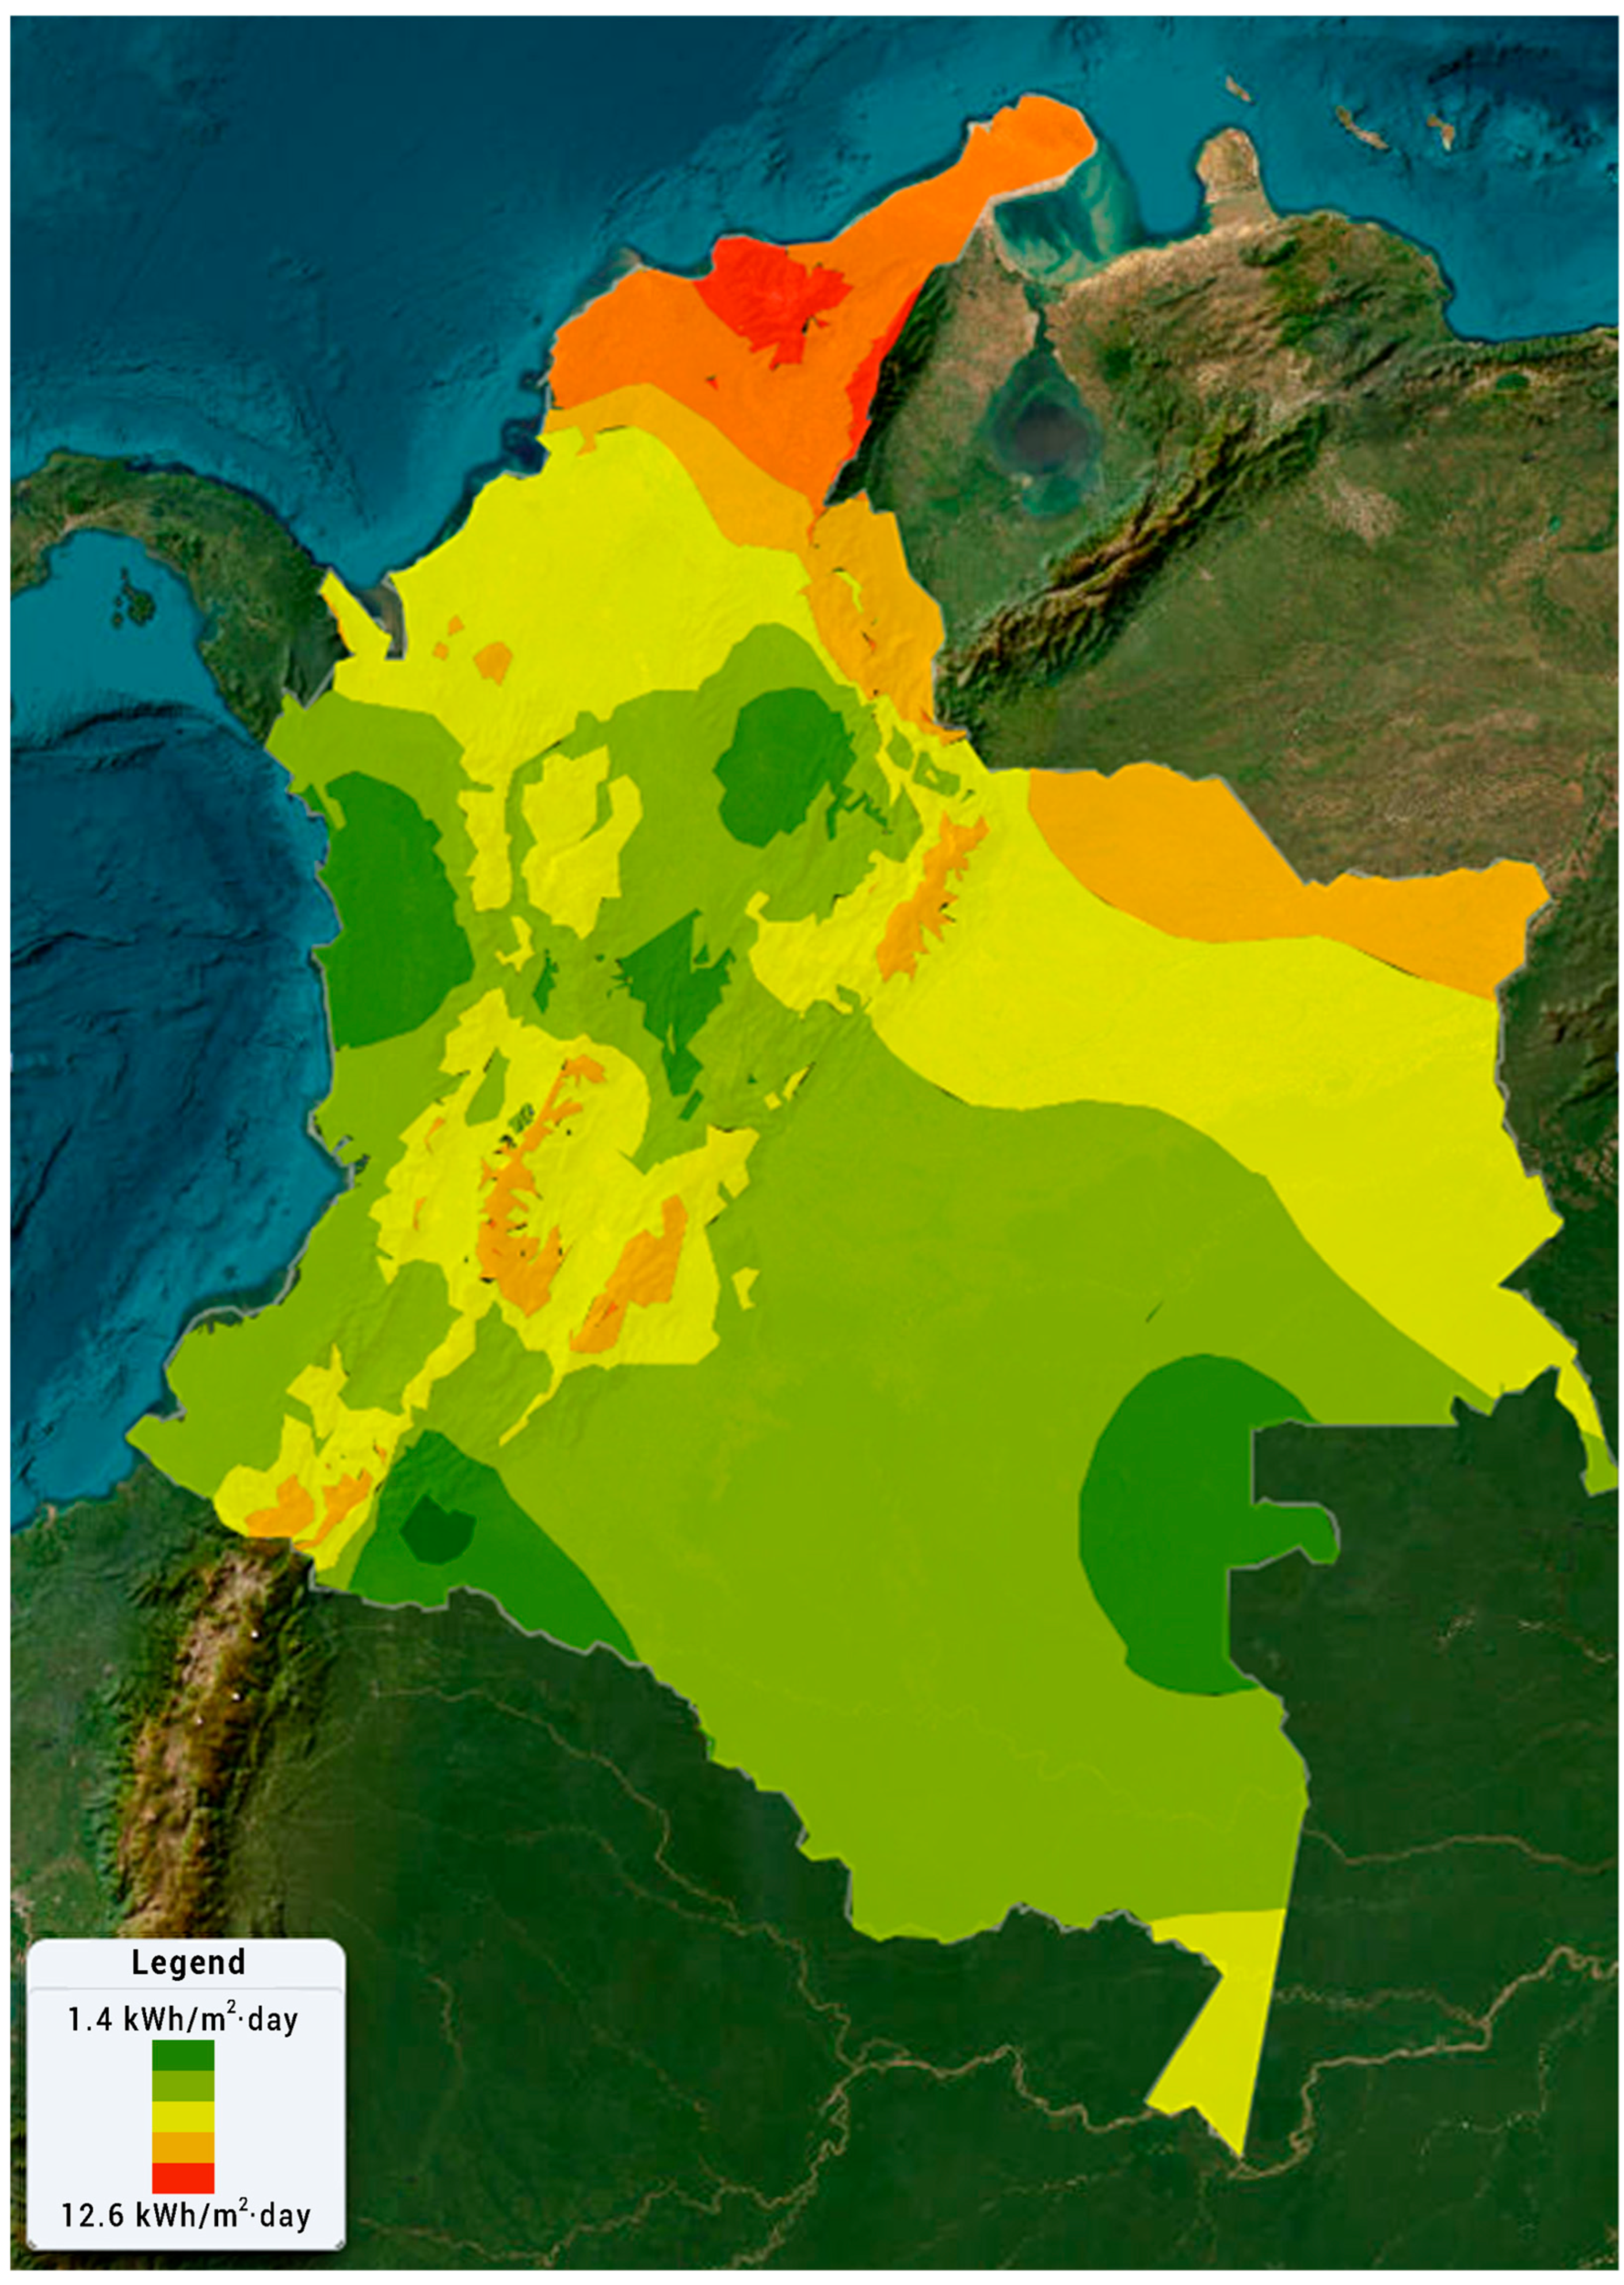
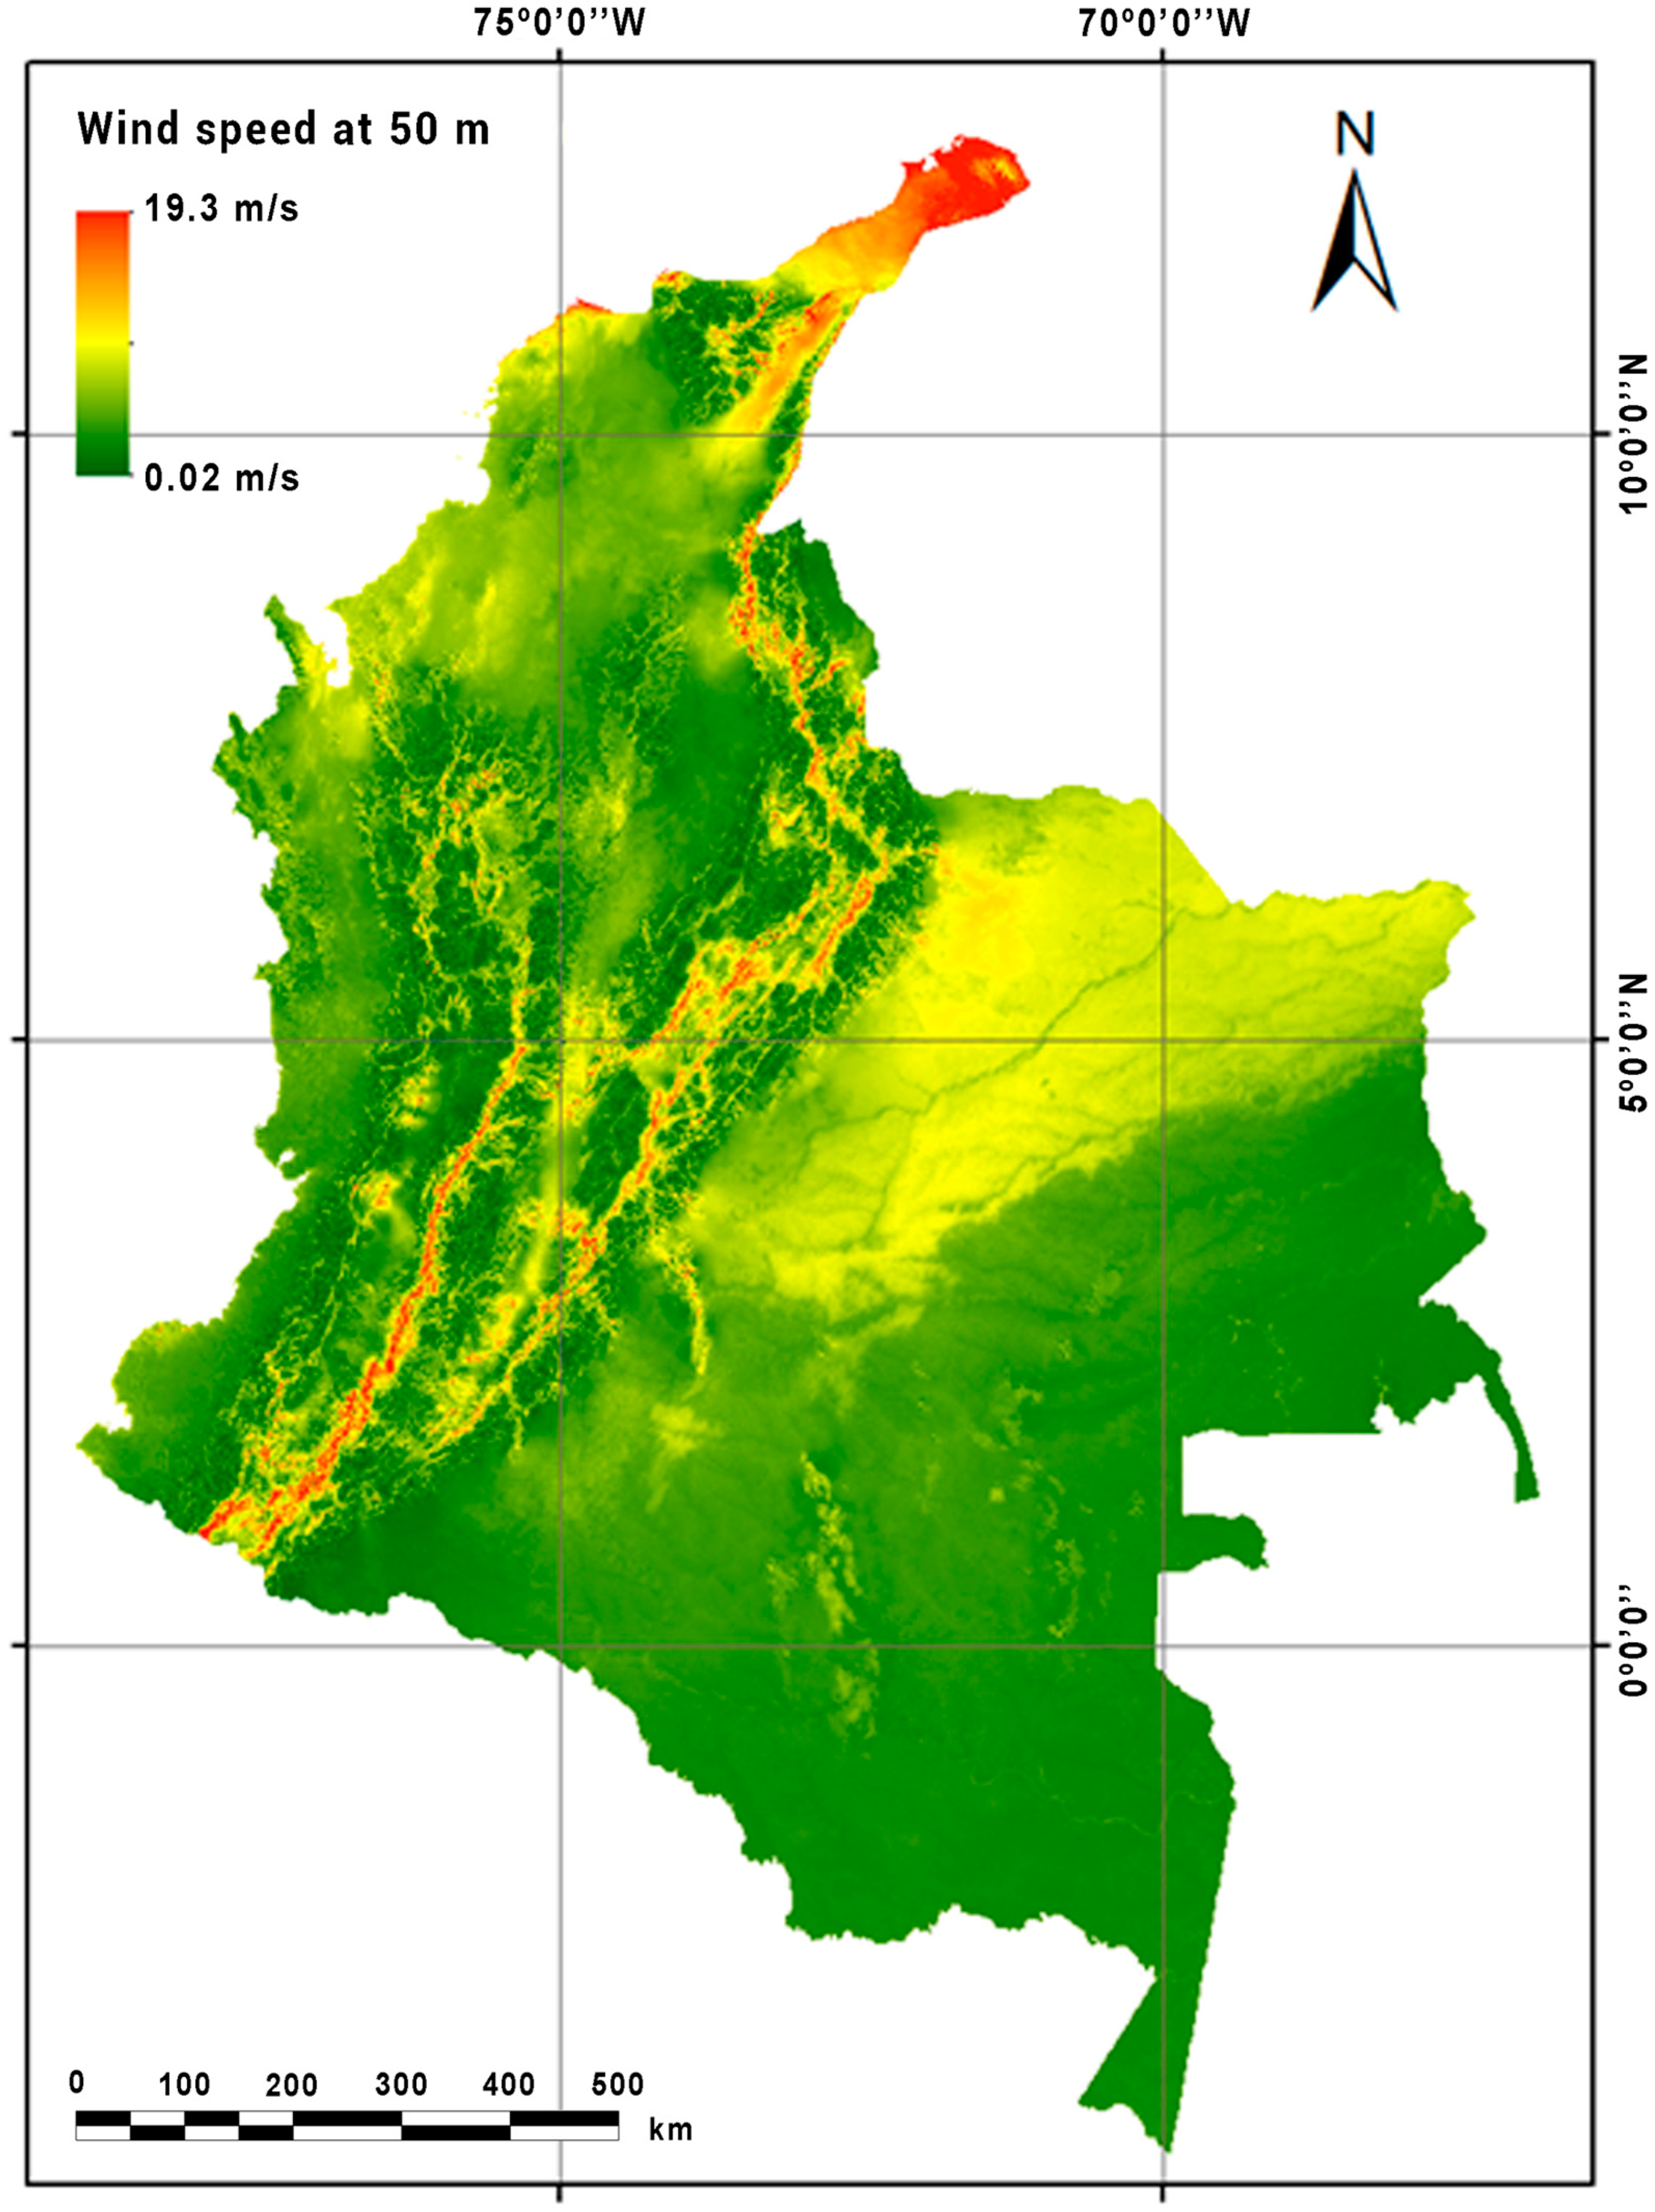
The solar and wind potential is estimated using GIS technology from a series of monthly and annual average solar radiation and annual monthly average wind speed taken from the sun and wind atlases of the Colombian Institute of Hydrology, Meteorology, and Environment (IDEAM) [
21] (see
Figure 4 and
Figure 5). Note that Colombia has high solar radiation, starting from low values around 1.4 kWh/m
2/día, up to intense values of 12.6 kWh/m
2/día in the north of the country. The highest wind speeds are concentrated in the north and west, with values above 10 m/s of average annual wind speed. To verify and update the values and geospatial information, the Solargis sun and wind values from the World Bank Group’s Energy Sector Management Assistance Program (ESMAP) were employed [
22,
23]. The simulation of the ENERHYDROGEN model verifies the solar and wind resources using geospatial information from Colombia [
24].
The solar and wind power were calculated with solar radiation and wind kinetic energy transformation equations. Standard values of 750 Wp photovoltaic panels and a nominal wind turbine capacity of 6500 kW were used. A capacity factor for solar systems of 0.25 is considered in the study [
25]. This factor represents the actual operating hours of the solar panels. This value is given for the radiation conditions in Colombia. For wind systems, a capacity factor of 0.45 is established [
26]. This factor represents the actual operating hours of wind turbines in Colombia [
27,
28].
2.3.2. Water Availability
Environmental and social sustainability are fundamental considerations in the production of green hydrogen. Accordingly, components have been incorporated into the calculation of net water availability to minimize potential social conflicts related to water use. This study integrates environmental and social sustainability by assessing water availability and incorporating the aridity index (AI), which quantifies the degree of sufficiency or insufficiency of precipitation to sustain the ecosystems of a region. Furthermore, the framework accounts for the effects of El Niño–Southern Oscillation (ENSO), which has been shown to reduce rainfall in Colombia by 40–80% during its occurrence [
29].
The net water availability (
—Mm
3/year) is computed as
where
is the available water supply (Mm
3/year), D is the total water demand (Mm
3/year), AI is the aridity index (%), and EN is the correction factor considered for ENSO in the net water availability. O, D, and the aridity index (AI) were obtained from IDEAM [
30], while EN was obtained from the study Montealegre-Bocanegra, J.E., Institutional model of IDEAM on the climatic effect of El Niño and La Niña phenomena in Colombia [
29]. EN was established at 40%, reflecting the reduction in net water availability observed during ENSO seasons.
Water availability in the five main basins is calculated as shown in
Table 1. Note that water demand is distributed among different economic sectors; the sectors with the highest participation in water use are agriculture at 43.1%, followed by energy at 24.3%, and livestock at 8.2%.
Table 1 shows the net water availability with results ranging from 28,253 Mm
3/year in the Caribbean Basin to 169,411 Mm
3/year in the Amazon Basin.
The water demand for hydrogen production is then determined by multiplying the hydrogen output by a constant factor of 11 liters of water per kilogram of hydrogen and subsequently dividing by the electrolyzer efficiency.
2.4. ENERDEM Simulation of Demand
The ENERDEM module simulates energy supply and demand, taking into account socioeconomic variables. It uses the Long-Range Energy Alternatives Planning System (LEAP) model to calculate the prospective energy in the short and medium term [
16].
The year 2018 was selected as the base year for this study, as it was considered representative of typical conditions and preceded the COVID-19 pandemic and its peculiar effects on energy demand. The available information on electricity demand, supply, and generation for this year was obtained from UPME [
31]. Socioeconomic information, such as population, gross domestic product, annual manufacturing survey, automotive registration, and gross domestic product, was obtained from the National Planning Department (DNP) [
32] and the National Statistics Department (DANE) [
33], also taking into account the new legislation for promoting the use of electric vehicles [
34].
The calculation of energy demand considered two sectors—industry and transport. The values were taken from the 2018 energy balance of the UPME [
17].
2.5. ENERHYDROGEN
ENERHYDROGEN serves as the central module of this study, integrating renewable energy potential estimates (solar and wind) derived from ENERGIS with demand characterization and substitution scenario analysis from ENERDEM, supported by GIS. The module calculates green hydrogen production using PEM electrolysis technologies [
35,
36] and evaluates its integration into Colombia’s national energy matrix. Additionally, it quantifies greenhouse gas (GHG) emissions reductions by applying the Intergovernmental Panel on Climate Change (IPCC) methodology [
37].
The modeling of installed capacity and solar and wind power generation for green hydrogen production maintains the criteria of constraints and environmental sustainability. An orderly and hierarchical sequence is performed as follows:
Determination of solar and wind potential and generation. ENERGIS results.
Determination of environmental sustainability, energy, and the environmental sustainability map. ENERGIS results.
Determination of sustainable water supply, including aridity indices and EN-ENSO simulation. ENERHYDROGEN results.
Green hydrogen production, with PEM electrolyzer technologies. ENERHYDROGEN results.
Characterization of demand, construction of fossil energy substitution scenarios, and demand for green hydrogen for consumption, feedstock, or export. ENERHYDROGEN results.
Calculation of combustion emissions and avoided emissions for renewable energies, to simulate substitution percentages and ensure energy and environmental sustainability.
The model quantifies the green hydrogen balance and the proportion of fossil fuel substitution. This stage is validated using the National Renewable Energy Laboratory (NREL) models [
38]. The NREL model estimates the levelized cost of hydrogen production from solar energy using polymeric membranes. The NREL approach, which begins with the required quantity of hydrogen (in kilograms) and subsequently calculates the necessary power, solar electricity generation, land requirements, carbon dioxide emissions, and applicable taxes in each country to determine the average production cost per kilogram. In contrast, ENERHYDROGEN starts from the available solar radiation and the area required to produce the necessary green hydrogen. It then calculates fossil energy consumption, conducts substitution scenario analyses, estimates greenhouse gas emissions, and can adjust the entire process using real-world data, as demonstrated in the case of Colombia.
2.5.1. Green Hydrogen Production
Solar and wind energy generated in regions with abundant water resources and high energy demand can be the subject of green hydrogen production via the electrolysis method. This research assumes that electrolysis is performed using the proton exchange membrane electrolyzers. The green hydrogen production (
—kg H
2) is calculated as [
39]
where
is the annual solar or wind energy generation (kWh/year),
is the hydrogen production rate (52.5 kWh/kg H
2) and the efficiency of the electrolyzer is already incorporated [
35]. The consumption of the electrolyzer is set at 1250 kW per cell, utilizing the catalog specifications provided commercially by manufacturers [
36]. This value is used to determine the number of hydrogen stacks required.
The newly installed solar and wind plants that are dedicated to the production of green hydrogen are determined by the ratio between total energy potential and the available power from manufacturers of solar and wind technologies. In the case of solar energy, 500 MW plants are used, while for wind energy, 500 and 600 MW plants are employed.
2.5.2. Modeling Scenarios
The structuring of scenarios involves a comprehensive analysis of the current energy landscape and the development of a forward-looking vision for 2030. This process incorporates principles of sustainable development, variability, climate sensitivity, and vulnerability, as well as the guidelines outlined in national and international hydrogen roadmaps, and includes an assessment of global energy geopolitics.
The base year for this research is 2018. The criteria for this selection included ensuring that the year did not exhibit atypical energy demand, was free from abnormal events such as ENSO, did not experience energy supply deficits, and was unaffected by pandemic conditions such as COVID-19. Additionally, it was essential that energy and economic data sources for the year were consolidated and readily available, particularly the energy balance, annual manufacturing survey, updated vehicle registry, and national economic accounts, as well as gross domestic product and value added by sector.
The industrial sectors considered in this study include the thermal and chemical sectors, both of which are projected to undergo partial substitution with green hydrogen by 2030. The thermal sector is primarily dependent on coal consumption within cement production, accounting for 41,553 TJ, while the chemical sector relies on natural gas, with a consumption of 6613 TJ. For the year 2030, the model simulates a 10% reduction in coal use for cement manufacturing and a 20% reduction in natural gas consumption for chemical production. In the transport sector, current energy use is estimated at 218,722 TJ for diesel oil and 257,662 TJ for gasoline. By 2030, the model simulates a 10% reduction in gasoline and a 7% reduction in diesel consumption, facilitating the integration of green hydrogen. These projections align with the provisions of Colombian National Law 1964 of 2019, which promotes the adoption of electric vehicles as a strategy to reduce greenhouse gas emissions [
34].
2.5.3. Greenhouse Gas Estimation
To calculate greenhouse gas emissions, two distinct procedures were employed, each utilizing different equations and emission factors. The first approach estimates emissions avoided through the generation of solar- and wind-based renewable energy, as represented by Equation (3). The second approach calculates emissions resulting from fuel combustion, using specific emission factors for each fuel type and associated oxidation technologies, as outlined in Equation (4). The greenhouse gas emissions were quantified in accordance with the methodology established by the Intergovernmental Panel on Climate Change (IPCC) [
37] and the national greenhouse gas inventory developed by IDEAM [
40]. The equations used are categorized into two groups: those estimating avoided emissions from solar- and wind-based green hydrogen production in Colombia and those calculating direct emissions from fossil fuel use:
where
is avoided emission (t CO
2eq/MWh),
is solar or wind power generation in year i (MWh/year),
is the durability of the project in years (assumed as 25 years),
is the emission factor (t CO
2eq/MWh) equal to 0.662 t CO
2eq/MWh for wind and solar projects. The source of the final and useful energy balances of the Mining–Energetic Planning Unit.
The emissions avoided from the combustion of fossil fuels are calculated as follows:
where
is combustion emission (t CO
2),
is the energy consumption of fuel i in year j (TJ), and
is emission factor (kt CO
2/TJ) found in. The emission factors were obtained from the Mining–Energetic Planning Unit and are presented d:
| Transport: | |
| Diesel Oil 0.0752 (kt CO2/TJ) | Gasoline 0.0692 (kt CO2/TJ) |
| Industry: | |
| Carbon Mineral 0.0881 (kt CO2/TJ) | Natural Gas 0.0555 (kt CO2/TJ) |
2.5.4. Environmental Aspects
The production of green hydrogen has multiple impacts on the environment, both positive and negative. Although the large-scale electrolysis process involves considerable water use (9 tons of pure water per ton of hydrogen produced), this consumption is minimal compared to the water used globally for other economic sectors such as agriculture and industry. Nevertheless, in regions with high levels of water stress, it is recommended that this impact be assessed in detail. However, this research proposes, for the first time, a mechanism to assess its viability so that this consumption does not compete with human or agricultural consumption. Furthermore, although the transition to clean energy could significantly reduce mining activity in general, the production of green hydrogen and the use of renewable energies and electrolyzers require a significant amount of metals. This should be comprehensively assessed by manufacturers through life cycle analysis [
41].
3. Results
3.1. Green Hydrogen Production and Consumption
The selection of project locations was based on several criteria, including energy demand, road infrastructure, population, gross domestic product, and the availability of renewable resources and water. The Amazon, Pacific, and Orinoco basins did not meet the criteria for road infrastructure, population, or contribution to gross domestic product and exhibited low energy demand. Consequently, project sites were considered in the Caribbean and Magdalena basins. The Magdalena Basin possesses high solar potential but limited wind resources, making it more suitable for solar energy projects. In contrast, the Caribbean Basin, located in the northern part of the country, has the highest wind potential in Colombia, rendering it ideal for wind energy development.
Table 2 presents the estimated green hydrogen production of 83,428.6 tons, based on solar energy generation of 4380 GWh per year across four plants, with an associated annual water demand of 0.75 million cubic meters. This represents approximately 0.002% of the total water demand in the Magdalena Basin. Additionally, green hydrogen production of 127,645.7 tons is projected from wind energy generation totaling 6701 GWh per year across three plants, requiring approximately 1.1 million cubic meters of water annually—equivalent to 0.0041% of the water demand in the Caribbean hydrographic basin. While the Caribbean Basin possesses the highest wind energy potential in Colombia, it also faces the lowest water availability due to its rainfall patterns and aridity index.
The balance of the green hydrogen is shown in
Table 3. The H
2 production (211,074.3 t H
2, solar and wind) is larger than the total consumption (208,042.3 t H
2). There is a surplus of 3032.0 tons of green hydrogen per year that can be used for fertilizer production or for the foreign market.
3.2. Energy Matrix
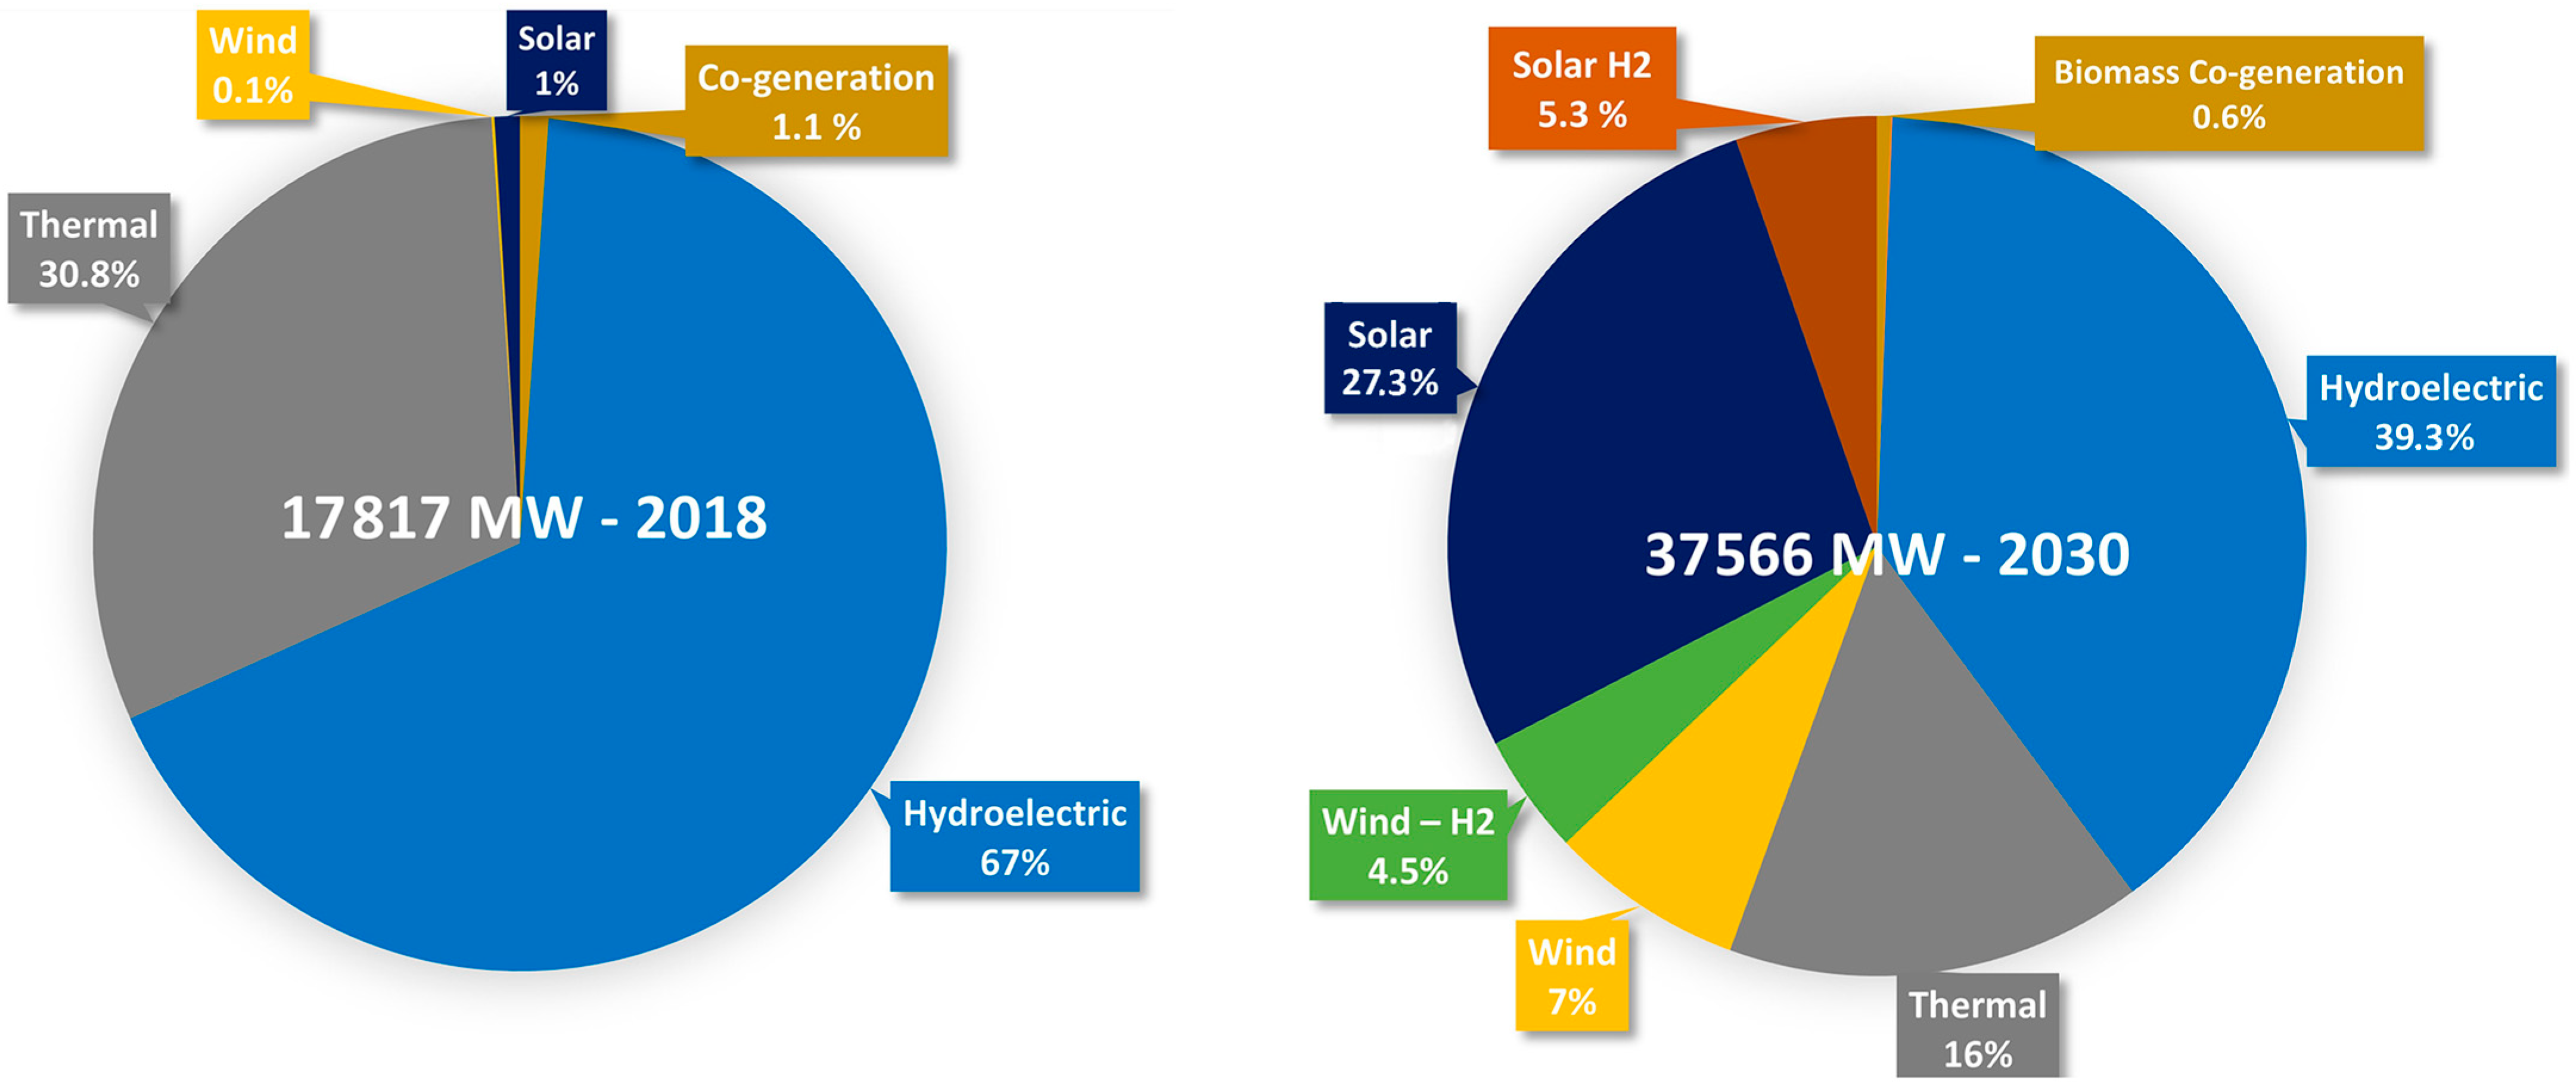
Figure 6 illustrates the energy generation matrix for the year 2018, in which renewable energy accounted for 1.5%, thermal generation from fossil fuels represented 30.8%, and hydroelectric generation comprised 67%. Notably, green hydrogen was not included in the energy mix. By 2030, the integration of green hydrogen is projected to contribute 5.3% from solar energy and 4.5% from wind energy. Additionally, solar photovoltaic energy is expected to increase significantly to 27%, while wind energy is anticipated to reach 7%. These changes are accompanied by a marked reduction in hydroelectric generation, declining from 67% to 39%, and thermal generation, decreasing from 31% to 16%.
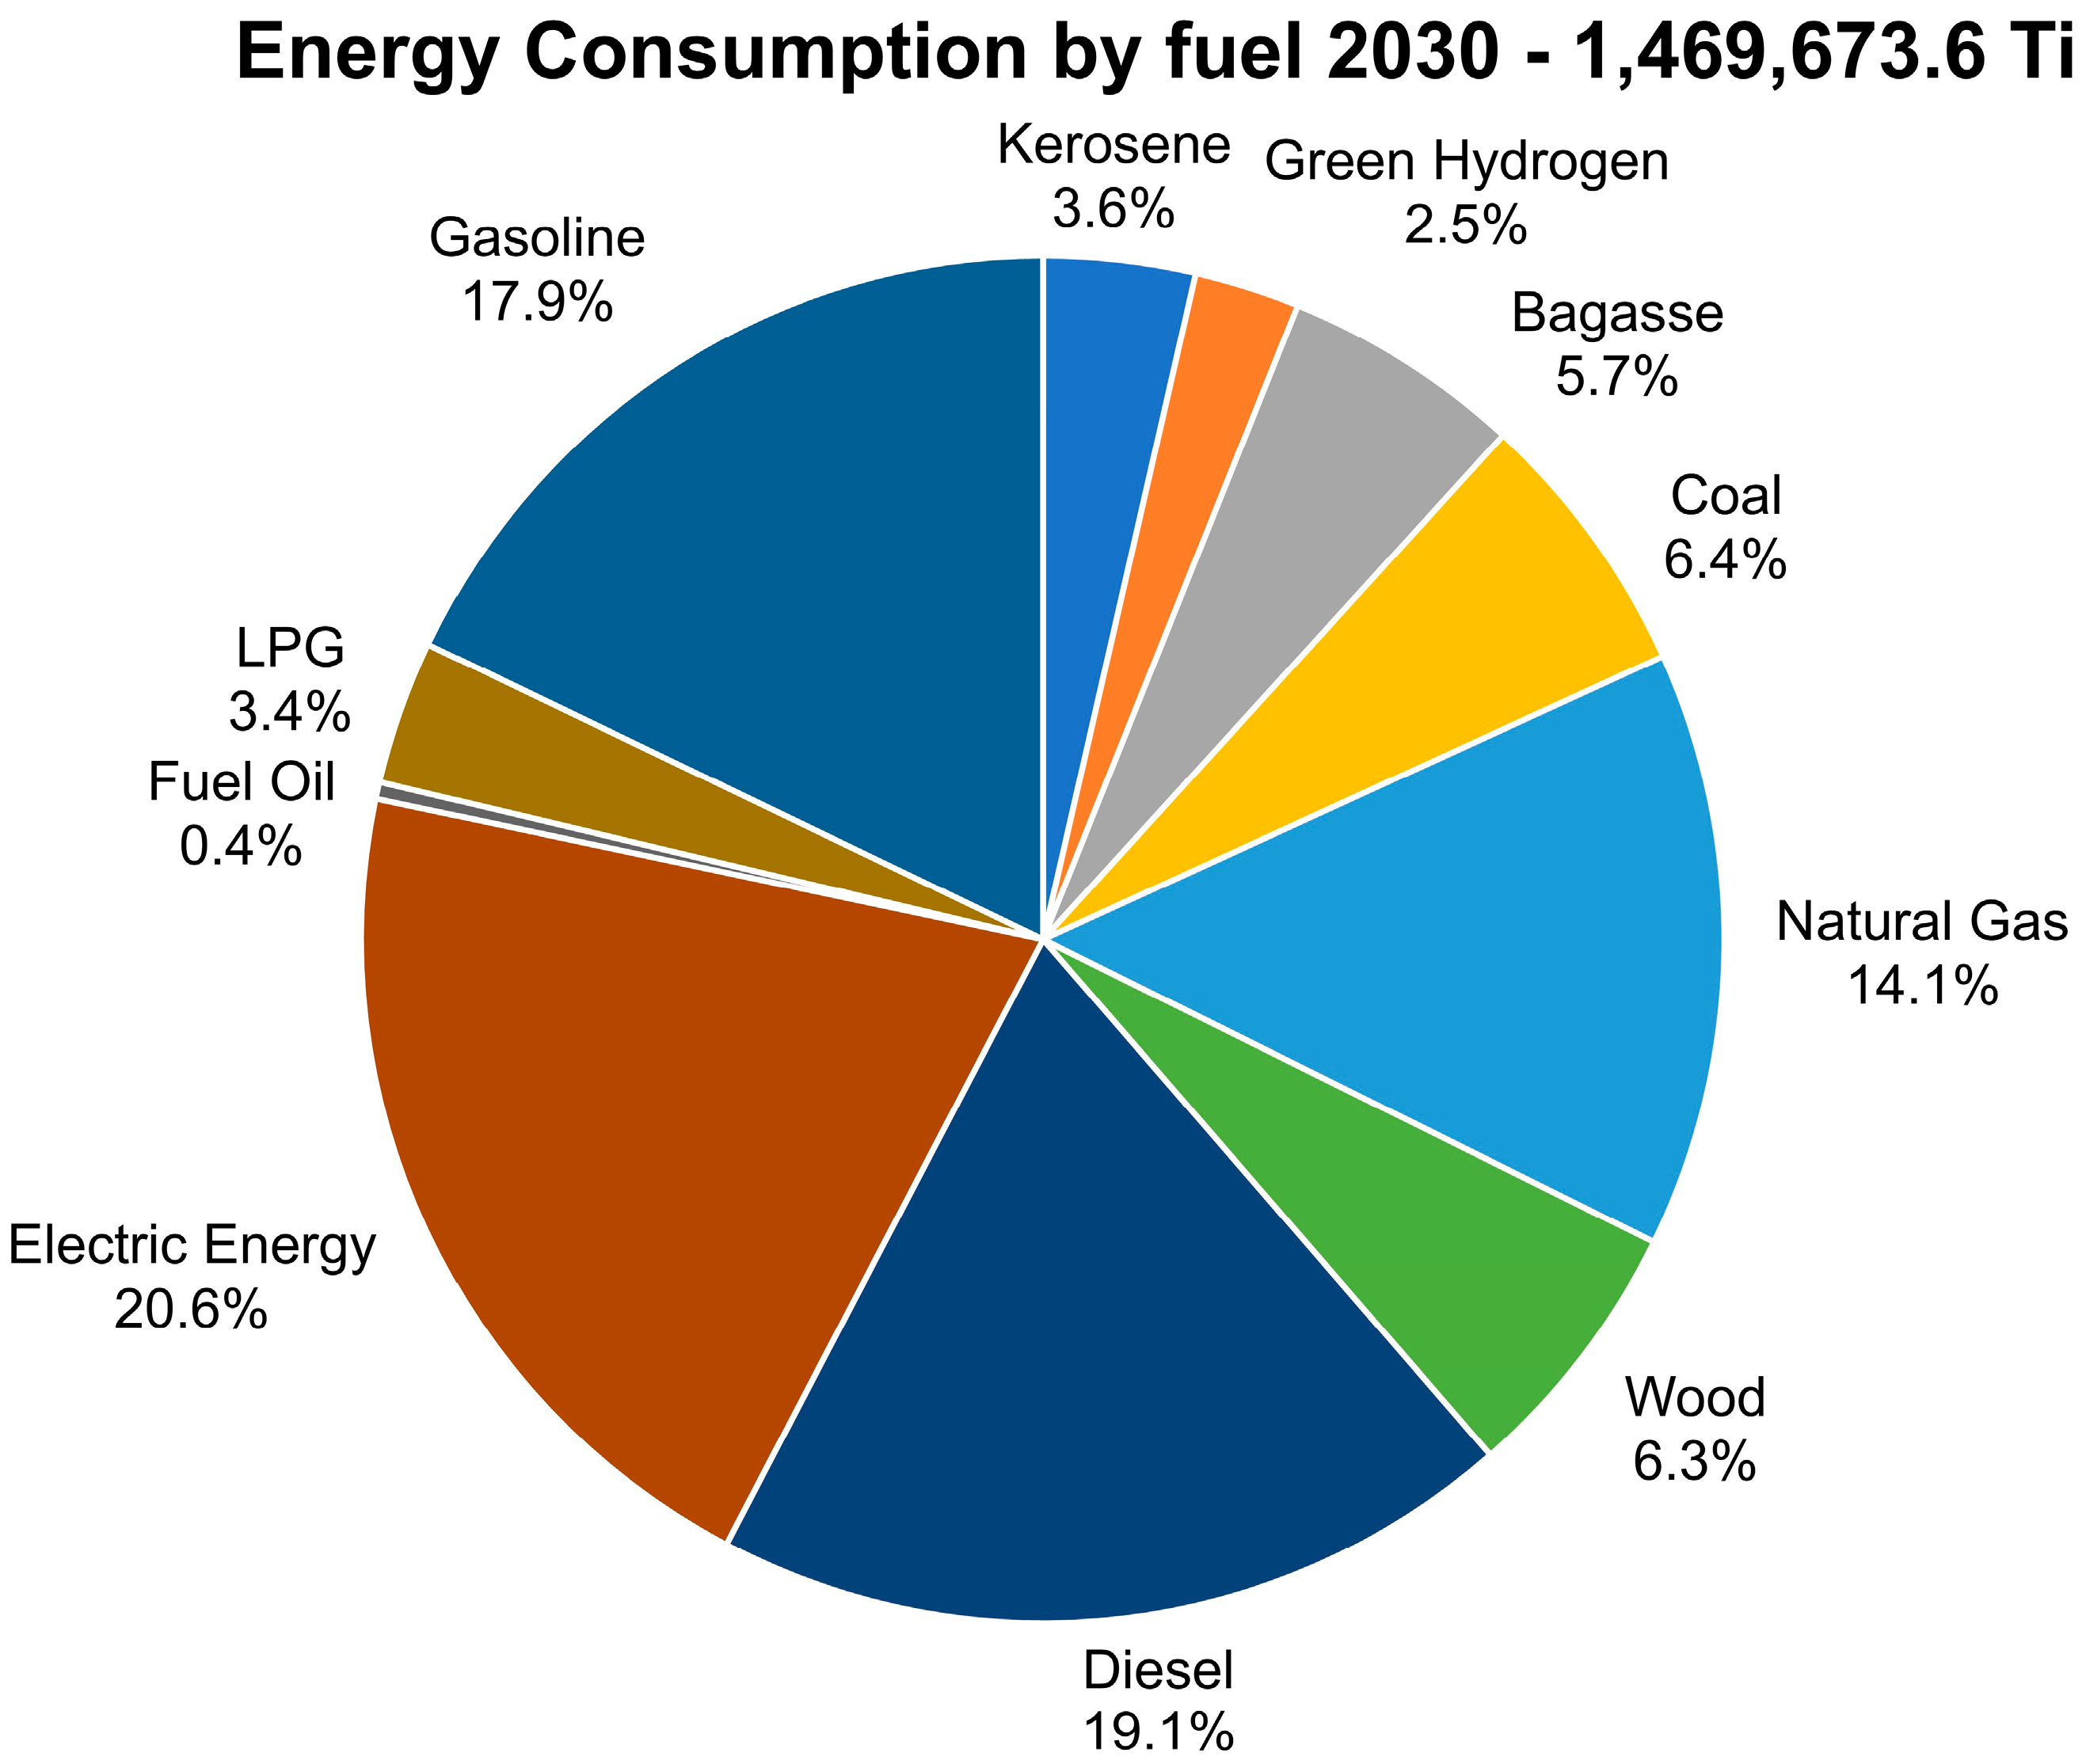
Table 4 presents the results of the energy demand for 2018 (base year), 2020 (outlier year due to COVID-19), and 2030 model simulation (fossil fuel substitution), while
Figure 7 presents the energy matrix demand by fuel for the year 2030. It is observed that the substitution of gasoline, diesel oil, coal, and natural gas generates a demand for green hydrogen of 37,221 TJ and participates in 2.5% of the country’s energy matrix. These consumption results are similar to the projections made by UPME [
42].
The results of the avoided emissions and the combustion emissions calculations are presented in
Table 5. It was found that a reduction of 10,099.4 KTon of CO
2 was represented in the emissions avoided by generation with solar energy (2899.3 KTon CO
2) and in wind energy (4436.2 KTon CO
2). In sustainable mobility, 2001.4 KTon CO
2 are reduced by the substitution of 518.7 KTon CO
2 in diesel
, and 1482.7 in gasoline. The reduction in the industry reached 725.4 KTon CO
2 by the substitution of coal and 36.7 KTon CO
2 by natural gas.
4. Discussion
The model’s results for solar power generation indicate the feasibility of installing four solar plants of 500 MW each—totaling 2000 MW—in the Magdalena–Cauca Basin, with an estimated annual electricity generation of 4380 GWh and a green hydrogen production of 83,428.6 tons. Notably, capital expenditures for large-scale electrolyzers are projected to decrease by approximately 50%, and anticipated reductions in photovoltaic costs are expected to significantly lower the cost of hydrogen production by 2030 [
42]. These price reductions would enhance the affordability of solar hydrogen, enabling its application in additional sectors and larger-scale projects, while sustainable water consumption remains below 1% of available resources.
For wind energy, the simulation considers three projects—two with 600 MW and one with 500 MW—located in the Caribbean Basin in northern Colombia, amounting to a total installed capacity of 1700 MW. These projects are projected to generate 6701 GWh of electricity annually and produce 127,645 tons of green hydrogen. For comparison, an analysis in Iran’s East Azerbaijan province demonstrated that the installation of 850 kW Vestas V52 wind turbines could yield 47.2 tons of green hydrogen per year [
43]. In contrast, wind projects utilizing 274 V162 turbines (6500 kW each) are estimated to produce 58,700 tons of hydrogen annually. In the Caribbean Basin, sustainable water use for these projects represents 1% of the basin’s total, which may pose limitations and potential conflicts with local communities.
The green hydrogen balance reveals a surplus of 3032 tonnes per year, which could be allocated for export. Colombia is thus positioned to become a leading hydrogen supplier to Asian and European markets [
44], offering some of the lowest projected prices—estimated at 1.5 USD/kg H
2 domestically and 3.24 USD/kg H
2 for wind- and solar-based production, respectively, by 2030 [
45].
By 2030, green hydrogen is expected to account for 5.3% of the energy supply from solar sources and 4.5% from wind sources. These projections are consistent with the 2020–2034 Generation and Transmission Reference Plan of UPME [
46], which anticipates an increase in solar photovoltaic energy to 27% and wind energy to 7%. This transition is accompanied by a reduction in hydroelectric generation from 67% to 39% and thermal generation from 31% to 16%, reflecting a shift towards a more sustainable energy matrix.
Within this matrix, the substitution of fossil fuels enables green hydrogen to contribute 2.5% (equivalent to 37,221 TJ) by 2030. Hydrogen’s versatility as both a fuel and a feedstock makes it particularly attractive for industries currently reliant on fossil fuels, and even small-scale solar hydrogen production plants have been found to be economically viable [
47]. The model estimates a reduction of 10,099.4 KTon of CO
2 emissions, representing nearly 10% of Colombia’s total emissions of 100,863 KTon in 2023 [
48]. These reductions can be achieved through the transition to sustainable transport and industry and the integration of green hydrogen into the national energy matrix [
49].
According to a report by the International Renewable Energy Agency (IRENA) [
50] and statistics from the International Energy Agency (IEA) [
51], the cost of hydrogen facilities could decrease by 40% to 80% in the long term. This, combined with the falling cost of renewable energies and electrolyzers, suggests that green hydrogen could be profitable from 2030 onwards.
It is recommended that Colombia adopt such analytical tools to support decision-makers in implementing energy policy guidelines, thereby fulfilling the objectives outlined in the national hydrogen roadmap for both domestic consumption and international export.
5. Conclusions
The model’s results for solar power generation indicate the feasibility of installing four solar plants of 500 MW each—totaling 2000 MW—in the Magdalena–Cauca Basin, with an estimated annual electricity generation of 4380 GWh and a green hydrogen production of 83,428.6 tons. For wind energy, the simulation considers three projects—two with 600 MW and one with 500 MW—located in the Caribbean Basin in northern Colombia, amounting to a total installed capacity of 1700 MW. These projects are projected to generate 6701 GWh of electricity annually and produce 127,645 tons of green hydrogen.
MODERHydrogen-H2 determines the sustainable balance of green hydrogen, comprehensively simulates the substitution rate of fossil fuels in a logical sequence, and applies to climatological, technological, and economic conditions for Colombia. It starts with the solar radiation and wind potential of the site, calculates the area required to produce the necessary green hydrogen, simulates sustainable water per basin, determines fossil energy consumption, simulates substitution scenarios, and calculates greenhouse gas emissions. This sequence can be adjusted at all stages of the process, highlighting that the data utilized reflects actual conditions specific to Colombia. Unlike other simulation models, such as those of NREL, which work with information referenced to conditions in the United States of America and can generate representative distortions in the results if the input information is not adjusted at the modeling site.
The MODERHydrogen-H2 framework has demonstrated its applicability for the integration of green hydrogen into the Colombian energy matrix and for the recognition of renewable and sustainable energy perspectives. The assessment involves conditioning factors such as the ‘Aridity Index’ and the historical behavior of the El Niño ENSO phenomenon, which were identified as fundamental for assessing the water balance, hydrogen production, and water sustainability. The environmental and cultural dimension is a strength as it involves the development of projects in areas of environmental fragility, such as natural parks, environmental reserves, and indigenous and Afro-descendant territories.
The model was compared to the H2A from the National Renewable Energy Laboratory (NREL) of levelized costs of hydrogen production from solar energy and polymer membranes, starting with the amount of kg of hydrogen needed and calculating the power and solar or wind generation, the required land area, emissions, and taxes to arrive at average prices per kg produced. Unlike the ENERHIDROGEN model, which begins with the amount of solar radiation, calculates the area required to produce the necessary green hydrogen, assesses fossil energy consumption, creates substitution scenarios, and calculates greenhouse gas emissions, it generates the energy flow and provides the necessary information to build the substitution energy matrix. In this sense, each model has a different objective but can be complementary.
The limitation of the model may lie in the acquisition of updated and reliable information. Likewise, this model does not reach detailed levels, such as technological aspects in fuel substitution, equipment efficiencies, risk analysis, and uncertainty. However, this model raises the need for new research and proposals to finance the continuation of investigations that complement the strength of the model.
The environmental benefit of using green hydrogen was found to be significant due to the reduction in CO2 emissions by substituting fossil fuels. This model can be applied to other countries, facilitating the development of the energy transition by encouraging the formulation of policies aimed at replacing fossil fuels with affordable, clean, and sustainable energy, in line with the Sustainable Development Goals.
Author Contributions
Conceptualization, J.D., R.Q., and J.Q.-B.; methodology, J.D., R.Q., and J.Q.-B.; software, R.Q.; resources, R.Q.; writing—original draft preparation, R.Q. and J.Q.-B.; writing—review and editing, J.D.; supervision, R.Q. and J.D.; project administration, R.Q.; funding acquisition, R.Q. All authors have read and agreed to the published version of the manuscript.
Funding
This research received no external funding.
Institutional Review Board Statement
Not applicable.
Informed Consent Statement
Not applicable.
Data Availability Statement
Dataset available on request from the authors.
Acknowledgments
The authors acknowledge the following institutions for their collaboration and support in the development of this work: Universidad Nacional de Colombia, Centro de Investigaciones Energéticas Medioambientales y Tecnológicas (CIEMAT), Centro Nacional del Hidrógeno and Fundación para el Desarrollo de Nuevas Tecnologías del Hidrógeno (Spain), Inter-American Development Bank, Colombian Institute of Hydrology, Meteorology and Environment (IDEAM), Agustin Codazzi Colombian Geographic Institute (IGAC) and Ministry of Science, Technology and Innovation—in the project Prospects and technological development in the production, complementarity with other energy sources and uses of hydrogen in Antioquia.
Conflicts of Interest
The authors declare no conflicts of interest.
Abbreviations
The following abbreviations are used in this manuscript:
| AI | Aridity Index |
| BID | Inter-American Development Bank |
| CIEMAT | Centro de Investigaciones Energéticas, Medioambientales y Tecnológicas |
| DANE | National Statistics Department |
| DNP | National Planning Department |
| ENA | National Water Study |
| ENERGIS | Geographic Information System–Sustainable Energy Module |
| ENERHYDROGEN | Green Hydrogen Calculator Module |
| ENERDEM | Sustainable Energy Demand Module |
| ENSO | El Niño Southern Oscillation |
| ESMAP | Energy Sector Management Assistance Program |
| GHG | Greenhouse Gas |
| GIS | Geographic Information System |
| H2 | Hydrogen |
| ITCZ | Intertropical Convergence Zone |
| IDEAM | Colombian Institute of Hydrology, Meteorology, and Environment |
| IGAC | Agustin Codazzi Colombian Geographic Institute |
| IPCC | Intergovernmental Panel on Climate Change |
| OLADE | Latin American Energy Organization |
| LEAP | Long-Energy Alternative Planning |
| MODERGIS | Renewable Energy Model |
| MODERHydrogen-H2 | Green Hydrogen Sustainable Energy Model |
| NREL | National Renewable Energy Laboratory |
| SDGs | Sustainable Development Goals |
| TJ | Tera Joule |
| UNC | National University of Colombia |
| UPME | Mining and Energy Planning Unit |
References
- Colombia’s Hydrogen Roadmap; Ministerio de Minas y Energía: Bogota, Colombia, 2021; p. 50.
- Nicoletti, G.; Arcuri, N.; Nicoletti, G.; Bruno, R. A technical and environmental comparison between hydrogen and some fossil fuels. Energy Convers Manag. 2015, 89, 205–213. [Google Scholar] [CrossRef]
- Velazquez Abad, A.; Dodds, P.E. Green hydrogen characterisation initiatives: Definitions, standards, guarantees of origin, and challenges. Energy Policy 2020, 138, 111300. [Google Scholar] [CrossRef]
- Naseem, K.; Khalid, F.; Qin, F.; Zhu, J.; Suo, G.; Shah, B.A.; Mubasher. The catalytic role of cubic iron oxide coated graphene oxide for hydrogen generation via hydrolysis of Magnesium. Renew. Energy 2026, 256, 124515. [Google Scholar] [CrossRef]
- Janmontree, J.; Zadek, H.; Ransikarbum, K. Analyzing solar location for green hydrogen using multi-criteria decision analysis. Renew. Sustain. Energy Rev. 2025, 209, 115102. [Google Scholar] [CrossRef]
- Romero-Ramos, J.A.; Arias, I.; Escobar, R.A.; Macía, Y.M.; Pérez-García, M. Assessing green hydrogen production potential using photovoltaic solar energy in industrial buildings of southeastern Spain. Int. J. Hydrogen Energy 2025, 112, 418–432. [Google Scholar] [CrossRef]
- Attiaoui, M.; Amrani, S.E.; Silva, H.G.; Neto, J.; Alami Merrouni, A. Techno-economic and GIS mapping of wind-driven hydrogen production in Portugal. Int. J. Hydrogen Energy 2025, 151, 150157. [Google Scholar] [CrossRef]
- Liu, J.; Ma, X.; Lu, C. A three-stage framework for optimal site selection of hybrid offshore wind-photovoltaic-wave-hydrogen energy system: A case study of China. Energy 2024, 313, 133723. [Google Scholar] [CrossRef]
- MRC Consultants and Transaction Advisers (España); PSR Energy Consulting and Analytics (Brasil). La Transición Energética de América Latina y el Caribe. Una Visión de sus Oportunidades y Desafíos Hasta 2050. In Contexto Actual y Caminos Para el Futuro en Colombia; CAF: Caracas, Venezuela, 2024; Available online: https://www.bce.fin.ec/economiatricolor/storage/sites/2/2025/05/CAF_Transicion_energetica_2050.pdf (accessed on 12 December 2025).
- Review Energy. Las Energías Renovables en Colombia Crecerán un 35% en 2025. 2 June 2025. Available online: https://www.review-energy.com/otras-fuentes/las-energias-renovables-en-colombia-creceran-un-35-en-2025 (accessed on 15 August 2025).
- United Nations Climate Change. The Paris Agreement. Available online: https://unfccc.int/sites/default/files/english_paris_agreement.pdf (accessed on 15 August 2025).
- Marín-Ramírez, R. Colombia Potencia Hídrica; Sociedad Geográfica de Colombia: Bogota, Colombia, 2003; Available online: https://www.sogeocol.edu.co/documentos/06colo.pdf (accessed on 20 November 2025).
- Quijano, R.; Dominguez, J.; Botero, S. MODERGIS Application: Integrated simulation platform to promote and develop renewable sustainable energy plans, Colombian case study. Renew. Sustain. Energy Rev. 2012, 16, 5176–5187. [Google Scholar] [CrossRef]
- Myers, N.; Mittermeler, R.A.; Mittermeler, C.G.; Da Fonseca, G.A.B.; Kent, J. Biodiversity hotspots for conservation priorities. Nature 2000, 403, 853–858. [Google Scholar] [CrossRef] [PubMed]
- World Bank Group. 10 Years of Green Bonds: Creating the Blueprint for Sustainability Across Capital Markets. Available online: https://www.worldbank.org/en/news/immersive-story/2019/03/18/10-years-of-green-bonds-creating-the-blueprint-for-sustainability-across-capital-markets (accessed on 18 August 2025).
- Stockholm Environment Institute. LEAP: The Long-Range Energy Alternatives Planning System; Stockholm Environment Institute: Somerville, MA, USA, 2021; Available online: https://openei.org/wiki/Long_range_Energy_Alternatives_Planning_(LEAP)_System (accessed on 20 September 2019).
- Unidad de Planeación Minero Energética Balances (UPME). Balances de Energia Final y Util 2018; Unidad de Planeación Minero Energética Balances (UPME): Bogotá, Colombia, 2019. Available online: www.upme.gov.co (accessed on 20 September 2019).
- OLADE—Organizacion Latinoamericana de Energia. Manual Balances de Energía Util en Latinoamerica; OLADE: Quito, Ecuador, 2017; Available online: www.olade.org (accessed on 20 January 2022).
- Instituto Geográfico Agustín Codazzi IGAC. Cartografía Politico-Administrativa de Colombia; IGAC: Bogotá, Colombia, 2012. [Google Scholar]
- Escobar, J.; Betaikiir, T.; Palacio, C.; Muriel, R. Los retos de la enseñanza de los Sistemas de Información Geográfica integrados a la gestión del medio ambiente y los recursos naturales. Gest. Ambiente 2010, 11, 125–136. [Google Scholar]
- Instituto de Hidrología; Meteorología y Estudios Ambientales (IDEAM). Tiempo y clima. Available online: https://www.ideam.gov.co/tiempo-y-clima (accessed on 15 August 2025).
- Energy Sector Mapping Assistan Program (ESMAP). RE Resource Mapping. Available online: https://www.esmap.org/re_mapping (accessed on 15 August 2025).
- World Bank. Global Solar Atlas. Available online: https://globalsolaratlas.info/map (accessed on 15 August 2025).
- ENERHIDROGEN. Available online: https://enerhidrogen.web.app/ (accessed on 5 February 2024).
- JINGSUN SOLAR. Available online: https://www.jingsun-power.com/solar-panel/mono-solar-panel/750w-solar-panel.html (accessed on 15 August 2025).
- VESTAS. Available online: https://en.wind-turbine-models.com/turbines/2343-vestas-v162-6.2-enventus (accessed on 15 August 2025).
- Energy and Gas Regulatory Commission. Resolution 101 7 of 2023, Which Defines the Methodology for Determining Firm Energy for the Reliability Charge for Photovoltaic Plants and Regulates other Provisions. Available online: https://gestornormativo.creg.gov.co/gestor/entorno/docs/resolucion_creg_101-7_2023.htm (accessed on 8 January 2026). (In Spanish)
- Energy and Gas Regulatory Commission. Resolution 101 6 of 2023, Which Defines the Methodology for Determining Firm Energy for the Reliability Charge for Wind Farms and Regulates other Provisions. Available online: https://gestornormativo.creg.gov.co/gestor/entorno/docs/resolucion_creg_101-6_2023.htm (accessed on 8 January 2026). (In Spanish)
- Montealegre-Bocanegra, J.E. Modelo Institucional del IDEAM Sobre el Efecto Climático de los Fenómenos El Niño y La Niña en Colombia; IDEAM: Bogota, Colombia, 2007. [Google Scholar]
- IDEAM. Estudio Nacional del Agua en Colombia; Panamerica Formas e Impresos S.A: Bogotá, Colombia, 2019. [Google Scholar]
- Unidad de Planeación Minero Energétca UPME. Available online: https://www1.upme.gov.co/DemandayEficiencia/Paginas/BECO.aspx (accessed on 18 August 2025).
- Departamento Nacional de Planeación DNP. Available online: https://www.dnp.gov.co/ (accessed on 18 August 2025).
- Departamento Nacional de Estadistica DANE. Available online: https://www.dane.gov.co/ (accessed on 18 August 2025).
- Law 1964 of 11 July 2019. Promoting the Use of Electric Vehicles in Colombia and Establishing Other Provisions. Available online: https://www.minambiente.gov.co/wp-content/uploads/2021/06/ley-1964-2019.pdf (accessed on 18 August 2025). (In Spanish)
- Energy.gov. Hydrogen Programme. DOE H2A Production Analysis. Available online: https://www.hydrogen.energy.gov/program-areas/systems-analysis/h2a-analysis/h2a-production (accessed on 18 August 2025).
- NEL. Water Electrolysers/Hydrogen Generators. Available online: https://nelhydrogen.com/water-electrolysers-hydrogen-generators (accessed on 18 August 2025).
- Institute for Global Environmental Strategies. The IPCC Guidelines for National Greenhouse Gas Inventories; Institute for Global Environmental Strategies: Bracknell, Ginebra, 2006. [Google Scholar]
- NREL. H2A: Hydrogen Analysis Production Models. Available online: https://www.nrel.gov/hydrogen/h2a-production-models (accessed on 18 August 2025).
- Rahmouni, S.; Negrou, B.; Settou, N.; Dominguez, J.; Gouareh, A. Prospects of hydrogen production potential from renewable resources in Algeria. Int. J. Hydrogen Energy 2017, 42, 1383–1395. [Google Scholar] [CrossRef]
- IDEAM; PNUD; MADS; DNP; Cancilleria. Inventario Nacional y Departamental de Gases de Efecto Invernadero, Tercera Comunicación de Cambio Climatico; Zetta Comunicadores: Bogotá, Colombia, 2016. [Google Scholar]
- Wei, S.; Sacchi, R.; Tukker, A.; Suh, S.; Steubing, B. Future environmental impacts of global hydrogen production. Energy Environ. Sci. 2024, 17, 2157–2172. [Google Scholar] [CrossRef]
- UPME. Proyecciones de Demanda. Available online: https://www1.upme.gov.co/DemandayEficiencia/Paginas/Proyecciones-de-demanda.aspx (accessed on 18 August 2025).
- Vartiainen, E.; Breyer, C.; Moser, D.; Román Medina, E.; Busto, C.; Masson, G.; Bosch, E.; Jäger-Waldau, A. True Cost of Solar Hydrogen. Solar RRL 2021, 6, 2100487. [Google Scholar] [CrossRef]
- Almutairi, K.; Hosseini Dehshiri, S.S.; Hosseini Dehshiri, S.J.; Mostafaeipour, A.; Techato, K. An economic investigation of the wind-hydrogen projects: A case study. Int. J. Hydrogen Energy 2022, 47, 25880–25898. [Google Scholar] [CrossRef]
- h2lac Plataforma Para el Desarrollo del Hidrogeno Verde en Latinoamérica y el Caribe. Available online: https://h2lac.org/archivos/infografia-sobre-el-estado-del-hidrogeno-verde-en-america-latina-y-el-caribe/ (accessed on 15 October 2025).
- Burdack, A.; Duarte-Herrera, L.; López-Jiménez, G.; Polklas, T.; Vasco-Echeverri, O. Techno-economic calculation of green hydrogen production and export from Colombia. Int. J. Hydrogen Energy 2023, 48, 1685–1700. [Google Scholar] [CrossRef]
- UPME—Planes Expansión Generación Transmisión. Available online: https://www1.upme.gov.co/siel/Pages/Planes-expansion-generacion-transmision.aspx (accessed on 18 August 2025).
- Nicita, A.; Maggio, G.; Andaloro, A.P.F.; Squadrito, G. Green hydrogen as feedstock: Financial analysis of a photovoltaic-powered electrolysis plant. Int. J. Hydrogen Energy 2020, 45, 11395–11408. [Google Scholar] [CrossRef]
- Datosmacro. Available online: https://datosmacro.expansion.com/energia-y-medio-ambiente/emisiones-co2 (accessed on 18 August 2025).
- IRENA. Estadísticas de Energías Renovables 2024; Agencia Internacional de Energías Renovables: Abu Dabi, United Arab Emirates, 2024; Available online: www.irena.org/Publications/2024/Jul/Renewable-energy-statistics-2024 (accessed on 30 December 2025).
- IEA. World Energy Balances; last updated August 2025; International Energy Agency: Paris, France, 2025; Available online: https://www.iea.org/data-and-statistics/data-product/world-energy-balances (accessed on 30 December 2025).
| Disclaimer/Publisher’s Note: The statements, opinions and data contained in all publications are solely those of the individual author(s) and contributor(s) and not of MDPI and/or the editor(s). MDPI and/or the editor(s) disclaim responsibility for any injury to people or property resulting from any ideas, methods, instructions or products referred to in the content. |