Article

Clonogenic Survival RBE Calculations in Carbon Ion Therapy: The Importance of the Absolute Values of α and β in the Photon Dose-Response Curve and a Strategy to Mitigate Their Anticorrelation

Department of Radiation Oncology, Mayo Clinic, Jacksonville, FL 32224, USA
*
Author to whom correspondence should be addressed.
Quantum Beam Sci. 2023, 7(1), 3; https://doi.org/10.3390/qubs7010003
Submission received: 23 December 2022 / Revised: 24 January 2023 / Accepted: 25 January 2023 / Published: 28 January 2023
(This article belongs to the Special Issue Quantum Beam Science: Feature Papers 2022)

Abstract

:
The computation of the relative biological effectiveness (RBE) is a fundamental step in the planning of cancer radiotherapy treatments with accelerated ions. Numerical parameters derived analyzing the dose response of the chosen cell line after irradiation to photons (i.e., α and β, namely the linear and quadratic terms of the linear-quadratic model of cell survival) are generally used as input to biophysical models to predict the ion RBE. The α/β ratio for the photon exposure is generally regarded as an indicator of cell radiosensitivity. However, previous studies suggest that α/β might not be a sufficient parameter to model the RBE of relatively high linear energy transfer (LET) radiation such as carbon ions. For a fixed α/β, the effect of the absolute values of α and β on the computed RBE is underexplored. Furthermore, since α and β are anticorrelated during the fit of the photon-exposed in vitro survival data, different linear-quadratic fits could produce different sets of α and β, thus affecting the RBE calculations. This article reports the combined effect of the α/β ratio and the absolute values α and β on the RBE computed with the Mayo Clinic Florida microdosimetric kinetic model (MCF MKM) for 12C ions of different LET. Furthermore, we introduce a theory-based strategy to potentially mitigate the anticorrelation between α and β during the fit of the photon dose-response biological data.

1. Introduction

Cancer radiation therapy with accelerated ions was proposed as an alternative to conventional radiotherapy with X-rays due to its advantageous physical characteristics [1]. Unlike X-rays, the ion energy deposition increases with decreasing ion energy. Therefore, the energy of the ion beams can be precisely tuned so that the particles stop within the tumor volume, thus minimizing the radiation dose to the surrounding healthy tissues [2] and reducing the risk of malignant secondary effects [3]. However, ions are well known to have a denser pattern of energy deposition per unit of path (i.e., a higher linear energy transfer, LET). This higher LET is associated with markedly different biological effects [4], especially for treatments with carbon ions [5,6].
In order to account for this different relative biological effectiveness (RBE), computational models of radiation-induced effects are used during the planning of ion therapy treatments. Among all the developed models, the mixed beam model [7], the first version of the local effect model (LEM I [8]), and the modified microdosimetric kinetic model (modified MKM [9]) are currently implemented in clinics [10,11,12,13,14]. The modeled endpoint is clonogenic survival [15,16] due to its relevance for tumor control calculations [17,18,19]. Although differences are present between the models and their formalism [20,21], the key idea is to describe and predict the cell survival after high LET irradiation by knowing the response of the cell to sparsely ionizing radiation such as photons. A subset of ion-exposed data is generally used for the determination of the model parameters.
In view of the upcoming proton and carbon ion therapy center of Mayo Clinic in Jacksonville (Florida, United States of America) [22], we recently developed a model named Mayo Clinic Florida microdosimetric kinetic model (MCF MKM) [23,24]. The MCF MKM is based on the experience gathered with previous microdosimetric models [9,25,26,27,28] and the hypothesis that the DNA damage clustering over giant loops of chromatin (subnuclear structures containing approximately 2 Mbp) has a leading role in determining the cell survival after a radiation insult [29]. The latter hypothesis is shared with different RBE models based on the amorphous track structure [30,31] instead of microdosimetry. Thanks to new strategies to determine a priori the model parameters based on the results of morphometric and karyotypic cell measurements [23,24], the RBE calculations with the MCF MKM can be performed knowing the in vitro clonogenic survival after exposure to photons only. It follows that an accurate estimation of the surviving dose response after the photon exposure is of utmost importance.
Since the in vitro clonogenic survival data (i.e., the surviving fraction S as a function of the absorbed dose D) are discrete, an interpolation is generally performed by means of the linear-quadratic model (Equation (1)) [32].
S = exp ( α D β D 2 )
where α and β are exposure- and cell-specific fitting parameters.
However, α and β are anticorrelated during the LQM fit [33]. Therefore, different couples of LQM terms can be obtained by fitting the same in vitro survival curve using different minimization algorithms and constraints or by independent users. A preliminary study for conference proceedings [34] showed that the RBE10% of two human cell lines calculated with the MCF MKM could be significantly different if dissimilar published sets of LQM terms (obtained by different authors fitting the same photon survival curve) were used as input for the calculations. It must be noted that these different LQM sets (α and β for the photon reference radiation, named αref and βref here and in the following) could lead to markedly dissimilar αref/βref ratios for the same in vitro survival curve. For instance, αref/βref values of 3.5 and 6.9 Gy were obtained for photon-exposed human brain glioblastoma cells (A-172 cell line) [34]. Since the αref/βref ratio is used as a relevant parameter for RBE calculations with models other than the MCF MKM (i.e., proton phenomenological models [35]) and for fractionation studies [36], it is very important to assess it accurately.
As an example, the biologically effective dose (BED) for a treatment composed of 20 fractions of 2 Gy was calculated with Equation (2) [37] for human brain glioblastoma cells (A-172 cell line) using the two published LQM fits reported for the same photon-irradiated survival curve (αref/βref respectively equal 3.5 Gy and 6.9 Gy [34]).
B E D = n d ( 1 + d α β )
n is the number of fractions, d is the absorbed dose per fraction, α and β are the LQM terms. In the case of accelerated ions, an extension of the BED formalism was proposed to account for their different RBE with respect to photons [38].
Despite being based on the same photon survival curve, the BED calculated using the results of the two different LQM fits was significantly different; namely, 62.9 Gy and 51.6 Gy for the LQM fits with αref/βref equal to 3.5 Gy and 6.9 Gy, respectively.
A fundamental parameter in the RBE calculations with MKMs is α0, namely α in the limit of LET → 0. Negative values α0 were reported in the case of cell lines with a low αref/βref [24,39]. However, the physical and biological meaning of these negative values of α0 (which might lead to the computation of unreasonable negative RBE values) is unclear, if any. It is possible that the anticorrelation between αref and βref is one of the causes behind the computation of these negative α0 values.
Finally, previous studies with protons suggest that the αref/βref after photon irradiation can be used as an indication of the radiosensitivity of the cell line for ion irradiations, with higher RBE values expected for cell lines with a lower αref/βref [35]. Similarly, in the case of carbon ions, higher RBE values were observed at low doses for cell lines with a lower αref/βref [6,23]. However, at higher doses (i.e., for a surviving fraction of 10% or 50%), the RBE values appear to not significantly depend on the αref/βref [6]. In addition, despite the ion RBE values calculated with the clinically implemented LEM I [8] for a fixed αref/βref were reported to be nearly independent of the absolute values of αref and βref [40], the knowledge of the absolute values of αref and βref appears to be necessary [41] for 12C ion RBE calculations with the latest version of the LEM (LEM IV [30]) and the modified MKM [9].
Considering all the above, this article aims to:
(1)
Study the effect of αref/βref on the RBE of 12C ions calculated with the MCF MKM.
(2)
Investigate the effect of the absolute value of αref and βref on the RBE of 12C ions computed using the MCF MKM in the case of two clinically relevant values of αref/βref (2 and 10 Gy).
(3)
Explore the possibility of mitigating the anticorrelation between αref and βref by means of an MKM-based LQM fit of published in vitro photon survival curves. The RBE values predicted with the MCF MKM in combination with the αref and βref obtained with this MKM-based LQM fit are compared with the RBE values computed using the published αref and βref values obtained by other authors fitting the same survival curve. A benchmark of the RBE against corresponding in vitro data for irradiations with 12C ions is also included.

2. Materials and Methods

2.1. Relative Biological Effectiveness

The relative biological effectiveness (RBE) is defined as the ratio between the absorbed dose needed to obtain the same biological effect for the reference radiation (Dref) and the radiation under investigation (D) (Equation (3)).
R B E = D r e f D
In this article, the reference radiation is photons, while the radiation under investigation is carbon ions. The biological endpoint is the in vitro clonogenic survival, as described with the LQM (Equation (1)). The RBE was evaluated as a function of the surviving fraction S (RBES) using Equation (4) [28].
R B E S = α + α 2 4   β ln ( S ) α r e f + α r e f 2 4   β r e f ln ( S )
where α, β, αref, and βref are the linear and quadratic terms of the LQM for the radiation under investigation and the reference photon exposure, respectively.

2.2. Mayo Clinic Florida Microdosimetric Kinetic Model (MCF MKM)

2.2.1. Historical Background

The microdosimetric kinetic model (MKM [25]) of clonogenic survival was developed to explain the enhanced killing effectiveness of ions with respect to photons by means of microdosimetry [42]. The cell nucleus was assumed to be composed of subnuclear radiation structures (radius ~0.2–0.4 µm) named domains where the accumulation of lethal and sublethal radiation damages leads to cell death. The effect of different radiation types within these domains is assessed by means of microdosimetric density distributions of stochastic quantities such as the lineal energy.
In the MKM [25], the linear term of clonogenic survival (α) represents the effect of lethal lesions, and it is calculated with Equation (5):
α = α 0 + β r e f   y ¯ D   ρ   π   r d 2
where α0 is the cell-specific value of α in the limit of y → 0 where y is the lineal energy, βref is the quadratic term of the LQM model for the reference photon exposure, y ¯ D   is the dose-mean lineal energy assessed in a domain with density ρ and radius rd.
The dose-mean lineal energy y ¯ D is computed as in Equation (6)
y ¯ D   =   y   d ( y )   d y
where d(y) is the dose probability density of the lineal energy y [42].
On the other hand, the quadratic term of clonogenic survival (β) is assumed to be radiation-independent and equal to that for the photon exposure (Equation (7) [25]), i.e.,:
β = β r e f
Once αref and βref are determined with Equation (1) by fitting the clonogenic survival curve after photon exposure, the two MKM parameters (α0 and rd) are generally assessed by fitting the results of ion-exposed in vitro experiments with Equation (5) [43].
Corrections to Equations (5) and (7) were afterward introduced to improve the agreement with the in vitro data by explicitly considering the overkill effects at high linear energy transfer (LET) and the radiation dependence of β [9,27,44,45]. However, this requires the determination of additional parameters, such as, for instance, the saturation parameter y0 in the modified MKM [9]. Nonetheless, it is worth mentioning that the results of these newer MKMs [25,27] were found to be equivalent to that of the original MKM [25] for LET < ~30 keV/µm [46], where Equations (5) and (7) are still valid.

2.2.2. MCF MKM Formalism

In the MCF MKM [23,24], α and β are calculated as in Equations (8) and (9).
α = α 0   ( 1 + β 0 α 0   y ρ   π   r d 2   ) c ( y )   d ( y )   d y =   α ( y )   d ( y )   d y
β =   β 0 [   c ( y ) d ( y )   d y   ] 2
where c(y) (Equation (10), adapted from [27]) is a correction factor accounting for the non-Poisson distribution of lethal lesions.
c ( y ) = 1 exp [ α 0 ( 1 + β 0 α 0   y ρ   π   r d 2   )   y ρ   π   R n 2 β 0   ( y ρ   π   R n 2 ) 2   ] α 0 ( 1 + β 0 α 0   y ρ   π   r d 2   )   y ρ   π   R n 2 + β 0   ( y ρ   π   R n 2 ) 2
y is the lineal energy, d(y) is the dose probability density of the lineal energy, α0 and β0 are the LQM terms in the limit of y → 0, R n is the mean radius of the cell nucleus, rd is the mean radius of the subnuclear domains, and ρ is the density (=1 g/cm3).

2.2.3. MCF MKM Parameters

Both MCF MKM parameters (Rn and rd) are assessed a priori without using clonogenic survival in vitro data [23,24]. As first choice, Rn can be determined by means of morphometric measurements for (unattached) cells presenting a spherical nucleus. However, this information is not always available. If the cross-sectional area A of the cell nucleus is reported, an estimate of the mean radius of the cell nucleus can be obtained with Equation (11) [23,24].
R n = A π   3 3
If also A is unavailable, an approximate value of Rn can be obtained using an empirical correlation between Rn and the mean DNA content of an asynchronized population Γ [Gbp] (Equation (12) [23,24])
R n = 3.5   µ m + 0.144   µ m Gbp   · Γ
The mean DNA content of an asynchronized population Γ is computed with Equation (13) [23,24]
Γ = γ   p   ξ
where γ is the normal DNA content for one set of chromosomes (3050 Mbp for humans, 2750 Mbp for rats, 2700 Mbp for Chinese hamsters, and 2650 Mbp for mice [47]), p is the ploidy number, and ξ is a factor accounting for the cell cycle distribution of the irradiated population (ξ = 4/3 for asynchronized cells [23]).
The ploidy number p is equal to 2 for healthy cell lines and for diploid cancer cells. Though mutated chromosomes might contain an abnormal amount of DNA, an approximated value of p for aneuploid cancer cells can be calculated with Equation (14) [23,24].
p = x x n
where x is the mean number of chromosomes in the aneuploid cell population and xn is the number of chromosomes in a normal set (23 for humans, 21 for rats, 11 for Chinese hamsters, and 20 for mice [47]).
In the MCF MKM, it is hypothesized that the subnuclear domains are giant loops of chromatin, subnuclear structures containing approximately 2 Mbp of DNA [29,48,49] where the accumulation of DNA damage leads to cell inactivation. Therefore, the mean radius of the subnuclear domains rd is computed with Equation (15) [23,24]
r d = R n λ Γ 3
where R n is the mean radius of the cell nucleus, λ is the mean amount of DNA in a chromatin substructure (2 Mbp), and Γ is the mean DNA content of the irradiated cell population.
Finally, since Rn and rd are known, and the correction factor c(y) (Equation (10)) is ~1 for the reference photon exposure [23], then
α 0 = α r e f β 0 y ¯ D , r e f   ρ   π   r d 2
β 0 = β r e f

2.3. Effect of αrefref on the Calculated RBE for 12C Ions

To investigate the effect of αref/βref for a model assumption of a fixed αref/βref, we carried out calculations with the MCF MKM for a synthetic cell line with Rn = 4.7 µm and rd = 0.29 µm. These parameters represent the mean of the corresponding values obtained for the cell lines used in previous works [23,24,34], where Rn ranged between 4.0 and 5.7 µm and rd ranged between 0.26 and 0.32 µm.
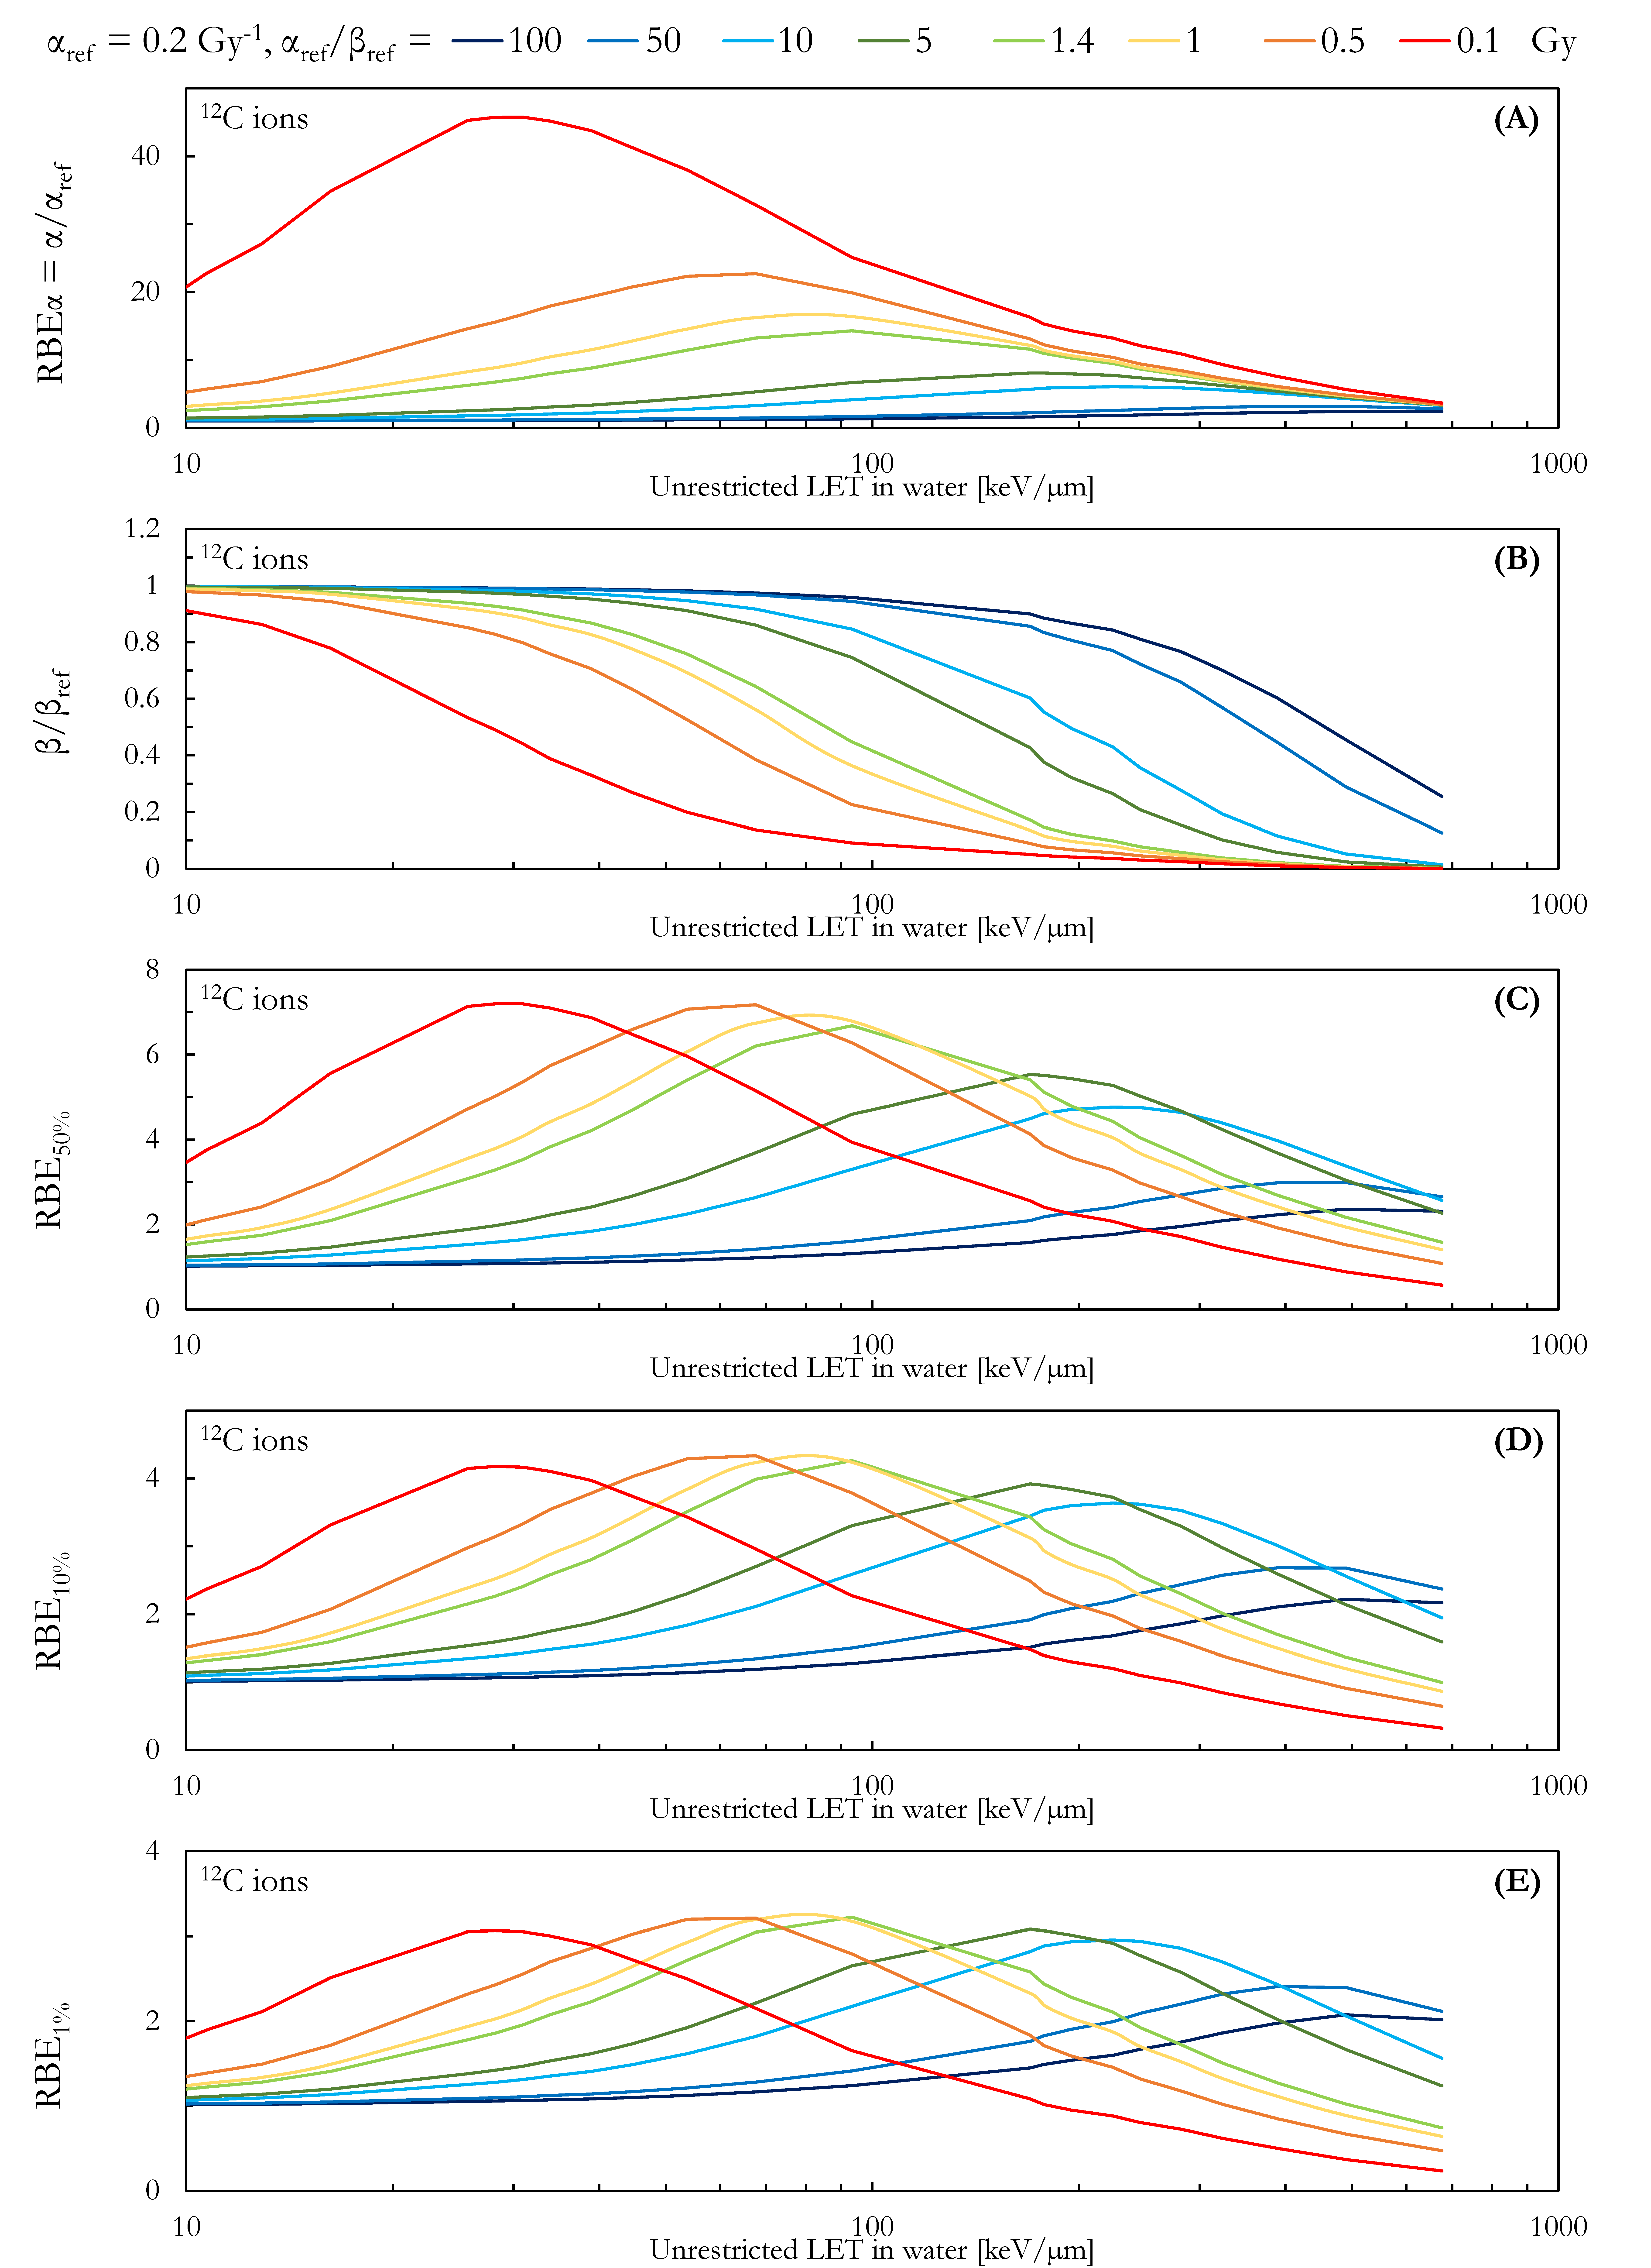
αref was fixed to 0.2 Gy−1 while αref/βref was set to 100 Gy, 50 Gy, 10 Gy, 5 Gy, 1.4 Gy (αref/βref for which α0~0, see Section 2.5), 1 Gy, 0.5 Gy, and 0.1 Gy. The values of 0.1 and 100 Gy were chosen as the lower and upper bounds of αref/βref for most of the published in vitro data [33,50], as shown in Figure 1. The value of αref = 0.2 Gy−1 was chosen as intermediate value for the cell lines analyzed in [23,24,34]. The effect of varying αref for a fixed αref/βref was evaluated in a second step, as described in Section 2.4.
The following quantities were calculated and compared as a function of the LET for 12C ions with energy between 1 and 1000 MeV/n: α/αref, β/βref, RBE50%, RBE10%, and RBE1%. The ratio α/αref is known as low dose RBE (RBEα) and can be derived from Equation (4) in the limit of S → 1. The reference radiation chosen for the RBE calculations was 6 MV X-rays ( y ¯ D , r e f   ~2.3 keV/μm [23]).

2.4. Effect of the Absolute Values of αref and βref on the Calculated RBE for 12C Ions
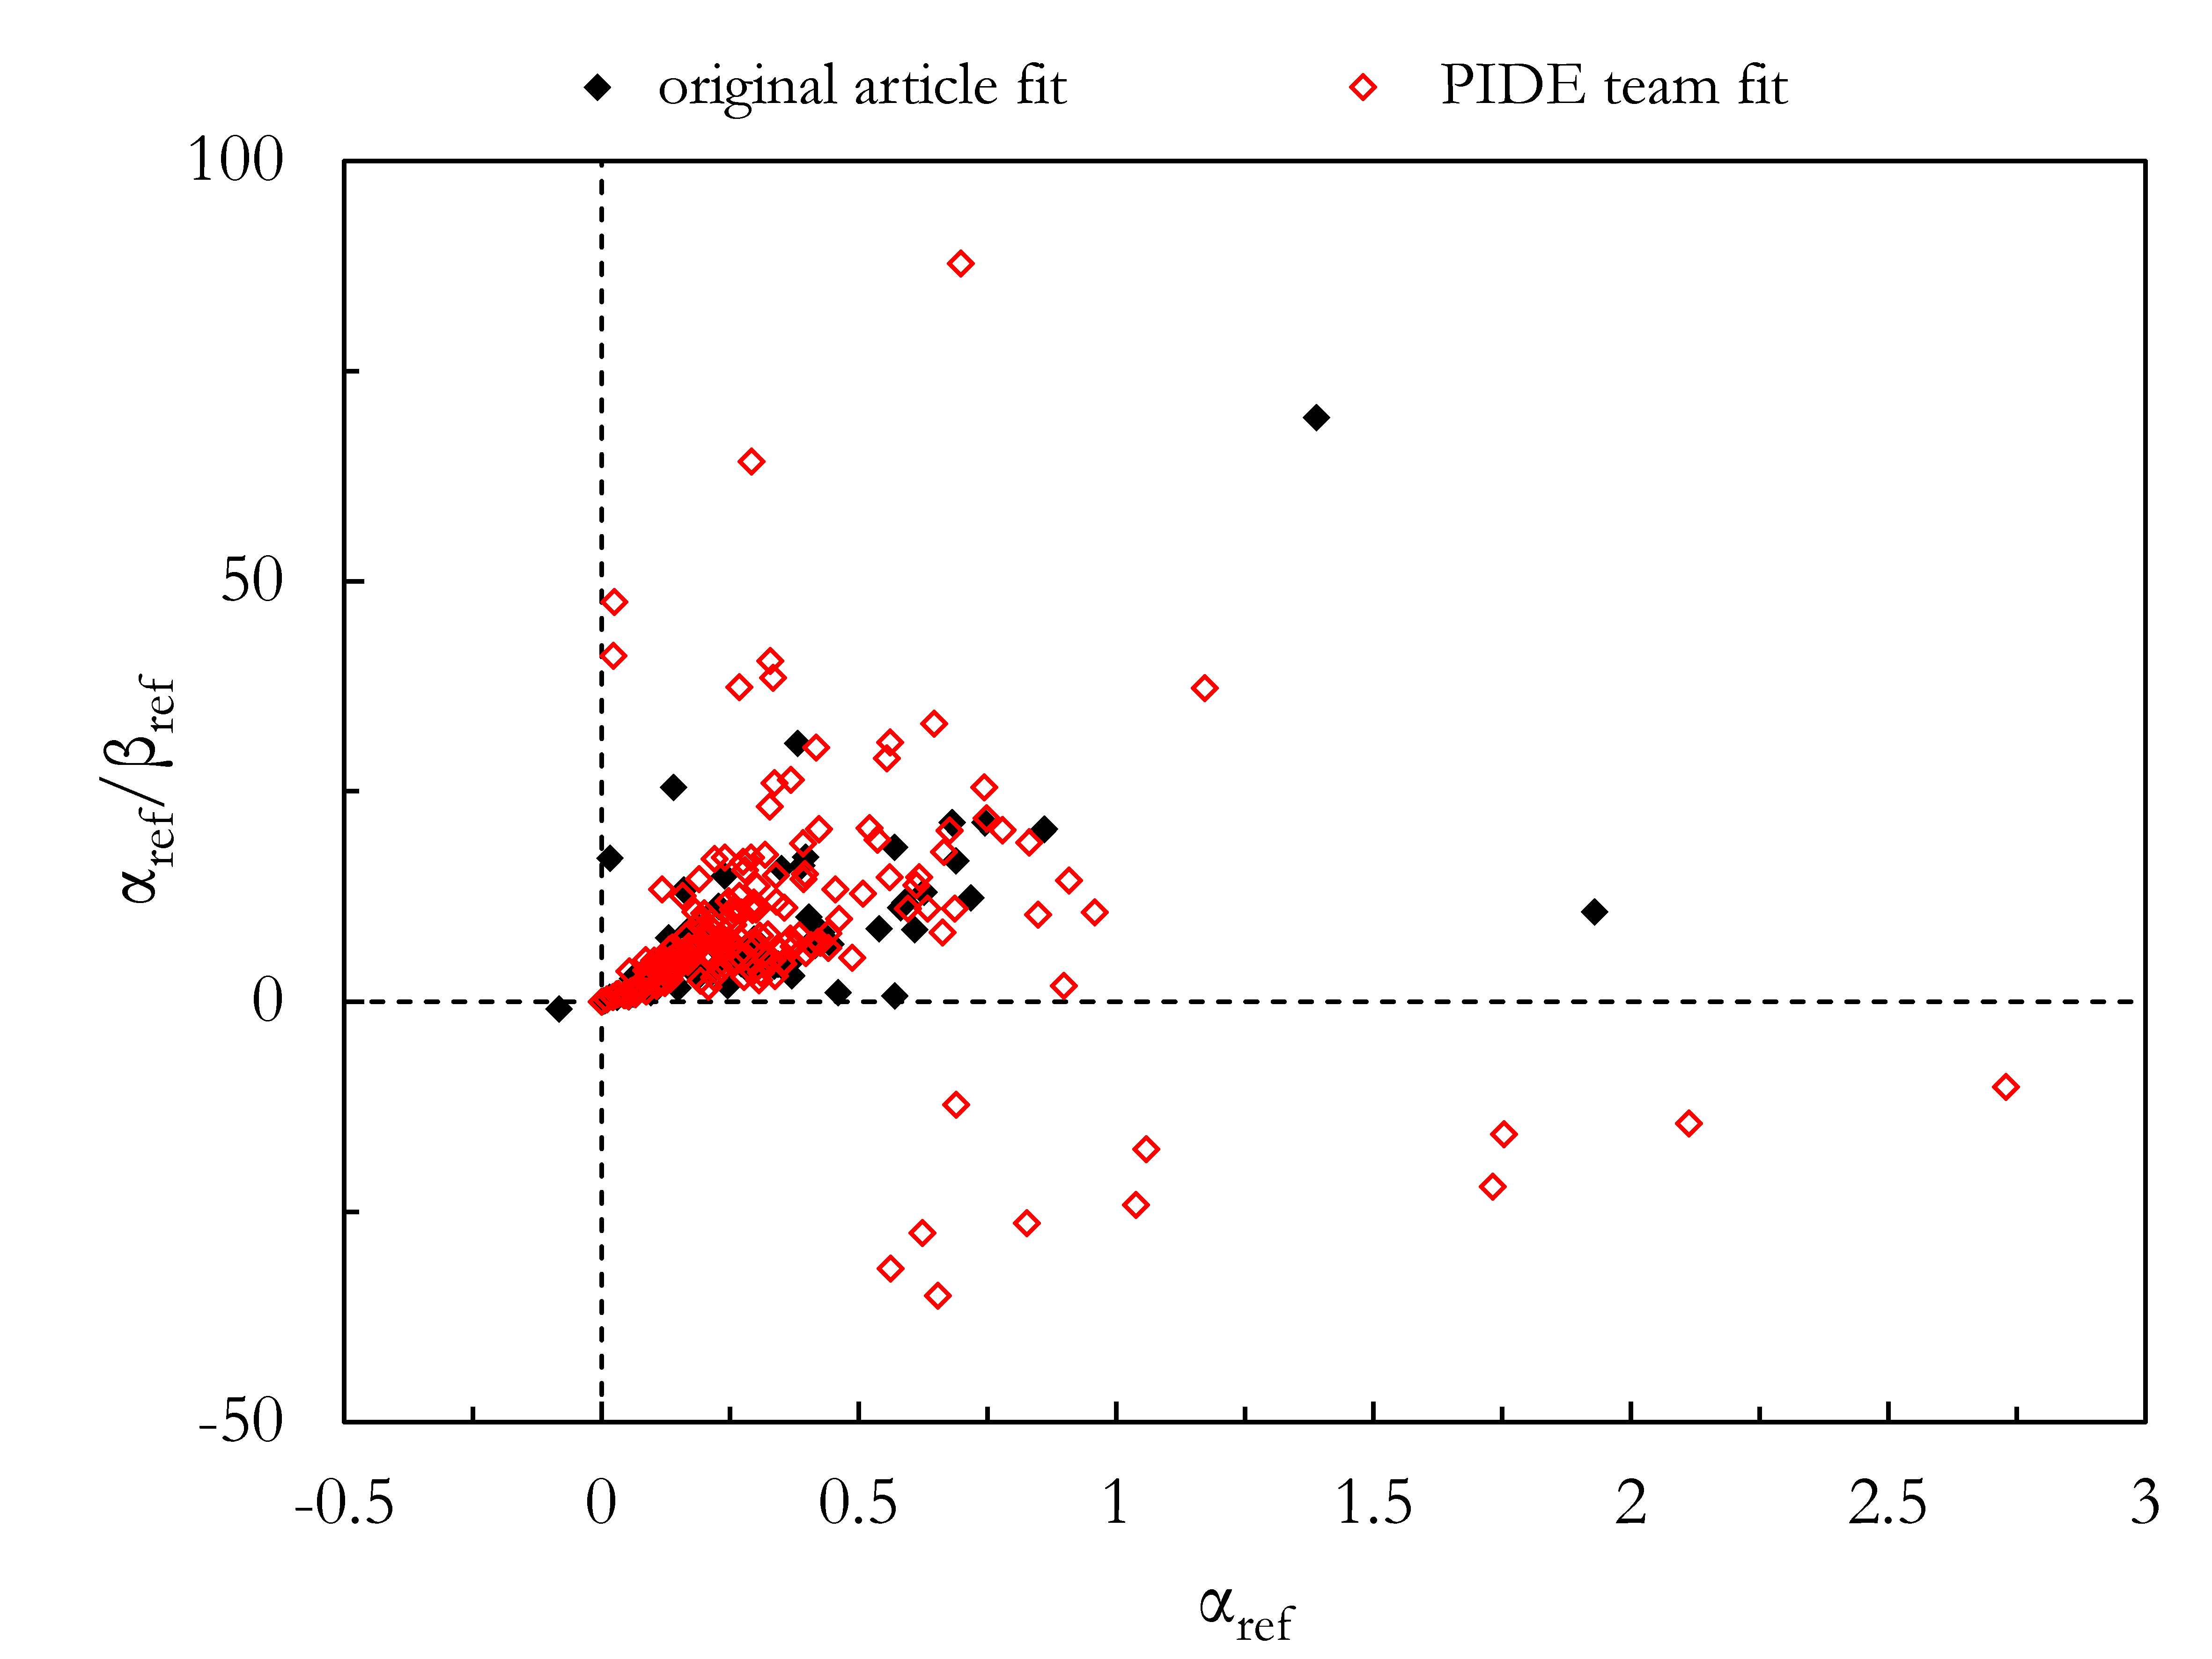
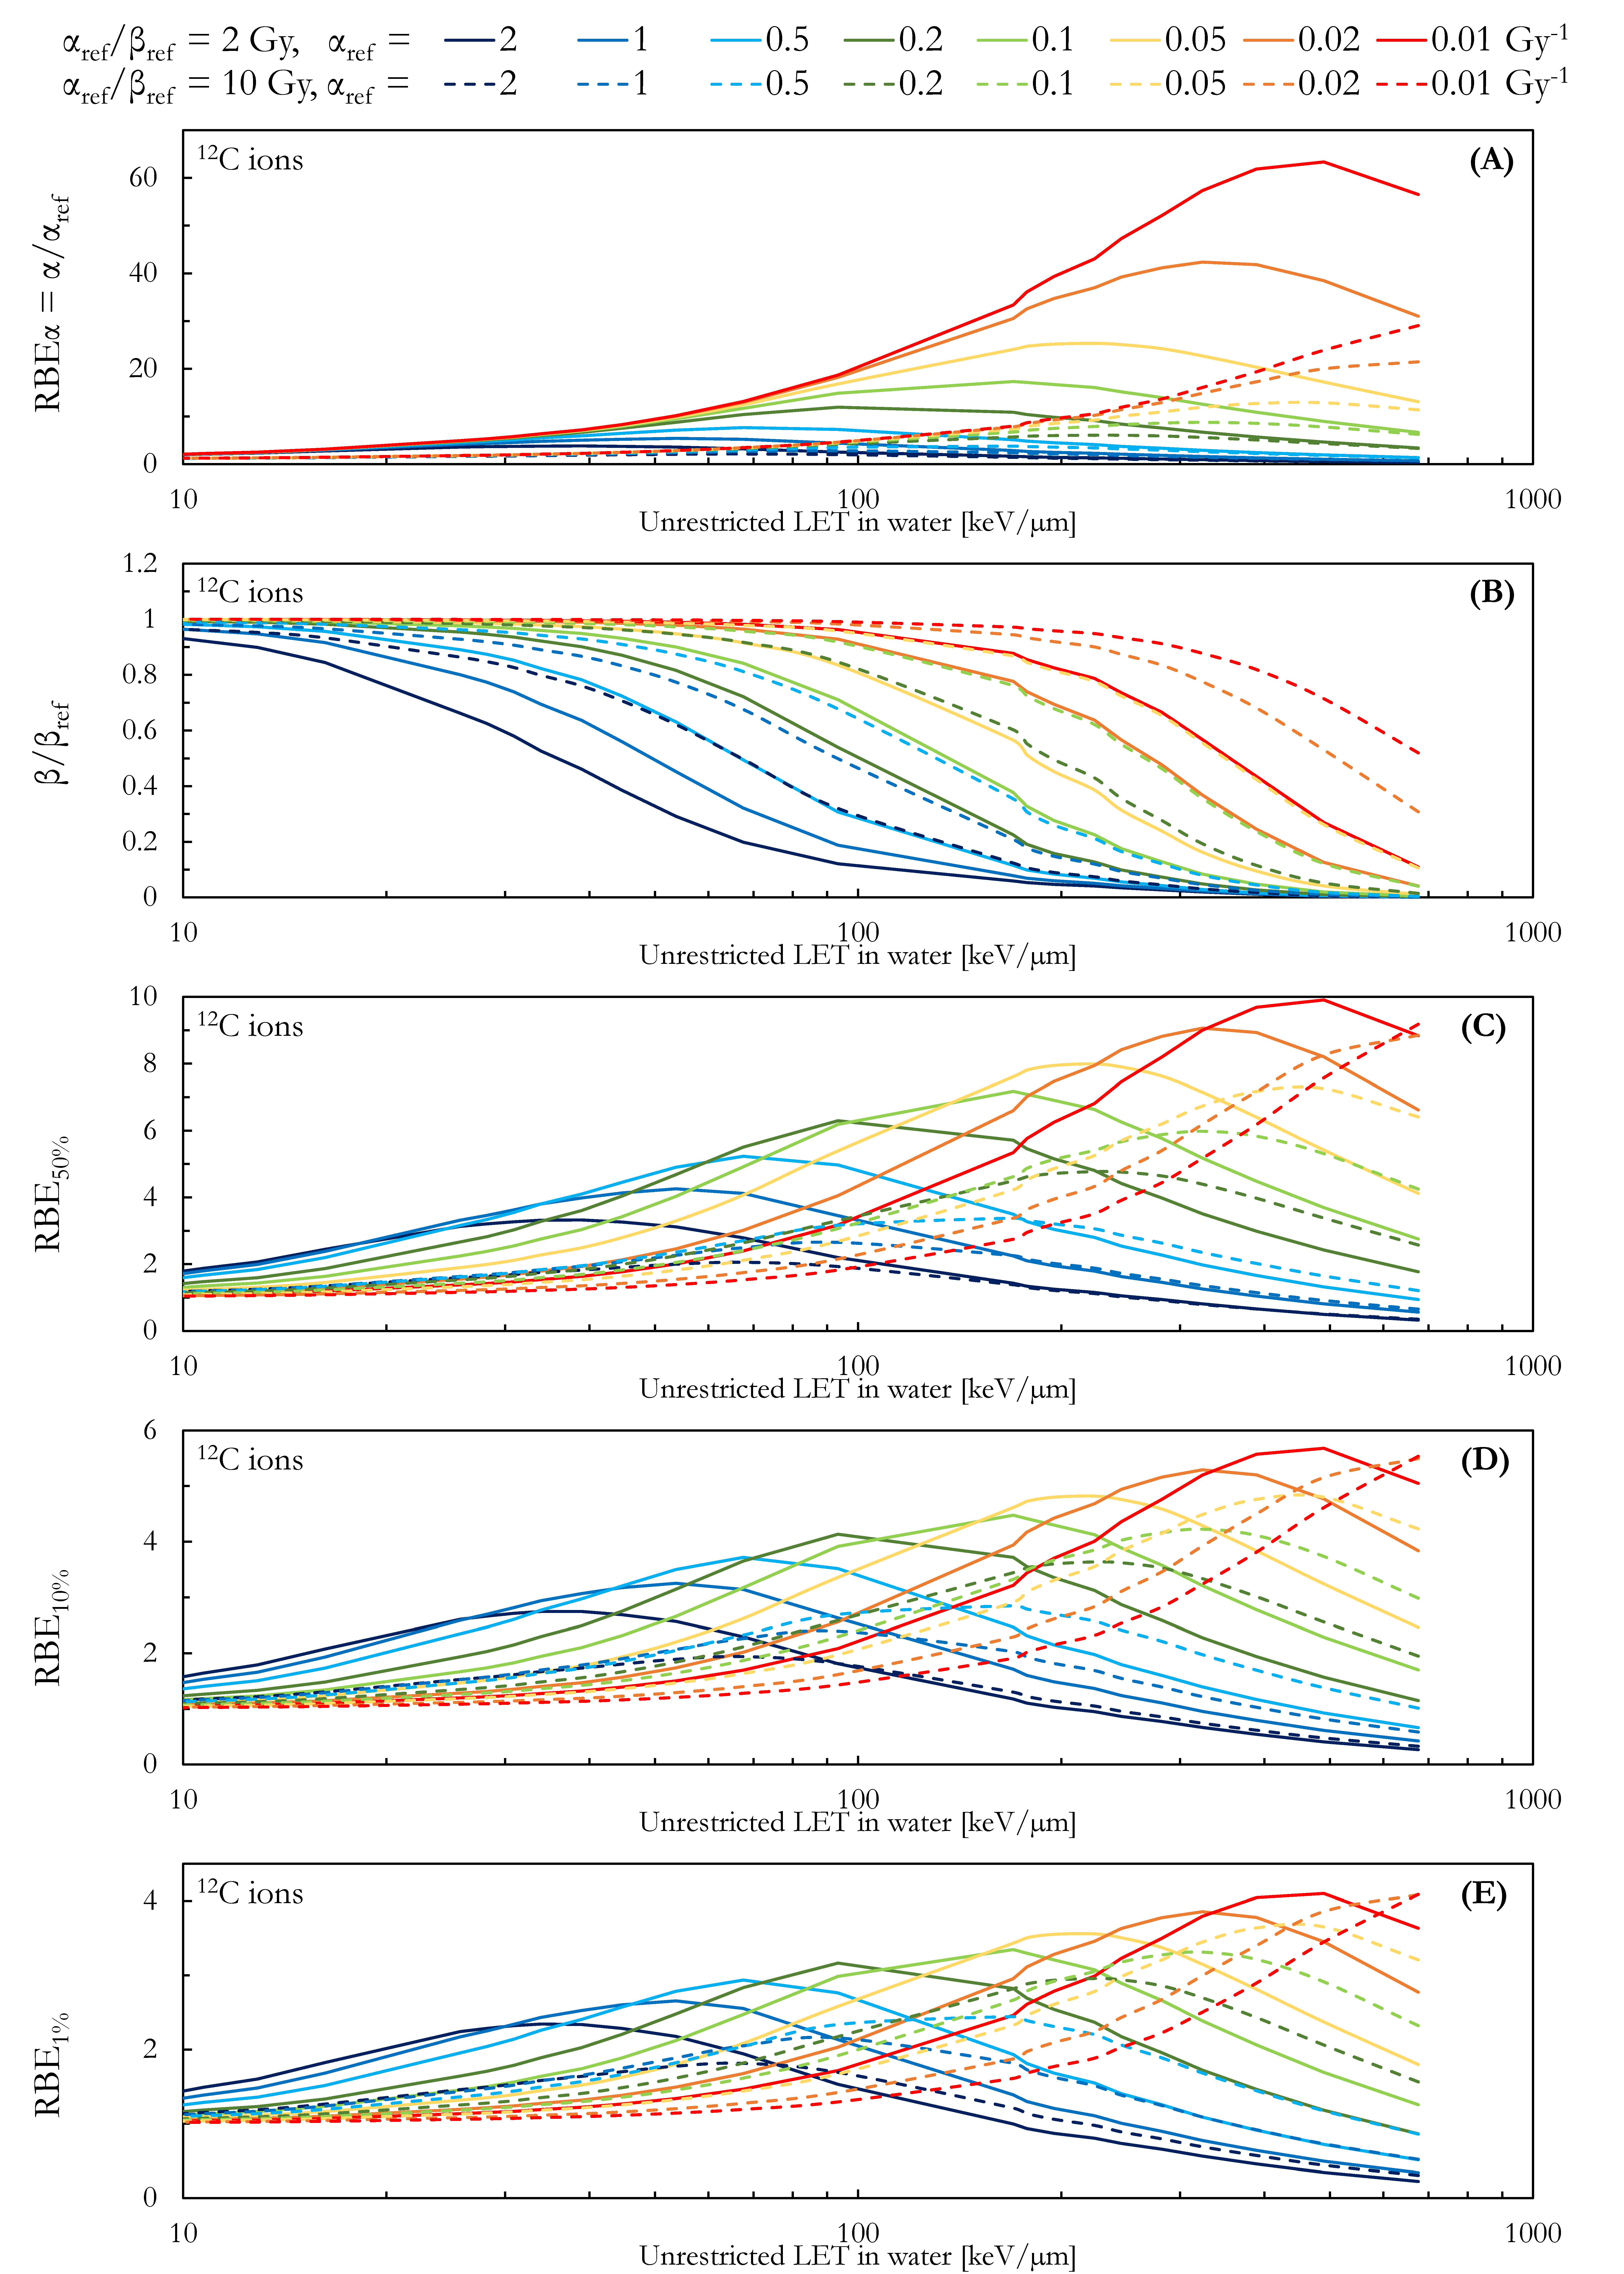
The RBE calculations of Section 2.3 were repeated in order to study the effect of the absolute values of αref and βref for two fixed values of αref/βref (2 and 10 Gy). These two αref/βref values were chosen because of their clinical relevance and for consistency with previous studies [35,51,52]. Once fixed the αref/βref ratio, αref was allowed to assume the following values: 2 Gy−1, 1 Gy−1, 0.5 Gy−1, 0.2 Gy−1, 0.1 Gy−1, 0.05 Gy−1, 0.02 Gy−1, and 0.01 Gy−1. The values of 2 and 0.1 Gy−1 were chosen as the lower and upper bounds of αref for most of the published in vitro data [33,50] (see Figure 1). The biological endpoints, the reference radiation, and the numerical values of Rn, rd, and y ¯ D , r e f   were the same of Section 2.3.
Figure 1. αref/βref plotted as a function of αref for the asynchronized in vitro data from PIDE 3.2 [53]. The two data series represent the results of the LQM fit performed by the authors of the original publication (full diamonds) and by the PIDE team (open diamonds). To improve the readability of the plot, two in vitro data points were excluded: αref = 1.73 Gy−1, αref/βref = −211 Gy; and αref = 1.04 Gy−1, αref/βref = 3059 Gy.
Qubs 07 00003 g001

2.5. MKM-Based Fit of the Photon Survival Curve

As mentioned before, the anticorrelation between α and β [54] during the LQM fit of the photon clonogenic survival data could produce very different sets of αref and βref. Since no physical nor biological constraints are generally applied during the LQM fits, null and negative values of both αref and βref were reported in literature [33]. This could immediately result in negative or infinite RBE values at low doses (RBEα).
Additionally, if α r e f < β r e f y ¯ D , r e f   ρ   π   r d 2 then negative α0 are calculated with Equation (16). Therefore, if the dose-mean lineal energy for the radiation under investigation ( y ¯ D   ) is lower than that for the reference radiation y ¯ D , r e f   , a negative α value is computed and thus a negative RBEα.
To prevent the occurrence of this effect and to possibly mitigate the anticorrelation between the two LQM terms during the fit of the in vitro clonogenic survival curve for the photon exposure, we propose that the latter is fitted with Equation (18)
S = exp ( ( α 0 + β 0 ρ π r d 2 y ¯ D , r e f   ) D β 0 D 2 )
under the condition of α0 ≥ 0.
Alternatively, the in vitro survival curve for the photon exposure can be fitted with the classic expression of the LQM (Equation (1)) in combination with the following numerically equivalent constraint (Equation (19)):
α β   y ¯ D , r e f   ρ   π   r d 2   ~   0.051   [ µ m 2 keV / µ m ]   y ¯ D , r e f   r d 2
As an example, for the synthetic cell line of Section 2.3 and Section 2.4 (rd = 0.29 µm, y ¯ D , r e f   = 2.3 keV/µm), this constraint is equal to αref/βref ≥ ~1.4 Gy.
We performed these MKM-based LQM fits using the Curve Fitting Tool of Matlab R2021 (The MathWorks Inc., Natick, MA, USA) based the “NonlinearLeastSquares” method and the “Trust-Region” algorithm

2.6. Effect of Different Fits of the Same Photon Survival Curve on the Calculated RBE for 12C Ions

Representative in vitro datasets from the Particle Irradiation Data Ensemble (PIDE) version 3.2 [33,53] were chosen to test the effect of different fits of the same in vitro photon survival curve (αref and βref) on the RBE calculated with the MCF MKM for 12C ions. PIDE is a database of in vitro clonogenic survival data for human and rodent cell lines exposed to photons and ions up to 238U. The following information is reported for each entry in PIDE: cell line details (name, human or rodent, tumor or healthy, synchronized or asynchronized), ion exposure details (ion energy, ion LET, monoenergetic or spread-out Bragg peak (SOBP)), the reference photons used (i.e., 200 kVp X-rays or 60Co γ-rays), and the results of the LQM fits (α, β, αref, and βref). When available, two sets of LQM terms are included for each entry in PIDE: the results of the LQM fits performed by the authors of the original publication and the results of LQM fits performed by the PIDE team. As performed in previous studies [23,24,46], we initially discarded entries for synchronized cells, irradiations along SOBPs, and exposures to ions with energy lower than 1 MeV/n. In the second step, we included only PIDE entries with non-negative values of β for the ion exposure. Negative β could be due to the presence of a more radioresistant cell subpopulation [53].
As a relevant example of datasets leading to negative values of α0, we selected the cell lines with most entries (for a specific ion) for which αref was equal to 0 in one of the two LQM sets (i.e., fit by the original author of the publication or by the PIDE team) and greater than 0 in the other photon LQM set: human astrocytoma cells (U-251MG cell line) and human mammary epithelial cells (M/10 cell line). In both cases, these two cell lines were irradiated with 12C ions. It must be stated that the RBE for the M/10 and the U-251MG cell lines was computed in previous work with the MCF MKM [24] using only the photon LQM terms with αref ≠ 0. These published RBE results were compared with the novel RBE calculations using the MCF MKM in combination with the photon LQM terms with αref = 0 and the new LQM terms obtained fitting the in vitro photon survival curve with the MKM-based approach of Section 2.7. The a priori assessed model parameters (rd and Rn) for both cell lines were extracted from [24] and listed in Table 1 together with the model parameters derived analyzing the different LQM fits of the photon in vitro survival curve (αref, βref, α0, β0). Additionally, in vitro data for human brain glioblastoma cells (A-172 cell line) irradiated with 12C ions were also included since marked differences were observed between the photon LQM terms (αref and βref) obtained by the original authors of the publication and by the PIDE team [34]. Different RBE10% values were computed when these two sets of photon-exposed LQM terms were used in combination with the MCF MKM [34]. In this work, we use these computed RBE10%s as a benchmark for the novel RBE calculation based on the αref and βref assessed with the MKM-based fit of Section 2.5. Furthermore, we extend the analysis to other RBE levels (RBEα, RBE50%, and RBE1%). The reference photon radiation was 137Cs γ-rays for the A-172 and U-251MG cell lines from [55], while 137Cs or 60Co γ-rays (not specified) for the M/10 cell line data from [56].

2.7. Computer Simulations

The computer simulations were carried out using the Particle and Heavy Ion Transport code System (PHITS [57]) version 3.24, following the methodology described in detail in previous works [23,24]. Therefore, only a summary is given here. The calculations were performed over an infinitesimal layer of water (no slowing down and no nuclear reactions) for monoenergetic 12C ion beams with energy between 1 and 1000 MeV/n.
The microdosimetric PHITS function [58] implemented in the PHITS [T-SED] tally was used to analytically compute the lineal energy distributions for a spherical liquid water target with radius equal to 0.30 µm. The minimum energy deposition considered in the microdosimetric calculations was 10.9 eV (i.e., one event of one ionization [58]). The results of the PHITS microdosimetric function were validated against experimental measurements with gas detectors [59,60,61]. Furthermore, the PHITS microdosimetric function was previously used to successfully model the response of LiF:Mg,Ti and LiF:Mg,Cu,P thermoluminescent detectors [62,63,64,65], Al2O3:C optically stimulated luminescent detectors [66], and an optical-fiber-based BaFBr:Eu detector [67]. The unrestricted linear energy transfer (LET) in water was calculated with the PHITS [T-LET] tally. All results of this study are plotted as a function of a generic “unrestricted LET in water” because of the lacking details and the contrasting approaches used in the LET assessment between the authors of the different studies presenting the in vitro data. A previous study reported a good agreement between the PHITS-calculated LET values and corresponding literature results for 12C ions [68]. More details on the simulations can be found in [23,24] and in the PHITS manual (https://phits.jaea.go.jp/manual/manualE-phits.pdf, accessed on 24 January 2023).

3. Results

3.1. Effect of αrefref on the Calculated RBE for 12C Ions

Figure 2A compares the clonogenic survival curve obtained for αref = 0.2 Gy−1 and varying αref/βref between 0.1 and 100 Gy. A decrease in αref/βref causes a larger curvature in the simulated survival curve and smaller surviving fractions at the same absorbed dose. These synthetic survival curves were used to determine the MCF MKM parameters α0 and β0 using Equations (16) and (17). As described in the methodology, Rn and rd were fixed at 4.7 and 0.29 µm. Since the biological weighting function α(y) (Equation (8)) is the most important factor in the RBE calculations with the MCF MKM, Figure 2B compares its shape as a function of the lineal energy for the different αref/βref included in this study (0.1–100 Gy). The chosen reference radiation was 6 MV X-rays. Therefore, for any value of αref/βref, αref is equal to 0.2 Gy−1 at 2.3 keV/µm. For y < 2.3 keV/µm, lower α values were calculated in case of smaller αref/βref, with negative values computed for αref/βref < 1.4 Gy. For y > 2.3 keV/µm, the opposite is observed: higher α values were calculated in the case of smaller αref/βref. It must be noted that the maximum of α(y) is shifted to higher linear energy values with the increase in αref/βref. Nonetheless, all α(y) functions tend to 0 when y → +∞.
Figure 3 presents an overview of the effect of the αref/βref on the RBEα = α/αref, β/βref, RBE50%, RBE10%, and RBE1% computed with the MCF MKM as a function of the LET of 12C ions. The results are plotted as a function of the LET between 10 and 1000 keV/µm for better visualization of the data. Strong differences were found between the low dose RBE (RBEα, Figure 3A) values computed using the different αref/βref. Both the maximum RBEα values (i.e., ~45 for αref/βref = 0.1 Gy and ~2.5 for αref/βref = 100 Gy) and the LET at which this maximum RBE is located (i.e., ~30 keV/µm for αref/βref = 0.1 Gy and ~500 keV/µm for αref/βref = 100 Gy) were strongly affected by the αref/βref chosen for the calculations. The general trend consists of a shift of the RBEα maximum to lower values and higher LET with the increase in αref/βref. Except for αref/βref = 0.1 Gy, the maximum value of β/βref (=1) for carbon ion appears to not be affected by αref/βref, as shown in Figure 3B. On the other hand, the decrease in β/βref with the increase in the LET is sharper for lower αref/βref values. As an example, β/βref = 0.5 is reached at ~30 keV/µm for αref/βref = 0.1 Gy, while at ~450 keV/µm for αref/βref = 100 Gy). In the case of RBE50%, RBE10%, and RBE1% (Figure 3C–E), the shift in the position of the RBE maximum as a function of the LET follows that of RBEα. However, the variation in the maximum RBE values is less pronounced than that for RBEα. As mentioned before, the maximum value of RBEα varied between 2.5 (αref/βref = 100 Gy) and 45 (αref/βref = 0.1 Gy) as a function of αref/βref. By contrast, the maximum value of RBE varied between 2.4 and 7.2 for RBE50%, between 2.2 and 4.3 for RBE10%, and between 2.1 and 3.2 for RBE1%.

3.2. Effect of the Absolute Values of αref and βref on the Calculated RBE for 12C Ions

The influence of the absolute values of αref/βref on the MCF MKM results for 12C ions is shown in Figure 4. Two values of αref/βref were analyzed (2 and 10 Gy), while αref was varied between 2 and 0.01 Gy−1. The RBE values for αref/βref = 10 Gy (dashed lines in Figure 4) are systematically lower than that for αref/βref = 2 Gy (solid lines in Figure 3). Since the effect of the absolute values of αref and βref is similar for both αref/βref values, the discussion below is limited to the results for αref/βref = 2 Gy. As can be seen in Figure 4A, RBEα is strongly affected by the absolute values of αref and βref. The maximum of RBEα is higher for smaller values of αref. Furthermore, the maximum of RBEα is shifted at higher LET values for smaller values of αref. As an example for αref/βref = 2 Gy, the maximum RBEα was ~3.8 at ~40 keV/µm for αref = 2 Gy−1, while ~63 at ~500 keV/µm for αref = 0.01 Gy−1. The LET dependence of β/βref was also found to be affected by the absolute value of αref: a sharper decrease in β/βref as a function of the LET was computed for higher αref values. In this regard, β/βref = 0.5 was obtained in the case of carbon ions with an LET of ~350 keV/µm for αref = 0.01 Gy, while at ~35 keV/µm for αref = 2 Gy. In the case of RBE50%, RBE10%, and RBE1% (Figure 4C–E), the change in the position of the RBE maximum as a function of the LET is the same as that for RBEα. For αref/βref = 2 Gy, the maximum value of RBE varied between 3.8 and 63 for RBEα, between 3.3 and 9.9 for RBE50%, between 2.7 and 5.7 for RBE10%, and between 2.3 and 4.1 for RBE1%. For αref/βref = 10 Gy, the maximum value of RBE varied between 2.1 and 29 for RBEα, between 2.1 and 9.2 for RBE50%, between 1.9 and 5.5 for RBE10%, and between 1.8 and 4.1 for RBE1%.

3.3. Effect of Different Fits of the Same Photon Survival Curve on the Calculated RBE for 12C Ions

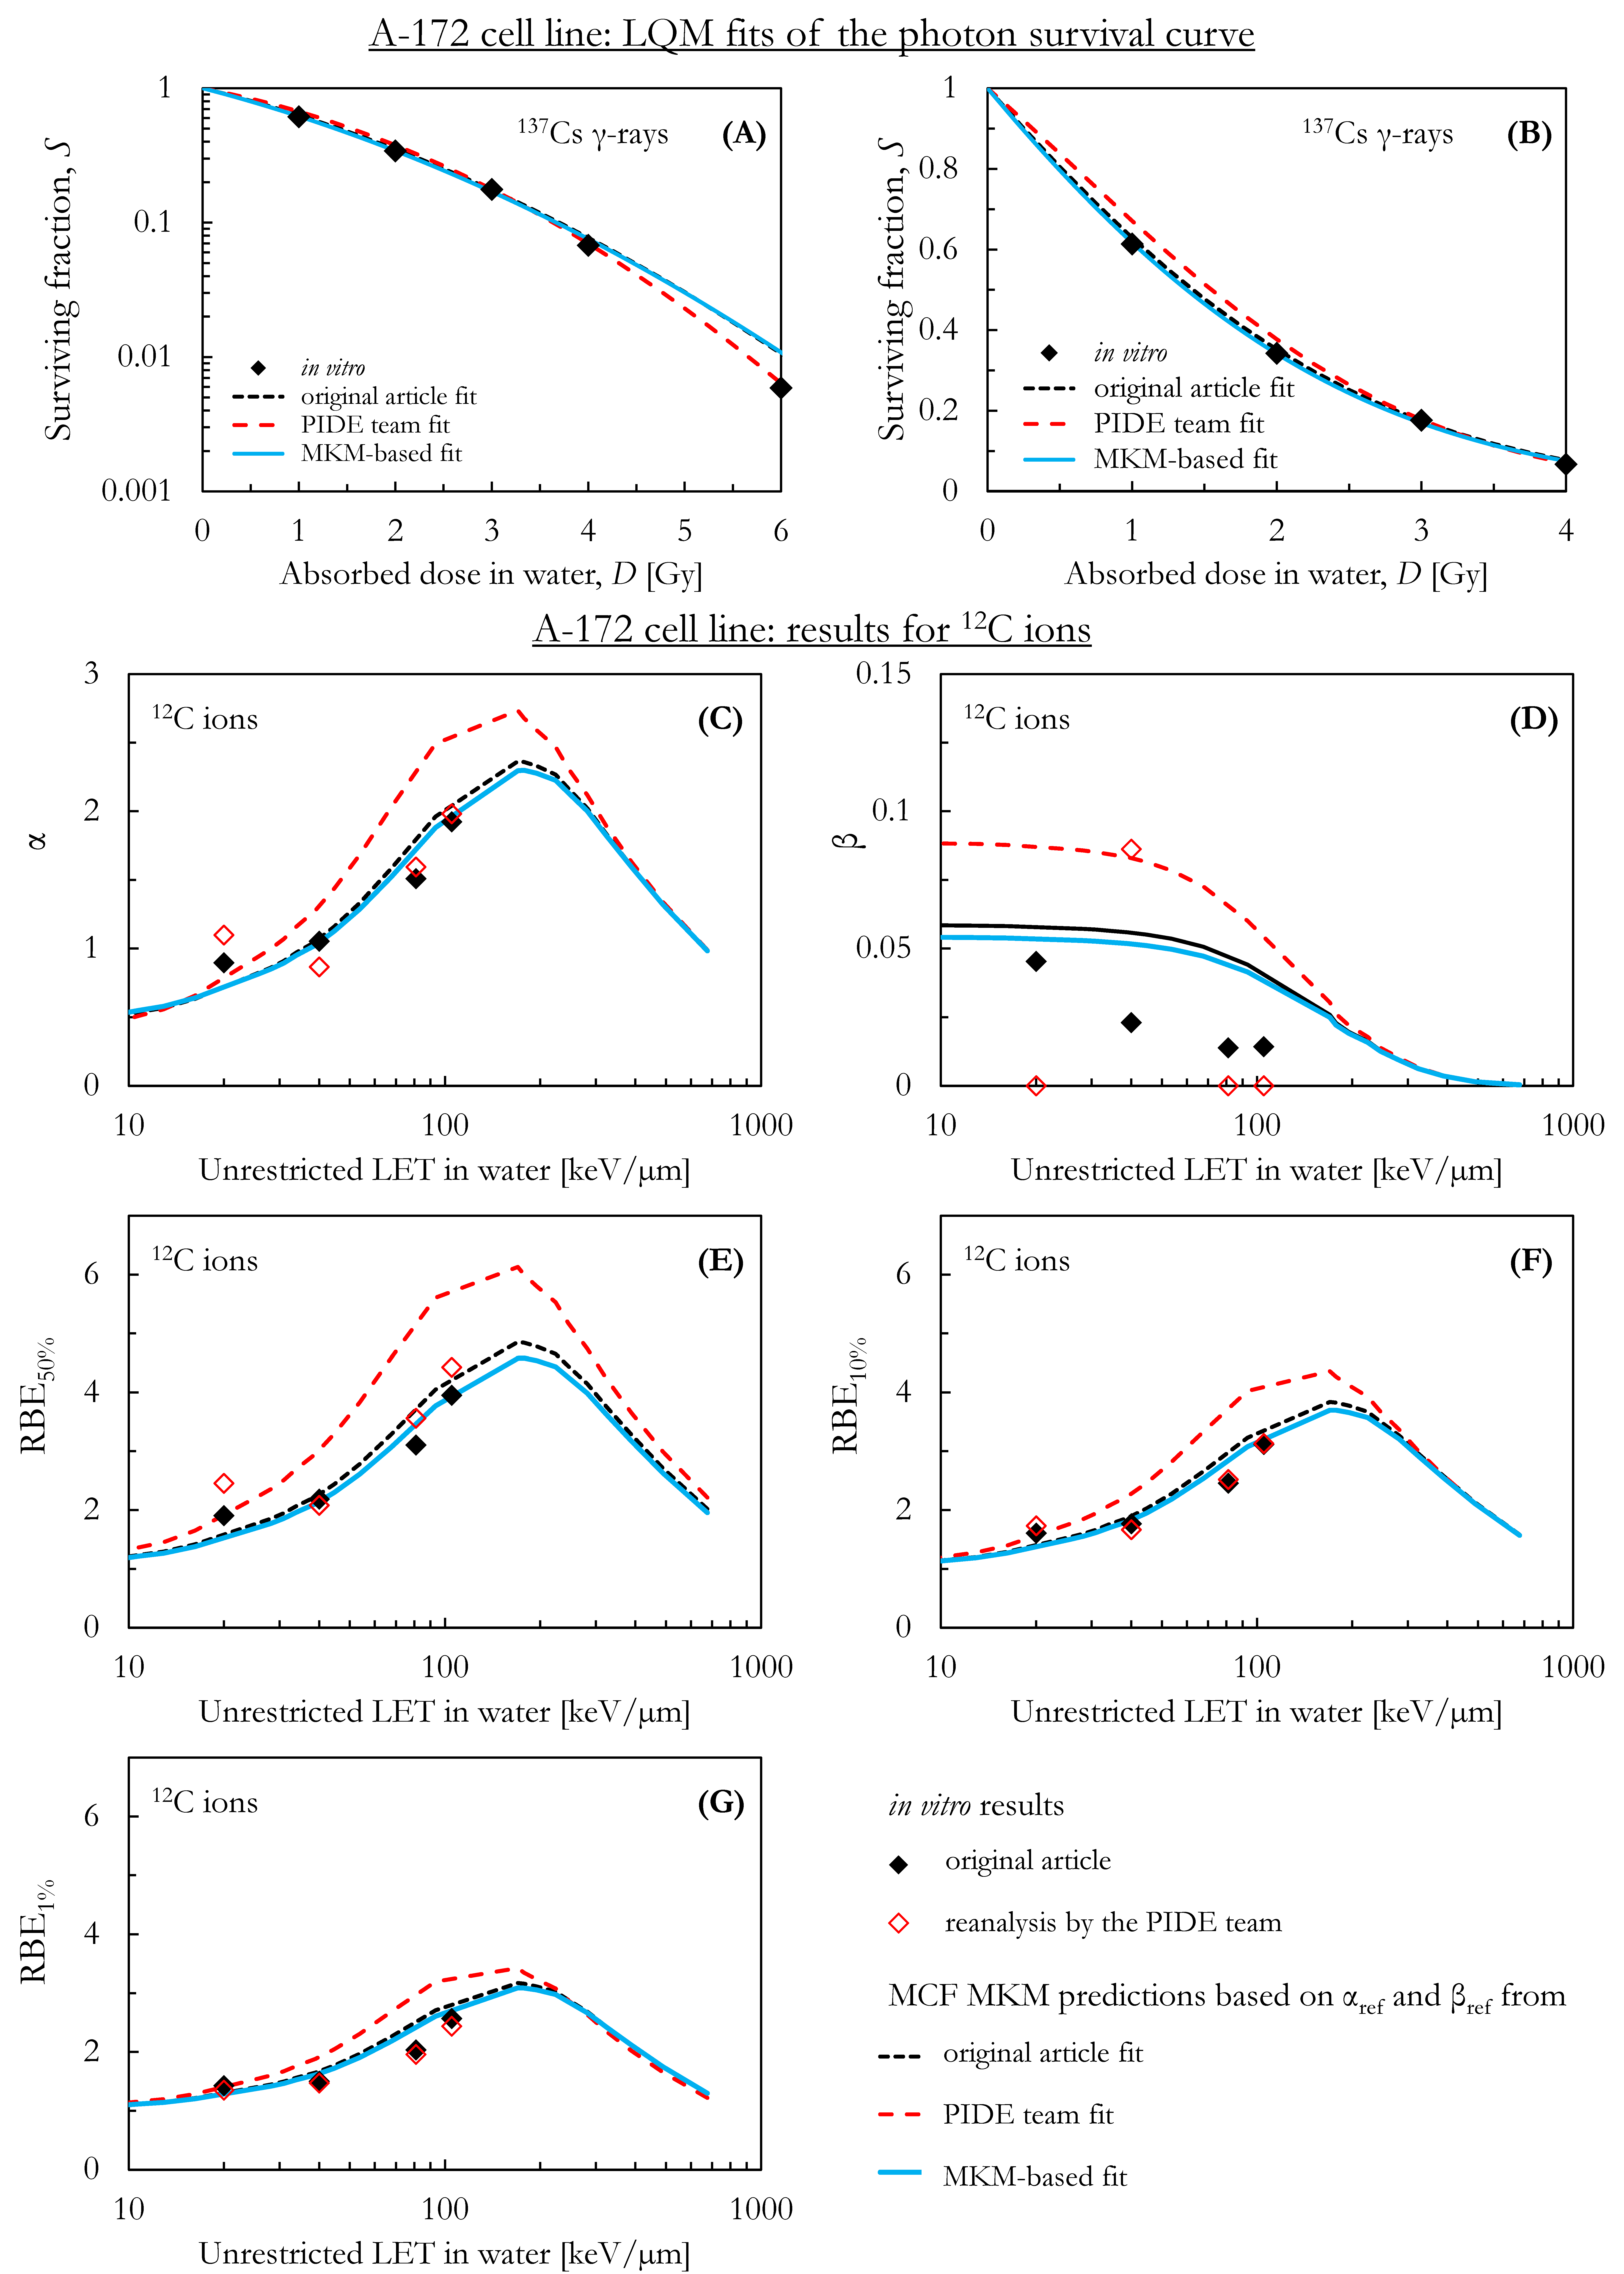
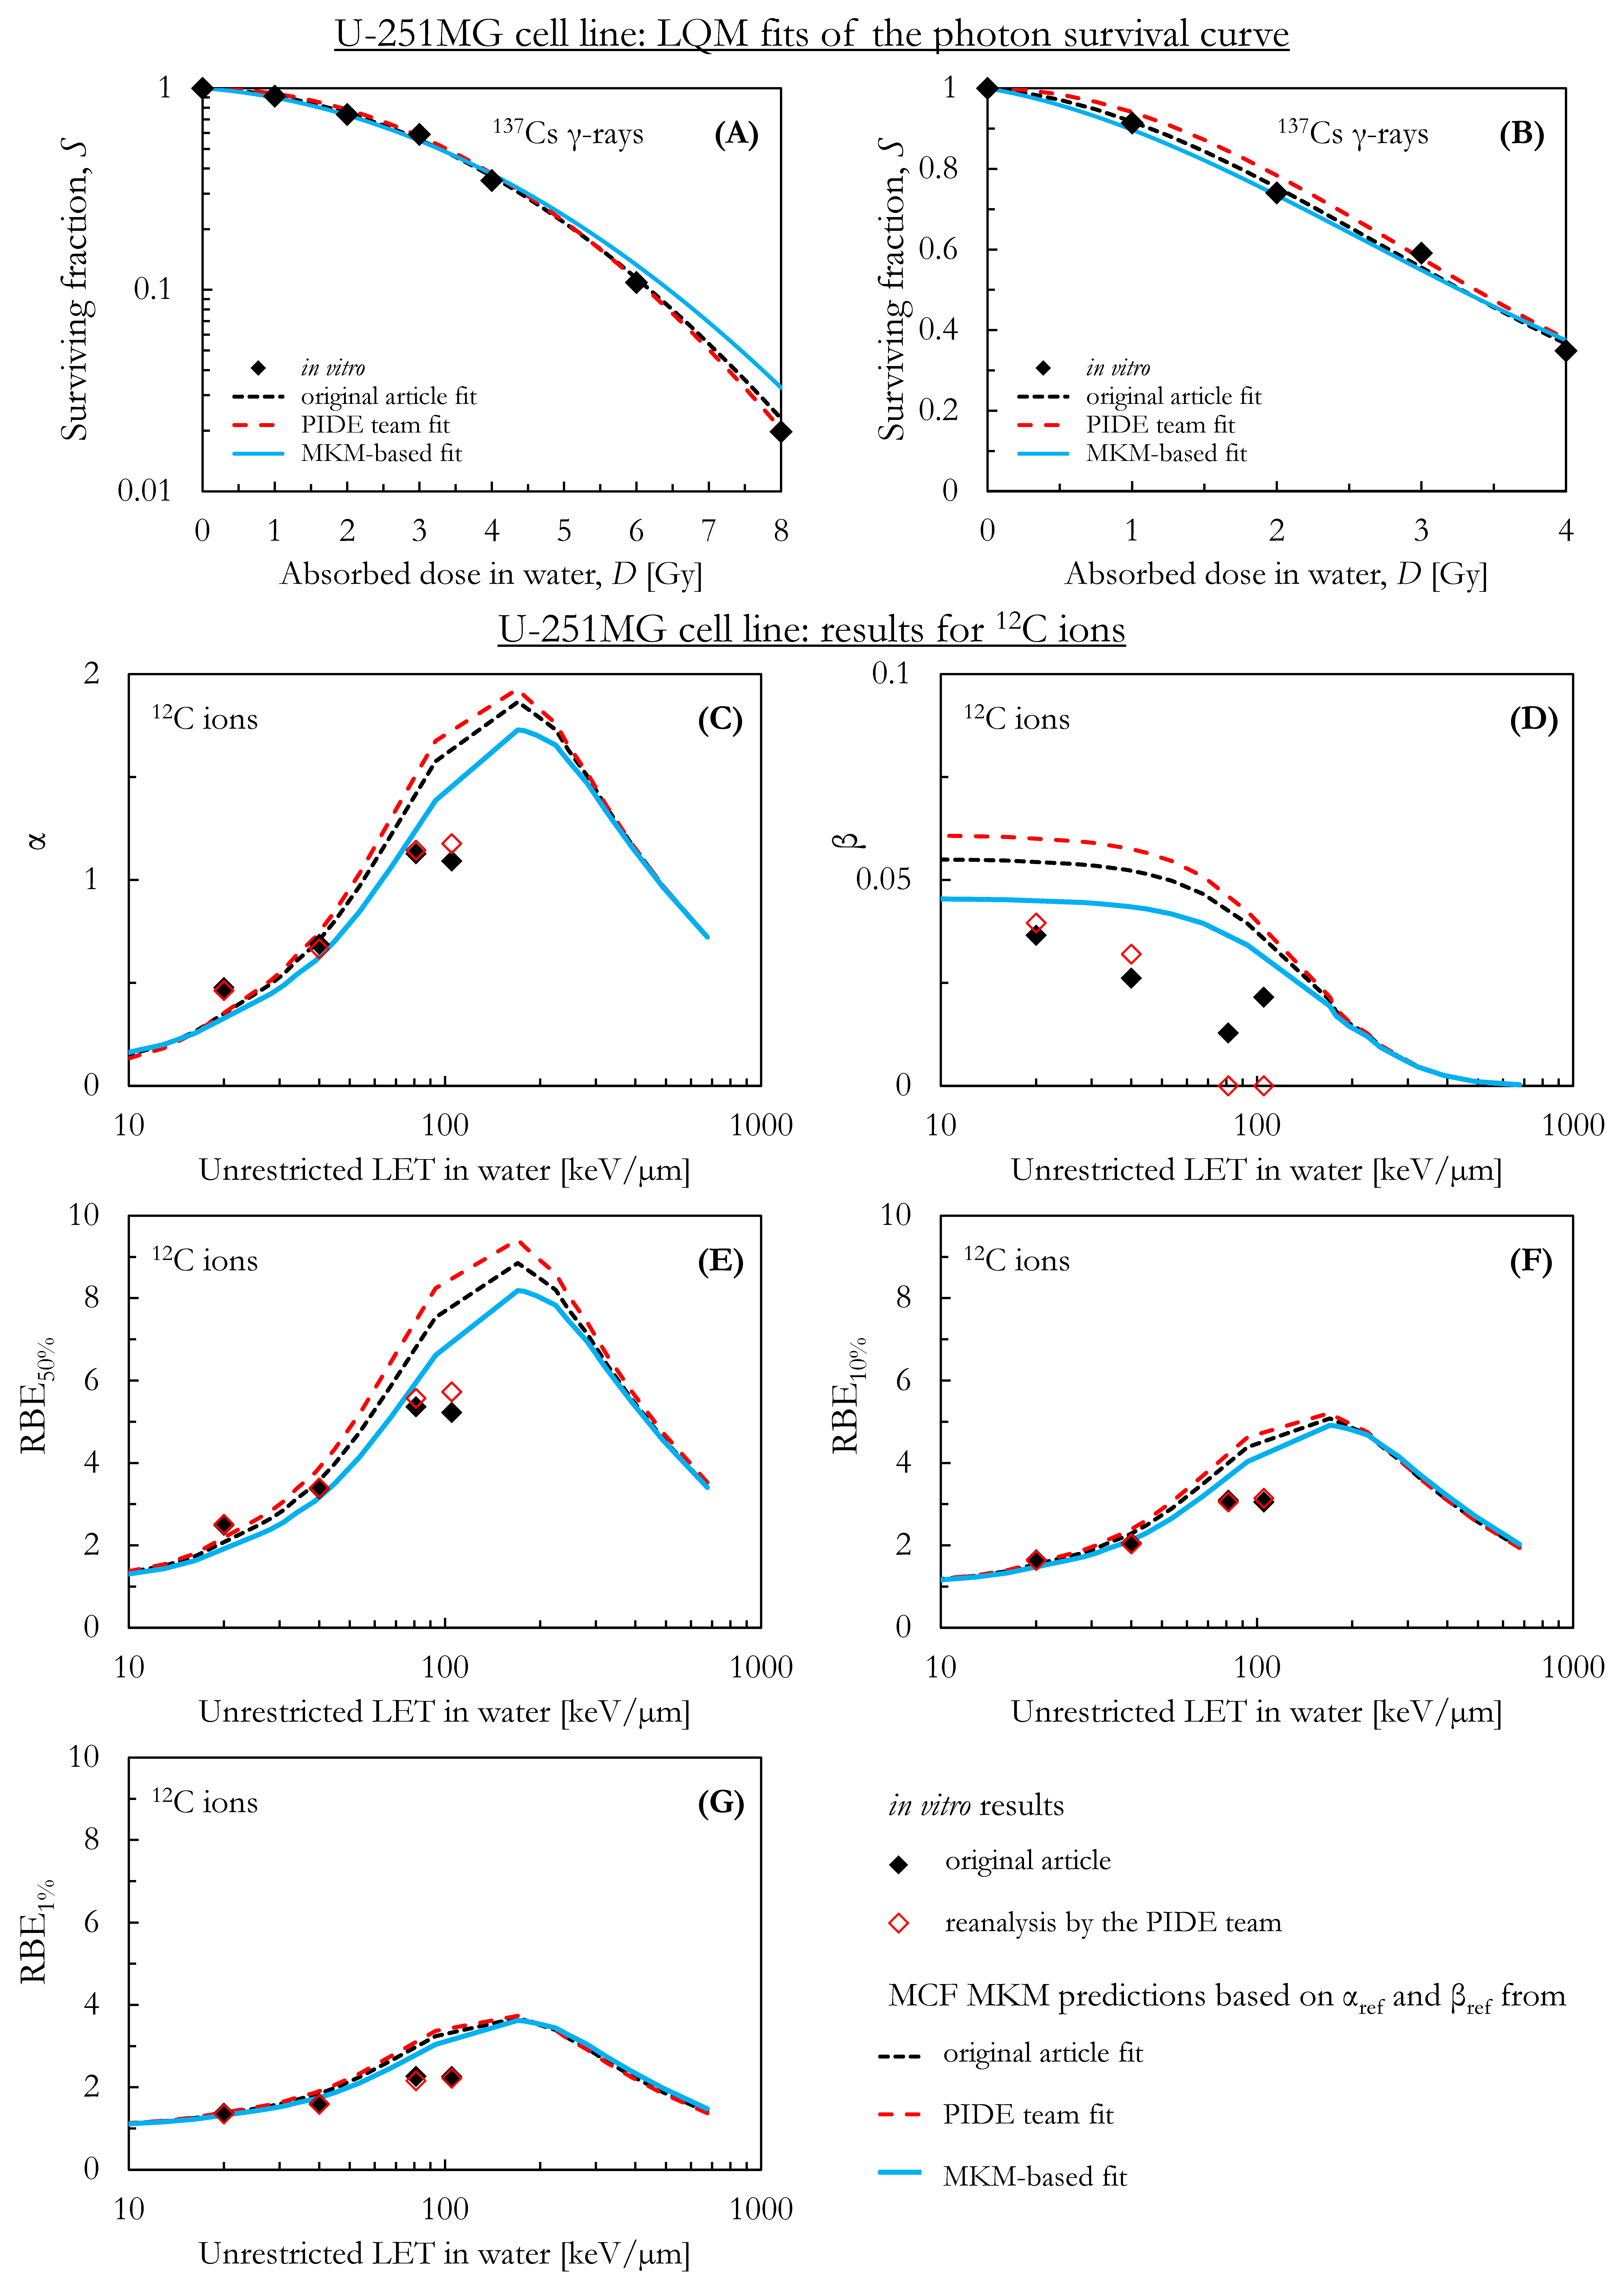
The effect of the different LQM fits on the MCF MKM calculations for carbon ions is shown in Figure 5, Figure 6 and Figure 7 for human glioblastoma cells (A-172 cell line), human mammary epithelial cells (M/10 cell line), and human astrocytoma cells (U-251MG cell line) respectively. Panels A and B compare the photons in vitro data (black diamonds) with the three LQM fits, namely the fit from the original article (short-dashed black lines), the fit from the PIDE team (dashed red lines), and the novel MKM-based fit (solid blue lines). The results of these fits (in the form of αref and βref) were used as an input to the MCF MKM to calculate the LET dependence of α, β, RBE50%, RBE10%, and RBE1% in case of exposures to monoenergetic carbon ions (panels C, D, E, F, and G of Figure 5, Figure 6 and Figure 7). It was decided not to present the results in the form of RBEα = α/αref since infinite RBE values would be computed for the M/10 and U-251MG cell lines in case of the PIDE fits with αref = 0. The results of these in silico calculations (panels C, D, E, F, and G of Figure 5, Figure 6 and Figure 7) are compared with the in vitro results presented by authors of the original articles (black diamonds) [55,56] and by the subsequent reanalysis performed by the PIDE team (open red diamonds) [53] on the same raw data. All the in vitro results are reported without error bars since the PIDE database, including the results of the analyses by original authors and by the PIDE team, currently does not provide uncertainty intervals for the clonogenic survival data. As previously discussed [24], this is likely due to the fact that most published biological papers do not include a systematic uncertainty analysis nor include sufficient information to perform a retrospective uncertainty study.
As shown in Figure 5A,B, the description of the photon survival curve of the A-172 cell line with the MKM-based fit is very similar to that from the original article [55]. On the other hand, the fit by the PIDE team appears to better describe the data point at 6 Gy, but it reproduces the in vitro data at low doses less accurately (Figure 5B). The LQM terms after the carbon exposures (Figure 5C,D) and the corresponding RBE values (Figure 5E–G) computed with the MCF MKM in combination with the original fit and the MKM-based fit are similar and in reasonable agreement with the in vitro results. On the other hand, if the αref and βref from the PIDE team are used in combination with the MCF MKM, the model appears to overestimate the in vitro data.
The results of the different LQM fits for the photon-exposed M/10 cell line are plotted in Figure 6A,B. Relevant differences are present between the three fits, especially for that by the PIDE team (dashed red lines). The fit by the PIDE team appears to well reproduce the in vitro data points at 4 and 6 Gy, but it significantly overestimates the in vitro data below 4 Gy (Figure 6B). As a consequence of this unreliable description of the photon survival curve at relatively low doses, the experimental in vitro RBE50% and RBE10% results are not included in Figure 6E,F. Except for the carbon-irradiated data point at ~300 keV/µm (there is a minor underestimation), the MCF MKM results agree well with the in vitro data (Figure 6C,G) when the photon LQM terms from the original article [56] and the MKM-based fit are used as input to the MCF MKM calculations. By contrast, the in silico calculations based on the photon LQM terms obtained by the PIDE team (dashed red lines in Figure 6C,G) overestimate the corresponding in vitro results.
As shown in Figure 7A,B (U-251MG cell line), the LQM fit from the original article and that by the PIDE team are quite similar. These two fits seem to well describe the in vitro data (black diamonds) over the whole dose range (0–8 Gy). On the other hand, the MKM-based fit appears to overestimate the in vitro photon data at 6 and 8 Gy. The LQM terms from these three fits of the photon curve were used as input to the MCF MKM to compute the cell response to carbon ions (Figure 7C,G). Though a reasonable agreement between the in silico and the in vitro results is present at 20 and 40 keV/µm, the model calculation appears to overestimate the experimental data at ~80 and ~100 keV/µm. The underestimation is the largest for the MCF MKM calculations based on the photon LQM determined by the PIDE team, while it is the smallest in the case of the MKM-based fit.

4. Discussion

In order to perform RBE calculations with the MCF MKM, four parameters must be known together with the microdosimetric spectra: a geometrical measure of both the cell nucleus (Rn) and the subnuclear domains (rd) and the numerical values of the LQM terms in the limit of zero lineal energy (α0 and β0). While the first two parameters (Rn and rd) can be assessed by means of morphometric measurements of the cell nucleus and estimates of the mean DNA content, α0 and β0 are derived from the in vitro LQM terms of the photon dose-response of the cell line under investigation (αref and βref) [23,24]. Since the two LQM terms are anticorrelated during the LQM fit of the photon dose response [33], different sets of αref and βref might be obtained from the same in vitro survival curve. This affects the results of the following calculations for photons and the computation of the RBE of ion therapy treatments.
In the first case (photons), different values of the biologically effective dose (BED, Equation (2)) [37] are computed if different sets of αref and βref (and therefore a different αref/βref) are derived from the same survival curve. In the BED calculations, the ratio αref/βref is used as an indication of the sensitivity of the cell line. Similarly, calculations of the sublethal lesion repair during beam interruption or a change in the radiation dose rate [69,70] can be affected by the different LQM fits. This happens because these MKM-based repair models [69,70] rely on the application of a temporal correction factor to β, while α is left unchanged. The anticorrelation between the two LQM terms could therefore result in different sets of LQM terms which lead to a different estimation of the temporal dependence (i.e., fractionation, dose rate, beam interruption) of the radiation-induced effects.
Secondly, since αref and βref are used as input to the RBE calculations (i.e., via Equations (16) and (17) in the case of the MCF MKM), a different estimation of their values could result in a different αref/βref. A recent analysis of published in vitro clonogenic survival data suggests that the low dose RBE (RBEα) of carbon ions strongly depends on αref/βref, with higher RBEα values found for cells with lower αref/βref [6]. By contrast, this relationship between αref/βref and RBE was not visible at higher doses (i.e., RBE10%) [6]. One could argue that the need for grouping the in vitro data in two broad categories (radioresistant if αref/βref < 4 Gy and radiosensitive if αref/βref > 4 Gy [6]) and the relatively large uncertainty in the biological data [68] could be the reason behind this lack of observable correlation between RBE and αref/βref at high dose. In order to explore the effect of αref/βref on the RBE of carbon ions, we computed the RBE with the MCF MKM as a function of the ion LET and of the surviving fraction for αref/βref between 0.1 and 100 Gy. As summarized in Figure 3, αref/βref appears to affect both the maximum value of the RBE and its position when plotted as a function of the carbon ion LET. Though the differences in the maximum values of the RBE are very large at low doses (RBEα) between the different αref/βref data series, the values of the RBE maxima are closer at higher doses. When the comparison is restricted to the αref/βref range encompassing most of the in vitro data for 12C ions (1 Gy < αref/βref < 10 Gy, Figure S1 of Supplementary Materials), our in silico results with the MCF MKM agree well with what previously observed on the in vitro data [6]. As an example, the maximum RBEα was strongly affected by αref/βref: 16 for αref/βref = 1 and 6 for αref/βref = 10 Gy. On the other hand, the maximum RBE10% values were much closer: 4.2 for αref/βref = 1 and 3.6 for αref/βref = 10.
Furthermore, the results included in this paper suggest that the knowledge of αref/βref is not sufficient to uniquely characterize the RBE of carbon ions. As shown in Figure 4 for two clinically relevant values of αref/βref (2 and 10 Gy), the absolute values of αref and βref significantly affect the RBE computed with the MCF MKM in the case of carbon ions and likely also for other ions. In the framework of implementing a variable RBE in proton therapy practice, many phenomenological RBE-vs-LET models were developed. A numerical comparison between the results of these models revealed large differences between the results of these LET-based proton RBE models [35]. As concluded in a subsequent review of these phenomenological models [71], these differences could be attributed to the significant disagreement between the role of αref/βref on the computed RBE among the different models. Further studies with the MCF MKM are warranted to investigate if this disagreement on the role of αref/βref could be due to the negligence of the effect of absolute values of αref and βref in the RBE calculations for protons.
Additionally, the anticorrelation between the αref and βref during the LQM fit and the uncertainty in the clonogenic assay at high doses (i.e., few residual colonies) could lead to the computation of very low αref/βref (even 0 in some cases, see Table 1) and therefore negative α0 values with Equation (16). As a result, the MCF MKM α(y) functions computed with Equation (8) could assume negative values, as shown in Figure 2B. This might lead to the calculation of unreasonable negative RBEα values for sparsely ionizing radiation. Though α0 = 0 denotes that all lethal lesions arise from the combination of sublethal lesions [72], the biological meaning of negative α0 values is, at best, unclear.
In this work, we presented and used a set of novel MKM-based constraints (Equations (18) and (19)) for the LQM fit of photon-exposed in vitro data (panels A and B of Figure 5, Figure 6 and Figure 7). We do not claim that this MKM-based fit for the reference photon radiation is universally valid nor mathematically the best one. On the other hand, we introduced this method as a strategy to mitigate the occurrence of negative α0 values, to avoid the calculation of negative RBE values for ions whose dose-mean lineal energy is smaller than that of the reference photons, and to prevent the calculations of infinite RBEα for cell lines whose LQM fit of the reference photon exposure resulted in αref = 0 (Table 1). When the photon LQM terms (αref and βref) obtained with this MKM-based fit were used as input to the MCF MKM calculations, the predicted cell response to carbons (solid blue lines in panels C to G of Figure 5, Figure 6 and Figure 7) were generally found to be in reasonable agreement with the in vitro data. The results obtained using the other two LQM fits of the photon survival curve (short-dashed red lines and dashed black lines in panels C to G of Figure 5, Figure 6 and Figure 7) were found to describe the in vitro data in a comparable or worse way (i.e., some large deviations were observed especially in case of the photon fits with αref = 0).
Finally, as previously discussed, we benchmarked the RBE results obtained with the MCF MKM in combination with the new MKM-based photon LQM fit against in vitro RBE data for carbon ions only. This was performed because carbon ions are the focus of this article and since the most interesting in vitro datasets were found for this ion (see Section 2.6). Nonetheless, this approach can be used in combination with in vitro experiments dealing with other ions. As an example, we applied this method to published in vitro data of proton-irradiated human glioblastoma cells (U-87 cell line [73]; see Figure S2 of the Supplementary Materials). This dataset was chosen because of its clinical relevance and since negative α0 values are computed using the published values of αref and βref, as shown in Table S1 of the Supplementary Materials.
In conclusion, this study indicates that the knowledge of both the absolute values of αref and βref and their ratio αref/βref appears to be necessary for an accurate calculation of the RBE in carbon ion therapy. Care must be taken in fitting the reference in vitro photon survival curve. It is suggested to pay particular attention to the relatively-low dose range since α0 and β0 represent the LQM parameters in the limit of very sparsely ionizing radiation and low dose. However, at low doses (i.e., below ~1–2 Gy), phenomena such as low-dose hypersensitivity [74], likely due to intercellular signaling (bystander effects) [75], could further complicate the fitting process. Furthermore, it should be remembered that LQM fits over different dose ranges could produce different sets of LQM terms [76]. This is particularly evident at relatively high doses where the in vitro clonogenic survival curves transition to a fixed slope [77]. The MKM-based fit of the in vitro photon survival curve appears to be a useful tool to determine α0 and β0 for the MCF MKM calculations and to check the physical and biological meaning of the mathematical values of αref and βref.

Supplementary Materials

The following supporting information can be downloaded at: https://www.mdpi.com/article/10.3390/qubs7010003/s1, Figure S1: αref/βref plotted as a function of αref for 12C ions only. Figure S2: Proton-irradiated human glioblastoma cells (U-87 cell line): comparison between MCF MKM results and in vitro data. Table S1: MCF MKM parameters used in the calculations for the U-87 cell line.

Author Contributions

Methodology: A.P., C.J.B., and K.M.F.; Software: A.P.; Formal analysis: A.P.; Visualization: A.P.; Writing—original draft: A.P.; Writing—review and editing: A.P., C.J.B., and K.M.F.; Supervision: C.J.B. and K.M.F.; Funding acquisition: C.J.B. and K.M.F. All authors have read and agreed to the published version of the manuscript.

Funding

This research received no external funding.

Institutional Review Board Statement

Not applicable.

Informed Consent Statement

Not applicable.

Data Availability Statement

All MCF MKM results are plotted in this article and the Supplementary Materials. The in vitro data were extracted from the PIDE database [53].

Conflicts of Interest

The authors declare no conflict of interest.

Abbreviations

αlinear term of the linear-quadratic model of clonogenic survival
α0α in the limit of the lineal energy y → 0
αrefα for the reference photon exposure
βquadratic term of the linear-quadratic model of clonogenic survival
β0β in the limit of the lineal energy y → 0
βrefβ for the reference photon exposure
A-172 cell line human glioblastoma cells
BEDbiologically effective dose [37]
DNAdeoxyribonucleic acid
LEMlocal effect model [8]
LEM IV fourth version of the local effect model [30]
LETlinear energy transfer
LQMlinear-quadratic model of clonogenic survival [32]
M/10 cell linehuman mammary epithelial cells
MCFMayo Clinic Florida, Jacksonville, Florida, United States of America
MCF MKM Mayo Clinic Florida microdosimetric kinetic model [23]
MKM microdosimetric kinetic model [25]
modified MKM modified microdosimetric kinetic model [9]
PHITS Particle and Heavy Ion Transport code System [57]
PIDE Particle Irradiation Data Ensemble [53]
RBE relative biological effectiveness
RBESin vitro clonogenic cell survival RBE for the surviving fraction S (Equation (4))
rdmean radius of the subnuclear domains
Rnmean radius of the cell nucleus
U-87 cell linehuman glioblastoma cells
U-251MG cell line human astrocytoma cells
ylineal energy

References

  1. Wilson, R.R. Radiological use of fast protons. Radiology 1946, 47, 487–491. [Google Scholar] [CrossRef] [PubMed]
  2. Durante, M.; Paganetti, H. Nuclear physics in particle therapy: A review. Rep. Prog. Phys. 2016, 79, 096702. [Google Scholar] [CrossRef] [PubMed]
  3. Facoetti, A.; Barcellini, A.; Valvo, F.; Pullia, M. The Role of Particle Therapy in the Risk of Radio-induced Second Tumors: A Review of the Literature. Anticancer Res. 2019, 39, 4613–4617. [Google Scholar] [CrossRef] [PubMed]
  4. Scholz, M. Effects of Ion Radiation on Cells and Tissues. Radiat. Eff. Polym. Biol. Use 2003, 162, 95–155. [Google Scholar]
  5. Ando, K.; Kase, Y. Biological characteristics of carbon-ion therapy. Int. J. Radiat. Biol. 2009, 85, 715–728. [Google Scholar] [CrossRef]
  6. Tinganelli, W.; Durante, M. Carbon Ion Radiobiology. Cancers 2020, 12, 3022. [Google Scholar] [CrossRef]
  7. Kanai, T.; Furusawa, Y.; Fukutsu, K.; Itsukaichi, H.; Eguchi-Kasai, K.; Ohara, H. Irradiation of mixed beam and design of spread-out Bragg peak for heavy-ion radiotherapy. Radiat. Res. 1997, 147, 78–85. [Google Scholar] [CrossRef]
  8. Scholz, M.; Kellerer, A.M.; Kraft-Weyrather, W.; Kraft, G. Computation of cell survival in heavy ion beams for therapy. The model and its approximation. Radiat. Environ. Biophys. 1997, 36, 59–66. [Google Scholar] [CrossRef]
  9. Kase, Y.; Kanai, T.; Matsumoto, Y.; Furusawa, Y.; Okamoto, H.; Asaba, T.; Sakama, M.; Shinoda, H. Microdosimetric measurements and estimation of human cell survival for heavy-ion beams. Radiat. Res. 2006, 166, 629–638. [Google Scholar] [CrossRef]
  10. Kanai, T.; Endo, M.; Minohara, S.; Miyahara, N.; Koyama-ito, H.; Tomura, H.; Matsufuji, N.; Futami, Y.; Fukumura, A.; Hiraoka, T.; et al. Biophysical characteristics of HIMAC clinical irradiation system for heavy-ion radiation therapy. Int. J. Radiat. Oncol. Biol. Phys. 1999, 44, 201–210. [Google Scholar] [CrossRef]
  11. Jakel, O.; Kramer, M.; Karger, C.P.; Debus, J. Treatment planning for heavy ion radiotherapy: Clinical implementation and application. Phys. Med. Biol. 2001, 46, 1101–1116. [Google Scholar] [CrossRef] [PubMed]
  12. Inaniwa, T.; Kanematsu, N.; Matsufuji, N.; Kanai, T.; Shirai, T.; Noda, K.; Tsuji, H.; Kamada, T.; Tsujii, H. Reformulation of a clinical-dose system for carbon-ion radiotherapy treatment planning at the National Institute of Radiological Sciences, Japan. Phys. Med. Biol. 2015, 60, 3271–3286. [Google Scholar] [CrossRef] [PubMed] [Green Version]
  13. Inaniwa, T.; Suzuki, M.; Hyun Lee, S.; Mizushima, K.; Iwata, Y.; Kanematsu, N.; Shirai, T. Experimental validation of stochastic microdosimetric kinetic model for multi-ion therapy treatment planning with helium-, carbon-, oxygen-, and neon-ion beams. Phys. Med. Biol. 2020, 65, 045005. [Google Scholar] [CrossRef] [PubMed]
  14. Yagi, M.; Tsubouchi, T.; Hamatani, N.; Takashina, M.; Maruo, H.; Fujitaka, S.; Nihongi, H.; Ogawa, K.; Kanai, T. Commissioning a newly developed treatment planning system, VQA Plan, for fast-raster scanning of carbon-ion beams. PLoS ONE 2022, 17, e0268087. [Google Scholar] [CrossRef]
  15. Puck, T.T.; Marcus, P.I. Action of X-rays on mammalian cells. J. Exp. Med. 1956, 103, 653–666. [Google Scholar] [CrossRef]
  16. Brix, N.; Samaga, D.; Belka, C.; Zitzelsberger, H.; Lauber, K. Analysis of clonogenic growth in vitro. Nat. Protoc. 2021, 16, 4963–4991. [Google Scholar] [CrossRef]
  17. Kanai, T.; Matsufuji, N.; Miyamoto, T.; Mizoe, J.; Kamada, T.; Tsuji, H.; Kato, H.; Baba, M.; Tsujii, H. Examination of GyE system for HIMAC carbon therapy. Int. J. Radiat. Oncol. Biol. Phys. 2006, 64, 650–656. [Google Scholar] [CrossRef]
  18. Paganetti, H. Relating the proton relative biological effectiveness to tumor control and normal tissue complication probabilities assuming interpatient variability in alpha/beta. Acta Oncol. 2017, 56, 1379–1386. [Google Scholar] [CrossRef]
  19. Abolfath, R.; Helo, Y.; Bronk, L.; Carabe, A.; Grosshans, D.; Mohan, R. Renormalization of radiobiological response functions by energy loss fluctuations and complexities in chromosome aberration induction: Deactivation theory for proton therapy from cells to tumor control. Eur. Phys. J. D 2019, 73, 1–22. [Google Scholar] [CrossRef]
  20. Kase, Y.; Kanai, T.; Matsufuji, N.; Furusawa, Y.; Elsasser, T.; Scholz, M. Biophysical calculation of cell survival probabilities using amorphous track structure models for heavy-ion irradiation. Phys. Med. Biol. 2008, 53, 37–59. [Google Scholar] [CrossRef]
  21. Karger, C.P. Peschke, RBE and related modeling in carbon-ion therapy. Phys. Med. Biol. 2017, 63, 01TR02. [Google Scholar] [CrossRef] [PubMed]
  22. Beltran, C.; Amos, R.A.; Rong, Y. We are ready for clinical implementation of Carbon Ion Radiotherapy in the United States. J. Appl. Clin. Med. Phys. 2020, 21, 6–9. [Google Scholar] [CrossRef] [PubMed]
  23. Parisi, A.; Beltran, C.J.; Furutani, K.M. The Mayo Clinic Florida microdosimetric kinetic model of clonogenic survival: Formalism and first benchmark against in vitro and in silico data. Phys. Med. Biol. 2022, 67, 185013. [Google Scholar] [CrossRef] [PubMed]
  24. Parisi, A.; Beltran, C.J.; Furutani, K.M. The Mayo Clinic Florida Microdosimetric Kinetic Model of Clonogenic Survival: Application to Various Repair-Competent Rodent and Human Cell Lines. Int. J. Mol. Sci. 2022, 23, 12491. [Google Scholar] [CrossRef] [PubMed]
  25. Hawkins, R.B. A statistical theory of cell killing by radiation of varying linear energy transfer. Radiat. Res. 1994, 140, 366–374. [Google Scholar] [CrossRef]
  26. Loncol, T.; Cosgrove, V.; Denis, J.M.; Gueulette, J.; Mazal, A.; Menzel, H.G.; Pihet, P.; Sabattier, R. Radiobiological Effectiveness of Radiation Beams with Broad LET Spectra: Microdosimetric Analysis Using Biological Weighting Functions. Radiat. Prot. Dosim. 1994, 52, 347–352. [Google Scholar] [CrossRef]
  27. Hawkins, R.B. A microdosimetric-kinetic model for the effect of non-Poisson distribution of lethal lesions on the variation of RBE with LET. Radiat. Res. 2003, 160, 61–69. [Google Scholar] [CrossRef]
  28. Parisi, A.; Sato, T.; Matsuya, Y.; Kase, Y.; Magrin, G.; Verona, C.; Tran, L.; Rosenfeld, A.; Bianchi, A.; Olko, P.; et al. Development of a new microdosimetric biological weighting function for the RBE(10) assessment in case of the V79 cell line exposed to ions from (1)H to (238)U. Phys. Med. Biol. 2020, 65, 235010. [Google Scholar] [CrossRef]
  29. Friedrich, T.; Durante, M.; Scholz, M. Modeling cell survival after photon irradiation based on double-strand break clustering in megabase pair chromatin loops. Radiat. Res. 2012, 178, 385–394. [Google Scholar] [CrossRef]
  30. Elsasser, T.; Weyrather, W.K.; Friedrich, T.; Durante, M.; Iancu, G.; Kramer, M.; Kragl, G.; Brons, S.; Winter, M.; Weber, K.J.; et al. Quantification of the relative biological effectiveness for ion beam radiotherapy: Direct experimental comparison of proton and carbon ion beams and a novel approach for treatment planning. Int. J. Radiat. Oncol. Biol. Phys. 2010, 78, 1177–1183. [Google Scholar] [CrossRef]
  31. Mairani, A.; Bohlen, T.T.; Dokic, I.; Cabal, G.; Brons, S.; Haberer, T. Modelling of cell killing due to sparsely ionizing radiation in normoxic and hypoxic conditions and an extension to high LET radiation. Int. J. Radiat. Biol. 2013, 89, 782–793. [Google Scholar] [CrossRef] [PubMed]
  32. McMahon, S.J. The linear quadratic model: Usage, interpretation and challenges. Phys. Med. Biol. 2018, 64, s01TR01. [Google Scholar] [CrossRef] [PubMed]
  33. Friedrich, T.; Scholz, U.; Elsasser, T.; Durante, M.; Scholz, M. Systematic analysis of RBE and related quantities using a database of cell survival experiments with ion beam irradiation. J. Radiat. Res. 2013, 54, 494–514. [Google Scholar] [CrossRef] [PubMed] [Green Version]
  34. Parisi, A.; Beltran, C.J.; Furutani, K.M. The effect of fitting the reference photon dose-response on the clonogenic survival predicted with the Mayo Clinic Florida microdosimetric kinetic model in case of accelerated ions. Radiat. Prot. Dosim. 2022; in press. [Google Scholar]
  35. Rorvik, E.; Fjaera, L.F.; Dahle, T.J.; Dale, J.E.; Engeseth, G.M.; Stokkevag, C.H.; Thornqvist, S.; Ytre-Hauge, K.S. Exploration and application of phenomenological RBE models for proton therapy. Phys. Med. Biol. 2018, 63, 185013. [Google Scholar] [CrossRef] [Green Version]
  36. Fowler, J.F. The linear-quadratic formula and progress in fractionated radiotherapy. Br. J. Radiol. 1989, 62, 679–694. [Google Scholar] [CrossRef]
  37. Fowler, J.F. 21 years of biologically effective dose. Br. J. Radiol. 2010, 83, 554–568. [Google Scholar] [CrossRef]
  38. Jones, B.; Carabe-Fernandez, A.; Dale, R.G. Calculation of high-LET radiotherapy dose required for compensation of overall treatment time extensions. Br. J. Radiol. 2006, 79, 254–257. [Google Scholar] [CrossRef] [PubMed]
  39. Sato, T.; Watanabe, R.; Kase, Y.; Tsuruoka, C.; Suzuki, M.; Furusawa, Y.; Niita, K. Analysis of cell-survival fractions for heavy-ion irradiations based on microdosimetric kinetic model implemented in the particle and heavy ion transport code system. Radiat. Prot. Dosim. 2011, 143, 491–496. [Google Scholar] [CrossRef] [PubMed]
  40. Scholz, M. Calculation of RBE for normal tissue complications based on charged particle track structure. Bull. Cancer Radiother. 1996, 83, 50s–54s. [Google Scholar] [CrossRef] [Green Version]
  41. Mein, S.; Klein, C.; Kopp, B.; Magro, G.; Harrabi, S.; Karger, C.P.; Haberer, T.; Debus, J.; Abdollahi, A.; Dokic, I.; et al. Assessment of RBE-Weighted Dose Models for Carbon Ion Therapy Toward Modernization of Clinical Practice at HIT: In Vitro, In Vivo, and in Patients. Int. J. Radiat. Oncol. Biol. Phys. 2020, 108, 779–791. [Google Scholar] [CrossRef] [PubMed]
  42. Rossi, H.H.; Zaider, M. Microdosimetry and Its Applications; Springer: Berlin/Heidelberg, Germany, 1996. [Google Scholar]
  43. Hawkins, R.B. A microdosimetric-kinetic theory of the dependence of the RBE for cell death on LET. Med. Phys. 1998, 25, 1157–1170. [Google Scholar] [CrossRef]
  44. Sato, T.; Furusawa, Y. Cell survival fraction estimation based on the probability densities of domain and cell nucleus specific energies using improved microdosimetric kinetic models. Radiat. Res. 2012, 178, 341–356. [Google Scholar] [CrossRef]
  45. Chen, Y.; Li, J.; Li, C.; Qiu, R.; Wu, Z. A modified microdosimetric kinetic model for relative biological effectiveness calculation. Phys. Med. Biol. 2017, 63, 015008. [Google Scholar] [CrossRef] [PubMed]
  46. Parisi, A.; Furutani, K.M.; Beltran, C.J. On the calculation of the relative biological effectiveness of ion radiation therapy using a biological weighting function, the microdosimetric kinetic model (MKM) and subsequent corrections (non-Poisson MKM and modified MKM). Phys. Med. Biol. 2022, 67, 095014. [Google Scholar] [CrossRef]
  47. McMahon, S.J.; McNamara, A.L.; Schuemann, J.; Paganetti, H.; Prise, K.M. A general mechanistic model enables predictions of the biological effectiveness of different qualities of radiation. Sci. Rep. 2017, 7, 10790. [Google Scholar] [CrossRef] [Green Version]
  48. Yokota, H.; Vandenengh, G.; Hearst, J.E.; Sachs, R.K.; Trask, B.J. Evidence for the Organization of Chromatin in Megabase Pair-Sized Loops Arranged along a Random-Walk Path in the Human G0/G1 Interphase Nucleus. J. Cell Biol. 1995, 130, 1239–1249. [Google Scholar] [CrossRef] [Green Version]
  49. Rogakou, E.P.; Pilch, D.R.; Orr, A.H.; Ivanova, V.S.; Bonner, W.M. DNA double-stranded breaks induce histone H2AX phosphorylation on serine 139. J. Biol. Chem. 1998, 273, 5858–5868. [Google Scholar] [CrossRef] [Green Version]
  50. Paganetti, H. Relative biological effectiveness (RBE) values for proton beam therapy. Variations as a function of biological endpoint, dose, and linear energy transfer. Phys. Med. Biol. 2014, 59, R419–R472. [Google Scholar] [CrossRef]
  51. Tilly, N.; Johansson, J.; Isacsson, U.; Medin, J.; Blomquist, E.; Grusell, E.; Glimelius, B. The influence of RBE variations in a clinical proton treatment plan for a hypopharynx cancer. Phys. Med. Biol. 2005, 50, 2765–2777. [Google Scholar] [CrossRef]
  52. McNamara, A.L.; Schuemann, J.; Paganetti, H. A phenomenological relative biological effectiveness (RBE) model for proton therapy based on all published in vitro cell survival data. Phys. Med. Biol. 2015, 60, 8399–8416. [Google Scholar] [CrossRef] [Green Version]
  53. Friedrich, T.; Pfuhl, T.; Scholz, M. Update of the particle irradiation data ensemble (PIDE) for cell survival. J. Radiat. Res. 2021, 62, 645–655. [Google Scholar] [CrossRef] [PubMed]
  54. Friedrich, T.; Durante, M.; Scholz, M. Comments on the paper “Modelling of cell killing due to sparsely ionizing radiation in normoxic and hypoxic conditions and an extension to high LET radiation” by A. Mairani et al. Int. J. Radiat. Biol. 89(10), 2013, 782–793. Int. J. Radiat. Biol. 2015, 91, 127–128. [Google Scholar] [CrossRef] [PubMed]
  55. Tsuboi, K.; Tsuchida, Y.; Nose, T.; Ando, K. Cytotoxic effect of accelerated carbon beams on glioblastoma cell lines with p53 mutation: Clonogenic survival and cell-cycle analysis. Int. J. Radiat. Biol. 1998, 74, 71–79. [Google Scholar] [CrossRef]
  56. Belli, M.; Bettega, D.; Calzolari, P.; Cherubini, R.; Cuttone, G.; Durante, M.; Esposito, G.; Furusawa, Y.; Gerardi, S.; Gialanella, G.; et al. Effectiveness of monoenergetic and spread-out bragg peak carbon-ions for inactivation of various normal and tumour human cell lines. J. Radiat. Res. 2008, 49, 597–607. [Google Scholar] [CrossRef] [PubMed]
  57. Sato, T.; Iwamoto, Y.; Hashimoto, S.; Ogawa, T.; Furuta, T.; Abe, S.-i.; Kai, T.; Tsai, P.-E.; Matsuda, N.; Iwase, H.; et al. Features of Particle and Heavy Ion Transport code System (PHITS) version 3.02. J. Nucl. Sci. Technol. 2018, 55, 684–690. [Google Scholar] [CrossRef] [Green Version]
  58. Sato, T.; Watanabe, R.; Niita, K. Development of a calculation method for estimating specific energy distribution in complex radiation fields. Radiat. Prot. Dosim. 2006, 122, 41–45. [Google Scholar] [CrossRef]
  59. Tsuda, S.; Sato, T.; Takahashi, F.; Satoh, D.; Sasaki, S.; Namito, Y.; Iwase, H.; Ban, S.; Takada, M. Systematic measurement of lineal energy distributions for proton, He and Si ion beams over a wide energy range using a wall-less tissue equivalent proportional counter. J. Radiat. Res. 2012, 53, 264–271. [Google Scholar] [CrossRef] [PubMed] [Green Version]
  60. Takada, K.; Sato, T.; Kumada, H.; Koketsu, J.; Takei, H.; Sakurai, H.; Sakae, T. Validation of the physical and RBE-weighted dose estimator based on PHITS coupled with a microdosimetric kinetic model for proton therapy. J. Radiat. Res. 2018, 59, 91–99. [Google Scholar] [CrossRef] [Green Version]
  61. Hu, N.; Tanaka, H.; Takata, T.; Endo, S.; Masunaga, S.; Suzuki, M.; Sakurai, Y. Evaluation of PHITS for microdosimetry in BNCT to support radiobiological research. Appl. Radiat. Isot. 2020, 161, 109148. [Google Scholar] [CrossRef]
  62. Parisi, A.; Van Hoey, O.; Mégret, P.; Vanhavere, F. Microdosimetric specific energy probability distribution in nanometric targets and its correlation with the efficiency of thermoluminescent detectors exposed to charged particles. Radiat. Meas. 2019, 123, 1–12. [Google Scholar] [CrossRef]
  63. Parisi, A.; Dabin, J.; Schoonjans, W.; Van Hoey, O.; Mégret, P.; Vanhavere, F. Photon energy response of LiF:Mg,Ti (MTS) and LiF:Mg,Cu,P (MCP) thermoluminescent detectors: Experimental measurements and microdosimetric modeling. Radiat. Phys. Chem. 2019, 163, 67–73. [Google Scholar] [CrossRef]
  64. Parisi, A.; Struelens, L.; Vanhavere, F. Nanoscale calculation of the relative efficiency of 7LiF:Mg,Ti (MTS-7) and 7LiF:Mg,Cu,P (MCP-7) thermoluminescent detectors for measuring electrons and positrons. J. Phys. Conf. Ser. 2020, 1662, 012025. [Google Scholar] [CrossRef]
  65. Parisi, A.; Olko, P.; Swakoń, J.; Horwacik, T.; Jabłoński, H.; Malinowski, L.; Nowak, T.; Struelens, L.; Vanhavere, F. A new method to predict the response of thermoluminescent detectors exposed at different positions within a clinical proton beam. Radiat. Meas. 2020, 133, 106281. [Google Scholar] [CrossRef]
  66. Parisi, A.; Sawakuchi, G.; Granville, D.; Yukihara, E.G. Microdosimetric modeling of the relative efficiency of Al2O3:C (Luxel, blue emission) optically stimulated luminescent detectors exposed to ions from 1H to 132Xe. Radiat. Meas. 2022, 150, 106678. [Google Scholar] [CrossRef]
  67. Hirata, Y.; Sato, T.; Watanabe, K.; Ogawa, T.; Parisi, T.; Uritani, A. Theoretical and experimental estimation of the relative optically stimulated luminescence efficiency of an optical-fiber-based BaFBr:Eu detector for swift ions. J. Nucl. Sci. Technol. 2022, 59, 915–924. [Google Scholar] [CrossRef]
  68. Parisi, A.; Struelens, L.; Vanhavere, F. Comparison between the results of a recently-developed biological weighting function (V79-RBE(10)BWF) and thein vitroclonogenic survival RBE(10)of other repair-competent asynchronized normoxic mammalian cell lines and ions not used for the development of the model. Phys. Med. Biol. 2021, 66, 235006. [Google Scholar]
  69. Inaniwa, T.; Suzuki, M.; Furukawa, T.; Kase, Y.; Kanematsu, N.; Shirai, T.; Hawkins, R.B. Effects of dose-delivery time structure on biological effectiveness for therapeutic carbon-ion beams evaluated with microdosimetric kinetic model. Radiat. Res. 2013, 180, 44–59. [Google Scholar] [CrossRef] [PubMed]
  70. Inaniwa, T.; Kanematsu, N.; Suzuki, M.; Hawkins, R.B. Effects of beam interruption time on tumor control probability in single-fractionated carbon-ion radiotherapy for non-small cell lung cancer. Phys. Med. Biol. 2015, 60, 4105–4121. [Google Scholar] [CrossRef] [PubMed]
  71. McMahon, S.J. Proton RBE models: Commonalities and differences. Phys. Med. Biol. 2021, 66, 04NT02. [Google Scholar] [CrossRef] [PubMed]
  72. Hawkins, R.B. Mammalian cell killing by ultrasoft X rays and high-energy radiation: An extension of the MK model. Radiat. Res. 2006, 166, 431–442. [Google Scholar] [CrossRef]
  73. Chaudhary, P.; Marshall, T.I.; Perozziello, F.M.; Manti, L.; Currell, F.J.; Hanton, F.; McMahon, S.J.; Kavanagh, J.N.; Cirrone, G.A.; Romano, F.; et al. Relative biological effectiveness variation along monoenergetic and modulated Bragg peaks of a 62-MeV therapeutic proton beam: A preclinical assessment. Int. J. Radiat. Oncol. Biol. Phys. 2014, 90, 27–35. [Google Scholar] [CrossRef] [PubMed] [Green Version]
  74. Joiner, M.C.; Marples, B.; Lambin, P.; Short, S.C.; Turesson, I. Low-dose hypersensitivity: Current status and possible mechanisms. Int. J. Radiat. Oncol. Biol. Phys. 2001, 49, 379–389. [Google Scholar] [CrossRef] [PubMed]
  75. Matsuya, Y.; Sasaki, K.; Yoshii, Y.; Okuyama, G.; Date, H. Integrated Modelling of Cell Responses after Irradiation for DNA-Targeted Effects and Non-Targeted Effects. Sci. Rep. 2018, 8, 4849. [Google Scholar] [CrossRef] [PubMed] [Green Version]
  76. Garcia, L.M.; Leblanc, J.; Wilkins, D.; Raaphorst, G.P. Fitting the linear-quadratic model to detailed data sets for different dose ranges. Phys. Med. Biol. 2006, 51, 2813–2823. [Google Scholar] [CrossRef]
  77. Astrahan, M. Some implications of linear-quadratic-linear radiation dose-response with regard to hypofractionation. Med. Phys. 2008, 35, 4161–4172. [Google Scholar] [CrossRef] [PubMed]
Figure 2. (A) Survival curves calculated for αref = 0.2 Gy−1 and αref/βref ranging between 0.1 and 100 Gy. (B) Effect of the αref/βref ratio on the MCF MKM biological weighting function for the linear term of the LQM (α(y), Equation (8)) computed for a synthetic cell line with mean characteristics (Rn = 4.7 µm and rd = 0.29 µm) and αref = 0.2 Gy−1.
Qubs 07 00003 g002
Figure 3. Effect of the αref/βref ratio on the RBEα = α/αref (A), β/βref (B), RBE50% (C), RBE10% (D), and RBE1% (E) of 12C ions as calculated with the MCF MKM for a synthetic cell line with mean characteristics (Rn = 4.7 µm and rd = 0.29 µm) and αref = 0.2 Gy−1.
Qubs 07 00003 g003
Figure 4. Effect of the absolute values of αref and βref on the RBEα = α/αref (A), β/βref (B), RBE50% (C), RBE10% (D), and RBE1% (E) of 12C ions as calculated with the MCF MKM for a synthetic cell line with mean characteristics (Rn = 4.7 µm and rd = 0.29 µm) and αref/βref = 2 and 10 Gy.
Qubs 07 00003 g004
Figure 5. (A) Clonogenic survival of human glioblastoma cells (A-172 cell line) exposed to photons: comparison between the in vitro data (black diamonds) and the LQM fits performed by the authors of the original article (short-dashed black line), by the PIDE team (dashed red line), and the novel MKM-based fit (solid blue line). (B) Detailed view of the survival data in linear-linear scale. α (C), β (D), RBE50% (E), RBE10% (F), and RBE1% (G) as a function of the LET of carbon ions as experimentally determined by the authors of the original article (black diamonds) and by PIDE team (open red diamonds) in comparison with MCF MKM predictions based on the αref and βref obtained by authors of the original article (black short-dashed line), by the PIDE team (dashed red line), and the novel MKM-based fit (solid blue line).
Qubs 07 00003 g005
Figure 6. (A) Clonogenic survival of human mammary epithelial cells (M/10 cell line) exposed to photons: comparison between the in vitro data (black diamonds) and the LQM fits performed by the authors of the original article (short-dashed black line), by the PIDE team (dashed red line), and the novel MKM-based fit (solid blue line). (B) Detailed view of the survival data in linear-linear scale. α (C), β (D), RBE50% (E), RBE10% (F), and RBE1% (G) as a function of the LET of carbon ions as experimentally determined by the authors of the original article (black diamonds) and by PIDE team (open red diamonds) in comparison with MCF MKM predictions based on the αref and βref obtained by authors of the original article (black short-dashed line), by the PIDE team (dashed red line), and the novel MKM-based fit (solid blue line).
Qubs 07 00003 g006
Figure 7. (A) Clonogenic survival of human astrocytoma cells (U-251MG cell line) exposed to photons: comparison between the in vitro data (black diamonds) and the LQM fits performed by the authors of the original article (short-dashed black line), by the PIDE team (dashed red line), and the novel MKM-based fit (solid blue line). (B) Detailed view of the survival data in linear-linear scale. α (C), β (D), RBE50% (E), RBE10% (F), and RBE1% (G) as a function of the LET of carbon ions as experimentally determined by the authors of the original article (black diamonds) and by PIDE team (open red diamonds) in comparison with MCF MKM predictions based on the αref and βref obtained by authors of the original article (black short-dashed line), by the PIDE team (dashed red line), and the novel MKM-based fit (solid blue line).
Qubs 07 00003 g007
Table 1. MCF MKM parameters used in the calculations to benchmark the MKM-based LQM fit of the photon in vitro survival curve.
Cell LineRn
[µm]
rd
[µm]
LQM Fitαref
[Gy−1]
βref = β0
[Gy−2]
αref/βref
[Gy]
α0
[Gy−1]
A-1725.7 [34]0.3 [34]original article [55]0.4050.05886.890.328
PIDE team [53]0.3100.08883.490.194
MKM-based0.4280.05447.870.357
M/104.7 [24]0.29 [24]original article [56]0.3000.06804.410.205
PIDE team [53]00.11200−0.156
MKM-based0.2880.07853.670.178
U-251MG4.9 [24]0.29 [24]original article [55]0.0310.05510.56−0.046
PIDE team [53]00.06090−0.085
MKM-based0.06350.04551.390
Disclaimer/Publisher’s Note: The statements, opinions and data contained in all publications are solely those of the individual author(s) and contributor(s) and not of MDPI and/or the editor(s). MDPI and/or the editor(s) disclaim responsibility for any injury to people or property resulting from any ideas, methods, instructions or products referred to in the content.