Abstract
Since the nuclear energy leakage that occurred at the Fukushima nuclear power plant in Japan, people have paid more attention to the danger of environmental radiation. Environmental radiation is monitored using Geiger counters, which are not easy to obtain in some areas. Therefore, this research proposes an open-source and low-cost handheld Geiger counter that uses solar energy to charge lithium-ion batteries. Our design can provide a low-cost environmental radiation monitoring platform and effectively enhance the public’s scientific education awareness of radiation hazards. The measured dose rate can be output through the serial port, allowing a LoRa wireless network to transmit data to a database. When the sensing network deployed by the radiometer detects that the radiation value of the area is abnormally increased, it can issue an alarm to the government for the first time. Moreover, the low-power radiometer design can reduce energy consumption, reduce the burden on the ecological environment caused by the deployment of the sensing network, and provide sustainability for the environment.
1. Introduction
Long-term exposure to ionizing radiation can cause DNA damage [1], including DNA double-strand breaks, defects in the DNA repair mechanism, and increased cancer risk. Therefore, the measurement of environmental radiation can help reduce cancer caused by exposure to radiation. A radiometer-dosimeter used to monitor ionizing radiation employs a Geiger–Müller (GM) tube [2], which is a gaseous ionization detector. A high voltage is applied between the two ends of the GM tube, which does not conduct without ionizing radiation. When high-speed particles penetrate the GM tube, the energy of the particles causes the gas in the tube to ionize, allowing conduction through the wire. A rapid gas ionization phenomenon occurs between the electrode and the tube wall. At this time, the GM tube outputs an impulse signal [3]. The number of impulse signals per unit time can be converted into dose rate units. The dose rate is the biological effect on the body from radiation exposure [4], in the International System of Units (SI units), which uses the sievert (Sv) for radiation measurement.
As a long-standing dose-rate-detection device, the GM tube is still widely used in nuclear power plants, radiology, and environmental radiation monitoring because of its higher sensitivity and reliability than semiconductor-based solid-state detectors [5]. Although radiometer-dosimeter products based on GM tubes are currently available for purchase, they need calibration for different device designs and GM tube models [6]. Such closed-source commercial products require reference instruments and nuclides to calibrate the dose rate. The large-scale deployment of radiation monitoring networks, while improving public awareness of radiation, has many challenges. Therefore, an open-source radiometer–dosimeter is necessary, so that researchers can adjust the conversion factor (CF) with different GM tube models.
A comparison of radiation detection instruments is shown in Table 1. Compared with an ionization camber and proportional counter, the surrounding radiation alarm based on the Geiger counter has a low cost [7]. It is also easier to manufacture, and the device is small, making it easy to deploy with an IoT-based sensing network. Therefore, to deploy an environmental radiation monitoring network on a low-cost and large-scale basis and monitor environmental radiation anomalies in real-time, the technology based on the GM tube is more suitable than other instruments.

Table 1.
Compare the different characteristics of different types of radiometers.
The flexible design of the GM tube enables a radiation monitoring network, and the widespread dissemination of proper radiation hazard knowledge to the public. As reported in past Geiger counter instrument-related research and published technical documents, a handheld Geiger counter called the Pocket Geiger [8] was developed for the Fukushima nuclear power plant accident. This device used a positive-intrinsic–negative (PIN) diode as a sensor for ionizing radiation detection. The device is connected to a smartphone, through the 3.5 mm headphone jack, to use an application for the calculation of the dose rate and record the Global Position System (GPS) location to upload the data.
An Internet of things (IoT) monitoring device was designed to monitor whether the exposure dose of radiation medical equipment in the hospital exceeds the standard during operation [9]. This design used Raspberry Pi, with integrated Wi-Fi, an Ethernet network as the central computing device. The single-board computer could convert the impulse signal generated by the M4011-series GM tube into the dose rate and upload it to the network database to realize the remote monitoring function.
Based on the design of a microcontroller [10], the PIC16F84 was used as a central dose rate computing unit, and the SBM-19-series GM tube was used to detect radiation. When the dose rate is abnormal, the computing unit could transmit data through the Universal Serial Bus (USB) interface to the back-end alarm system.
However, these designs could not combine the device’s size with low power consumption and low-cost features. Therefore, we chose to design a low-cost, handheld device that can be deployed outdoors to use solar charging with lithium-polymer (LiPo) batteries for sufficient operation at night. This device also relies on its microcontroller to compute and display the dose rate independently, without external computing equipment. At the same time, the software can modify the corresponding CF according to different GM tubes. The radiometer–dosimeter that combines these advantages can be manufactured quickly and adjusted by non-government organizations and research institutions in different regions to monitor environmental radiation. With this device, public awareness of radiation hazards will be easier to promote.
Our Contribution
Our open-source handheld Geiger counter can measure the dose rate and temperature of the environment, and researchers can adjust the CF with an easy-to-obtain GM tube. Another advantage is that the LiPo battery charging circuit designed for this device can be charged via micro-USB or with a solar panel with a voltage of 5 V and a current of 100 mAh, which improves the duration capability of the environmental radiation measurement in the field. Data can be recorded through the serial port, which can be connected to a wireless network module to become an IoT device, making it possible to deploy a network of radiation data. Furthermore, we show a feasible scheme to form a sensor network, using the LoRa module as an example. The total cost of this open-source handheld Geiger counter ranges from USD 30 to 40. The software and the hardware design have received Open Source Hardware Association (OSHWA) certification [11]. The mainstream platforms are Arduino (ATmega328P) [12] and ESP32 [13]. However, the design with limited battery size and solar panel area is unsuitable for long-term continuous radiation monitoring in the wild. We assume that the GM tube drive circuit and OLED display proposed in this study are combined with MSP430G2433, Arduino, and ESP32 to compare the power consumption [14,15]. In Table 2, the microcontroller’s MSP430 platform with relatively low power consumption can be used in the wild with solar panels. It has a longer monitoring time in the wild. Therefore, the design of the radiometer sensing network proposed in this study is more suitable for large-scale deployment. It can continuously monitor environmental radiation and contribute to the early alert, when the environmental radiation is abnormal.
Table 2.
Compare the power consumption between our proposed and other microcontroller-based open-source Geiger counters.
2. Materials and Methods
This chapter explains our proposed device design concept. The circuit architecture is shown in Figure 1, including the printed circuit board (PCB) layout and simulation model of the device.
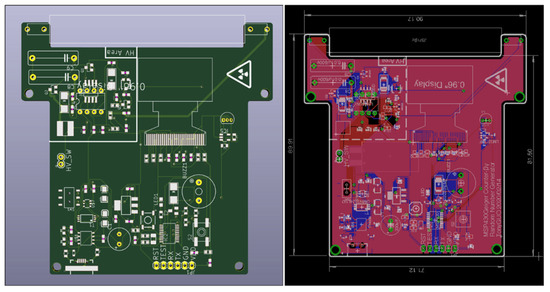
Figure 1.
Circuit architecture for the PCB layout (left) and simulation model of the device (right).
Figure 2 shows the top and bottom views of the handheld Geiger counter proposed in this study. Figure 2a shows the M4011-series GM tube. Figure 2b is a high-voltage (HV) generator based on LMC555. To generate an ionizing effect on the gas in the GM tube for radiation detection, 380 V must be applied to both ends of the GM tube. Figure 2c is an Organic Light-Emitting Diode (OLED) 128 × 64 pixel display to indicate the dose rate. Figure 2d is the LiPo battery charging circuit, which can be charged using micro-USB or solar panels. Figure 2e shows the microcontroller MSP430G2433, mode selection button, alarm buzzer, and flash LED. Figure 2f is the TMP35 ambient temperature sensor, which can output analog voltage and convert it to Celsius temperature by the microcontroller. Figure 2g is a solar panel with an output voltage of 5 V and a current of 100 mA, which uses sunlight to charge the battery charging circuit.
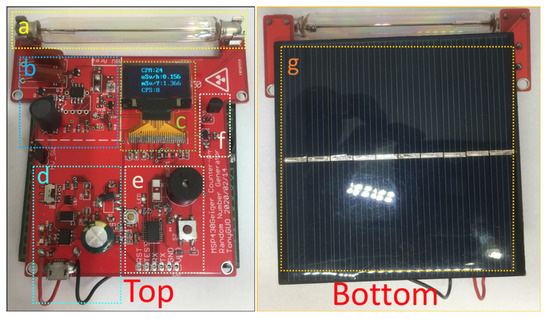
Figure 2.
Top and bottom views of the handheld Geiger counter: (a) GM tube, (b) HV generator, (c) OLED display, (d) LiPo battery charging circuit, (e) microcontroller MSP430G2433, (f) TMP35 ambient temperature sensor, and (g) solar panel.
Figure 3 describes the relationship between each module in the block diagram of the handheld Geiger counter in Figure 2. There are two blocks: (i) the microcontroller and peripheral modules and (ii) the power system. The power system includes a LiPo battery charging circuit and can use solar panels or a micro-USB as a power source. When the power switch is on, the LiPo battery supplies power to the linear regulator (LDO) and outputs 3.3 V. The voltage output by the LDO provides the power supply to the microcontroller and peripheral modules. The microcontroller uses an external interrupt to detect the GM tube’s impulse signal, quantifies the impulse signal count as the dose rate, and outputs the dose rate value to the OLED display through the inter-integrated circuit (IIC) bus. The analog voltage signal output by the ambient temperature sensor is sampled by the microcontroller’s analog-to-digital converter (ADC). The microcontroller converts the voltage to temperature in Celsius and outputs it to the OLED display. The microcontroller can switch between the Geiger counter and ambient temperature measurement modes through the mode-selection button. When the GM tube generates an impulse signal, the external alarm buzzer and flash LED are controlled by the microcontroller to alert the user of the intensity of the radiation. When the intensity is stronger, the excitation frequency of the alarm buzzer and flash LED increases.
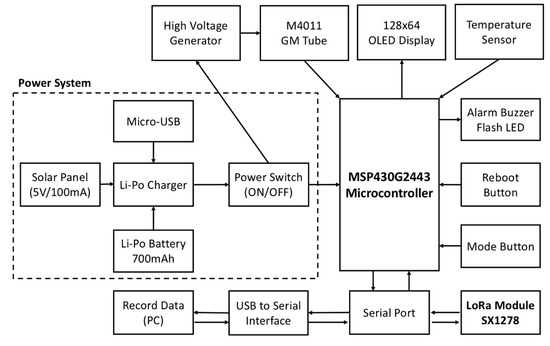
Figure 3.
Relationship between each module in the block diagram of the handheld Geiger counter.
Figure 4 illustrates the initialization process of the peripheral module by the microcontroller and the operation process of the handheld Geiger counter. The microcontroller first initializes the system clock and then initializes the general-purpose input and output (GPIO), as the communication protocol of the module to which the GPIO is connected. Next, the microcontroller jumps to the main loop of the program. In the Geiger counter mode, the current counts per minute (CPM) is measured, converted to a dose rate, and output to the OLED display and the serial port; the CPM value of the internal memory is then refreshed. The temperature in Celsius is displayed in the ambient temperature mode, and the ambient temperature value in the internal memory is refreshed. The impulse signal of the radiation detected by the GM tube is counted based on interrupt events because the accuracy of CPM affects the accuracy of dose rate measurement. When the impulse signal of the GM tube is generated, the microcontroller can pause the current task, and the priority is to increase the CPM.
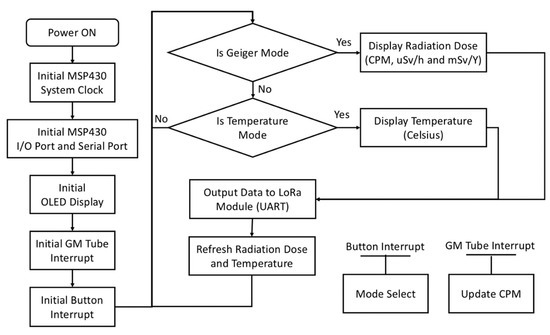
Figure 4.
Initialization process of the peripheral module by the microcontroller and the operation process of the handheld Geiger counter.
2.1. Solar LiPo Battery Charger
Figure 5 shows the schematic of the LiPo battery charging module. The charging circuit uses the TP4056 chip [16], and the DW01 charging protection circuit is used with the FS8205 chip integrated with two n-MOS [17,18]. According to the TP4056 specification, we connect pin-2 to a 2k pull-down resistor, and the maximum charging current set at this time is 580 mA. The LiPo battery fully charges to about 4.2 V. When the fully charged voltage threshold is reached, the charging needs to be interrupted to prevent the battery from overcharging and causing damage. The LiPo battery has a voltage of 3 V, when the power is completely consumed. At this time, the battery discharging needs to be stopped. Excessive discharging will reduce the battery capacity and may prevent the battery from being recharged. The overdischarge pin-1 and overcharge pin-3 of DW01 are connected to the two n-MOS integrated into FS8205. When the battery voltage is less than 2.4 V, it is overdischarged. At this time, pin-1 of DW01 will pull down, so the n-MOS is not turned on to stop battery discharge. When the battery voltage is greater than 4.25 V, it is overcharged. At this time, pin-3 of DW01 will pull down, to make the n-MOS turn off to stop battery charging.
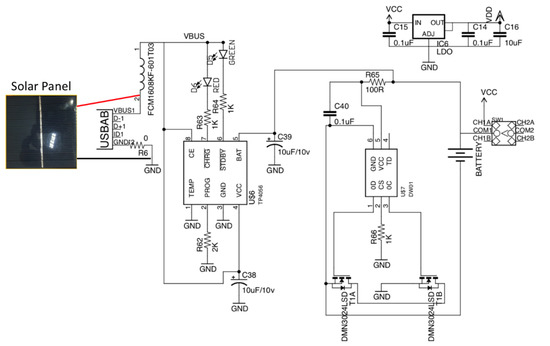
Figure 5.
Schematic of the LiPo battery charging module.
The CS pin-2 of DW01 can be used to detect overcurrent. A very small battery load resistance can cause excessive current to generate heat, risking explosion. When the detection voltage of this pin is greater than 150 mV, owing to the on-resistance of the n-MOS drain-source being 23 mΩ, the discharge current is greater than 6.5 A, and DW01 will interrupt the battery discharge. The voltage of the LiPo battery is 4.2 V as VCC. After input into LDO, the LDO output is 3.3 V as VDD, which is the system voltage.
The LiPo battery used in this study has a capacity of 700 mAh, so the battery can be fully charged in about an hour when using a USB. A solar panel with an output current of 100 mA under sufficient sunlight takes about seven hours to charge the battery. The main module power consumption of the Geiger counter proposed in this study includes about 0.35 mA when the MSP430G2433 is in active mode, about 6 mA when the OLED displays the dose rate, and about 3.5 mA for the GM tube drive circuit. The power consumption of the handheld Geiger counter proposed in this study is about 10 mA, and the LiPo battery can provide nearly 70 h of operating time. With six to eight hours of sunlight, the handheld Geiger counter can operate continuously for a long time. Each charging cycle of a LiPo battery can be used for about three days, and, after 300 cycles of charging, the battery can still have a capacity greater than 80%. A battery with a capacity greater than 80% indicates that it is still in good condition. Therefore, the device uses a LiPo battery as the power source, and it can be used outdoors for three years and still retain more than 80% of the battery capacity.
2.2. MSP430G2 Microcontroller
Figure 6 shows the schematic of the microcontroller. This study uses the MSP430G2433 [19], a 16-bit low-power mixed-signal microcontroller manufactured by Texas Instruments. We connect the IIC serial data line (SDA) and serial clock line (SCL) of the microcontroller to the OLED to display dose rate and ambient temperature [20]. For the serial port (Pins for Tx and Rx labels), we use the universal asynchronous receiver and transmitter protocol [21] as the data output port of the dose rate, which can also become the data output and input standard port of LoRa network modules. Other GPIOs include the impulse signal interrupt pin of the GM tube (Pins for GM_INT labels), interrupt pin of the mode selection button, analog voltage sampling of the ambient temperature (Pins for TEMPERATURE labels), and control of the alarm buzzer and flash Toer to save power consumption, we use a controllable low-dropout regulator (LDO) to manage the power supply of the LoRa module. When the system transmits data with the LoRa module, the MCU will turn on the LDO through GPIO to power the LoRa module. The LDO model number is LD3985M33R, produced by STMicroelectronics.
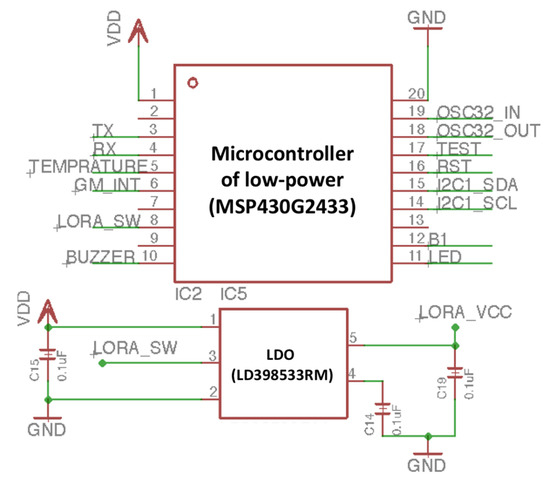
Figure 6.
Schematic of the microcontroller.
2.3. Long-Range (LoRa) Network
LoRa is a long-distance and low-power wireless communication technology [22]. Figure 7 is the connection between the LoRa module and the handheld Geiger counter through the UART interface. Figure 7a is a LoRa chip (model SX1278 produced by Semtech Inc, California, U.S.), and low-power Cortex-M0+ MCU is used to bridge the LoRa chip and UART (model HC32F005C6UA produced by HUADA Semiconductor Co, Shanghai, China). These two chips are the core of the LoRa module. Figure 7b is the external antenna required by the LoRa chip. The antenna frequency is 433 MHz, and it is connected to the antenna pin of the LoRa chip with an SMA connector. LoRa chip usually only consumes 2 µA of current in sleep mode, and the current consumption during transmission is 118 mA (3 km to 5 km transmission distance). The current consumption of modules with low noise amplifier (LNA) and power amplifier (PA) is added to 660 mA (transmission distance over 8 km). Therefore, the power management method of this study is that when the Geiger counter collects the dose rate of the environment, it will periodically wake up the LoRa module. The LoRa module will broadcast the data through the UART protocol, and the gateway will receive the dose rate.
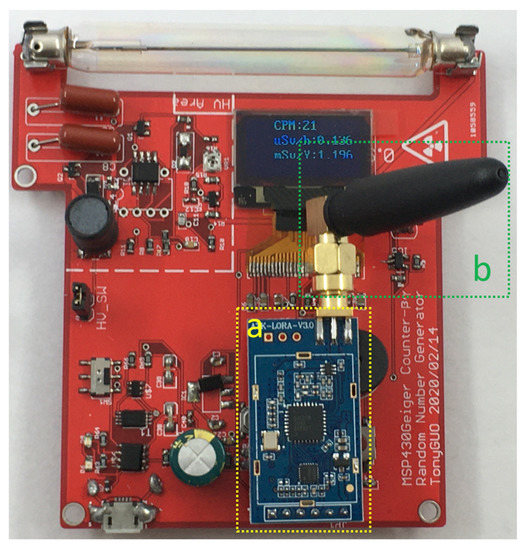
Figure 7.
The connection between the LoRa module and the handheld Geiger counter through the UART interface: (a) the LoRa chip and (b) the external antenna required by the LoRa chip.
When the handheld Geiger counter can use LoRa communication, we can build a sensing network to monitor environmental radiation. Figure 8 shows a form of monitoring network [23]. Since the SX1278 chip can receive and transmit, each handheld Geiger counter can be a sensor node or a gateway. The marginal circle of the gateway has a limited range, which depends on the power of the LoRa chip. When we want to locate a target with high radiation risk, we can find the possible zone from the three gateways, effectively and quickly marking the area where radiation hazards occur.
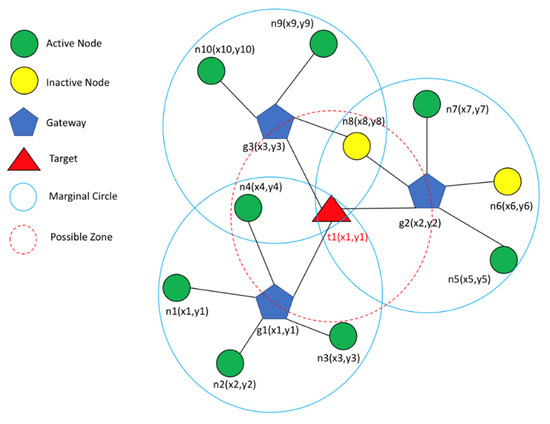
Figure 8.
The form of monitoring network.
2.4. Ambient Temperature Sensor
Figure 9 shows a schematic of the ambient temperature sensor, which is the TMP35 sensor manufactured by Analog Devices [24] in this study. We use an amplifier to increase the sensor’s output analog voltage and input it to the ADC of the microcontroller. Through Equation (1), we convert the analog voltage of the TMP35 to temperature in Celsius using the relationship between the amplifier gain and the ADC reference voltage. In addition, the typical accuracies of the TMP35 temperature sensor are ±1 °C at +25 °C and ±2 °C over the –40 °C to +125 °C temperature range. The temperature sensor can monitor the ambient temperature to detect whether the GM tube is in the applicable temperature range. When the temperature sensor detects that the ambient temperature exceeds the applicable temperature range of the GM tube, it means that the measured value of the GM tube is not available.
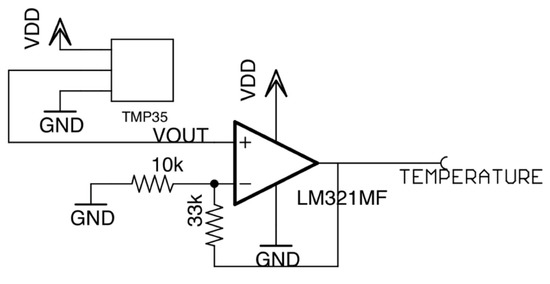
Figure 9.
Ambient temperature sensor schematic.
2.5. Geiger-Müller Counter Circuit
Figure 10 illustrates the LMC555 CMOS timer [25] produced by Texas Instruments. The LCM555, as an oscillator with a frequency of roughly 4 kHz, with an inductor, can generate HV and also act as a charge pump. Figure 10a shows the HV MPSA42 NPN transistor [26], the range of which can be changed by adjusting the variable resistance of subcircuit Figure 10b. Figure 10c comprises the HV generate side. The resistance value of this circuit block can be adjusted between 10 Ω and 28 Ω. The smaller resistance of this block generates a higher voltage.
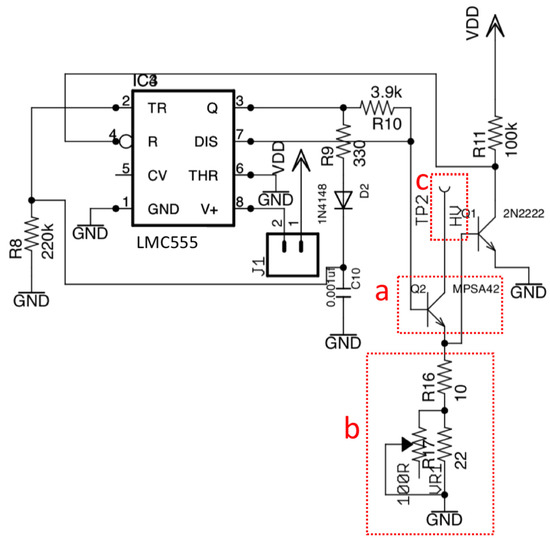
Figure 10.
LMC555 CMOS timer produced by Texas Instruments: (a) HV transistor, (b) variable resistance, and (c) HV generate side.
Figure 11 illustrates the circuit connecting the HV generator to the GM tube. The inductance of Figure 11a is 10 mH. Storing energy through the oscillator that repeatedly opens and closes can generate 380 V, and the current consumed is on the order of microamps, so the fast-recovery rectifier’s diode, part 1N4937 [27], is also needed. To adjust the voltage according to the type of GM tube, as in Figure 11b, we connect a 5.7 MΩ resistor in series between the HV and anode of the GM tube. The internal resistance, when measuring the DC voltage with a multimeter, is 10 MΩ. Therefore, according to the voltage division rule, the suggested working voltage of the M4011 GM tube is 380 V [28], which is achieved by the HV generator when the voltage measured by the multimeter is about 242 V. The impulse signal, which is generated when the GM tube detects radiation passing through the voltage divider, turns the NPN transistor of Figure 11c on, so the microcontroller’s interrupt is triggered to increase the CPM value. The M4011 GM tube we used in this study has a maximum measurable upper limit of the gamma-ray dose rate of 1200 µSv/h and an operating temperature range of −40 to 55 °C. The background count of the M4011 is 25 CPM. Considering Equation (5), the lower limit of its measurement is about 0.16 µSv/h.
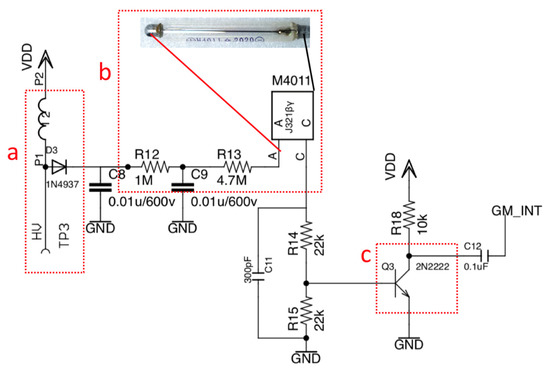
Figure 11.
Circuit connecting the HV generator to the GM tube: (a) 10-mH inductor, (b) 5.7-MΩ resistor in series connection between the HV and anode of the GM tube, and (c) NPN transistor.
2.6. CF Calibration Method
The microcontroller can count the impulse signals generated by the GM tube in real-time through interrupt events. We can measure the counts per second (CPS) to determine the CPM. The CPS calculation method of the proposed device is to count the number of interrupts every 20 s, which is multiplied by three to determine the CPM. The internal memory of CPM data is then updated. Therefore, the frequency of data reporting is increased, improving the accuracy.
The radiation protection recommendations of the International Commission on Radiological Protection propose that, in addition to background radiation, the average person is exposed to no more than one mSv/yr [29]. Therefore, to convert CPM to sieverts, we need to measure the calibrated sensitivity of GM tube to cobalt (Co60) and calculate the CF [30]. To determine the value of CF, we use a simple method, as shown in Figure 12, for the calibration procedure of the GM tube. Place the radiometer and the cobalt sample as the standard radioactive source in the same space, and count the events generated by the gamma-ray of the cobalt sample measured every second. This count will be different for different types of GM tubes. The model we used in this study was M4011, while we obtained a cobalt-calibrated sensitivity of 22.5 CPS/mR/h for the M4011 GM tube. We perform this calibration procedure at a room temperature of 25 degrees Celsius. According to the calculation of Equation (2), we can convert milliroentgens to microsieverts and then multiply 22.5 CPS/mR/h by 60 s/min, as shown by Equation (3), to obtain 1350 CPM/mR/h. Then, dividing by 8.77 μSv/mR yields a CF of 154 CPM/μSv/h. The value for the absorption rate to be used is 8.77 for the air [31]. Therefore, as shown by Equation (4), we determined the resolution of dose rate represented by each event count for M4011 to be 0.006493 μSv/h. The microcontroller calculates the current CPM and uses Equation (5) to obtain the dose rate in μSv/h. The dose in mSv/y can be calculated by multiplying the result by 24 h/day and then by 365 days/year, as expressed in Equation (6).
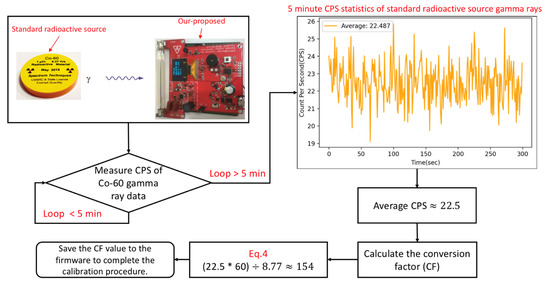
Figure 12.
The calibration procedure of the GM tube.
The microcontroller’s firmware is compiled with the Energia software of Texas Instruments, version number 1.6.10E18. Energia is an integrated development environment (IDE), so it also provides a serial port monitor that can receive handheld Geiger counter data. Spy-Bi-Wire protocol is used to program the microcontroller firmware.
3. Results
To simplify the verification required for researchers to manufacture the handheld Geiger counter designed in this paper, we use gas mantles as the radioactive source samples for verification tests. They are coated with thorium to emit white intensity luminescence [32]. Thorium is radioactive and can, therefore, be detected by the GM tube. Gas mantles are used in portable camping lanterns and can be found in camping outdoor supply stores. Other samples that are easy to obtain, such as Pakistani marble, may also contain radioactivity [33].
Figure 13 shows the experimental setup for this study. We placed the handheld Geiger counter above the gas mantles, aligned the GM tube at the center of the gas mantles, and adjusted the height between the two to observe the intensity of the dose rate. After determining the correlation coefficient, the designers who manufactured the handheld Geiger counter in this paper could verify the same material and process, and the performance of the handheld Geiger counter in measuring dose rate was consistent.
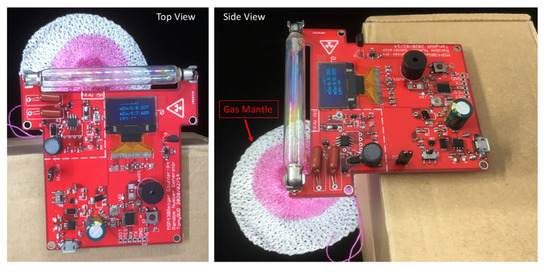
Figure 13.
Experimental setup for this study.
Figure 14 applies the box plot statistical method to show the test statistics at six distances and background radiations. The measurement time of each group was 1 h, and the measurement results were output to the PC for sampling through the serial port every 20 s. As the distance between the handheld Geiger counter and the gas mantles increased, the dose rate decreased significantly. When the distance between the two was closer, the dose rate significantly increased. This phenomenon might be due to the difference in the angular direction [34] of the nuclear radiation. When the distance was closer, the detection window of the GM tube could cover more angular differences. Therefore, different GM detector geometries at the same distance would yield different dose rate measurements, such as GM pancake tubes [35].
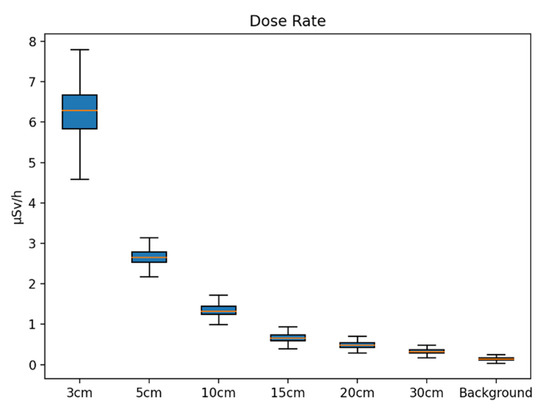
Figure 14.
Box plot statistical method showing our test statistics at six different distances and background radiations. (The black line is minimum to maximum, the blue box is lower to upper quartile, and the orange line is median).
Figure 15 shows the relation between the radioactive source’s distance and the dose rate. Dose rate and distance show an inverse proportion relation. The shorter the distance is, the greater the dose rate. Finally, we averaged the dose rate at each distance and compared the background radiation. As shown in Table 3, when the handheld Geiger counter detected the radiation source, the dose rate was several times that of the background radiation. Therefore, using the handheld Geiger counter proposed in this paper, the radiation source can be detected. The dose rate can indicate the distance between the handheld Geiger counter and the radiative target.
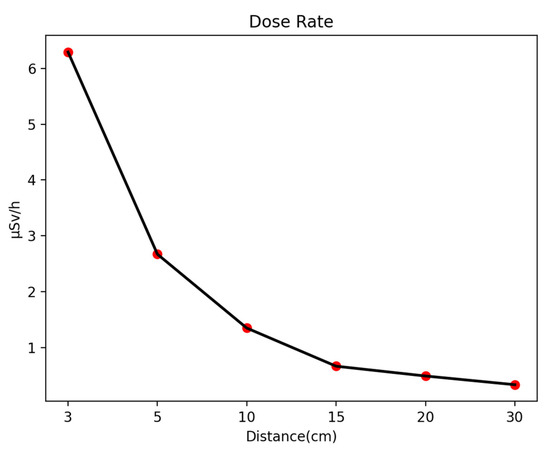
Figure 15.
The relation between the distance of the radioactive source and the dose rate.
Table 3.
Dose rate at each distance and background radiation.
4. Limitations
The solar radiometer with LoRa networking capability proposed in this study is mainly used for large-scale deployment. Due to the low-cost and low-power consumption, it is easy to deploy. However, GM tubes are unsuitable for accurate dose rate quantification. So, in future studies, new devices with more accurate dose rate quantification need further development. The radiometer sensing network proposed in this study is more suitable for early warning, when the radiation of the deployment environment increases abnormally.
5. Conclusions
To improve the manufacturability of the radiometer–dosimeter and enhance the public’s awareness of radiation hazards, we designed a handheld Geiger counter that can be charged with solar energy. Researchers can select an easy-to-obtain GM tube to adjust the dose rate parameters. We also provide a performance test method using a readily available radiation source. In our test, the distance between the GM tube and the gas mantles and detection window area affected the measurement. When the window was larger and the distance was small, the GM tube was more sensitive to radiation detection. In the future, based on the serial port reserved for this device, we can make serial connections with various IoT devices to provide a low-cost solution for forming Geiger counters into a network. This study also proposes a method to form a sensor network using LoRa technology. Through solar charging, the Geiger counter can operate nearly continuously, which is a good solution for environmental radiation monitoring. Finally, the radiometer sensing node proposed in this study is based on solar energy and is widely deployed in the natural environment, which is sustainable for the environment.
Author Contributions
C.-Y.G., T.-L.L. and T.-L.H. jointly wrote and revised the paper. All authors have read and agreed to the published version of the manuscript.
Funding
This research received no external funding.
Institutional Review Board Statement
Not applicable.
Informed Consent Statement
Not applicable.
Data Availability Statement
Not applicable.
Conflicts of Interest
The authors declare no conflict of interest.
References
- Borrego-Soto, G.; Ortiz-López, R.; Rojas-Martínez, A. Ionizing radiation-induced DNA injury and damage detection in patients with breast cancer. Genet. Mol. Biol. 2015, 38, 420–432. [Google Scholar] [CrossRef] [PubMed]
- Barclay, D. Improved response of Geiger Muller detectors. IEEE Trans. Nucl. Sci. 1986, 33, 613–616. [Google Scholar] [CrossRef]
- Yasin, M.; Ahmed, R.; Gill, P.S. An External Cathode Hard-Glass Geiger–Müller Tube. Nature 1951, 167, 647. [Google Scholar] [CrossRef] [PubMed]
- What Is the Relationship between Exposure Rate and Dose Rate? U.S. Environmental Protection Agency. 2022. Available online: https://www.epa.gov/radnet/what-relationship-between-exposure-rate-and-dose-rate (accessed on 13 May 2022).
- Hill, I.G.; McLean, A.B. A comparison of two high performance inverse photoemission bandpass detectors. Rev. Sci. Instrum. 1998, 69, 261–264. [Google Scholar] [CrossRef]
- Morosh, V.; Röttger, A.; Neumaier, S.; Krasniqi, F.; Živanović, M.; Kržanović, N.; Pantelić, G.; Iurlaroc, G.; Mariotti, F.; Sperandio, L.; et al. Investigation into the performance of dose rate measurement instruments used in non-governmental networks. Radiat. Meas. 2021, 143, 106580. [Google Scholar] [CrossRef]
- Solymosi, J.; Vincze, A.; Baumler, E.; Sarkadi, A.; Gujgiczer, A.; Pinter, I. Wide range universal radiation measuring instrument. Acad. Appl. Res. Mil. Sci. (Online) 2002, 1, 133–144. [Google Scholar]
- Ishigaki, Y.; Ichimiya, R.; Matsumoto, Y.; Tanaka, K. Ultra-low-cost radiation monitoring system utilizing smartphone-connected sensors developed with internet community. In Proceedings of the 2012 IEEE, Taipei, Taiwan, 28–31 October 2012; pp. 1–4. [Google Scholar]
- Garcia-Sanchez, A.J.; Garcia Angosto, E.A.; Moreno Riquelme, P.A.; Serna Berna, A.; Ramos-Amores, D. Ionizing radiation measurement solution in a hospital environment. Sensors 2018, 18, 510. [Google Scholar] [CrossRef] [PubMed]
- Buruiană, V.; Oprea, M. A microcontroller-based radiation monitoring and warning system. In Proceedings of the 8th International Conference on Artificial Intelligence Applications and Innovations (AIAI), Halkidiki, Greece, 27–30 September 2012; pp. 380–389. [Google Scholar]
- Open Source Hardware Association Certification. MSP430G2-GEIGER-COUNTER. 2022. Available online: https://certification.oshwa.org/tw000004.html (accessed on 1 September 2022).
- Rahman, N.A.A.; Lombigit, L.; Abdullah, N.A.; Azman, A.; Dolah, T.; Muzakkir, A.; Jaafar, Z.; Mohamad, G.H.P.; Ramli, A.A.M.; Zain, R.M.; et al. Arduino based radiation survey meter. AIP Conf. Proc. 2016, 1704, 030012. [Google Scholar]
- Chowdhury, A.T.; Muktadir, M.S.; Zakir, M.G. Smartgeiger–Development of Background Radiation Monitoring with IoT Based Device. In Proceedings of the 2021 International Conference on Automation, Control and Mechatronics for Industry 4.0 (ACMI), Rajshahi, Bangladesh, 8–9 July 2021; pp. 1–6. [Google Scholar]
- Al-Shorman, M.Y.; Al-Kofahi, M.M.; Al-Kofahi, O.M. A practical microwatt-meter for electrical energy measurement in programmable devices. Meas. Control 2018, 51, 383–395. [Google Scholar] [CrossRef]
- Mekki, K.; Bajic, E.; Chaxel, F.; Meyer, F. Concept and hardware considerations for product-service system achievement in Internet of Things. In Proceedings of the 2019 International Conference on Wireless Technologies, Embedded and Intelligent Systems (WITS), Fez, Morocco, 3–4 April 2019. [Google Scholar]
- TP4056 Datasheet. Li-Po Battery Charger IC. 2022. Available online: https://dlnmh9ip6v2uc.cloudfront.net/datasheets/Prototyping/TP4056.pdf (accessed on 7 March 2022).
- DW01 Datasheet. Li-Po Battery Protect IC. 2006. Available online: https://cdn.sparkfun.com/assets/learn_tutorials/2/5/1/DW01-P_DataSheet_V10.pdf (accessed on 1 September 2006).
- FS8205A Datasheet. N-Channel Enhancement Mode MOSFET IC. 2021. Available online: https://datasheet.lcsc.com/szlcsc/2010271837_FUXINSEMI-FS8205A_C908265.pdf (accessed on 1 March 2021).
- MSP430G2433 Datasheet. MSP430G2x33 Mixed-Signal Microcontrollers. 2016. Available online: https://www.ti.com/lit/gpn/msp430g2403 (accessed on 1 April 2016).
- SSD1306 Datasheet. OLED Driver. 2008. Available online: https://cdn-shop.adafruit.com/datasheets/SSD1306.pdf (accessed on 1 April 2008).
- He, C.; Xia, Y.; Wang, L. A universal asynchronous receiver transmitter design. In Proceedings of the 2011 IEEE International Conference on Electronics, Communications and Control, Ningbo, China, 9–11 September 2011; pp. 691–694. [Google Scholar]
- Li, Y.; Yan, X.; Zeng, L.; Wu, H. Research on water meter reading system based on LoRa communication. In Proceedings of the 2017 IEEE International Conference on Smart Grid and Smart Cities (ICSGSC), Singapore, 23–26 July 2017. [Google Scholar]
- Jia, Z.; Guan, B. Received signal strength difference–based tracking estimation method for arbitrarily moving target in wireless sensor networks. Int. J. Distrib. Sens. Netw. 2018, 14, 1–19. [Google Scholar] [CrossRef]
- Wellem, T.; Setiawan, B. A microcontroller-based room temperature monitoring system. Int. J. Comput. Appl. 2012, 53, 7–10. [Google Scholar] [CrossRef]
- LMC555 Datasheet. 555 CMOS Timer. 2016. Available online: https://www.ti.com/lit/gpn/lmc555 (accessed on 1 July 2016).
- MPSA42 Datasheet. High Voltage NPN Transistors. 2013. Available online: https://www.onsemi.com/pdf/datasheet/mpsa42-d.pdf (accessed on 1 February 2013).
- 1N4937 Datasheet. Fast Recovery Rectifiers Diode. 2020. Available online: https://www.vishay.com/docs/88508/1n4933.pdf (accessed on 1 July 2020).
- M4011 Specification. Geiger Tube. 2019. Available online: https://github.com/SensorsIot/Geiger-Counter-RadiationD-v1.1-CAJOE-/blob/master/M4011%20Geiger%20Tube%20Specification.pdf (accessed on 3 January 2019).
- Wrixon, A.D. New ICRP recommendations. J. Radiol. Prot. 2008, 28, 161. [Google Scholar] [CrossRef] [PubMed]
- Holovatyy, A.; Teslyuk, V.; Kryvinska, N.; Kazarian, A. Development of Microcontroller-Based System for Background Radiation Monitoring. Sensors 2020, 20, 7322. [Google Scholar] [CrossRef] [PubMed]
- Isaksson, M.; Raaf, C.L. Environmental Radioactivity and Emergency Preparedness; CRC Press: Boca Raton, FL, USA, 2017. [Google Scholar]
- Hassan, H.J.; Hashim, S.; Sanusi, M.S.M.; Bradley, D.A.; Alsubaie, A.; Tenorio, R.G.; Bakri, N.F.; Tahar, R.M. The Radioactivity of Thorium Incandescent Gas Lantern Mantles. Appl. Sci. 2021, 11, 1311. [Google Scholar] [CrossRef]
- Tufail, M.; Iqbal, M.; Mirza, S.M. Radiation doses due to the natural radioactivity in Pakistan marble. Radioprotection 2000, 35, 299–310. [Google Scholar] [CrossRef]
- Frauenfelder, H.A.N.S. Angular correlation of nuclear radiation. Annu. Rev. Nucl. Sci. 1953, 2, 129–162. [Google Scholar] [CrossRef]
- Machaj, B.; Mirowicz, J.; Kowalska, E. Performance of a plastic scintillator and GM pancake tubes as alpha and beta contamination detectors in dosimetric stand. Nukleonika 2011, 56, 53–56. [Google Scholar]
Publisher’s Note: MDPI stays neutral with regard to jurisdictional claims in published maps and institutional affiliations. |
© 2022 by the authors. Licensee MDPI, Basel, Switzerland. This article is an open access article distributed under the terms and conditions of the Creative Commons Attribution (CC BY) license (https://creativecommons.org/licenses/by/4.0/).