Article

Virtual Angstrom-Beam Electron Diffraction Analysis for Zr80Pt20 Metallic Glasses

by
Akihiko Hirata
1,2,3,4,5
1
Department of Materials Science, Waseda University, Tokyo 169-8555, Japan
2
Kagami Memorial Research Institute for Materials Science and Technology, Waseda University, Tokyo 169-0051, Japan
3
WPI Advanced Institute for Materials Research, Tohoku University, Sendai 980-8577, Japan
4
Mathematics for Advanced Materials-OIL, National Institute of Advanced Industrial Science and Technology, Sendai 980-8577, Japan
5
Research Center for Advanced Measurement and Characterization, National Institute for Materials Science, Tsukuba, 305-0047, Japan
Quantum Beam Sci. 2022, 6(4), 28; https://doi.org/10.3390/qubs6040028
Submission received: 24 August 2022 / Revised: 13 September 2022 / Accepted: 20 September 2022 / Published: 22 September 2022

Abstract

:
To analyze amorphous structure models obtained by a molecular dynamics (or reverse Monte Carlo) simulation, we propose a virtual angstrom-beam electron diffraction analysis. In this analysis, local electron diffraction patterns are calculated for the amorphous models at equal intervals as performed in the experiment, and the local structures that generate paired diffraction spots in the diffraction patterns are further analyzed by combining them with a Fourier transform and a Voronoi polyhedral analysis. For an example of Zr80Pt20, an aggregate of coordination polyhedra is formed which generates similar diffraction patterns from most parts within the aggregate. Furthermore, the coordination polyhedra are connected in certain orientational relationships which could enhance the intensity of the diffraction spots.

1. Introduction

Amorphous structures do not have any structural periodicity or long-range structural order similar to crystal structures. It is, therefore, hard to characterize amorphous structures differently from crystal structures which can be classified by space group. However, it is well known that amorphous structures are not entirely random, unlike ideal gases. Many previous scattering experiments have revealed the existence of short- to medium-range order in amorphous structures [1,2,3,4,5,6,7,8,9,10,11]. Atomistic models of amorphous structures have been constructed using molecular dynamics and reverse Monte Carlo simulations to fit scattering experiments [6,7] and handmade methods [8,9,10,11]. In metallic glasses especially, atomic coordination polyhedra and their aggregates are proposed as short- and medium-range order structures [7,8,9,10,11]. Voronoi polyhedral analysis, which gives the geometric features of coordination polyhedra [12], has been widely used to extract such local structures. This method is useful for detecting coordination polyhedra, such as icosahedra and prisms, and their connecting network corresponding to short- and medium-range order structures. However, it is also necessary to understand the medium-range order based on diffraction experiments because the observation is basically performed in reciprocal space.
This paper proposes a computational method for extracting the medium-range order from the models of amorphous structures constructed by a molecular dynamics (or reverse Monte Carlo) simulation through reciprocal space. In this method, the focused electron beam virtually goes through the model of amorphous structures and is mainly diffracted by short- to medium-range order structures, similar to the angstrom-beam electron diffraction experiment [13,14,15,16]. This method enables us to extract medium-range order structures from successive local regions in real space that give diffraction patterns, including sharp diffraction spots.

2. Simulation

Atomic configurations of an amorphous Zr80Pt20 alloy were prepared using a molecular dynamics method. The embedded atom method of interatomic potentials for a Zr-Pt system developed by Sheng [17] was utilized for the calculation. The simulation was carried out under constant isothermic-isobaric (NPT) conditions using a LAMMPS Molecular Dynamics Simulator [18]. The cubic cell, including randomly distributed 9600 Zr and 2400 Pt atoms with a dimension of 6.347 × 6.347 × 6.347 nm3, was prepared as an initial configuration. The configuration was kept at 2000 K for 100 ps and then cooled down to 300 K at cooling rates of 3.0 × 10⁹ K s−1 and 3.0 × 10¹³ K s−1. The temperature and pressure were controlled by a Nose-Hoover thermostat and barostat. Electron diffraction patterns were simulated using a conventional multislice method [19]. The electron accelerating voltage, third-order spherical aberration coefficient, and defocus value were set to 200 kV, 0.005 mm, and 0 nm, respectively. The convergence semiangle of the electron beam was set to 4.0 mrad. The electron beam irradiation positions were set at 0.2 nm intervals.

3. Results and Discussion

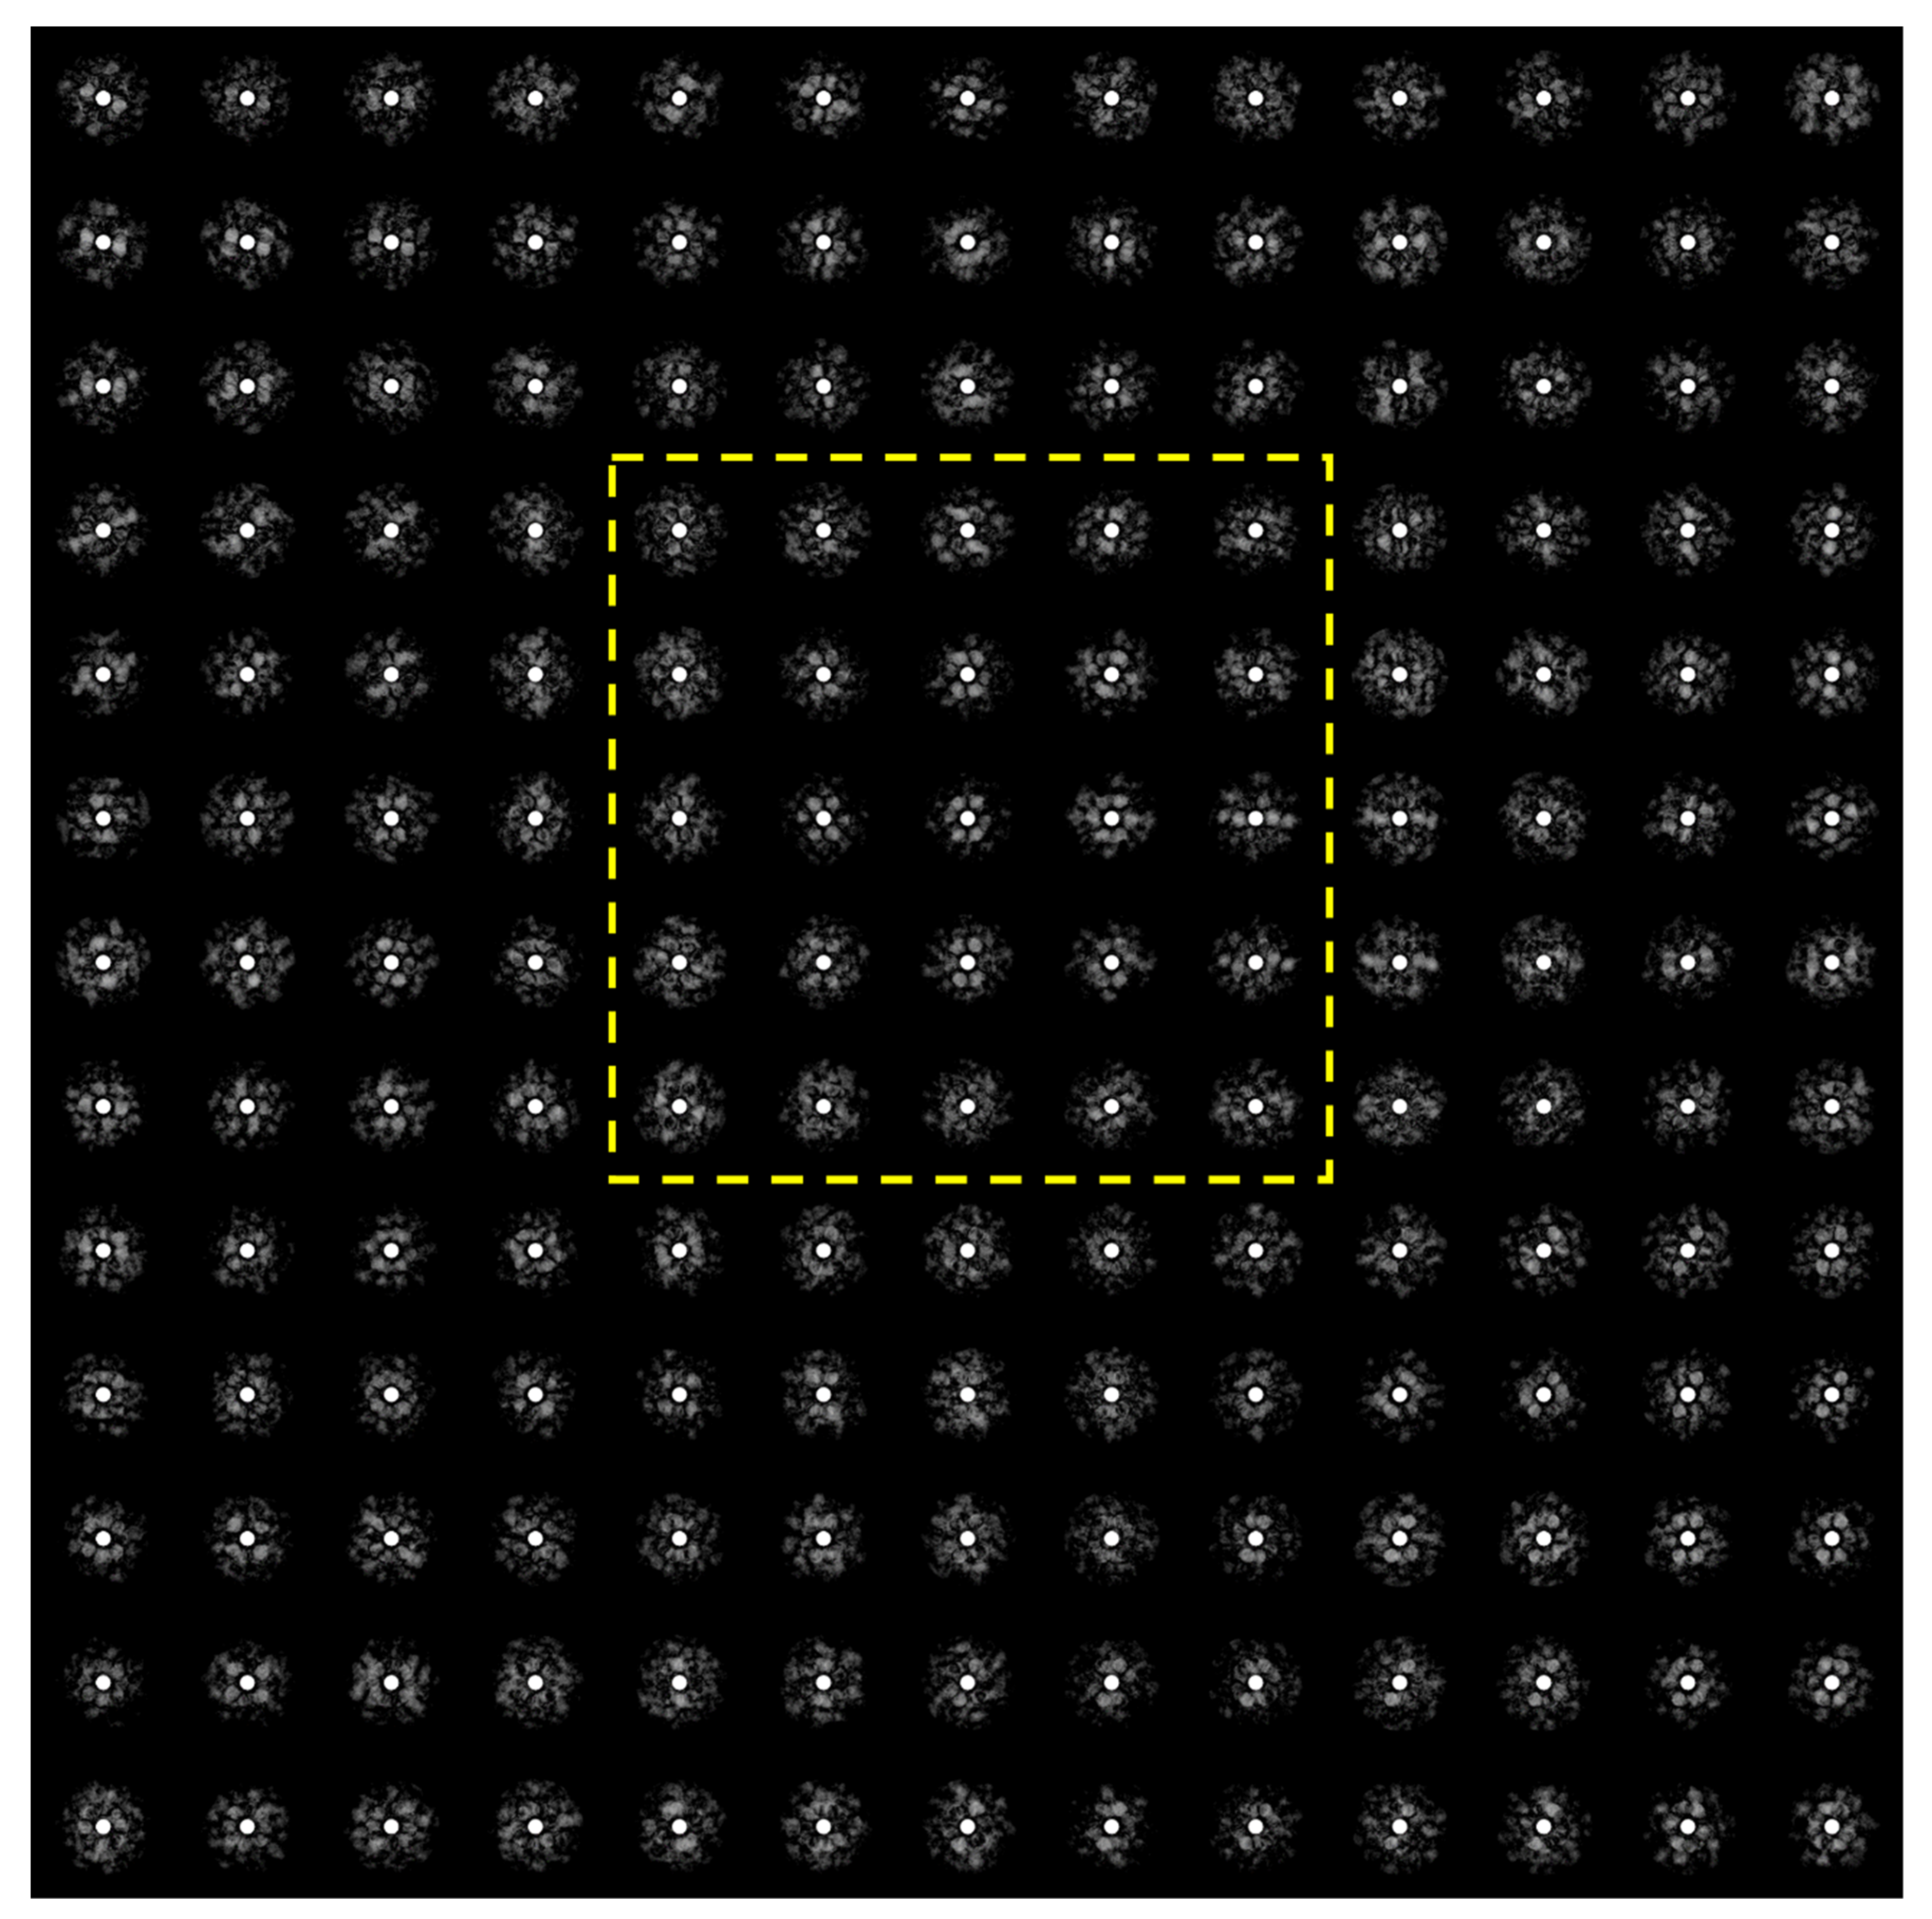
Figure 1 shows a structural model of the Zr80Pt20 metallic glass simulated by the molecular dynamics method. The cooling rate is 3.0 × 10⁹ K s−1. The model in Figure 1a is the original cubic model sliced into a 2.0 nm thickness. Note that there is no crystalline order at all in the structural model. Electron diffraction calculations were then performed for the local area enclosed by the dotted lines in Figure 1a, and Figure 1b shows 169 points where the focused electron beam was virtually irradiated at 0.2 nm intervals in the local area. Figure 2 shows the local electron diffraction patterns calculated from the 169 points shown in Figure 1b. Distinct diffraction spots were observed in most patterns obtained from local areas. In particular, it should be noted that similar diffraction patterns can be seen continuously over several steps.
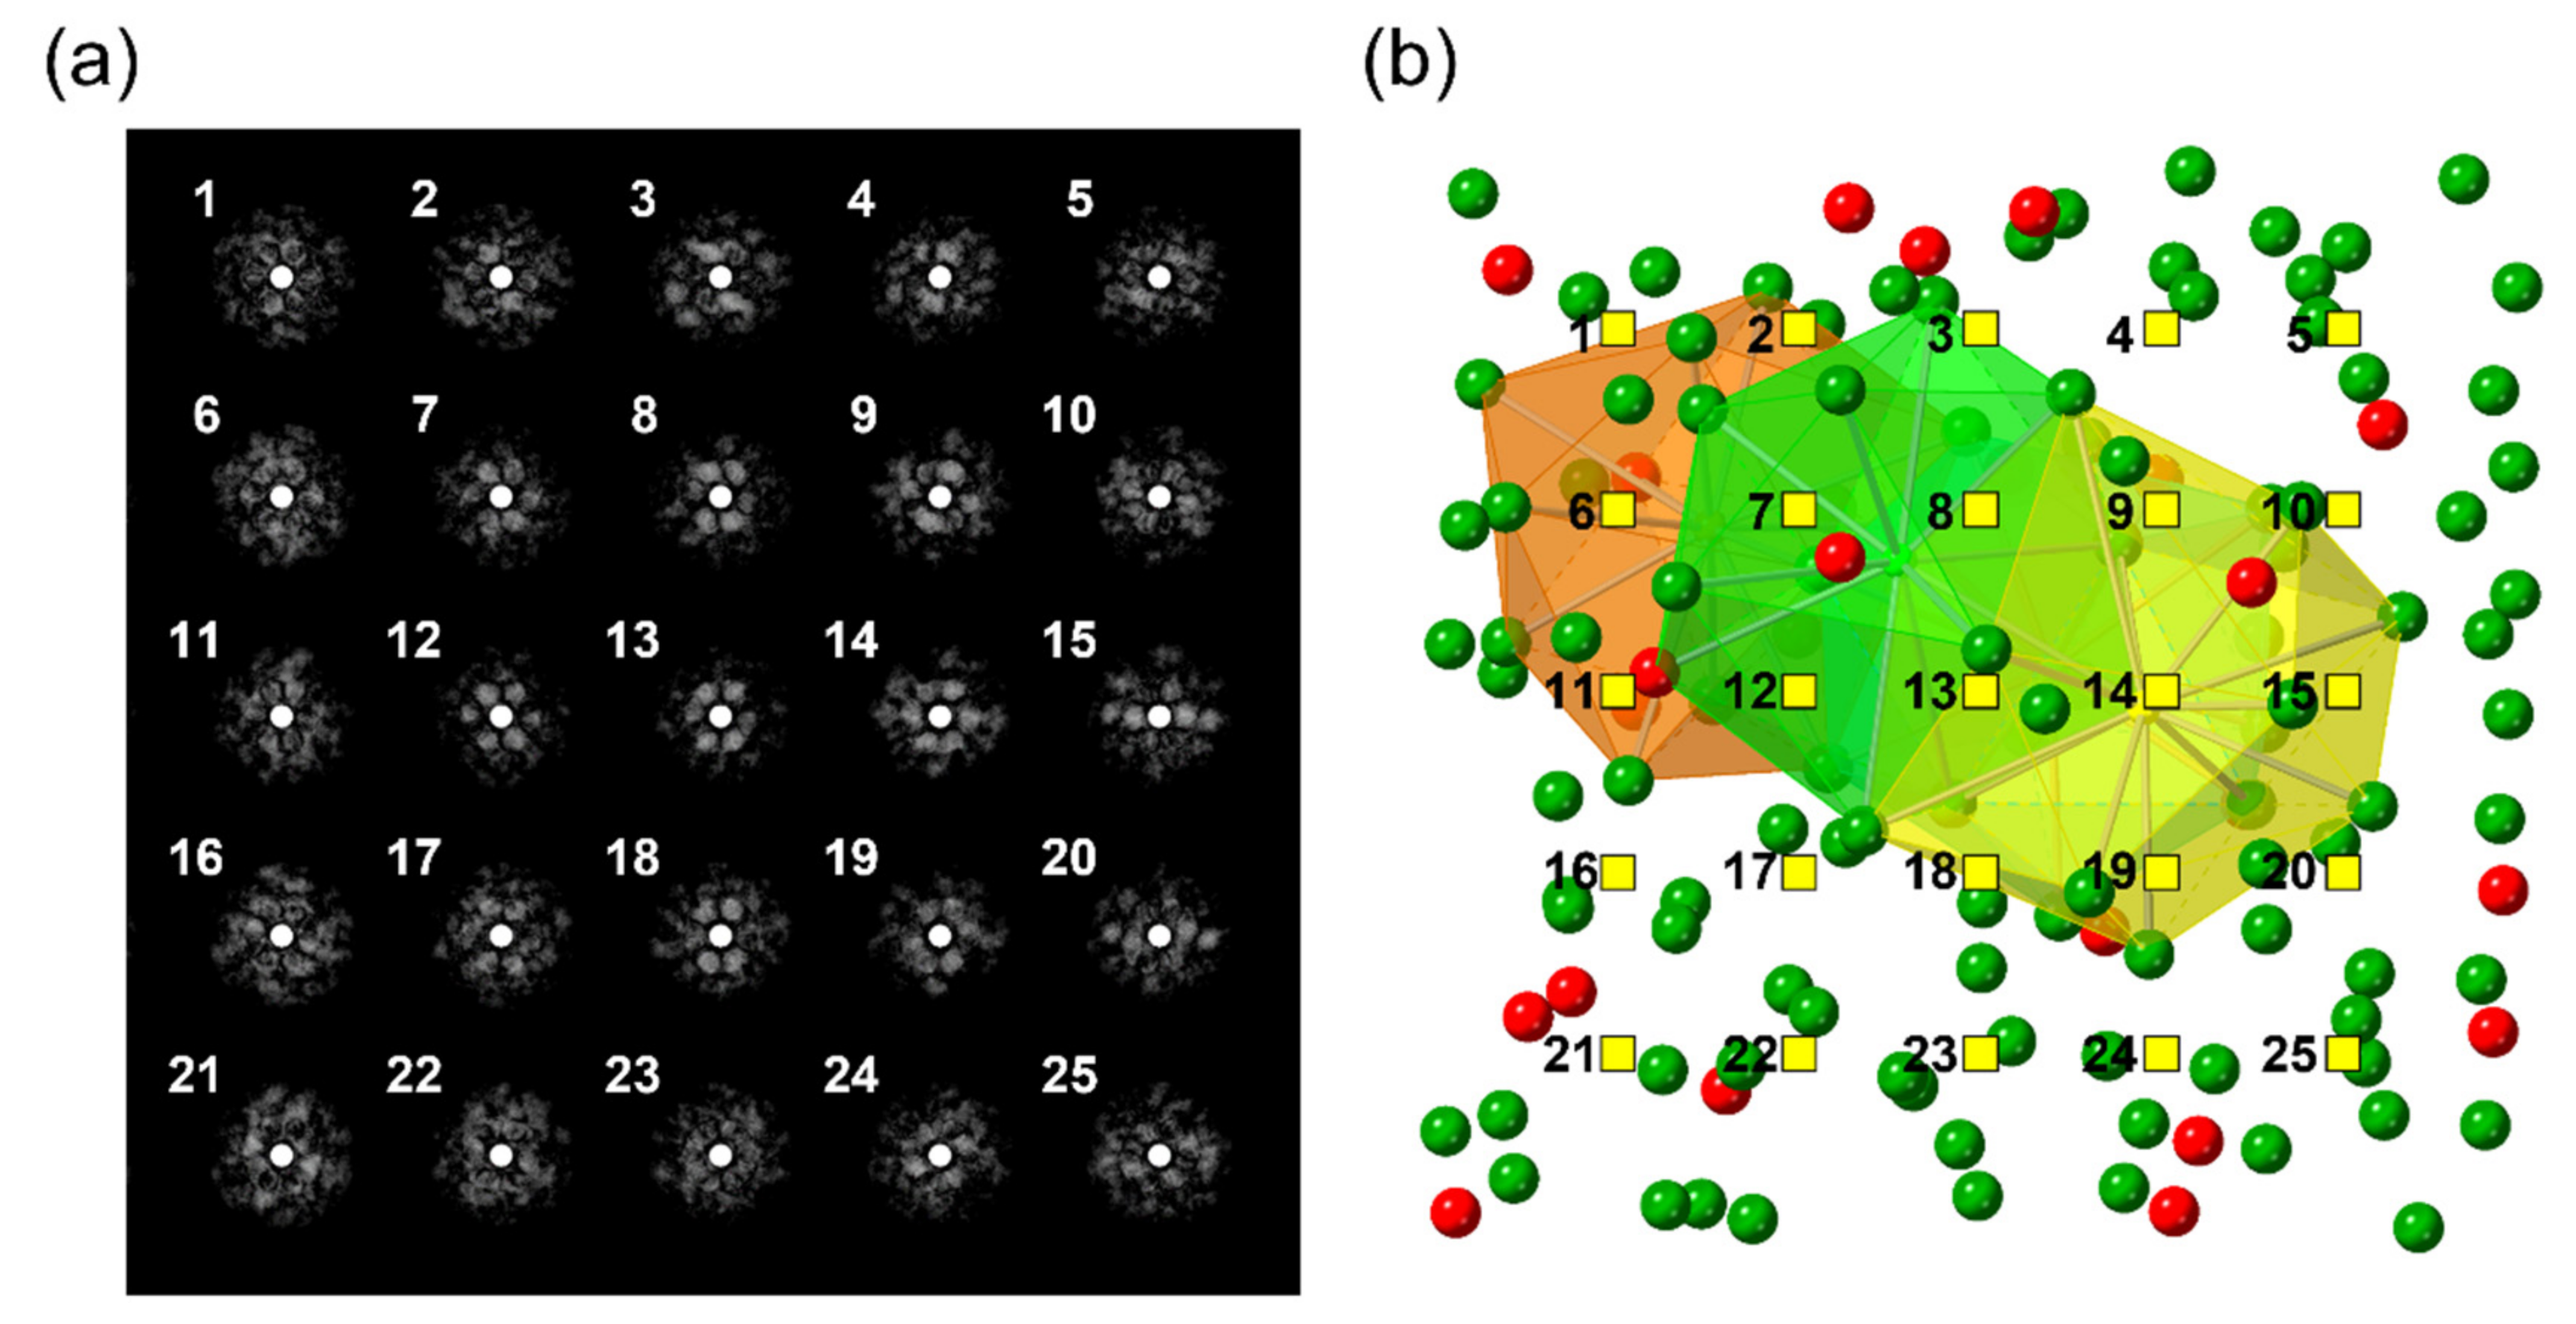
The 25 electron diffraction patterns surrounded by the dotted lines in Figure 2 are shown in Figure 3a. Focusing on the diffraction pattern, we can see that two pairs of diffraction spots are clearly visible and that similar patterns are seen around pattern 13. Note that similar electron diffraction patterns have been observed experimentally [16]. Figure 3b shows the atomic configuration corresponding to Figure 3a, together with the numbered points of the beam center. The coordination polyhedra, usually regarded as the short-range order of metallic glasses, are also shown in Figure 3b. Each coordination polyhedron consisting of 12 atoms has a Voronoi index of <0 2 8 1 0 0>, which is a dominant index in a Zr80Pt20 metallic glass [16].
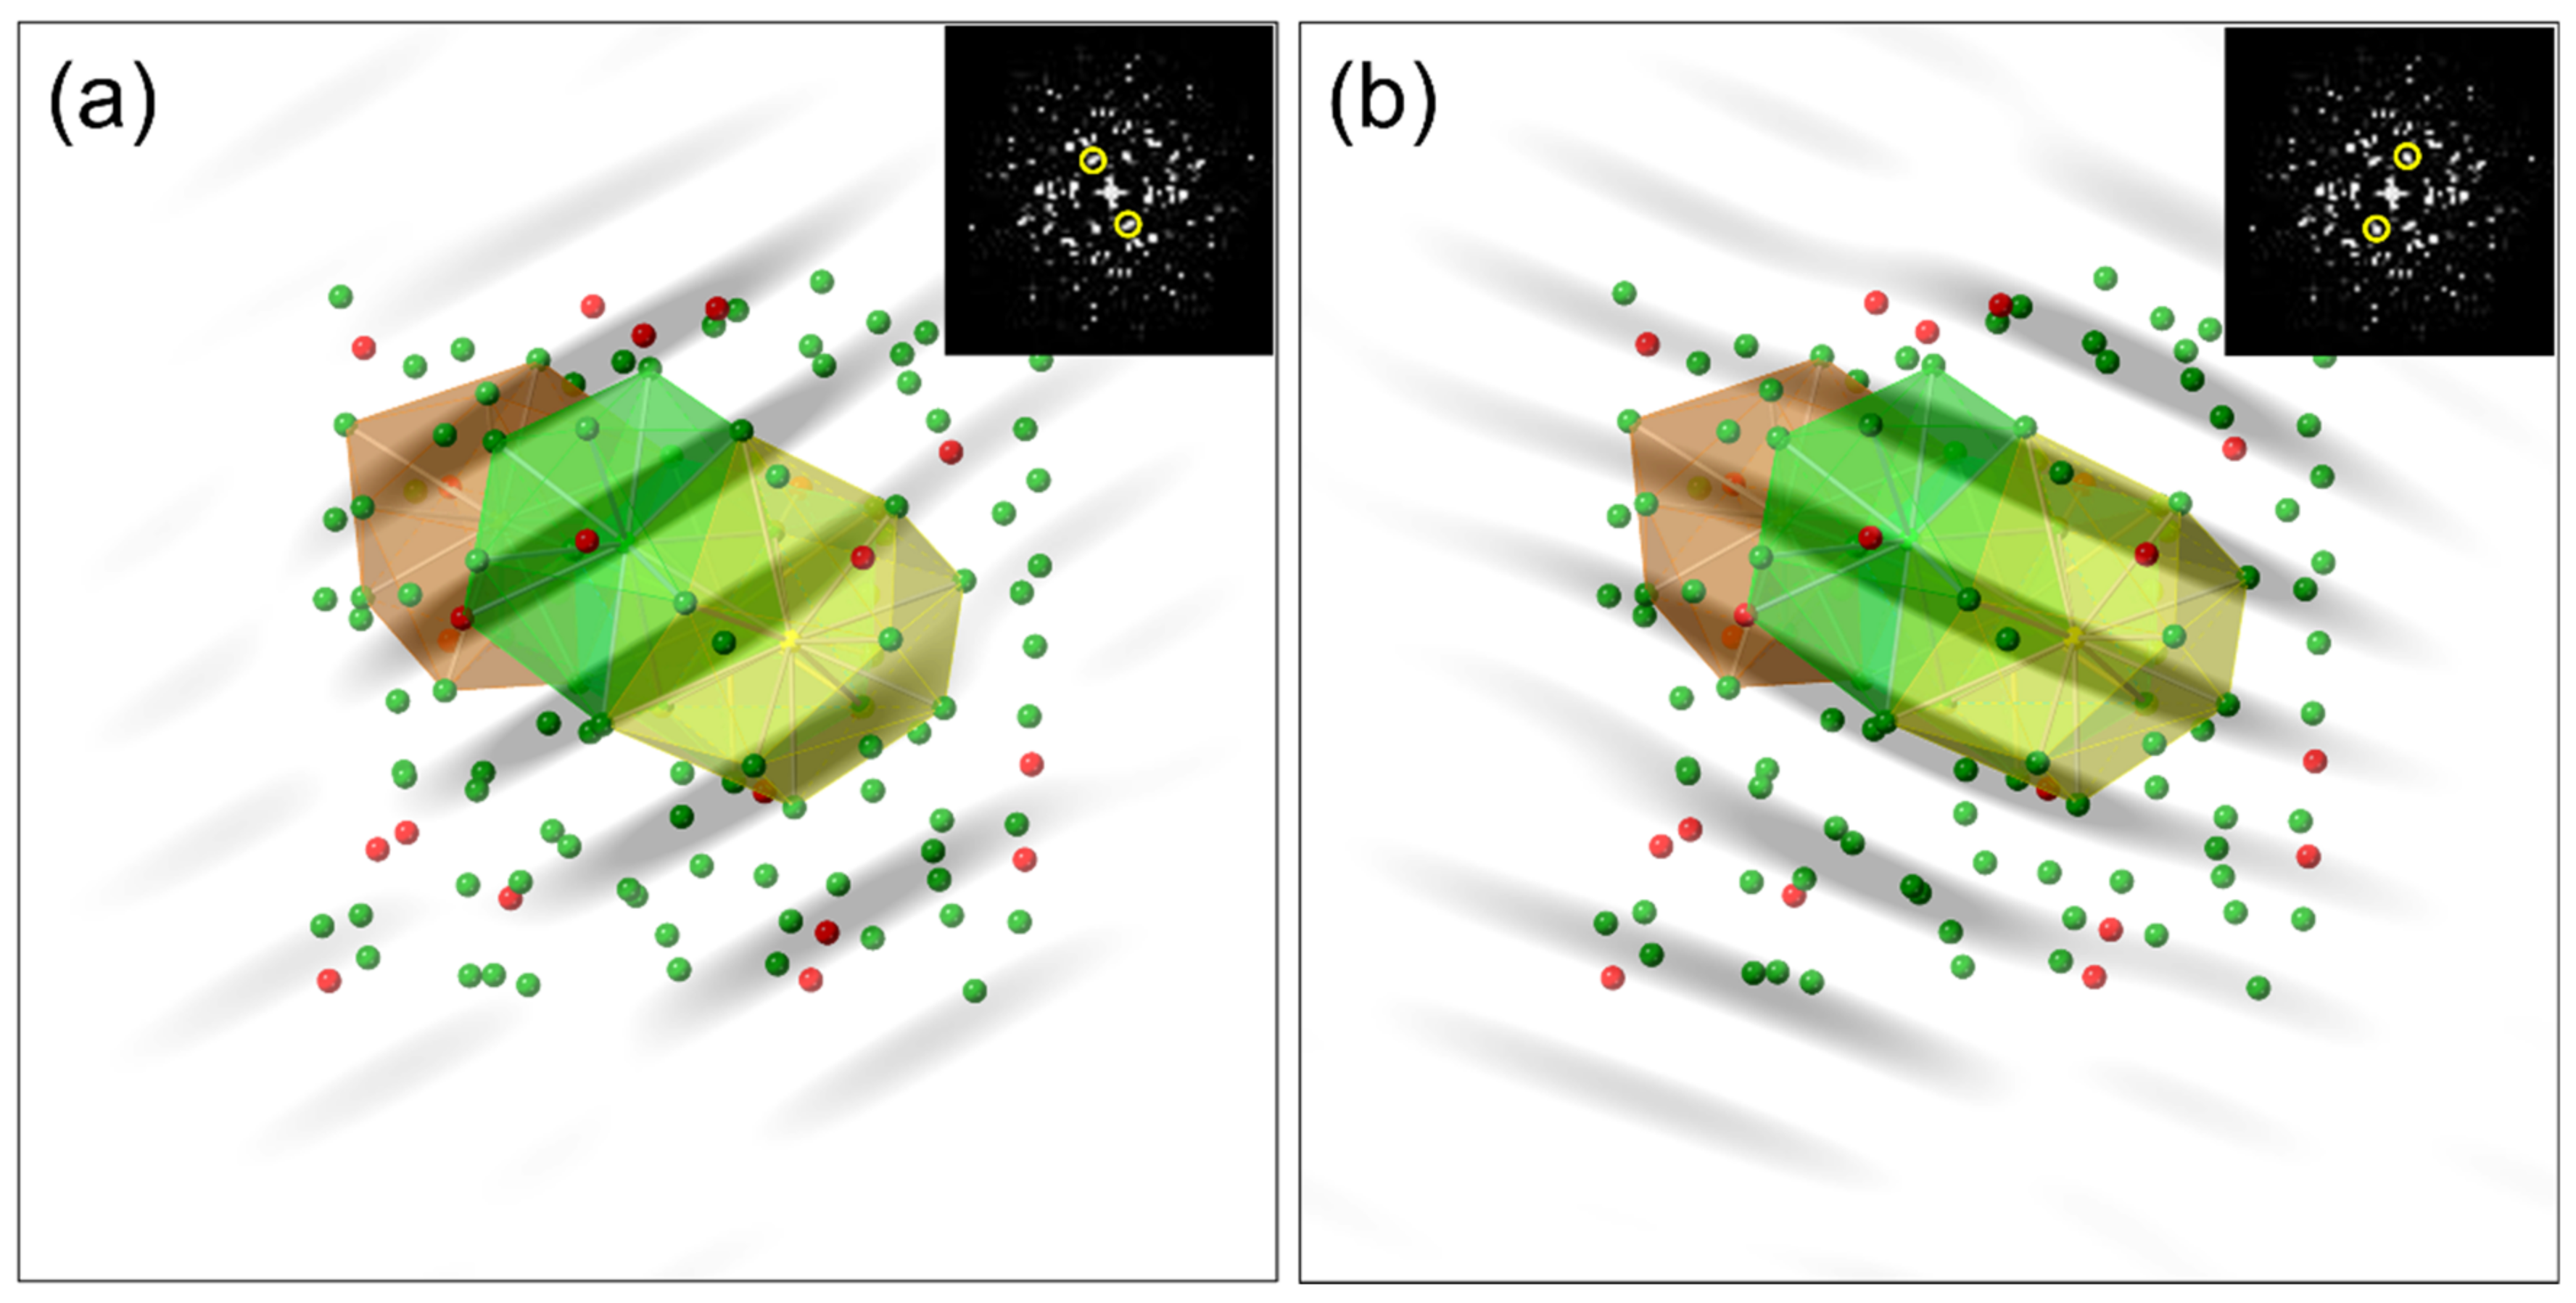
As seen in Figure 3, similar diffraction patterns, including two pairs of diffraction spots, extend over the region with a diameter of about 1.0 nm. This implies that a pseudo periodic structure corresponding to the paired spots is expected to form in this area. To understand the pseudo periodicity in the local structure, we performed a fast Fourier transform (FFT) for the projected image of the atomic configuration in Figure 3b. The FFT pattern obtained from a black and white image of the atomic configuration is shown in the inset of Figure 4. We can see two sets of paired diffraction spots similar to pattern 13 in Figure 3a. The inverse FFT images are calculated by using these paired spots and superimposed on Figure 3b as shown in Figure 4a,b. It can be seen that most of the atoms are distributed on the periodic gray lines corresponding to the spots in the inset. The shapes of coordination polyhedra are also related to the periodic lines.
Figure 5 shows the aggregation of coordination polyhedra which can be regarded as a medium-range order. The orientation in Figure 5a is the same as in Figure 3b, while Figure 5b is projected from a different orientation. Notably, all coordination polyhedra are connected by sharing a face or interpenetrating, indicating an orientational relationship between the neighboring polyhedra. The medium-range order in metallic glasses has been discussed in terms of the connection of polyhedra so far, and the connection manner includes point-sharing, edge-sharing, face-sharing, and interpenetrating [20,21,22]. Among these, the orientation relationship between polyhedra is arbitrary in the case of point-sharing or edge-sharing. On the other hand, the orientation relationship is uniquely determined in the case of face-sharing or interpenetrating, as mentioned above, because the numbers of sharing atoms are three or more. The constituent atoms tend to construct pseudo lattice planes that generate sharper diffraction spots in this situation, as seen in Figure 4. In terms of diffraction, therefore, the latter connections would be more significant and give a more precise meaning to the medium-range order structures in metallic glasses.
The extent to which similar diffraction patterns persist would be a clear way to measure the size of medium-range order. In Figure 3a, for example, patterns 8, 12, 14, and 18 are very close to pattern 15, which is at the center, while patterns 21–25, which are a little far from the center, are totally different from pattern 15. The size of the area giving similar diffraction patterns would be comparable to a full width at half the maximum of the main peak of the structure factor, which is usually measured by X-ray or neutron diffraction. In fact, the full width at half the maximum for the X-ray diffraction of Zr80Pt20 is roughly estimated to be 1.2 nm from the literature [23], which is consistent with the present analysis.
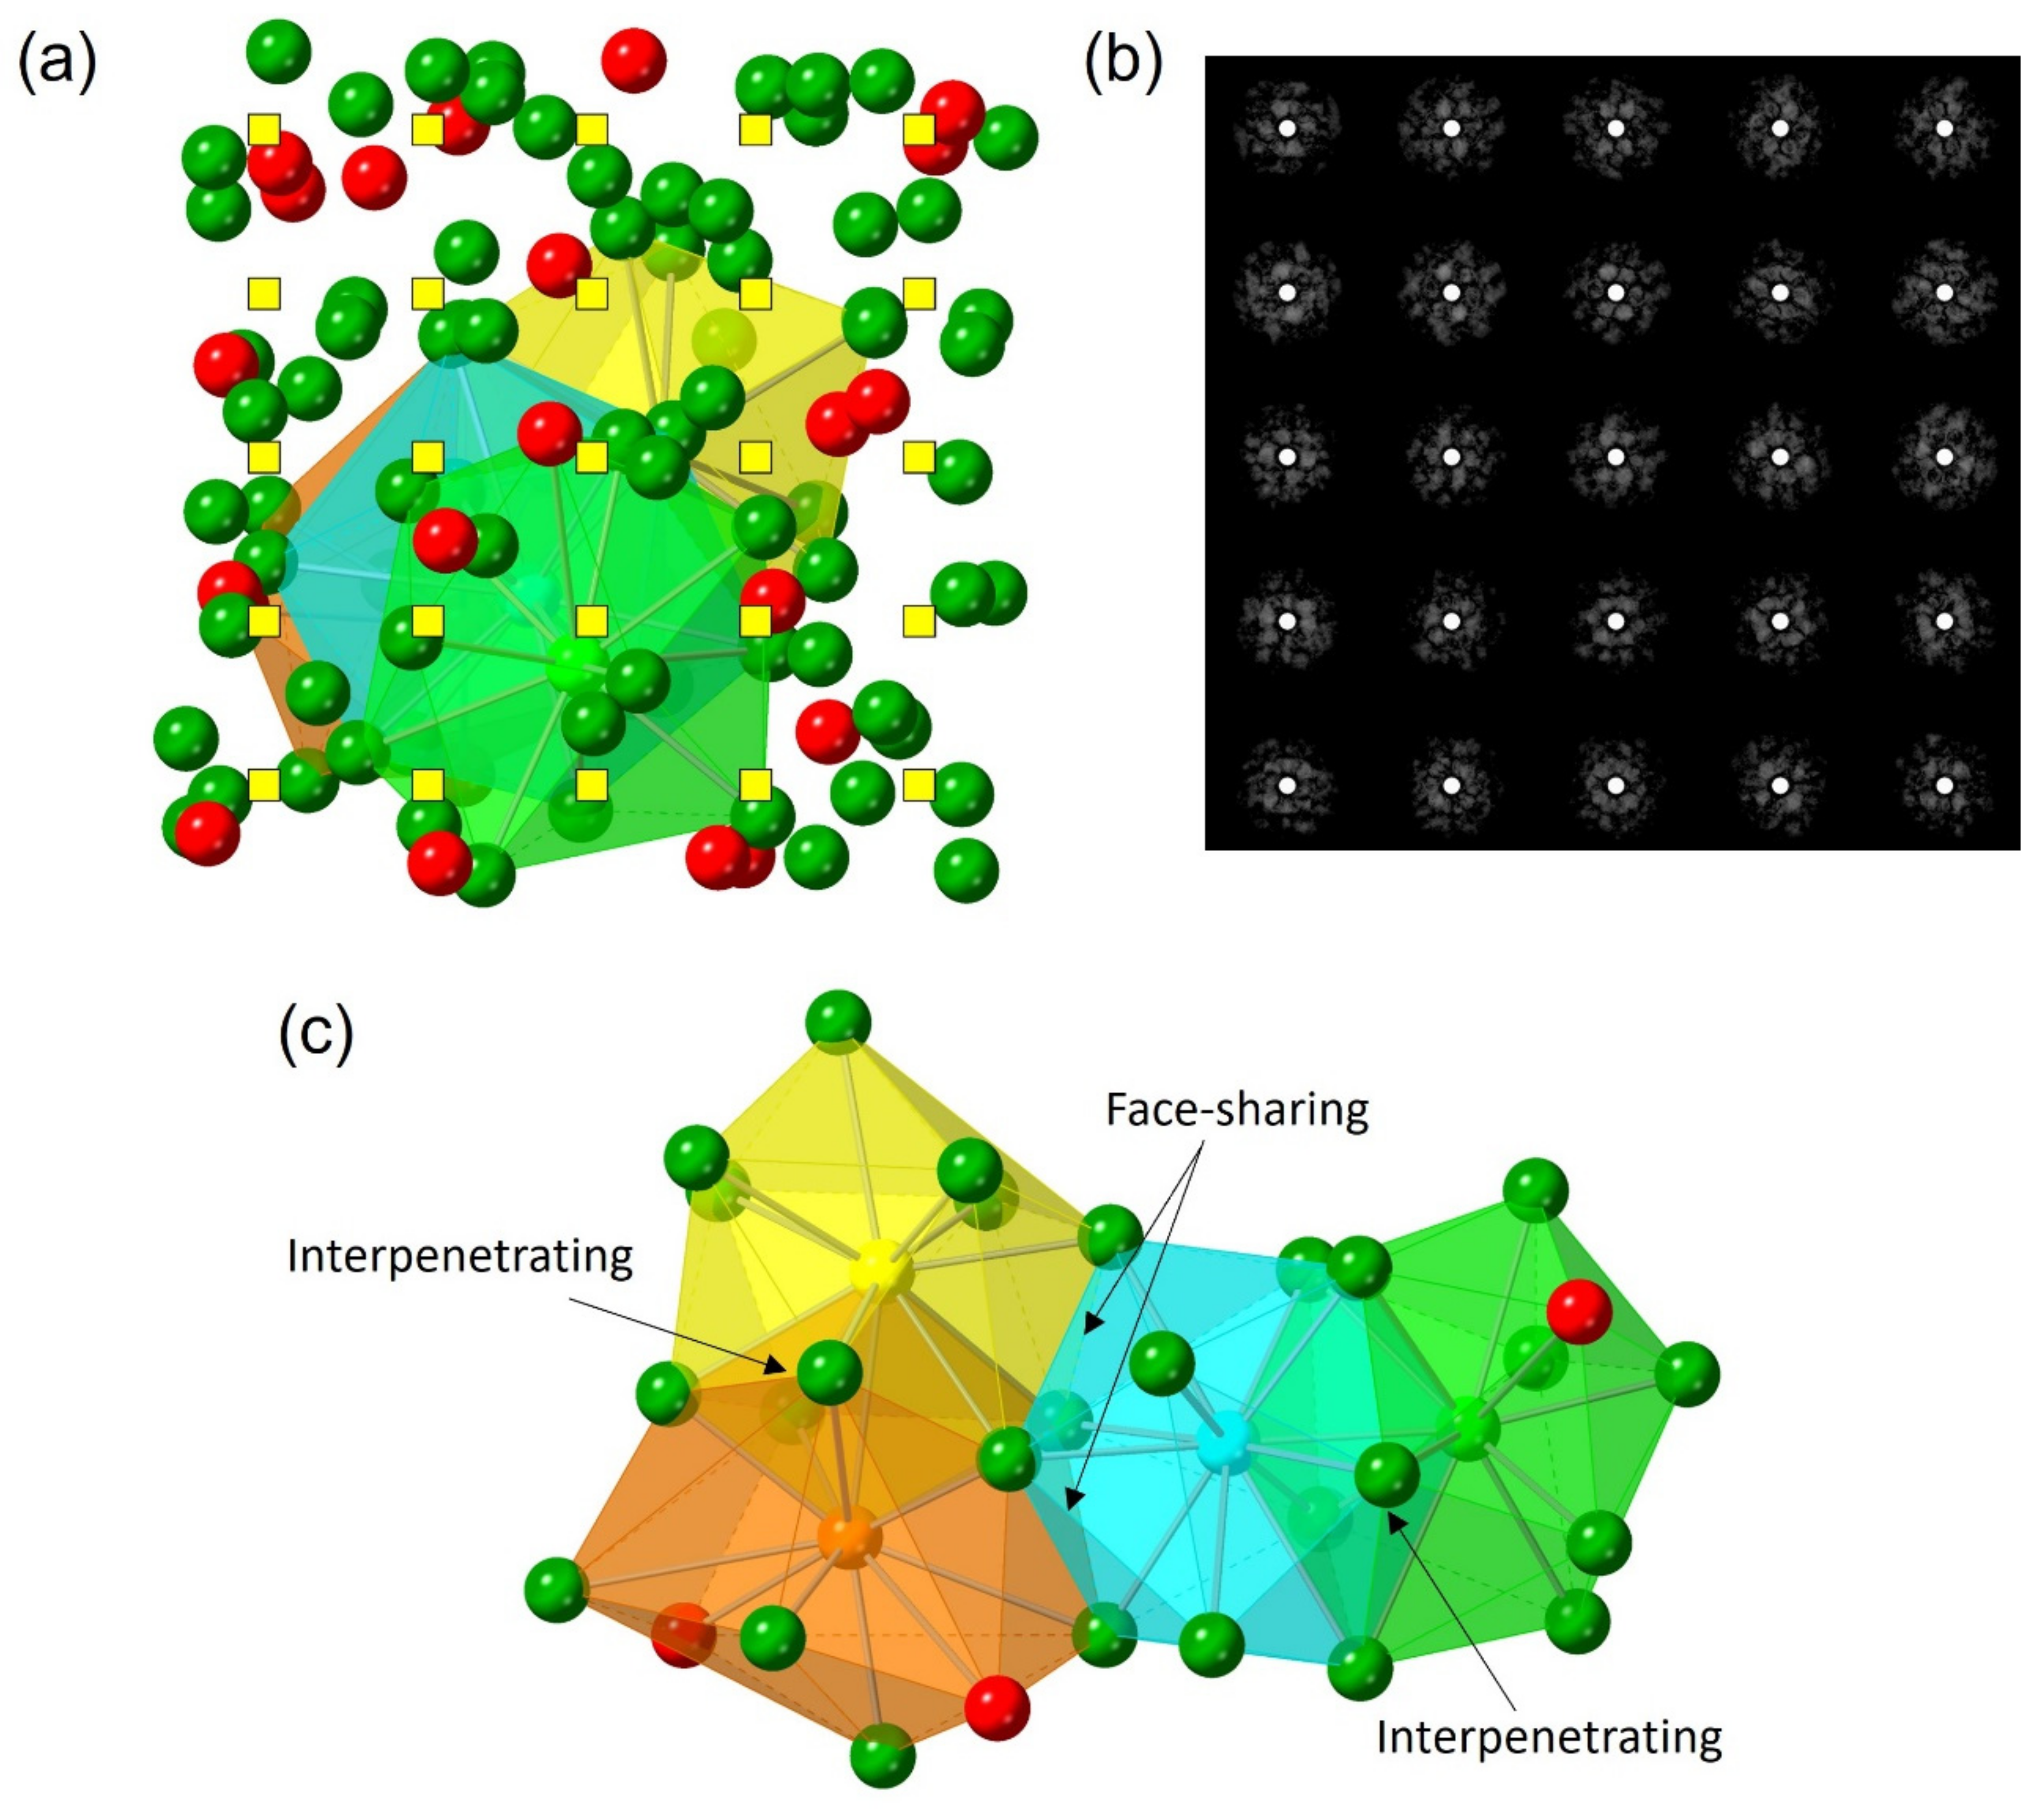
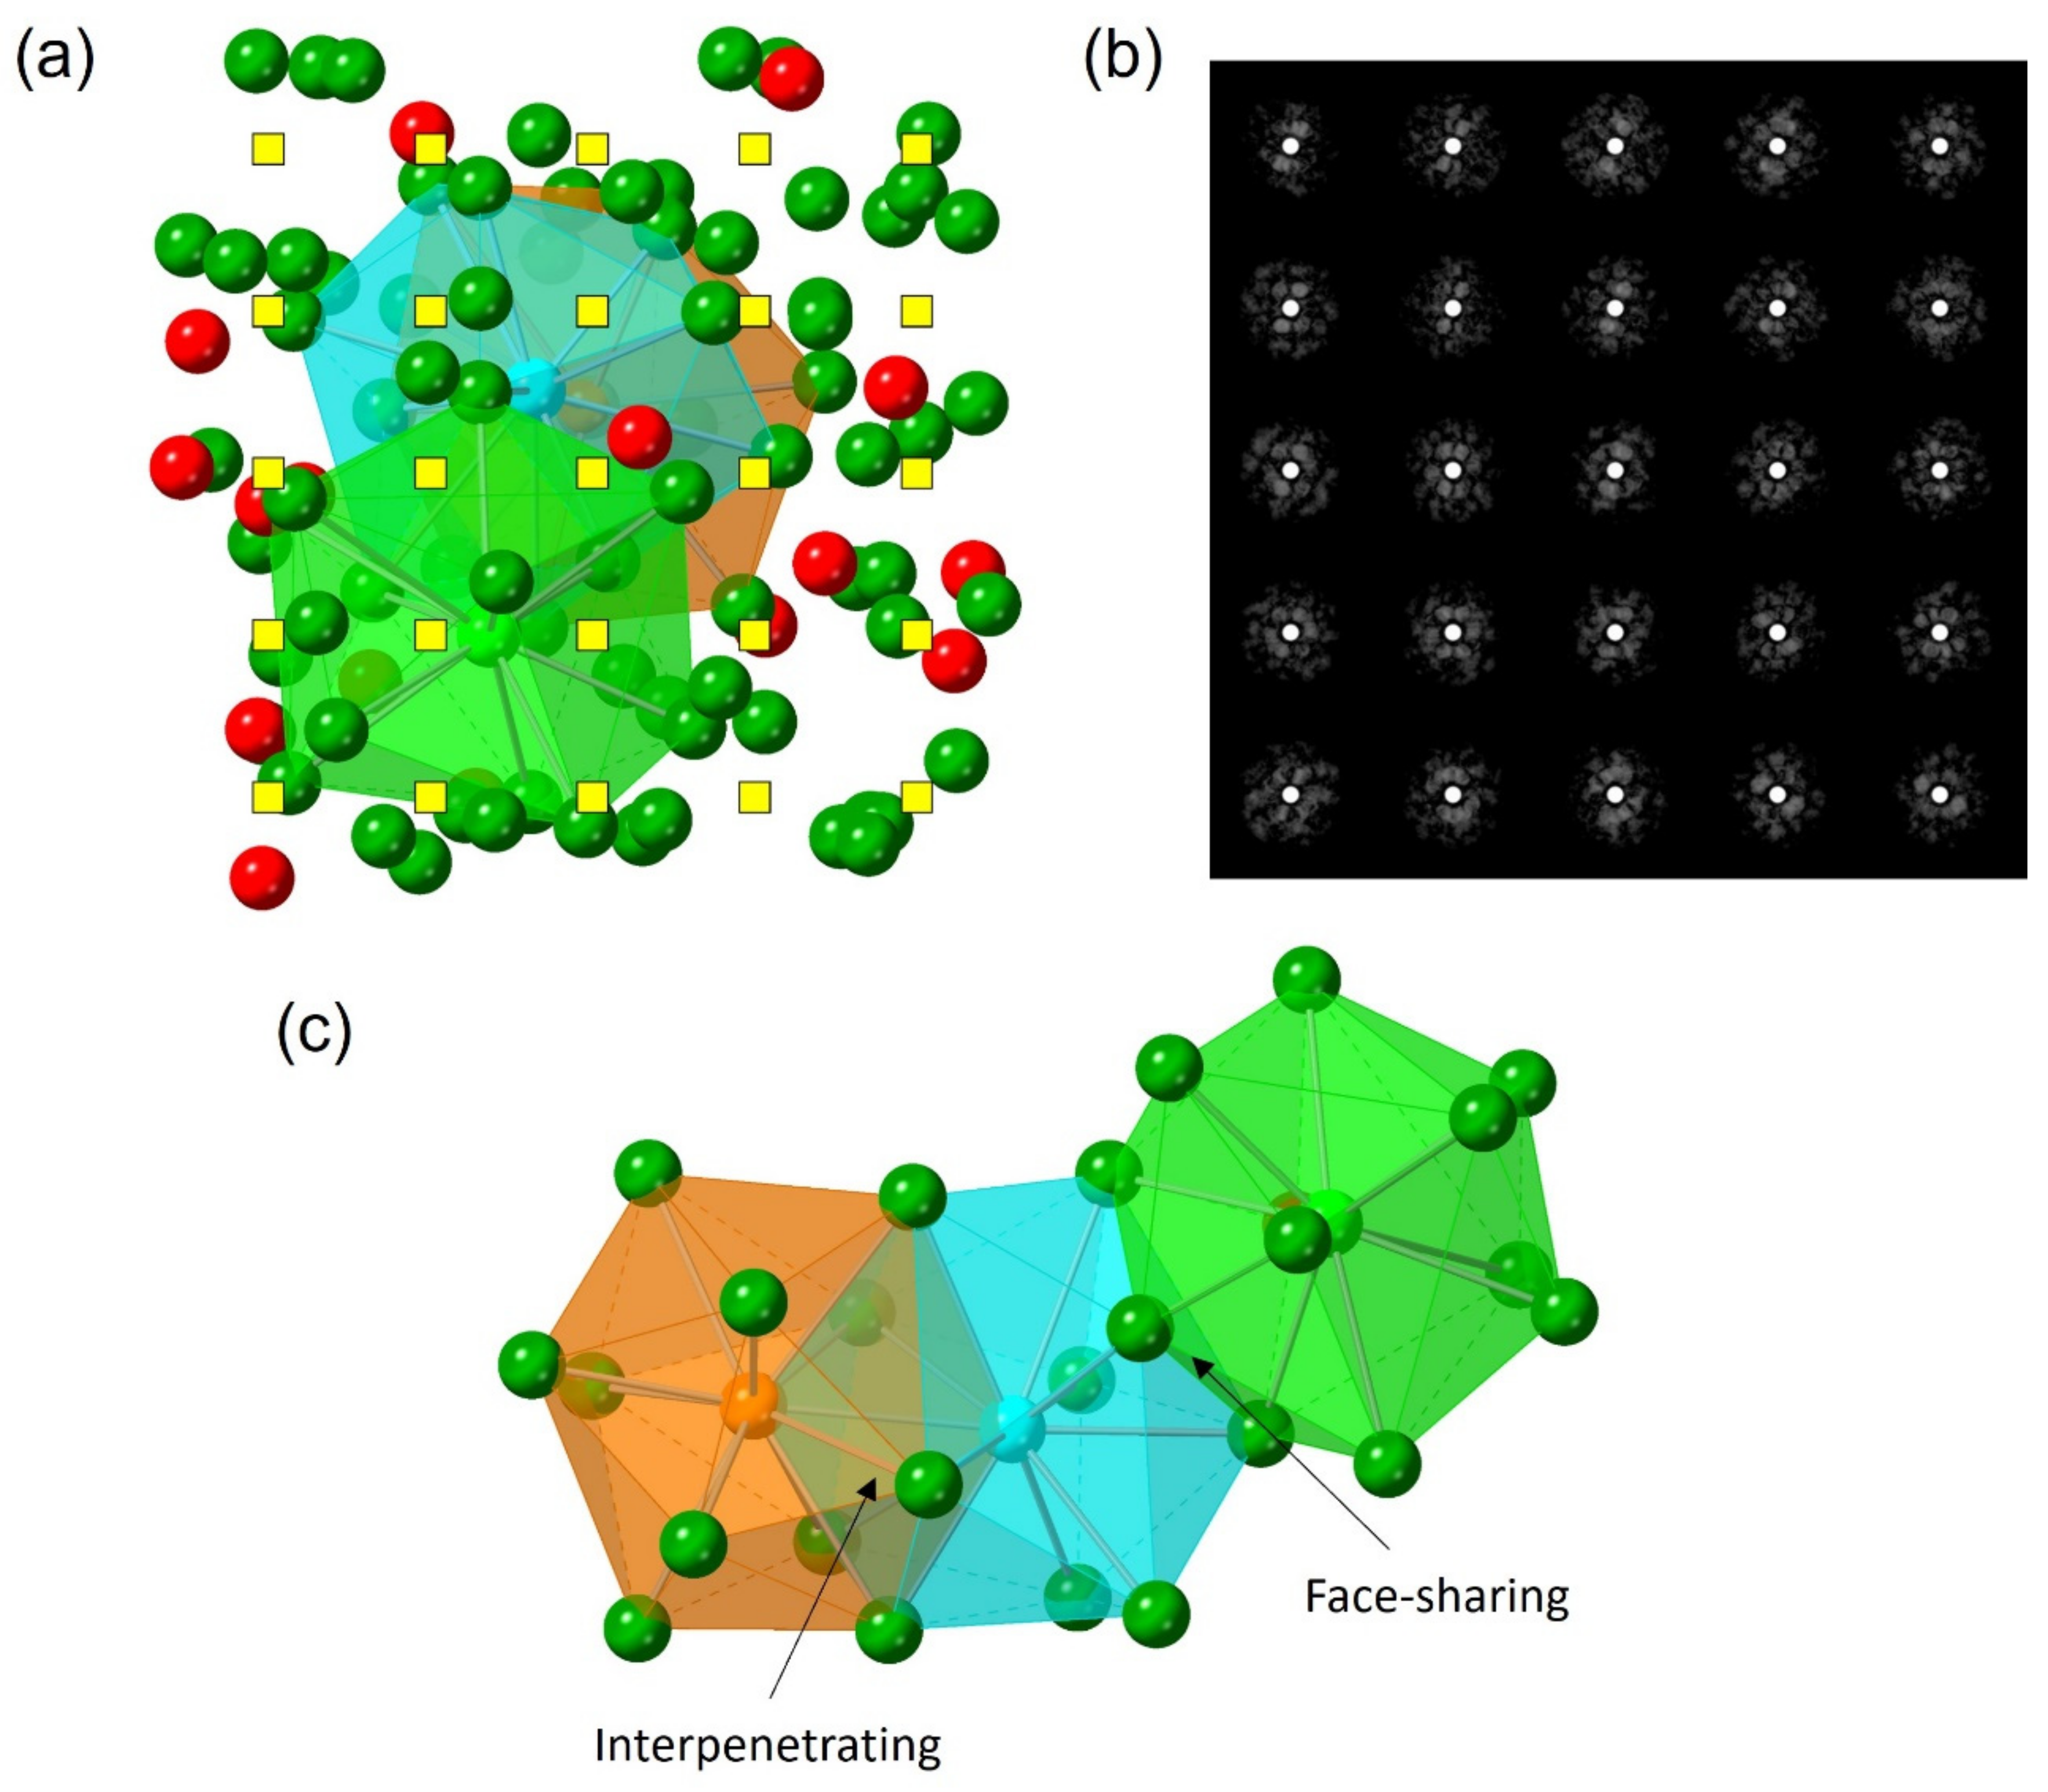
Another region of the same model is examined to confirm the validity of the present method, as shown in Figure 6. It is clearly seen that four polyhedra are connected by face-sharing or interpenetrating manner. These polyhedra consisting of 13 atoms have a Voronoi index of <0 0 12 0 0 0>, indicating icosahedral symmetry, except for the orange one. This implies that the present tool can easily detect the aggregates of polyhedra and show a clear relationship between the aggregates and the presence of diffraction spots. For comparison, moreover, a glass state formed with a faster cooling rate (3.0 × 10¹³ K s−1) is also checked as shown in Figure 7. Although a similar aggregate of polyhedra can be detected, it seems that the size is a bit smaller than that of the slower-cooled model. To clarify the difference quantitatively, however, a statistical study is necessary.
In our previous work [16], we emphasized that the distortion of coordination polyhedra (icosahedra) plays a significant role in generating sharp diffraction spots in the local diffraction patterns. The pseudo lattice planes are basically formed by the distortion of highly symmetric polyhedra (e.g., regular icosahedra). The present study reinforces this role and provides an additional fact that the surrounding polyhedra presumably enhance the diffraction sharpness/intensity by connecting in a face-sharing or interpenetrating manner. The extension of such aggregates of tightly-connected polyhedra should be related to a relatively sharp main peak of the structure factors for metallic glasses, compared to the liquid state, and might be essential for glass formation and stability.

4. Conclusions

This paper proposes the virtual angstrom-beam electron diffraction as an analysis method for structure models of amorphous materials. This method effectively detects medium-range order structures that form pseudo lattice planes, giving sharp diffraction spots by combining them with other methods such as Fourier transform and Voronoi polyhedral analysis. The extracted local structures are presumably related to the relatively sharper main peak of the structure factors, especially for metallic glasses, compared to the liquids. For future comparison, we intend to analyze not only glassy states but also liquid states [24] that are difficult to observe directly.

Funding

This work was partially supported by a JSPS Grant-in-Aid for Transformative Research Areas (A) “Hyper-Ordered Structures Science:” Grants No. 20H05881 and a JSPS Grant-in-Aid for Scientific Research (B) Grants No. 20H04241.

Data Availability Statement

Datasets acquired during the present research are available from the corresponding author upon reasonable request.

Conflicts of Interest

The author declares no conflict of interest.

References

  1. Elliott, S.R. Physics of Amorphous Materials, 2nd ed.; Longman: London, UK, 1990. [Google Scholar]
  2. Zallen, R. The Physics of Amorphous Solids; Wiley: New York, NY, USA, 1983. [Google Scholar]
  3. Ma, E. Tuning Order in Disorder. Nat. Mater. 2015, 14, 547–552. [Google Scholar] [CrossRef] [PubMed]
  4. Cheng, Y.Q.; Ma, E. Atomic-Level Structure and Structure-Property Relationship in Metallic Glasses. Prog. Mater. Sci. 2011, 56, 379–473. [Google Scholar] [CrossRef]
  5. Royall, C.P.; Williams, S.R. The Role of Local Structure in Dynamical Arrest. Phys. Rep. 2015, 560, 1–75. [Google Scholar] [CrossRef]
  6. Kohara, S.; Salmon, P.S. Recent Advances in Identifying the Structure of Liquid and Glassy Oxide and Chalcogenide Materials under Extreme Conditions: A Joint Approach Using Diffraction and Atomistic Simulation. Adv. Phys. X 2016, 1, 640–660. [Google Scholar] [CrossRef]
  7. Sheng, H.W.; Luo, W.K.; Alamgir, F.M.; Bai, J.M.; Ma, E. Atomic Packing and Short-to-Medium-Range Order in Metallic Glasses. Nature 2006, 439, 419–425. [Google Scholar] [CrossRef] [PubMed]
  8. Bernal, J.D. A Geometrical Approach to the Structure of Liquids. Nature 1959, 17, 141–147. [Google Scholar] [CrossRef]
  9. Evans, D.L.; King, S.V. Random Network Model of Vitreous Silica. Nature 1966, 212, 1353–1354. [Google Scholar] [CrossRef]
  10. Miracle, D.B. A Structural Model for Metallic Glasses. Nat. Mater. 2004, 3, 697–702. [Google Scholar] [CrossRef] [PubMed]
  11. Miracle, D.B. The Efficient Cluster Packing Model—An Atomic Structural Model for Metallic Glasses. Acta Mater. 2006, 54, 4317–4336. [Google Scholar] [CrossRef]
  12. Borodin, V.A. Local Atomic Arrangements in Polytetrahedral Materials. Philos. Mag. A Phys. Condens. Matter Struct. Defects Mech. Prop. 1999, 79, 1887–1907. [Google Scholar] [CrossRef]
  13. Hirata, A.; Guan, P.; Fujita, T.; Hirotsu, Y.; Inoue, A.; Yavari, A.R.; Sakurai, T.; Chen, M. Direct Observation of Local Atomic Order in a Metallic Glass. Nat. Mater. 2011, 10, 28–33. [Google Scholar] [CrossRef] [PubMed]
  14. Hirata, A.; Kohara, S.; Asada, T.; Arao, M.; Yogi, C.; Imai, H.; Tan, Y.; Fujita, T.; Chen, M. Atomic-Scale Disproportionation in Amorphous Silicon Monoxide. Nat. Commun. 2016, 7, 11591. [Google Scholar] [CrossRef] [PubMed]
  15. Hirata, A.; Ichitsubo, T.; Guan, P.F.; Fujita, T.; Chen, M.W. Distortion of Local Atomic Structures in Amorphous Ge-Sb-Te Phase Change Materials. Phys. Rev. Lett. 2018, 120, 205502. [Google Scholar] [CrossRef] [PubMed]
  16. Hirata, A.; Kang, L.; Fujita, T.; Klumov, B.; Matsue, K.; Kotani, M.; Yavari, A.R.; Chen, M. Geometric frustration of icosahedron in metallic glasses. Science 2013, 341, 376–379. [Google Scholar] [CrossRef] [PubMed]
  17. EAM Potentials. Available online: https://sites.google.com/site/eampotentials/ (accessed on 1 September 2022).
  18. Thompson, A.P.; Aktulga, H.M.; Berger, R.; Bolintineanu, D.S.; Brown, W.M.; Crozier, P.S.; in ’t Veld, P.J.; Kohlmeyer, A.; Moore, S.G.; Nguyen, T.D.; et al. LAMMPS—A Flexible Simulation Tool for Particle-Based Materials Modeling at the Atomic, Meso, and Continuum Scales. Comput. Phys. Commun. 2022, 271, 108171. [Google Scholar] [CrossRef]
  19. Kirkland, E.J. Advanced Computing in Electron Microscopy; Plenum: New York, NY, USA, 1998. [Google Scholar]
  20. Hui, X.; Fang, H.Z.; Chen, G.L.; Shang, S.L.; Wang, Y.; Qin, J.Y.; Liu, Z.K. Atomic Structure of Zr41.2Ti13.8Cu12.5Ni10Be22.5 Bulk Metallic Glass Alloy. Acta Mater. 2009, 57, 376–391. [Google Scholar] [CrossRef]
  21. Lee, M.; Lee, C.M.; Lee, K.R.; Ma, E.; Lee, J.C. Networked Interpenetrating Connections of Icosahedra: Effects on Shear Transformations in Metallic Glass. Acta Mater. 2011, 59, 159–170. [Google Scholar] [CrossRef]
  22. Soklaski, R.; Nussinov, Z.; Markow, Z.; Kelton, K.F.; Yang, L. Connectivity of Icosahedral Network and a Dramatically Growing Static Length Scale in Cu-Zr Binary Metallic Glasses. Phys. Rev. B 2013, 87, 184203. [Google Scholar] [CrossRef]
  23. Saida, J.; Itoh, K.; Sato, S.; Imafuku, M.; Sanada, T.; Inoue, A. Evaluation of the Local Environment for Nanoscale Quasicrystal Formation in Zr80Pt20 Glassy Alloy Using Voronoi Analysis. J. Phys. Condens. Matter 2009, 21, 375104. [Google Scholar] [CrossRef] [PubMed]
  24. Mauro, N.A.; Wessels, V.; Bendert, J.C.; Klein, S.; Gangopadhyay, A.K.; Kramer, M.J.; Hao, S.G.; Rustan, G.E.; Kreyssig, A.; Goldman, A.I.; et al. Short- and Medium-Range Order in Zr80Pt20 Liquids. Phys. Rev. B 2011, 83, 184109. [Google Scholar] [CrossRef] [Green Version]
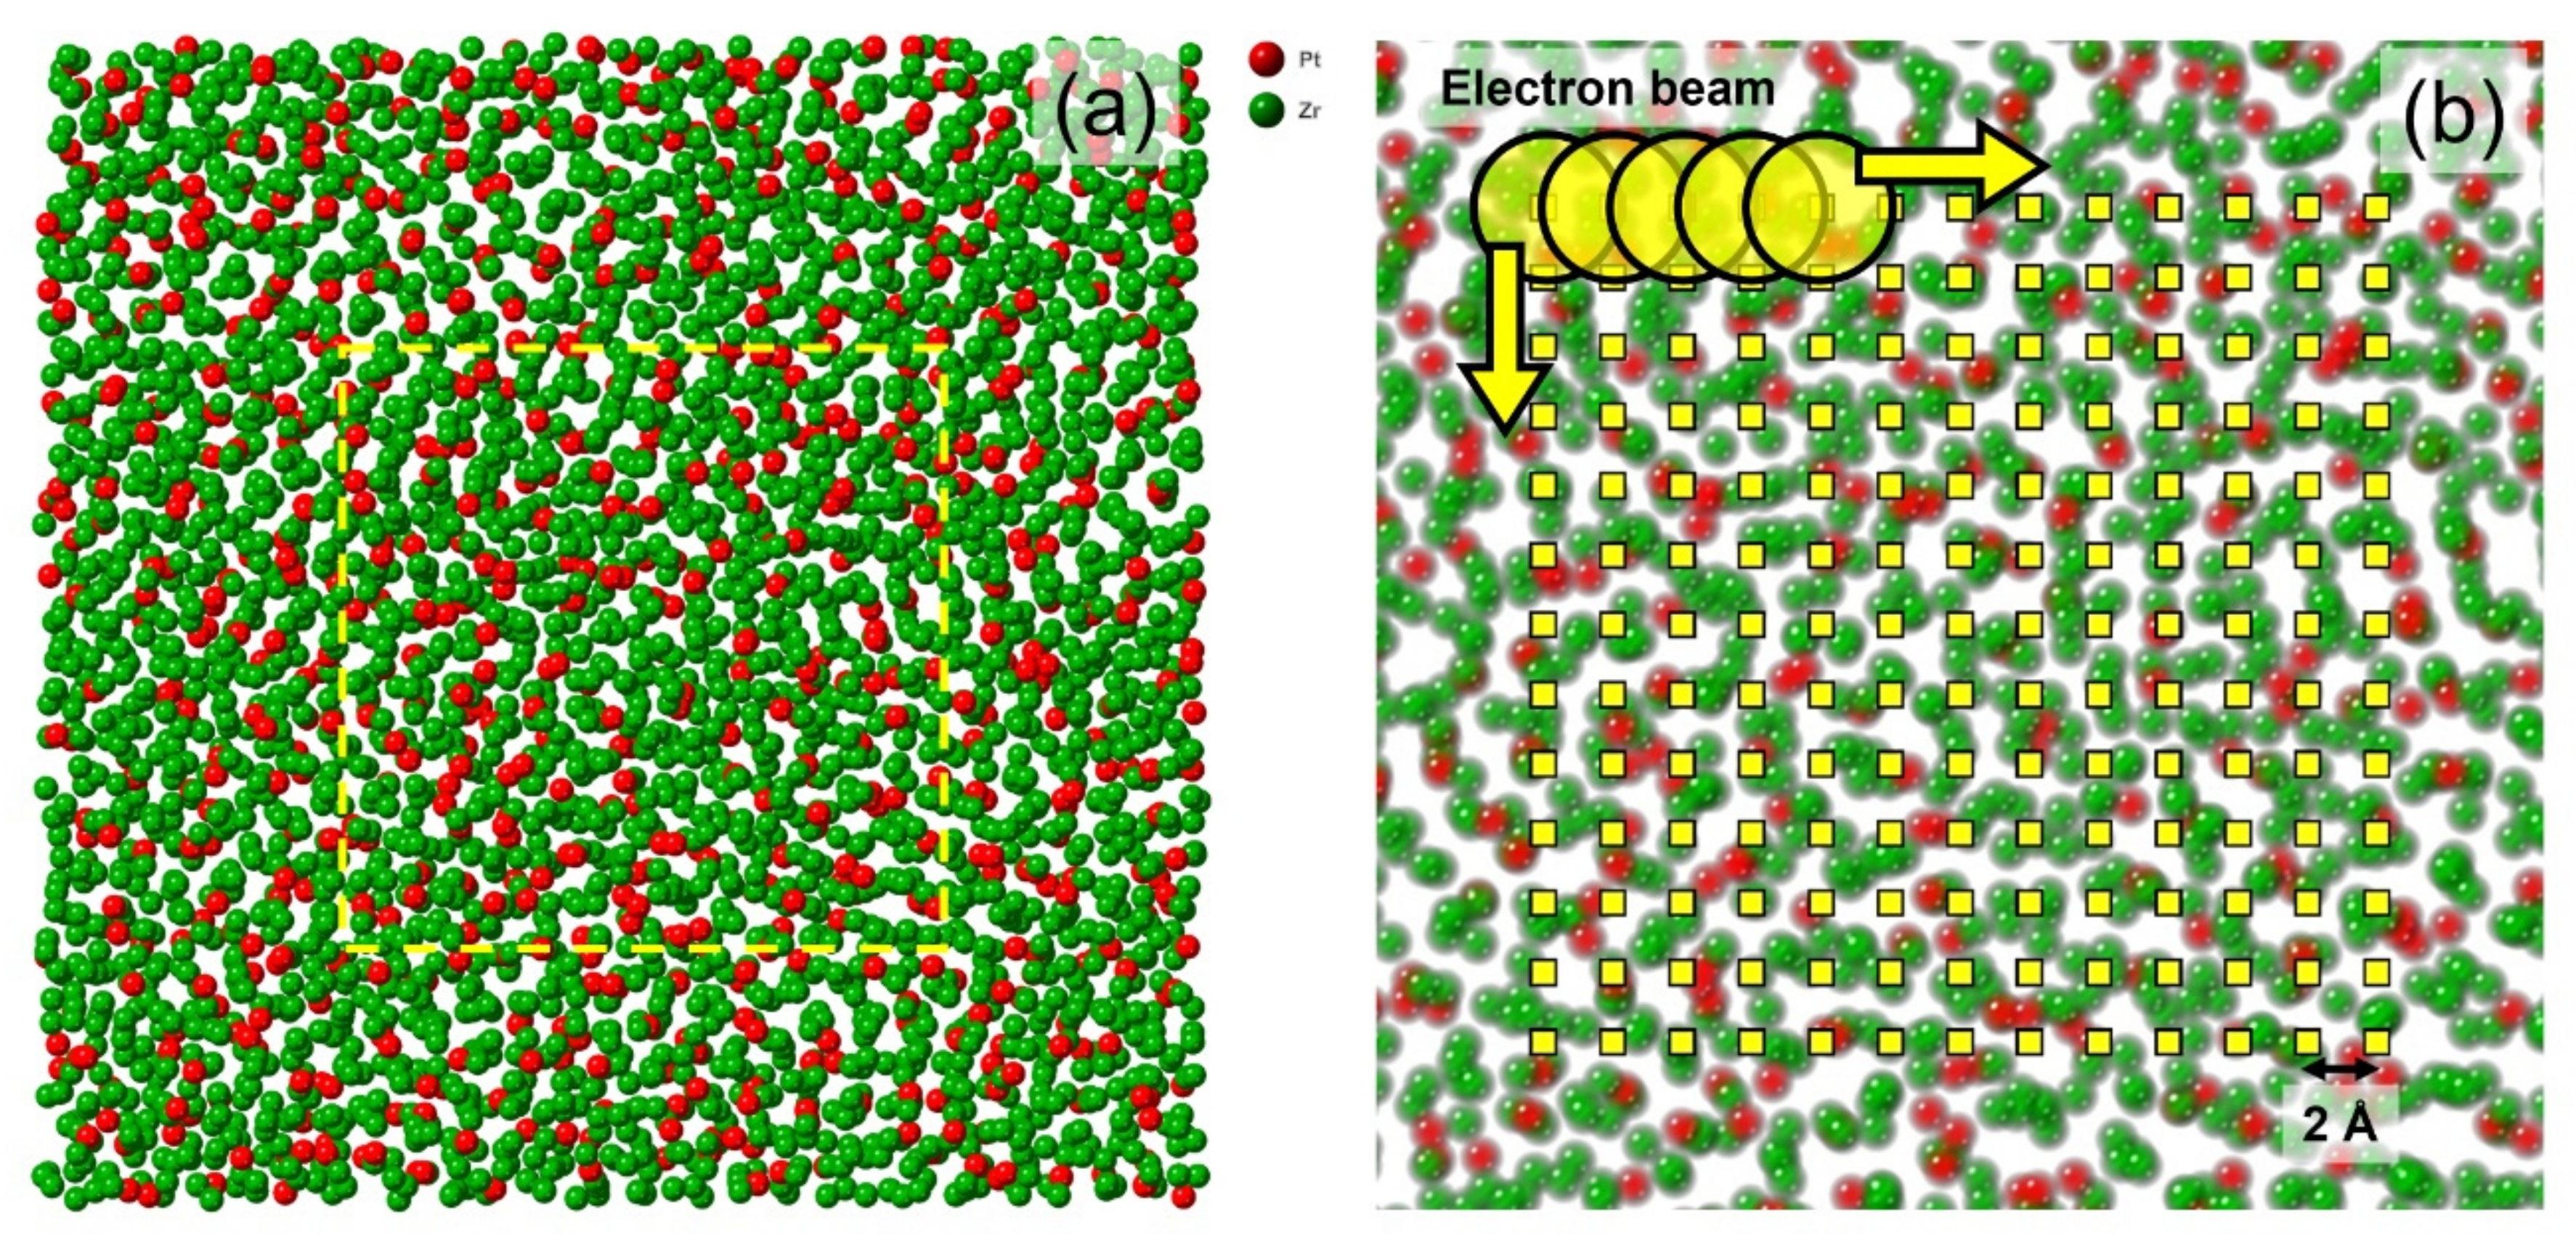
Figure 1. (a) Projection of an atomic configuration of the Zr80Pt20 metallic glass sliced into a 2 nm thickness. (b) Positions where the electron beam is virtually irradiated on the atomic configuration surrounded by the dotted lines in (a). The interval between spots is 0.2 nm.
Qubs 06 00028 g001
Figure 2. Calculated electron diffraction patterns from the positions shown in Figure 1b.
Qubs 06 00028 g002
Figure 3. (a) Calculated electron diffraction patterns surrounded by the dotted lines in Figure 2. (b) Atomic configuration, including the positions (position 1–position 25) where electron diffraction patterns are calculated for each. Coordination polyhedra are also depicted.
Qubs 06 00028 g003
Figure 4. Inverse fast Fourier transform images obtained by paired spots in the fast Fourier transform patterns shown in the insets. The fast Fourier transform patterns are calculated from the black and white image of the atomic configuration in Figure 3b. The spots used in (a,b) are different from each other.
Qubs 06 00028 g004
Figure 5. The aggregate of coordination polyhedra (medium range order) found in Figure 3b. The difference between (a) and (b) is the projection direction.
Qubs 06 00028 g005
Figure 6. Analysis of another region of the same model. (a) Positions where the electron beam is virtually irradiated, (b) calculated electron diffraction patterns from the positions, and (c) aggregate of coordination polyhedra.
Qubs 06 00028 g006
Figure 7. Analysis of the faster-cooled model (3.0 × 10¹³ K s−1). (a) Positions where the electron beam is virtually irradiated, (b) calculated electron diffraction patterns from the positions, and (c) aggregate of coordination polyhedra.
Qubs 06 00028 g007
Publisher’s Note: MDPI stays neutral with regard to jurisdictional claims in published maps and institutional affiliations.