3.1. Diffraction Profile Change under Tensile Loading
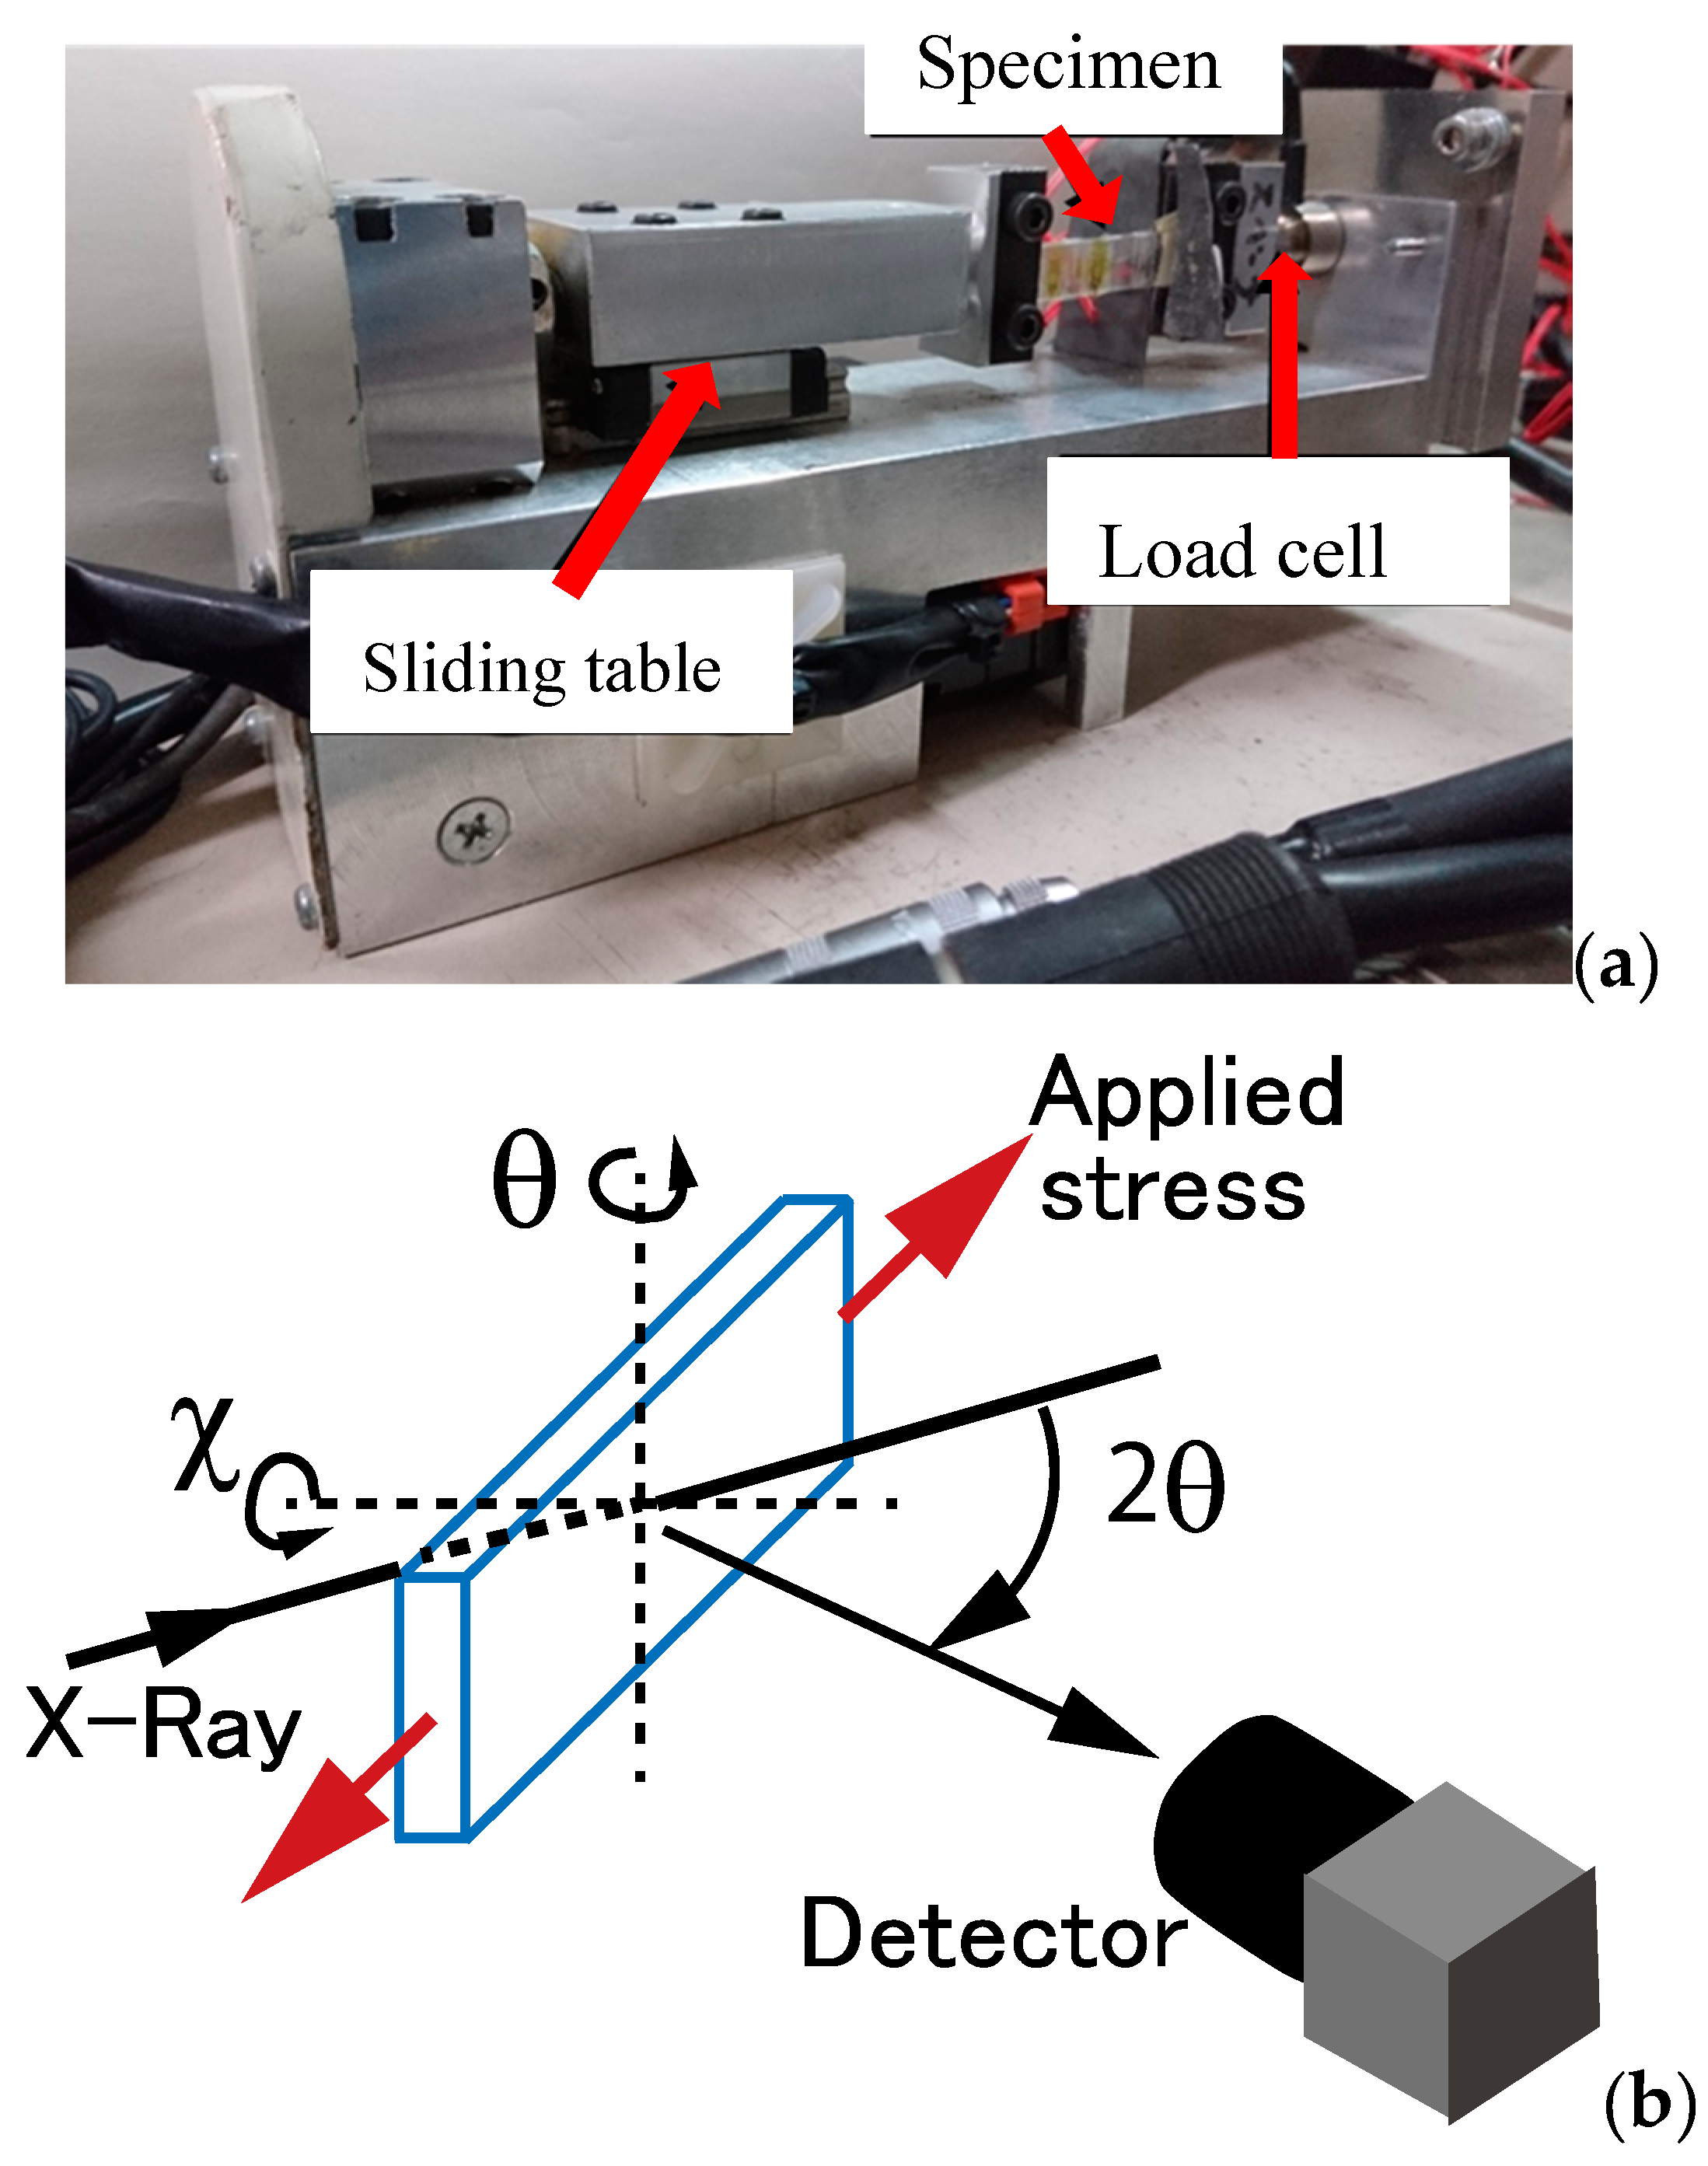
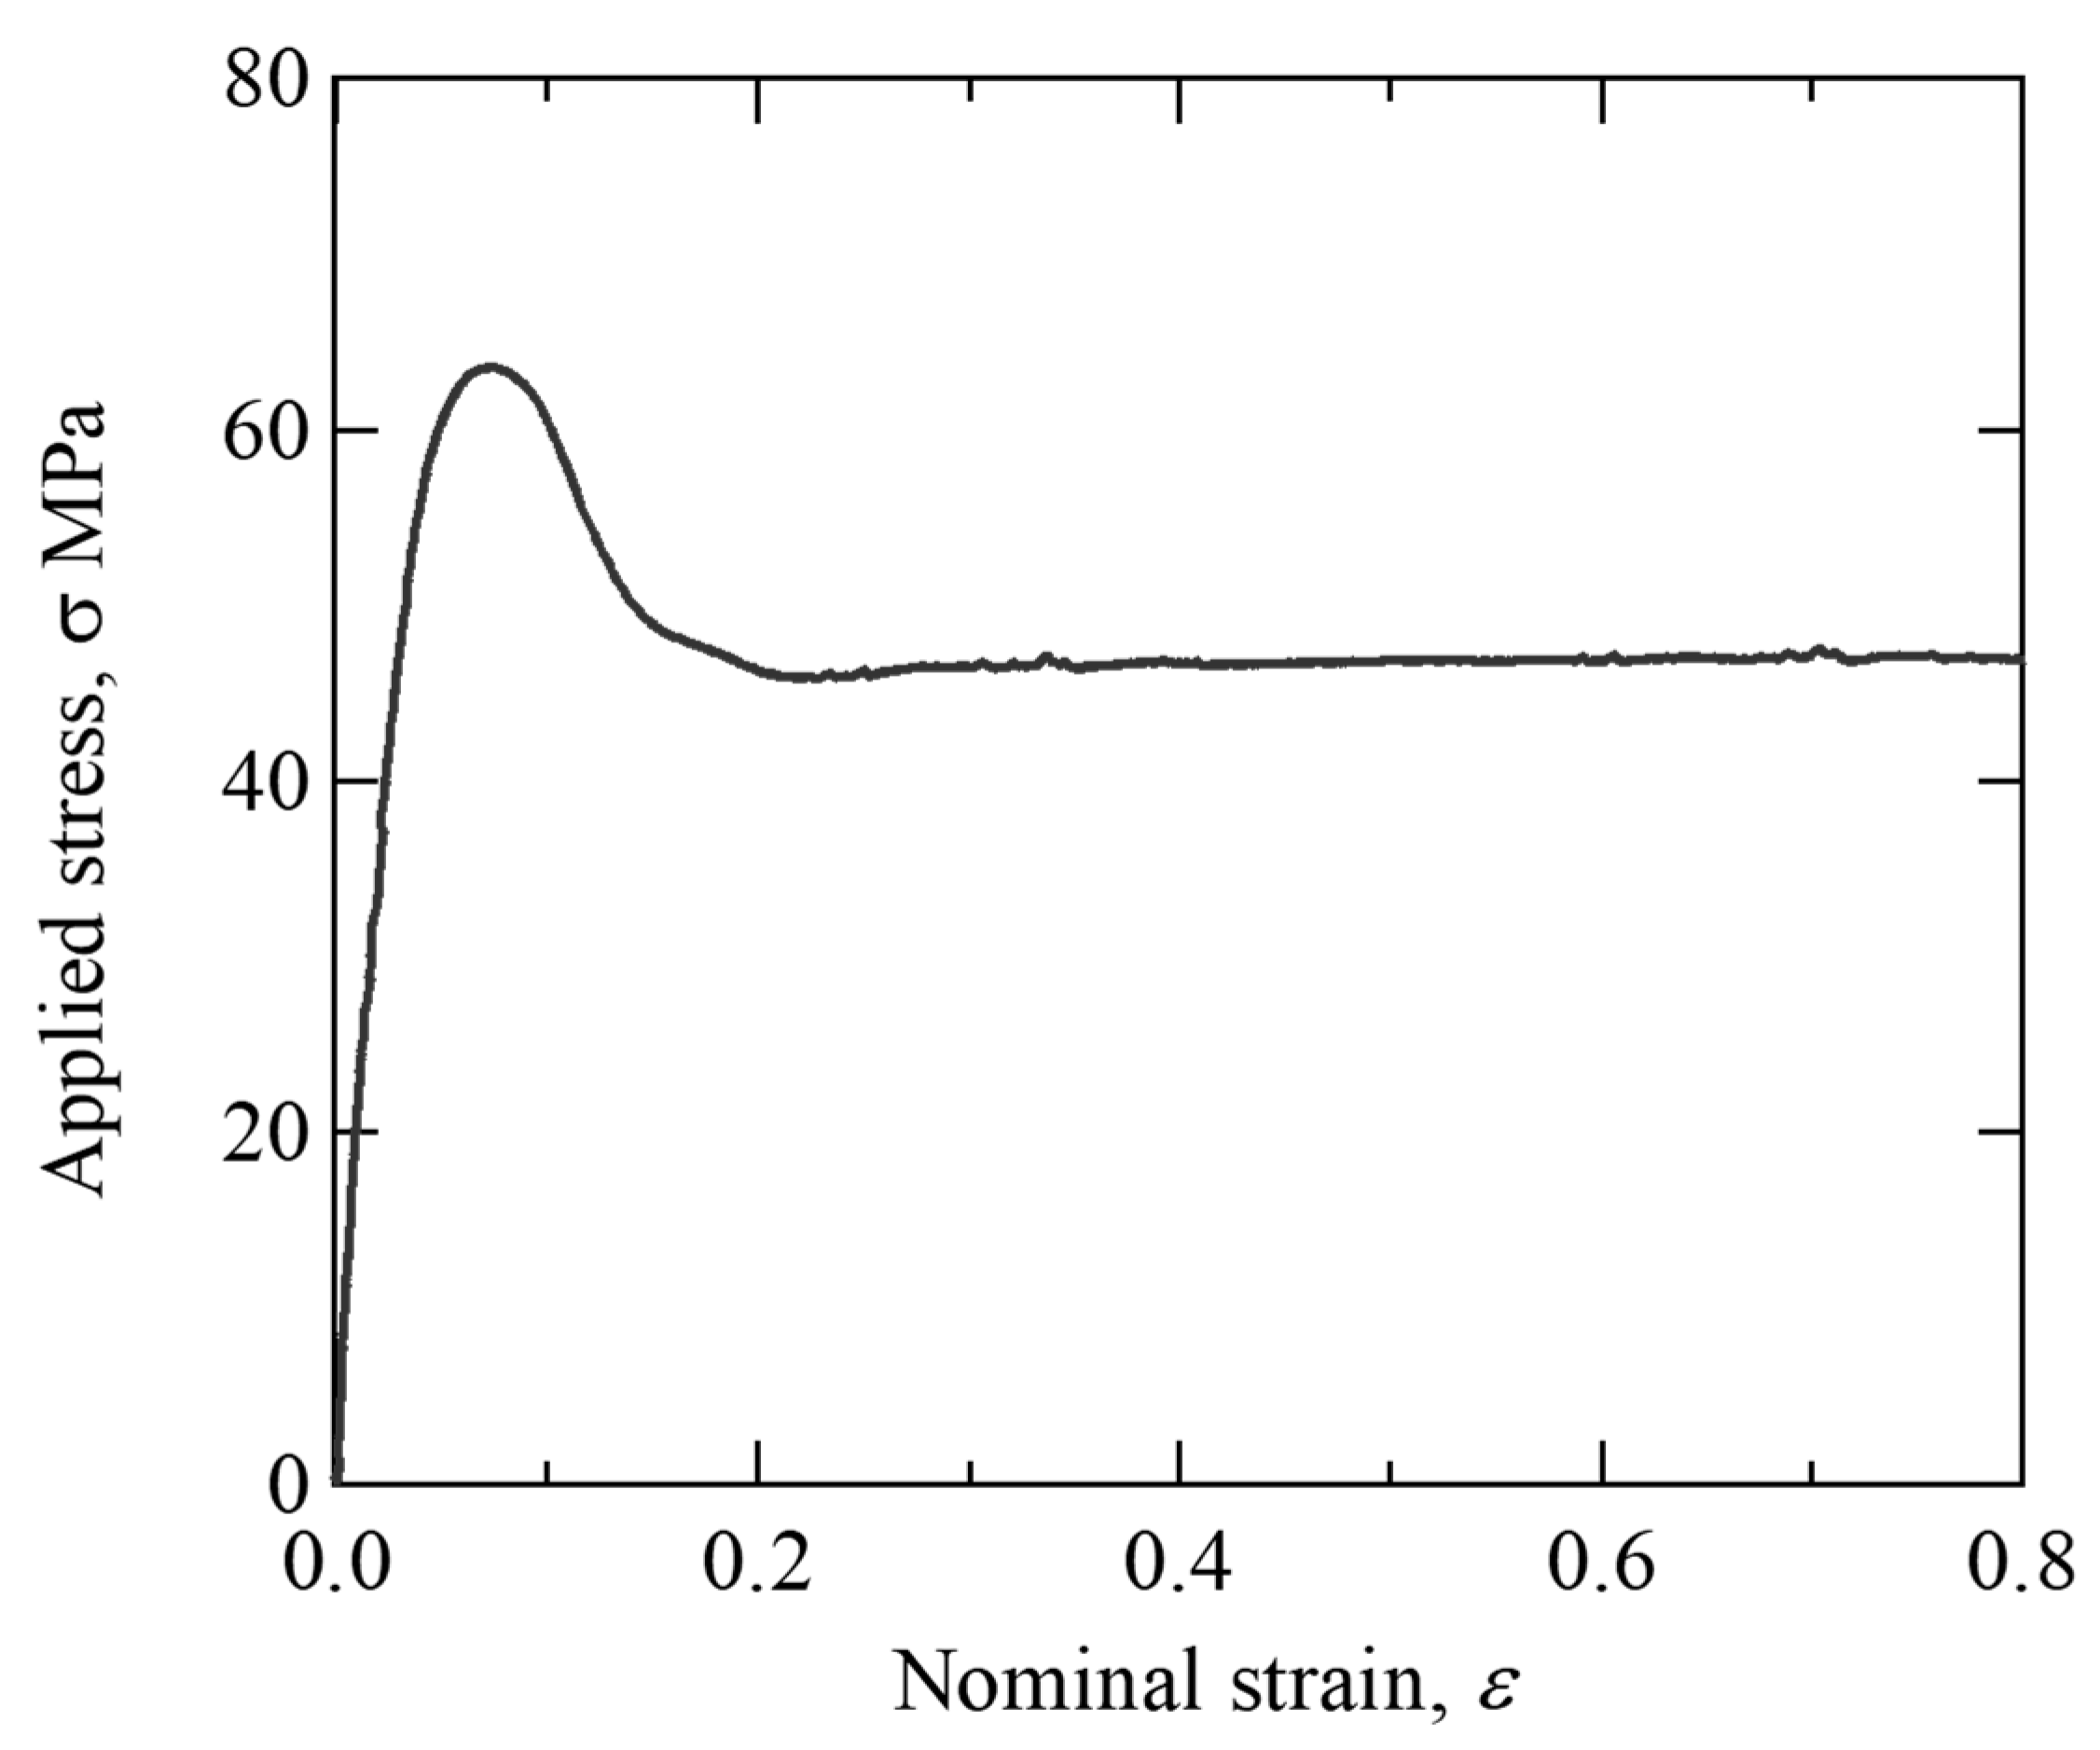
To determine the applied stress for X-ray elastic constant measurement in the elastic region, a tensile test of polycarbonate was performed. The gauge region of the tensile specimen has a length of 7 mm, a width of 2 mm, and a thickness of 2 mm.
Figure 3 shows the relation between the applied stress and the nominal strain. In the elastic region, the relation between stress and strain is almost linear. Macroscopically, the nonlinearity becomes remarkable for the stress above about 50 MPa. When the nominal strain is 0.075, the stress reaches the maximum value of 64 MPa. After that, a necking phenomenon occurs in the tensile specimen, and the stress decreases as the nominal strain increases. When the nominal strain is larger than 0.2, the stress increases slightly. Strictly speaking, it is difficult to define the pure elastic region because polymer materials exhibit visco-elasto-plastic behavior. In this study, the stress was set so that the maximum stress does not exceed 35 MPa. The mechanical Young’s modulus obtained in the elastic region is 2279 MPa, and the mechanical Poisson’s ratio is 0.37.
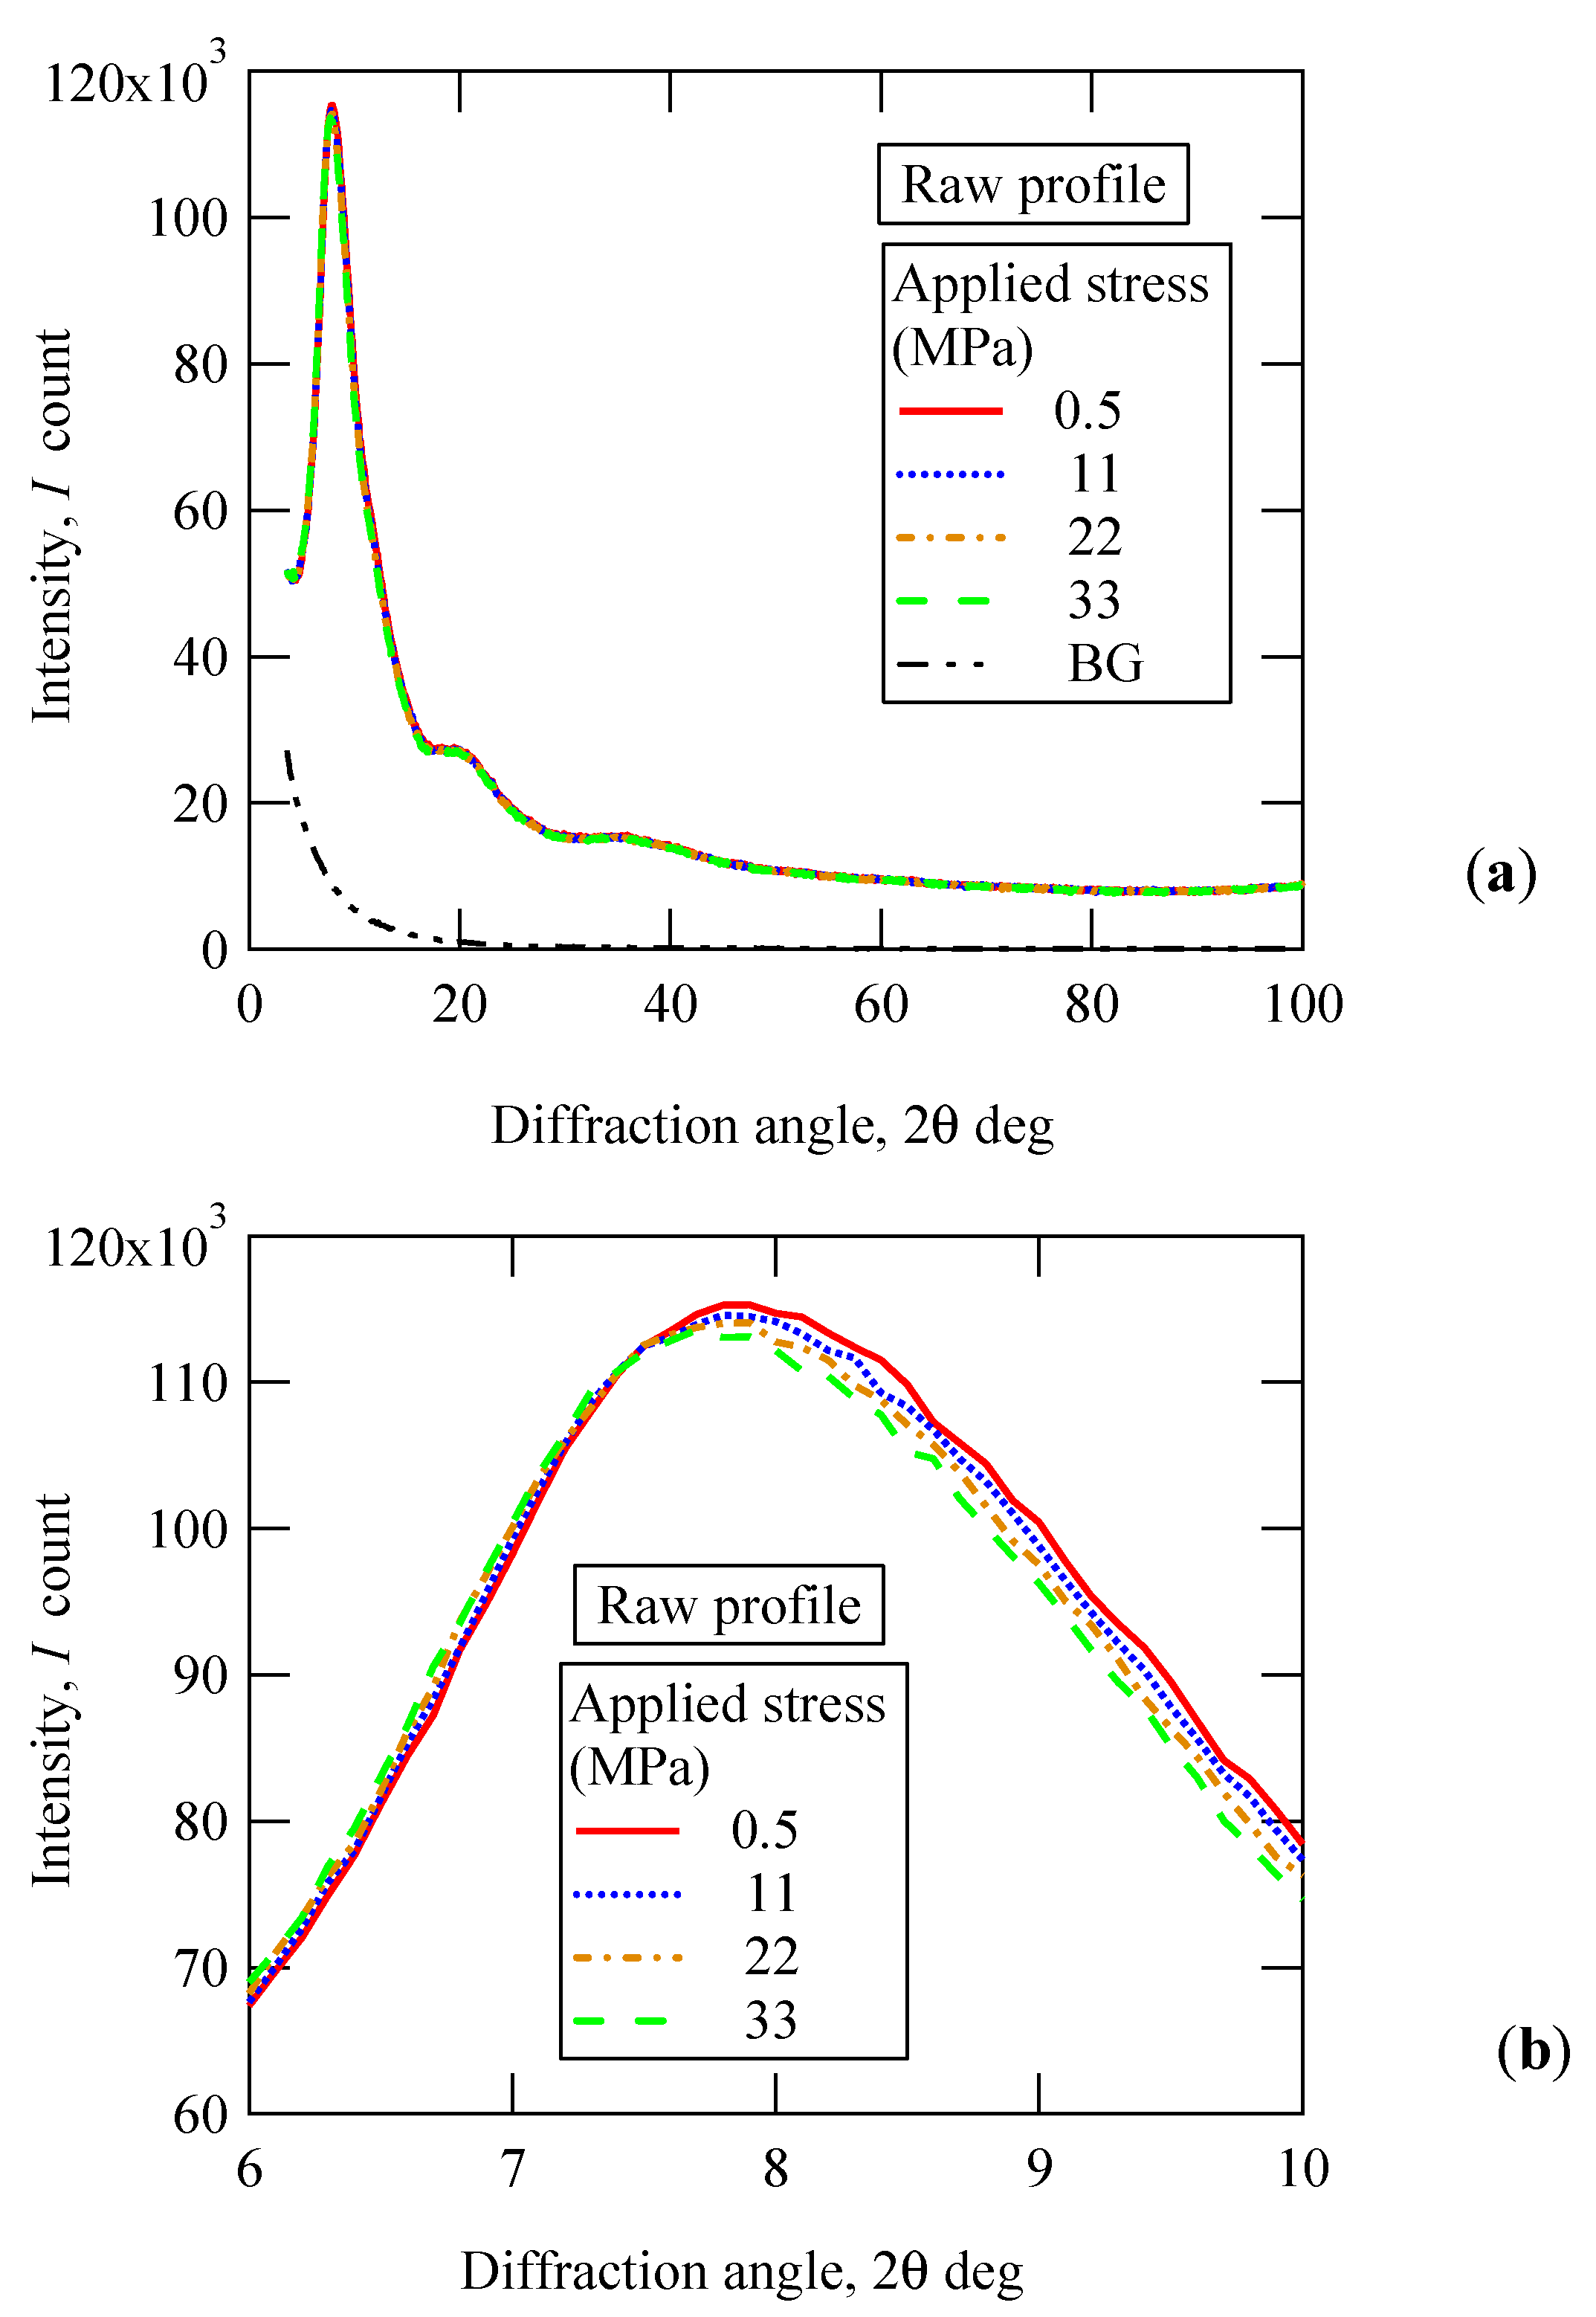
The diffraction profiles up to 100 deg in 2θ are shown in
Figure 4a. The applied stresses are from 0.5 to 33 MPa. Three halo peaks specific to amorphous materials were found at 8 deg, 20 deg, and 35 deg. The first halo has the highest diffraction intensity, and its shape is asymmetric with respect to the maximum peak position. The diffraction intensity decreases gently on the high angle side. No sharp peak derived from crystalline is confirmed in the range up to 100 deg. The black dashed line in the figure shows the air-scattering profile detected by the X-ray equipment in the absence of the sample. This data was used as background data for PDF analysis.
Figure 4b is an enlarged view of the diffraction angle range from 6 deg to 10 deg in
Figure 4a. The peak shape is asymmetric, and the absolute value of the gradient on the high angle side is smaller than that on the low angle side. The diffraction profile shifts to the lower angle side as the applied stress increases. This behavior is similar to the results reported by other researchers [
13,
14,
22]. Focusing on the relationship between the profile shift amount and the diffraction angle, there is an asymmetry not only in the profile shape but also in the amount of profile shift. The amount of profile shift on the high angle side is larger than that on the low angle side.
3.2. PDF Analysis
PDF analysis was carried out against the raw profile data shown in
Figure 4 using PDFgetX2 [
21].
Figure 5a shows the relationship between the structure function,
S(
Q), and the magnitude of the scattering vector,
Q. As shown in
Figure 4, three peaks appear for the structure function. The peak position of
S(
Q) corresponds to the peak diffraction angle of the raw profile data. As in the case of the raw profile data, the intensity of the first peak at
Q = 1.2 Å
−1 is the highest in the case of the structure function as well.
When focusing on the first peak with the highest intensity, the peak intensity is not constant with respect to the applied stress. The intensity of the 0.5 MPa is the highest. Therefore, the structure function is normalized by the maximum peak value in order to clarify the effect of the applied stress.
Figure 5b shows the vicinity of the first peak of the normalized structure function profile. For example, for the applied stress of 0.5 MPa,
S(
Q) was normalized by dividing the maximum value S
max = 2.535. Even if it is converted into a structure function by various corrections, the asymmetry of the profile shape cannot be eliminated. Similar to
Figure 4b, the absolute value of the slope on the high
Q value side is smaller than that on the low
Q value side. The movement of the profile data on the low
Q value side is clearer than in the case of the raw profile data shown in
Figure 4b, and the shift of the entire profile is confirmed.
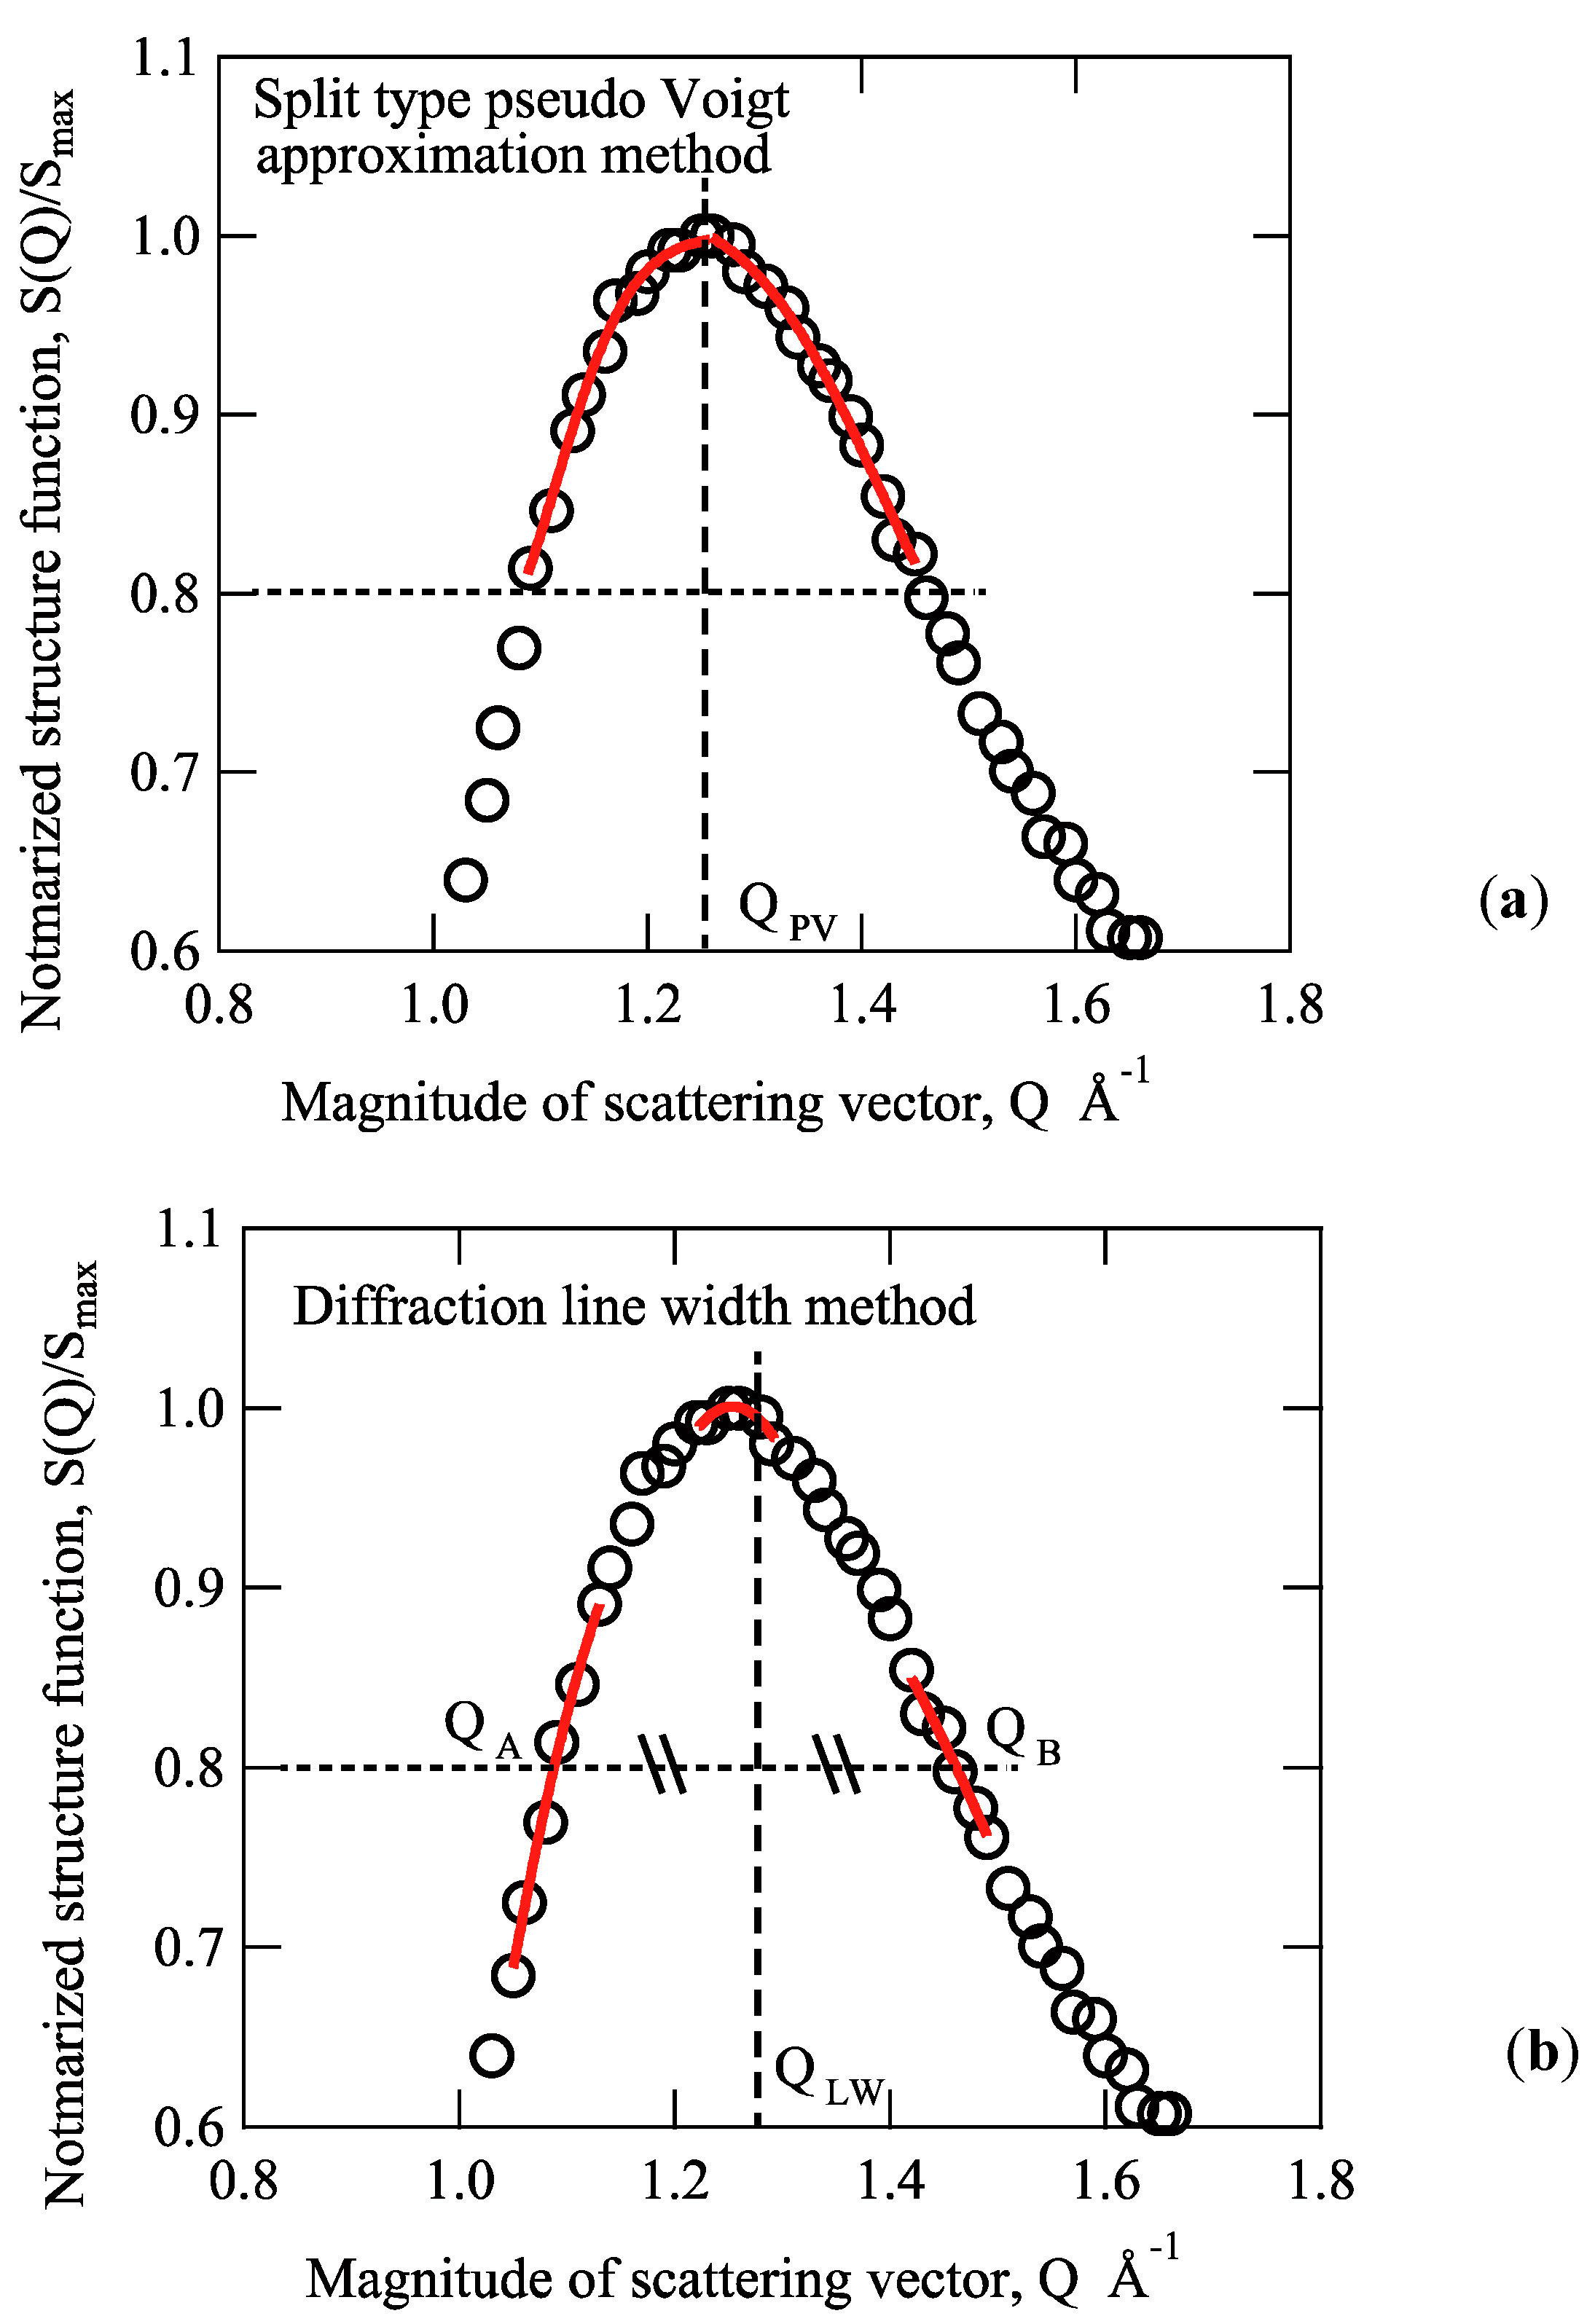
Using the normalized structure function shown in
Figure 5b, the peak position was determined by the methods described in
Section 2.3.
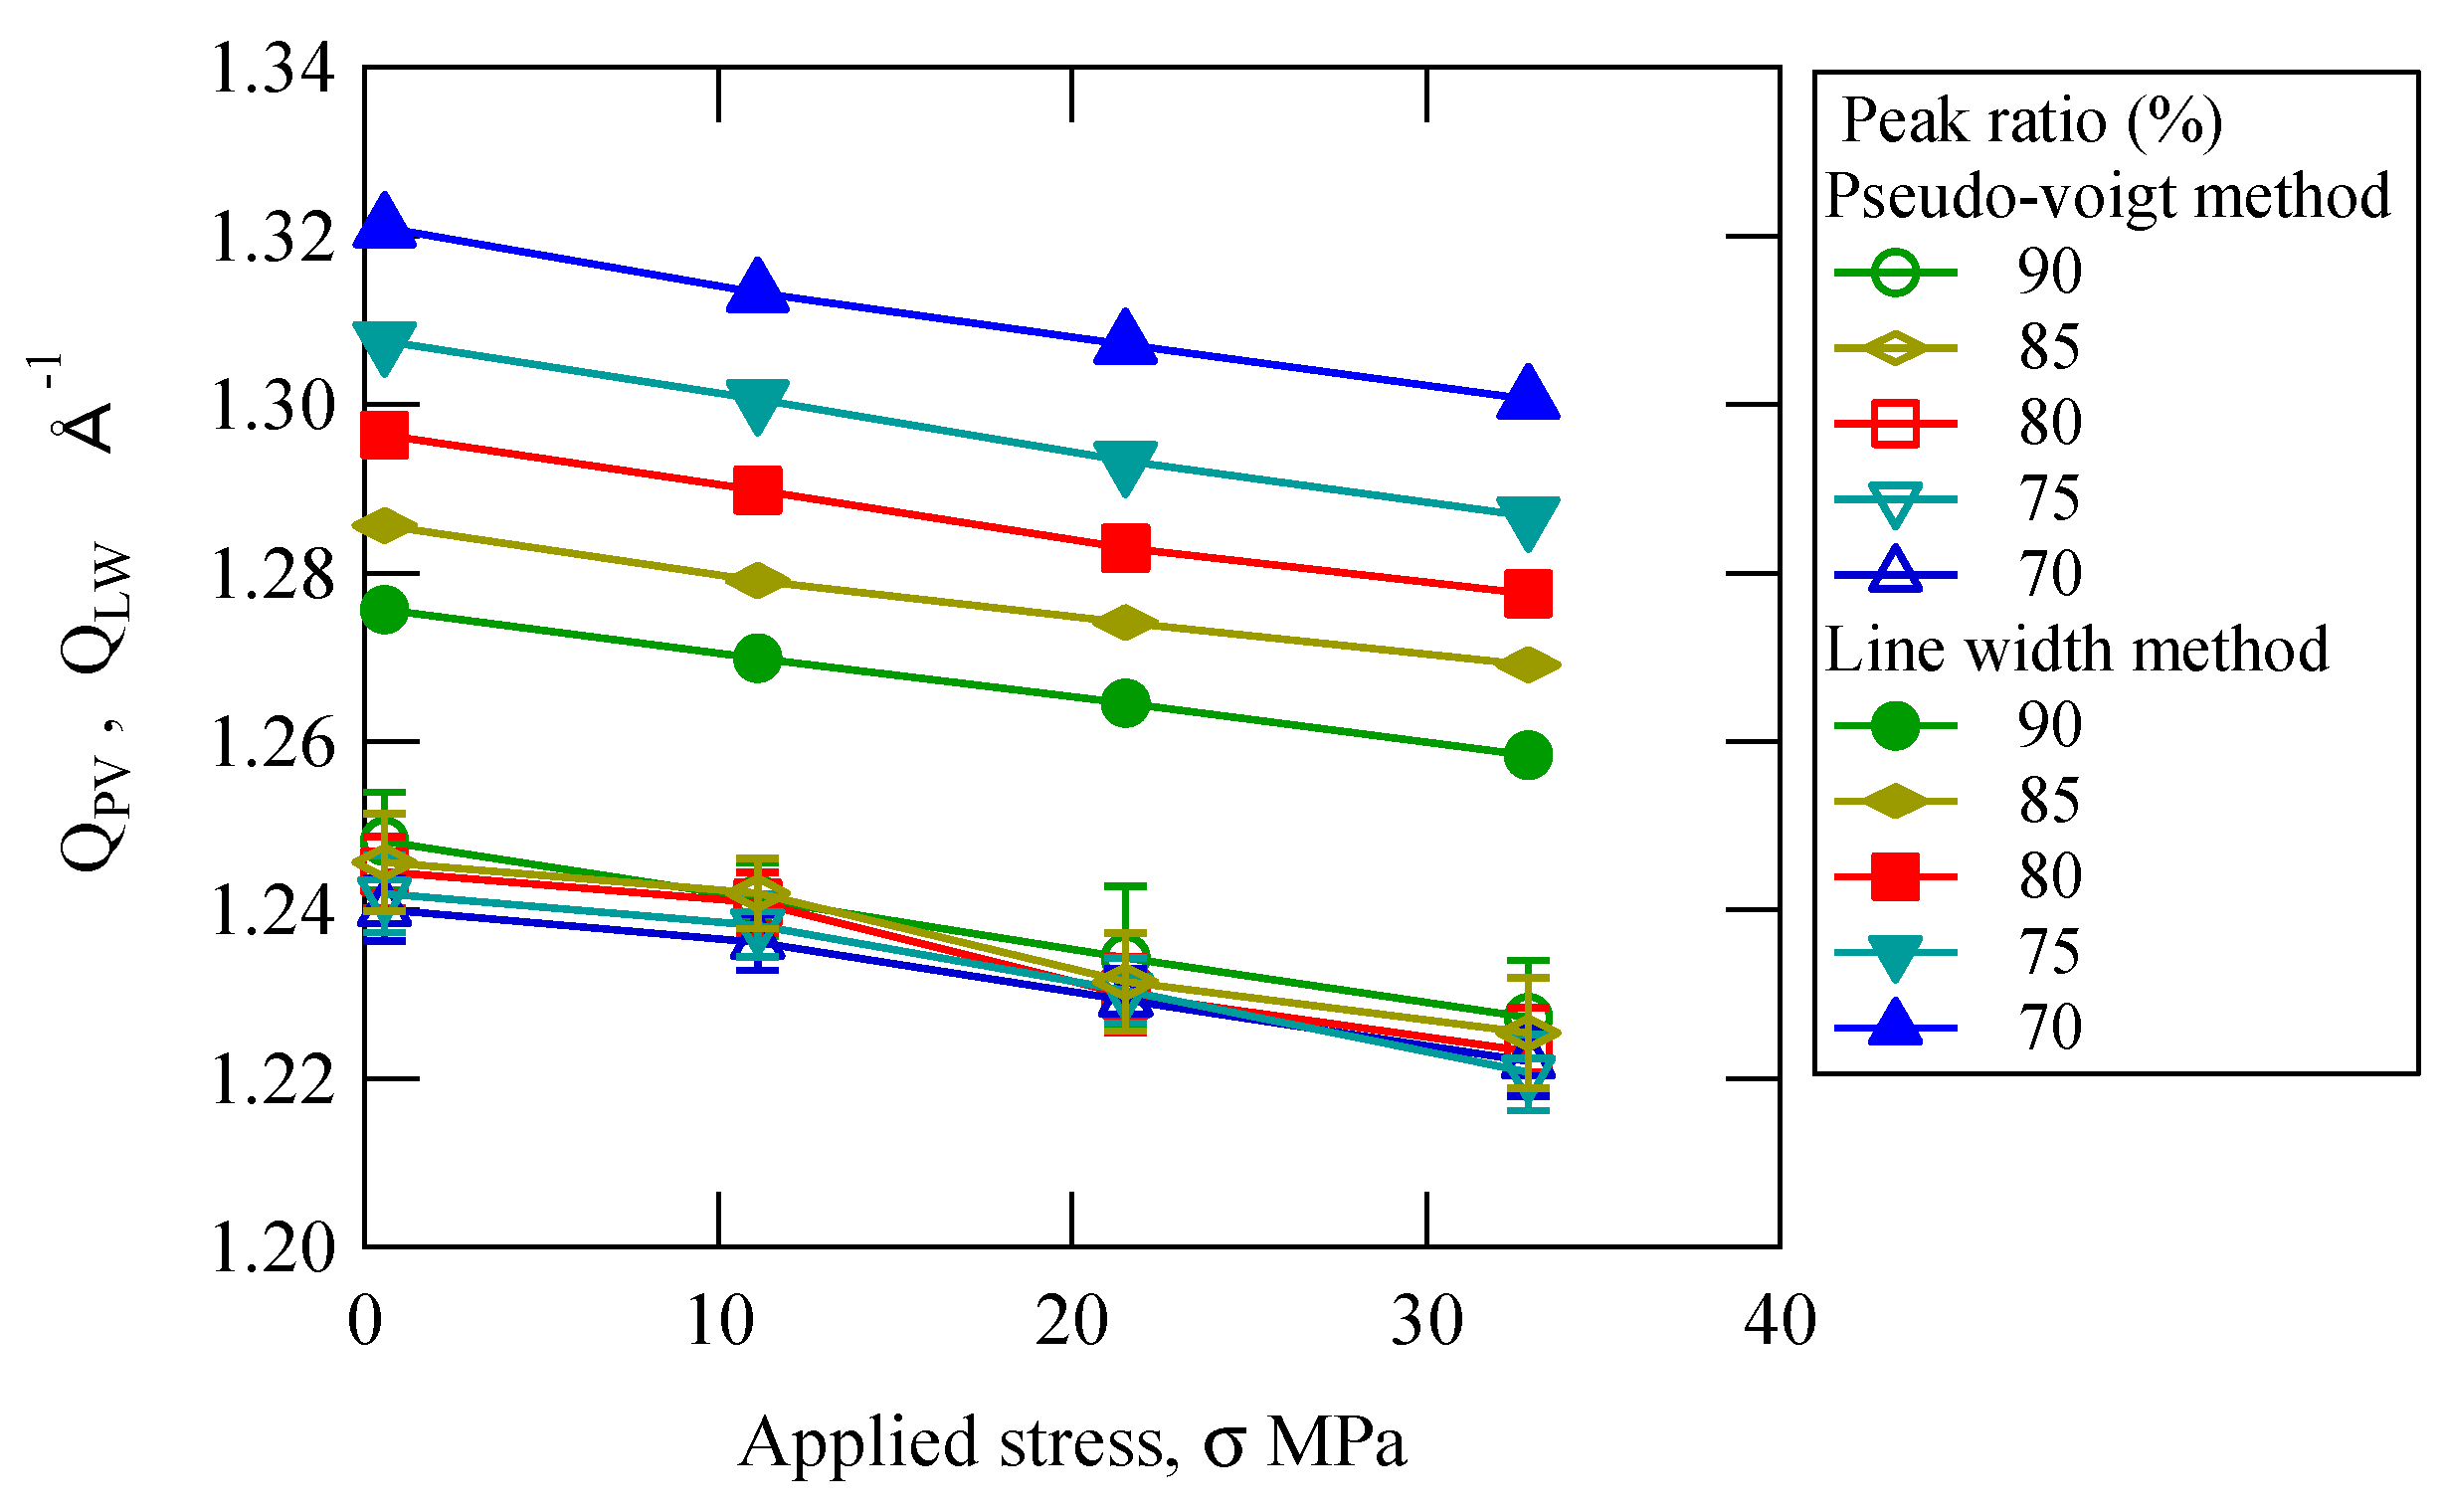
Figure 6 shows the relation between the
Q value of the first peak and the applied stress. In the figure, the open marks and solid marks indicate the values obtained by the pseudo-Voigt method, and the diffraction line width method, respectively. For the solid marks, the
Q value decreases almost linearly with increasing applied stress. When compared at the same applied stress, the
Q value decreases with increasing peak ratio, because the absolute value of the slope of the structure function profile on the high
Q value side is smaller than that on the low
Q value side, as shown in
Figure 5b. Therefore, as the peak ratio increases, the
Q value approaches the relation of the pseudo-Voigt method corresponding to the peak top value. The effect of the peak ratio on the slope of the relation between the
Q value and the applied stress is not significant; however, it is important for evaluating the X-ray elastic constant, as described later. On the other hand, in the case of the pseudo-Voigt method, the tendency that the
Q value decreases with increasing applied stress is the same as in the diffraction line width method. In this case, contrary to the diffraction line width method, the
Q value increases slightly with increasing peak ratio. In the figure, the standard deviation for function fitting is shown by error bars. Although it is difficult to read from the figure, the error increased as the peak ratio increased.
If the
Q value of the first peak is obtained as described above, the strain can be calculated by the
Q-space method [
16,
17,
18]. In this case, the
Q value obtained at the applied stress of 0.5 MPa was adopted as the reference for strain calculation. Namely, if there is the residual strain that has not been removed by annealing, its value is ignored and the relative strain is discussed in this study.
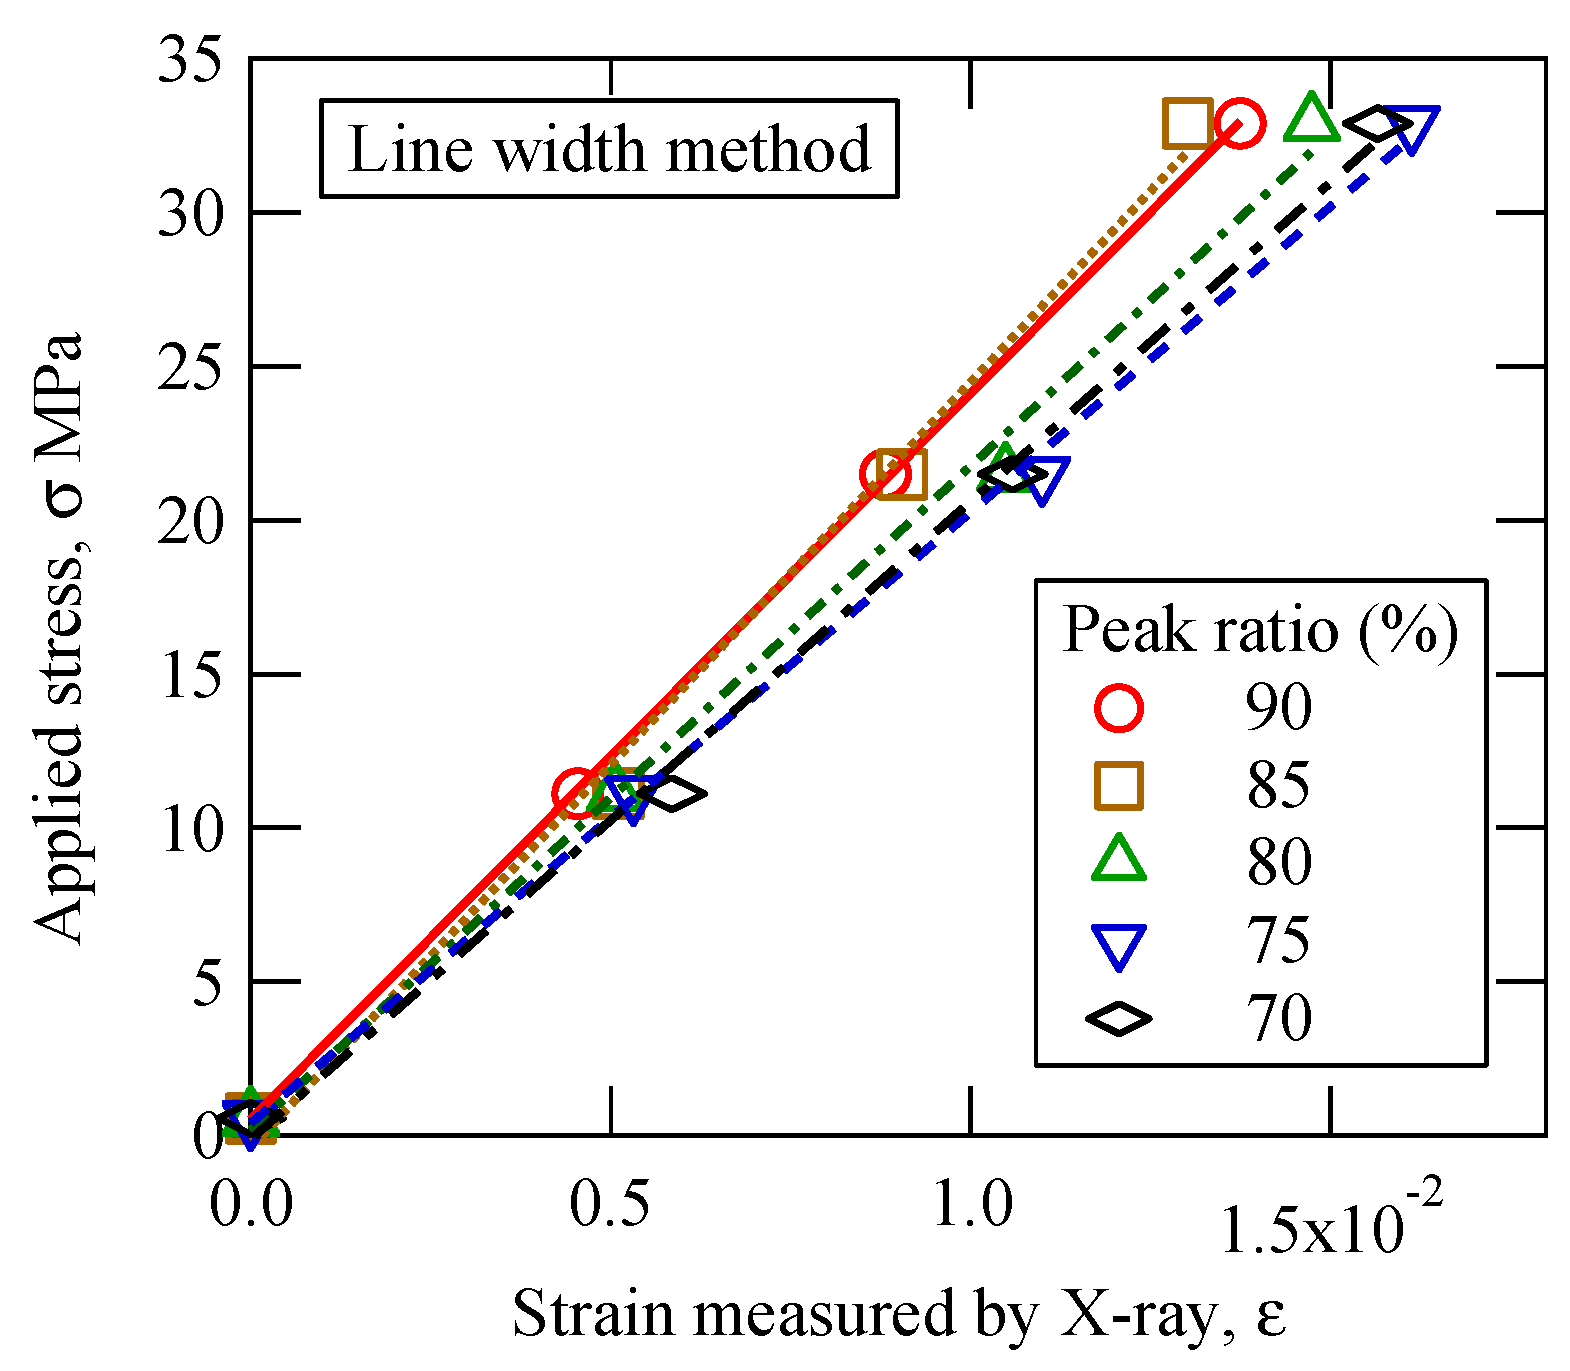
Figure 7 shows the relation between the applied stress and the strain measured by X-ray obtained by the diffraction line width method. The relationship between stress and strain shows very good linearity for each peak ratio. When compared at the same strain, the results with peak ratios of 90% and 85% are higher than other results. Although the presentation of the results is omitted, a similar linear relation was observed for each peak ratio for the results obtained by the pseudo-Voigt method. However, the linearity of the relation between the applied stress and the strain was lower than in
Figure 7.
The X-ray elastic constant can be calculated from the slope of the fitted linear curve in
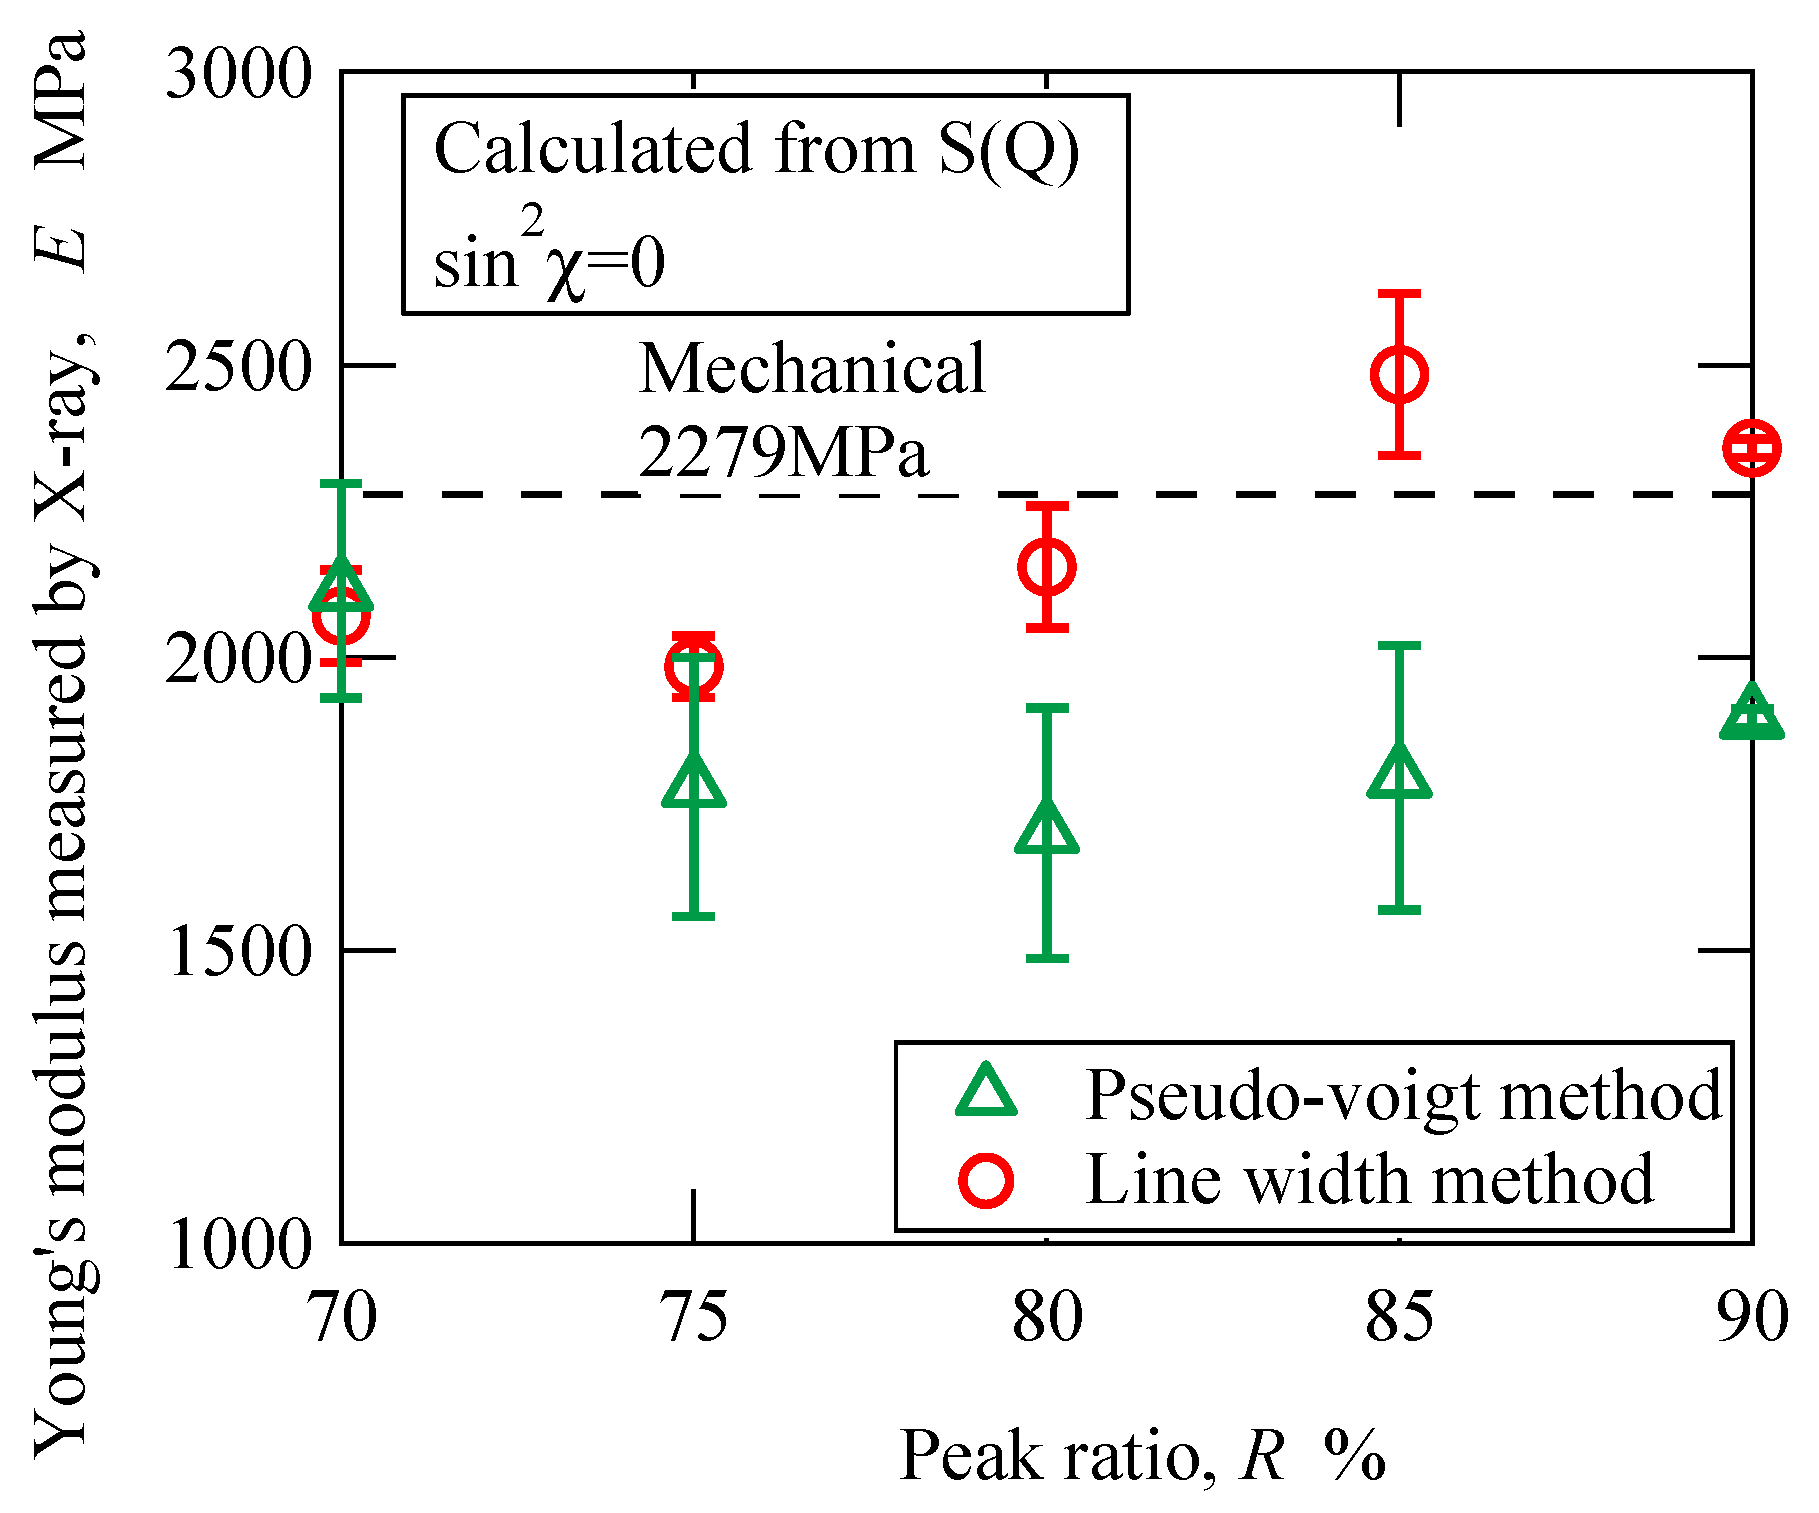
Figure 7. The obtained Young’s modulus measured by X-ray is summarized in
Figure 8. The circles in the figure indicate the Young’s modulus determined by the diffraction line width method. As expected from
Figure 7, the Young’s modulus at peak ratios of 85% and 90% are greater than the values for smaller peak ratios. The horizontal dashed line in the figure is the mechanical Young’s modulus of 2279 MPa determined from the average strain measured by the strain gauge glued on the front and back surfaces of the sample. At low peak ratios of 70% and 75%, the Young’s modulus measured by X-ray is about 10% smaller than the mechanical value. On the other hand, at 85% and 90%, it is about 5% larger. In this method, the peak position depends on the peak ratio.
In the pseudo-Voigt function method, the Young’s modulus measured by X-ray is smaller than the mechanical value. The effect of the peak ratio on the Young’s modulus is smaller than that of the diffraction line width method. The Young’s modulus measured by X-ray is not large except for the peak ratio of 70%. It should be noted that the slope of the high
Q-value side changes with a peak ratio of about 70% as shown in
Figure 5a. The average of the four values is 1793 MPa, which is 79% smaller than the mechanical Young’s modulus. The error bar in the figure is the standard deviation of the slope of the fitting line in
Figure 7. The standard deviation of the pseudo-Voigt method is larger than that of the diffraction line width method. Although the error in the value of the 90% peak ratio obtained by the pseudo-Voigt method is quite small, the error is the value for the linear approximation for the relationship in
Figure 7. As shown in
Figure 6, it should be noted that the fitting error to the pseudo-Voigt function becomes larger as the peak ratio increases.
In the analysis of halo profiles, attention should be paid to the fact that the accuracy of the calculation of the peak shift is not sufficient due to the broad halo peaks at low diffraction angles. As shown in
Figure 8, since the Young’s modulus measured by X-ray depends on the method of determining the peak position, it is necessary to adopt the same method of the elastic constant measurement for stress measurement. This matter will be mentioned again in a simple method described below using raw profile data.
Strains were also evaluated by the direct space method, using the atomic pair distribution function [
16]. However, the Young’s modulus for the first peak finally obtained was 1288 MPa, which was much smaller than the mechanical Young’s modulus and the above values. Since the accuracy is considered to be insufficient, details are omitted here. In the case of strain measurement using PDF, highly accurate evaluation can be expected by obtaining data in a wider
Q value range. For that purpose, it is effective to use Ag anode and synchrotron radiation.
3.3. Simple Evaluation Method
The structure function is the data obtained by correcting the raw profile data by background, polarization, atomic scattering factors, absorption, Compton scattering, etc. Practically, it is important to confirm the effectiveness of the method using raw profile data. In order to suppress the data scatter, another experiment with χ-axis rotation was conducted.
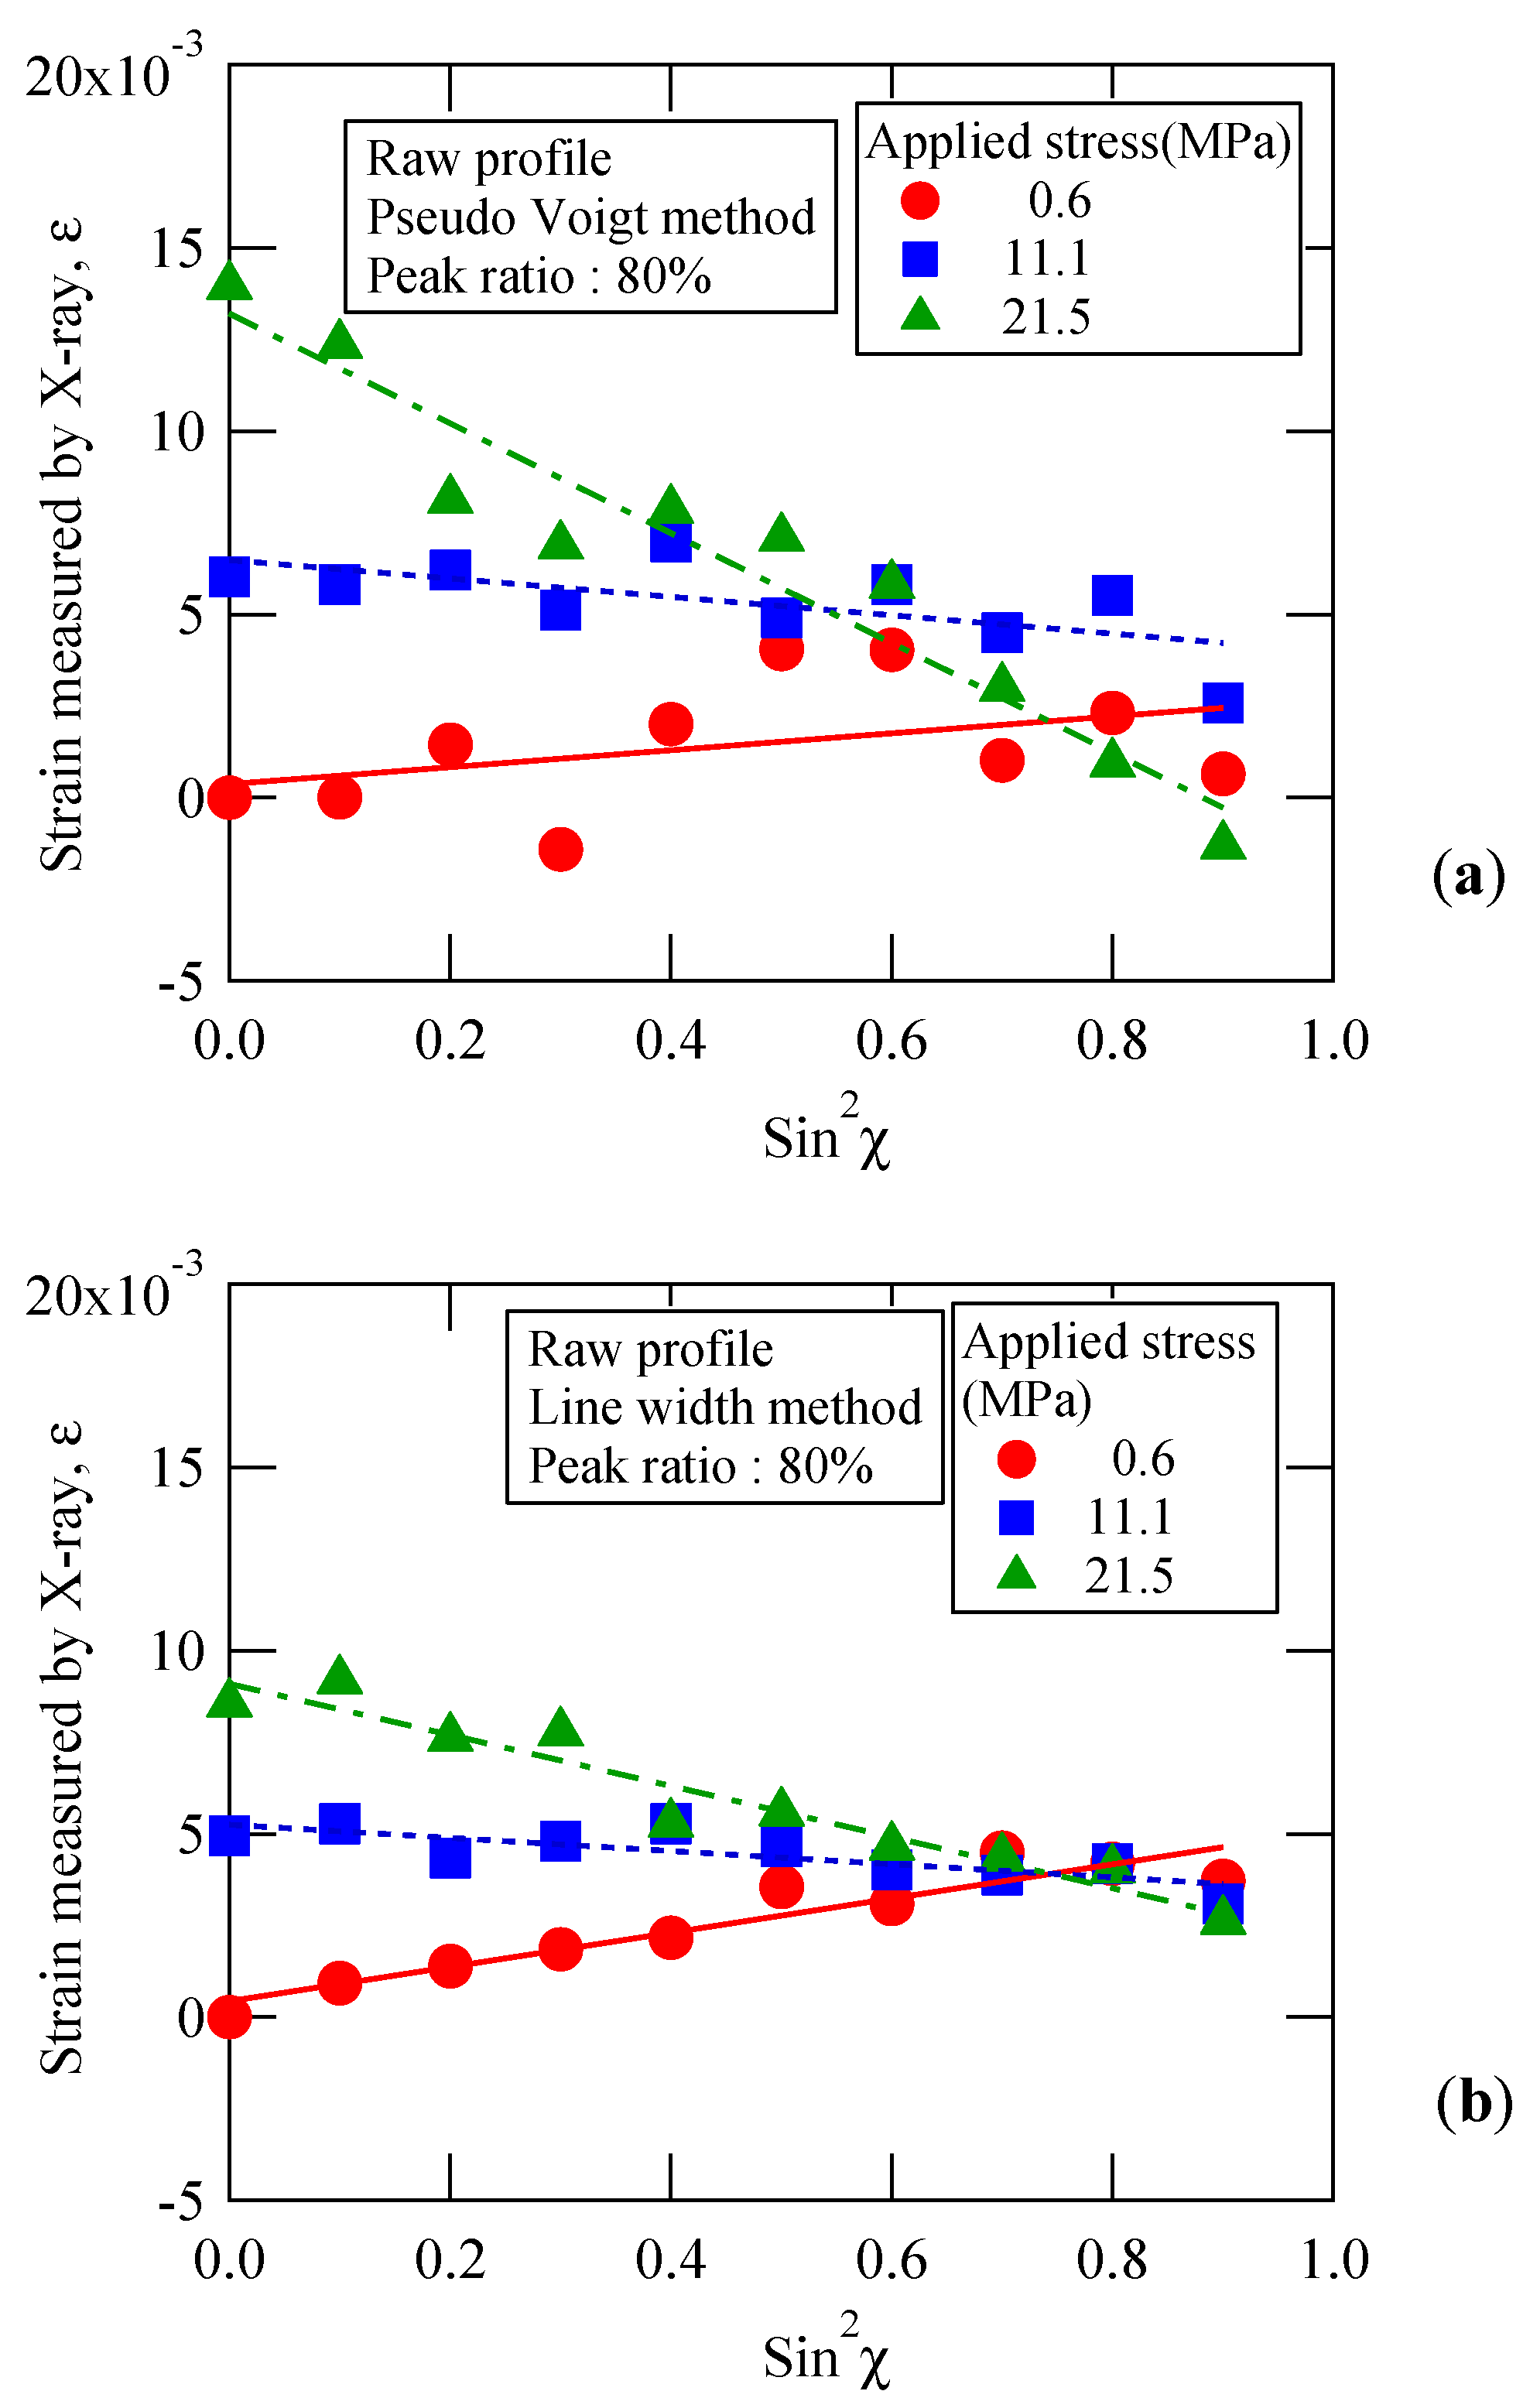
Figure 9a shows the relation between the strain measured by X-ray and the value of sin
2χ. The diffraction peak angle of the 1st halo was determined by the pseudo-Voigt method for the relation between the raw diffraction intensity and the diffraction angle. This figure summarizes the results corresponding to the peak ratio of 80% as a typical example. The results for other peak ratios were almost the same. The strain was determined by the
Q-space method. The
Q value used as a reference for the strain calculation was taken as the diffraction peak angle at sin
2χ = 0 of 0.6 MPa. Namely, as mentioned above, the strain measured by X-ray means relative value. The residual strain, if existing, is ignored. In terms of stress loading, the applied stress was set to three levels from 0.6 to 21.5 MPa.
The circles in the figure indicate the results obtained for the applied stress of 0.6 MPa. Although the scatter is relatively large, it can be approximated by a straight line. The strain at sin
2χ = 0 means the value in the loading direction. By using the intercept of the approximate straight line at sin
2χ = 0, the influence of the scatter can be reduced. The slope of the fitted linear curve obtained for the applied stress of 0.6 MPa is positive. The slope in the unloaded state should be zero. The reason for the positive slope is considered to be the existence of the compressive residual strain. Furthermore, it is well known that injection-molded products of polymeric materials have a skin-core structure due to the fountain flow [
23]. Since the molecular orientation depends on that structure, it is necessary to clarify the effect of the elastic modulus in detail. This is a subject for future work.
Data for other applied stresses can also be approximated by straight lines. The slope changes from positive to negative with increasing applied stress. The strains for sin
2χ = 1 are the transverse strain perpendicular to the loading direction. By extrapolating the approximate line in
Figure 9 to sin
2χ = 1, not only the Young’s modulus, but also the Poisson’s ratio measured by X-ray can be determined. In the case of the uniaxial loading of a homogeneous material, these three lines in
Figure 9a intersect at a specific point. The intersection point corresponds to sin
2χ = 1/(1 + v). However, the intersection of the three straight lines in
Figure 9 has a large difference, and the accuracy is extremely insufficient.
On the other hand,
Figure 9b summarizes strain for the peak ratio of 80% by the diffraction line width method. The circles in the figure also indicate the data for the applied stress of 0.6 MPa, and the scatter is smaller than that of the pseudo-Voigt method as shown in
Figure 9a. The slope is positive (as in
Figure 9), and regardless of the method of peak determination, this result has intrinsic significance. The gradient change obtained from approximate lines is smaller than that in
Figure 9a; however, they intersect at one particular point. The Poisson’s ratio calculated from the intersection point of sin
2χ = 0.74 becomes 0.35. The value is close to the mechanical Poisson’s ratio of 0.37. The diffraction line width method is expected to be more accurate than the pseudo-Voigt method. These results were similar to other peak ratio data. It is suggested that the split type pseudo-Voigt function may not be suitable for the approximation of raw profile data. On the other hand, in the diffraction line width method, the target data are limited to a narrow range, and it is not necessary to approximate the entire profile. Therefore, it is a practical and general-purpose method to evaluate the shift of the raw profile data because of its high flexibility to profile shapes.
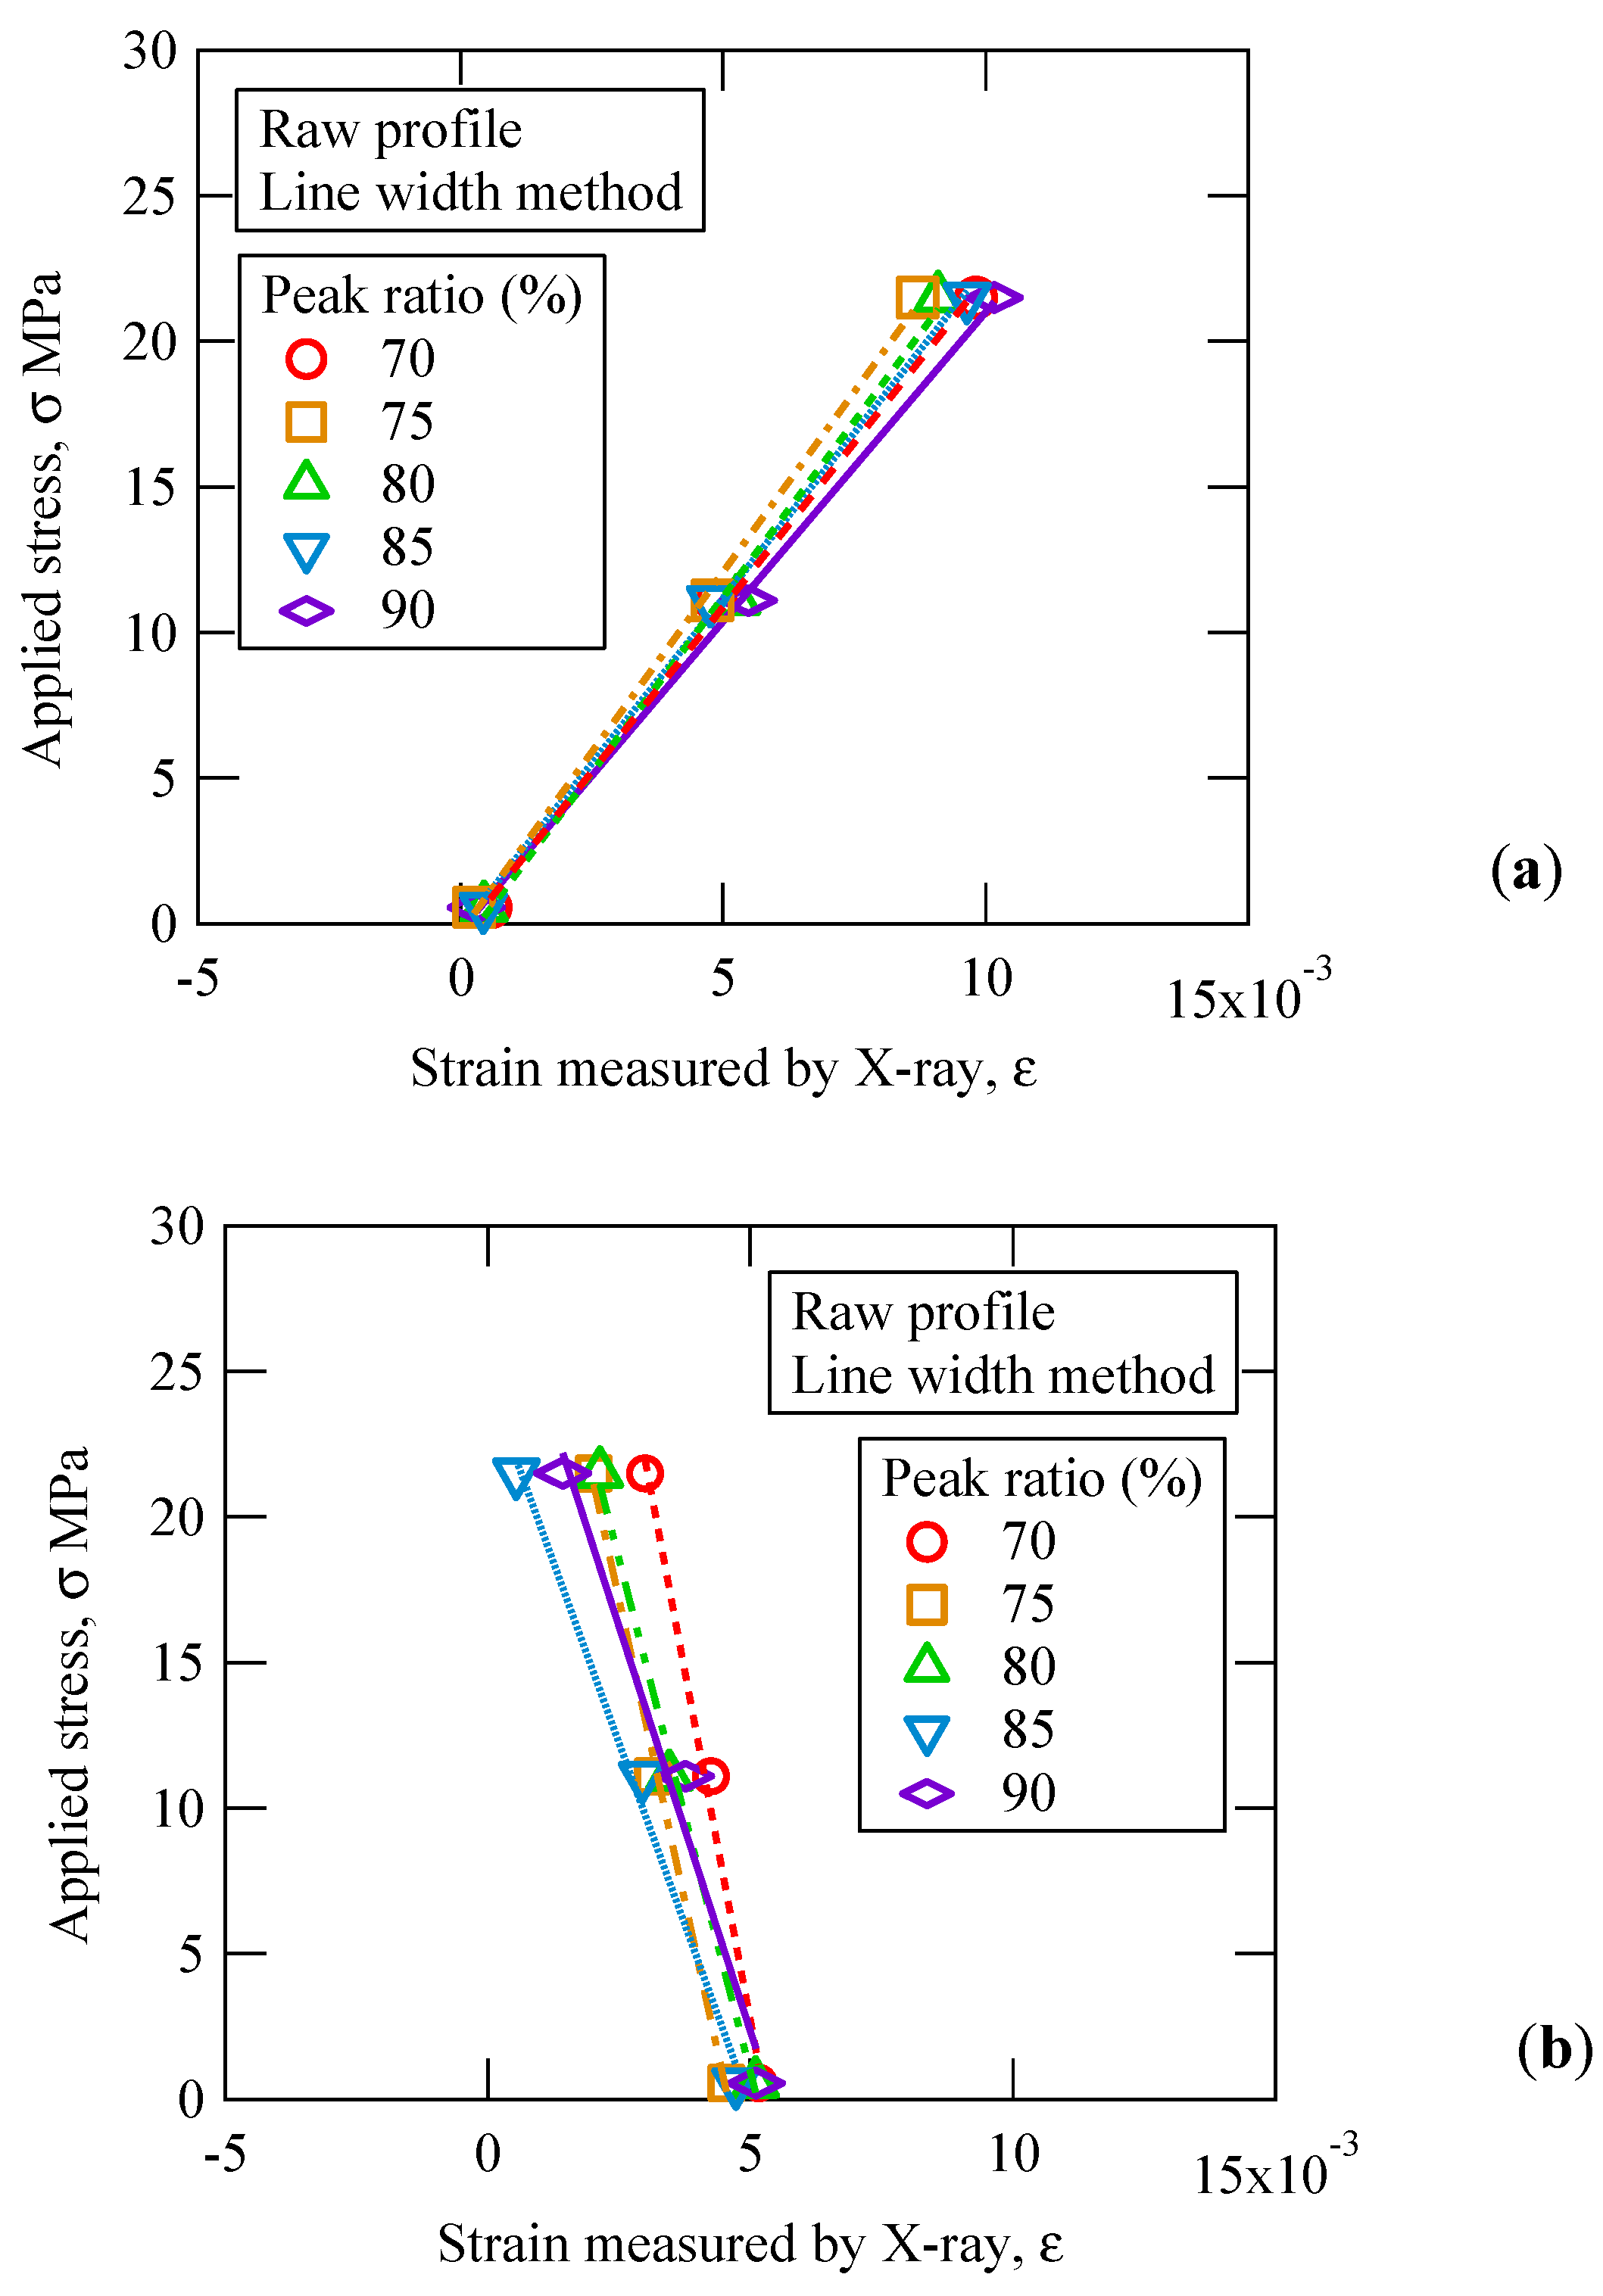
Figure 10a shows the relation between the applied stress and the longitudinal strain obtained by the diffraction line width method for peak ratios of 70 to 90%. The strain value of the intercept at sin
2χ = 0 of the fitted linear curve in
Figure 9b was plotted. Although there are only three data points, the results for each peak ratio can be approximated by a straight line.
Figure 10b shows the relationship between the applied stress and the transverse strain measured by X-ray. As described previously, the reference applied to calculate the strain is the diffraction angle for sin
2χ = 0 of 0.6 MPa. Therefore, the transverse strain at zero applied stress varies around 5 × 10
−3. The transverse strain decreases with increasing applied stress, and of course, the slope becomes negative.
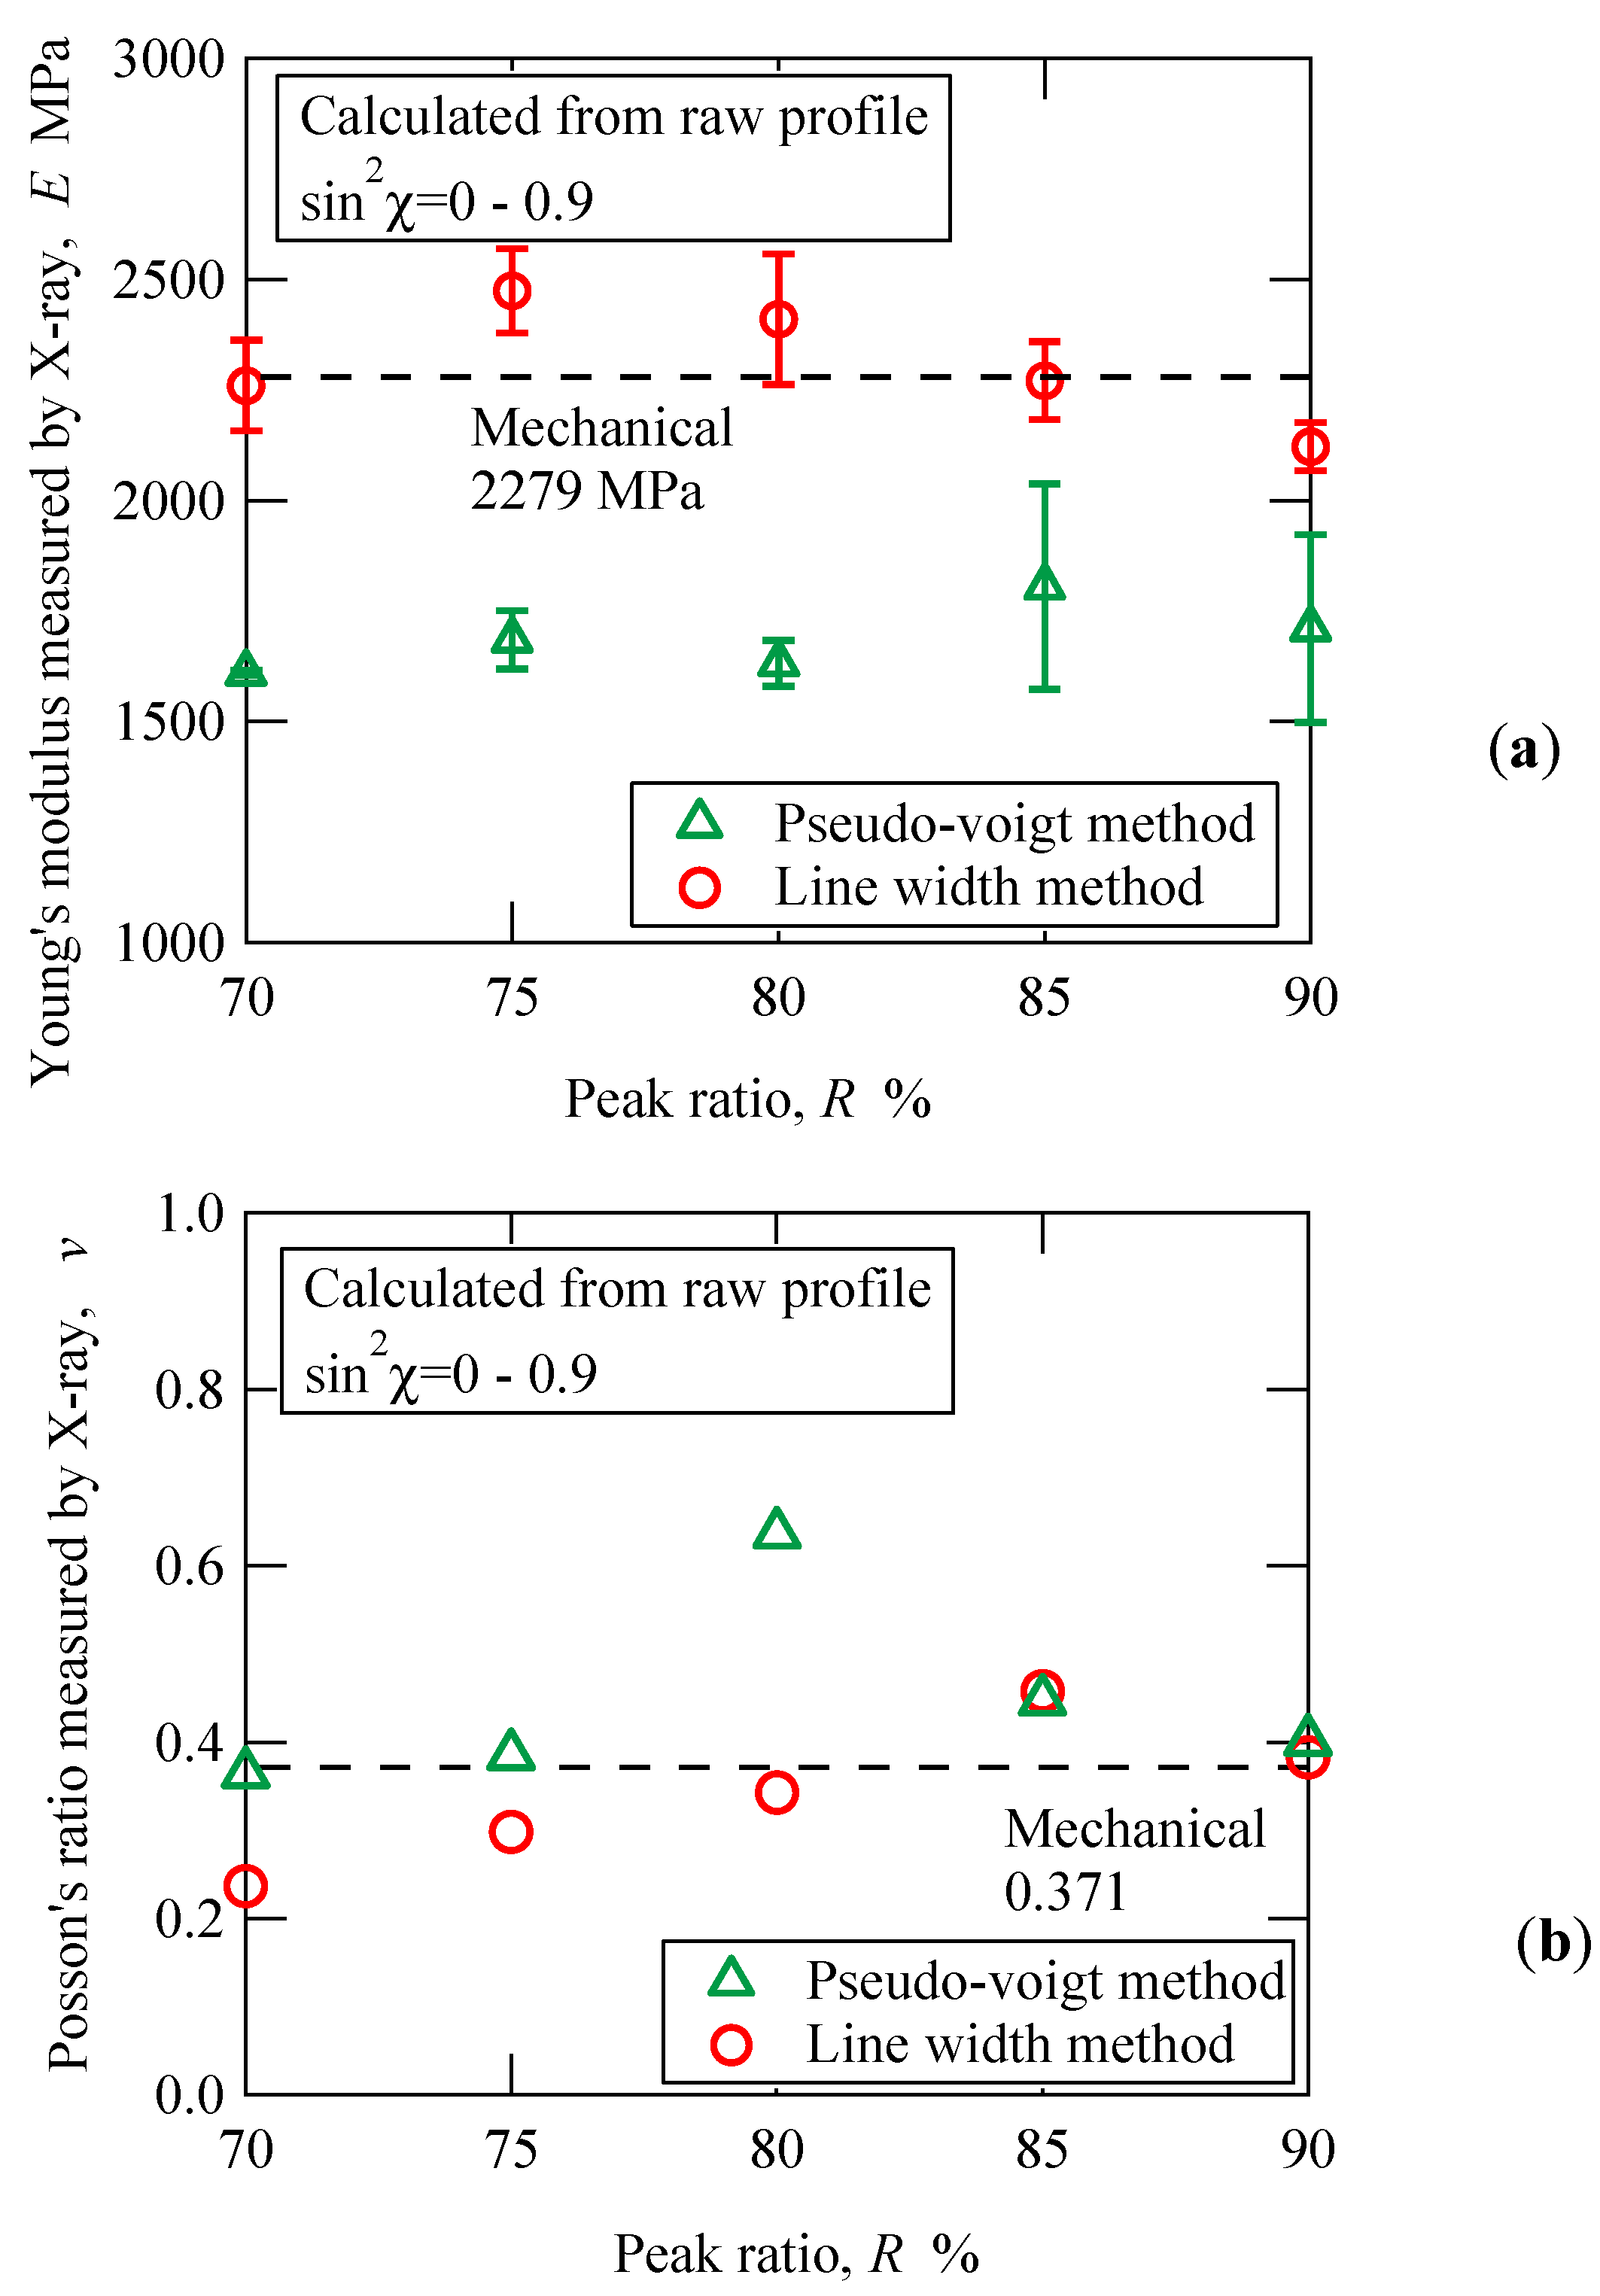
Figure 11a shows the relation between the Young’s modulus measured by X-ray and the peak ratio obtained from the slope in
Figure 10a. The results obtained by the pseudo-Voigt method and the diffraction line width method were summarized. The dashed line in the figure shows the mechanical Young’s modulus, and the error bar is the standard deviation of the slope of the fitting line in
Figure 10. As in
Figure 8, the Young’s modulus measured by X-ray of the diffraction line width method is larger than that of the pseudo-Voigt method. In the pseudo-Voigt method, the dependence of the peak ratio is small, and it is almost constant, or increases slightly, as the peak ratio increases. However, the error bars of 85% and 90% data are large in this case. The average of the five values is 1688 MPa, which is 74.1% of the mechanical Young’s modulus. On the other hand, Young’s modulus determined by the diffraction line width method decreases as the peak ratio increases, except for a peak ratio of 70%. The maximum value is for a peak ratio of 75%, which is 1.17 times higher than the 90% value. The average of five points is 2319 MPa, which is 1.02 times of the mechanical Young’s modulus. In the simple method, the effect of the peak position determination method is remarkable. This is due to the diffraction angle dependence of the peak shift and suggests that the profile shape changes with loading. From the viewpoint of the accuracy of strain measured by X-ray, the application of the diffraction line width method can be expected as a practical strain evaluation method.
Figure 11b shows the relation between the Poisson’s ratio measured by X-ray and the peak ratio. In contrast to the Young’s modulus measured by X-ray in
Figure 11a, the results of the pseudo-Voigt method are larger than those of the diffraction line width method. In the diffraction line width method, the Poisson’s ratio increases with the increase in the peak ratio. Namely, if it is necessary to determine the stresses, the same peak ratios must be used as when the elastic constants are determined. The average of the five points is 0.344, which is 0.93 times of the mechanical Poisson’s ratio. In the case of the pseudo-Voigt method, 80% of the data are obviously too large. The average of the four points excluding the data of 80% is 0.399, which is 1.308 times of the mechanical Poisson’s ratio.
In this study, a method for determining the X-ray elastic constants by transmission geometry is investigated for X-ray stress measurement of polymer materials. In the industrial field, the stress near the surface is often important, so the measurement by the reflection method is necessary. Particularly near the surface of the products, the effect of molecular orientation of the skin layer is expected to be large. It is desirable to establish a highly accurate nondestructive stress measurement method to improve the yield rate due to the deformation of injection-molded products and to ensure safety against environmental stress cracking.


