1. Introduction
Qatar, a developing country in the Middle East, started an Intelligent Transportation Systems (ITS) program in 2011. The objective of the program is to develop a statewide ITS architecture and master plan that incorporates all modes of transportation. The ITS program is currently in the implementation stage [
1,
2]. However, there have not been any studies in Qatar or the region about the impact of such a system on driver behavior. The purpose of this study is to investigate the impact of two of the ITS systems, dynamic message signs (DMS) and lane change signs (LCS) on driver behavior. The ITS program in Qatar is deploying DMS and LCS with more than twenty signs installed. These numbers are expected to increase significantly in the future as the expressway program in Qatar is being completed.
DMS are electronic screens that are placed above or on the side of the road and can view characters along with pictures in motion. They are also called variable message signs. There are many applications for DMS based on the needs of different public agencies. They can be used to provide information regarding weather and road conditions or send warning signs to the drivers in different cases. DMS provides road users with information that they can use on their journey to make smart decisions that will result in safer or shorter travel times [
3,
4,
5,
6,
7,
8]. LCS are small electronic signs placed specifically for each lane on the road. Their sizes vary and they can be used on open roads or inside tunnels. The information shown on LCS is typically the maximum allowed speed (similar to posted speed limit signs) or the status of the lane (open, closed, or merge). LCS can also be used as variable speed limit signs (VSL) [
9,
10,
11,
12,
13].
2. Background
2.1. Impact of DMS on Driver Behavior
Different studies focused on the impact of DMS signs. Rama and Kulmala [
14] conducted a field study to investigate the effects of two DMS on driver behavior. The study was performed in Finland at three sites. The before-and-after experiment was conducted in two winter seasons. Two types of DMS signs were evaluated; a slippery road condition and minimum headway between vehicles. Results showed that some types of signs reduced the average speed on slippery roads by one km/h. Additionally, other types of signs, i.e., minimum headway sign, have decreased the proportion of headways shorter than 1.5 s.
Wu and Liang [
15] produced a model to determine the best locations for DMS based on drivers’ perceptions. The optimum location for a DMS is where the sign can reduce travel time. Similarly, a misplaced DMS may increase travel time. The research methodology used both online and field surveys to record drivers’ satisfaction with the DMS. This research used the satisfaction rate to determine the compliance rate using a method of conversion. This is because DMS messages are not mandatory to follow, so it is hard to determine the compliance rate of drivers to the DMS message. The selection model for DMS was based on drivers’ responses to the survey where their satisfaction degrees with DMS-based information service is proposed to minimize the total travel time. Finally, a case study was conducted to verify the model. The study indicated that as drivers’ compliance rate increases, the total travel time decreases.
Zavareh et al. [
16] measured the drivers’ behavioral-based on DMS messages that indicated the risk levels. In this study, three levels of risk were indicated: low, medium, and high. The study measured the implications of each message that including speed, time to collision, and safety margin. Results showed that the same message might have different implications in different situations. The effect of high-risk messages was always related to safe adaptations. Based on the results of this study, it can be concluded that DMS messages can affect driver behavior, especially when informed of high-risk situations.
Harms et al. [
17] assessed the effect of using irrelevant traffic messages by studying driver behavior with the response to a critical route instruction displayed on a DMS that previously displayed different traffic-irrelevant messages. The results showed that drivers who were informed of a critical route instruction had compliant driver behavior in the experimental group. Drivers did, however, reduce the speed, which was to increase the time they needed to process the DMS. However, the control group reduced the speed much harder. This study concludes that if the DMS provided traffic-irrelevant messages, it would not affect traffic management. Compliance behavior, driver comments, recall and recognition, and speed were used as variables in this study.
2.2. Impact of LCS on Driver Behavior
Other studies focused on the impact of LCS on driving behavior. Schaefer et al. [
18] analyzed the percentage of drivers complying with LCS using a simulation model. The model in this study used one direction of a three-lane freeway. Delay was used as the measure of performance for the freeway system. The model also used different flow rates; low, medium, and high. Later on, the study included further flow rates as the three flow rates were not enough for the conclusion. The results show that LCS has a low influence on traffic congestion in heavy, medium, and low traffic conditions. Heavy traffic conditions did not change even if drivers fully comply with LCS. Similarly, LCS did not affect low, or medium traffic levels. However, at the medium to high range, specifically at a flow rate of 1150 vphpl, and at 70% compliance, lane control was found to be effective.
Wang et al. [
19] used a microscopic simulator for the design and evaluation of the LCS signs. The study used sixteen incident scenarios with four varying factors: demanding flow, incident duration, incident location, and driver compliance rate. The effectiveness of the LCS systems was evaluated based on average speeds and an average number of stops per vehicle from one-hour simulation runs. Results show that LCS can help to decrease the number of stops for vehicles with high compliance rates. Low compliance rates, however, will not have any impact. In conclusion, drivers need to comply with LCS to be beneficial, and hence, LCS should be integrated with other systems such as speed control or enforcement.
Zhang and Ioannou [
20] investigated the effect of combining ramp metering with LCS and VSL on traffic mobility. The three systems have been coordinated to establish traffic flow stability and improvements in traffic mobility and traffic safety. The study used the microscopic simulator VISSIM to carry out Monte Carlo simulations to evaluate the performance of the combined three systems. Results show significant improvements in the stability of the traffic flow, as well as mobility, safety, and environment.
Despite having many studies focusing on the impact of DMS and LCS on driving behavior, traffic management, and road safety, limited studies investigated the impact of these new technologies in Qatar or the Arabian Gulf region. The objective of this study is to investigate driver behavior after the implementation of dynamic signs (DMS and LCS) in the country.
3. Data Collection
3.1. Case Study
Qatar, a country in the Arabian Gulf region with a population of around three million people, was chosen as a case study for this investigation. The majority of the population lives in Doha, Qatar’s capital. In recent years, Qatar has undergone rapid and substantial infrastructural growth [
21,
22]. As a result, private vehicle utilization increased significantly, resulting in limited use of public transportation and active transportation alternatives. [
23,
24]. This condition has resulted in a number of traffic safety [
25,
26], traffic operations [
25,
27], emission pollution [
28], and noise pollution issues [
29,
30]. Qatar is spending billions of dollars to improve and modernize its infrastructure, including ITS [
31,
32]. As part of this study, the driver behavior is compared on three types of roads in Doha, Qatar: arterial roads, and freeways with and without ITS signs.
3.2. Data Sources and Collection Techniques
The data for this study were collected using field observations, field measurements, interview questions, and video camera recordings. For similar field studies, some studies used a fixed vehicle, and other studies used drivers’ vehicles. In this experiment, one test vehicle was used for all drivers. The vehicle is a regular car sedan type. Two cameras equipped with GPS were installed inside the vehicle; one was facing the front of the car, and the other was facing the driver. The cameras recorded the time, position, and speed. The drivers drove the same route, which contains sections with electronic signs and sections with only static signs. To capture the speed of other vehicles, a radar gun was used during the experiment.
To compare the drivers’ behavior, the participants have to drive along a specific route that includes sections with and without DMS and LCS signs. The drivers were not informed of the study objective or what will they be asked about after the driving is finished to encourage participants to drive normally on the route without any instructions. Upon finishing the route, an interview with the driver was made about his observation and opinion on the routes.
3.3. Sample Size
Previous studies used a range of 20 to 48 participants. Guattari et al. [
33] used 20 participants in their study about the effectiveness of DMS information. Dutta et al. used 48 participants for a driving simulation study about evaluating and optimizing factors affecting the understandability of DMS [
34]. Lyu et al. [
35] used 32 participants in their study about the effect of the advanced driver assistance system on driving performance and braking behavior. Similarly, Xu et al. [
36] used 32 participants in their study about the relationship between DMS control strategies and driving safety in freeway work zones. Vrieling et al. used a smaller number of participants (25) when comparing two types of roads in the Netherlands. Several similar studies were conducted during off-peak hours [
37,
38,
39], and other studies did not specify [
35,
36]. Based on the literature review, off-peak hours were used in this study. Leaflets were used to advertise for participants on the campus of Qatar University, Doha, Qatar. They were also sent to a list of contacts that participated in previous transportation studies. Based on the responses received, 32 participants were selected for this study. All participants had a normal or corrected-to-normal vision and a current driver’s license.
3.4. Demographics
The summary of the participants’ demographics is shown in
Table 1. It should be noted that the demographics chosen for this experiment represents the population of Qatar, which includes 11.6% Qataris and 88.4% expats. Moreover, the country has a majority of males, with 74.9% of the total population compared to 25.1% of females. Most of the participants had five or more years of driving experience.
3.5. Pilot Study
A pilot study was conducted before proceeding with the experiment. Two participants completed all parts of the experiment, including the post-experiment questionnaire. After that, the participants were asked about their opinion of the experiment and the comments or observations they have. Several issues were identified. Measuring other vehicles’ speed affected the visibility of the right-side mirror. Upon practice, this issue was resolved by aiming the radar gun far from the line of sight with the mirror. The limits of each route were not clearly understood. A map was printed and was shown to every participant before and after the experiment. Directional signs were ignored since they have a static route. The above comments were considered in the final experimental design.
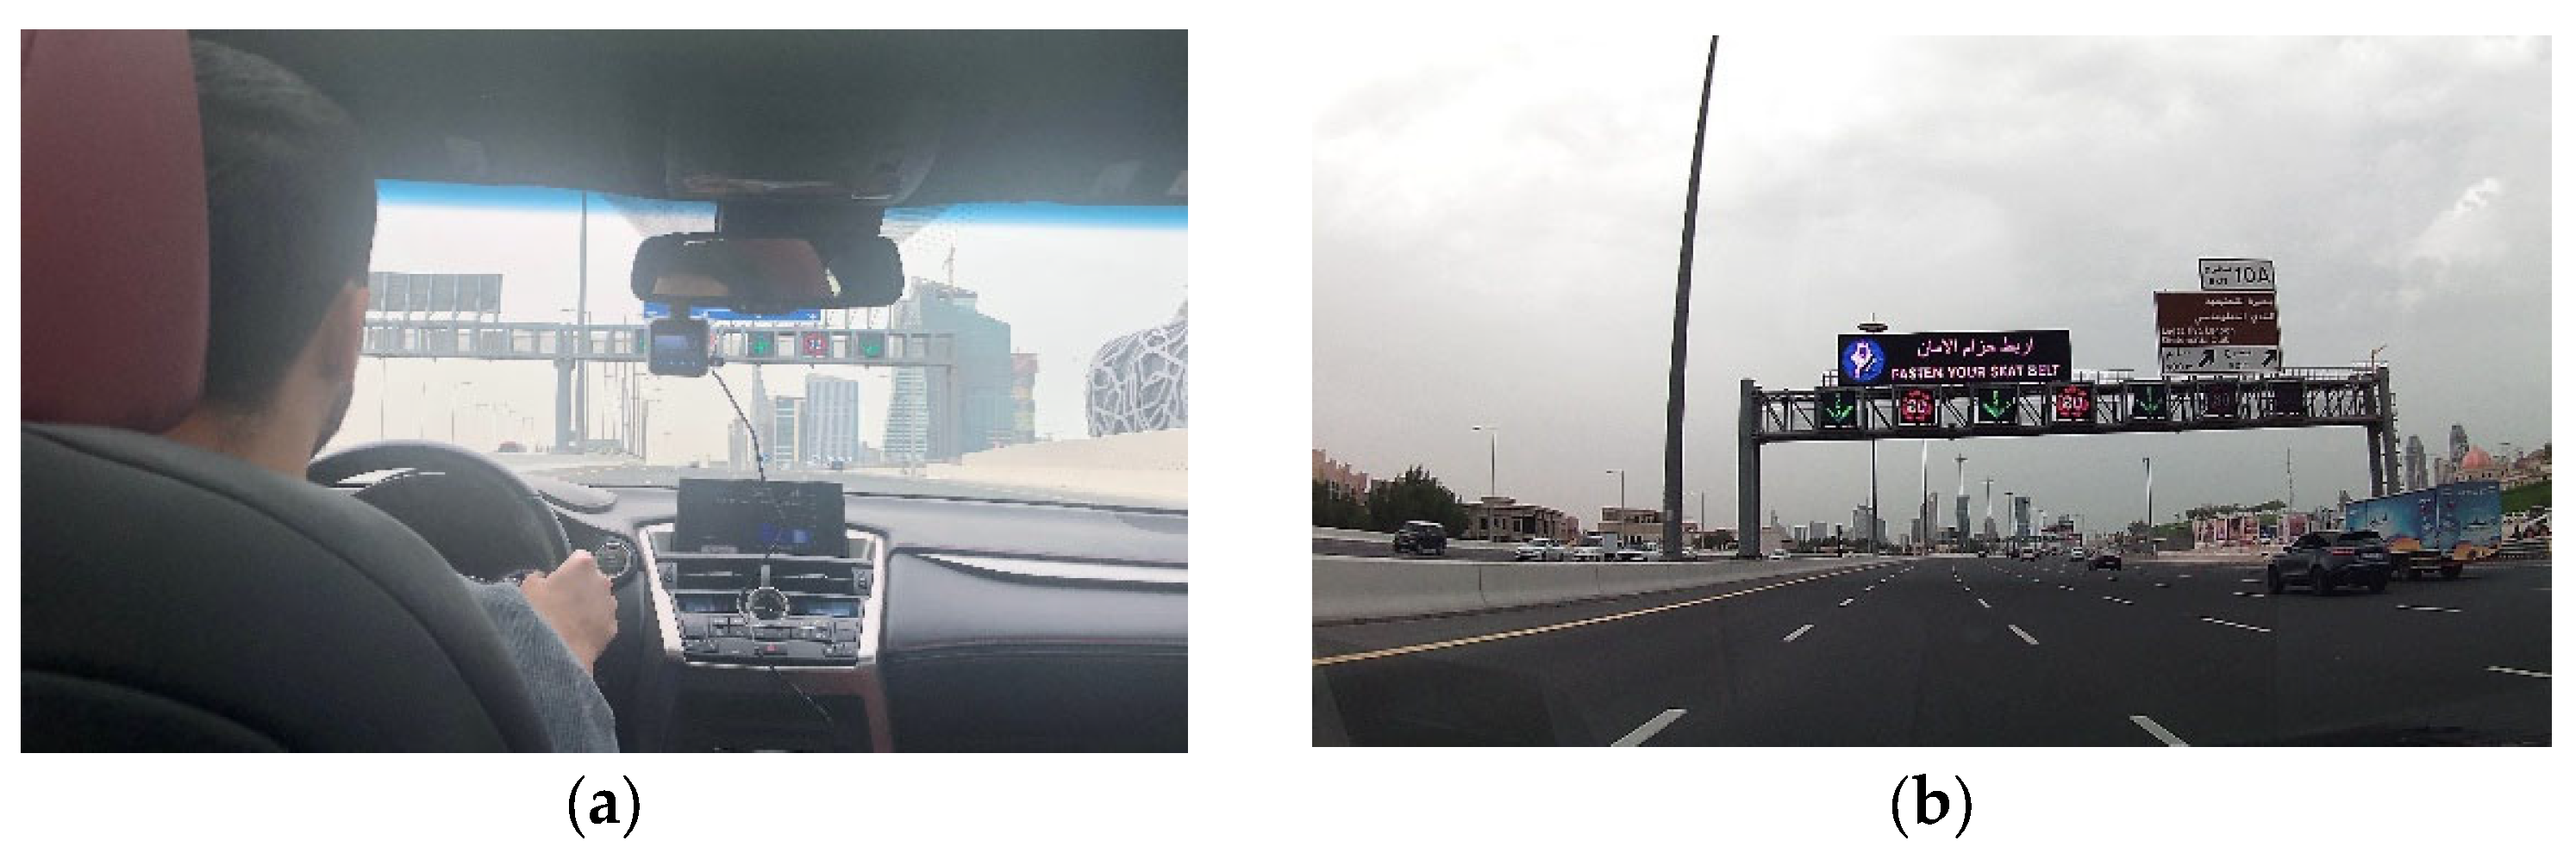
Figure 1a shows the vehicle setup, and
Figure 1b shows a screenshot from the recording camera.
3.6. Experiment Route
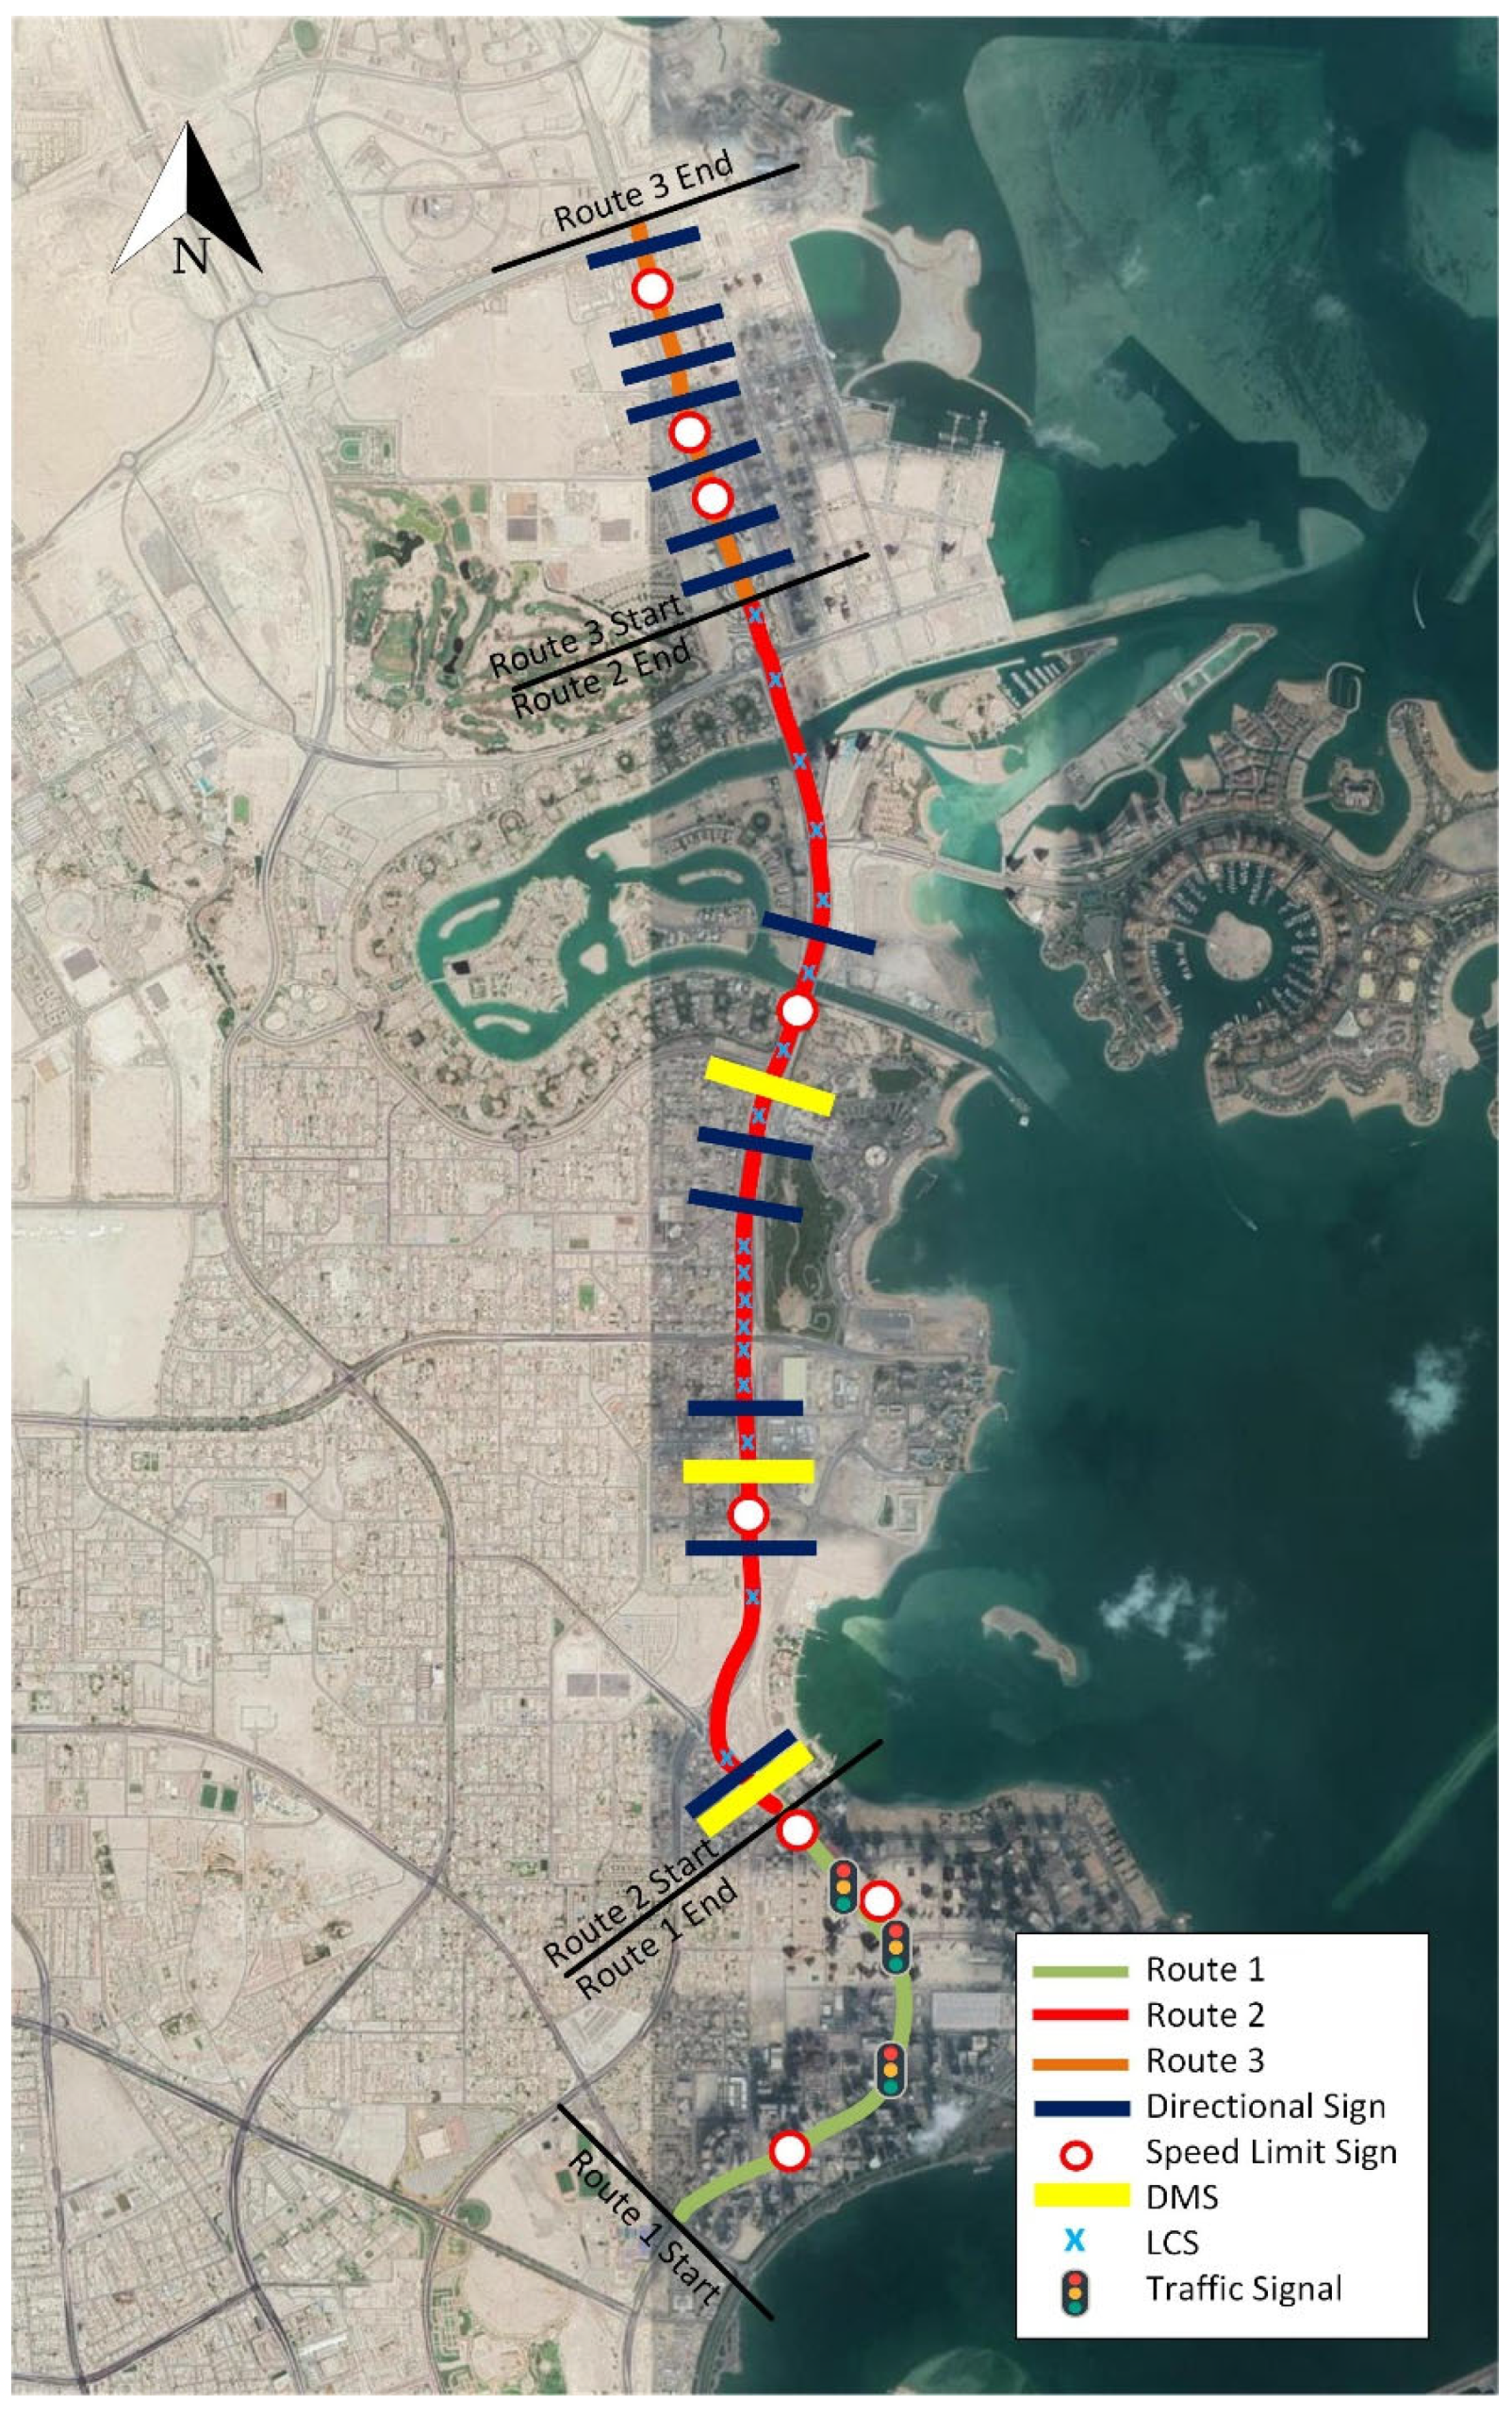
After reviewing several sites, a corridor was selected. The corridor includes an arterial road segment and two freeway segments with and without DMS and LCS installed. The selected corridor is shown in
Figure 2.
Route 1, a signalized-intersections corridor, is 3.0 km long and has four lanes in each direction and three traffic signalized intersections. Route 1 has a posted speed of 80 kph. Route 2, a DMS/LCS corridor, starts from the end of Route 1 (Lusail 5/6 interchange) and ends after the pearl interchange. It is 5.3 km long, has four lanes, and has two tunnels with 350 m and 600 m of covered length in each direction. Route 2 also includes three DMS and 17 sets of LCS. The posted speed for Route 2 is 80 kph. Route 3, a freeway corridor, starts right after Route 2 ends. It is a freeway, 3.2 km long with four lanes in each direction, and a posted speed of 80 kph. Route 3 does not include any DMS or LCS. The summary of the characteristics of the three routes is shown in
Table 2. The advantage of the chosen route is studying one continuous corridor. In this case, the drivers do not have to switch from one location to the other to start another section. The route also has convenient parking places near the start of the route and right after the end, which were used to meet with participants and have the post-experiment interview.
4. Selection of Variables
Different variables were measured in previous studies. A summary of these variables is shown in
Table 3.
Speed was collected in most reviewed previous studies, followed by lateral position, and drivers’ opinions. Other variables included were traffic weather conditions, number of lane changes with and without signaling, number of braking occurrences, recall and recognition, compliance behavior, and self-reported mental effort.
4.1. Speed
Speed is one of the most important factors to consider when comparing roads. Lyu et al. [
35] recorded speed in their study of ADAS systems. Vrieling et al. [
37] also calculated average speed to compare two types of road works. Xu et al. [
36] used speed as a variable in the research on the relationship between DMS. In this study, speed was recorded using three methods. First, the observer used the remote radar equipment to measure sample speeds for 32 surrounding vehicles. The second method was using the GPS Camera. It should be noted that a distance of 100 m before and after the intersection was not recorded in both methods since Route 1 contains some traffic signals which will require braking to stationary speed and acceleration from zero. The third method is from the average speed of the vehicles in which the distance of the route is divided by the entry/exit time for each participant. It should be noted Route 1 includes different stops at intersections, which will affect the average speed.
4.2. Harsh Braking
Harsh braking was another variable to consider. Many studies used deceleration and harsh braking as a variable. Lyu et al. [
35] recorded the change in speed which is acceleration/deceleration. Vrieling et al. [
37] and Xu et al. [
36] used braking as a variable in their studies. In this study, the number of harsh braking incidents made by the participant during the drive was measured and recorded by the observer.
4.3. Traffic Flow Condition
This variable refers to the condition of the traffic flow at the time of each experiment trial. Measured by both observer and participant judgments. Zheng et al. [
39] used traffic flow conditions as a variable in their study of pedestrian interactions outside of the crosswalk zone. The traffic flow conditions were recorded as low, medium, or high.
4.4. Number of Lane Changes
The number of lane changes made by the participant on the test segments. Lane change was used as a variable by Lyu et al. [
35]. In this study, the number of lane changes was measured by a combination of lane changes with and without turn signaling.
4.5. Number of Lane Changes with Turn Signaling
The number of lane changes made by the participant on the test segments while using turn signal indicators. Measured by observer’s observation.
4.6. Number of Lane Changes without Turn Signaling
The number of lane changes made by the participant on the test segments without using turn signaling was recorded. It was considered a variable in previous studies [
38]. In this study, lane changes without turn signaling were recorded by the observer.
4.7. Lateral Position
The position of the vehicle with respect to the lane was recorded. It is defined as the distance from the edge of the car to the lane edge due to different lane widths [
37]. In this experiment, the corridor has a fixed lane width of 3.65 m. In this study, the lateral position was defined by three categories: within lane, edge of the lane, and crossing the lane marking. It is expected that the driver will mostly maintain the vehicle within the lane. Hence, it is measured based on the vehicle distance from the edge of the lane or crossing the lane with respect to the corresponding route segment. Video recordings were used to measure the lateral position.
4.8. Position of Hands-On Steering Wheel
The position of the driver’s hand on the steering wheel was categorized into three categories: high, medium, and low control [
37]. High control means that both hands were used in a high control position (which is around the 3 o’clock and 9 o’clock position of the steering wheel). Medium control is using both hands, not in 3 and 9 o’clock, or 5 and 7 o’clock positions. Low control is using one hand in any position or both hands at 5 o’clock or 7 o’clock positions. In this study, the position of the hands was measured by the duration of each position based on the observer’s judgment.
4.9. Self-Reported Mental Effort
The participants’ mental effort was investigated in each segment. Vrieling et al. [
37] also used self-reported mental effort in their study. In this study, the participants were asked in the post-experiment questionnaire to record what they believe was the mental effort to drive on each segment measured from 1–5, with 1 being the lowest effort (best), and 5 being the most demanding.
4.10. Recall and Recognition
Recall and recognition were used in previous studies about DMS traffic-irrelevant messages [
17]. In this study, drivers were asked in the questionnaire to recall the number of signs for speed limit signs, directional signs, DMS, and LCS for each segment, which was later compared with the actual number of signs.
4.11. Driver Compliance
Compliance behavior was used in previous studies about drivers’ compliance with the use of traffic-irrelevant messages in DMS [
17]. In this study, compliance was measured using drivers’ compliance with speed, lane changing, and lateral position, which is obtained from previous variables.
4.12. Post-Trip Questionnaire
The study includes a post-experiment interview with questions about the driving routes. Participants will provide their opinions and self-reported evaluation. Huysduynen et al. [
41] investigated the relationship between self-reported driving style and driving behavior by collecting data from 88 participants who took a driving simulation and provided their self-reported evaluation. The results revealed a modest correlation between self-reported driving behavior and the driving behavior data obtained from the simulation.
Participants’ opinion of the quality of each segment and comments about any other issues was recorded. This method was used in previous studies [
17,
37]. At the end of the experiment, participants were asked in the post-experiment questionnaire about their opinion and provided comments if they want. After each participant completed the drive, they were asked questions about their trip.
There were three types of questions that were asked to the participants. First, personal questions about driver characteristics. The second part is about route-specific questions regarding what they saw, how they reacted, and what the exposed mental effort for driving on each route is in their opinion. Lastly, some general questions regarding their opinion on the LCS.
4.13. Traffic Flow Conditions
In this study, traffic flow conditions were estimated based on the observer as well as the driver’s perception.
Table 4 shows the average measured traffic flow conditions for both. The traffic flow conditions were mostly considered medium with an average estimation of 48.4% for low, 51.6% for medium, and 0% for high levels of traffic.
4.14. Weather Conditions
Weather conditions during the experiment ranged from clear (93.8%) to slightly hazy (6.2%). No driving was recorded during rainy conditions.
5. Measured Variables
Several variables were measured and compared between the three routes.
Table 5 shows a summary of the results.
5.1. Average Speed
Three types of speeds were measured. The first speed is the average speed for each participant based on the duration of driving on each route. The average speed of each driver was calculated based on the length of the route and the drivers’ entry/exit time that was recorded using the GPS camera. The results are shown in
Table 5. It was noticed that the average speeds for Route 1 were below the posted speed. On Route 2 and Route 3, the average speeds were above the posted speed. It should be noted that the posted speed for all routes is 80 km/h.
5.2. Spot Speed
The second is the spot speed, which is the running speed in the middle section of each route. Spot speed is a measurement of the driver’s speed that was measured using the GPS camera by taking 32 measurements of speed while the vehicle is in motion. This is to counter the impact of stationary stopping at traffic signal intersections on Route 1 that would highly affect the average speed.
Table 5 shows the average spot speeds for each driver on each route. It is noticed that Route 1 has an average spot speed of 72.6 km/h with a standard deviation of 5.4, which is 9.3% below the posted speed (80 km/h). Route 2 has an average spot speed of 91.0 km/h with a standard deviation of 9.8, which is 13.8% above the posted speed (80 km/h). Lastly, Route 3 average spot speed is 93.9 km/h with a standard deviation of 15.3 and is 17.4% above the posted speed (80 km/h).
5.3. Flow Speed
The third is the speed of surrounding vehicles. Flow speed was measured using the remote radar by recording the speed of other vehicles. For each trial, 32 measures of speed for other vehicles were taken. The average flow speeds on each route are shown in
Table 5. Route 1 had an average flow speed of 70.2 km/h with a standard deviation of 5.1, which is 12.3% below the posted speed (80 km/h). Route 2 had an average flow speed of 88.9 km/h with a standard deviation of 8.5, which is 11.1% above the posted speed (80 km/h). Lastly, Route 3’s average flow speed was 88.9 km/h with a standard deviation of 8.2 and is 11.1% above the posted speed (80 km/h).
It should be noted that, on Routes 2 and 3, the average speed is close to the spot speed. However, as expected, there was a great difference in Route 1 since it includes traffic signal intersections. For Route 1, the drivers’ average speed, spot speed, and flow speed were below speed limits. Based on the methodology used for calculating each value, it was expected that the average speed would be lower than the spot or flow speed since it counts for vehicles stopping at the traffic signal intersections. It should be noted that on Route 1, all measured speeds were below the posted speed. On Route 2 and Route 3, speeds were surpassing the posted speed of 80 km/h. Therefore, it can be concluded that the existence of DMS and LCS did not affect drivers’ speed compliance. Although it was found in the literature review that these signs reduce over-speeding occurrences [
36], the drivers’ compliance in Qatar may not be affected by these signs.
5.4. Harsh Braking
The number of harsh braking incidents was recorded in each trial.
Table 5 shows the average number of harsh braking incidents on each route. Since the routes have different length, the average number of harsh braking incidents were divided by the total length of each route in km. The average numbers of harsh braking incidents on each route were insignificant. Although Route 1 has a slightly larger number with 0.156 incidents per 1 km.
5.5. Lane Changing
Lane changing was recorded with and without using the turn-signaling indicator. It was noticed that lane changes occurred mostly on Route 2, with an average of 3.6 lane change occurrences. However, since the three routes do not have the same length, the average number of lane changes was calculated per 1 km. It is concluded that Route 2 has the lowest number of lane changes (LC) per 1 km, followed by Route 3, then Route 1. Furthermore, from the above results, the use of the turn-signaling indicator was recorded, and it should be noted that turn signaling was mostly used on Route 1 and Route 2 with 54.4% and 57.7%, respectively. However, on Route 3, it was used only 36.5% of the time. The summary of the use of turn-signaling indicators is shown in
Table 5. In summary, it is concluded that Route 2 had the lowest number of lane changes per 1 km and the highest number of the turn-signaling indicator.
5.6. Lateral Position
The lateral position of the vehicles was recorded. Based on the results shown in
Table 5, it should be noted that the drivers had the highest deviation from the center of the lane along Route 3 with 1.6% close to the edge and 0.6% crossing the lane marking. Route 2 has the highest percentage of length crossing the lane with 0.70%.
5.7. Position of Hands on Steering Wheel
The position of the drivers’ hands-on on the steering wheel was recorded and classified. Based on the results shown in
Table 5. It is perceived that Route 1 had the highest control for drivers, with 59.4% in a High Control position. On the contrary, Route 2 had the lowest percentage of drivers using a High Control position, with only 21.9%.
6. Self-Reported Variables
Different variables were obtained based on the post-trip questionnaire.
Table 6 shows a summary of the results.
6.1. Mental Effort
The self-reported mental effort (SRME) was recorded based on the driver’s opinion. The descriptive statistical results are shown in
Table 6. It was found that Route 1 has the highest SRME with a mean of 2.9 and SD of 1.0, while Route 2 and 3 had the same average SRME of 1.6 and SD of 0.7 for Route 2 and 1.0 for Route 3. The SRME values for Route 2 and Route 3 are the same and lower than Route 1. This could be due to the fact that Route 1 is an arterial road with more traffic, signalized intersections, etc. On the other hand, both Route 2 and Route 3 are freeways.
6.2. Traffic Signs Rating
The drivers were asked to rate the signs used on each route based on how useful they were to the driver. The rating used the following scale (poor–average–good–very good). To get the average rating for each route, options were rated from 1–4, 1 being the lowest (poor), and 4 being the highest (very good). Based on this analysis, signs were rated, as shown in
Table 6. Route 2 has the highest rating of 3.8, followed by Route 3 with a rating of 2.8, and finally Route 1 with a rating of 2.3.
6.3. Recall and Recognition
Drivers were asked in the post-trip questionnaire to recall how many signs they have witnessed while driving on each route. From the results shown in
Table 6, it is noticed that the directional signs were recalled in Route 1, while there were not any actual directional signs on that route. DMS is the most accurate recalled sign, with an average of 77.1% of the actual number. Similarly, speed signs’ average recall was 72.6% of the actual.
6.4. Driver Compliance
From the post-trip questionnaire, drivers were asked if they think they have followed the different signs on each route. The results are summarized in
Table 6. It should be noted that DMS and LCS are installed only on Route 2. Hence, there is no data for compliance on Route 1 and Route 3. LCS were the most followed type of sign, with an average of 84.4% being followed. Schaefer et al. [
18] found that drivers’ compliance to LCS was higher in low to medium traffic conditions. As mentioned earlier, all experiment drives were conducted in low to medium traffic conditions. With regards to speed limit signs, they are the second most followed signs. It was noticed that speed signs were less followed in Route 3 compared to Route 1 and Route 2, with 71.9% on Route 1, 65.6% on Route 2, and 53.1% on Route 3. It should be noted that Route 2 and Route 3 have the same type of highway and an extension of each other.
The only difference between Route 2 and Route 3 is the presence of ITS, mostly DMS and LCS. The reason drivers did not follow speed limit signs can be due to drivers feeling safe on the route. With regards to DMS and directional signs, they were followed by 59.4% and 40.6%, respectively. With regards to speed compliance, average speeds were below the speed limit on Route 1 and Route 2. There are over-speeding incidents that were reported on all routes. However, results found that the average speeds on Route 3 are above the speed limit of 80 km/h. It’s noted that only Route 1 is enforced with speed cameras.
7. Discussion
The results showed that the introduction of DMS and LCS had no significant impact on speed compliance. With regards to journey comfort, it is concluded based on the analysis that the LCS and DMS did not have a major effect on driver behavior variables such as harsh braking and lane changing but were beneficial in drivers’ opinion and driver behavior in steering wheel control level. Additionally, it was found that drivers’ compliance was highest towards LCS, followed by speed limit signs, then DMS, then static directional signs. The results also concluded that drivers would follow static speed limit signs when there is a contradiction between the static and dynamic signs.
Speed was measured using three methods: average speed, spot speed, and flow speed. Due to the road layouts and classifications, the computed average speed in Route 1 is lower than in Route 2 and Route 3, which is caused by the vehicle stopping at intersections. Hence, the average speed is highly different from spot speed and flow speed. Because flow speed was measured at midpoints between two intersections in Route 1 and to counter this effect, spot speed was introduced. Overall, drivers were below the maximum allowed speed (posted speed) on Route 1. For the freeway section, participants’ average speed and traffic flow speed on Route 2 and Route 3 were above the posted speed. It is important to note that Route 2 and Route 3 are not speed enforced, while Route 1 is enforced using speed cameras. Previous studies have demonstrated that DMS have a positive effect on drivers’ compliance to speed. Xu et al. [
36] found that introducing DMS in the same corridor can reduce over-speeding occurrences. However, in this study, it was found that the LCS and DMS had no major effect on speed compliance.
With regard to lane changing, results showed that Route 2 has the lowest number of lane change occurrences per kilometer. However, the result in Route 2 is close to Route 3. Hence, the implementation of LCS may not have an effect on lane changing. However, the use of turn-signaling indicators was recorded, and results show that drivers were using signaling most on Route 2, followed by Route 1, then Route 3, with 55.7%, 54.4%, and 36.5% respectively. Therefore, it can be concluded that the introduction of LCS and DMS had a positive effect on traffic safety.
Journey comfort is an important element that was compared between the three routes. A comparison was made with regards to the number of harsh braking incidents, hand position on the steering wheel, self-reported mental effort, and participant rating of traffic signs. Harsh braking was found to be most on Route 1, followed by Route 2 and Route 3. The results show that there is no significant difference between Route 2 and Route 3. Hence, it is concluded that DMS and LCS did not affect harsh braking.
The position of the hands can indicate the driver’s comfort. According to the results, Route 2 had the lowest percentage of “High Control” position, followed by Route 3, then Route 1. Moreover, the driver’s opinion and self-reporting were considered. Route 2 and Route 3 had the same SRME of 1.6, which was lower than Route 1, which was 2.9. Finally, participants rated the traffic signs. Route 2 was rated highest with an average of 3.8, followed by Route 3 with a rating of 2.8, and finally Route 1 with a rating of 2.3 out of 5.
Lastly, participants’ self-reported compliance with following traffic signs instructions was recorded. Results show that 59.4% of participants stated they followed DMS instructions, while 84.4% followed LCS signs. These results are in line with the findings of previous studies. Schaefer et al. [
18] found that LCS will be beneficial in low and medium traffic conditions. In this study, all driving attempts were conducted in low and medium traffic conditions. Furthermore, Wu and Liang [
15] found that a well-placed DMS can increase drivers’ compliance and reduce travel time. With regards to speed static signs, an average of 63.5% of participants following in all three routes. It should be noted that speed limit signs compliance was higher on Route 1. Furthermore, 40.6% of participants stated they followed directional signs. These results can be an indication that drivers tend to follow dynamic signs more than static signs.
8. Conclusions
A driving experiment was conducted to study driver behavior along three routes, with a total of 11.5 km. Route 1 is an urban arterial road with three signalized intersections, while Route 2 and Route 3 were classified as urban freeways. However, Route 2 was supported with ITS infrastructure, including DMS and LCS, while Route 3 did not have any ITS elements. The findings revealed that the implementation of DMS and LCS had no significant effect on speed compliance. The findings also revealed that LCS and DMS had no significant impact on driver behavior characteristics such as hard braking and lane changes. It should be noted that the many differences between the complex types of routes may affect and explain some of the unexpected results.
The results can be beneficial for public agencies and policymakers in Qatar and other high-income countries in the region such as Bahrain, Kuwait, United Arab Emirates, Oman, and Saudi Arabia. These countries are rebuilding their infrastructure and expanding it. Therefore, there is a need to know the most suitable ITS to be implemented
The study had some limitations. The limited sample size was a significant limitation of the study. Some similar studies used a larger sample size [
42,
43]. However, this was not possible in this study. Due to the small sample size available, extensive statistical analysis could not be completed. A future study involving a larger sample size is needed to conduct a more detailed statistical analysis and validate the results.
The chosen routes are fairly new and may not have all the functions of the DMS and LCS currently in operation. In addition, the participants were not using their vehicles, which may affect their driving behavior since they are new to the vehicle. Furthermore, since this is not a simulation experiment, there was no control over the dynamic messages. They were based on the signs at the time of the study.
Moreover, the driver behavior in this study focused on one corridor. Future studies in Qatar should consider different locations and other types of roads. Furthermore, studies in Qatar need to compare the methods of delivery of traffic-related information, i.e., traffic condition ahead, such as DMS, car navigation systems, and mobile phone applications. It is important to know which method is a better or more trustworthy source for the drivers instead of investing in infrastructure projects.
The co-location of many dynamic and static signs on the same gantry has been highlighted as undesirable. However, it is not clear what is the amount of information that can be provided to the drivers and maintain a safe environment. Future studies in Qatar can quantify the number of information and also study the desired text height. Finally, similar studies about driver behavior with respect to DMS and LCS signs in other countries in the region need to be conducted.
Author Contributions
Conceptualization, K.S. and M.A.; methodology, K.S. and M.A.; validation, K.S. and M.A.; formal analysis, K.S. and M.A.; data curation, K.S. and M.A.; writing—original draft preparation, K.S. and M.A.; writing—review and editing, K.S. and M.A.; visualization, K.S. and M.A.; supervision, K.S. All authors have read and agreed to the published version of the manuscript.
Funding
This research received no external funding.
Institutional Review Board Statement
All participants were anonymous in the data logs, and their data are not linked to their personal identifications. For this type of study, formal consent is not required per the guidelines on the use of human subjects issued by the Qatar Supreme Council of Health.
Informed Consent Statement
Informed consent was obtained from all subjects involved in the study.
Data Availability Statement
The data used to support the findings of this study are available from the corresponding author upon request.
Conflicts of Interest
The authors declare no conflict of interest.
References
- Shaaban, K.; Elamin, M.; Alsoub, M. Intelligent Transportation Systems in a Developing Country: Benefits and Challenges of Implementation. Transp. Res. Procedia 2021, 55, 1373–1380. [Google Scholar] [CrossRef]
- Shaaban, K.; Adalbi, M.A. Smart City Transportation System in Developing Countries: The Case of Lusail City, Qatar. In Proceedings of the International Conference on Applied Human Factors and Ergonomics, San Francisco, CA, USA, 25–29 July 2021; Springer: Berlin/Heidelberg, Germany, 2021; pp. 445–452. [Google Scholar]
- Kassens-Noor, E.; Savolainen, P.T.; Gates, T.J.; Cai, M.; Deaminada, T. Communicating safety with drivers via dynamic message signs. Transp. Res. Part F Traffic Psychol. Behav. 2021, 81, 417–430. [Google Scholar] [CrossRef]
- Diop, E.B.; Zhao, S.; Duy, T.V. An extension of the technology acceptance model for understanding travelers’ adoption of variable message signs. PLoS ONE 2019, 14, e0216007. [Google Scholar] [CrossRef] [PubMed]
- Poulopoulou, M.; Spyropoulou, I. Active traffic management in urban areas: Is it effective for professional drivers? The case of variable message signs. Transp. Res. Part A Policy Pract. 2019, 130, 412–423. [Google Scholar] [CrossRef]
- Tejero, P.; Roca, J. Messages beyond the phone: Processing variable message signs while attending hands-free phone calls. Accid. Anal. Prev. 2021, 150, 105870. [Google Scholar] [CrossRef]
- Lucas, A.; Montoro, L. Some critical remarks on a new traffic system: VMS Part II. In The Human Factors of Transport Signs; CRC Press: Boca Raton, FL, USA, 2004; pp. 199–212. [Google Scholar]
- Montoro, L.; Lucas, A.; Blanch, M.T. Specific design parameters: VMS part I. In The Human Factors of Transport Signs; CRC Press: Boca Raton, FL, USA, 2004; pp. 185–198. [Google Scholar]
- Reinolsmann, N.; Alhajyaseen, W.; Brijs, T.; Pirdavani, A.; Hussain, Q.; Brijs, K. Investigating the impact of dynamic merge control strategies on driving behavior on rural and urban expressways–A driving simulator study. Transp. Res. Part F Traffic Psychol. Behav. 2019, 65, 469–484. [Google Scholar] [CrossRef]
- Khattak, Z.H.; Smith, B.L.; Park, H.; Fontaine, M.D. Cooperative lane control application for fully connected and automated vehicles at multilane freeways. Transp. Res. Part C Emerg. Technol. 2020, 111, 294–317. [Google Scholar] [CrossRef]
- Lin, P.-W.; Kang, K.-P.; Chang, G.-L. Exploring the effectiveness of variable speed limit controls on highway work-zone operations. J. Intell. Transp. Systems. 2004, 8, 155–168. [Google Scholar] [CrossRef]
- Khondaker, B.; Kattan, L. Variable speed limit: An overview. Transp. Lett. 2015, 7, 264–278. [Google Scholar] [CrossRef]
- Bertini, R.L.; Boice, S.; Bogenberger, K. Dynamics of variable speed limit system surrounding bottleneck on german autobahn. Transp. Res. Rec. 2006, 1978, 149–159. [Google Scholar] [CrossRef]
- Rämä, P.; Kulmala, R. Effects of variable message signs for slippery road conditions on driving speed and headways. Transp. Res. Part F Traffic Psychol. Behav. 2000, 3, 85–94. [Google Scholar] [CrossRef]
- Wu, Z.; Liang, Y. Variable Message Sign Location Selection Basing on Drivers’ Perception. Transp. Res. Procedia 2017, 25, 1745–1754. [Google Scholar] [CrossRef]
- Zavareh, M.F.; Mamdoohi, A.R.; Nordfjærn, T. The effects of indicating rear-end collision risk via variable message signs on traffic behaviour. Transp. Res. Part F Traffic Psychol. Behav. 2017, 46, 524–536. [Google Scholar] [CrossRef]
- Harms, I.M.; Dijksterhuis, C.; Jelijs, B.; de Waard, D.; Brookhuis, K.A. Don’t shoot the messenger: Traffic-irrelevant messages on variable message signs (VMSs) might not interfere with traffic management. Transp. Res. Part F Traffic Psychol. Behav. 2018, 65, 564–575. [Google Scholar] [CrossRef]
- Schaefer, L.; Upchurch, J.; Ashur, S. An evaluation of freeway lane control signing using computer simulation. Math. Comput. Model. 1998, 27, 177–187. [Google Scholar] [CrossRef]
- Wang, Y.; Chang, H.; Ioannou, P.A. Lane Change Guidance for Freeway Incident Management. IFAC Proc. Vol. 2009, 42, 7–11. [Google Scholar] [CrossRef]
- Zhang, Y.; Ioannou, P.A. Coordinated variable speed limit, ramp metering and lane change control of highway traffic. IFAC-PapersOnLine 2017, 50, 5307–5312. [Google Scholar] [CrossRef]
- Shaaban, K.; Shakeel, K.; Rashidi, T.H.; Kim, I. Measuring users’ satisfaction of the road network using structural equation modeling. Int. J. Sustain. Transp. 2021. [Google Scholar] [CrossRef]
- Shaaban, K.; Muley, D.; Elnashar, D. Temporal variation in walking behavior: An empirical study. Case Stud. Transp. Policy 2017, 5, 671–680. [Google Scholar] [CrossRef]
- Shaaban, K. Why Don’t People Ride Bicycles in High-Income Developing Countries, and Can Bike-Sharing Be the Solution? The Case of Qatar. Sustainability 2020, 12, 1693. [Google Scholar] [CrossRef]
- Shaaban, K.; Abdur-Rouf, K. Assessing Walking and Cycling around Schools. Sustainability 2020, 12, 10607. [Google Scholar] [CrossRef]
- Elhassy, Z.; Abou-Senna, H.; Shaaban, K.; Radwan, E. The Implications of Converting a High-Volume Multilane Roundabout into a Turbo Roundabout. J. Adv. Transp. 2020, 2020, 5472806. [Google Scholar] [CrossRef]
- Tageldin, A.; Sayed, T.; Shaaban, K.; Zaki, M. Automated Analysis and Validation of Right-Turn Merging Behavior. J. Transp. Saf. Secur. 2015, 7, 138–152. [Google Scholar] [CrossRef]
- Shaaban, K.; Hamad, H. Critical Gap Comparison between One-, Two-, and Three-Lane Roundabouts in Qatar. Sustainability 2020, 12, 4232. [Google Scholar] [CrossRef]
- Shaaban, K.; Abou-Senna, H.; Elnashar, D.; Radwan, E. Assessing the impact of converting roundabouts to traffic signals on vehicle emissions along an urban arterial corridor in Qatar. J. Air Waste Manag. Assoc. 2019, 69, 178–191. [Google Scholar] [CrossRef] [PubMed]
- Abdur-Rouf, K.; Shaaban, K. Development of prediction models of transportation noise for roundabouts and signalized intersections. Transp. Res. Part D Transp. Environ. 2022, 103, 103174. [Google Scholar] [CrossRef]
- Shaaban, K.; Abouzaid, A. Assessment of Traffic Noise Near Schools in a Developing Country. Transp. Res. Procedia 2021, 55, 1202–1207. [Google Scholar] [CrossRef]
- Shaaban, K. Challenges and Lessons Learned from Building a New Road Drainage System in a Developing Country. In Proceedings of the 2022 Intermountain Engineering, Technology and Computing (IETC), Orem, UT, USA, 13–14 May 2022; pp. 1–4. [Google Scholar]
- Ghanem, M.; Shaaban, K. Determinants of memorable sightseeing bus-tour experiences: Identifying and evaluating destination related attributes. Tour. Hosp. Res. 2022, 22, 209–225. [Google Scholar] [CrossRef]
- Guattari, C.; De Blasiis, M.R.; Calvi, A. The effectiveness of variable message signs information: A driving simulation study. Procedia-Soc. Behav. Sci. 2012, 53, 692–702. [Google Scholar] [CrossRef]
- Dutta, A.; Fisher, D.L.; Noyce, D.A. Use of a driving simulator to evaluate and optimize factors affecting understandability of variable message signs. Transp. Res. Part F Traffic Psychol. Behav. 2004, 7, 209–227. [Google Scholar] [CrossRef]
- Lyu, N.; Deng, C.; Xie, L.; Wu, C.; Duan, Z. A field operational test in China: Exploring the effect of an advanced driver assistance system on driving performance and braking behavior. Transp. Res. Part F Traffic Psychol. Behav. 2019, 65, 730–747. [Google Scholar] [CrossRef]
- Xu, W.; Zhao, X.; Chen, Y.; Bian, Y.; Li, H. Research on the Relationship between Dynamic Message Sign Control Strategies and Driving Safety in Freeway Work Zones. J. Adv. Transp. 2018, 2018, 9593084. [Google Scholar] [CrossRef]
- Vrieling, J.; de Waard, D.; Brookhuis, K. Driving behaviour while driving through two types of road works. Int. J. Traffic Transp. Eng. 2014, 3, 141–148. [Google Scholar]
- Son, J.; Park, M.; Park, B.B. The effect of age, gender and roadway environment on the acceptance and effectiveness of Advanced Driver Assistance Systems. Transp. Res. Part F Traffic Psychol. Behav. 2015, 31, 12–24. [Google Scholar] [CrossRef]
- Zheng, Y.; Chase, T.; Elefteriadou, L.; Schroeder, B.; Sisiopiku, V.P. Modeling vehicle–pedestrian interactions outside of crosswalks. Simul. Model. Pract. Theory 2015, 59, 89–101. [Google Scholar] [CrossRef]
- Gilandeh, S.S.; Hosseinlou, M.H.; Anarkooli, A.J. Examining bus driver behavior as a function of roadway features under daytime and nighttime lighting conditions: Driving simulator study. Saf. Sci. 2018, 110, 142–151. [Google Scholar] [CrossRef]
- van Huysduynen, H.H.; Terken, J.; Eggen, B. The relation between self-reported driving style and driving behaviour. A simulator study. Transp. Res. Part F Traffic Psychol. Behav. 2018, 56, 245–255. [Google Scholar] [CrossRef]
- Pérez-Zuriaga, A.M.; Camacho-Torregrosa, F.J.; Campoy-Ungría, J.M.; García, A. Application of global positioning system and questionnaires data for the study of driver behaviour on two-lane rural roads. IET Intell. Transp. Syst. 2013, 7, 182–189. [Google Scholar] [CrossRef]
- Ma, Y.; Tang, K.; Chen, S.; Khattak, A.J.; Pan, Y. On-line aggressive driving identification based on in-vehicle kinematic parameters under naturalistic driving conditions. Transp. Res. Part C Emerg. Technol. 2020, 114, 554–571. [Google Scholar] [CrossRef]
| Publisher’s Note: MDPI stays neutral with regard to jurisdictional claims in published maps and institutional affiliations. |
© 2022 by the authors. Licensee MDPI, Basel, Switzerland. This article is an open access article distributed under the terms and conditions of the Creative Commons Attribution (CC BY) license (https://creativecommons.org/licenses/by/4.0/).


