
Direct Method to Design Solar Photovoltaics to Reduce Energy Consumption of Aeration Tanks in Wastewater Treatment Plants


Abstract
:1. Introduction
2. Materials and Methods
2.1. Materials
2.1.1. Reference Data
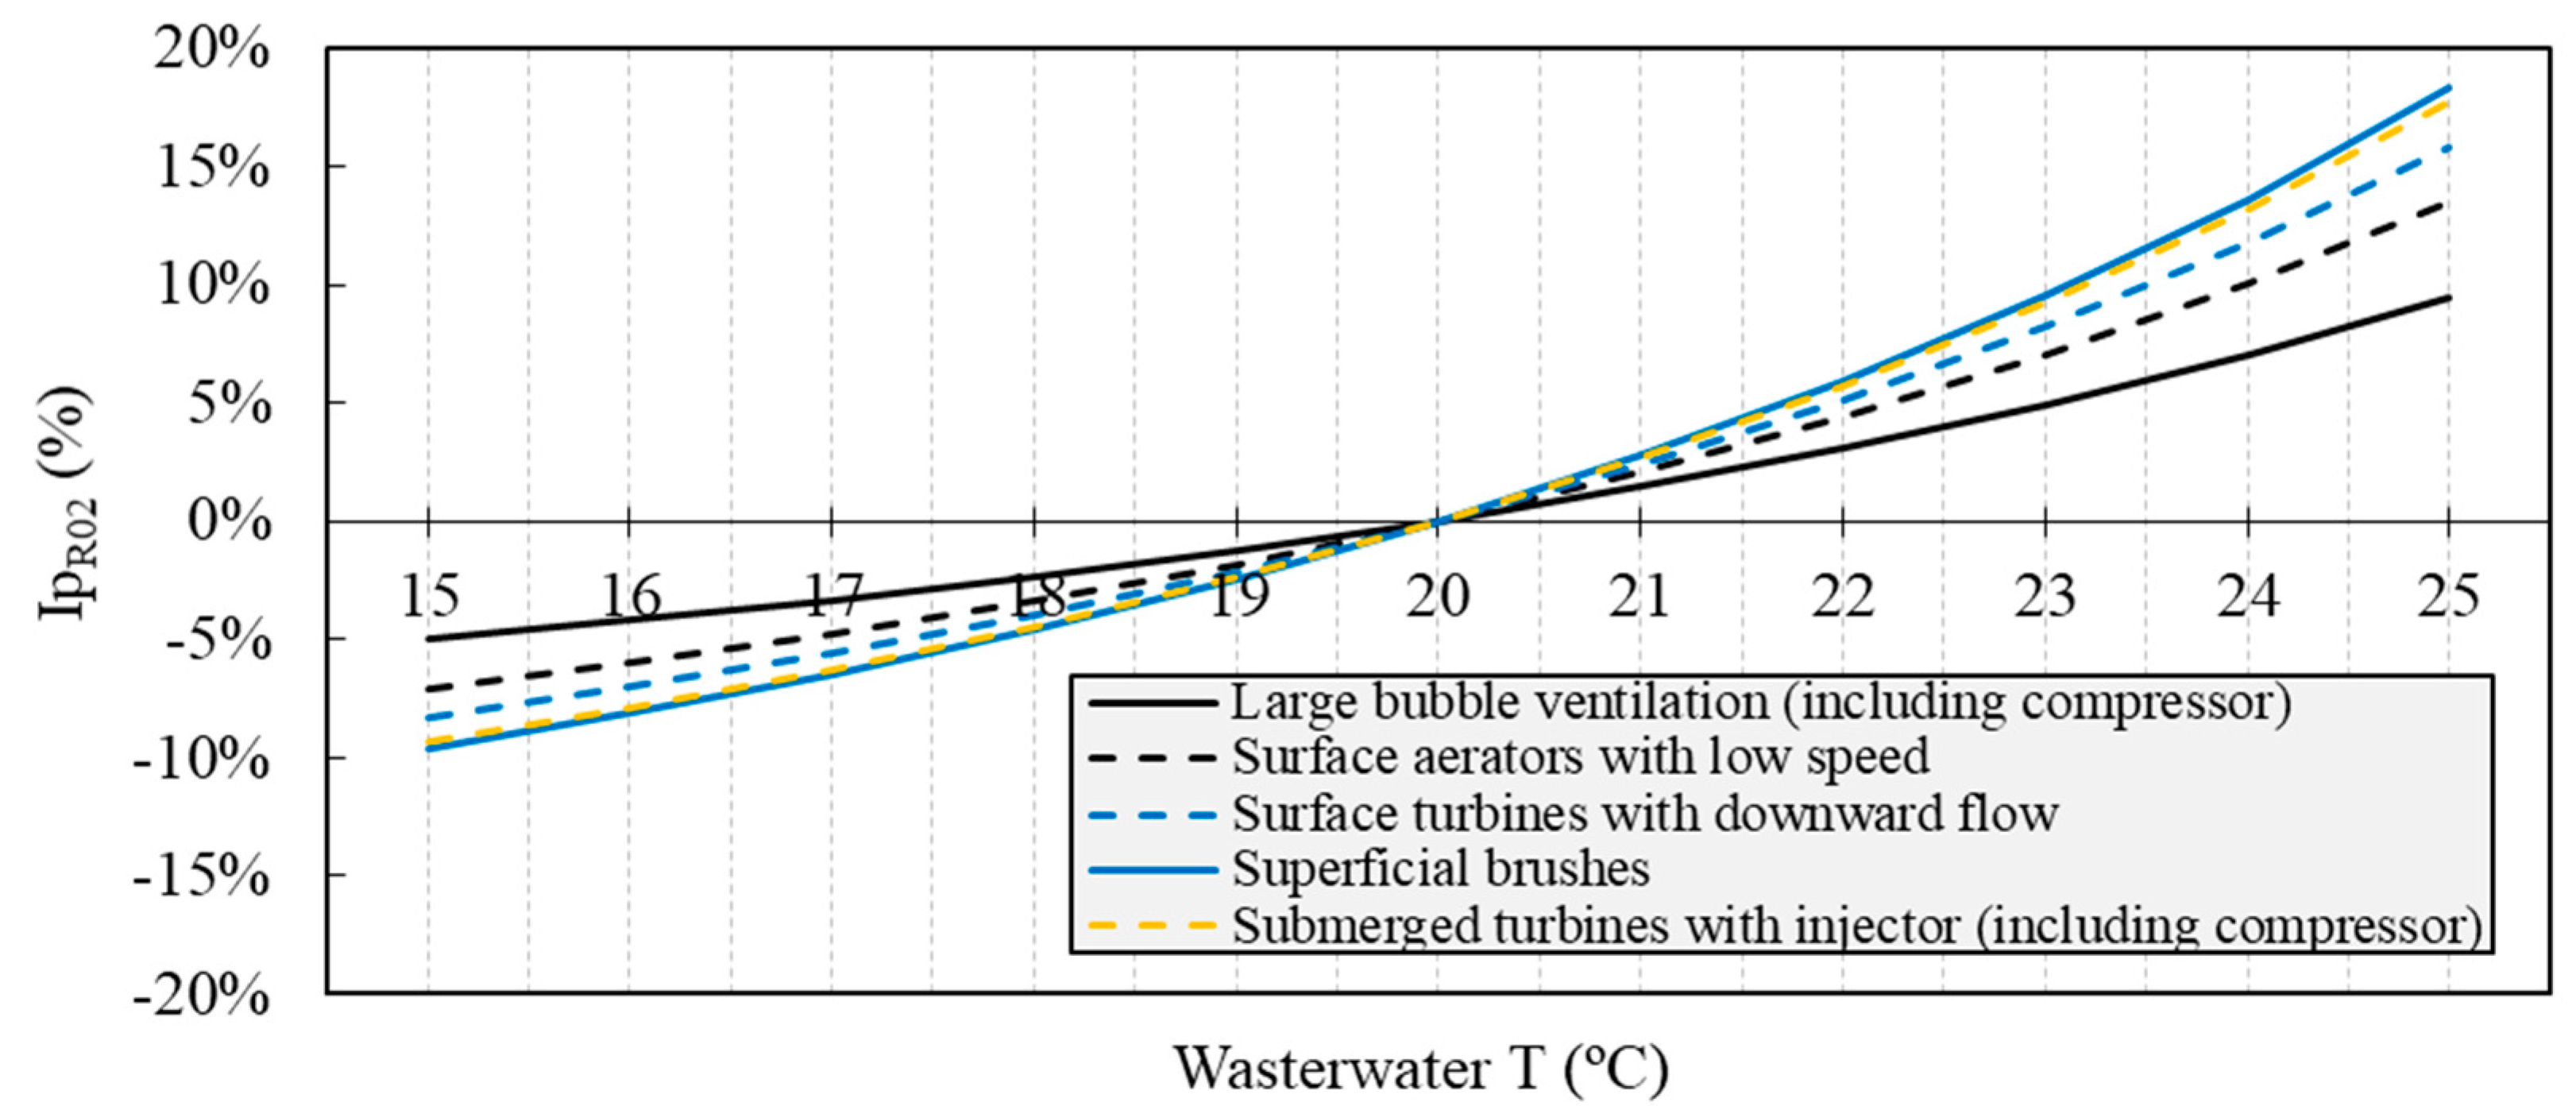
2.1.2. Oxygen and Temperature Role
2.2. Methodology
3. Analyses and Results
4. Conclusions
Author Contributions
Funding
Institutional Review Board Statement
Informed Consent Statement
Data Availability Statement
Acknowledgments
Conflicts of Interest
References
- Sharadga, H.; Hajimirza, S.; Balog, R.S. Time series forecasting of solar power generation for large-scale photovoltaic plants. Renew. Energy 2020, 150, 797–807. [Google Scholar] [CrossRef]
- Nairn, C.; Rodriguez, I.; Segura, Y.; Molina, R.; Gonzalez-Benitez, N.; Molina, M.C.; Simarro, R.; Melero, J.A.; Martinez, F.; Puyol, D. Alkalinity, and not the oxidation state of the organic substrate, is the key factor in domestic wastewater treatment by mixed cultures of purple phototrophic bacteria. Resources 2020, 9, 88. [Google Scholar] [CrossRef]
- Deep Purple Project. Available online: https://deep-purple.eu/ (accessed on 1 June 2021).
- Chakraborty, S. Reliable energy prediction method for grid connected photovoltaic power plants situated in hot and dry climatic condition. SN Appl. Sci. 2020, 2, 1–13. [Google Scholar] [CrossRef] [Green Version]
- Sampaio, P.G.V.; Gonzalez, M.O.A. Photovoltaic solar energy: Conceptual framework. Renew. Sustain. Energy Rev. 2017, 74, 590–601. [Google Scholar] [CrossRef]
- Serralta, J.; Ribes, J.; Seco, A.; Ferrer, J. A supervisory control system for optimising nitrogen removal and aeration energy consumption in wastewater treatment plants. Water Sci. Technol. 2002, 45, 309–316. [Google Scholar] [CrossRef]
- Krzeminski, P.; Iglesias-Obelleiro, A.; Madebo, G.; Garrido, J.M.; van der Graaf, J.H.J.M.; van Lier, J.B. Impact of temperature on raw wastewater composition and active sludge filterability in full-scale MBR systems for municipal sewage treatment. J. Membr. Sci. 2012, 423-424, 348–361. [Google Scholar] [CrossRef]
- Gallé, T.; Koehler, C.; Plattes, M.; Pittois, D.; Bayerle, M.; Carafa, R.; Christen, A.; Hansen, J. Large-scale determination of micropollutant elimination from municipal wastewater by passive sampling gives new insights in governing parameters and degradation patterns. Water Res. 2019, 160, 380–393. [Google Scholar] [CrossRef] [PubMed]
- Rizzo, L.; Gernjak, W.; Krzeminski, P.; Malato, S.; McArdell, C.S.; Sanchez Perez, J.A.; Schaar, H.; Fatta-Kassinos, D. Best available technologies and treatment trains to address current challenges in urban wastewater reuse for irrigation of corps in EU countries. Sci. Total Environ. 2020, 710, 1–17. [Google Scholar] [CrossRef]
- Khan, S.A.R.; Ponce, P.; Yu, Z.; Golpira, H.; Mathew, M. Environmental technology and wastewater treatment: Strategies to achieve environmental sustainability. Chemosphere 2022, 286, 1–10. [Google Scholar] [CrossRef] [PubMed]
- Strazzabosco, A.; Kenway, S.J.; Lant, P.A. Quantification of renewable electricity generation in the Australian water industry. J. Clean. Prod. 2020, 254, 120119. [Google Scholar] [CrossRef] [Green Version]
- Colacicco, A.; Zacchei, E. Optimization of energy consumptions of oxidation tanks in urban wastewater treatment plants with solar photovoltaic systems. J. Environ. Manag. 2020, 276, 111353. [Google Scholar] [CrossRef]
- Alvarez-Guerra, E.; Dominguez-Ramos, A.; Irabien, A. Photovoltaic solar electro-oxidation (PSEO) process for wastewater treatment. Chem. Eng. J. 2011, 170, 7–13. [Google Scholar] [CrossRef]
- Rosa-Clot, M.; Tina, G.M.; Nizetic, S. Floating photovoltaic plants and wastewater basins: An Australian project. Energy Procedia 2017, 134, 664–674. [Google Scholar] [CrossRef]
- Wu, W.; Christiana, V.I.; Chen, S.A.; Hwang, J.J. Design and techno-economic optimization of a stand-alone PV (photovoltaic)/FC (fuel cell)/battery hybrid power system connected to a wastewater-to-hydrogen processor. Energy 2015, 84, 462–472. [Google Scholar] [CrossRef]
- Ganiyu, S.O.; Brito, L.R.D.; da Araújo Costa, E.C.T.; dos Santos, E.V.; Martínez-Huitle, C.A. Solar photovoltaic-battery system as a green energy for driven electrochemical wastewater treatment technologies: Application to elimination of brilliant blue FCF dye solution. J. Environ. Chem. Eng. 2019, 7, 102924. [Google Scholar] [CrossRef]
- Valero, D.; Ortiz, J.M.; Exposito, E.; Montiel, V.; Aldaz, A. Electrochemical wastewater treatment directly powered by photovoltaic panels: Electrooxidation of a dye-containing wastewater. Environ. Sci. Technol. 2010, 44, 5182–5187. [Google Scholar] [CrossRef] [PubMed]
- Strazzabosco, A.; Kenway, S.J.; Lant, P.A. Solar PV adoption in wastewater treatment plants: A review of practice in California. J. Environ. Manag. 2019, 248, 109337. [Google Scholar] [CrossRef]
- Andrei, H.; Badea, C.A.; Andrei, P.; Spertino, F. Energic-environmental-economic feasibility and impact assessment of grid-connected photovoltaic system in wastewater treatment plant: Case study. Energies 2021, 14, 100. [Google Scholar] [CrossRef]
- Mou, Y.; Xia, Y.; Zhang, S.; He, Y.; Shen, W.; Li, J. Aniline removed from simulated wastewater by electro-Fenton process using electric energy from photovoltaic modules. Desalination Water Treat. 2022, 247, 173–183. [Google Scholar] [CrossRef]
- Marmanis, D.; Emmanouil, C.; Fantidis, J.G.; Thysiadou, A.; Marmani, K. Description of a Fe/Al electrocoagulation method powered by a photovoltaic system, for the (ore-)treatment of municipal wastewater of a small community in Northern Greece. Sustainability 2022, 14, 4323. [Google Scholar] [CrossRef]
- Clerici, A. Efficienza energetica nel settore idrico. In Proceedings of the Efficienza Energetica—Tutela Dell’Ambiente, Opportunità di Crescita, Technical Workshop, Milan, Italy, 12 September 2011. [Google Scholar]
- Vaccari, M. Il consumo energetico negli impianti di depurazione. In Proceedings of the Il Consumo di Energia Elettrica Negli Impianti di Depurazione: Opportunità di Risparmio, Meeting, Rimini, Italy, 8 November 2012. [Google Scholar]
- Di Domenico, S. Analisi Delle Fognature e Relative Applicazioni Energetiche. Bachelor Dissertation, University of Bologna, Bologna, Italy, 2010; p. 176. [Google Scholar]
- United Nations (UN). Transforming Our World: The 2030 Agenda for Sustainable Development; Technical Report A/RES/70/1; United Nations (UN): New York, NY, USA, 2015; p. 35. [Google Scholar]
- Directive 2000/60/EC, European Parliament and of the Council, A Framework for Community Action in the Field of Water Policy, OJ L 327, 22.12.2000, p. 73. 2000. Available online: https://eur-lex.europa.eu/legal-content/EN/TXT/?uri=CELEX%3A32000L0060 (accessed on 1 August 2020).
- Zhang, H.; Gong, W.; Bai, L.; Chen, R.; Zeng, W.; Yan, Z.; Li, G.; Liang, H. Aeration-induced CO2 stripping, instead of high dissolved oxygen, have a negative impact on algae-bacteria symbiosis (ABS) system stability and wastewater treatment efficiency. Chem. Eng. J. 2020, 382, 122957. [Google Scholar] [CrossRef]
- Liu, G.; Wang, J.; Campbell, K. Formation of filamentous microorganisms impedes oxygen transfer and decreases aeration efficiency for wastewater treatment. J. Clean. Prod. 2018, 189, 502–509. [Google Scholar] [CrossRef]
- Pennsylvania Department of Environmental Protection. The Activated Sludge Process, Part II, Module 16, Wastewater Treatment Plant, Operator, Certification Training; Pennsylvania Department of Environmental Protection: Harrisburg, PA, USA, 2014; p. 114.
- Capuano, M. Modello di Calcolo Diagnostico del Comparto di Aerazione in un Impianto di Depurazione Delle Acque Reflue Civili a Scala Reale. Master’s Dissertation, Polytechnic of Torino, Torino, Italy, 2018; p. 164. [Google Scholar]
- Gillot, S.; Héduit, A. Effect of air flow rate on oxygen transfer in an oxidation ditch equipped with fine bubble diffusers and slow speed mixers. Water Res. 2000, 34, 1756–1762. [Google Scholar] [CrossRef]
- Lu, J.H.; Lei, H.Y.; Dai, C.S. Analysis of Henry’s law and a unified lattice Boltzmann equation for conjugate mass transfer problem. Chem. Eng. Sci. 2019, 199, 319–331. [Google Scholar] [CrossRef]
- Mizuta, K.; Shimada, M. Benchmarking energy consumption in municipal wastewater treatment plants in Japan. Water Sci. Technol. 2010, 62, 2256–2262. [Google Scholar] [CrossRef] [PubMed]
- Campanelli, M.; Foladori, P.; Vaccari, M. Consumi Elettrici ed Efficineza Energetica del Trattamento Delle Acque Reflue; Maggioli Editore: Santarcangelo di Romagna, Italy, 2013; p. 391. [Google Scholar]
- PVGIS. Photovoltaic Geographical Information System. Database. 2020. Available online: https://ec.europa.eu/jrc/en/pvgis (accessed on 1 January 2020).


| Parameter | Value |
|---|---|
| Active breathing coefficient, a | 0.65 (Equation (1)) a |
| Biochemical oxygen demand, BOD5 | 0.8 kgBOD5 b |
| Endogenous respiration coefficient, cT | 0.09–0.19 (Equation (2)) c |
| Volatile suspended solids, VSS | 4.0 kgVSS [12] |
| Correction factor, α | 0.80 [30] |
| Aerators fouling factor, F | 0.90 [12] |
| Correction factor, β | 1.0 [30] |
| Standard aeration efficiency, SAE20° | 1.55–3.0 kgO2/kWh [34] d |
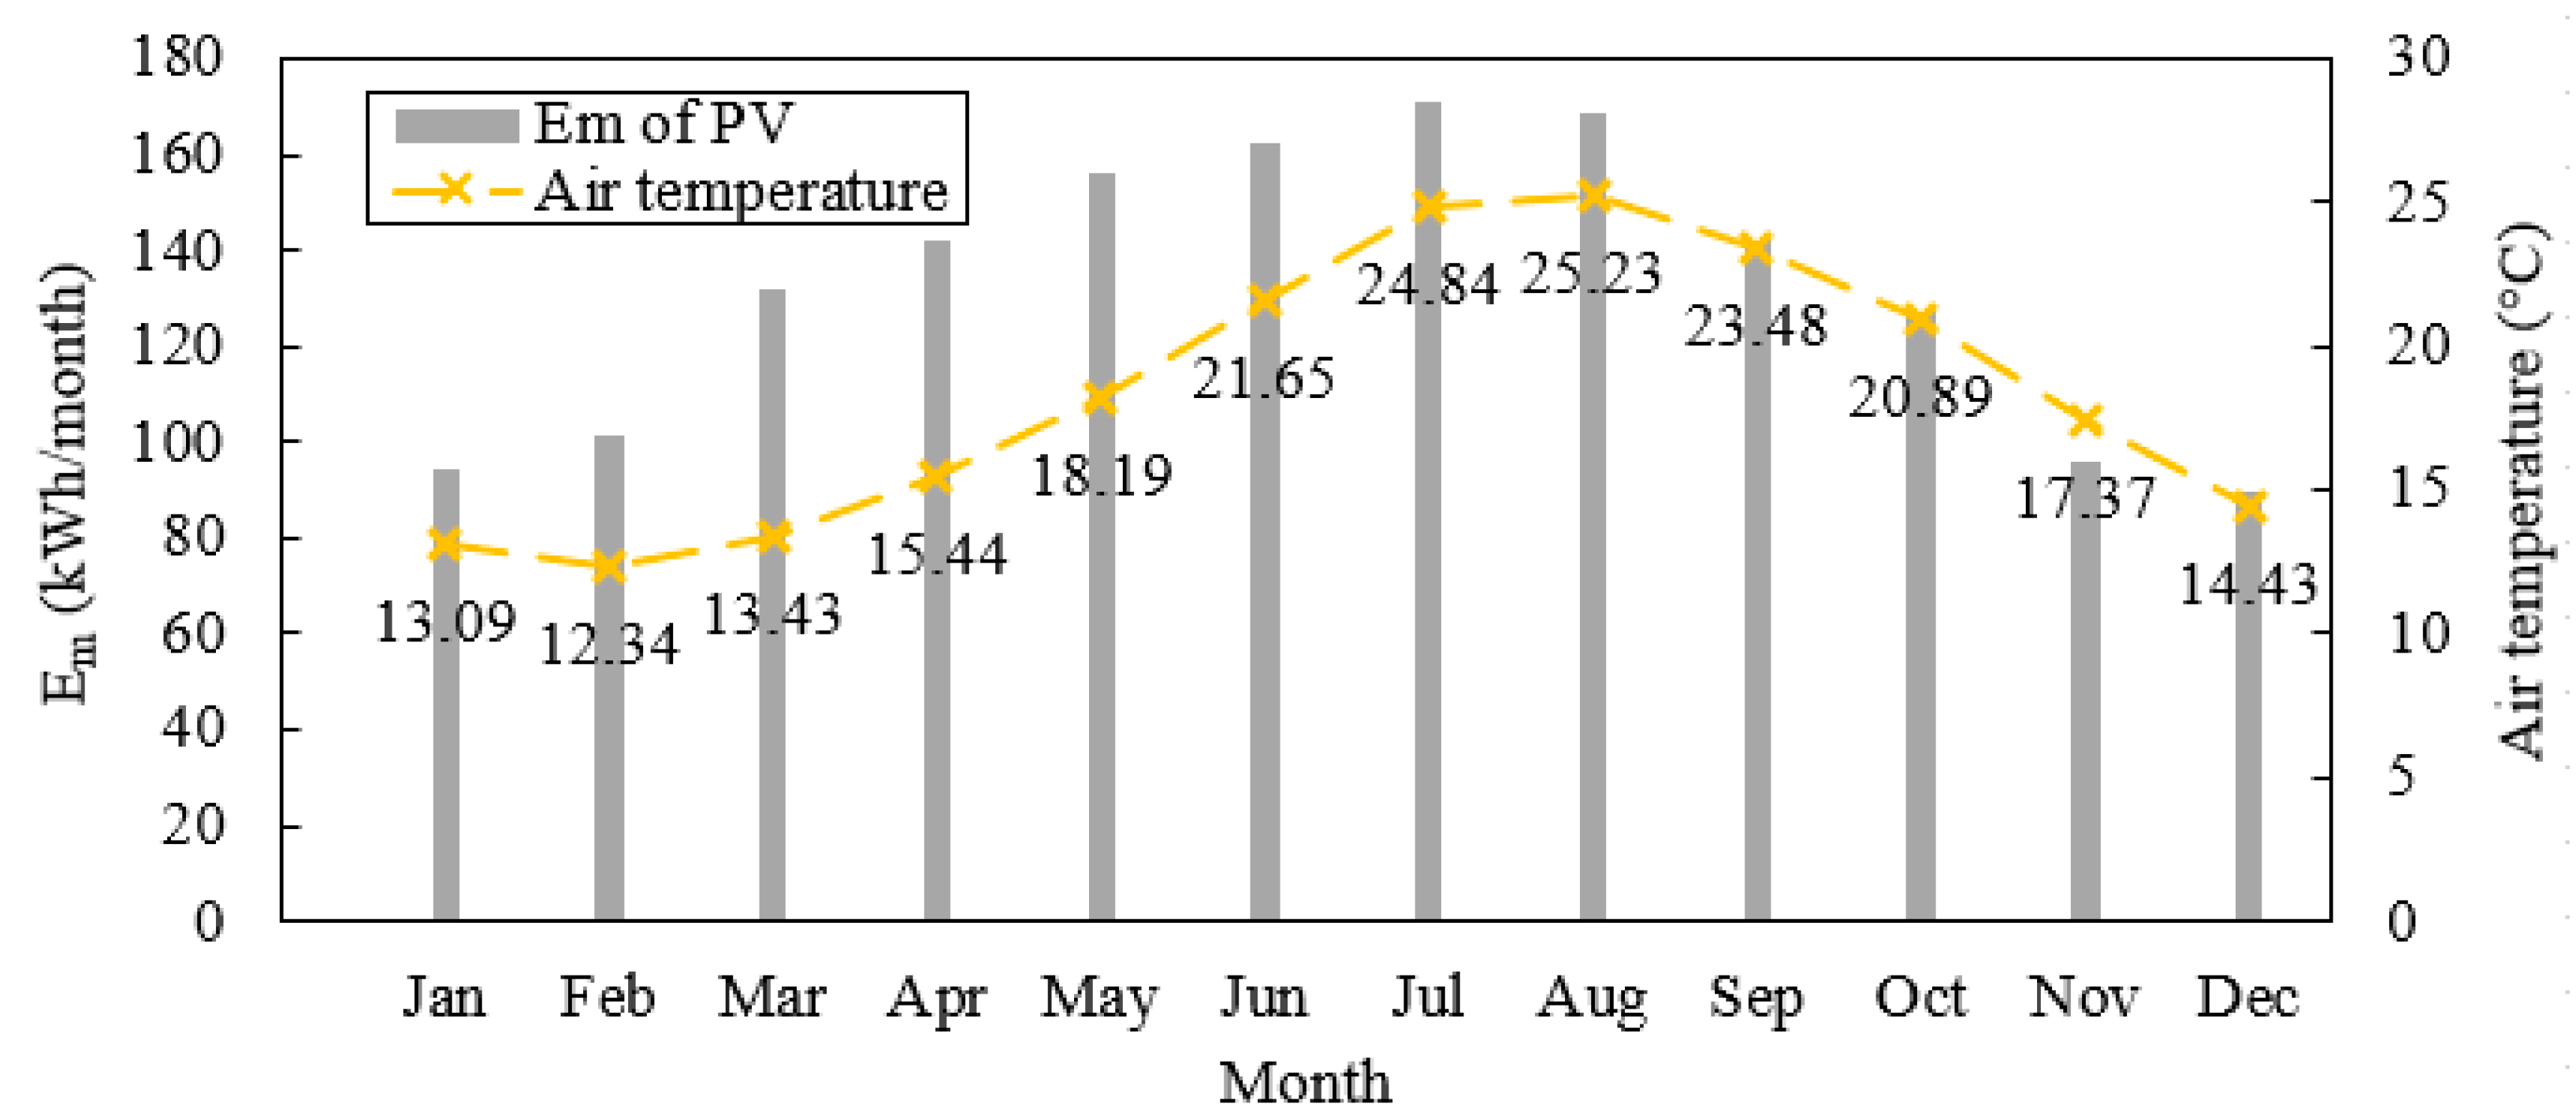
| Month | Ed (kWh/d) | Em (kWh/m) (Figure 5 and Figure 6) | H(i)d (kWh/m2/d) | H(i)m kWh/m2/m) | ±σm (kWh) |
|---|---|---|---|---|---|
| 1 (January) | 3.05 | 94.57 | 3.65 | 113.01 | 9.44 |
| 2 | 3.62 | 101.28 | 4.34 | 121.58 | 12.23 |
| 3 | 4.27 | 132.23 | 5.21 | 161.45 | 11.9 |
| 4 | 4.73 | 141.80 | 5.90 | 177.0 | 10.24 |
| 5 | 5.05 | 156.45 | 6.41 | 198.65 | 10.81 |
| 6 | 5.42 | 162.68 | 7.04 | 211.10 | 4.26 |
| 7 | 5.52 | 171.09 | 7.28 | 225.59 | 5.55 |
| 8 | 5.44 | 168.51 | 7.14 | 221.44 | 6.85 |
| 9 | 4.73 | 142.04 | 6.10 | 182.91 | 5.0 |
| 10 | 4.11 | 127.39 | 5.16 | 160.10 | 7.57 |
| 11 | 3.20 | 95.88 | 3.90 | 117.13 | 9.91 |
| 12 (December) | 2.89 | 89.50 | 3.47 | 107.48 | 9.46 |
| Mean | 4.34 | 131.95 | 5.47 | 166.45 | 2.40 |
| AOI loss (%) | Spectral effects (%) | Temperature/solar irradiance loss (%) | Combined loss (%) | ||
| −2.65 | 0.66 | −5.93 | −20.73 | ||
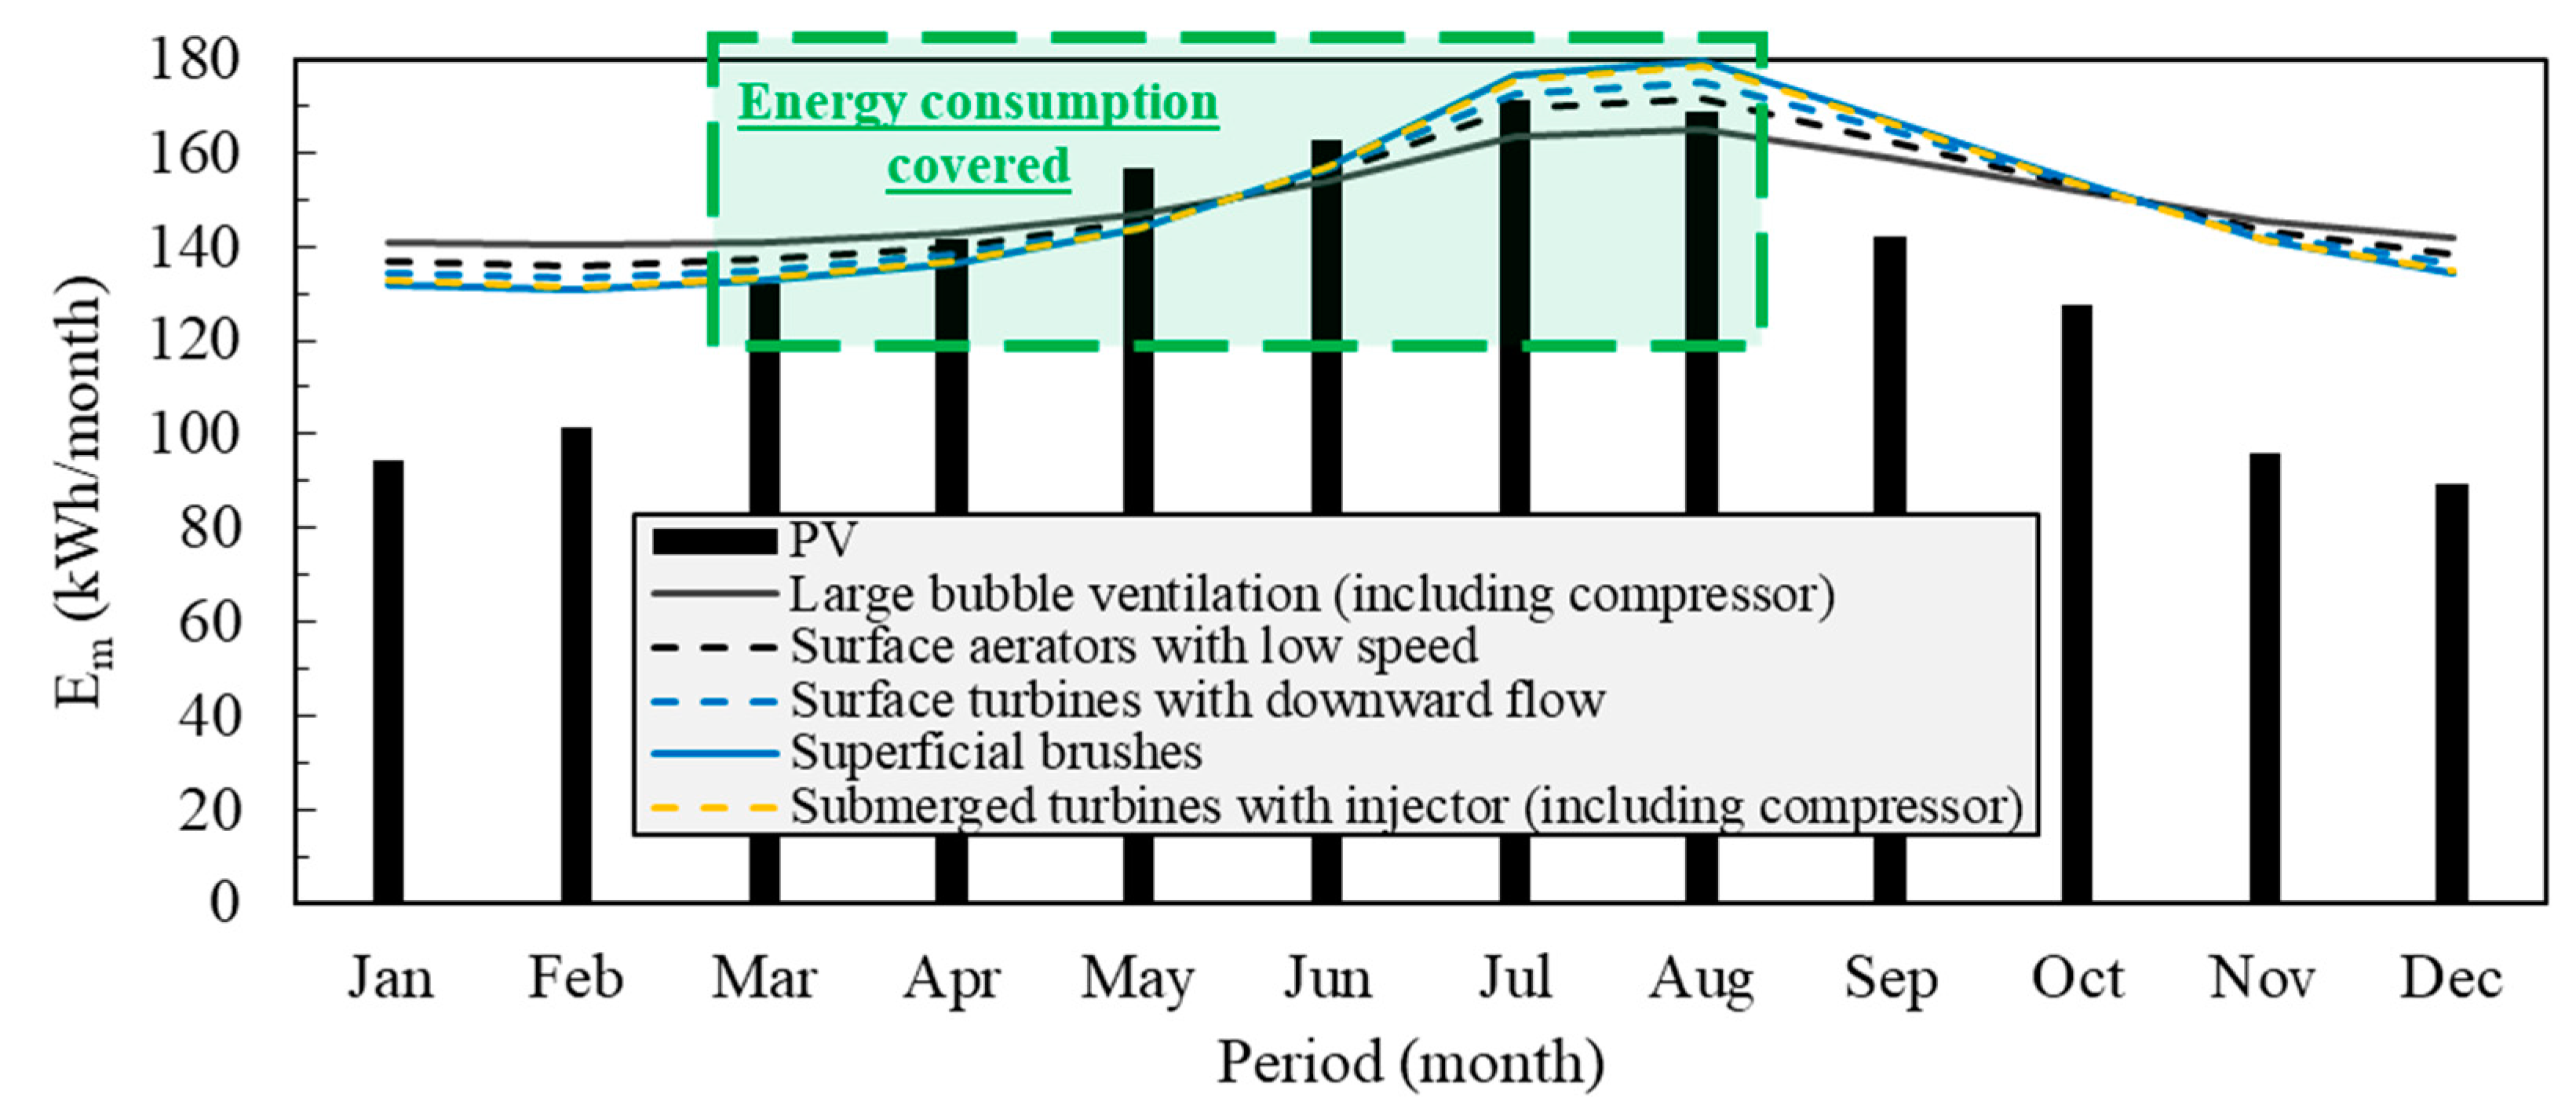
| Auto-Consumption (%) for Aeration Systems | ||||||
|---|---|---|---|---|---|---|
| Month | Superficial Brushes | Surface Turbines with Downward Flow | Low-Speed Surface Aerators | Large Bubble Ventilation | Submerged Turbines with Injector | Performance |
| 3 (March) | 100.0 | 98.0 | 96.0 | 94.0 | 99.0 | Optimum |
| 4 | 100.0 | 100.0 | 100.0 | 99.0 | 100.0 | |
| 5 | 100.0 | 100.0 | 100.0 | 100.0 | 100.0 | |
| 6 | 100.0 | 100.0 | 100.0 | 100.0 | 100.0 | |
| 7 | 97.0 | 99.0 | 100.0 | 100.0 | 97.0 | |
| 8 | 94.0 | 96.0 | 98.0 | 100.0 | 94.0 | |
| 9 | 85.0 | 86.0 | 87.0 | 89.0 | 85.0 | Good |
| 10 (October) | 83.0 | 83.0 | 83.0 | 84.0 | 83.0 | |
| Mean a | 87.0 | 87.0 | 87.0 | 86.0 | 87.0 | - |
Publisher’s Note: MDPI stays neutral with regard to jurisdictional claims in published maps and institutional affiliations. |
© 2022 by the authors. Licensee MDPI, Basel, Switzerland. This article is an open access article distributed under the terms and conditions of the Creative Commons Attribution (CC BY) license (https://creativecommons.org/licenses/by/4.0/).
Share and Cite
Zacchei, E.; Colacicco, A. Direct Method to Design Solar Photovoltaics to Reduce Energy Consumption of Aeration Tanks in Wastewater Treatment Plants. Infrastructures 2022, 7, 79. https://doi.org/10.3390/infrastructures7060079
Zacchei E, Colacicco A. Direct Method to Design Solar Photovoltaics to Reduce Energy Consumption of Aeration Tanks in Wastewater Treatment Plants. Infrastructures. 2022; 7(6):79. https://doi.org/10.3390/infrastructures7060079
Chicago/Turabian StyleZacchei, Enrico, and Antonio Colacicco. 2022. "Direct Method to Design Solar Photovoltaics to Reduce Energy Consumption of Aeration Tanks in Wastewater Treatment Plants" Infrastructures 7, no. 6: 79. https://doi.org/10.3390/infrastructures7060079
APA StyleZacchei, E., & Colacicco, A. (2022). Direct Method to Design Solar Photovoltaics to Reduce Energy Consumption of Aeration Tanks in Wastewater Treatment Plants. Infrastructures, 7(6), 79. https://doi.org/10.3390/infrastructures7060079