Article

Travelers’ Perceptions on Significance of Travel Time Saving Attributes in Travel Behavior: A Case Study in Oman

by
Muhammad Ashraf Javid
1,
Hanan Saif Al-Khatri
2,
Sawsan Said Al-Abri
2,
Nazam Ali
3,
Krisada Chaiyasarn
4 and
Panuwat Joyklad
5,*
1
Department of Civil Engineering, NFC Institute of Engineering and Fertilizer Research, Faisalabad 38090, Punjab, Pakistan
2
Department of Civil and Environmental Engineering, University of Nizwa, Birkat Al-Mouz, Nizwa 616, Oman
3
Department of Civil Engineering, University of Management and Technology, Lahore 54770, Punjab, Pakistan
4
Thammasat Research Unit in Infrastructure Inspection and Monitoring, Repair and Strengthening (IIMRS), Thammasat School of Engineering, Faculty of Engineering, Thammasat University Rangsit, Pathum Thani 12000, Thailand
5
Department of Civil and Environmental Engineering, Faculty of Engineering, Srinakharinwirot University, Nakhonnayok 26120, Thailand
*
Author to whom correspondence should be addressed.
Infrastructures 2022, 7(6), 78; https://doi.org/10.3390/infrastructures7060078
Submission received: 7 May 2022 / Revised: 2 June 2022 / Accepted: 3 June 2022 / Published: 6 June 2022
(This article belongs to the Special Issue Smart Mobility)

Abstract

:
As everyone spends much time traveling, engaged in leisure or work activities, travel time represents one of the largest costs to transportation. The main objective of the study is to investigate travelers’ perceptions related to value of travel time saving with the help of a questionnaire survey. The survey was conducted online with the help of Google forms. The required data were collected through a self-reported questionnaire that consisted of five parts. A total of 312 useable sample responses were collected. The collected data were analyzed using conventional and statistical methods. In conventional methods, frequency distribution was carried out, and bar and pie charts were prepared. In the statistical methods, the exploratory factor analysis method (EFA) was conducted to extract useful factors affecting the travelers’ perceptions about travel time saving attitude. The survey results showed that more than 73% of people use a car for transport, which implies that most of them do not like to wait for public transport modes. It means that their travel attitudes are more inclined towards private transport seeking travel time saving. Most people do not like to share space with others while traveling, amounting to 44% of respondents using private cars alone, and placing high importance on flexibility, reliability, and time and cost saving in traveling, which implies that they are more likely to travel alone to save travel time. In addition, most of the respondents use short routes; this propensity is positively related to time and cost saving factors. Similarly, the time and cost savings and car-oriented attitudes are positively associated with the choice of a short route to save travel time. They also believe that the service quality level of transportation facilities affects the travel time saving and its value. This study proposes to improve travel time and cost in Oman.

1. Introduction

The urban population has been increasing, which increases travel demand on the road networks. The present population of Oman is 4.489 million, including 1.747 million expatriates and 2.742 million Omani nationals [1]. The total land area of Oman is 309,500 km2 and population density is 16 people per km2 [2]. Private vehicle ownership and usage is increasing rapidly as car and taxi are the main transport modes in Oman. The total registered vehicles in Oman, as of January 2021, is quite high and public transport has a negligible share (around 1.3%) in the travel modes split throughout the country [3]. The growing traffic of private transport tends to increase travel delays, increase travel time and cost, and reduces the reliability of traveling especially in urbanized areas. The increased travel demand also causes environmental and social problems such as an increase in air pollution, traffic delays, and sometimes increases in traffic accidents.
The quality of transportation infrastructure plays a significant role in the modes and route choice behavior of travelers. Most of the time travelers make a trade-off between travel time and travel cost in their decision making to choose a particular mode and route. The choice of the route while using a private vehicle entirely depends on an individual’s behavior and in the case of public transport, is dependent on the route of the transit vehicle. Travel time reliability and perceived value of travel time by each individual also play important roles in the choice of alternatives. The service reliability of transportation alternatives has a great influence on travelers’ choices [4]. Public transportation services are an integral part of societies. Countries need effective public transport services for transit users. In an urbanized society, an efficient transportation system is one of the basic components of the social, economic, and physical structure, and it has to be competitive and attractive to the transit seekers. Public transport services must follow regular schedules, be reliable, be safe and rapid, and guarantee high service quality [5,6].
Two of the most important values obtained from travel demand studies are the value of travel time (VTT) and the value of travel time reliability (VTTR). The former links the monetary values travelers (or consumers) place on reducing their travel time (i.e., savings). The latter connects the monetary values travelers place on improving the predictability (i.e., reducing the variability) of their travel time [7]. The value of travel time (VTT) or value of time (VOT) refers to the cost of time spent on transport. It includes costs spent on travel (e.g., fuel costs, parking costs, road toll, and fare in case of transit services), and costs of personal (unpaid) time spent on travel. The value of travel time savings (VTTS) refers to the benefits from reduced travel time costs. Travel time saving is often the principal benefit for transportation projects. Congestion relief projects are justified primarily by the reduction in travel time they are supposed to bring about [8]. Travel time saving can also lead to reductions in vehicle operating costs. For example, an addition of a new lane to a freeway would increase traffic speeds and reducing travel delays, a coordinated signaling strategy would allow for faster travel along a particular corridor, and an improvement to a transit system reduces waiting time or increases travel time reliability. It can also reduce travel time on a parallel highway [9].
The perceived generalized travel cost of transportation modes plays a significant role in mode choice behavior. This generalized travel cost is a combination of monetary (e.g., fuel, parking fee, toll, fare) and non-monetary (travel time) components of travel cost. The non-monetary component of travel costs depends on several factors such as service quality and reliability attributes of the transportation infrastructure system. The value of time (VOT) varies significantly across different segments of the travel market and economic groups of society. The perceived generalized travel cost and VOT are essential parameters in the transportation planning process. The determination of the value of time helps in understanding the exact needs of a specific segment of the travel market, planning, and designing transportation facilities. It is essential to identify the value of travel time saving in the local context to know the preference and needs of travelers.
This study aims to identify the value of travel time and identify the significant factors which might influence the value of travel time. Some of the main objectives for carrying out this research study are listed as follows: as the value of travel time is important in the decision making for travel behavior, it is therefore imperative to understand the behavior of commuters in the local context to comprehend how it affects their choices. To the best of the authors’ knowledge, no such study has been conducted in Oman; therefore, the findings of this research can fill the gap in the body of the literature for effective inferences and interventions to reduce the dependence upon personalized vehicles. It has been mentioned in the preceding section that the share of public transport is negligible as compared with private vehicles; therefore, it is important to identify the core factors which affect the decision process of travelers about the use of mode and route choices. Furthermore, understanding the behavior of respondents belonging to different socio-economic backgrounds can help in affectively addressing the concerns regarding the use of public transport and concurrent suggestions can be proposed for the promotion of sustainable transport modes.

2. Literature Review

The value of travel time is an important factor in many decisions a traveler makes in terms of routes to travel, when to travel, and by which mode to travel. The value of time is affected by the level of transportation infrastructure and the service quality offered by the system. The value of time is affected by money spent on the type of transportation choice. The value of travel time decreases when one’s time budget increases and the value of time increases with monetary income [10]. The value of travel time saving differs across different income groups and travel modes [11]. The value of travel time differs from one person to another depending on many factors such as type of transport mode, travel time, destination, weather conditions, trip purpose, and a traveler’s characteristics [12]. The value of travel time increases directly as the distance of trips increases. Moreover, the value of travel time increases when personal income increases. In addition, the social and economic conditions are also affected by the value of travel time as the number of people in the family increase, thus spending more money for good and fast travel is inevitable [13].
Fuel cost is one of the factors affecting the influence of travel. The price of fuel cost increases as demand grows and this effect influences travel [14]. Household size has a negative impact when selecting the mode choice with family members. It is important to mention that the ride sharing will be less with someone who is not known. Time of day also plays an important role in ride sharing; most of the time families and friends share rides on weekends and working days in the mornings, so the ride sharing will be more often be at the weekends. Most people who use a private car have a high level of income and also have a greater level of education and good jobs. The other factors determining whether people use a private car are security, comfort, and time, which are higher in a private car compared to public vehicles [15].
Reasons for using a private car include a rise in income, which has probably resulted in an increase in both travel costs and benefits; the benefits of additional travel have increased more rapidly than costs, and possibly the increased comfort level of cars have outweighed the cost.
Travel time saving depends on the income of the family and the total cost of travel. It also depends on the specific travel time which has a different cost value. Newcomers resent avoidable costs; the most important of these costs is parking cost, which can be reduced through long walking times or the different road options. In addition to paying parking costs is traffic fees as well as the usual and acceptable cost of fuel [16]. The income and length of the trip have a great impact on the value of travel time. The higher the income, the higher the VOT. Likewise, as the length of the trip increases, the VOT increases where similar studies can be performed to analyze the effect of respondents’ socio-economic characteristics on value of travel time [13]. A study found that income and allowances from employee are significant for commuting trips and time savings and cost savings are significant for shopping and recreational trips [17]. The value of travel time increases as income increases [18]. The increase in incomes has resulted in an increase in travel costs and benefits in traveling [19]. It has been found that the function of value of time reduces with higher levels of objective and perceived comfort [20]. A study found that high speed rail and air transport users show higher values for travel time saving than bus users [21]. Additionally, savings of waiting time have more value than access time. Some researchers examined the travel time saving in terms of consumers surplus using discrete choice models [22,23]. Sergio et al. estimated the subjective values of travel time saving using perceptions results of work, leisure, and travel from a joint mode choice activity model [24]. It has been found that long commuting times have a positive and significant impact on increases in work stress and type of traveling mode also induces significant influence on stress [25,26]. Some of the factors influencing the VOT are summarized in Table 1. This table illustrates the factors which influence the decision making process of users related to VOT. The factors are divided into two categories, i.e., internal factors and external factors. The internal factors are concerned with the social-cognitive aspects and socio-economic characteristics of the travelers which influence their decision while traveling. The external factors include the service quality characteristics of transport infrastructure and transit modes such as variation of travel costs, time, accessibility, distance, and population. The pricing policies and reward on use of particular travel alternatives are also considered as external factors.
It is evident that the value of time saving in traveling varies across different segments of the travel market. The actual travel preferences considering various time saving scenarios may differ from person to person. The time saving also influences the traveler’s mode choice pattern and such mode choice pattern may be unique under specific circumstances. The local transportation infrastructure characteristics also play a significant role in route and mode choice considering the travel time saving. The travelers’ perceptions can provide useful insight into the significance of travel time saving.

3. Data Collection and Analysis Methods

A questionnaire survey was designed carefully for the estimation of travel time saving. The questionnaire survey was conducted using an online method for extracting useable samples. The questions were kept short and concise so that exact information can be extracted using this questionnaire.

3.1. Selection of Survey Locations and Sample Size

The survey was conducted online with the help of Google forms. An online approach was preferred to conduct this survey due to the COVID-19 infection issue. The survey was prepared both in Arabic and English languages for a better understanding of the potential respondents. The survey conducted with travelers from all parts of Oman was an online survey and it was possible to collect responses from different regions in Oman. The population of Oman is 5.36 million people, and the population density of the country is around 16 people per Km2. We chose this survey as it was a simple way to approach participants. Guidelines and instructions were given at the start of the questionnaire as well as at the start of each questionnaire part so that exact information could be obtained. The questionnaire was sent to all those who were easily accessible.
We decided to obtain more than 300 samples. Most of the previous studies with similar scope have considered a sample size of 300 or more suitable for use in statistical analysis. During the survey, we assumed that the sample size should comprise travelers from different socio-economic groups. The survey sample includes students from the University of Nizwa as well as from off-campus students. It also includes the employees of various organizations. Most of these students use the university bus for daily commutes, and many students use their cars. They were asked to report the cost of travel and travel time for the use of the car and private vehicle for their trip. To ensure the confidentiality of the data and respondents’ information, personal identification information was not asked in the survey. The questionnaire survey only asked general characteristics of the travelers and perceptions on travel time saving attributes and importance of time saving in the mode choice behaviors.

3.2. Questionnaire Design

The data were collected through a self-reported questionnaire that consisted of five parts. The first part of the questionnaire consisted of personal and trip characteristics of the travelers, e.g., age, gender, marital status, income, living city in Oman, profession, car ownership, travel mode, possession of driving license, trip frequency before COVID-19 and at present, main trip purpose, travel time, travel cost and trip distance for the most frequent trip. The respondent’s age was classified into six groups: under 20 years, 20–30 years, 31–40 years, 41–50 years, 51–60 years, and more than 60 years. This categorization of age was used considering age distribution of target population in this study. The type of travel mode used was classified into four groups as private bus, car, taxi, and other vehicles. The trip frequency per week was divided into four groups: 1–2 days a week, 3–4 days a week, 5–6 days a week, and every day.
In the second part of the questionnaire, some attributes of service quality of travel alternatives were chosen to learn the views of the respondents about the travel time saving in traveling considering various factors and scenarios. These statements were designed as, for example, how important it is to save travel time saving, travel cost saving, living closer to office/school to save travel time, the flexibility of travel route to save travel time, the flexibility of travel schedule to save travel time, travel time reliability, traveling alone to save travel time, and traveling in off-peak hours to save travel time. These phrases were evaluated using the five-point Likert type scale, i.e., not important at all (1), slightly important (2), moderate (3), important (4), and very important (5). This five-point Likert-type ordinal scale was chosen to seek the reliability and normality of the data [28]. The five scales were chosen considering the reliability of the data and easiness of the respondents in recording the responses. The five-point scale usually provides better results and is easy to understand for the target respondents in the population.
In the third part, the students were asked to provide the best choice for each phrase using the five-point Likert scale, i.e., strongly disagree (1), disagree (2), neutral (3), agree (4), and strongly agree (5). Some of the questions included in this part were as follows: I prefer travel time reliability over cost of traveling, I prefer time saving over cost saving in traveling, traveling with family members increases the travel time, the level of transportation infrastructure influences the value of travel time, I use a car because it saves travel time, I have to wait a long time if I need to travel by bus, I have to wait a long time if I need to travel by taxi, I am willing to pay additional travel costs for the reduction in travel time and am willing to pay a road toll or tax for the improvement of roads by adding more lanes. In addition, it is acceptable for me if there is an increase in travel time e.g., 5 min, 6–10 min, and 11–15 min.
In the fourth part of the questionnaire, the respondents were supposed to show their level of interest in the following travel scenarios for daily commuting considering the travel time saving. The potential target respondents were asked to provide the best choice for each phrase using the five-point Likert scale, i.e., (1) not at all interested, (2) slightly interested, (3) moderately interested, (4) very interested, and (5) extremely interested. The designed scenarios of travel time saving for mode choice preferences included a private car with family members, private with friends/colleagues, and a taxi with strangers. A taxi with friends/colleagues, a taxi with family members, public transport bus, a taxi alone, the private car alone, private car with a flexible working schedule, a long route with no traffic signal, a short route with a traffic signal, a long route with a higher speed limit (e.g., 120 km/h), and short route with a lower speed limit (e.g., 80 km/h).
The last part of the questionnaire consisted of respondents’ willingness to pay for various levels of travel time saving. These selected cost options included 100 baisa, 101–200 baisa, 201–300 baisa, 301–400 baisa, and more than 400 baisa. These questions in part five were designed as: (1) How much additional travel cost are you willing to pay for a 5-min travel time saving? (2) How much additional travel cost are you willing to pay for a 6–10-min travel time saving? (3) How much additional travel cost are you willing to pay for more than 11–15 min travel time saving? Respondents were supposed to record their willingness to pay for the mentioned travel time saving scenarios.

3.3. Data Analysis Methods

The collected data were analyzed using conventional and statistical methods. In conventional methods, frequency distributions of the responses are presented. Average responses and standard deviations were estimated to understand the central tendency of the data. The data in parts 2, 3, and 4 were analyzed using exploratory factor analysis methods (EFA). The EFA technique is usually used when the survey items are not designed based on a certain proven theory as well as when the latent variables are unknown. It is used to reduce a large number of observed variables into interpretable and logical variables to explore the underlying theoretical structure based on certain assumptions. It helps to extract the latent or unobserved variables or underlying factors which can be used further to explain the correlations between extracted variables. The extracted factors from EFA were named based on the nature of indicators of each factor. The indicators are those variables that are observed in the field, i.e., they are also called observed variables. Cronbach’s alpha values were estimated for each factor to check the creditability of the data. A Cronbach’s alpha value of more than 0.7 shows an acceptable level of reliability [29]; however, a lower of 0.5 is also acceptable in some cases as it shows a moderate level of reliability [30]. Structural equation modeling (SEM) technique was used to develop regression equations between different factors. SEM is a well-known technique which is widely used in transportation research [31,32,33,34,35,36]. From the graphs, important factors and features are extracted and explain the significance of travel time saving.

4. Results and Discussions

4.1. Distribution of Respondents’ Personal and Traveling Characteristics

Based on the responses, the gender distribution shows that 67% were females, which was more than males at 33%. The marital status distribution showed that 55% were single and 45% were married. The age distribution was carried out in five groups, 65% of the respondents were in the 20–30 year-old age group, 57% were in the 31–40 year-old group, 9% were in the 41–50 year-old group, 5% were in the under 20 year-old group, and 2% were in the 51–60 year old group. Based on the nationality distribution, 86% of the respondents were Omani and 14% of the respondents were expats (foreigner). In terms of the personal monthly income, there were five groups set: 49% of the respondents were in the below 200 OMR group, 20% were in the 500–1000 OMR group, 17% were in the 1000–2000 OMR group, 10% were in the 200–500 OMR group, and 4% were in the more than 2000 OMR group. The number of cars in a household was divided into five groups: 32% of the respondents owned more than three cars, 27% owned two cars, 22% had one car, 16% had three cars, and 3% were in the group with no car. Based on the possession of the driving license, 67% of the respondents had a driving license, but 33% of them did not have a driving license. Based on the profession, the respondents were divided into four groups: 43% of the respondents were in the student group, 36% were in the employees group, 19% was the others group, and 2% was for the businessman) group. In total, 27% of the respondents were in a family with 3–5 people, 27% of them were in a family with 5–8 people, 27% were in a family with 9–12 people, 11% were in a family with more than 12 people, and 8% of the respondents had 1–2 people in their family. The traveling mode distribution shows that 73% of the respondents used personal cars for traveling, 11% used busses, 11% used shared cars, 4% used other modes of transport, and 1% of the respondents used taxis for traveling.

4.2. Distribution of Respondents’ Travelling Information

Travel time from home to office/school/university was divided into five groups: 30% of the respondents were in the 21–40 min group, 27% were in the more than 60 min group, 19% were in the 10–20 min group, 14% were in the 41–60 min group, and 10% were in the below 10 min group. Travel distance from home to office/school/university was also divided into five groups: 43% of the respondents were in the >50 km group, 21% were in the 21–30 km group, 18% were in the 10–20 km group, 14% were in the 31–50 km group, and 13% were in the <10 km group. The travel cost distribution from home to office/school/university was also divided into five groups: 57% of the respondents were in the more than 1.0 OMR group, 13% were in the 0.6–1.0 OMR group, 11% were in the 0.4–0.6 OMR group, 10% were in the 0.2–0.4 OMR group, and 9% were in the <0.20 group. The main purpose of the daily trips was also categorized into five groups: 43% of the respondents were in the recreational group, 33% were in the job group, 15% were in the business group, 6% were in the others) group, and 3% were among the shopping group. The distribution about how many days travel in a week (before COVID-19) was set into four groups: 34% of the respondents were in the 5–6 days a week group, 35% were in the 1–2 days a week group, 16% were in the everyday of the week group, and 15% were among the 3–4 days a week group. The distribution of about how many days of travel spent in a current week was also divided into four groups: 59% of the respondents were in the 1–2 days a week group, 16% were in the 3–4 days a week group, 16% were in the 5–6 days a week group, and 9% were among the everyday of the week group.

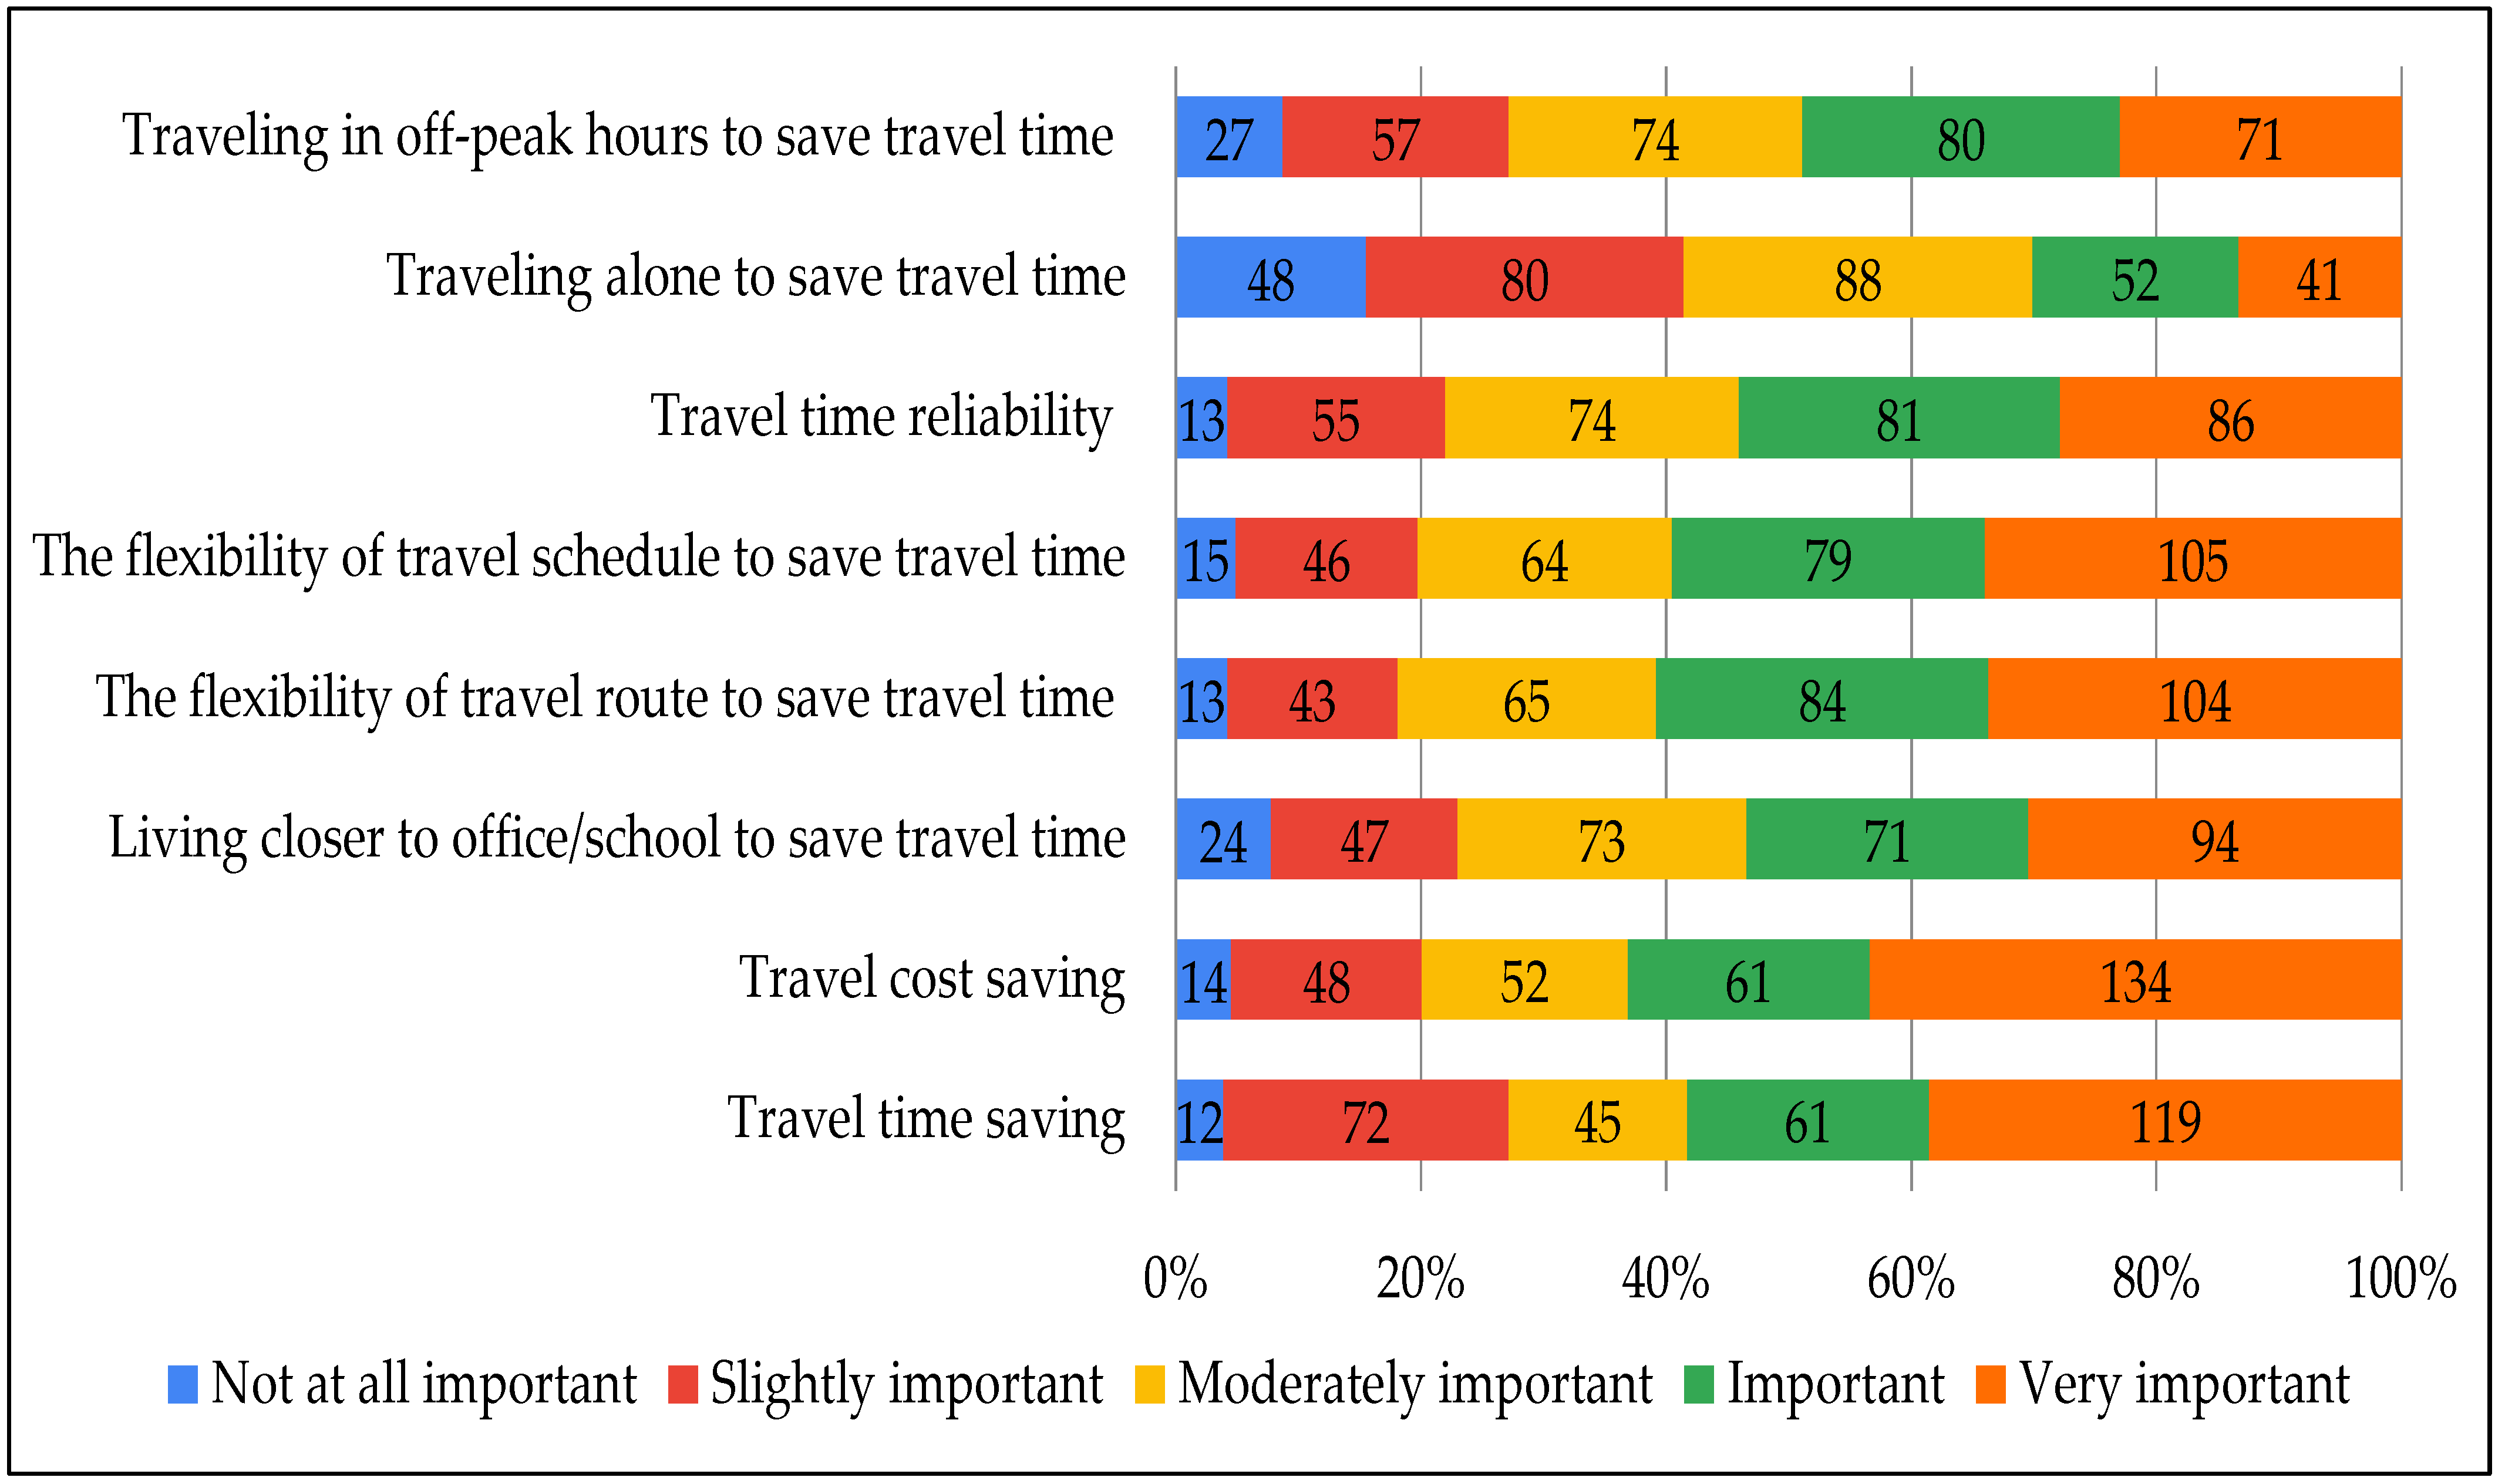
4.3. Distribution of Respondents’ Travel Time Saving Importance

Figure 1 shows the statement of the respondents along with their level of time saving importance; most of the respondents generally answered, “very important”, with the highest response for “travel cost saving”. In addition, the statement that received 119 responses was “travel time saving”. Thus, people focus on two important things when traveling: the cost and time of travel. Figure 2 also shows that the most important attributes of the mode selection for people are the flexibility of travel schedule to save travel time and the flexibility of travel route to save travel time. The travel time saving differs across different groups as they belong to different social and economic groups of the market. The respondents belonging to high income groups have more value of travel time saving in comparison to other groups. The detailed responses in this domain can be seen in Figure 1.

4.4. Distribution of Respondents’ Mode Choice Behaviors

Figure 2 shows the opinions about traveling and their agreement; most of the respondents generally stated “agree”. The most frequent statement from respondents was the statement, “it is acceptable for me if there is an increase in travel time up to 5 min”. In addition, the statement that had 108 respondents agreeing and 116 respondents “strongly agree” was “the level of transportation infrastructure influences the value of travel time”.

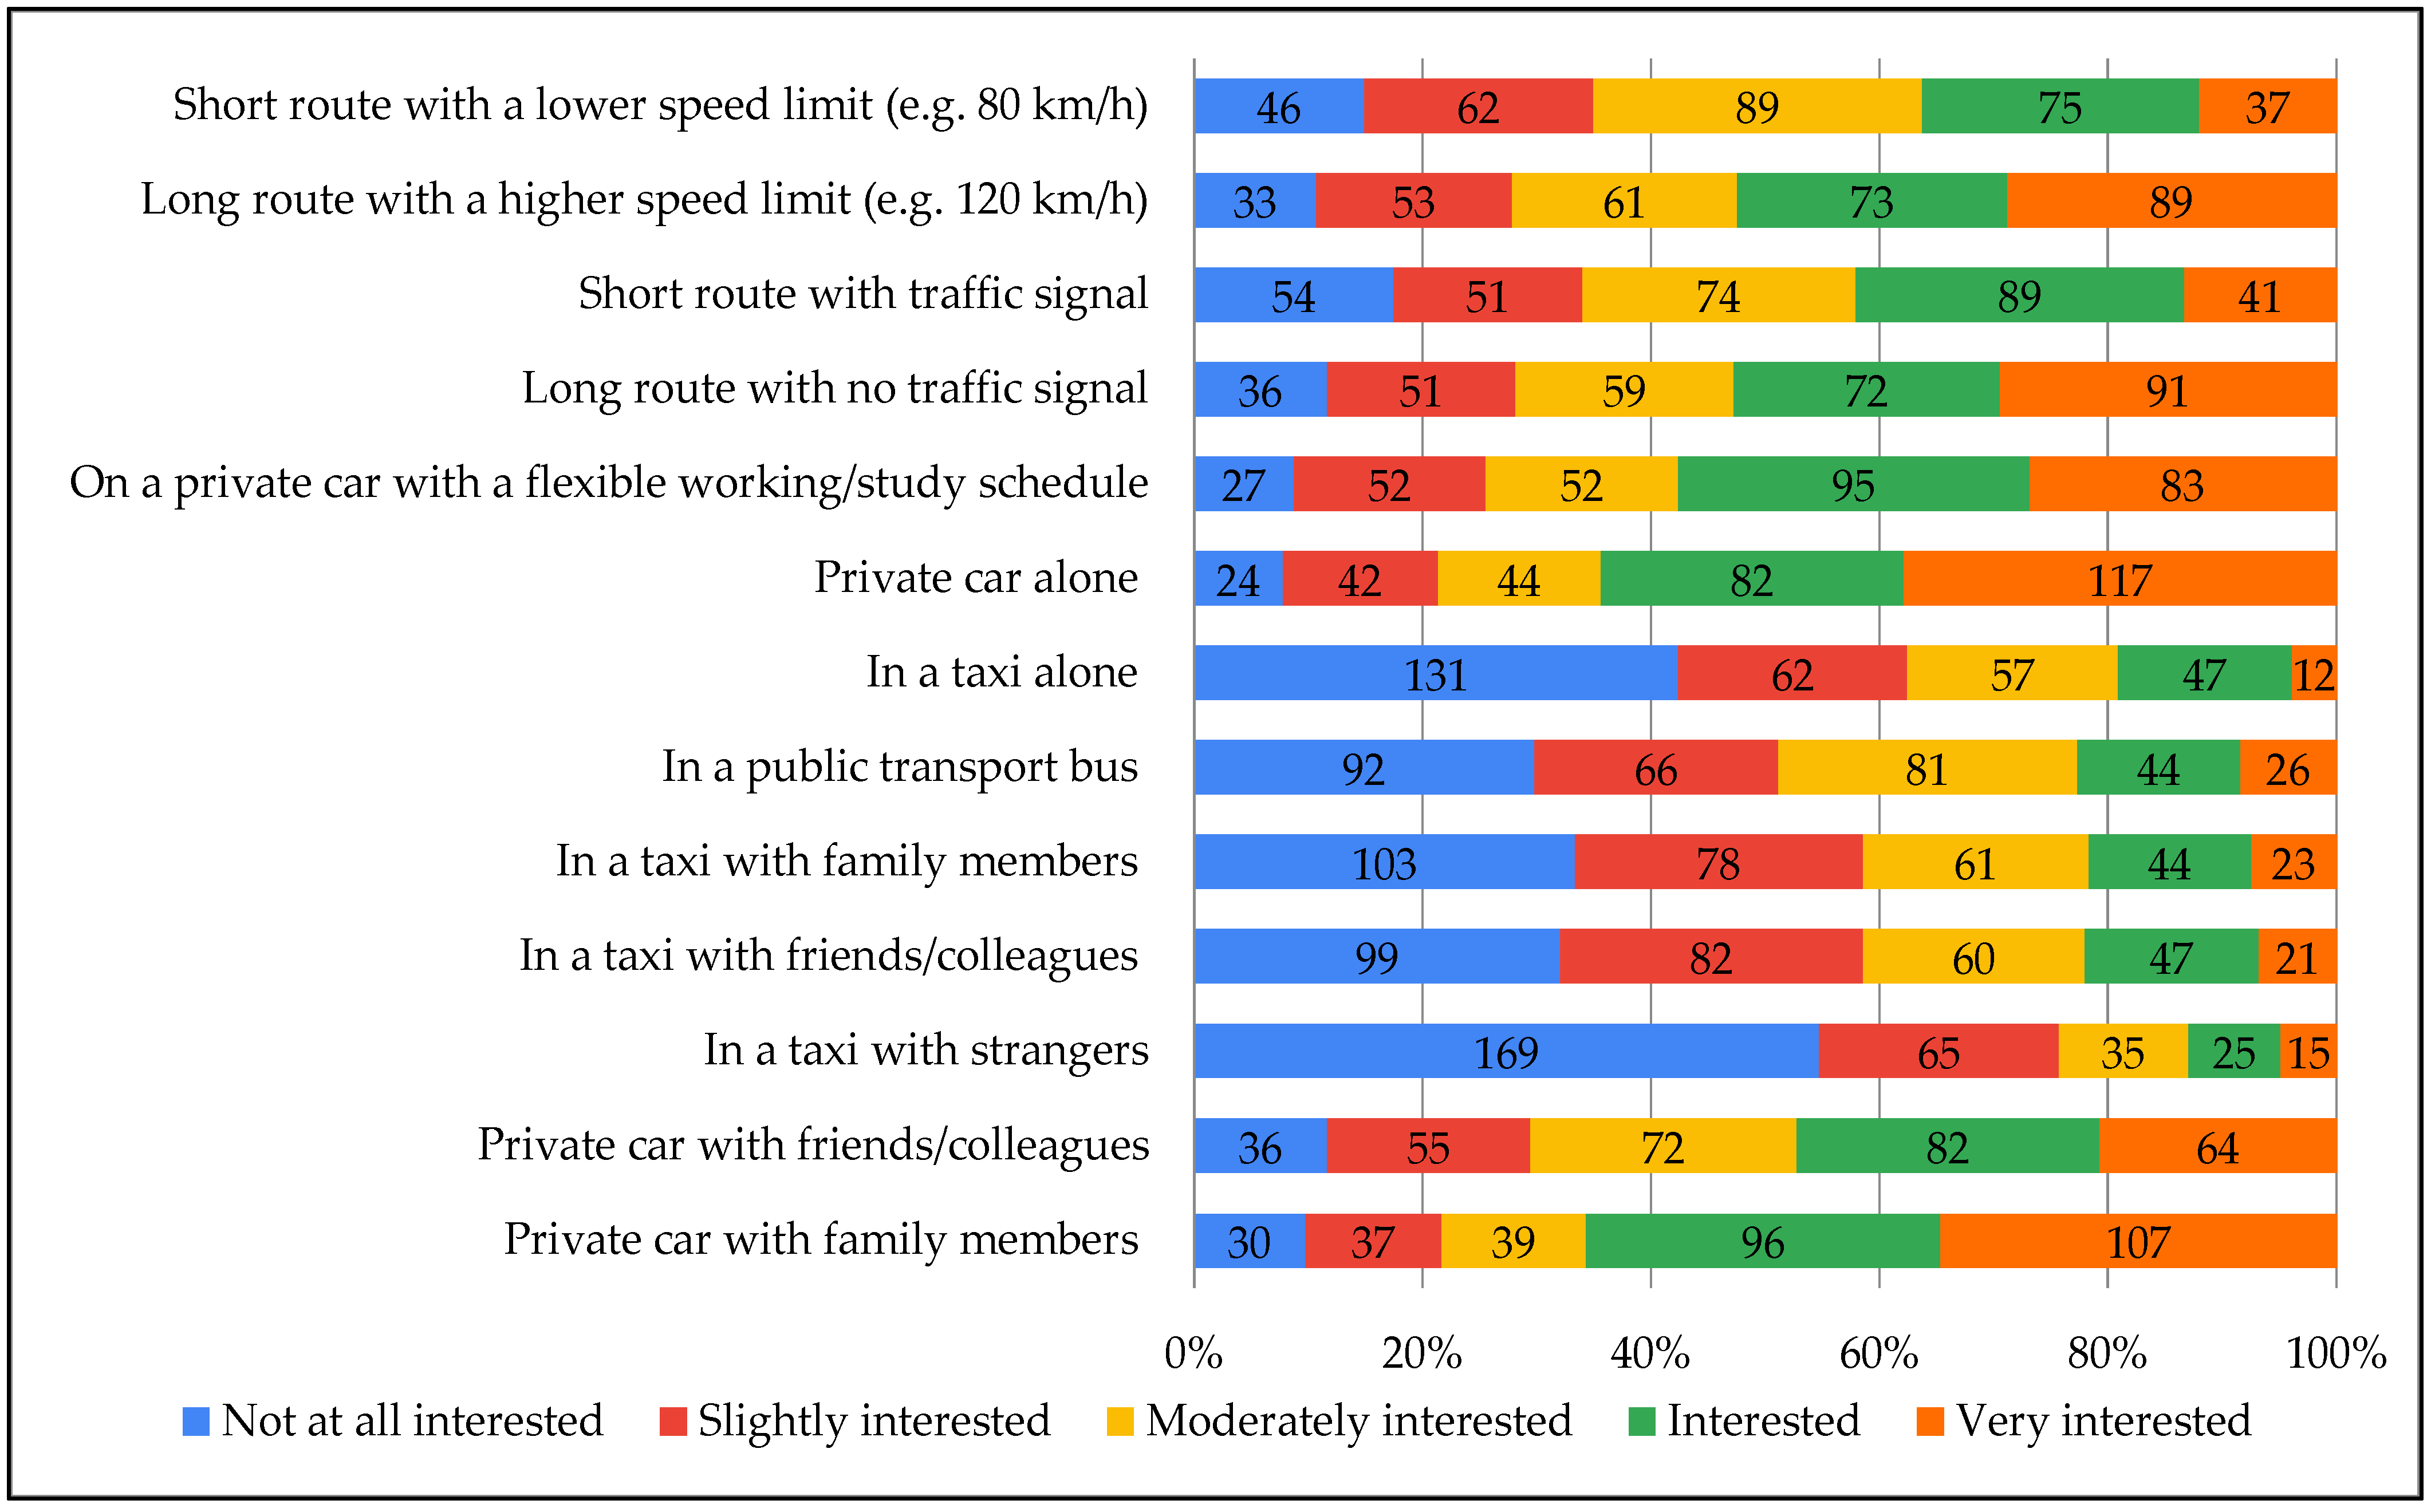
4.5. Distribution of Respondents’ Level of Interests in Different Scenarios for Travel Time Saving

Figure 3 shows the opinions of the respondents about the distribution of responses level of interest in different scenarios for the travel time saving. Most of the respondents stated, “not at all interested”. The statement receiving most of the respondents’ attention was “in a taxi with strangers”, which received 169 responses, again for “not at all interested”. Figure 4 also shows that the most frequent response for “not at all interested” was in a taxi alone, in a taxi with family members, and a taxi with friends\colleagues. In addition, the statement that received 117 responses for “very interested” was the statement, “private car alone”. This implies that that people focus more on using a private car alone than a taxi with friends and family for the sake of saving travel time in different scenarios. The detailed responses can be seen in Figure 3.

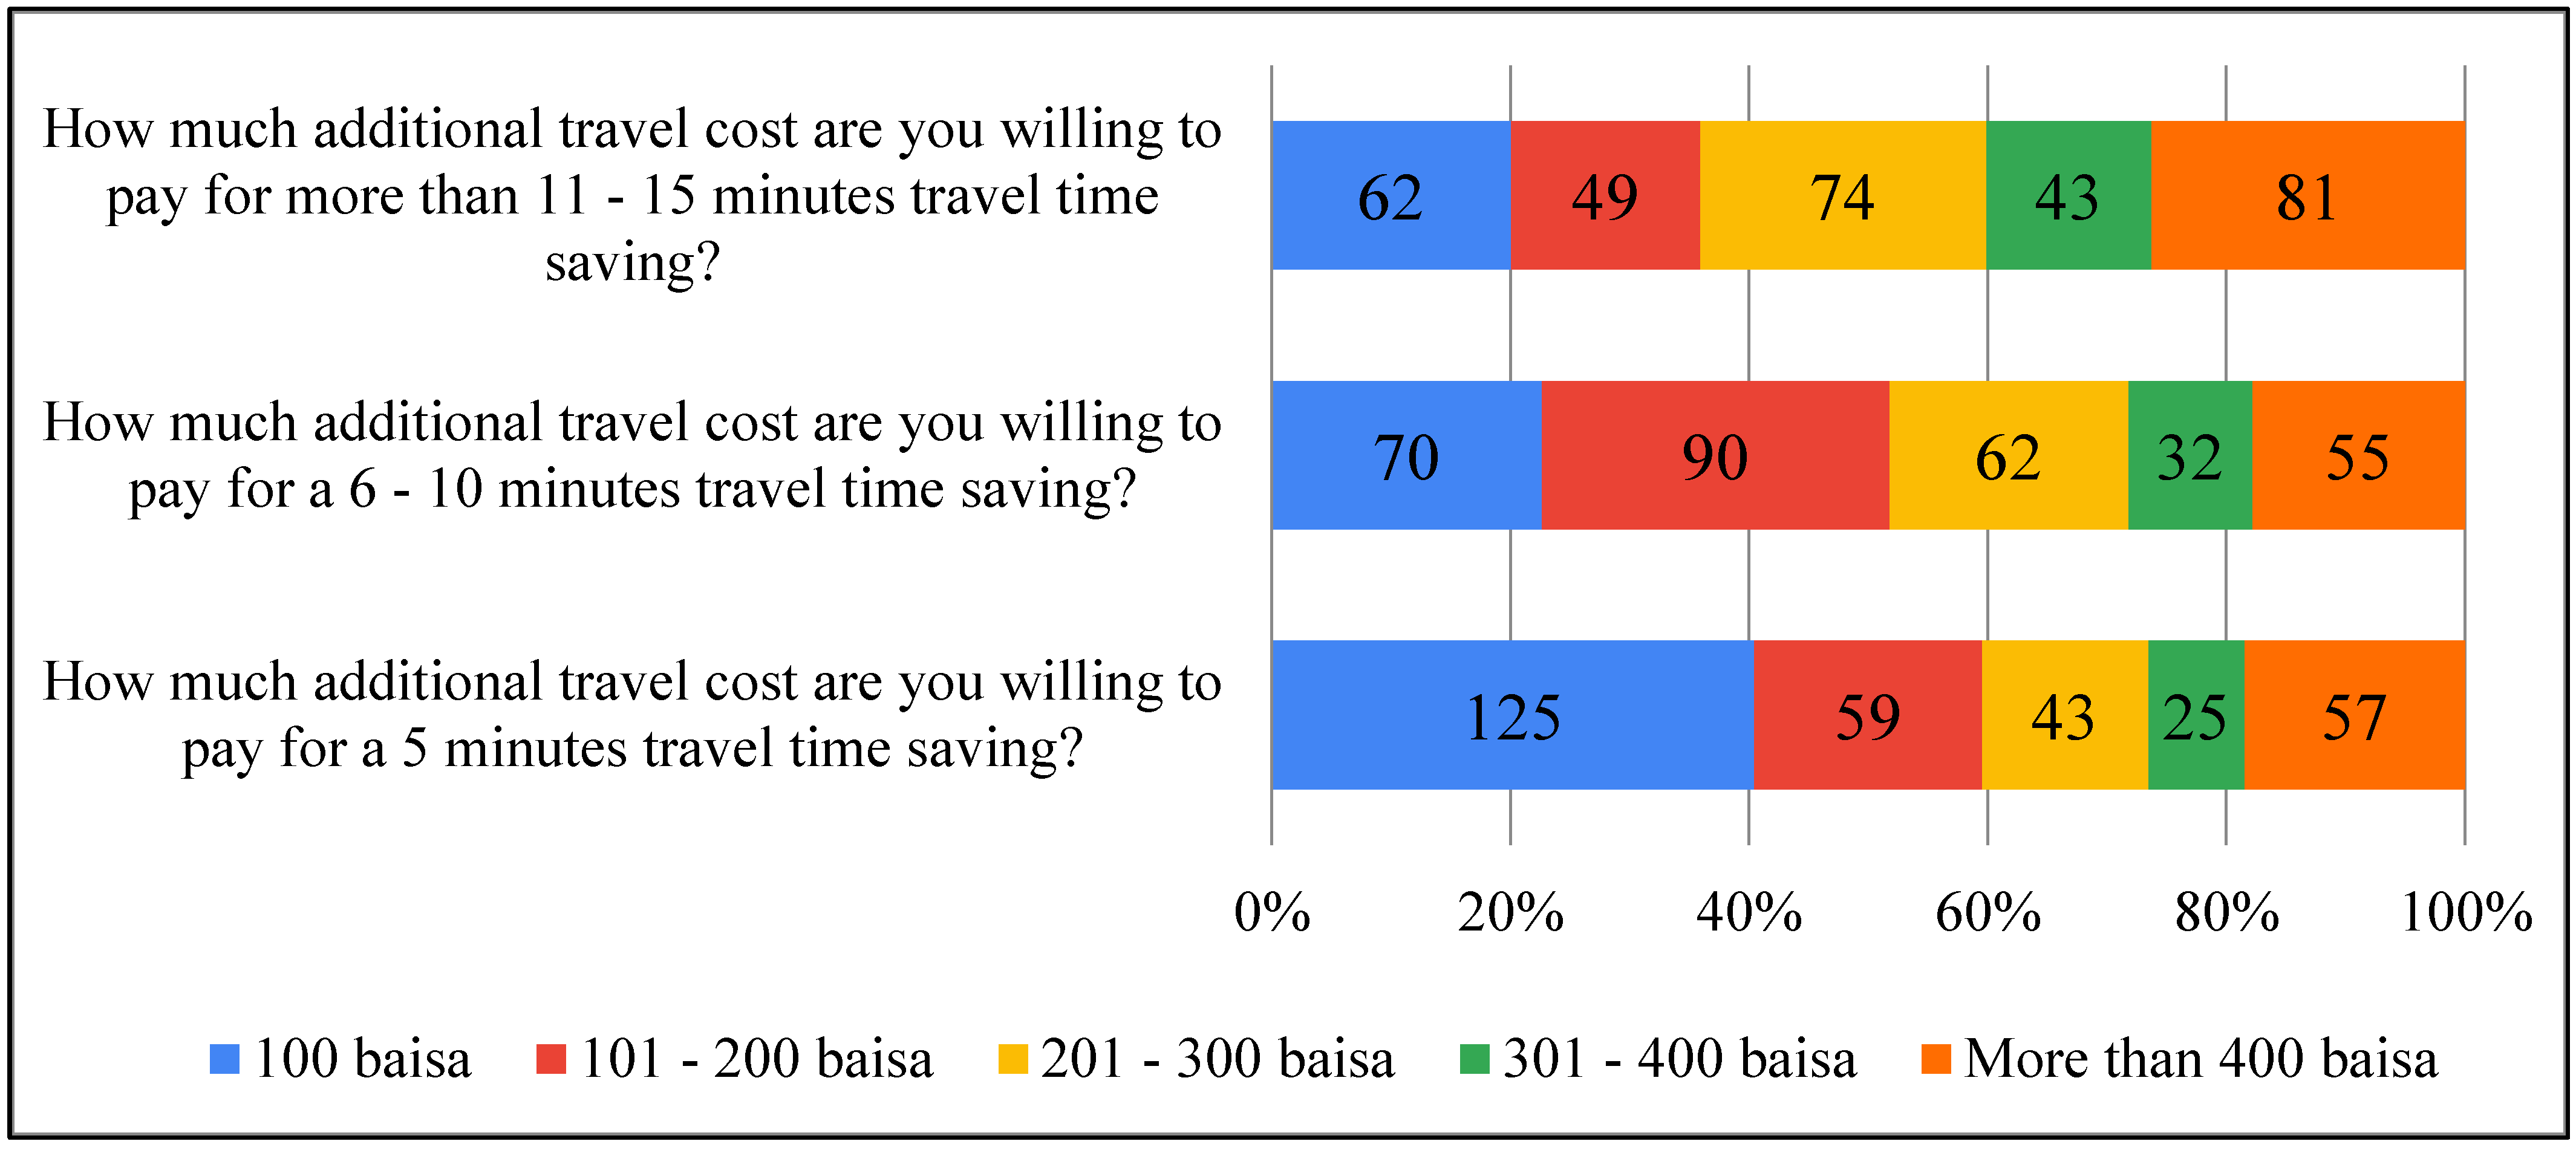
4.6. Distribution of Respondents’ Willingness to Pay for Various Levels of Travel Time Saving

Figure 4 shows the respondents’ responses fort travel cost by minutes of travel time saving; most of the respondents ‘stated “100 baisa ”. The statement receiving the most attention was “How much additional travel cost are you willing to pay for a 5-min travel time saving?” Moreover, the statement that received 90 responses from the respondents for “101–200 baisa” was “How much additional travel cost are you willing to pay for a 6–10 min travel time saving? ”. The distribution of the detailed responses can be seen in Figure 4.

4.7. Factor Analysis of Important Travel Time Saving Attributes

An exploratory factor analysis (EFA) was conducted using the principal component axis (PCA) factoring method and Equamax rotation. Three factors were obtained from this analysis as flexibility and reliability in traveling (FRT), time and cost saving (TCS), and personal preferences in traveling (PPT) as shown in Table 1. The average scores and standard deviations are also presented in Table 1. The factor for FRT included observed variables related to the importance level for the flexibility and reliability in traveling considering travel time saving. The results show that respondents placed high importance on these travel characteristics. The second factor for TCS shows that travelers placed a high level of importance on cost and time saving in traveling. The results of the PPT factor shows that the travelers give importance to travel in off-peak hours to save travel time. The Cronbach’s alpha values of all three factors are more than 0.7, which shows an acceptable level of reliability of the extracted factors. It is pertinent to mention that respondents’ preferences were highest for the FRT factor, followed by TCs, and PPT. The detailed factor scores can be seen in Table 1.

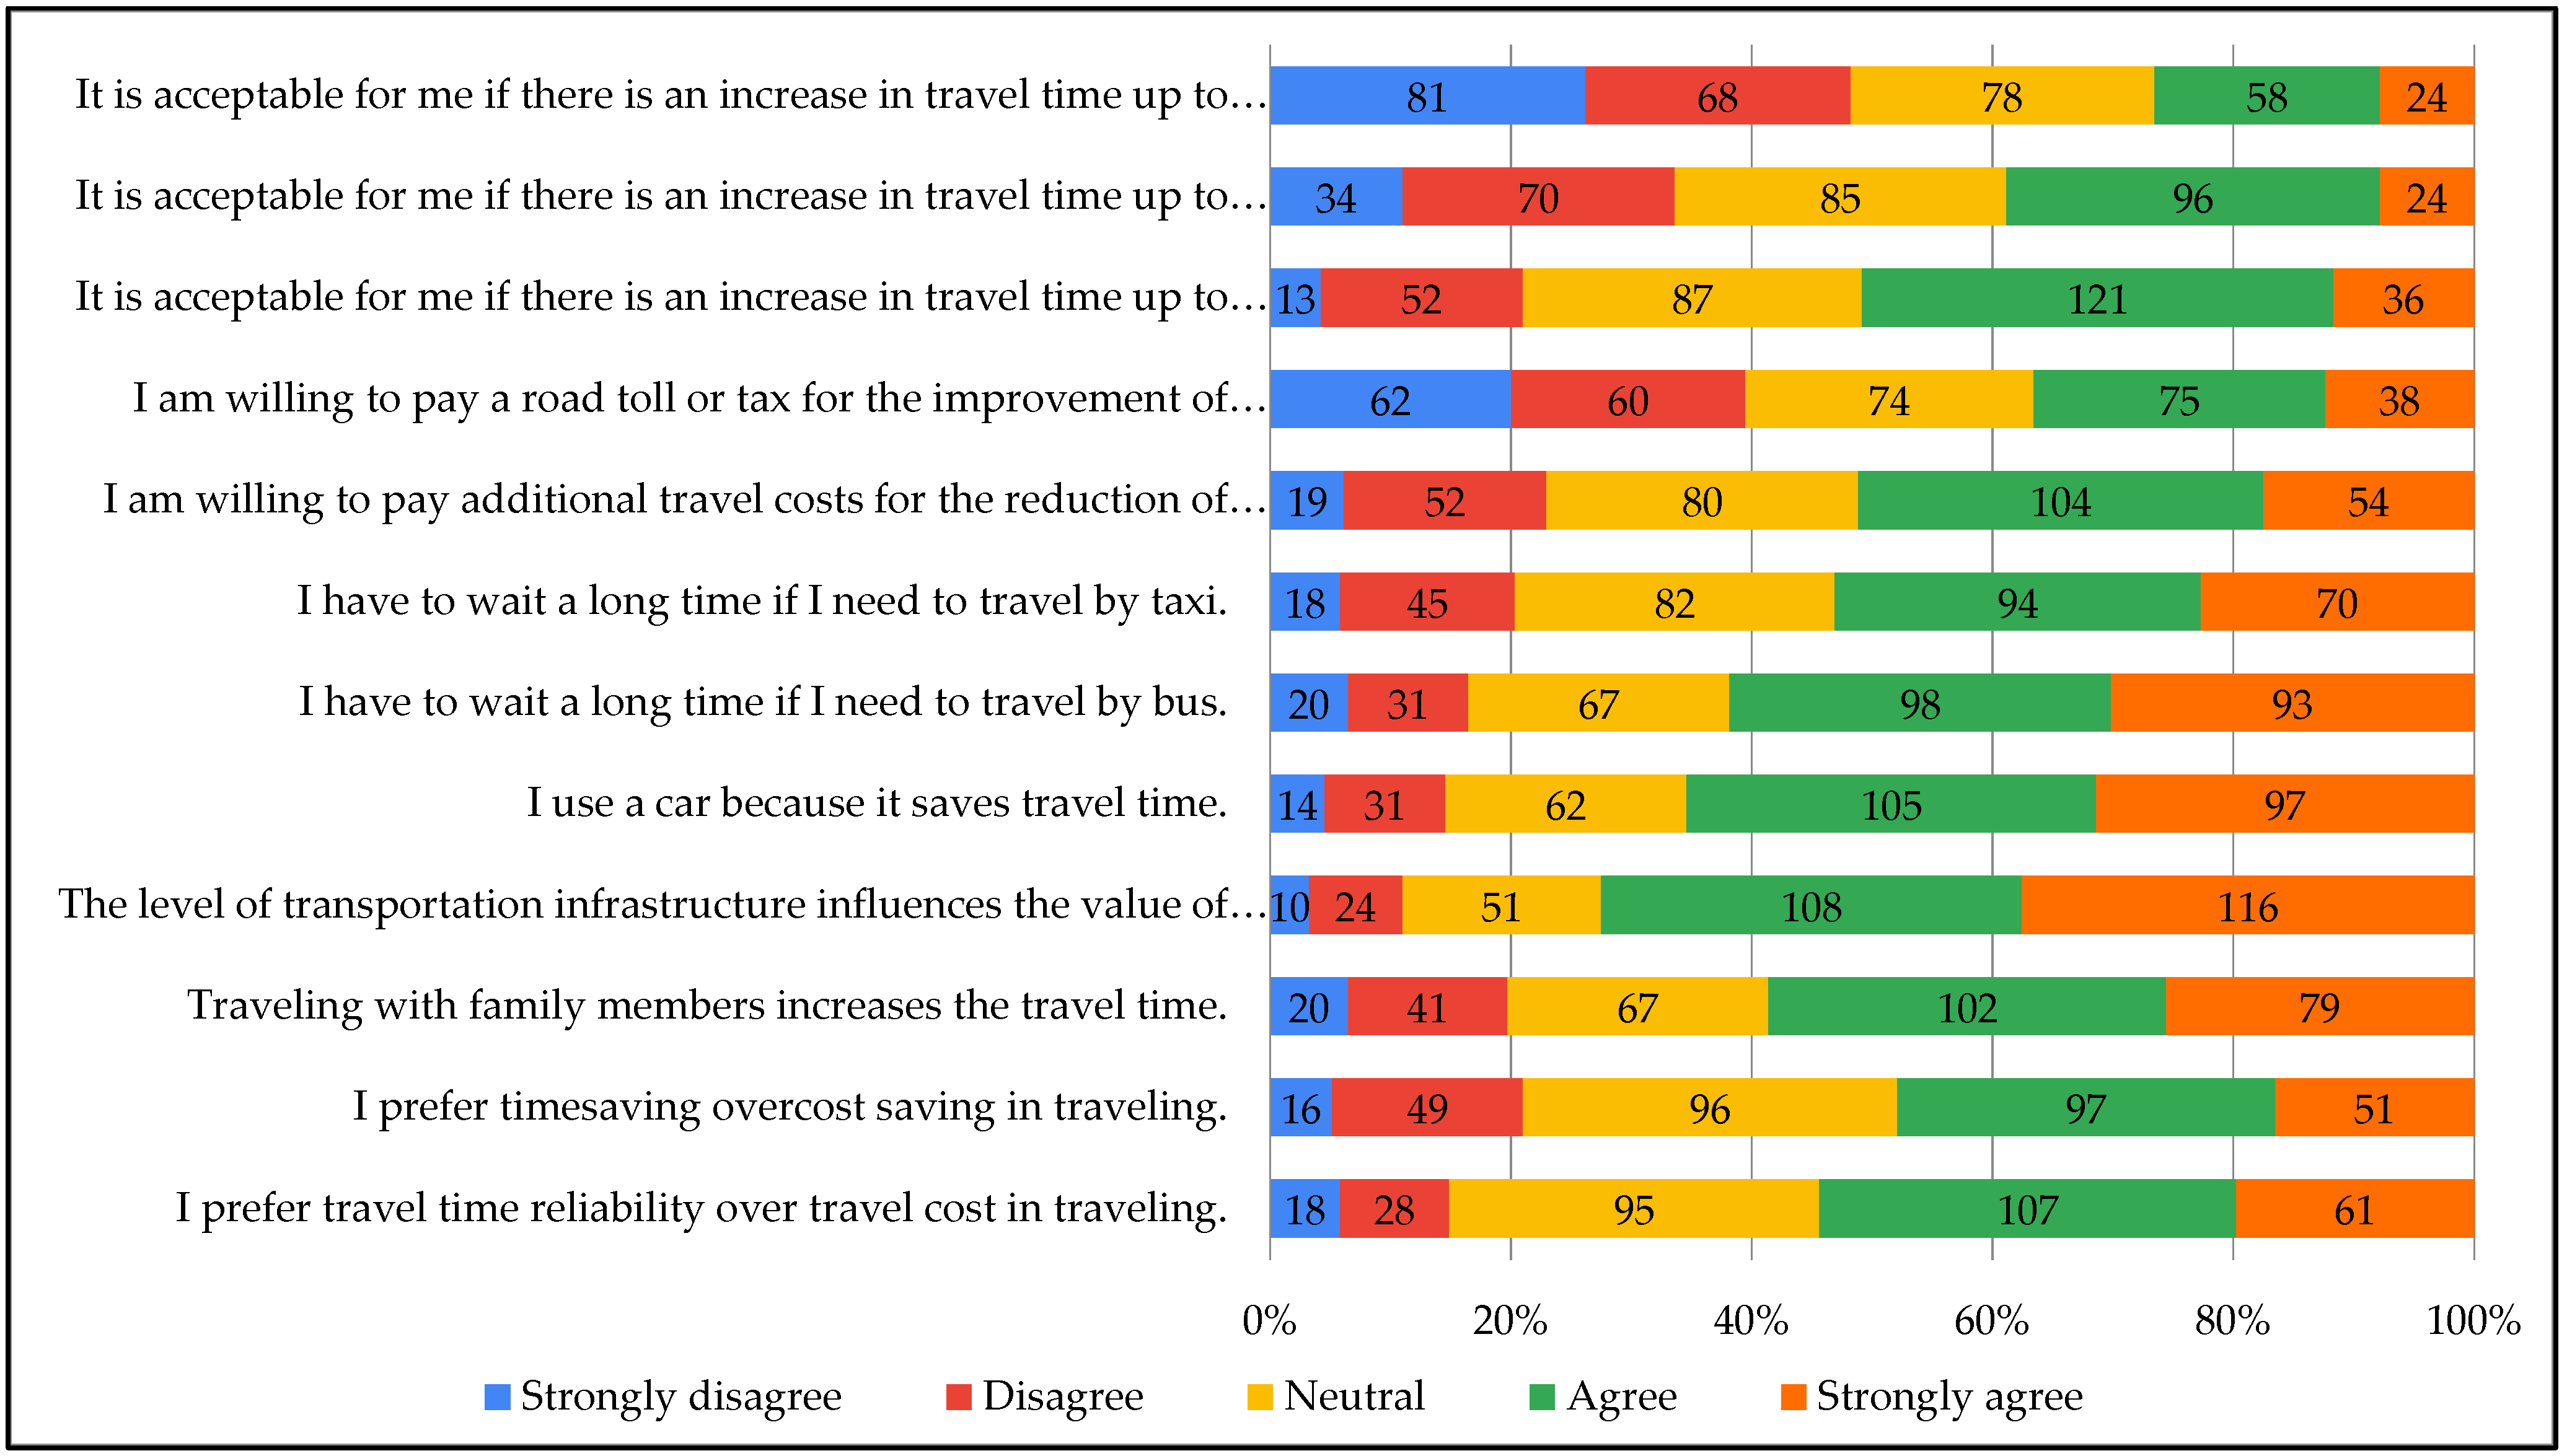
4.8. Factor Analysis of Preferences in Traveling

The second EFA was conducted on respondents’ preferences on mode choice and willingness to accept an increase in the travel time. This analysis resulted in three factors: car-oriented priorities (COP), travel time saving priorities (TTSP), and acceptability of travel time increase (ATTI) as presented in Table 2. All three factors explain more than 60% of the variance in the analysis. The estimated values of Cronbach’s alpha are more than 0.7, which indicates that these factors have an acceptable level of reliability and internal consistency among respondents in their evaluation. The factor of TTSP shows that most of the respondents agreed that they put more beliefs on travel time reliability, and time saving in the choice of their modes. They also believed that the service quality level of transportation facilities affects the travel time saving and its value. The factor of COP depicts the auto-oriented attitudes of the respondents in the mode selection, as most of them did not like to wait for public transport modes. It means that their travel attitudes were more inclined towards private transport-seeking travel time saving. The results of ATTI depict the travelers’ propensity to accept an increase in travel time could be agreed for any reason. The increase in travel time could be due to high traffic demand and unexpected events such as accidents and bad weather. The respondents’ expresses a willingness for up to a 5 min increase in travel time. Again, the estimated values of Cronbach’s alpha are more than 0.7 which confirm the acceptability of the rotated factors as the internal consistency and reliability of the respondents’ evaluation. The detailed factor loadings can be seen in Table 2.

4.9. Factor Analysis of Respondents’ Travel Interests Considering Travel Time Saving

The third EFA was conducted on respondents’ interests in various travel alternatives. This analysis resulted in five factors and categorized the travel choices. These five factors included public transport modes (PTM), personal car traveling alone (PCTA), short route propensity (SRP), personal car traveling with others (PCTO), and long route propensity (LRP). These five factors explain more than 60% of the variance in the results as shown in Table 3. The estimated Cronbach’s alpha values are more than 0.7 of all five factors, which depict that the extracted factors have an acceptable level of reliability, and the respondents have internal consistency in their evaluation. The PTM factor shows the respondent’s interest in selecting public transport modes seeking travel time saving. The value of the Cronbach’s alpha is more than 0.7 which shows that there is internal consistency among the responses’ evaluation. It implies that the travelers’ Interests to use taxis and buses are quite low while focusing on travel time saving.
The travel interests to use a private car alone and travel with a flexible schedule are quite high as indicated by the factor of PCTA. The travelers’ propensity to use long routes with high-speed limits and no traffic signals were high compared to short routes with traffic lights and low-speed limits. It shows that some travelers would prefer long routes over short routes to avoid delays at the traffic signal and more travel time on low-speed roads. This implies that the respondents’ propensity regarding high travel speed was greater as compared to stopover routes along the shorter routes. The travelers have shown good interest in using a private car with family members and colleagues when they needed to save travel time as depicted by the PCTO factor. It infers that when respondents travel with family members, they would prefer to use private car as compared to taxi and public transport. However, traveling with family members has more tendencies to save travel time than traveling with friends or colleagues as it can be depicted with the mode choice behavior of the respondents.

4.10. Regression Analysis of Travelers’ Time Saving Interests

Regression analysis was conducted between extracted factors in Table 1, Table 2 and Table 3. The factors of Table 1 and Table 2 were treated as independent latent variables and factors of Table 3 were utilized as dependent variables. The standardized estimates of regression equations are presented in Table 4 with their level of significance. Results of the regression analysis show that TCS, TTSP, and COP have significant correlations with travelers’ interests in using public transport modes. The negative coefficient of TCS with PTM shows that those respondents who placed high importance on time and cost savings would not prefer to use public transport modes such as taxis and buses. The TTSP and COP have a positive association with PTM, which depicts that there are travelers who may use taxi and bus services despite having positive attitudes towards private transport.
The positive and significant relationships of FRT and TCS with PCTA show that the travelers who give high importance to flexibility, reliability, time, and cost saving in traveling were more likely to travel alone to save travel time. The TTSP and COP also have positive and significant correlations with PCTA, which depict that the travelers’ high priorities for time and cost savings and car-oriented attitudes had a direct bearing on their alone travel patterns. The short route propensity of travelers is positively related to time and cost saving factors. Similarly, the time and cost savings and car-oriented attitudes had a positive association with the choice of a short route to save travel time. The time and cost saving importance levels are positively associated with private car preferences while traveling with others. However, travelers who cared about their priorities had a low likelihood to travel with others while their focus was to save travel time. The flexibility and reliability factor had a negative association with long route priorities, which shows that the travelers who give more importance to flexibility and reliability in traveling had low preferences for choose the longer route (Table 5). The relationships of TCS, PPT, and TTSP are positive with LRP, which shows that the respondents with high importance of time and cost saving and personal priorities were more likely to choose a long route for traveling. The indices of goodness fit parameters such as CMIN/DF are between 2–5, and values of GFI and CFI are near 0.9 [37,38], which depicts good reliability of the regression analysis results.

4.11. Discussion on Results

The survey and analysis results revealed that respondents had high beliefs on value of travel saving and concerning transportation infrastructure characteristics. It is evident that the time saving has major influence in the choice of route and travel modes of the travelers. The other studies have also shown the value of time saving in mode choice preferences using various models [16]. The perceived flexibility in traveling, cost savings, and traveling alone are also significant in determining travel mode preferences of riders. The situational constraints such as traveling with family members and friends also have significant impact on mode choice behavior [39]. It is evident that in the context of Oman, social and family constraints play important roles in the selection of travel mode as most of the local people avoid selecting shared and public transport modes. It is well known that such coupling and social constraints have a significant influence on choice of travel alternatives [39,40]. The increased travel cost can have an impact on changing travel behavior patterns, especially those travelers who fall in a captive group. It is required to focus on mobility needs of captive riders through provision of better public transport facilities.
On providing alternative travel modes, future policies should keep in view the mobility needs of groups in the travel market. Considering people’s preferences and perceptions, it is suggested that state authorities focus on developing public transport facilities in the main cities such as Muscat. Such facilities may include a bus rapid transit service or a metro-train on the main arteries of the city. The provision of such facility would provide a faster mode of transport to the residents which helps them to save travel time. Additionally, the public transport modes can be integrated with mass transit modes to enhance the efficiency of the transit network and improve the accessibility. The shared transport modes can help in reducing the auto traffic on roads and reduce travel delays.

5. Conclusions

The survey results showed that more than 73% of people use a car for transport which implies that most of them do not like to wait for public transport modes. It means that their travel attitudes are more inclined towards private transport seeking travel time savings. Most people do not like to share cars with others when traveling, which can be confirmed with the fact that 44% of the respondents use private cars alone to give high importance to flexibility, reliability, and time and cost saving in traveling and are more likely to travel alone to save travel time. The people’s short route propensity is positively related to time and cost saving factors. Similarly, the time and cost savings and car-oriented attitudes have a positive association with the choice of a short route to save travel time. Most of the respondents agreed that they put more beliefs on travel time reliability and time saving in the choice of their modes. They also believed that the service quality level of transportation facilities affects the travel time saving and its value. Most respondents accepted an increase in travel time fo good reasons. The increase in travel time could be due to high traffic demand and unexpected events such as accidents and bad weather. The respondents’ willingness was more for up to a 5 min increase in the travel time. The travelers’ propensity to use long routes with high-speed limits and no traffic signals were higher than short routes with traffic lights and low-speed limits. This shows that some travelers would prefer long routes over shorter routes to avoid delays at the traffic signal and more travel time on low-speed roads. The travelers showed high interest in using a private car with family members and colleagues when they needed to save travel time. However, traveling with family members has more tendencies to save travel time than traveling with friends or colleagues. Most of the travelers who placed high importance o flexibility, reliability, time, and cost saving in traveling were more likely to travel alone to save travel time. The flexibility and reliability factor has a negative association with long route priorities, which shows that the travelers who placed more importance on flexibility and reliability in traveling had low preferences for choosing the longer routes.
It is pertinent to mention that there is a need to improve the current public transport infrastructure. One of the reasons for the low propensity of the respondents to use public transport can be attributed to the fact that current transport infrastructure is not sufficient to accommodate the needs of the commuters. From the results, many people prefer to use the private car because it provides them with more comfort and flexibility than bus and taxi services. The improvement in the bus and taxi services and its development will help in enhancing the use of the bus and taxi greatly so that it can save the time and cost of traveling. There is also a need to improve the service quality level of transportation facilities, e.g., road infrastructure in Oman, as most people’s beliefs affect the travel time saving. This research focused on various factors pertinent to the travel time saving perceptions of the commuters. It is recommended to consider other infrastructural, social, and behavioral factors in the evaluation that affect the value of travel time saving. A more extensive and comprehensive evaluation through detailed survey is needed in order to determine the exact willingness of travelers to estimate the exact value of travel time saving.

Author Contributions

Conceptualization, M.A.J. and H.S.A.-K.; methodology, S.S.A.-A.; software, M.A.J. and H.S.A.-K.; validation, M.A.J. and H.S.A.-K. and N.A.; formal analysis, N.A.; investigation, N.A.; resources, N.A.; data curation, M.A.J.; writing—original draft preparation, M.A.J.; writing—review and editing, N.A.; visualization, N.A.; supervision, P.J.; project administration, K.C.; funding acquisition, P.J. All authors have read and agreed to the published version of the manuscript.

Funding

This research received no external funding.

Institutional Review Board Statement

Ethical review and approval were waived for this study, due to this study being a non-interventional study that did not involve biological human experimentsand patient data. In addition, this study was completely voluntary and non-coercive, and responsesremain anonymous.

Informed Consent Statement

The respondents were informed that their responses would remain anonymous and would be used for research purposes only.

Data Availability Statement

The data can be made available from the corresponding author upon reasonable request.

Acknowledgments

This work was supported by the Thammasat Research Unit in Infrastructure Inspection and Monitoring, Repair and Strengthening (IIMRS), Thammasat School of Engineering, Faculty of Engineering, Thammasat University Rangsit, Klong Luang Pathumthani, Thailand. Thanks are also extended to the Research and Innovation Development Unit for Infrastructure and Rail Transportation Structural System (RIDIR), Research and Innovation Development Unit for Infrastructure and Rail Transportation Structural System (RIDIR), Srinakharinwirot University, Nakhonnayok, Thailand for supporting this research. The authors are thankful to all the people who participated in the questionnaire survey and helped in completing this research.

Conflicts of Interest

The authors declare no conflict of interests.

References

  1. National Center for Statistics and Information. Monthly Statistical Bulletin. Available online: https://www.ncsi.gov.om/Elibrary/Pages/LibraryContentDetails.aspx?ItemID=MgTlAFqddgBeormy3YBZDg%3D%3D (accessed on 7 May 2022).
  2. Worldometer Oman Demographics 2020 (Population, Age, Sex, Trends)—Worldometer. Available online: https://www.worldometers.info/demographics/oman-demographics/ (accessed on 31 May 2022).
  3. Al Subhi, A.K. Women’s Representation in Majlis Al Shura in Oman: How Do Gender Ideology, Islam, and Tribalism Matter? Iowa State University, Digital Repository: Ames, IA, USA, 2016. [Google Scholar]
  4. Javid, M.A.; Al-Hashmi, W.Y.; Al-Shaqsi, A.S. Exploring the Student’s Perceptions on Safety Aspects of the University of Nizwa Bus Service in Oman. Iran. J. Sci. Technol.—Trans. Civ. Eng. 2020, 45, 227–239. [Google Scholar] [CrossRef]
  5. Belwal, R. People’s Perception of Public Transport Services in Oman. J. Teknol. Sci. Eng. 2013, 65, 9–16. [Google Scholar] [CrossRef] [Green Version]
  6. Belwal, R.; Belwal, S. Public Transportation Services in Oman: A Study of Public Perceptions. J. Public Transp. 2010, 13, 1. [Google Scholar] [CrossRef] [Green Version]
  7. Carrion, C.; Levinson, D. Value of Travel Time Reliability: A Review of Current Evidence. Transp. Res. Part A Policy Pract. 2012, 46, 720–741. [Google Scholar] [CrossRef] [Green Version]
  8. Martens, K.; Di Ciommo, F. Travel Time Savings, Accessibility Gains and Equity Effects in Cost–Benefit Analysis. Transp. Rev. 2017, 37, 152–169. [Google Scholar] [CrossRef]
  9. Batley, R.; Bates, J.; Bliemer, M.; Börjesson, M.; Bourdon, J.; Cabral, M.O.; Chintakayala, P.K.; Choudhury, C.; Daly, A.; Dekker, T.; et al. New Appraisal Values of Travel Time Saving and Reliability in Great Britain. Transportation 2019, 46, 583–621. [Google Scholar] [CrossRef]
  10. Barrett, J. The Impact of Transportation Infrastructure on the Value of Time; University of California: Los Angeles, CA, USA, 2010. [Google Scholar]
  11. Schmid, B.; Molloy, J.; Peer, S.; Jokubauskaite, S.; Aschauer, F.; Hössinger, R.; Gerike, R.; Jara-Diaz, S.R.; Axhausen, K.W. The Value of Travel Time Savings and the Value of Leisure in Zurich: Estimation, Decomposition and Policy Implications. Transp. Res. Part A Policy Pract. 2021, 150, 186–215. [Google Scholar] [CrossRef]
  12. Burris, M.; Spiegelman, C.; Abir, A.K.M.; Lee, S. Value of Travel Time. Available online: https://static.tti.tamu.edu/tti.tamu.edu/documents/PRC-2016-4.pdf (accessed on 7 May 2022).
  13. Athira, I.C.; Muneera, C.P.; Krishnamurthy, K.; Anjaneyulu, M.V.L.R. Estimation of Value of Travel Time for Work Trips. Transp. Res. Procedia 2016, 17, 116–123. [Google Scholar] [CrossRef]
  14. Shariff, N.M.; Shah, M.Z. Factors Influencing Travel Behavior and Their Potential Solution: A Review of Current Literatures. J. Alam Bina 2008, 11, 19–28. [Google Scholar]
  15. Dewi, A.U. Research on Factors Affecting Travel Behaviour on Choice of Transportation Means for Working Activity: A Case Study in Yog Yakarta City, Indonesia; Karlstads University: Karlstad, Sweden, 2010. [Google Scholar]
  16. Vrtic, M.; Schuessler, N.; Erath, A.; Axhausen, K.W. The Impacts of Road Pricing on Route and Mode Choice Behaviour. J. Choice Model. 2010, 3, 109–126. [Google Scholar] [CrossRef] [Green Version]
  17. Shao, C.Q.; Liu, Y.; Liu, X.M. Valuation of Travel Time Savings in Viewpoint of WTA. Comput. Intell. Neurosci. 2014, 2014. [Google Scholar] [CrossRef]
  18. Kato, H.; Fujiu, M. How does the value of travel time saving vary over the individual’s income? J. East. Asia Soc. Transp. Stud. 2007, 7, 128–140. [Google Scholar] [CrossRef]
  19. Van Wee, B.; Rietveld, P.; Meurs, H. Is Average Daily Travel Time Expenditure Constant? In Search of Explanations for an Increase in Average Travel Time. J. Transp. Geogr. 2006, 14, 109–122. [Google Scholar] [CrossRef]
  20. Bouscasse, H.; de Lapparent, M. Perceived Comfort and Values of Travel Time Savings in the Rhône-Alpes Region. Transp. Res. Part A Policy Pract. 2019, 124, 370–387. [Google Scholar] [CrossRef]
  21. Román, C.; Martín, J.C.; Espino, R.; Cherchi, E.; de Dios Ortúzar, J.; Rizzi, L.I.; González, R.M.; Amador, F.J. Valuation of Travel Time Savings for Intercity Travel: The Madrid-Barcelona Corridor. Transp. Policy 2014, 36, 105–117. [Google Scholar] [CrossRef]
  22. Jara-Diaz, S.R. Consumer’s Surplus and the Value of Travel Time Savings. Transp. Res. Part B 1990, 24, 73–77. [Google Scholar] [CrossRef]
  23. Jara-Díaz, S.R. Allocation and Valuation of Travel-Time Savings. In Handbook of Transport Modelling; Hensher, D.A., Button, K.J., Eds.; Emerald Group Publishing Limited: Bingley, UK, 2007; Volume 1, pp. 363–379. ISBN 978-0-08-045376-7. [Google Scholar]
  24. Jara Díaz, S.R.; Guevara, C.A. Behind the Subjective Value of Travel Time Savings: The Perception of Work, Leisure, and Travel from a Joint Mode Choice Activity Model. J. Transp. Econ. Policy 2003, 37, 29–46. [Google Scholar]
  25. Zhu, Z.; Chen, H.; Ma, J.; He, Y.; Chen, J.; Sun, J. Exploring the Relationship between Walking and Emotional Health in China. Int. J. Environ. Res. Public Health 2020, 17, 8804. [Google Scholar] [CrossRef]
  26. Zhu, Z.; Chen, H.; Chen, J.; Ma, J.; He, Y. The Effect of Commuting Time on Job Stress in Obese Men With Different Exercise Frequency in China. Am. J. Mens. Health 2020, 14, 1557988320975542. [Google Scholar] [CrossRef]
  27. Malichová, E.; Pourhashem, G.; Kováĉiková, T.; Hudák, M. Users’ Perception of Value of Travel Time and Value of Ridesharing Impacts on Europeans’ Ridesharing Participation Intention: A Case Study Based on MoTiV European-Wide Mobility and Behavioral Pattern Dataset. Sustainability 2020, 12, 4118. [Google Scholar] [CrossRef]
  28. Vagias, W.M. Likert-Type Scale Response Anchors. Available online: https://www.crcaih.org/assets/Resources/sample-scales.pdf (accessed on 30 May 2022).
  29. Taber, K.S. The Use of Cronbach’s Alpha When Developing and Reporting Research Instruments in Science Education. Res. Sci. Educ. 2018, 48, 1273–1296. [Google Scholar] [CrossRef]
  30. Tavakol, M.; Dennick, R. Making Sense of Cronbach’s Alpha. Int. J. Med. Educ. 2011, 2, 53–55. [Google Scholar] [CrossRef] [PubMed]
  31. De Oña, J.; De Oña, R.; Eboli, L.; Mazzulla, G. Perceived Service Quality in Bus Transit Service: A Structural Equation Approach. Transp. Policy 2013, 29, 219–226. [Google Scholar] [CrossRef]
  32. Wang, Y.; Cao, M.; Liu, Y.; Ye, R.; Gao, X.; Ma, L. Public Transport Equity in Shenyang: Using Structural Equation Modelling. Res. Transp. Bus. Manag. 2020, 42, 100555. [Google Scholar] [CrossRef]
  33. Javid, M.A.; Al-Roushdi, A.F.A. Causal Factors of Driver’s Speeding Behaviour, a Case Study in Oman: Role of Norms, Personality, and Exposure Aspects. Int. J. Civ. Eng. 2019, 17, 1409–1419. [Google Scholar] [CrossRef]
  34. Javid, M.A.; Ali, N.; Abdullah, M.; Shah, S.A.H. Integrating the Norm Activation Model (NAM) Theory in Explaining Factors Affecting Drivers’ Speeding Behaviour in Lahore. KSCE J. Civ. Eng. 2021, 25, 2701–2712. [Google Scholar] [CrossRef]
  35. Javid, M.A.; Al-Hashimi, A.R. Significance of Attitudes, Passion and Cultural Factors in Driver’s Speeding Behavior in Oman: Application of Theory of Planned Behavior. Int. J. Inj. Contr. Saf. Promot. 2020, 27, 172–180. [Google Scholar] [CrossRef]
  36. Javid, M.A.; Al-Neama, M.Y. Identification of Factors Causing Driver’s Distraction in Oman. J. Appl. Eng. Sci. 2018, 16, 153–160. [Google Scholar] [CrossRef]
  37. Sahoo, M. Structural Equation Modeling: Threshold Criteria for Assessing Model Fit. In Methodological Issues in Management Research: Advances, Challenges, and the Way Ahead; Emerald Publishing Limited: Bingley, UK, 2019; pp. 269–276. [Google Scholar] [CrossRef]
  38. Bentler, P.M.; Bonett, D.G. Significance Tests and Goodness of Fit in the Analysis of Covariance Structures. Psychol. Bull. 1980, 88, 588–606. [Google Scholar] [CrossRef]
  39. Javid, M.A.; Okamura, T.; Nakamura, F.; Tanaka, S.; Wang, R. People’s Behavioral Intentions towards Public Transport in Lahore: Role of Situational Constraints, Mobility Restrictions and Incentives. KSCE J. Civ. Eng. 2016, 20, 401–410. [Google Scholar] [CrossRef]
  40. Klöckner, C.A.; Friedrichsmeier, T. A Multi-Level Approach to Travel Mode Choice—How Person Characteristics and Situation Specific Aspects Determine Car Use in a Student Sample. Transp. Res. Part F Traffic Psychol. Behav. 2011, 14, 261–277. [Google Scholar] [CrossRef]
Figure 1. Distribution of respondents’ level of importance for travel time saving.
Infrastructures 07 00078 g001
Figure 2. Distribution of response preferences in mode choice behaviors.
Infrastructures 07 00078 g002
Figure 3. Distribution of responses level of interests in different scenarios for the travel time saving.
Infrastructures 07 00078 g003
Figure 4. Distribution of willingness to pay for various levels of travel time saving.
Infrastructures 07 00078 g004
Table 1. Factors influencing the decision making process regarding VOT [27].
Internal FactorsExternal Factors
1- 
Psychological factors:
1—
Attitudes and preferences related to commuting
2—
Attitudes and preferences related to privacy
3—
Attitudes and preferences related to comfort
4—
Attitudes and preferences related to social interaction
5—
Attitudes and preferences related to the protection of the environment
6—
Preferences of a commuter regarding the driver
1- 
Situational factors:
1—
Accessibility of public transport
2—
Price of fuel/transport costs
3—
Commute time
4—
Distance to the target destination
5—
Size of the employer company
6—
Population density
7—
Time spent waiting for a shared ride
2- 
Social—demographic characteristics:
1—
Age
2—
Income
3—
Marital status
4—
Number of cars in household
2- 
Interventions:
1—
Parking discounts
2—
Reward programs
3—
Partner—matching programs
4—
Guaranteed ride home
Table 2. Rotated factor loadings of important travel time saving attributes.
Observed Variables MeanStandard DeviationFactors
FRTTCSPPT
The flexibility of travel schedule to save travel time3.6891.2200.762
The flexibility of travel route to save travel time3.7221.1870.726
Travel time reliability3.5571.1900.611
Travel time saving3.6571.304 0.794
Travel cost saving3.8191.266 0.728
Traveling alone to save travel time2.8641.251 0.831
Traveling in off-peak hours to save travel time3.3591.260 0.516
% of variance explained 26.30825.23919.510
Cronbach’s Alpha0.9070.8650.715
Note: FRT: flexibility and reliability in traveling, TCS: time and cost savings, PPT: personal preferences in traveling.
Table 3. Rotated factor loadings of preferences in traveling.
Observed Variables MeanStandard DeviationFactor
TTSPATTICOP
I prefer travel time reliability to travel cost in traveling.3.5341.0850.706
I use a car because it saves travel time.3.7771.1300.606
I prefer time saving over cost saving in traveling.3.3821.0940.576
The level of transportation infrastructure influences the value of travel time.3.9581.0700.550
It is acceptable for me if there is an increase in travel time from 6–10 min.3.0191.137 0.898
It is acceptable for me if there is an increase in travel time from 11–15 min.2.5991.269 0.747
It is acceptable for me if there is an increase in travel time up to 5 min.3.3721.029 0.603
I have to wait a long time if I need to travel by taxi.3.4951.161 0.895
I have to wait a long time if I need to travel by bus.3.6891.187 0.677
% of variance explained17.83616.70616.700
Cronbach’s Alpha0.7060.8050.812
Note: COP: car-oriented priorities, ATTI: acceptability of travel time increase, TTSP: travel time saving priorities.
Table 4. Rotated factor loadings of travel interests with travel time saving preferences.
Observed VariablesMeanStandard DeviationFactor
PTMPCTASRPPCTOLRP
In a taxi with friends/colleagues2.3821.2630.756
In a taxi with strangers1.8741.1870.727
In a taxi alone2.1811.2400.702
In a taxi with family members2.3721.2790.662
In a public transport bus2.5021.2810.626
Private car alone3.3711.303 0.744
On a private car with a flexible working/study schedule3.5021.286 0.652
Short route with a lower speed limit (e.g., 80 km/h)2.9841.234 0.799
Short route with traffic signal3.0391.299 0.563
Private car with friends/colleagues3.2691.293 0.701
Private car with family members3.6891.317 0.626
Long route with a higher speed limit (e.g., 120 km/h)3.4271.346 0.668
Long route with no traffic signal3.4241.367 0.642
% of variance explained19.3510.9510.8910.4510.32
Cronbach’s Alpha0.8560.7870.7530.7850.757
Note: PTM: public transport modes, PCTA: personal car traveling alone, SRP: short route propensity, PCTO: personal car traveling with others, LRP: long route propensity.
Table 5. Standardized estimates of regression equations.
Latent VariablesPTMPCTASRPPCTOLRP
FRT0.110.26 *0.040.12−0.30 **
TCS−0.28 **0.19 *0.13 *0.39 ***0.40 ***
PPT0.11−0.080.06−0.19*0.29 **
TTSP0.20 ***0.36 ***0.27 ***0.52 ***0.40 ***
COP0.19 **0.27 ***0.15 *−0.050.07
Indices of Goodness of fit parameters
CMIN/DF4.0394.7414.7414.7934.836
GFI0.8470.8560.8570.8550.854
AGFI0.7940.7900.7910.7880.786
CFI0.8670.8770.8720.8750.871
Note: *** significant at 1% (p < 0.01), ** significant at 5% (p < 0.05), * significant at 10% (p < 0.1).
Publisher’s Note: MDPI stays neutral with regard to jurisdictional claims in published maps and institutional affiliations.

