Article

Structural Performance of Acute Corners on Skewed Bridge Decks Using Non-Linear Modeling of the Deck Parapet

1
Structures Group, WSP USA, 500 Winding Brook Drive, Glastonbury, CT 06033, USA
2
Civil and Environmental Engineering Department, University of Connecticut, 261 Glenbrook Road, Unit 3037, Storrs, CT 06269, USA
*
Author to whom correspondence should be addressed.
Infrastructures 2022, 7(6), 77; https://doi.org/10.3390/infrastructures7060077
Submission received: 28 April 2022 / Revised: 27 May 2022 / Accepted: 1 June 2022 / Published: 2 June 2022
(This article belongs to the Special Issue Structural Performances of Bridges)

Abstract

:
In modern transportation projects, the demand for skewed bridges is increasing. Restrictive site constraints, particularly in urban infrastructure projects, yield severely skewed bridges that demand specific design and construction considerations. In particular, the acute corners have reinforcement details that are challenging to construct and often perform poorly. Although the Federal Highway Administration has recognized this problem, to date a simplified detail has not been suggested and evaluated. To tackle this challenge, the Connecticut Department of Transportation partnered with the University of Connecticut to propose a simplified reinforcement detail for acute corners that replaces the normal transverse reinforcement with reinforcement placed along the skew with specific detailing to avoid congestion. An analytical study was conducted using CSiBridge to evaluate the performance of the detail with different skew angles. A series of pushover analyses were performed to capture the flexural yielding of the parapet and measure the stresses in the reinforcing bars in the slab. Based on these findings, a simplified detail for the acute corner of skewed bridge decks is provided.

1. Introduction

In modern transportation projects, the demand for skewed bridges is increasing due to restrictive site constraints, such as those in urban infrastructure projects. The need for skewed bridges and the severity of the skew required has grown significantly [1]. High skew angles challenge current design standards and add complexity to construction, specifically at the acute corners of the deck [1]. The congested reinforcement details in this area lead to several problems with placing and compacting concrete, as well as problems with post-construction deck cracking. According to a report from FHWA, it is often difficult to adequately reinforce the acute corners of skewed concrete decks [2]. Traditionally, transverse reinforcement is placed normal to the girders. As such, as the angle of the skew increases, substantial portions of the deck are left unreinforced as the transverse bars are too short to fully develop. Thus, it is typically necessary to detail diagonal bars that extend into the deck over the girders to carry the deck overhang loads.
Although there has been significant research related to the impact of skew on bridge performance, particularly in relation to seismic performance [3,4,5,6,7,8], research on the cause and impacts of cracking in the acute corner is limited [9,10,11,12]. Michigan DOT sponsored a comprehensive survey completed by Fu et al. on Bridge Deck Corner Cracking on Skewed Structures [9] to collect information from state transportation agencies across the country. The information collected included the observed severity and behavior of the concrete deck corner cracking, actions taken to address the cracking, and special design requirements for the deck and reinforcement. The study found that twelve out of seventeen agencies reported corner cracking in more than 25% of their skewed concrete decks. Fourteen out of seventeen agencies indicated that the most common cracking location is the acute corner of the deck. This finding was reinforced by additional research studies [11,12,13,14]. Arancibia et al. studied the impact of skew on deck cracking using nonlinear finite element analysis. They showed that high skews created larger tensile strains in the deck compared to bridges with no skew. In addition, skewed bridges have concentrated tensile strains at the acute corner and a diagonal cracking pattern at this location [11].
Okumus and Arancibia used non-linear finite element analysis to study the types of service loads that cause in-service cracks, and how skew impacts the cracking [10]. They also evaluated crack mitigation measures, including reducing end restraint, varying bearing arrangements, and changing the amount and orientation of reinforcement. They found that orienting the transverse deck reinforcement parallel to the abutment rather than perpendicular to bridge centerline or increasing the amount of deck reinforcement resulted in more cracking [10]. This was attributed to the reinforcement restraining the deck shrinkage. Although Okumus and Arancibia found that increasing the level of reinforcement led to decreased performance in terms of cracking [10], in general, larger skews require more steel and specific reinforcing arrangements [9].
In regard to the current practice of reinforcement arrangements at the acute corner, Fu et al. noted that four states specify a cutoff skew angle at which the reinforcement may no longer follow the skew angle [9]. This cutoff angle ranges from 15 to 30 degrees, while AASHTO LRFD specifies a cutoff angle of 25 degrees. Furthermore, seven states have specific design requirements for additional reinforcement. Three of these states (Arizona, Arkansas, and Minnesota) do not indicate limiting skew angles, so their requirements for additional steel are applied to all skewed decks. The other four states specify a skew threshold after which additional reinforcement is required [9].
Although the issue of cracking at the acute corner is discussed in multiple studies and the impacts of reinforcement details are compared, none of the studies described herein explicitly propose a new detail or study reinforcement details under extreme loads imposed by truck collision. To address these challenges, the Connecticut Department of Transportation (CTDOT) partnered with the University of Connecticut to develop a simplified reinforcement detail. This study investigated the effects of key design parameters, including skew angle, overhang length, and orientation of the reinforcement on the deck performance at the acute corner under load cases specified by the AASHTO LRFD Bridge Design Specifications. This was achieved through an extensive analytical study of four prototype skewed bridges, which were designed in accordance with AASHTO LRFD [15]. This study showed that the design of the overhang is governed by the extreme event loading of barrier collision, which gives the highest stresses in the top transverse bars. It was found that the extent of special detailing of the acute corner can be reduced to the area between the first two girders rather than the area between the first three girders. Additionally, the normal transverse reinforcement at the acute corner that has insufficient development length can be replaced by reinforcement placed along the skew. With the updated detailing, thickening the slab is not necessary to meet the design requirements. Based on these findings, a simplified detail for the acute corner of skewed bridges is proposed. This detail is expected to address the design and construction challenges of the current practice.

2. Materials and Methods

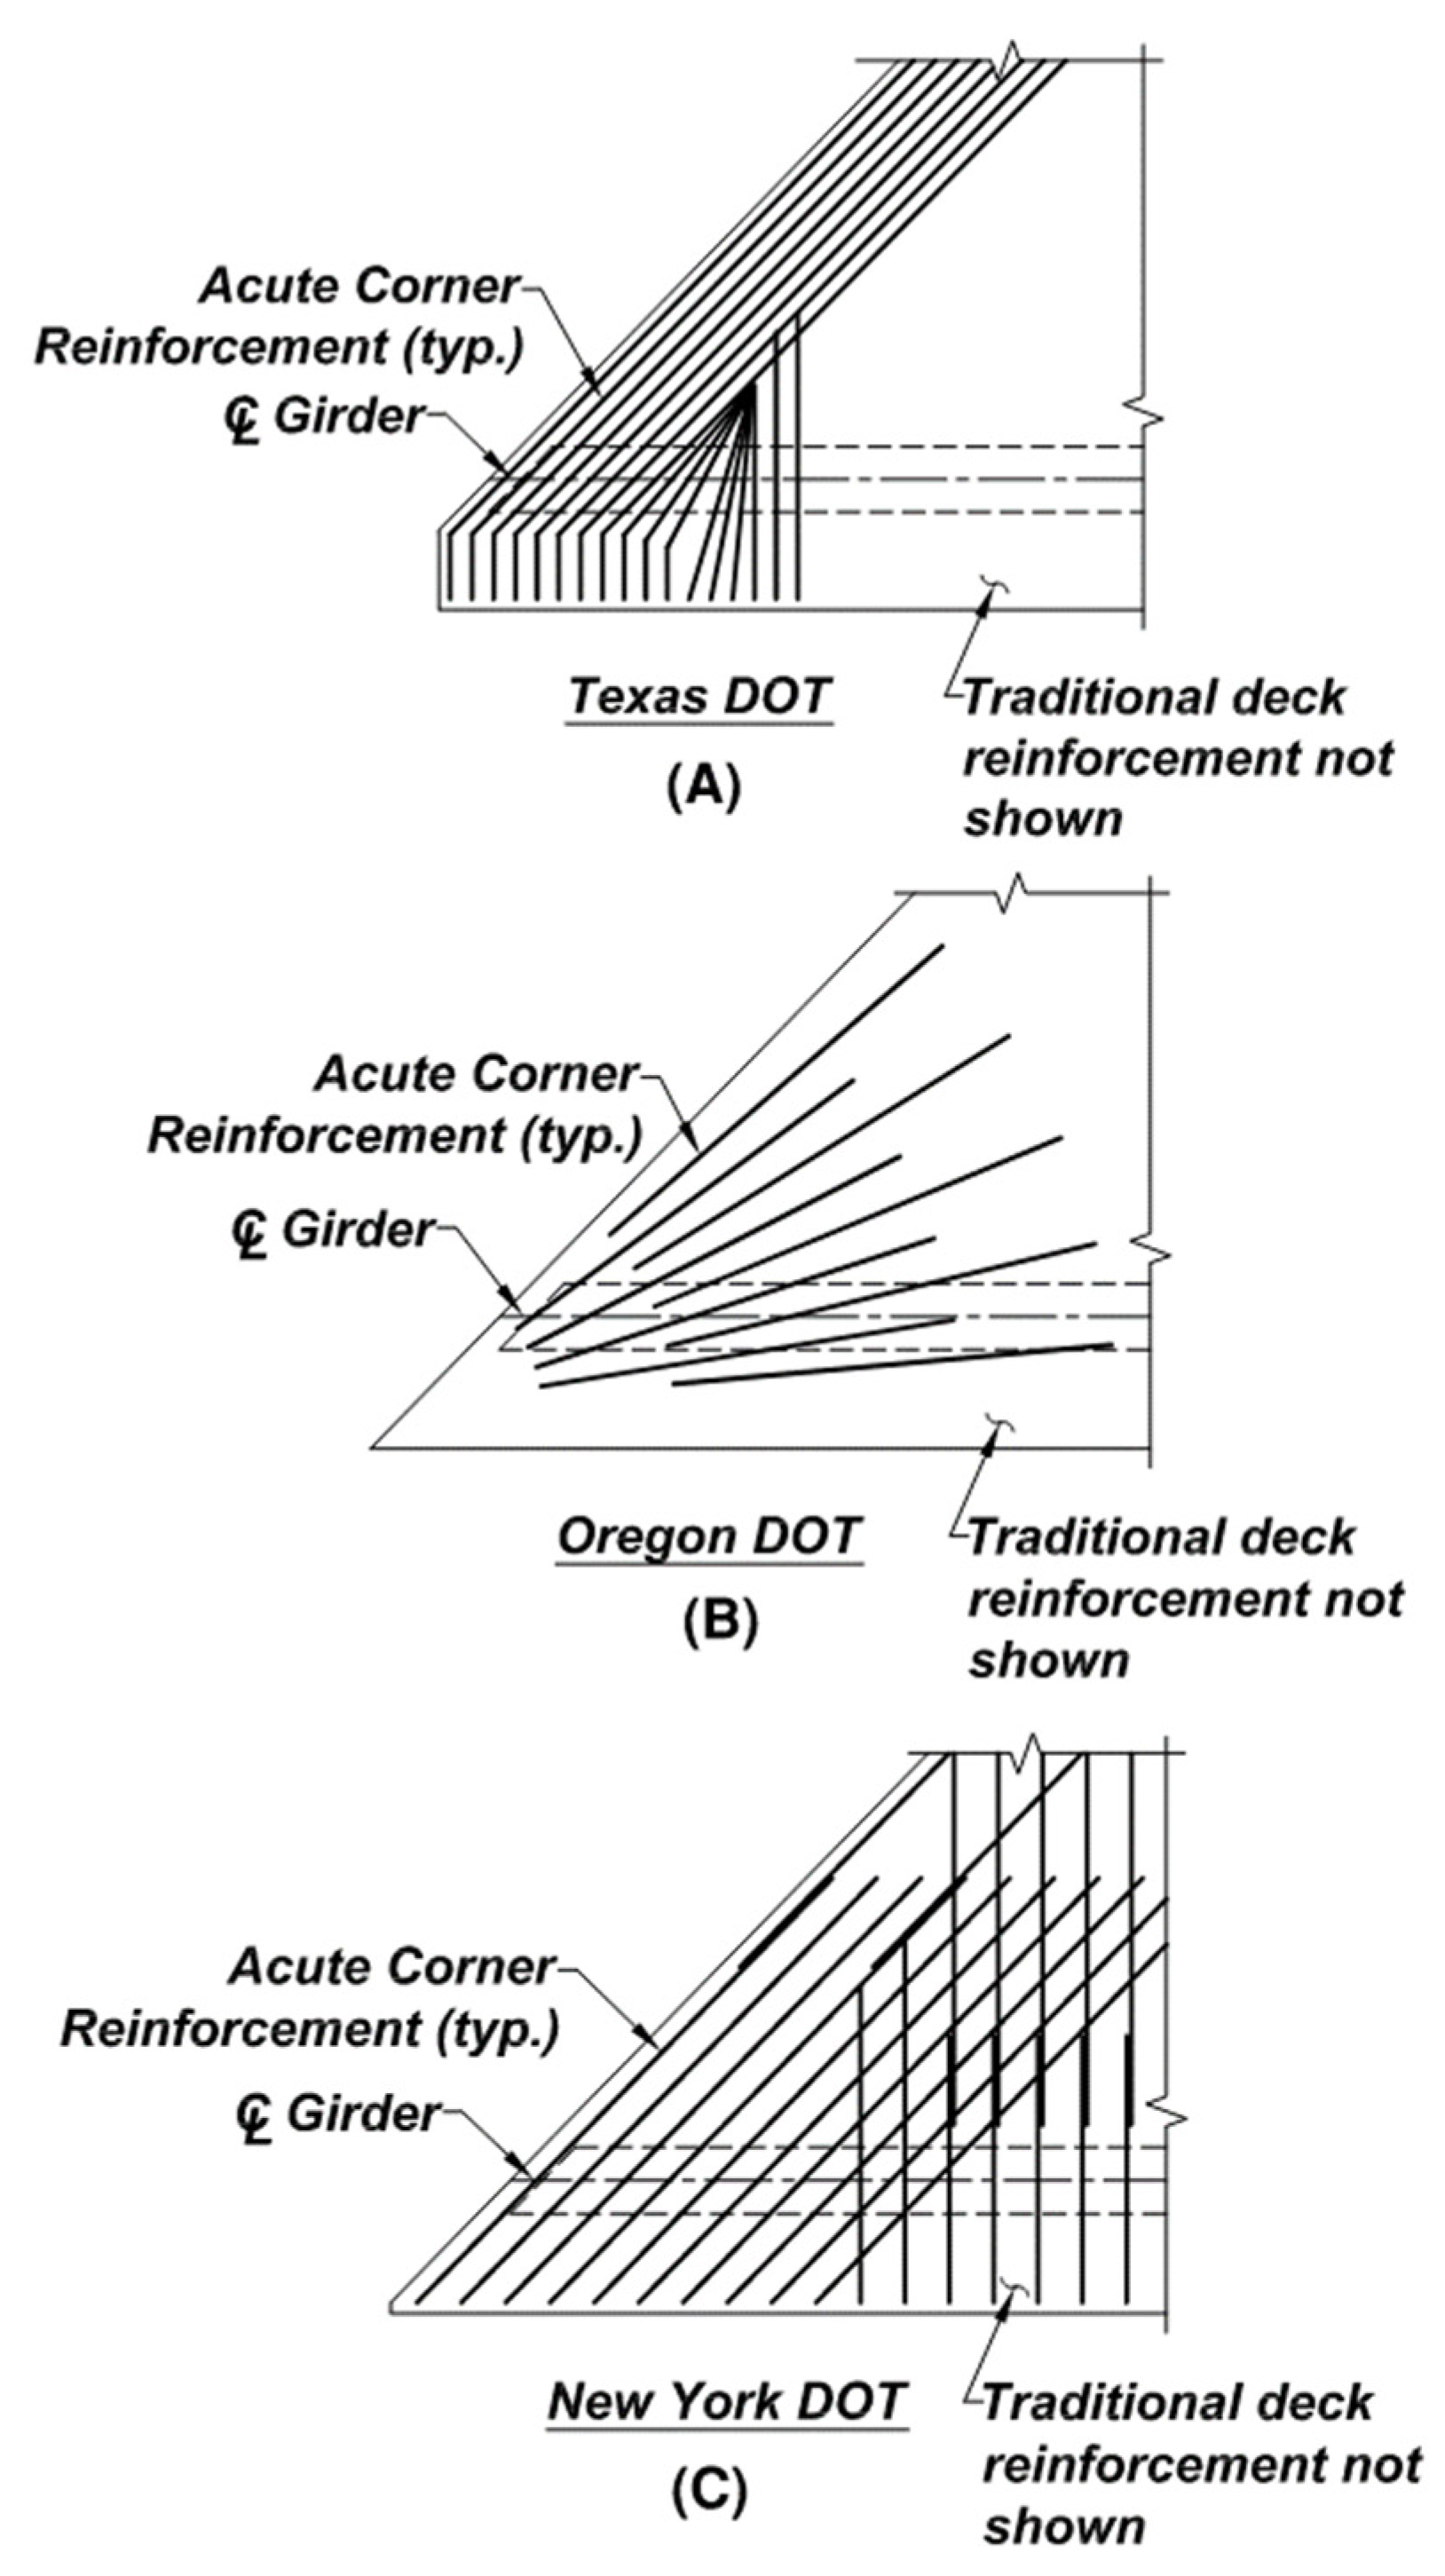
2.1. Current Practice in the Design of Acute Corner Reinforcement Details

There is no uniform design method offered by federal agencies, such as AASHTO or FHWA, to calculate and detail steel reinforcement at the acute corner of bridge decks. Thus, the current details vary substantially between state departments of transportation (DOTs), and the basis of design is unclear. In addition, the available guidelines by state agencies yield complex designs with complicated detailing. Post-construction observations have found that the implementation of these details still result in cracking at the acute corners [9].
The current acute corner detail per the Connecticut Department of Transportation (CTDOT) Bridge Design Manual [16] is used in bridges with a skew angle exceeding 20 degrees, as shown in Figure 1. The deck within this area is thickened. Additional skewed reinforcement is placed in the bottom of the top reinforcement mat, while continuing all typical deck reinforcement. The bottom reinforcement mat is lowered to maintain consistent cover along the bottom of the deck in the thickened region.
This detail includes five layers of congested reinforcement, some of which are ineffective due to insufficient development length. The transverse reinforcement within the thickened area is designed based on the assumption of a simply supported slab. Although this detail has performed well to date, it lacks efficiency in construction because of the complex formwork for the thickened slab. In addition, the structural performance of the deck is not adequate in a vehicle collision event. The normal transverse bars at the acute corner are ineffective due to the inadequate development length. Thus, these bars are unable to contribute to resisting the plastic moment of the barrier. Such inefficiencies and challenges with construction, combined with the high prevalence of skewed bridges, showcase the need for an improved detail.
Several bridge design guidelines published by other state departments of transportation (DOTs) were studied to inform the design of the proposed detail. Texas DOT uses a breakback detail to eliminate or reduce the acute corner area (Figure 2A) [17]. Breakback detailing turns the ends of the skewed deck so that the end is normal to the longitudinal edge of the deck. This detailing eliminates the sharp acute corner of the concrete deck and barriers. Various owner agencies include guidelines for breakback detailing in their design manuals, policy memos, or standard drawing details [1]. Although the breakback improves the deck corner detailing, it complicates details at the abutments and expansion joints. Therefore, the breakback is not the optimal solution for many state agencies. CTDOT uses the breakback detail on a small portion of the deck (limited to the width of the barrier) for skew angles larger than 35 degrees.
The Oregon Department of Transportation (ODOT) specifies that bridges with skews greater than 30 degrees require additional flare pattern steel reinforcement at the acute corners (Figure 2B) [18]. The flared corner steel shall be 10 feet long and placed on top of the upper mat of reinforcement. This detail results in significant congestion at the corner, yet it does not reinforce the overhang in the critical direction. The detail used by the New York State DOT (NYSDOT) allows the transverse bars to be fully developed as the bars in the extreme corner of the deck are placed along the skew (Figure 2C). However, the skewed bars are transitioned to transverse bars perpendicular to the fascia at the same location for the top and bottom bars [19]. Thus, the reinforcement is highly congested, with six layers of reinforcement in three directions. Subsequently, there may be difficulties with concrete placement and consolidation. The three details are shown below in Figure 2.

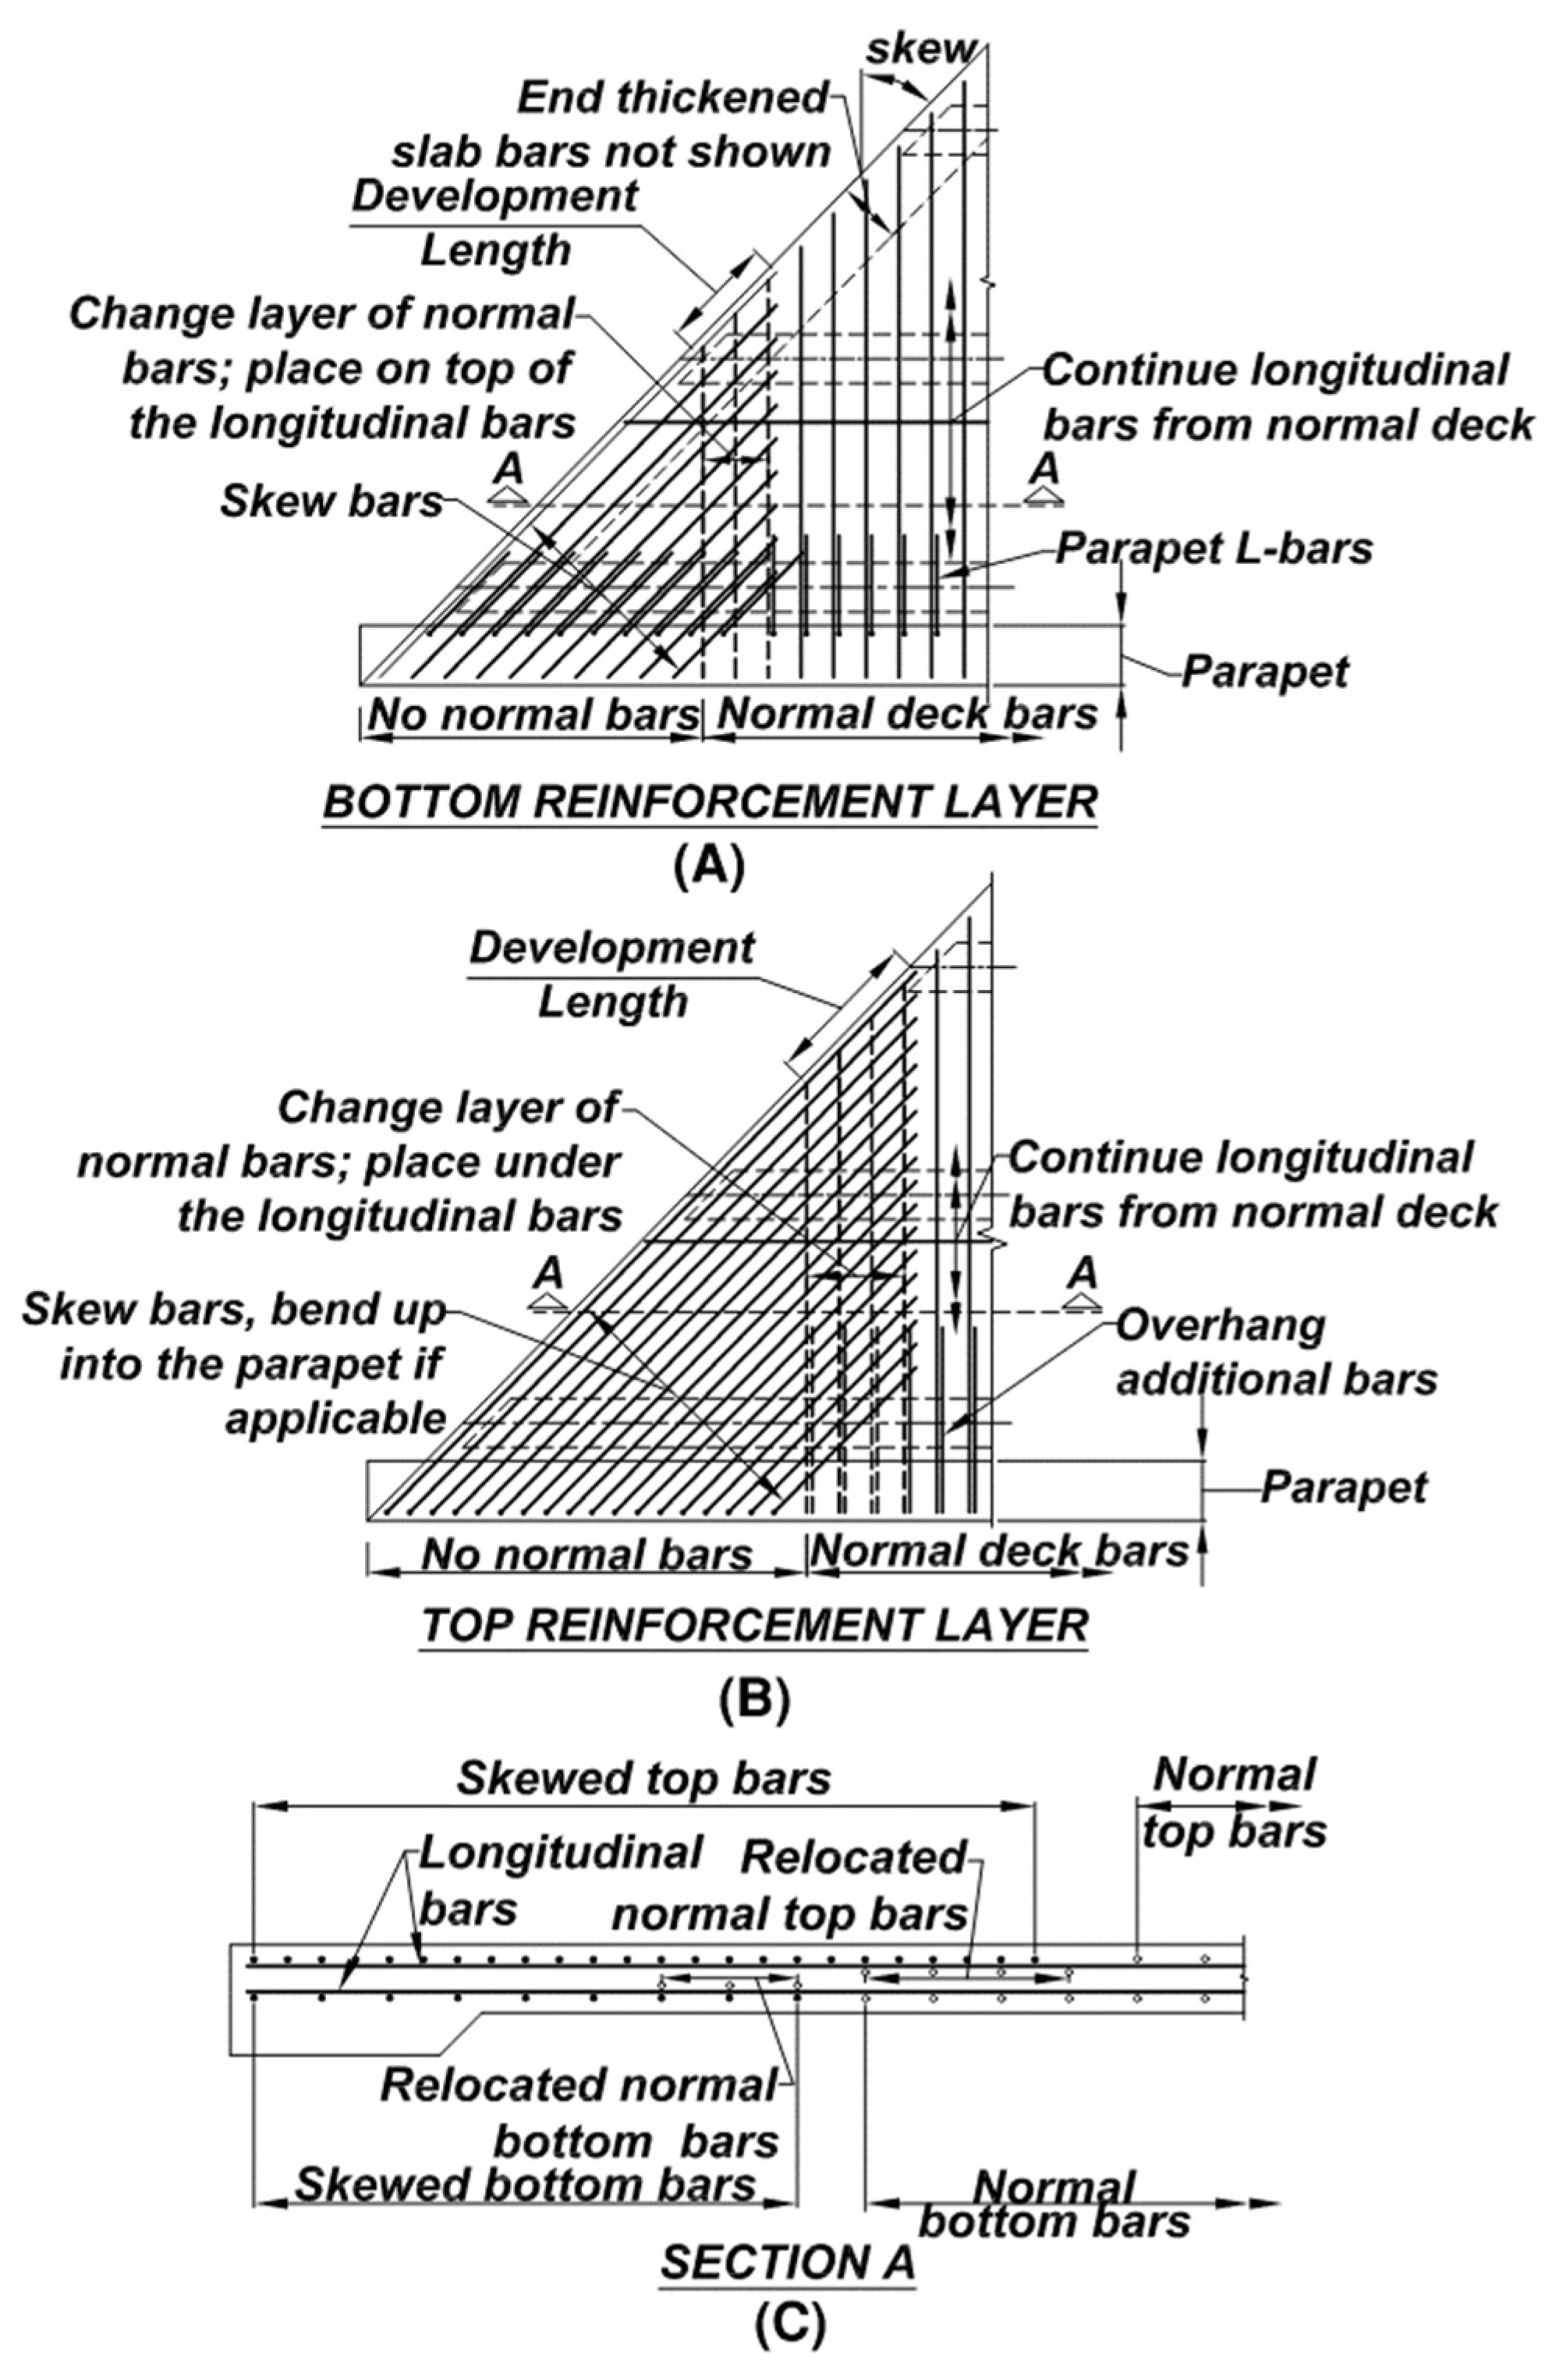
2.2. Proposed Detail for Acute Corner Reinforcing

Following a review of the different details and summarizing the necessary improvements, a new detail for the bridge deck acute corner is proposed and validated in this study. The intention of the proposed detail is to provide the necessary development length, improve constructability by reducing congestion and the number of cut and bent bars, and to create a less complex load path.
The detail proposed is applicable for skew angles larger than 20 degrees per CTDOT (or 25 degrees per AASHTO). The proposed detail eliminates the thickened slab and the fifth layer of reinforcement in the acute corner of skewed bridge decks, both of which are currently required by the CTDOT Bridge Design Manual. Additionally, the limit of the modified reinforcement is reduced to a line perpendicular to where the parapet intersects the first interior girder at the bearing centerline. Within this limit, the top and bottom transverse reinforcement are placed along the skew in the same layer as the general deck transverse bars (outside layers). Figure 3 shows the proposed reinforcement plan and section. The proposed detail is similar to the NYSDOT detail with limited modifications to avoid congested reinforcement. In the proposed detail, the skew bars shall extend outside of the limit of the acute corner for development length in tension. To avoid conflict between the skew bars and the normal transverse bars, the normal top transverse bars within the development length shall be placed below the longitudinal top bars. Similarly, the normal bottom transverse bars within the development length shall be placed above the longitudinal bottom bars. To avoid congestion within the development length, and to accommodate the required concrete cover, the limit of the bottom skew bars shall be shorter than the top skew bars. The typical thickening at the end of the deck at the end diaphragms remains, as currently detailed in the CTDOT Bridge Design Manual, but the thickening of the slab in the acute corner is avoided with this detail.

2.3. AASHTO Design Requirements

2.3.1. Overhang Design

For deck overhang design, AASHTO requires three separate design cases [15]. Design Cases 1 and 2 are under the extreme event limit state, and Design Case 3 is under the strength limit state. The design cases vary based on the application of the collision force to the parapet. Under Design Case 1, the vehicle collision applies transverse and longitudinal forces, under Design Case 2, the vehicle collision applies vertical force, and under Design Case 3, a vehicle wheel load is applied to the overhang.
In Design Case 1, the overhang flexural–axial resistance should exceed the flexural strength of the parapet at its base combined with the tensile force corresponding to the parapet resistance, Rw, distributed over a specified length. In Design Case 2, the overhang section must resist a vertical load applied over a certain length of the parapet. In Design Case 3, the overhang section must resist the vehicle wheel load applied within the overhang. In all cases, the deck overhang is designed to be stronger than the concrete parapet so that in the event of failure, only the parapet requires repair or replacement. Design Case 1 often governs, as it is a capacity-based design, in which the required strength may significantly exceed the specified “Test Level” design force used for parapet design. The Connecticut Bridge Design Manual Article 8.1.2.2 directs engineers to design overhangs in accordance with AASHTO Specifications [16]. Therefore, the AASHTO approach for parapet design is briefly reviewed in the following Section.

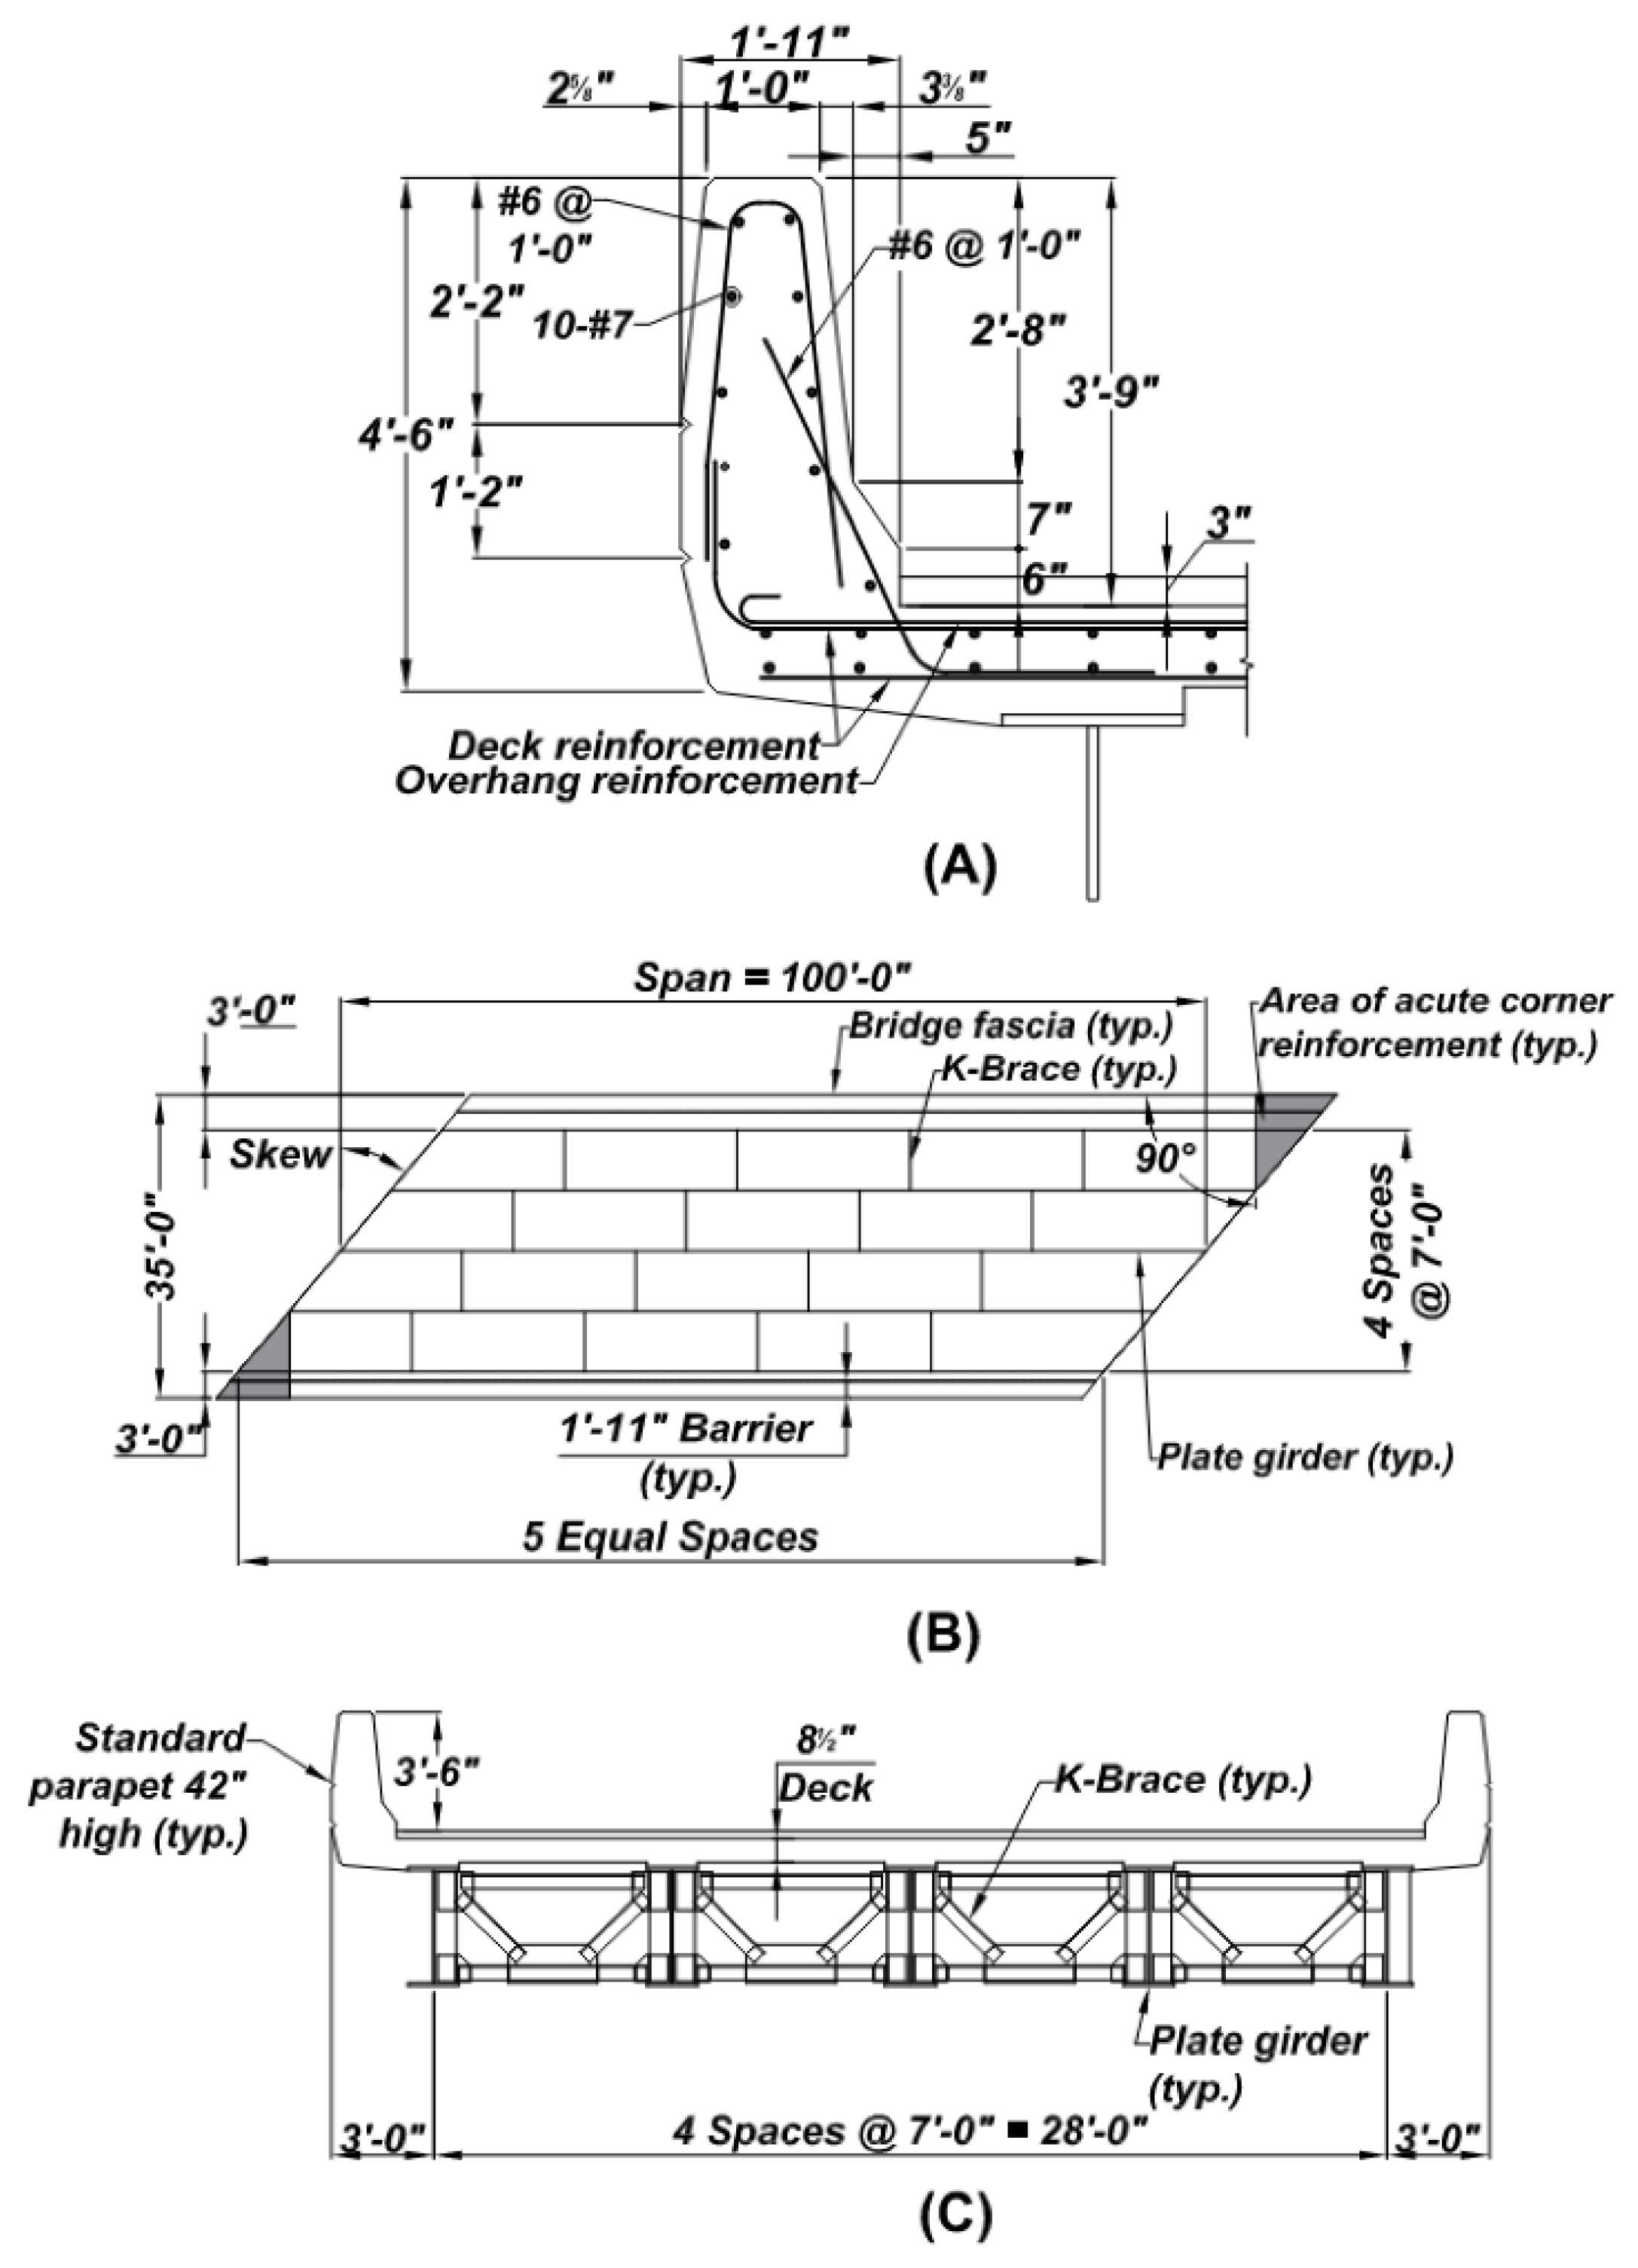
2.3.2. Parapet Design

The AASHTO parapet design approach is to calculate the nominal transverse resistance of the parapet and compare it to the specified design force, Ft, for a desired “Test Level.” AASHTO provides the resistance of concrete parapets in Article A13.3.1 based on yield line theory, which assumes the yield lines only occur within the parapet. The parapet resistance, Rw, can be calculated by Equation (1) for impact within a parapet segment or at the end of a segment.
R w = ( 2 2 L c L t ) ( nM b + nM w + M c L c 2 H ) ,
where Mw is the flexural resistance of the wall about its vertical axis (kip-ft), Mb is any additional flexural resistance to Mw (kip-ft), Mc is the flexural resistance of the cantilever wall about the axis parallel to the longitudinal axis of the bridge (kip-ft), H is the height of the parapet, Lc is the critical length of the yield line failure pattern (ft), Lt is the longitudinal length of the distribution of impact force (ft), and n is equal to 8 if within a wall segment and equal to 1 if at the end of a segment. As noted previously, Rw shall be greater than the applied transverse force, Ft. For a Test Level 4 parapet, the design values of Ft and Lt are 54 kips and 3.5 feet, respectively.
The calculated resistance, Rw, is for the wall critical length Lc, where the yield line mechanism occurs. Lc can be calculated using Equation (2), as shown below, for impacts within a wall segment, at the end of the wall, or at a joint.
L c = L t 2 + ( L t 2 ) 2 + nH ( M b +   M w ) M c ,
If the failure line extends into the deck, the equations provided in Article A13.3.1 are no longer applicable. The AASHTO crash testing program is oriented toward survival, not the identification of the ultimate strength of the railing system. This could produce a railing system that is significantly overdesigned, which results in an overdesigned deck overhang [15]. The AASHTO design approach for parapet design was used to determine the accuracy of the modeled parapet behavior. In addition, the AASHTO overhang design approach was used to confirm the adequacy of the proposed acute corner detail.

2.4. Analytical Evaluation

Three-dimensional finite element models of four prototype bridges were developed using CSiBridge v19.1.0. The analysis techniques and modeling features in CSiBridge can account for nonlinearity in geometry and inelastic behavior [20]. This design software has been used successfully in other research studies, including seismic response of horizontally curved bridges [7], seismic response analysis of bridges [21], and live load distribution on a prestressed concrete bridge [22]. Gupta and Kumar (2018) used a three-dimensional finite element model in CSiBridge to model skewed, curved concrete box girders. They found the load path in skewed bridges varies from straight bridges and typically takes the shortest path between the obtuse corners. This variation in the load path results in higher reactions at the obtuse corners and lower reactions at the acute corners [23]. The complexity in skewed bridge behavior led to the use of a three-dimensional finite element software.

2.4.1. Selection of Models

Four models with 15, 30, 45, and 60 degree skews were evaluated in this study to observe the effect of skew angle on the performance of the acute corner. The 15 degree model acts as a baseline for comparison as the deck transverse reinforcement is parallel to the skew per the CT Bridge Design Manual [16], and thus the acute corner of the deck does not require special treatment. The remaining skew angles were chosen to represent a low skew (30 degrees), intermediate skew (45 degrees), and high skew (60 degrees) option. Evaluating multiple skew angles provides assurance that the proposed design is adequate for larger skews yet does not result in an overdesigned acute corner for the lower skew. The maximum skew angle of 60 degrees was determined in agreement with several other research studies [24,25,26,27,28].

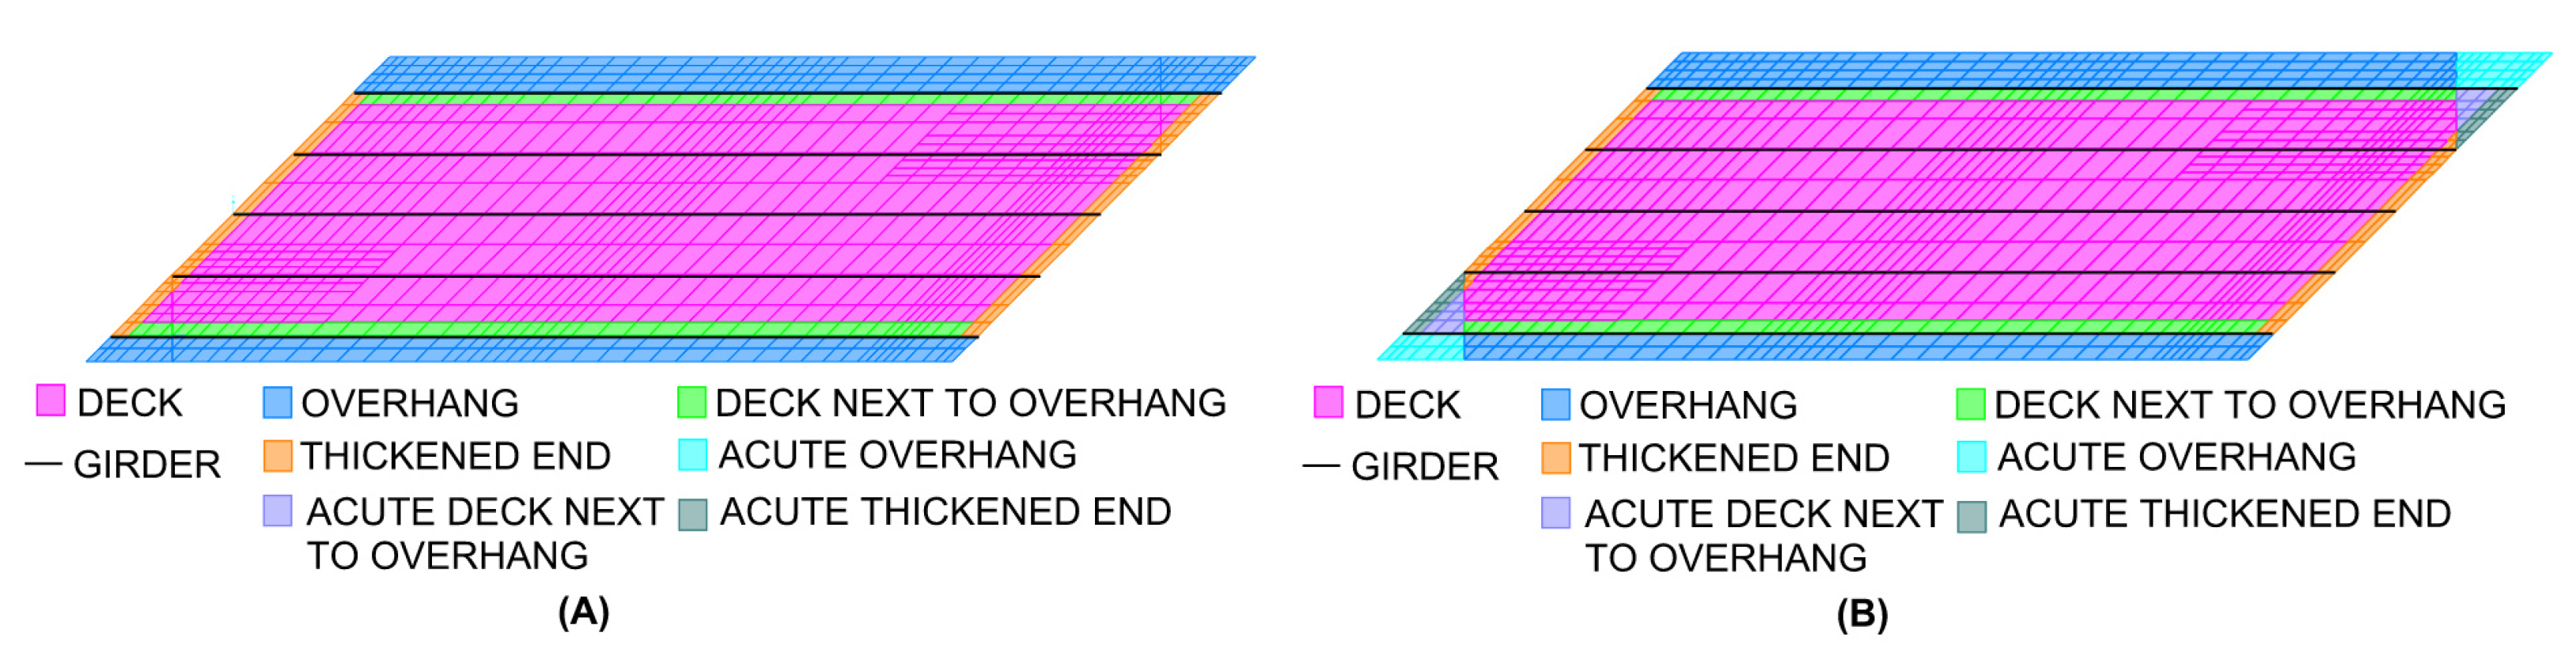
2.4.2. Model Geometry

For this project, Test Level 4 in conjunction with the Standard Parapet 42” High (Connecticut Bridge Design Manual Plate 6.2.2) [16], as shown in Figure 4A, was selected for evaluation, consistent with CTDOT current practice for state highway bridges. The CTDOT Memorandum dated 6 July 2005 [29] specifies the joint requirements for concrete parapets. The maximum joint spacing for regions with positive moments in the girders is 20 feet. A 20 foot joint spacing was selected for this project.
A two-lane deck with a total width of 35 ft was selected for the prototype bridge models. Figure 4B,C show the general framing plan and section of the prototype bridges. The prototype consists of a 100 ft simple span with five 3.5 ft deep steel composite girders spaced at 7 ft with a 3 ft overhang. K-type cross frames are normal to the girders and spaced at approximately 20 ft. An 8.0 in thick concrete deck with a 1.5 in haunch was used for all prototypes. The thickened deck overhangs were modeled as 10.7 in thick, corresponding to the distance measured from the top of deck to the bottom of deck at the edge of the barrier. Bearings were assumed to be fixed at one end, with the roller at the other end of the span. A uniform load of 36.25 psf was applied on the deck to simulate the 3 in thick asphalt wearing surface.

2.4.3. Material Properties and Element Selection

ASTM A709 grade 50 steel was assumed for the girders and diaphragms. This was modeled using a linear elastic with a modulus of elasticity of 29,000 ksi. For the concrete deck and parapets, a Class F concrete [16] with f’c = 4.0 ksi was used with ASTM A615 Grade 60 reinforcement. The isotropic unconfined Mander Model was used for concrete material with specified compressive strength of 4.0 ksi. A uniaxial elasto-plastic steel material with 60 ksi yield stress was used.
Frame elements were used to model the girder flanges and diaphragms. Linear shell elements were used for girder webs. Nonlinear-layered shell elements were used to model the deck and parapets. Deck shell elements were constrained to the girder top flanges to model composite action. The reinforcement material in the prototype model includes hardening with an ultimate strength of 65 ksi at 2.2% strain. Nonlinear layered shell elements were used as they have been shown to accurately represent the nonlinear behavior of reinforced concrete. Based on the capabilities of CSiBridge modeling software, using nonlinear shell elements mimics the real behavior of reinforced concrete with regard to the localization of stresses and cracking [9]. Reinforced concrete does not uniformly lose strength; the concrete and steel share the applied load and where cracking has occurred, the steel carries the full load over the crack width. Layered shell elements are used when there are varying material properties in the element. The varying material properties of the concrete and steel reinforcement of the reinforced concrete can be properly modeled when using layered shells. The layered shells were defined to accurately represent the size and location of the rebar in the concrete elements, including placement relative to other bars.
Numerous research studies have been performed, utilizing non-linear layered shell elements to represent reinforced concrete structures. Gurkalo et al. (2017) used non-linear layered shells in SAP2000 to model a reinforced concrete shaft. As noted in their study the shell element could simulate the coupled in-plane and out-of-plane bending behavior of the reinforced concrete shaft [30]. Chung and Sotelino (2005) investigated the cracking behavior of a reinforced concrete deck on steel girders. In order to accurately represent the cracking of the concrete, a layered shell was defined in ABAQUS software and the program’s non-linear analysis scheme was utilized [31]. Recalde B. et al. (2015) used non-linear layered shell elements in SAP2000 to model a concrete waffle slab and proved the developed model was adequate for representing uncracked and post-cracked concrete behavior [32]. These various research studies show the capabilities of non-linear layered shell elements in finite element software to accurately mimic the reinforced concrete behavior, thus justifying their utilization in this study.

2.4.4. Reinforcement Design

In the acute corners, two reinforcement layouts were considered for each prototype: (1) transverse reinforcement normal to the girders (traditional layout), and (2) transverse reinforcement along the skew at top and bottom layers (proposed layout). In the second layout, a specific reinforcement design was performed for the acute corner of each bridge as the deck span varies for the different skew angles.
The amount of steel reinforcement in each model was determined based on an iterative approach. The goal was to provide enough reinforcement so that the deck overhang did not experience significant yielding or plastic deformation. This behavior is consistent with the previously discussed AASHTO design approach where the parapet is designed to fail before the deck overhang [15]. The initial assumption for the area of reinforcement was the amount required for a straight bridge. This amount was incrementally increased for each skew angle until the desired behavior was achieved.

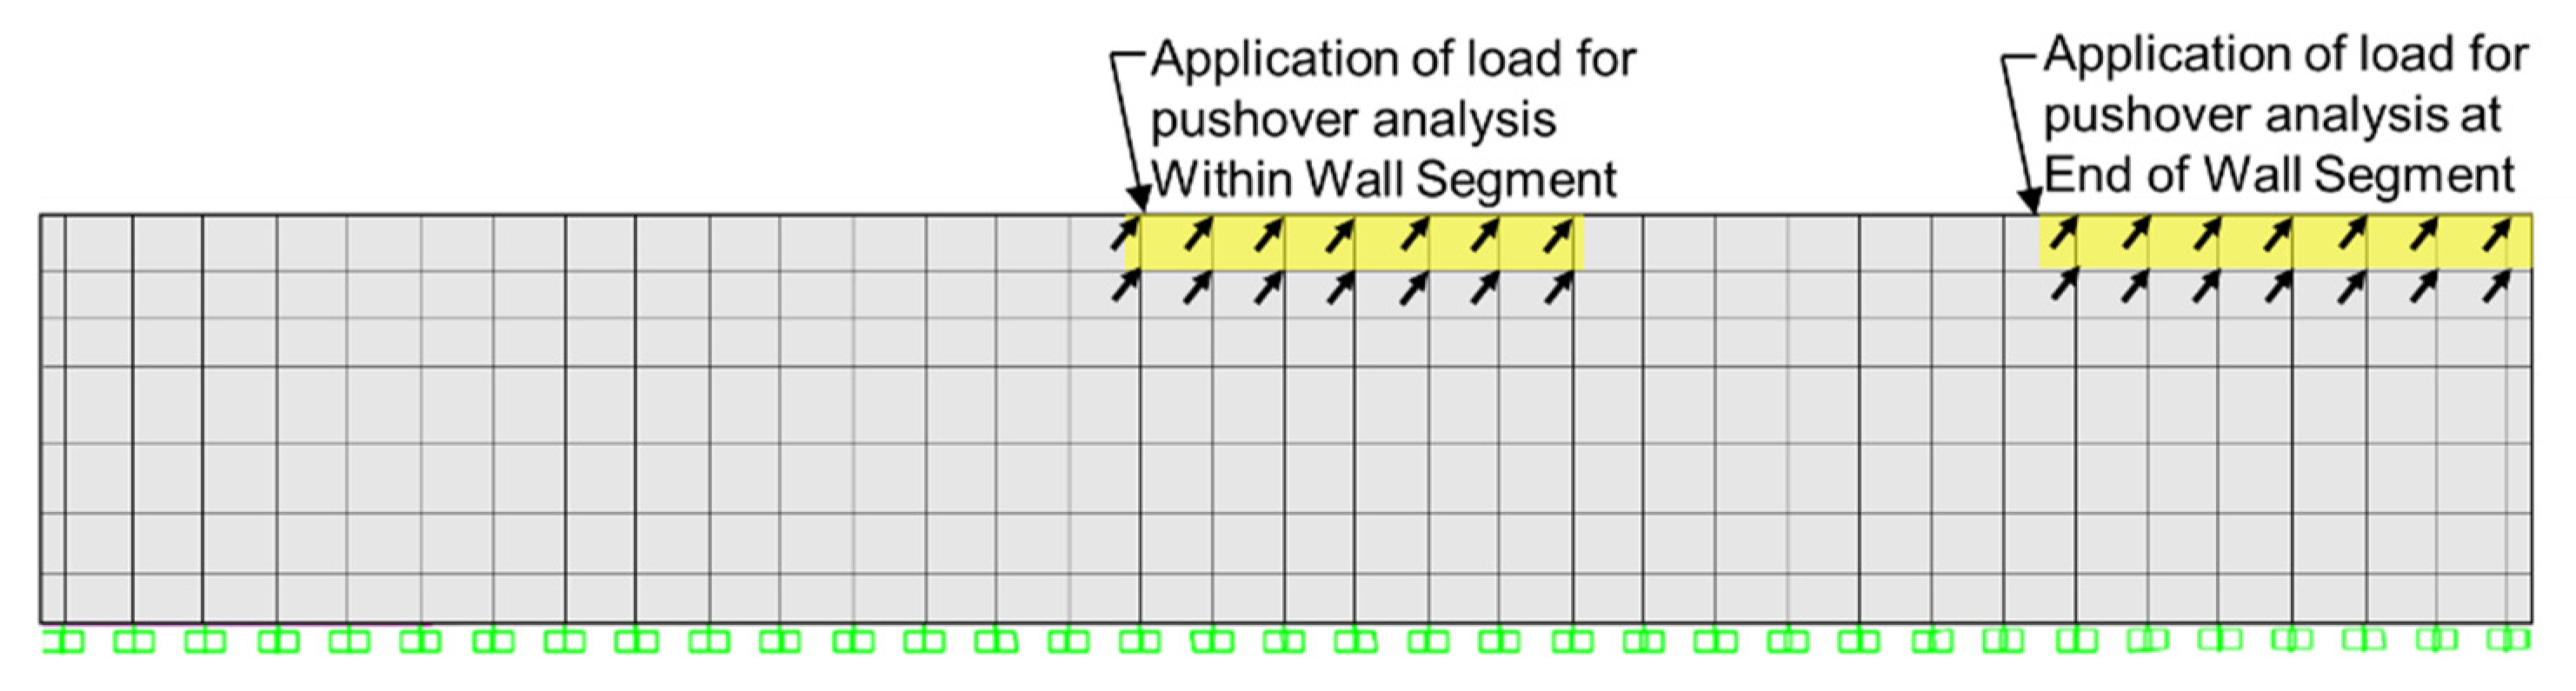
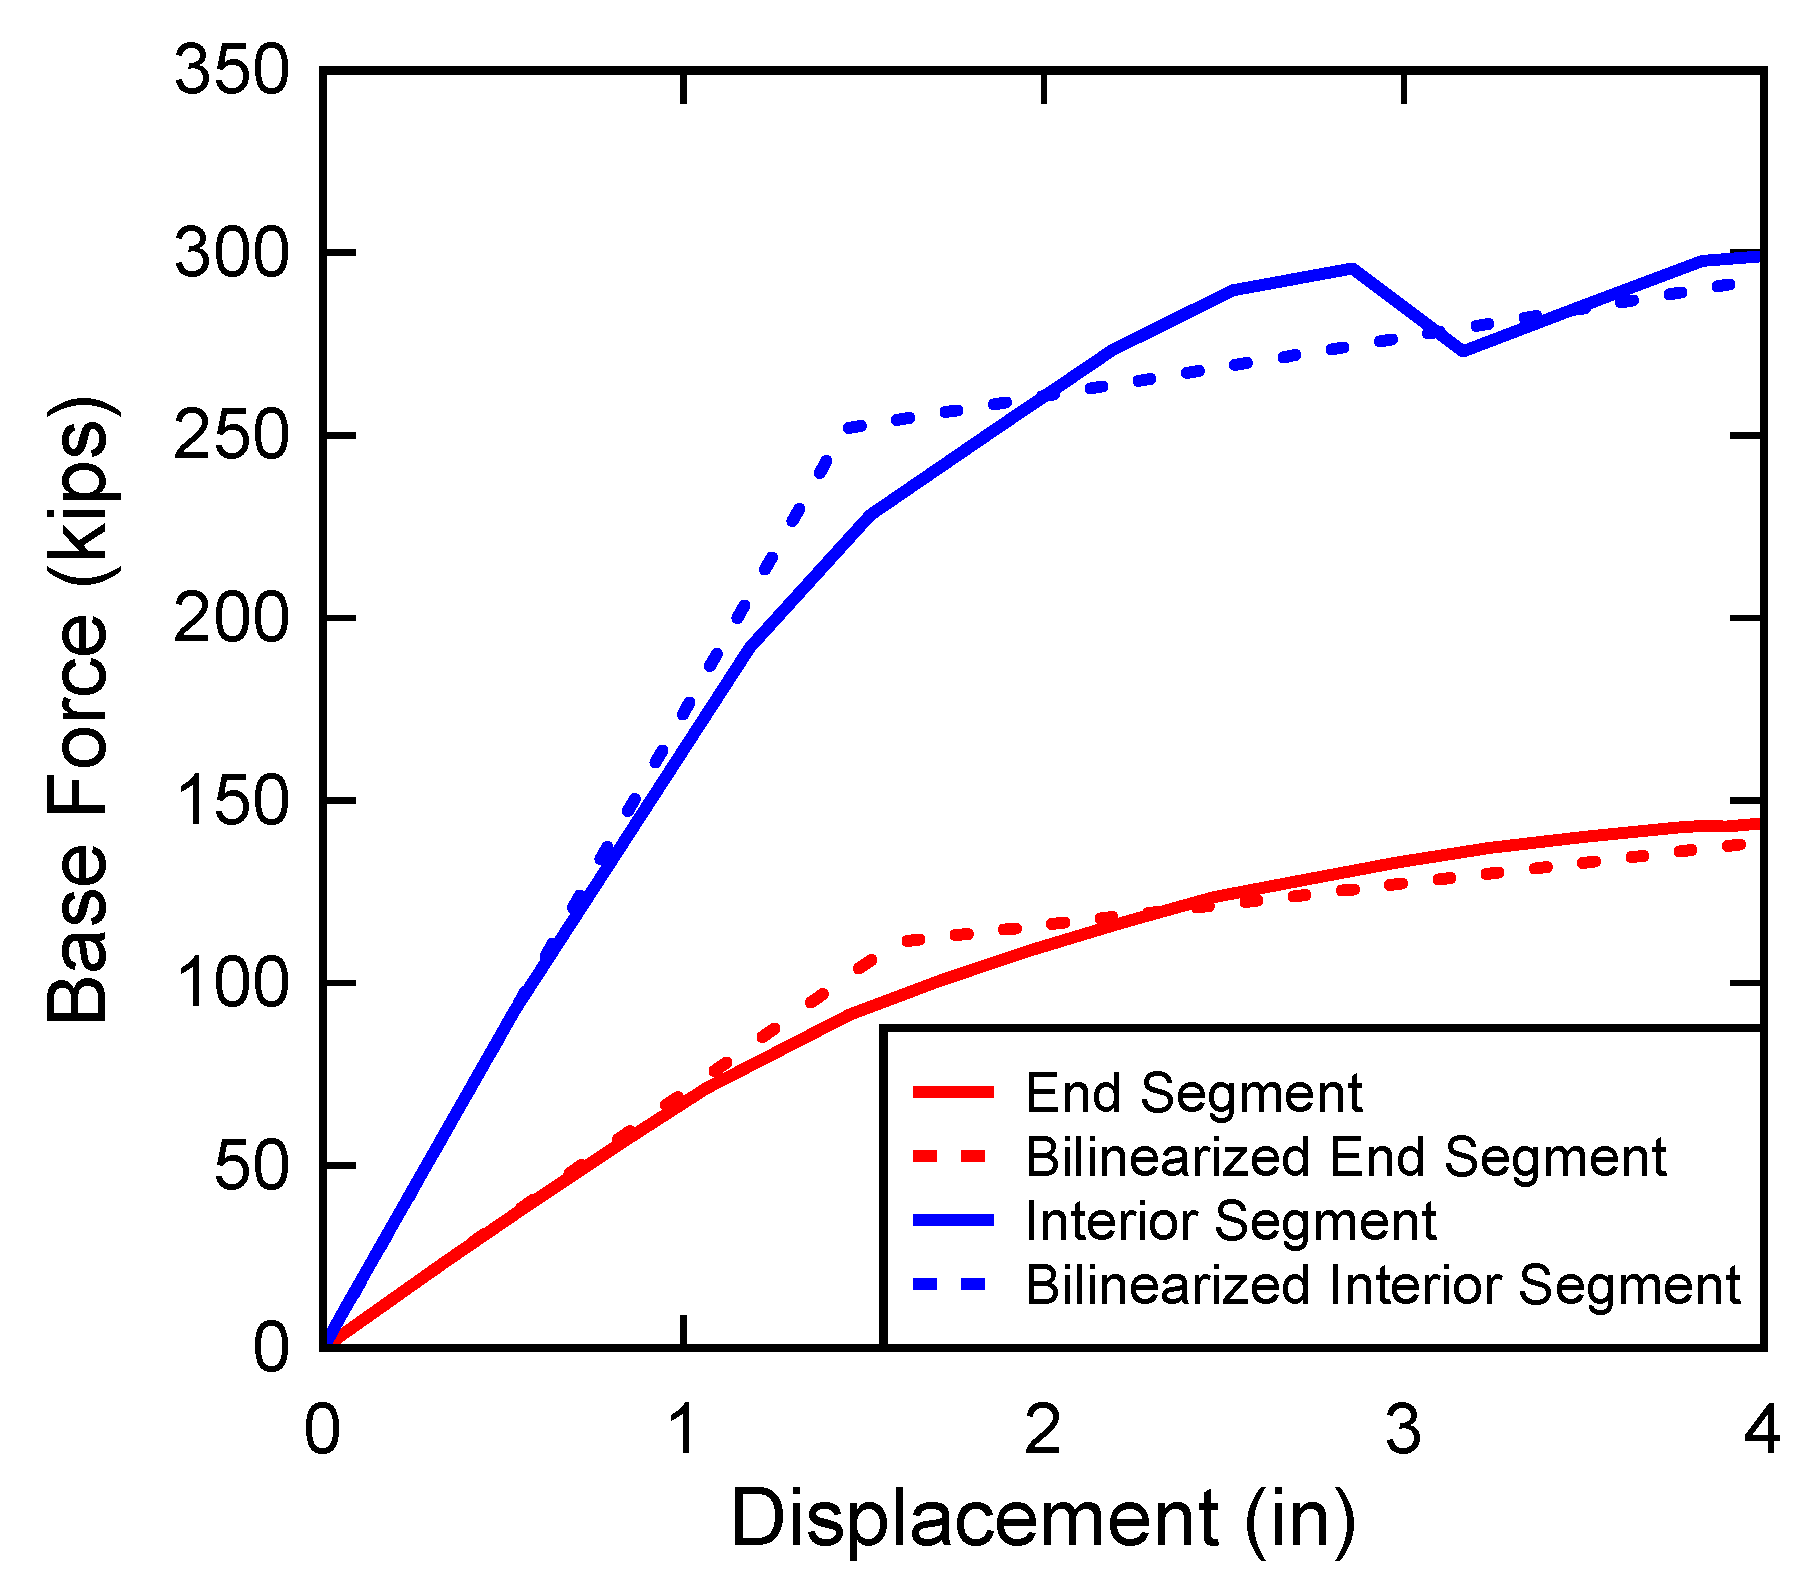
2.4.5. Verification of Parapet Behavior

In a typical overhang reinforcement design, the largest demand is imposed by the transfer of the parapet plastic moment to the deck. Therefore, it was critical to validate the plastic capacity of the parapet in the model. This was accomplished by performing a pushover analysis on the CTDOT Standard Parapet with a fixed base in an isolated model and comparing the results with the AASHTO guidelines for parapet design. After this verification of the parapet behavior, the barrier elements were incorporated into the prototype bridge models.
The resistance of the parapet is first calculated based on the previously described yield line method used in the AASHTO Bridge Design Manual and detailed in Section 2.3.1, Parapet Design. The yield line method provides only the ultimate flexural capacity of the concrete barrier. It is based on a triangular pattern of the yield lines. Two failure modes were assumed for the yield lines; the smaller of the resulting values defines the parapet resistance, Rw. In the first mode, the yield lines form from the base of the parapet. In the second mode, the yield lines form from the top of the sloped section of the parapet. The results for each failure mode at an interior and end wall segment are summarized in Table 1.
A two-dimensional finite element model of a 20 ft long standard parapet was developed using CSiBridge v19.1.0 [9]. The height of the parapet is divided into four sections to approximate the variable parapet thickness with equivalent shell elements. The longitudinal and vertical reinforcement are modeled using nonlinear-layered shell elements.
A nominal hardening (near zero post-elastic stiffness) was used for the steel reinforcement. The use of nominal hardening allows for direct comparison of the parapet resistance with that derived from the yield line method. The actual hardening of reinforcement material was included in the prototype bridge models. The Test Level 4 transverse load was interpolated and applied as point loads at each element corner, as shown in Figure 5, to model a distributed load. Pushover analysis (displacement control static nonlinear) was performed using these load patterns.
Figure 6 shows the reinforcement stress pattern at the maximum load for an end segment and an interior segment, respectively. The blue colors indicate yielding areas. The extent of yielding in the parapet was relatively smaller at the end segment than the interior segment. As anticipated, the vertical bars saw more yielding than the horizontal bars.
The yield strength of the parapet from the isolated CSiBridge model was determined by bilinearization of the force–displacement curve as shown in Figure 7. The maximum force from the bilinear curve is considered as the parapet resistance. The yield strength and resistance of the parapet based on the bilinearization are noted in Table 2 and compared with the AASHTO yield line method; resistance values between both methods were found to be in good agreement. Similarly, the extent of yielding of the parapet models agreed well with that of the yield line method. Therefore, it can be concluded that the finite element model of the parapet is reliable and can be incorporated into the prototype bridge models.

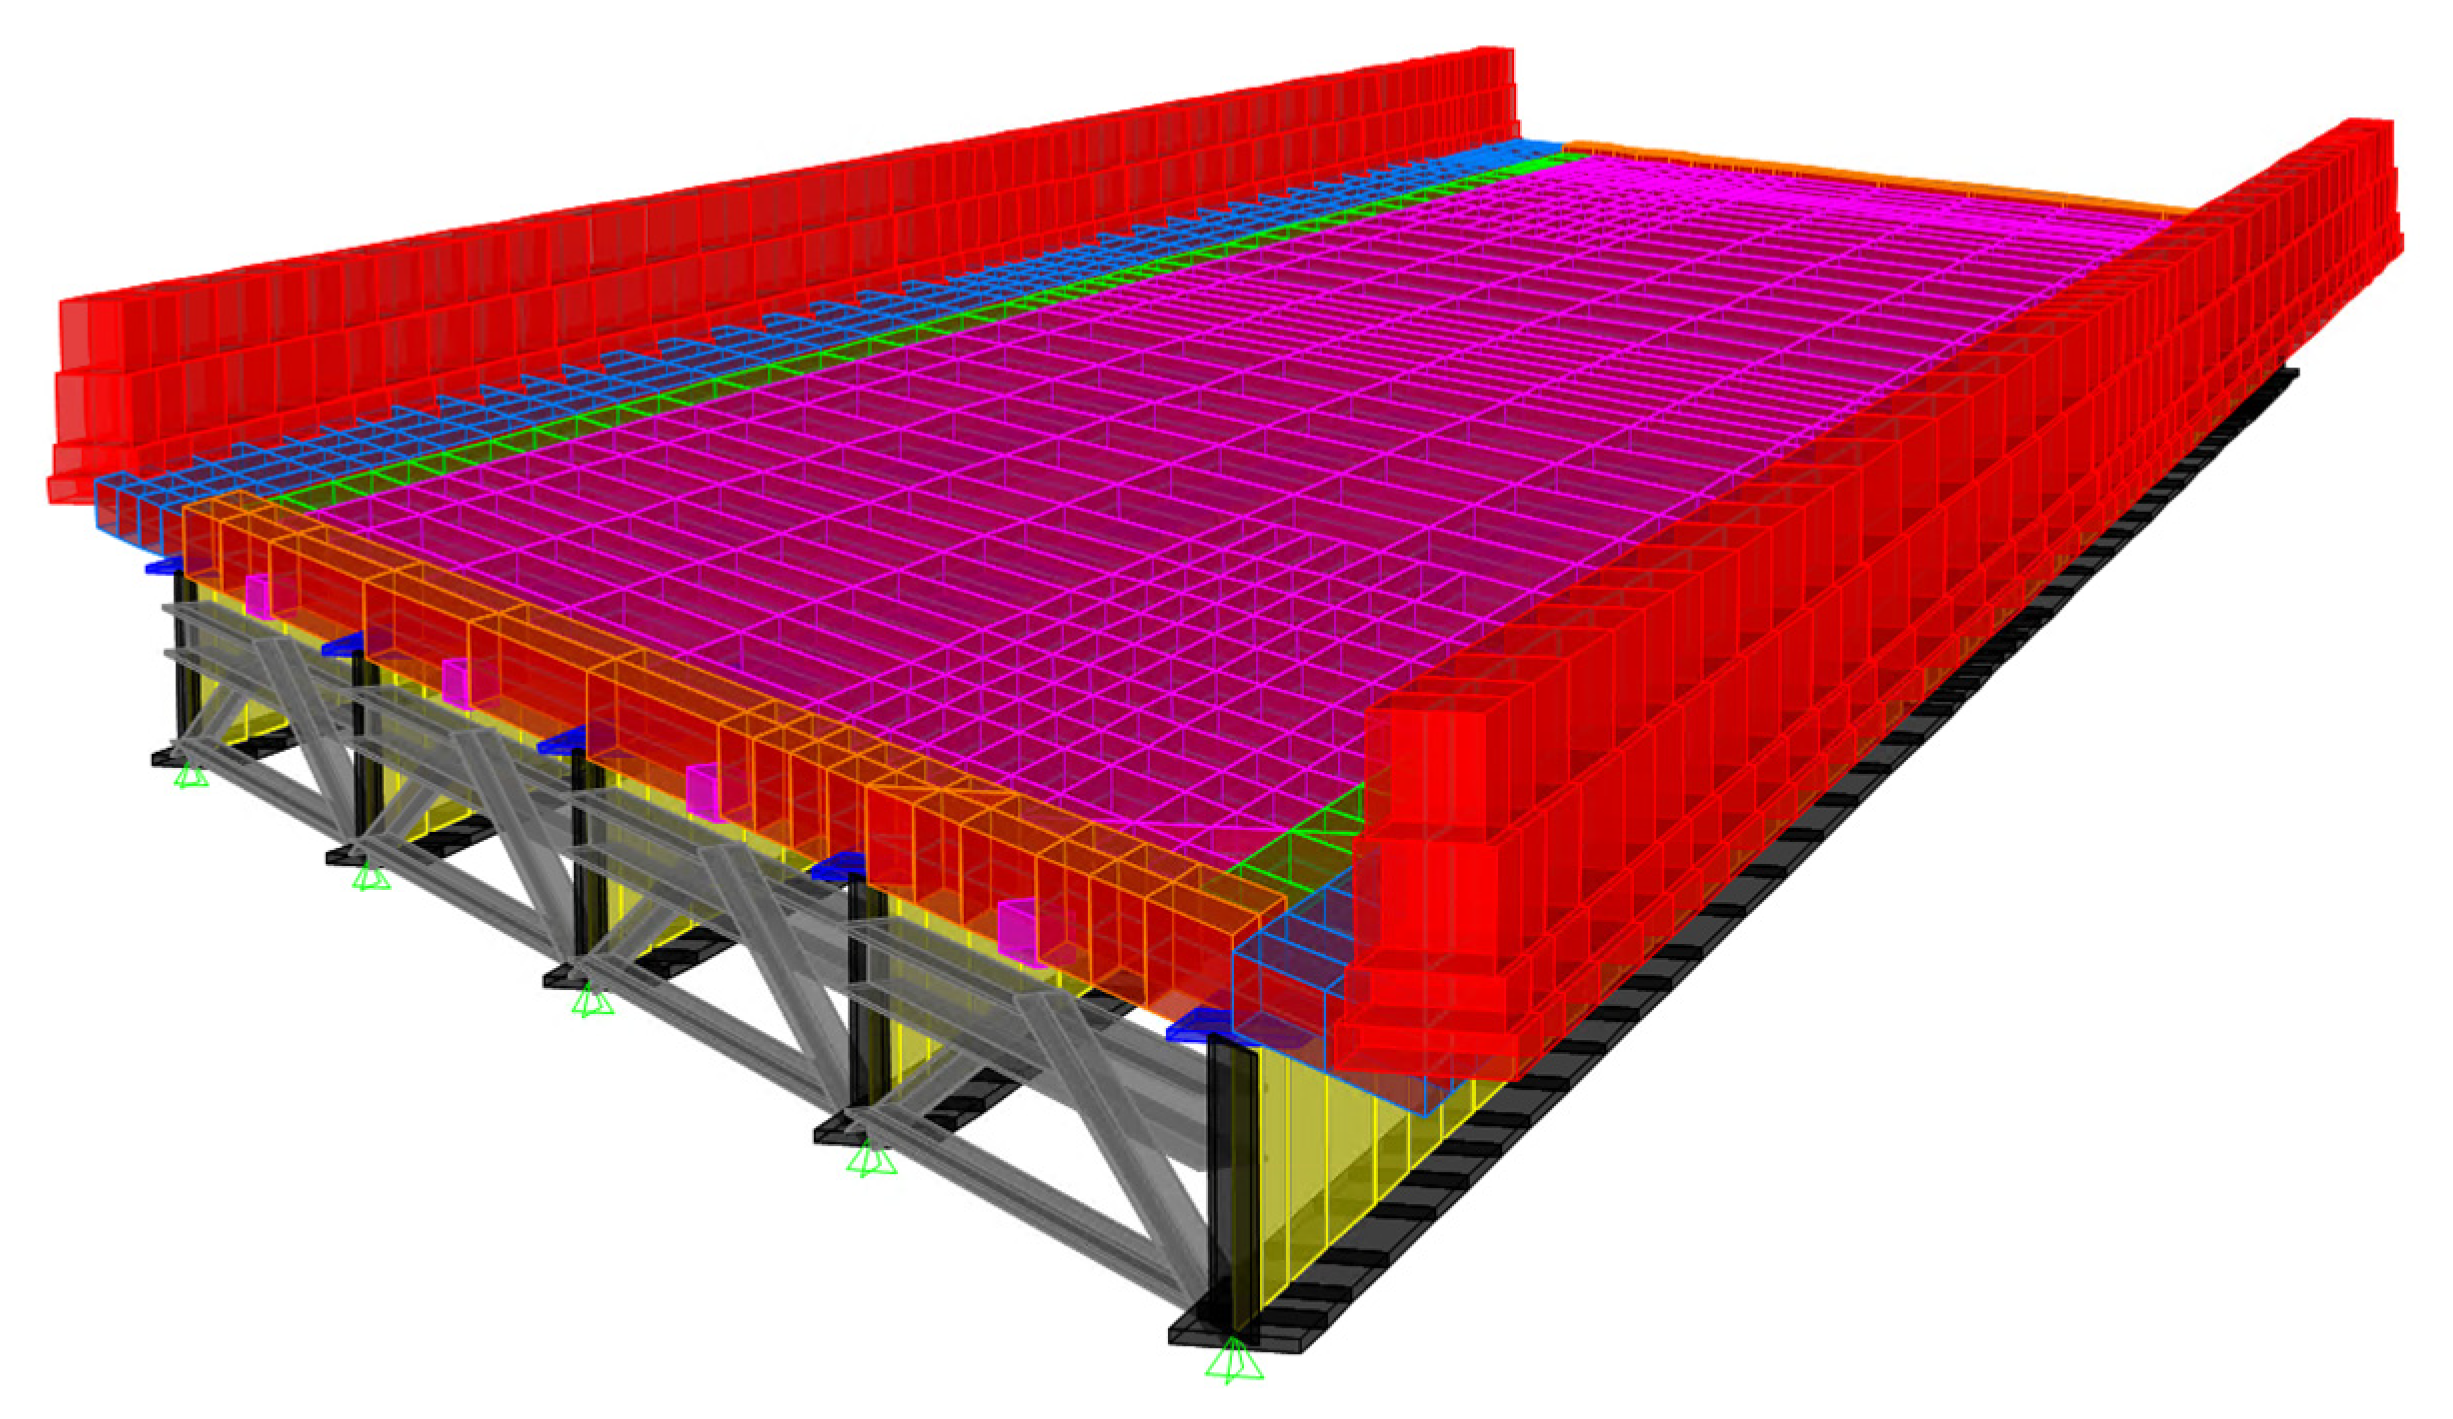
2.4.6. Model Assembly

As previously mentioned, four prototype bridge models were developed for each skew angle. In each of these models the reinforcement at the acute corner is based on the proposed detail. For the 45 degree skew angle, two prototype bridge models were developed to compare the performance of the proposed acute corner detail with the traditional design approach. In the first model, the reinforcement in the acute corner is oriented based on traditional design (Figure 8A), whereas in the second model the transverse reinforcement layers (top and bottom) at the acute corner are oriented along the skew based on the proposed detail (Figure 8B). The same amount of reinforcement is in both models.
Several shell sections were defined to create the bridge deck model. Figure 8 shows the extent of each shell section using color codes for the two models. The “DECK” shell (magenta) represents the main 8 inch thick slab with #5 bars spaced at 6 inches longitudinal and transverse reinforcement for the top and bottom layers. The “OVERHANG” shell (blue) represents the 10.7 inch thick slab with additional reinforcement of #7 bars spaced at 6 inches for the transverse top layer. The “ACUTE OVERHANG” shell (teal) is similar to “OVERHANG” with transverse reinforcement layers (top and bottom) oriented along the skew. The “DECK NEXT TO OVERHANG” shell (green) is similar to the “OVERHANG” shell, except the thickness of the shell matches the thickness of the “DECK.” The “ACUTE DECK NEXT TO OVERHANG” shell (purple) represents the 8-inch deck within the acute corner area where the transverse reinforcement layers (top and bottom) are placed along the skew. The “THICKENED END” shell (orange) represents the 15 inch thick slab with additional reinforcement at the bottom of the thickened deck at the bridge ends. The “ACUTE THICKENED END” shell (dark green) represents the 15 inch thick slab within the acute corner area which includes the additional overhang reinforcement. A comprehensive view of the 3D model in CSiBridge is shown in Figure 9 below.
For shell sections within the acute corner, the angle of the shell layers corresponding to transverse reinforcement were changed to match the skew alignment. However, each shell element has three orthogonal local axes which define the direction of the output forces and stresses and set the orientation of the shell layers. Although the local axes can be rotated, they are always normal to each other. Therefore, to observe the stress in the skew reinforcement, a subset of models was created for each skew angle in which the shell local axes in the acute corner were rotated accordingly. It should be noted that the reinforcement in the subset models are identical to the main prototype models.
Five static nonlinear load cases were run for each model. The first was a dead load case which was used as the initial condition for the following cases. The next group of load cases were Design Cases 1 through 3 at the acute corner. Lastly, Design Case 1 was run at mid span for additional information to compare to the fixed-base parapet model and to evaluate whether the overhang designed per AASHTO requirements would remain elastic.
For Design Case 1, the analysis was a displacement control pushover in which the top of the parapet was pushed 6 inches laterally (beyond yielding) at the end of the bridge/parapet and at mid-span at the locations shown in Figure 10. The other two design cases were full-load pushover analyses in which the entire designated load per AASHTO is applied in multiple steps to capture potential yielding. These two types of pushover analysis were conducted because in Design Case 1, the goal is to ensure that the overhang will remain elastic when the parapet reaches its ultimate resistance which is often larger than the required Test Level force. In Design Case 2 and 3, however, the goal is to ensure that the overhang can resist the live load effects.
As Design Cases 1–3 are nonlinear analyses, the initial condition dead load case should also be a nonlinear analysis. However, a major portion of dead load acts on the non-composite sections due to construction sequencing. CSiBridge is not capable of performing staged construction analysis with layered shell elements. Therefore, a full-load pushover analysis on the composite section was used for the dead load case instead. Neglecting construction sequencing in the analysis mainly affects the stress in the girders and the longitudinal stress in the deck within the middle third of the span. The effect on the longitudinal stress in the parapets is minimal due to frequent expansion joints in the parapets. Therefore, the implemented approach is not expected to affect the results of any of the design cases.
Two additional analysis cases were performed to check the AASHTO Strength-I and Service-I limit states specifically for the deck acute corner area within the first and second bays. The purpose of Strength-I analysis is to investigate if engineers can implement the simplified proposed reinforcement detail without further analysis for the acute corner area. Moreover, the Service-I analysis is to ensure the proposed reinforcement satisfies the requirements of crack control under combined loads including thermal and shrinkage.
The AASHTO tandem load [15] as the governing live load for the deck design was applied on the deck elements in the model, using four-point loads representing wheel load plus impact. Two adjacent tandems were positioned to maximize the slab moments within the first and second bays. A prescriptive uniform strain of −0.0005 ft/ft per AASHTO LRFD Section 5.4.2.3 [15] was introduced to all concrete components of the bridge representing the shrinkage load. Two thermal load cases including +60oF and −60oF were applied to all elements uniformly for expansion and contraction, respectively.
To capture the nonlinear behavior due to cracking effects, nonlinear analysis was carried out instead of superposition of the load effects for the Strength-I and Service-I limit states. The dead, live, shrinkage, and thermal loads were included with applicable factors. The results are evaluated in the following section. These analyses were carried out for the 60 degree skew model only as it was the governing prototype for the acute corner area.

3. Results

The plastic behavior of a standard parapet is first discussed by comparing the analysis results from the prototype bridge models with the results previously obtained from the isolated parapet model. This is followed by an assessment of three AASHTO Overhang Design Cases on models with the proposed acute corner reinforcement detail. Although the design cases are primarily for the overhang design, they can be used as a design basis for the adjacent deck. The deck moment distributions, reinforcement stresses and force–displacement curves for each prototype bridge were used to evaluate performance. The moment distributions show the moment per unit width of the deck in a specific direction and show the areas with highest demands, independent of the deck reinforcement and thickness. The reinforcement stresses show the equivalent uniaxial stress in a specific reinforcement layer and display how the selected reinforcement performs with respect to yielding.

3.1. Plastic Behavior of the Parapet on the Bridge Deck

The parapet force–displacement curves from pushover analyses are shown in Figure 8 for the fixed base model and prototype bridge models. The pushover curves show the stiffness of the parapet overhang system decreasing as the skew increases. Figure 11 show the parapet capacity of the lower skew angle bridge models exceeding the capacity of the fixed base model. This behavior of the lower skew angle bridges is explained by the deflection of the deck overhang which absorbs some of the loading, allowing the parapet to be more ductile. As the skew angle increases the stiffness of the overhang is reduced resulting in a decrease in the parapet capacity. As previously discussed, the parapet resistance from analysis was found by the bilinearization of the force–displacement curves. These resistances are compared with the calculated resistance per the AASHTO yield line method in Figure 12.
The resistance from analysis at the end of the wall segments are within 10% of the calculated Rw per the AASHTO yield line approach. Generally, parapets on the acute corner with smaller skew angles show a slightly higher resistance than those with larger skew angles. Figure 13 shows an example of the deformed shape of the end segment under Design Case 1. For interior wall segments, the prototype bridge models are within 12% of the fixed base model. For the midspan design cases, each skew produced the same results. This is expected, as the reinforcement is placed perpendicular to the fascia at midspan, and therefore there is no skew effect at this location. There was little to no difference in the capacity of the parapet between the unmodified and proposed detail models. However, the model cannot recognize the short undeveloped bars in the unmodified detail.

3.2. Deck Design Case 1

Figure 14 shows the moment distribution of the prototype bridge models for the all skew angles. The first design case produced the largest moments in the transverse direction of the deck due to parapet yielding. In general, the negative moment in the transverse direction increases as the skew angle increases due to the deflection at the end of the deck, which induces negative moments in the overhang. However, the moment in the 15 degree control model exhibits a relatively large transverse moment due to the higher stiffness of the section comped to the skewed models.
Design Case 1 produces the largest stresses in the deck reinforcement, especially in the top transverse layer. There is a concentration of reinforcement approaching yielding within the overhangs of each model. As the skew increases, so does the area of the deck in which the reinforcement experiences high stresses, as shown in Figure 15. There is a stress concentration at the very corner of the deck in the bottom transverse bars, which represents the entire parapet section pulling away from the deck. The stresses in the longitudinal reinforcement are much lower than the stresses in the transverse reinforcement. The highest concentration of stresses in each model is found at the very corner of the bridge deck. This is caused by the parapet displacement creating tension within the full depth of the deck section. There is also a similar concentration within the first girder bay showing tension at the edge of the deck.
The stress distribution in the top transverse bars for the proposed detail (Figure 16A) are slightly lower than those in the unmodified detail (Figure 16B), yet both details performed similarly. However, it is significant to note that the shell definitions do not capture underdeveloped reinforcement. As a result, the bars placed perpendicular (unmodified detail) to the bridge fascia at the very end of the deck are ineffective. Specifically, for the 45 degree model, the first 2′-6″ of the corner is not fully developed. As shown in Figure 14B, these bars are already approaching yielding or have yielded.
Ultimately, the proposed detail is deemed acceptable. All higher stresses in the deck reinforcement were found to occur within the acute corner area defined by the proposed detail. The proposed reinforcement design had minimal to no yielding, and the strength of the parapet capacity was not compromised.

3.3. Deck Design Cases 2 and 3

Under Design Cases 2 and 3 there is a negative moment concentration in the transverse direction over the exterior girder at the end of the deck. The magnitude and area of the moment increase as the skew angle increases due to the increased deflection of the cantilever overhang. These deflections are caused by the vertical parapet loading in Design Case 2 and the wheel loading in Design Case 3. Compared to Design Case 1, the stresses observed are negligible as shown in Figure 17, and, therefore, the proposed detail is acceptable under these load cases.

3.4. Strength I and Service I Analysis

The stress in the deck transverse bars from the Strength-I analysis is relatively small with a maximum of 30 ksi in the top layer and 20 ksi in the bottom layer, as shown in Figure 18. The low stress in the reinforcement indicates that the deck in the acute and end areas behaves as a two-way slab under gravity loads, due the geometry and presence of end diaphragms. In other words, the deck design per “Conventional Method” of AASHTO is likely to be conservative for the acute corner areas.
The stress in the deck transverse bars under the Service-I analysis case is shown in Figure 19 with a maximum of 26 ksi, and 21 ksi for the top and bottom layers, respectively. To control cracking, the AASHTO LRFD Section 5.6.7 [15] requires maintaining a specific bar spacing based on the stress level, exposure factor, slab thickness, and cover. Using the maximum stress, and assuming Class 1 exposure condition, the maximum bar spacing for the top and bottom layers are calculated at 9 and 14 inches, respectively. The designed spacing of bars for the prototype bridges is 6 inches; this is less than the maximum spacing to control the cracking.

4. Discussion

The results from the analytical evaluation of the proposed detail suggest it is a promising alternative to current details in use across the country. The proposed detail simplifies the current detail used in Connecticut by reducing the acute corner area, eliminating the thickened slab, and eliminating unnecessary reinforcement within the top mat. The acute corner area is defined from the first interior girder with a constant deck thickness and transverse reinforcement placed along the skew. These changes simplify the design and construction of the acute corner. For states without an acute corner detail suggestion, the proposed detail is a minor modification to typical deck details that is simple to implement and design. The skewed reinforcement within the acute corner area is determined by applying factors to the area of typical deck transverse reinforcement based on the skew angle required. The top transverse reinforcement is increased by 1/cos(α-20). The bottom transverse reinforcement is increased by 1/cos(α), where α is the skew angle. No changes were made to the top and bottom longitudinal reinforcement.
The results showed that the increased stresses in the deck reinforcement from extreme event loadings are maintained within the proposed limits of the acute corner area. Increasing the skew results in an increased area of higher stresses in the reinforcement, reduced stiffness and a reduction in the severity of stresses. The proposed detail performed well with all skew angles. It was proven through the Service-I load combination that the proposed reinforcement detail satisfies AASHTO’s strength design requirements. Results showed that the acute corner area behaves as a two-way slab, therefore, AASHTO’s convention design method is conservative in this application.
Recent modifications were made to the standard parapet due to the transition from NCHRP to MASH (Manual for Assessing Safety Hardware) loading. The applied crash test loads under MASH test levels are larger than the previous NCHRP, which resulted in a more robust parapet. Although this study uses the outdated standard parapet detail, the methodology presented is still applicable.

5. Conclusions

This study evaluated acute corner details for skewed bridges. The objective was to provide a design approach and detail that can be uniformly used. The proposed detail was modified from the CTDOT standard detail. The proposed detail improves constructability, reduces costs, and simplifies design. The detail was selected based on good performance within CSiBridge models, which analyzed extreme event collision loadings on the overhang within the acute corner. Key findings and research needs are summarized below:
  • A simplified detail based on modifying the CTDOT standard detail was proposed. The key detailing changes include reducing the area of special reinforcement detailing, placing bars along the skew to provide adequate development length, and removing the thickened slab at the acute corner.
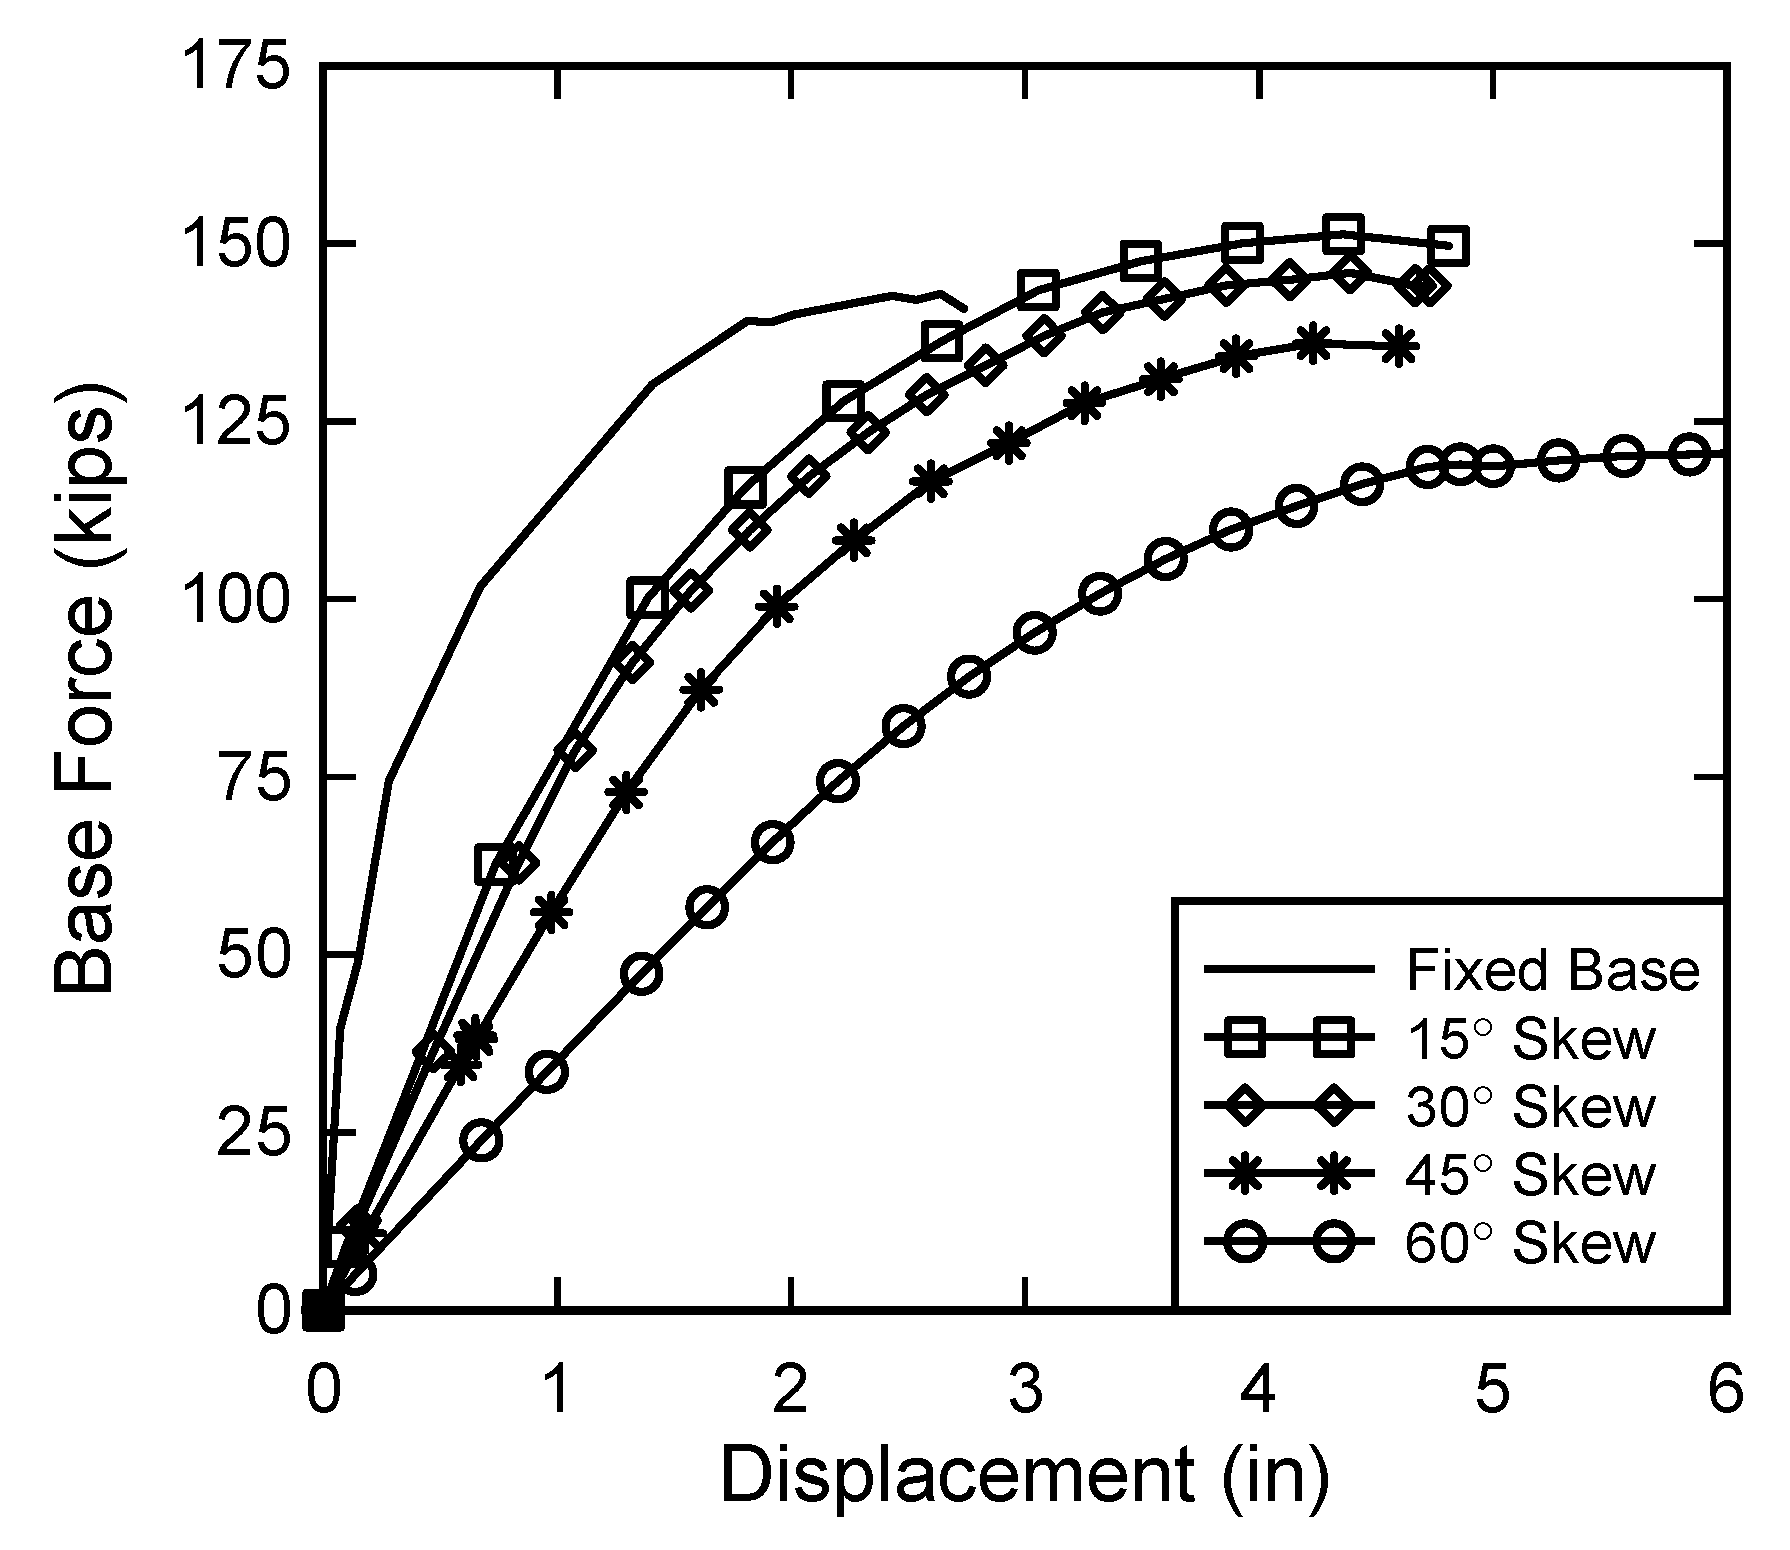
  • The analysis showed the proposed detail satisfies AASHTO’s strength design requirements for all skew angles studied including 15°, 30°, 45°, and 60°. The modeling methodology described can be used to study any additional skew angles of interest.
  • Due to the recent modifications for crash test loading, the proposed detail should be reevaluated under MASH test levels prior to implementation.

Author Contributions

Conceptualization, A.E.Z.; methodology, A.E.Z. and M.M.; software, J.C., M.M. and J.M.; validation, M.M. and A.E.Z.; formal analysis, J.M., J.C., M.M., A.E.Z. and A.H.; investigation, J.M., J.C., M.M., A.E.Z. and A.H.; data curation, J.C., M.M. and J.M.; writing—original draft preparation, J.C., M.M. and J.M.; writing—review and editing, J.M., A.H. and A.E.Z.; visualization, J.M. and J.C.; supervision, A.E.Z., M.M. and A.H.; project administration, A.E.Z. and A.H.; funding acquisition, A.E.Z. All authors have read and agreed to the published version of the manuscript.

Funding

This research was funded by the Connecticut Cooperative Transportation Research Program for project “Development of a Simplified Design Method and Reinforcement Detail for the Acute Corner of Skewed Bridge Decks”.

Institutional Review Board Statement

Not applicable.

Informed Consent Statement

Not applicable.

Data Availability Statement

The data presented in this study are available on request from the corresponding author.

Acknowledgments

The authors appreciate the support of the CCTRP advisory board as well as the advice and support from Michael Culmo of CHA Consulting, Inc. and Thomas Laliberte of WSP USA.

Conflicts of Interest

The authors declare no conflict of interest. The funders had no role in the design of the study; in the collection, analyses, or interpretation of data; in the writing of the manuscript, or in the decision to publish the results.

References

  1. Coletti, D.; Chavel, B.; Gatti, W.J. Challenges of skew in bridges with steel girders. Transp. Res. Rec. 2011, 2251, 47–56. [Google Scholar] [CrossRef]
  2. Chavel, B.W. Steel Bridge Design Handbook: Bridge Deck Design; Federal Highway Administration. Office of Bridge Technology: Chicago, IL, USA, 2012.
  3. Kun, C.; Yang, Z.; Chouw, N. Seismic performance of skewed bridges with simultaneous effects of pounding and supporting soil. Eng. Struct. 2018, 174, 26–38. [Google Scholar] [CrossRef]
  4. Serdar, N.; Folić, R. Vulnerability and optimal probabilistic seismic demand model for curved and skewed RC bridges. Eng. Struct. 2018, 176, 411–425. [Google Scholar] [CrossRef]
  5. Wang, Y.; Ibarra, L.; Pantelides, C. Effect of incidence angle on the seismic performance of skewed bridges retrofitted with buckling-restrained braces. Eng. Struct. 2020, 211, 110411. [Google Scholar] [CrossRef]
  6. Ghanem, A.; Moon, D. Seismic Fragility Assessment of Skewed Reinforced Concrete Bridges. In Proceedings of the 17th World Conference on Earthquake Engineering (17WCEE), Sendai, Japan, 27 September–2 October 2021. [Google Scholar]
  7. Gupta, T.; Sandhu, D. Seismic response of horizontally curved bridges in combination with skewed abutments. In Structures; Elsevier: Amsterdam, The Netherlands, 2022; Volume 36, pp. 864–878. [Google Scholar]
  8. Phan, V.-T.; Nguyen, D.-D. Correlation Between Seismic Intensity Measures and Response of Skewed Bridges. In Recent Advances in Earthquake Engineering; Springer: Singapore, 2022; pp. 25–36. [Google Scholar]
  9. Fu, G.; Dimaria, J.; Zhuang, Y.; Feng, J. Bridge Deck Corner Cracking on Skewed Structures; Department of Transportation, Construction and Technology Division: Lansing, MI, USA, 2007. [Google Scholar]
  10. Okumus, P.; Diaz Arancibia, M. Sources, mitigation and implications of skew-related concrete deck cracks in girder bridges. Struct. Infrastruct. Eng. 2021, 17, 1612–1625. [Google Scholar] [CrossRef]
  11. Diaz Arancibia, M.; Rugar, L.; Okumus, P. Role of skew on bridge performance. Transp. Res. Rec. 2020, 2674, 282–292. [Google Scholar] [CrossRef]
  12. Solae, C.; Chorzepa, M.G.; Durham, S.A.; Kim, S.S. Investigation of cracks observed on a skewed bridge constructed using self-propelled modular transporters. J. Perform. Constr. Facil. 2020, 34, 04020098. [Google Scholar] [CrossRef]
  13. Chorzepa, M.G.; Solae, C.; Durham, S.; Kim, S.S. Development of Possible Solutions to Eliminate or Reduce Deck Cracking on Skewed Bridges Built by Using the Accelerated Bridge Construction Method; Department of Transportation, Office of Performance-Based: Atlanta, GA, USA, 2019. [Google Scholar]
  14. Arancibia, M.D.; Okumus, P. Load Distribution and In-Plane Superstructure Movements on Highly Skewed Steel Girder Bridges. In Developments in International Bridge Engineering; Springer: Singapore, 2021; pp. 107–114. [Google Scholar]
  15. American Association of State Highway and Transportation Officials. AASHTO LRFD Bridge Design Specifications; American Association of State Highway and Transportation Officials, Highway Subcommittee on Bridges and Structures: Washington, DC, USA, 2020. [Google Scholar]
  16. Connecticut Department of Transportation. Bridge Design Manual; Connecticut Department of Transportation: Newington, CT, USA, 2019.
  17. Texas Department of Transportation. TxDOT Bridge Design Manual; Texas Department of Transportation: Austin, TX, USA, 2021.
  18. Oregon, D. Bridge Design Manual; Oregon Department of Transportation: Salem, OR, USA, 2021. Available online: http://www.oregon.gov/ODOT (accessed on 18 April 2022).
  19. New York State Department of Transportation. Standard Bridge Detail Sheets; New York State Department of Transportation: Albany, NY, USA, 2021.
  20. CSi. CSiBridge 2017; Computers and Structures: Berkeley, CA, USA, 2016. [Google Scholar]
  21. Mackie, K.R.; Scott, M.H. Implementation of nonlinear elements for seismic response analysis of bridges. Pract. Period. Struct. Des. Constr. 2019, 24, 04019011. [Google Scholar] [CrossRef]
  22. Khan, E.; Lobo, J.A.; Linzell, D.G. Live load distribution and dynamic amplification on a curved prestressed concrete transit rail bridge. J. Bridge Eng. 2018, 23, 04018029. [Google Scholar] [CrossRef]
  23. Gupta, T.; Kumar, M. Flexural response of skew-curved concrete box-girder bridges. Eng. Struct. 2018, 163, 358–372. [Google Scholar] [CrossRef]
  24. Abdel-Mohti, A.; Pekcan, G. Seismic response of skewed RC box-girder bridges. Earthq. Eng. Eng. Vib. 2008, 7, 415–426. [Google Scholar] [CrossRef]
  25. Sofi, F.A.; Steelman, J.S. Nonlinear flexural distribution behavior and ultimate system capacity of skewed steel girder bridges. Eng. Struct. 2019, 197, 109392. [Google Scholar] [CrossRef]
  26. Huang, H.; Shenton, H.W.; Chajes, M.J. Load distribution for a highly skewed bridge: Testing and analysis. J. Bridge Eng. 2004, 9, 558–562. [Google Scholar] [CrossRef]
  27. Huo, X.S.; Zhang, Q. Effect of skewness on the distribution of live load reaction at piers of skewed continuous bridges. J. Bridge Eng. 2008, 13, 110–114. [Google Scholar] [CrossRef]
  28. Théoret, P.; Massicotte, B.; Conciatori, D. Analysis and design of straight and skewed slab bridges. J. Bridge Eng. 2012, 17, 289–301. [Google Scholar] [CrossRef]
  29. Connecticut Department of Transportation. New Bridge Design Standard Practice; Connecticut Department of Transportation: Newington, CT, USA, 2005.
  30. Gurkalo, F.; Du, Y.; Poutos, K.; Jimenez-Bescos, C. The nonlinear analysis of an innovative slit reinforced concrete water tower in seismic regions. Eng. Struct. 2017, 134, 138–149. [Google Scholar] [CrossRef]
  31. Chung, W.; Sotelino, E.D. Nonlinear finite-element analysis of composite steel girder bridges. J. Struct. Eng. 2005, 131, 304–313. [Google Scholar] [CrossRef]
  32. Recalde, B.R.B.; Gastal, F.P.S.L.; Bessa, V.D.A.; Schwetz, P.F. Numerical analysis of waffle slabs in flexure considering the effects of concrete cracking. Rev. IBRACON Estrut. Mater. 2015, 8, 225–247. [Google Scholar] [CrossRef] [Green Version]
Figure 1. The current acute corner detail from Connecticut Department of Transportation [16].
Infrastructures 07 00077 g001
Figure 2. The standard acute corner reinforcement adapted from (A) Texas DOT [17], (B) Oregon DOT [18], and (C) New York State DOT [19].
Infrastructures 07 00077 g002
Figure 3. The proposed detail for the acute corner of bridge decks with larger than 20 degree skew showing (A) bottom reinforcement layer, (B) top reinforcement layer, (C) and section cut.
Infrastructures 07 00077 g003
Figure 4. The standard details from the prototype bridge models including the (A) parapet, (B) general framing plan and (C) typical section.
Infrastructures 07 00077 g004
Figure 5. Loading patterns on the isolated, fixed-based parapet model.
Infrastructures 07 00077 g005
Figure 6. The parapet stress pattern (ksi) for (A) End Segment Vertical Reinforcement, (B) End Segment Longitudinal Reinforcement, (C) Interior Segment Vertical Reinforcement, and (D) Interior Segment Longitudinal Reinforcement.
Infrastructures 07 00077 g006
Figure 7. Force–displacement relationships and bilinearization for interior and end segments from isolated parapet model.
Infrastructures 07 00077 g007
Figure 8. The definition of shell sections for deck model with (A) typical reinforcement at the acute corner (45 degree model only) and (B) modified reinforcement at the acute corner (all skew angles).
Infrastructures 07 00077 g008
Figure 9. Comprehensive view of 3D model of prototype bridges from CSiBridge.
Infrastructures 07 00077 g009
Figure 10. Locations of loading for pushover analyses of the prototype bridge models.
Infrastructures 07 00077 g010
Figure 11. The force–displacement curves from pushover analysis for Design Case 1 at end of wall segment.
Infrastructures 07 00077 g011
Figure 12. The comparison of parapet capacity between prototype bridge models, isolated parapet (fixed base) model and AASHTO yield line method.
Infrastructures 07 00077 g012
Figure 13. The deformed shape of an end segment under Design Case 1.
Infrastructures 07 00077 g013
Figure 14. The moment distribution (kip-inch/inch) in the transverse direction for Design Case 1 with (A) 15 degree, (B) 30 degree, (C) 45 degree and, (D) 60 degree skews.
Infrastructures 07 00077 g014
Figure 15. The stress distribution (ksi) in the top transverse reinforcement for Design Case 1 with (A) 15 degree, (B) 30 degree, (C) 45 degree and, (D) 60 degree skew.
Infrastructures 07 00077 g015
Figure 16. The stress distribution (ksi) in the top transverse reinforcement for Design Case 1, 45 degree model with (A) proposed reinforcement pattern and (B) unmodified reinforcement at acute corner.
Infrastructures 07 00077 g016
Figure 17. The moment distribution (k-in/in) in the top transverse reinforcement under (A) Design Case 2 with 45 degree skew, (B) Design Case 2 with 60 degree skew, (C) Design Case 3 with 45 degree skew, and (D) Design Case 3 with 60 degree skew.
Infrastructures 07 00077 g017
Figure 18. Stress distribution (ksi) in the top transverse reinforcement for Design Case 1, 45 degree model with (A) proposed reinforcement pattern and (B) unmodified reinforcement at acute corner.
Infrastructures 07 00077 g018
Figure 19. The stress distribution (ksi) in the (A) top and (B) bottom transverse reinforcement for Service-I limit state, 60 degree model with proposed reinforcement.
Infrastructures 07 00077 g019
Table 1. Barrier Capacity from Yield Line Method.
Failure PlaneLocationRw (kips)Lc (ft)
Failure Plane 1Within Wall
Segment
262.5915.29
Failure Plane 1End of Wall
Segment
116.946.81
Failure Plane 2Within Wall
Segment
217.5710.72
Failure Plane 2End of Wall
Segment
107.955.32
Table 2. Comparison of Yield Line and Pushover Analysis of Fixed Base Parapet Model.
LocationMethodYield Strength (kips)Resistance, Rw (kips)Displacement
at Rw (in)
Yield Line Extent, Lc (ft)
End of ParapetYield LineN/A108N/A5.30
End of ParapetPushover1101102.954.80
Middle of ParapetYield LineN/A218N/A10.7
Middle of ParapetPushover2282281.9213.8
Publisher’s Note: MDPI stays neutral with regard to jurisdictional claims in published maps and institutional affiliations.

