Article

A Resilience-Based Methodology to Assess Soil Structure Interaction on a Benchmark Bridge

by
Davide Forcellini
Department of Civil and Environmental Engineering, University of Auckland, 20 Symonds Street, Auckland 1010, New Zealand
Infrastructures 2020, 5(11), 90; https://doi.org/10.3390/infrastructures5110090
Submission received: 18 September 2020 / Revised: 18 October 2020 / Accepted: 19 October 2020 / Published: 28 October 2020
(This article belongs to the Special Issue Seismic Reliability Assessment and Advances in Structural Modelling)

Abstract

:
The assessment of bridge functionality during earthquakes is fundamental in the evaluation of emergency response and socio-economic recovery procedures. In this regard, resilience may be considered a key parameter for decision-making procedures such as post-hazard event mitigations and recovery investments on bridges. The paper proposes a case study of a bridge configuration subjected to seismic hazard and aims to consider the effects of the soil–structure interaction on the recovery to various levels of pre-earthquake functionality. The principal outcome of the paper consists of calculating resilience as a readable finding that may have many applications for a wide range of stakeholders, such as bridge owners, transportation authorities and public administrators who can apply the outcomes in the assessment of the best recovery techniques and solutions.

1. Introduction

Resilience from natural disasters has becoming a relevant issue for civil communities that rely particularly on bridges, being significantly exposed to natural disasters, such as earthquakes and thus quantitative estimations of seismic resilience are fundamental to define pre- and post-earthquake decision-making procedures. In particular, seismic risk assessment methodologies become crucial in planning adequate mitigation procedures and recovery activities to minimize the disruptions [1]. In this regard, resilience quantifies the recovery time and procedures in order to facilitate and enhance pre-hazard and post-hazard event mitigation and emergency response strategies of transportation systems and entire communities [2,3]. In particular, as shown in the JOINT RESEARCH PROJECT by the European Commission [4] resilience calculation depends on two important models: a loss model and a recovery model.
(1) A loss model is necessary to assess the reduction of functionality due to the impact of earthquakes [5] and risk assessment of structures requires a probabilistic-based approach to consider all the possible damage and failure scenarios of each component within a bridge, as shown in [6]. In [7], expected direct costs were calculated as the sum of the losses associated with all the vulnerable components failure/damage states in all possible conditions while indirect losses were defined as those associated with system failures by a scenario-based approach regarding the condition states of the components. However, indirect losses have many consequences and uncertainties that need to be assessed with interdisciplinary approaches [8,9].
(2) Recovery is a complex process that comprises a series of event, actions or changes to enhance the capacity of an affected bridge, but also community, when faced with singular, multiple or unique shocks and stresses, places emphasis on the human role. Therefore, recovery functions are essential for evaluating resilience but influenced by many variables, time dimensions and spatial dimensions with disparities among different geographic areas, in the same community or state and showing different rates and quality of recovery. To the best of our knowledge, there are few applications to earthquakes [10,11]. In Europe in particular, the restoration procedures have been left to the discretion of each nation and a standardized approach would start from the existing BRIME project that focused on bridge deterioration, and the two of the standing European projects: INPREP for improving effective inter-organizational response capacity in complex environments of disasters and PANOPTIS, a decision support system for increasing the resilience of transportation infrastructure. In the US, several implementations within computational platforms were developed (i.e., [12,13]).
A state of the art of such procedures was proposed by [14]. Many approaches focused on maintenance, safety, and robustness [11,15,16] analyzed post-earthquake functionality, while [17,18,19] proposed holistic risk management approaches. As underlined by [20], practical approaches that may incorporate bridge resilience have becoming fundamental to assess recovery procedures. Among others, a multi-objective evolutionary algorithm was proposed and applied by [21] with the aim to evaluate resilience of the retrofitted bridge under the multi-hazard effect of earthquake and flood-induced scour. The framework of [22] was applied for time-variant loss and resilience assessment of Californian highway bridges under time-dependent multiple hazards.
Against this background, [23] compared the performance of several isolated bridge configurations under soil–structure interaction (SSI) effects, by applying the performance-based earthquake engineering (PBEE) methodology to calculate repair costs without quantifying resilience. The present paper aims to contribute by performing the procedure proposed by [5] to study the effects of SSI on the seismic resilience of a bridge configuration. The ultimate objective is to perform a case study on a typical highway overpass by performing tridimensional numerical simulations of an integrated bridge-foundation-ground model and a performance-based assessment framework. The role of soil structure interaction (SSI) has been accounted for in order to perform a realistic risk assessment by founding the bridge on three different grounds with varying stiffness and strength (ranging from a rigid to a weak soil uniform layer). In particular, the SSI is fundamental to be considered at the design stage to consider the detrimental effects that considering the soil may influence the seismic assessment of the structural vulnerability.
Following the first attempt by [24], the paper has several elements of novelty: (1) it aims to overcome the lack of bridge resilience assessments necessary for investments, decision-making procedures and pre- and post-hazard risk mitigations; (2) the role of SSI is here investigated with a new approach based on quantification of resilience; and (3) the presented outputs may be applied by decision-makers to choose the best investments for post-hazard event mitigations, emergency responses and recovery strategies with more realistic scenarios. In particular, resilience is a key parameter that may include issues from several disciplines, such as structural, physical, social and economic relationships. This multi-disciplinary dimension is another important novelty of the methodology proposed herein. The paper is organized into 5 sections. Section 2 explains the numerical models. Section 3, Section 4 and Section 5 the methodology that was proposed is described by considering the definition of resilience and loss and recovery models. The results are shown in Section 6 where the discussion of the mail applications is also proposed.

2. Numerical Model

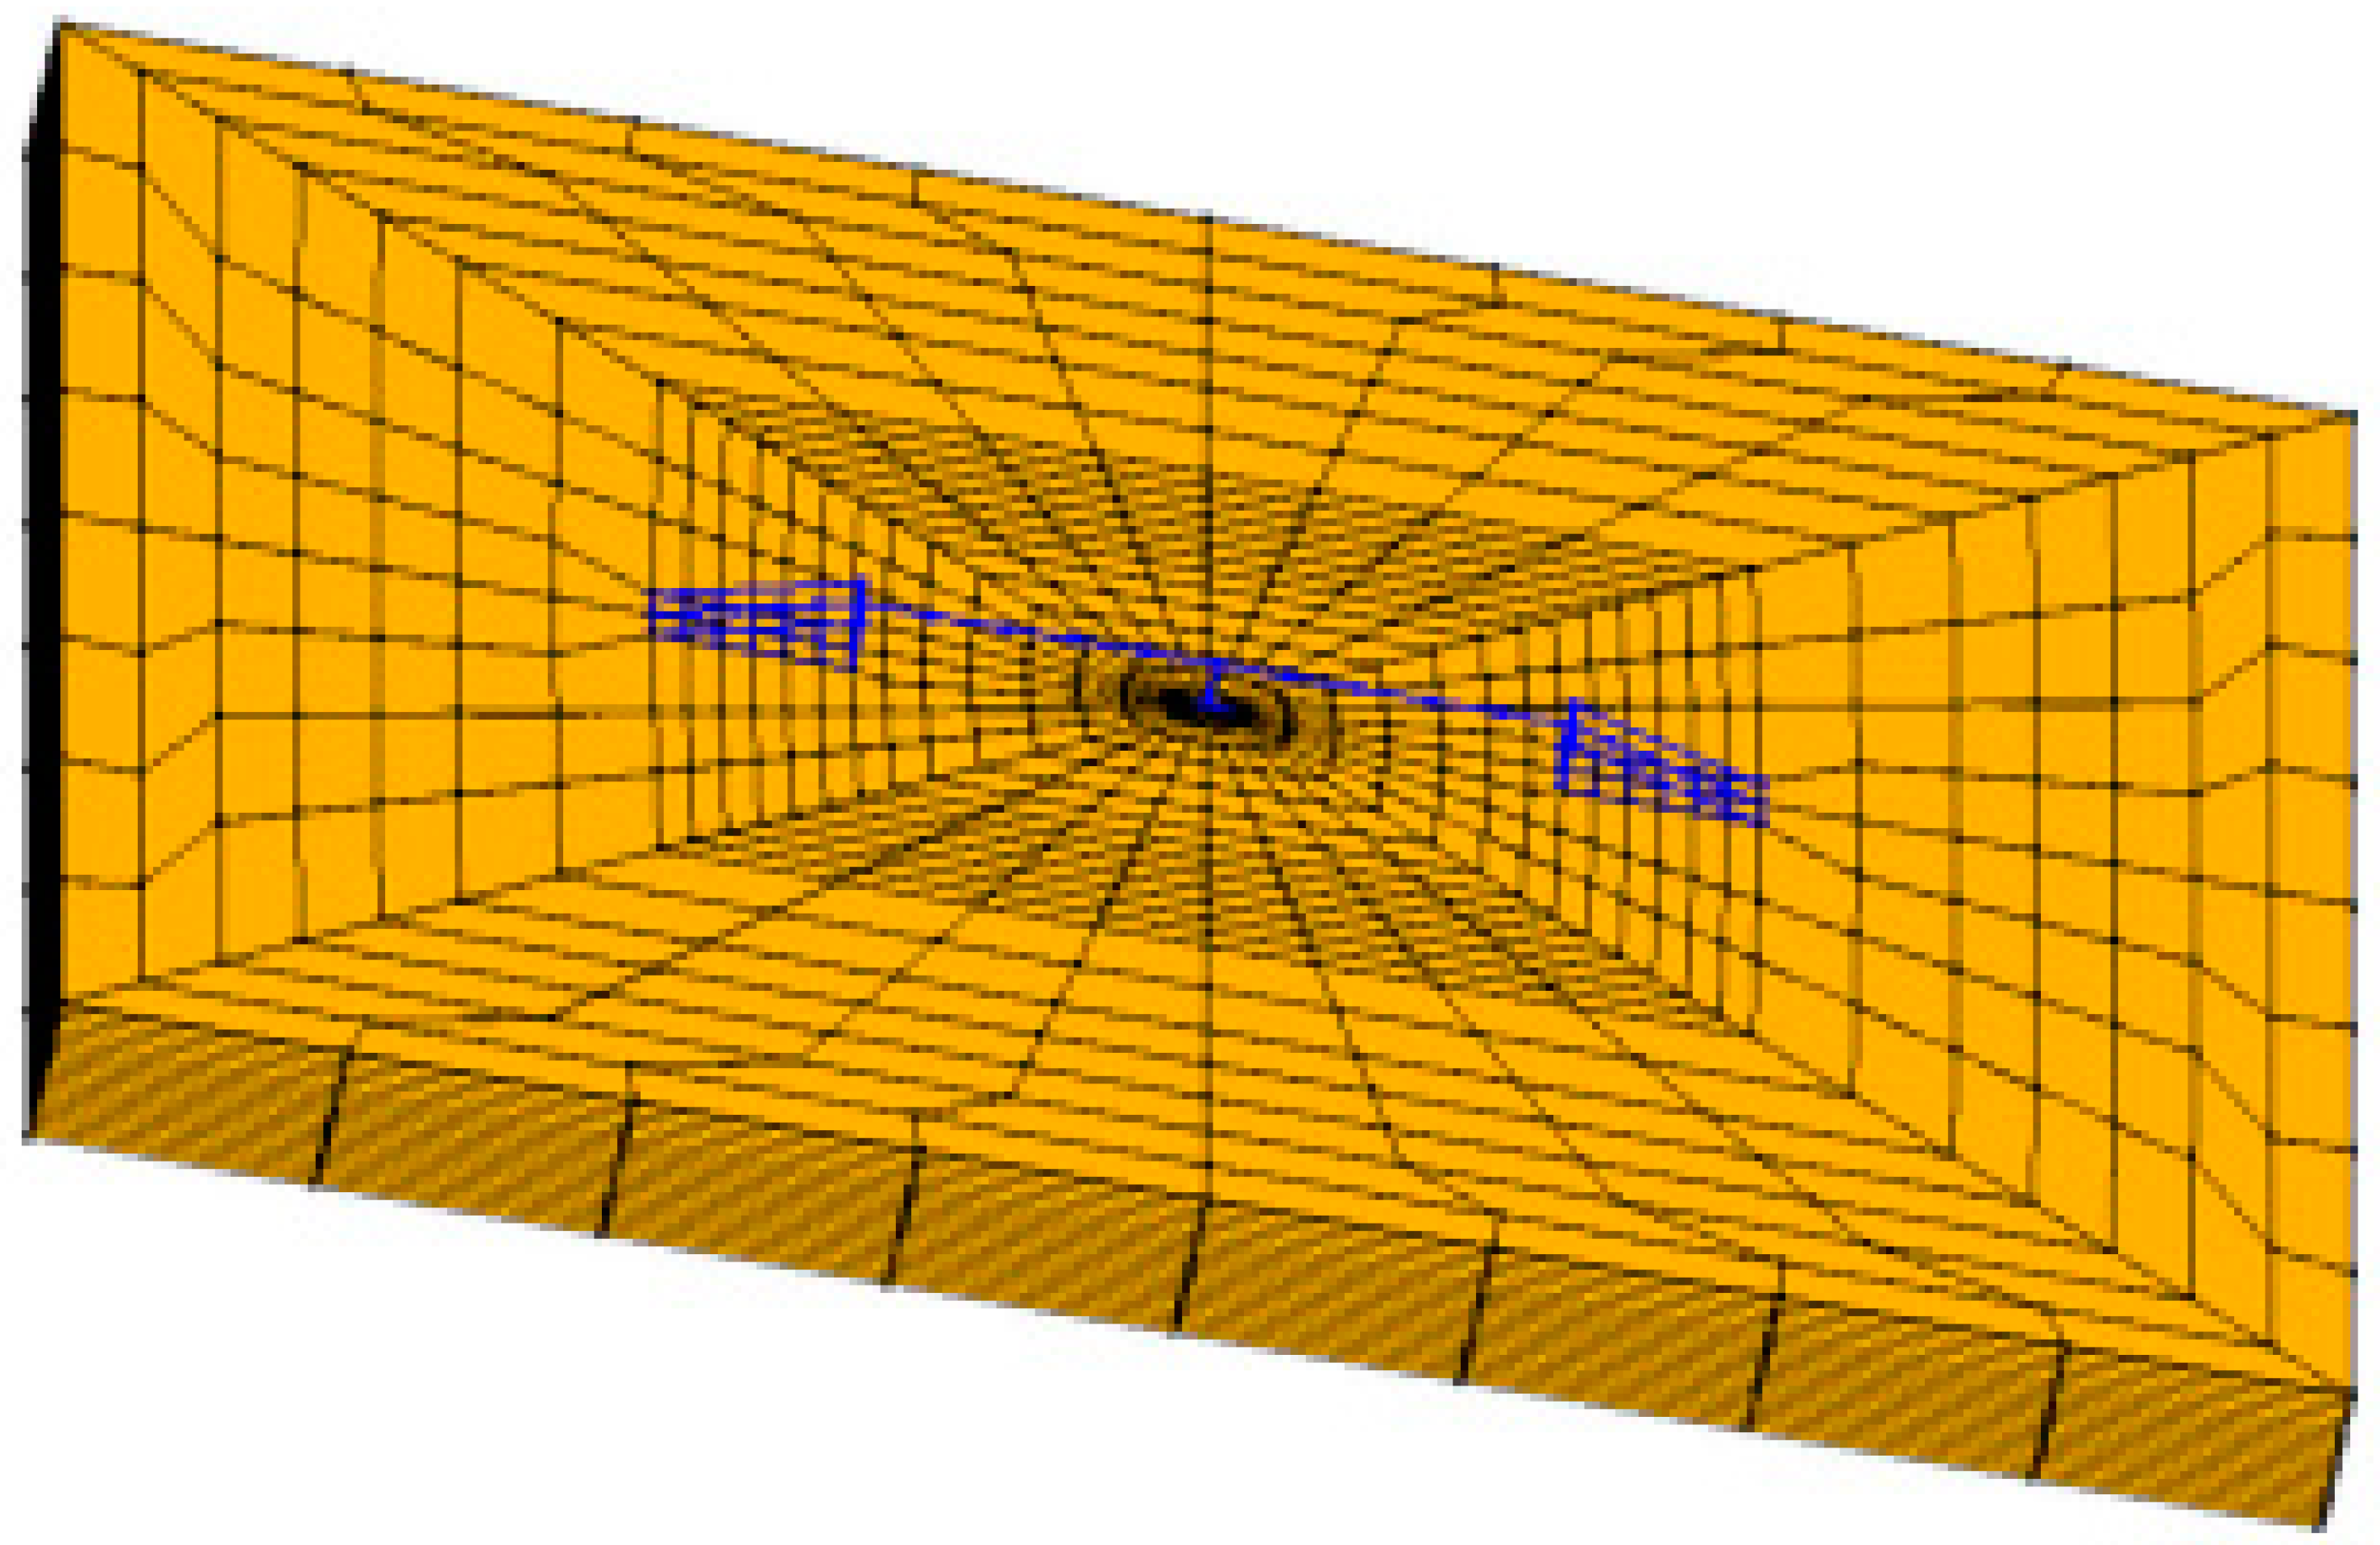
The structural scheme of the bridge consists of an ordinary standard bridge (OSB) representing California highway bridges and designed according to the Caltrans Seismic Design Criteria [25]. The bridge that is herein used was the object of a previous contribution [23] as a possible configuration for strengthen an original bridge and named I-01 (Figure 1 and Figure 2). The proposed 3D finite element model aims to reproduce the complex non-linear mechanisms to represent realistically the behaviour of the entire system (soil + foundation + bridge). This goal is particularly challenging because of the effect of soil non-linearity, such as the shear mechanisms that lead to permanent deformations. OpenSees [26,27] was applied to build the finite element models. In particular, due to the large number of non-linear dynamic analyses some simplifications were introduced to improve the computation speed: (1) abutment foundations were modelled as rigid slabs and with an equivalent linear elastic material. (2) Deformations inside the foundation and intermediate nodes along the height of the superstructure were calculated during the analyses but not saved and memorized as results. (3) Concrete columns were modelled with equivalent linear elastic materials. (4) The deck is assumed to be capacity designed since the isolation systems have been designed to allow it to respond in the elastic range, as in [23]. (5) Abutments were modelled with an equivalent linear elastic material and a nominal mass proportional to the superstructure dead loads, as in [23].

2.1. Soil Model

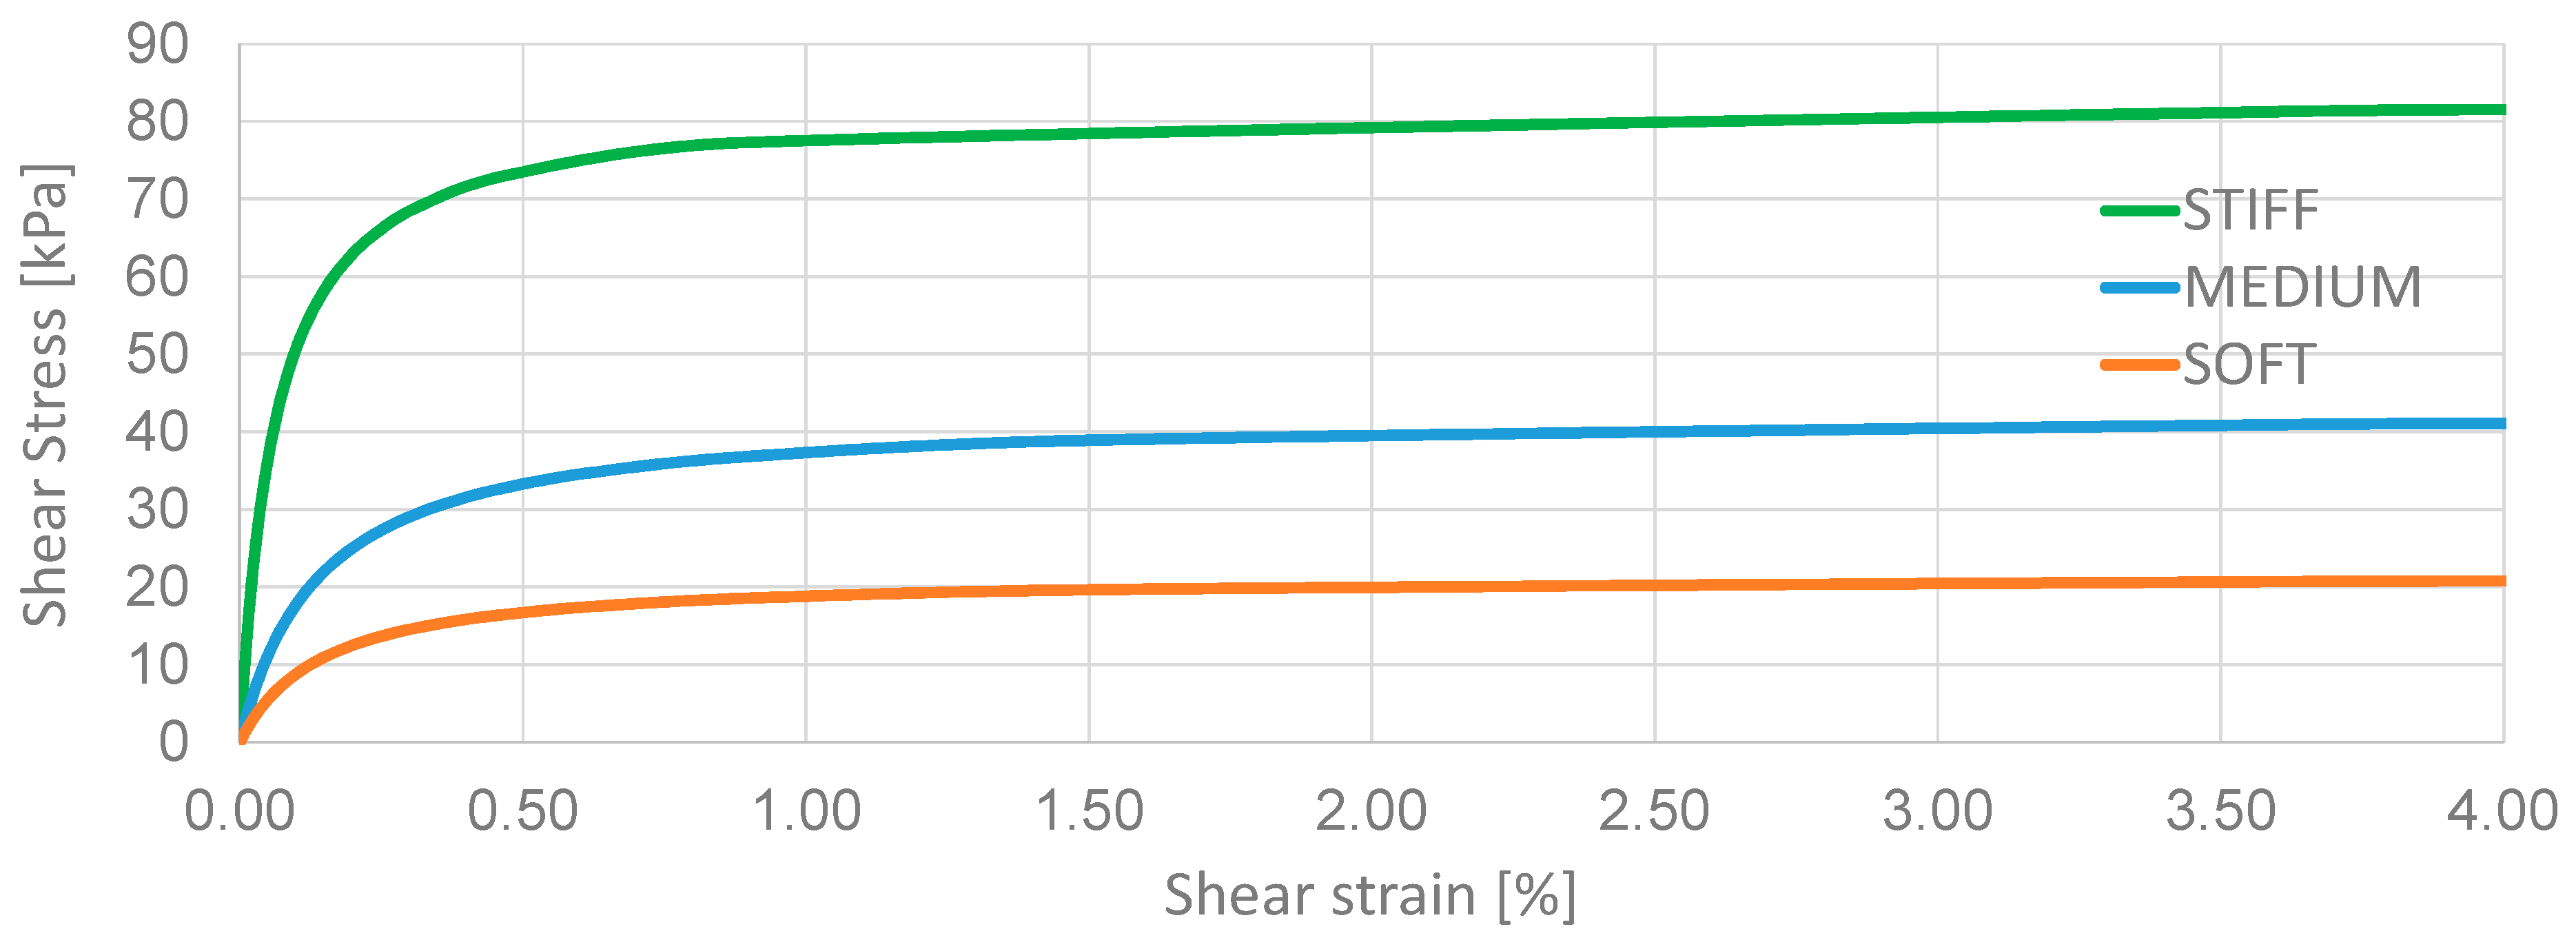
The soil was simulated with a 200 × 200 m × 20 m 3D soil mesh built up with 6360 modes and 5330 non-linear ‘‘Bbar brick’’ elements. The mesh was calibrated among several ones to be the best compromise between computational cost and numerical precision. For each element: 20 nodes describe the solid translational degrees of freedom (DOF) and for each of them: DOFs 1, 2 and 3 represent solid displacement recorded using OpenSees Node Recorder [26] at the corresponding integration points. The number of elements was defined on the bases of the wavelength of the seismic signal and the maximum frequency above which the spectral content of the input can be considered negligible. The dimension of the elements was increased from the bridges to the lateral boundaries that were modelled to behave in pure shear and located far away, as previously studied in [23]. The meshes were built up following the approach shown in [23,28,29,30] and were tested by verifying that the accelerations at the surface of the mesh near the lateral boundaries were identical to those simulating free-field conditions. The penalty method (tolerance: 10−4) was applied in correspondence with the lateral boundaries and shear deformations were allowed by leaving the longitudinal and transversal directions unconstrained. Vertical direction was fixed at the lateral boundaries. Absorbent boundaries were assigned at the base to account for the effects of wave reflection following the traditional approach by [31]. Three homogeneous layers (named STIFF, MEDIUM and SOFT) with increasing deformability were performed in order to consider the non-linear effects of the soil, such as amplitude-dependent amplification (or de-amplification), plastic accumulation of ground deformation and permanent movements (rotations, settlements and tilts) at the foundation level. The Pressure-Independent MultiYield (PIMY) model (representative parameters shown in Table 1) was applied in order to consider the non-linear mechanisms of hysteretic response and radiation damping. PIMY implements the Von Mises multi-surface kinematic plasticity model allowing the of cycle-by-cycle mechanism of permanent shear strain accumulation to be controlled. In particular, the deviational part of the flow rule is associate (non-linear) and independent from the volumetric part (non-associate and linear-elastic), as shown in [32]. The non-linear back-bone curve are represented by hyperbolic relations and defined by the strain shear modulus and ultimate shear strength (Figure 3).

2.2. Foundation Model

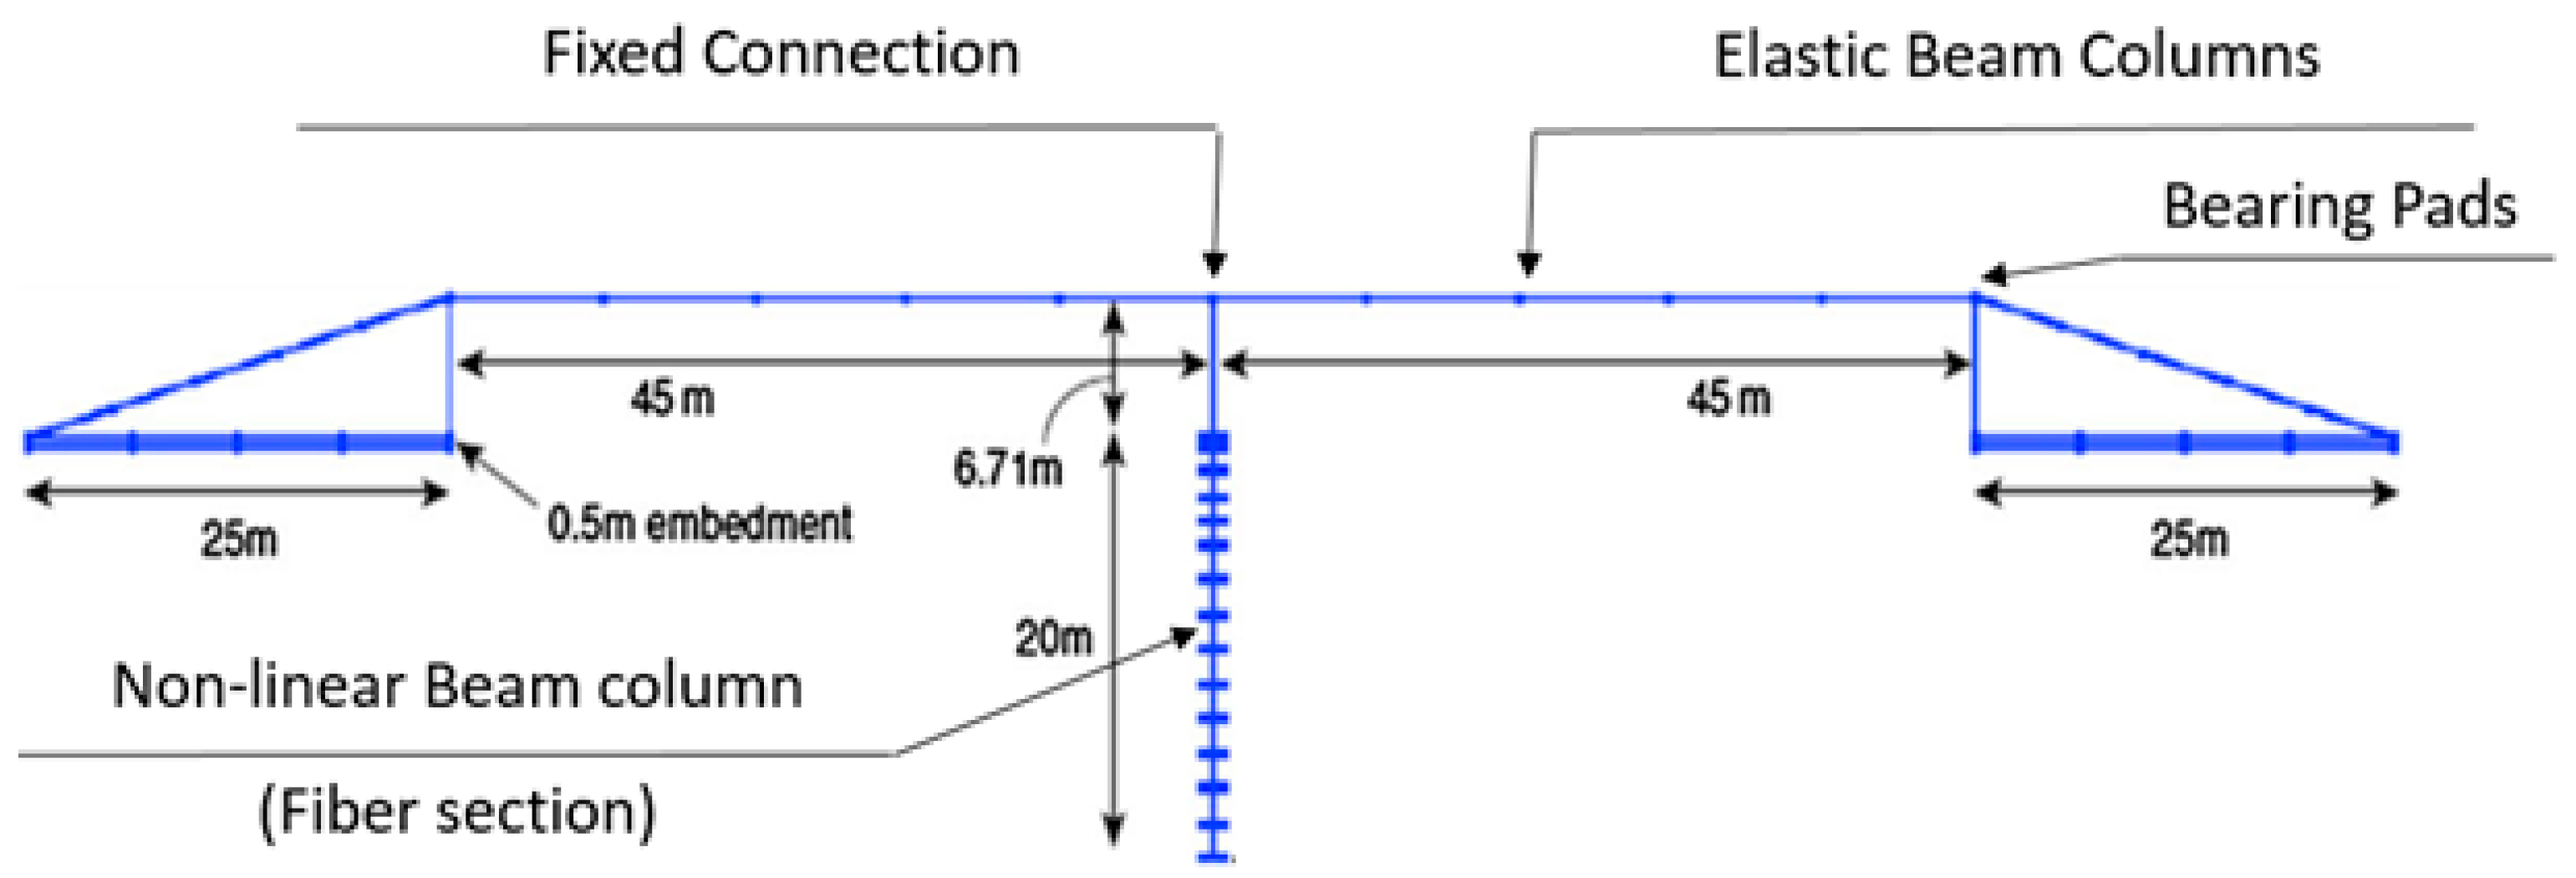
The entire system was developed to capture the interaction between the structural elements and the soil (i.e., potential settlements, rotations and tilts). In particular, foundations were modelled as superficial 0.5m-concrete slabs for both the abutments and were designed for the most severe conditions, such as maximum vertical pressure and maximum eccentricity (calculated as the ration between the overturning moment bending moment at the base of the foundation and the vertical axial force). Rigid link elements were used to model the 0.5m foundations below the abutments to capture the interaction of the soil and the bridge (including the potential embankment settlement into the surrounding soil), as in [23,28,29,30]. EqualDOF, commonly used in OpenSees [26] to link together nodes that has the same degree of freedom, connects the two points (one belonging to the foundation and the second to the soil, imposing equality of displacements. The foundation of the column has been modelled as a single Type I Caltrans pile shaft (20 m length) assumed to have a cross section continuous with the column above and below the grade. EqualDOF was used to link together all the nodes at the base of the column and the ones belonging to the foundation slab, modeled as a rigid element. The nodes of the interface between the foundations and the soil were connected with a horizontal rigid beam-column link to model the continuity of the link slab-column. Rigid beam-column links set normal to the pile longitudinal axis represent the geometric space occupied by the pile and were connected to the soil with EqualDOF. The 25m-embankments were founded on a 0.5 m foundation with a total weight of 30000 kN.

2.3. Structural Model

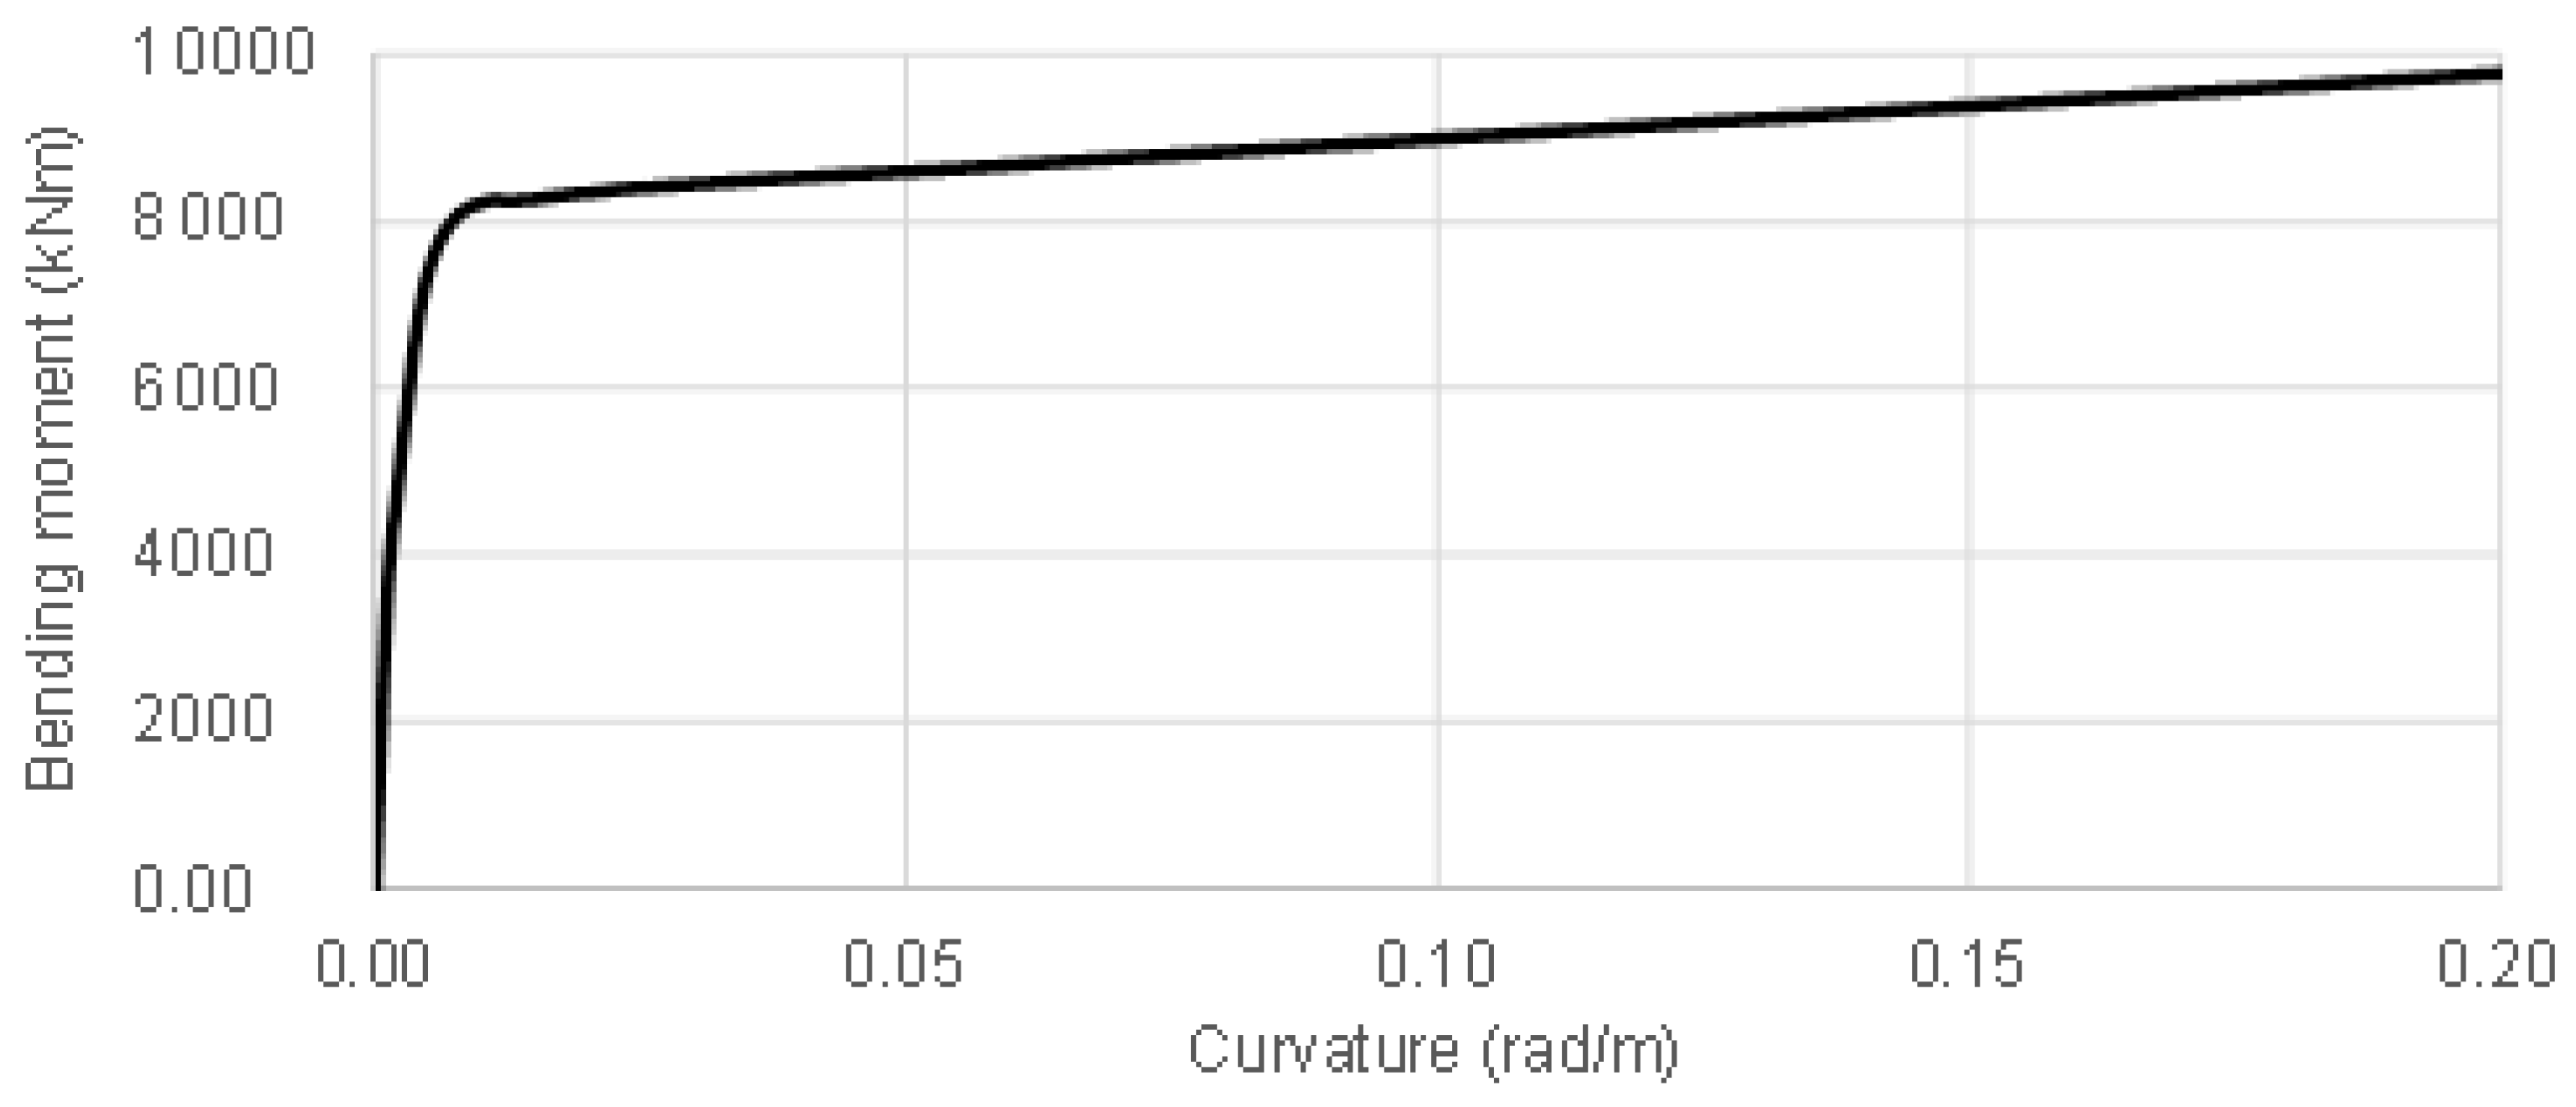
The bridge was modelled with elastic material (Young modulus: 2.8∙107 kPa, Shear modulus: 1.15∙107 kPa, density: 2.4 t/m3). The 6.71 m-column was modelled with non-linear forced-based beam elements and fiber-section (cross section: 0.95 m2, moment of Inertia about longitudinal and transversal axis: 0.108 m4), and the moment/curvature diagram is shown in Figure 4. The column was connected to the deck with EqualDOF in order to model restrain all the 6 components of deformations (fixed connection). The 90 m-deck is also modelled with elastic beam elements (cross section: 5.72 m2, moment of Inertia about transversal axis: 2.81 m4 and vertical axis: 53.9 m4, distributed loads: 130.3 kN/m). The deck was connected with the abutments with zero-length elements (with high stiffness) in the transversal and vertical directions to restrain the deformations along these directions. The longitudinal connections between the deck and the abutments were realized with bearing pads in symmetrical positions and shown in Figure 5. The bridge could translate longitudinally, following a perfect elastic connection deck–abutments, realized with Soft Damping Rubber Bearings with modulus of elasticity G = 0.4 MPa and equivalent viscous damping n = 10%. These devices were modelled with 2 longitudinal simple elastic springs (730 kN/m) for each pads, while vertical and transversal directions of the abutments were restrained [23,33].

3. Resilience Assessment

The methodology followed in this paper is based on several assumptions: (1) the implementation of a restoration function proposed by [29]; (2) the assessment of losses by using repair cost ratio (RCR) and repair time (RT) from the PBEE methodology, and (3) the calculation of resilience as the primary parameter used to guide investment decisions for a bridge after an earthquake. Resilience is defined by the rapidity for a system to return to pre-disaster levels of performance and can be calculated as follows:
R = t 0 E t 0 E + R T Q ( t ) R T d t
where, t0E is the time of occurrence of the event E, RT is the repair time (or recovery time) necessary to restore the functionality of the bridge and it is calculated with the PBEE methodology, as shown in the next section. Q(t) is the recovery function that quantifies the recovery process to return to the pre-earthquake level of functionality. Resilience is defined graphically as the normalized shaded area underneath the recovery function Q(t) and thus its quantification is based on the definition of Q(t) functions [5].

4. Recovery Model

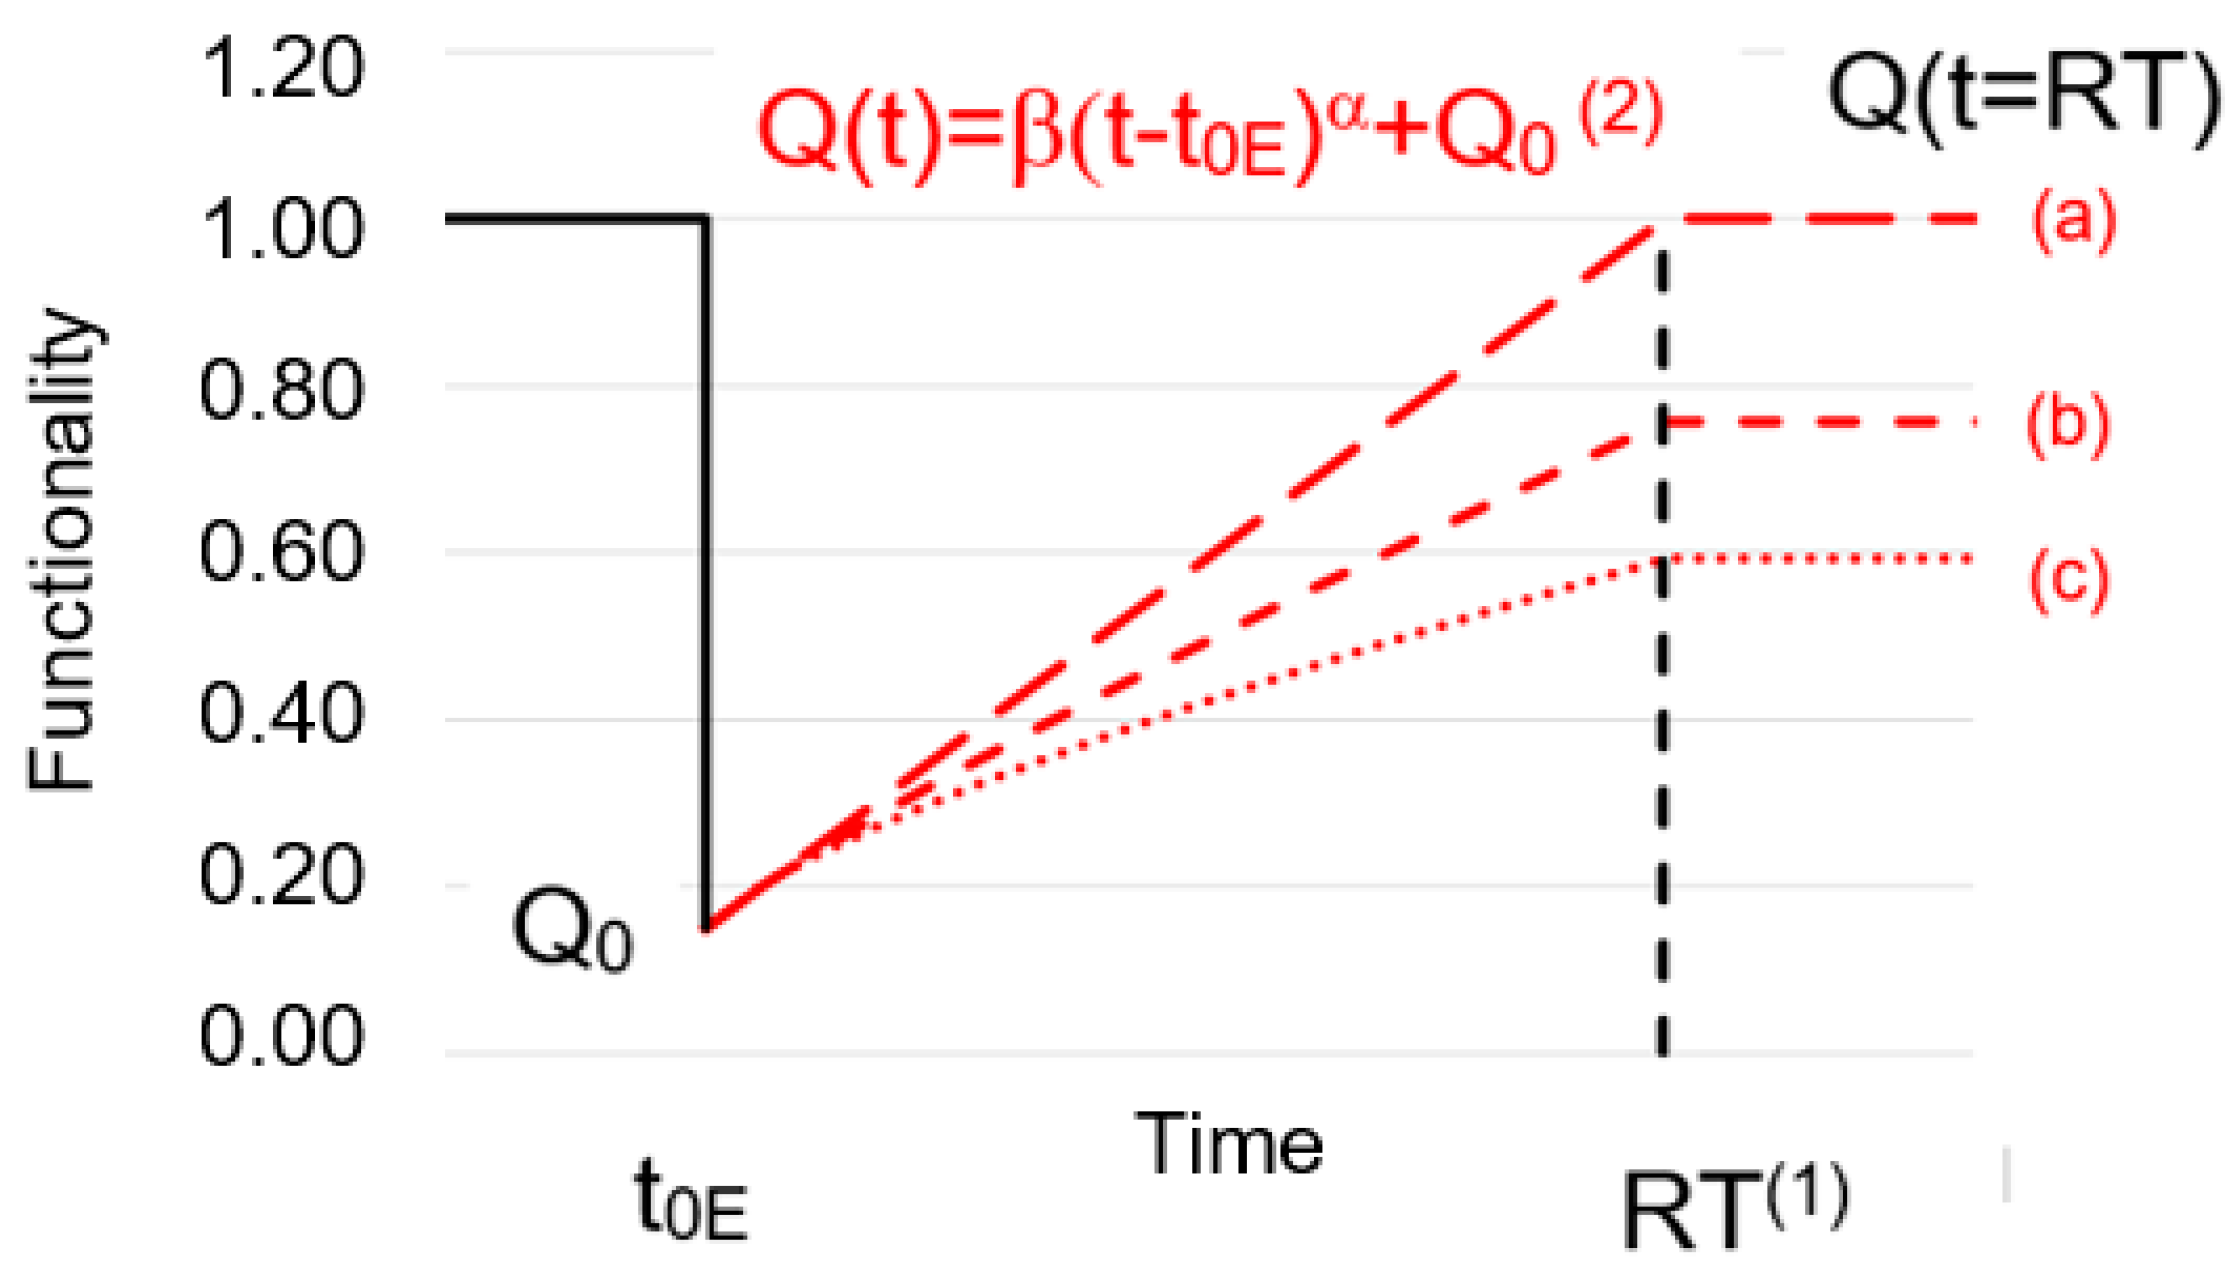
Recovery models quantify the recovery procedures to recover from the seismic event and this paper proposes a formulation to describe the recovery process with a continuous function that assesses the increase of bridge functionality (Q) in dependence with time (t) by a power model that is generally applied to describe log-normally distributed phenomenon. Such a formulation is useful because the unknown coefficients can be obtained from regression analyses that are statistical processes for estimating the relationships between variables. Therefore, Q is defined as the percentage of the pre-earthquake functionality (see Figure 6):
Q ( t ) = β × ( t t 0 E ) α   +   Q 0
where t0E is the time of occurrence of the event E, RT is the repair time (or recovery time) necessary to restore the functionality of the bridge and it is calculated with the PBEE methodology, as shown in the next section. Q(t) is the recovery function that quantifies the recovery process to return to the pre-earthquake level of functionality. Resilience is defined graphically as the normalized shaded area underneath the recovery function Q(t) and thus its quantification is based on the definition of Q(t) functions [5].
β represents the ratio between the final functionality Q and the original value of functionality (that is assumed equal to one). This ratio can generally vary from 0 to 1 (0% to 100%). Sometimes recovery procedures allow an improvement relative to the original functionality, and this value can be higher than 1.0.
α defines the exponent of the growth and it is related to the specific strategy applied. It depends on many uncertainties and can be assessed by statistical approaches, such as optimization procedures.
Q0 is the level of functionality due to the impact of the earthquake in correspondence with the time of occurrence of the event E (t0E) and needs to be assessed by the estimation of direct and indirect losses (see next section), as described in [5]. The proposed formulation (2) is based on two parameters (α and β and a mathematical structure (power function) that can describe restoration procedures more realistically than the linear one. In particular, α and β need to be consistent with practical experience coming from bridge multi-sectorial actors (i.e., bridge owners, transportation authorities and public administrators) to cover various bridge classes, different bridge characteristics and specific recovery procedures.

5. Loss Model

Recovery time and costs of repair were calculated by applying the Pacific Earthquake Engineering Research (PEER) centre methodology [34,35]; 100 input motions were selected from the PEER NGA database (http://peer.berkeley.edu/nga/). They consist of 3D triplets, composed of 3 perpendicular acceleration time history components (2 lateral and 1 vertical) and reproduce typical California seismicity, with characteristic periods similar to the fundamental of the bridges, [23].
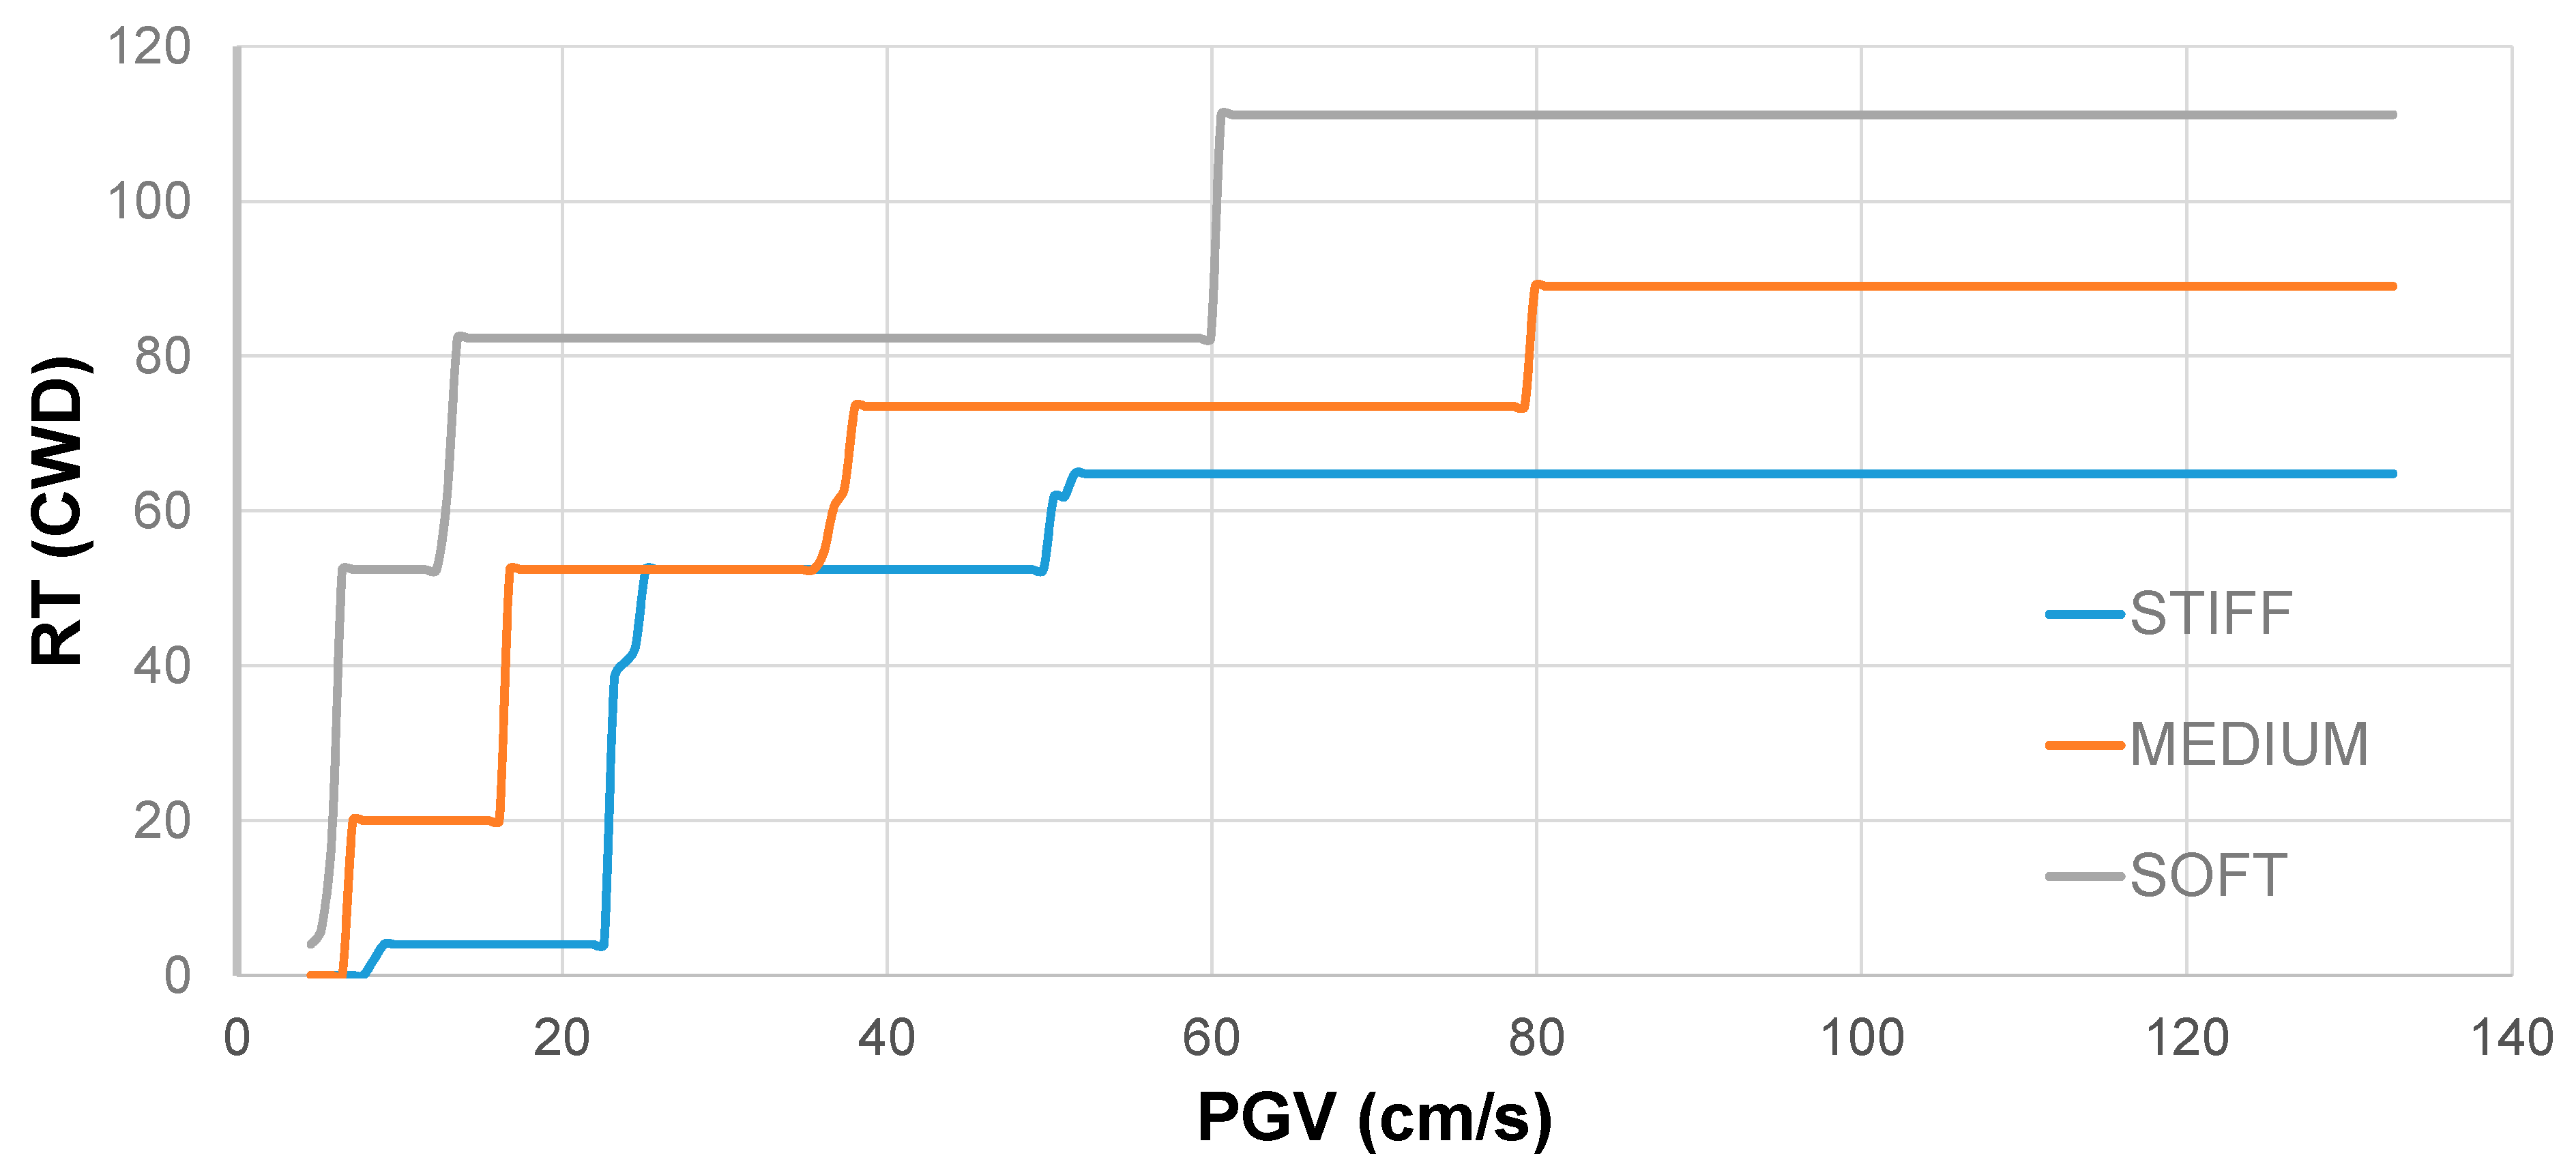
The ground motion hazard was introduced for a hypothetical site with intensity data specified at three specific probabilities of exceedance in 50 years (2%, 10%, and 50%). The calculation of the losses is based on the Caltrans Comparative Bridge Costs database and consisted in a probabilistic procedure called the local linearization repair cost and time methodology (LLRCAT) developed by Mackie et al., 2011 and 2012. Repair time is expressed in crew working days (CWD) that is not the number of days that would be required for repair but depends on several factors, such as the number of crews, incentives, number of hours per day on site, etc. Repair costs are expressed in terms of RCR defined as the ratio between the cost of repair and the cost of replacement (does not include demolition) and it can range between 0% and some number higher than 100%. Repair costs are calculated on the basis of performance groups and cost functions that allow to define the loss with a probabilistic-base approach and on the bases of economic estimations [34,35]. The results for three different soil conditions are shown Figure 7 and Figure 8 in terms of PGV (Peak Ground Velocity), used as the reference intensity measure.
The effects of soil deformability on the performance of the bridge and thus on the losses depend on the mutual interaction between the dynamic characteristics of the input motion and of the structure, as shown in [24]. It is worth noting here that accounting SSI effects lead to an increase of both the losses, with a less continuous increase for RTs, due to the triggering of repair activities, as shown in [8].
Figure 7 shows that the STIFF condition accumulates the least RT (as would be expected) before reaching a plateau (around 52.5 CWD) above which RTs do not continue to increase because the intensities of PGV are insufficient to cause more failure in the superstructure. The weaker soil cases also exhibit a cost plateau, followed by another increase at PGV (equal to 60 cm/s and 80 cm/s, respectively for SOFT and MEDIUM), due to the accumulation of damage at foundation level. The maximum values of RT are 111.1 CWD and 82.3 CWD, respectively for SOFT and MEDIUM soil.
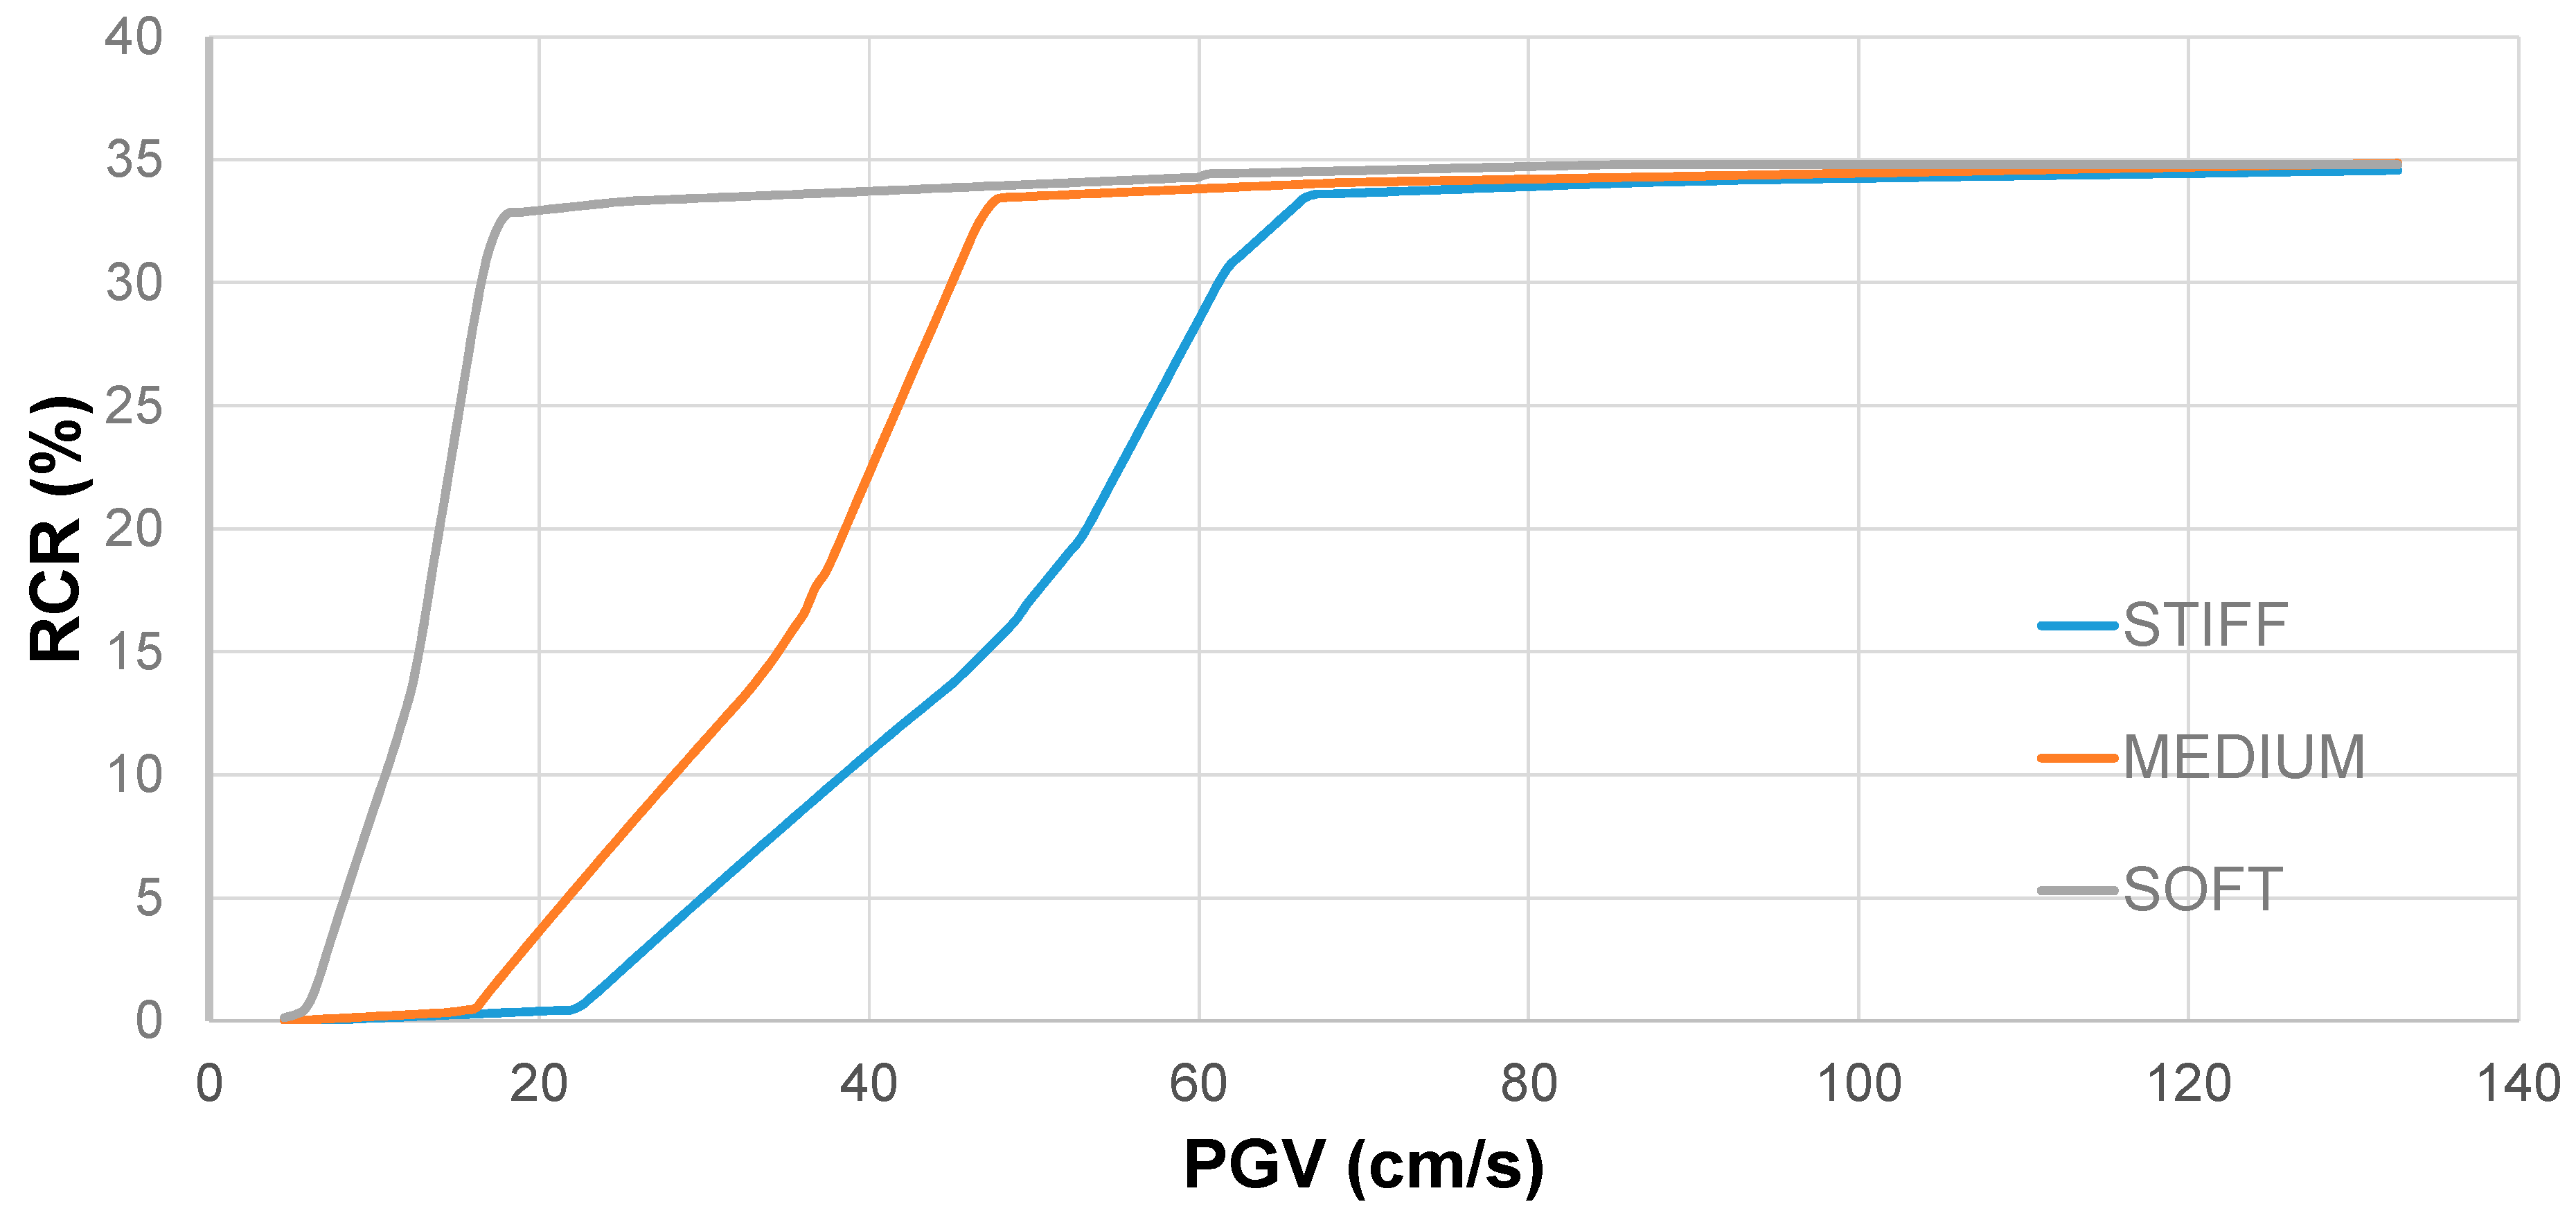
Figure 8 shows that for MEDIUM and STIFF soil scenarios, RCRs begin to accumulate only after a certain level of PGV (approximately 15 cm/s and 20 cm/s, respectively for MEDIUM and STIFF). For the SOFT condition, there is no retardation in the increase of RCRs that is quicker than for the other soil conditions to reach a plateau above which the cost is relatively constant (for PGV bigger than 18 cm/s). For other soil conditions, RCRs increase for PGVs ranging between 15 cm/s to 45 cm/s for MEDIUM soil and between 22 cm/s to 65 cm/s for STIFF soil. After these intensities, all the soil conditions show the same (almost constant) values of RCR (33–35%).
Table 2 and Table 3 show the results in terms of RT and RCR for the three considered soil conditions and with three specific probabilities of exceedance in 50 years (2%, 5% and 10%).
In order to apply (2) and thus quantify resilience, it is essential to calculate Q0 as the level of functionality consequent to the impact of the earthquake at the time of occurrence of the event E (t0E). According with [5], Q0 may be defined as:
Q 0 = 1 L = 1 R C R i × R T
where Q0 is the ordinate in correspondence with t0E and is obtained by subtracting the losses (indicated in (3) with L) to the original functionality (supposed to be 100%). Note that Q0 and RCR are expressed in percentage, while RT in CWD, therefore i is a coefficient with the dimensions of [1/T]. As proposed by [5], direct and indirect losses can be divided in the losses directly identified as the economic costs and those related to the casualties and because the extreme uncertainties related to the estimation of casualties, the losses are herein calculated by considering only the economic losses.
Direct economic costs were assumed to be described with the previous calculated RCR (Figure 8), since they represent the total costs in terms of structural and non-structural elements, as proposed already in [24]. Indirect economic losses can be related with the repair time RT (Figure 7) and they consist of two typologies: prolongation time and connectivity losses, as proposed and applied in [23]. In particular, the assessment of indirect losses is a challenging issue and implementing their calculation in a comprehensive framework may be difficult because the extreme variability of this typology of losses and the dependency of indirect losses on structures and on network conditions, do not allow a unique definition, as shown in [8]. In addition, deducing indirect losses from repair time helps to avoid the uncertainties connected with the estimation of traffic flow before and after the critical event as proposed in some contributions (e.g., [36]). Applying the PBEE methodology is also important in adopting a probabilistic-based approach instead of a deterministic estimation of indirect losses. Indirect losses connected with the prolongation of travel (PT) are caused by interventions on the infrastructure and the consequent detours that might be needed. Losses due to PT are important when a network is redundant and there are other alternative networks that can be used to cover the journey. The second dimension of indirect losses consists of connectivity loss (CL), principally due to the loss of economic activity that occurs when travel is not possible or the journey can become prohibitive for commercial and industrial traffic and the entire journey is not covered any more. This intangible nature of CL makes the assessment relatively challenging. In this paper indirect losses are calculated as proportional to repair time, calculated in the previous section (Figure 7), by applying a different coefficient i in order to represent the cases where only direct losses are considered (i = 0) and several cases where indirect losses become more important.

6. Seismic Assessment of Soil–Structure Interaction

This section discusses the calculation of resilience by applying the (1) and (2). Several assumptions were made in the choice of the various parameters: (1) this paper applied a linear restoration function (α = 1), in absence of information about preparedness and available resources, (2) 3 values of β were considered: 0.8, 1 and 1.1 (Table 4, Table 5, Table 6, Table 7 and Table 8) to define the level of recover the original functionality after the earthquake (a partial, a full recovery, and an improvement, respectively).
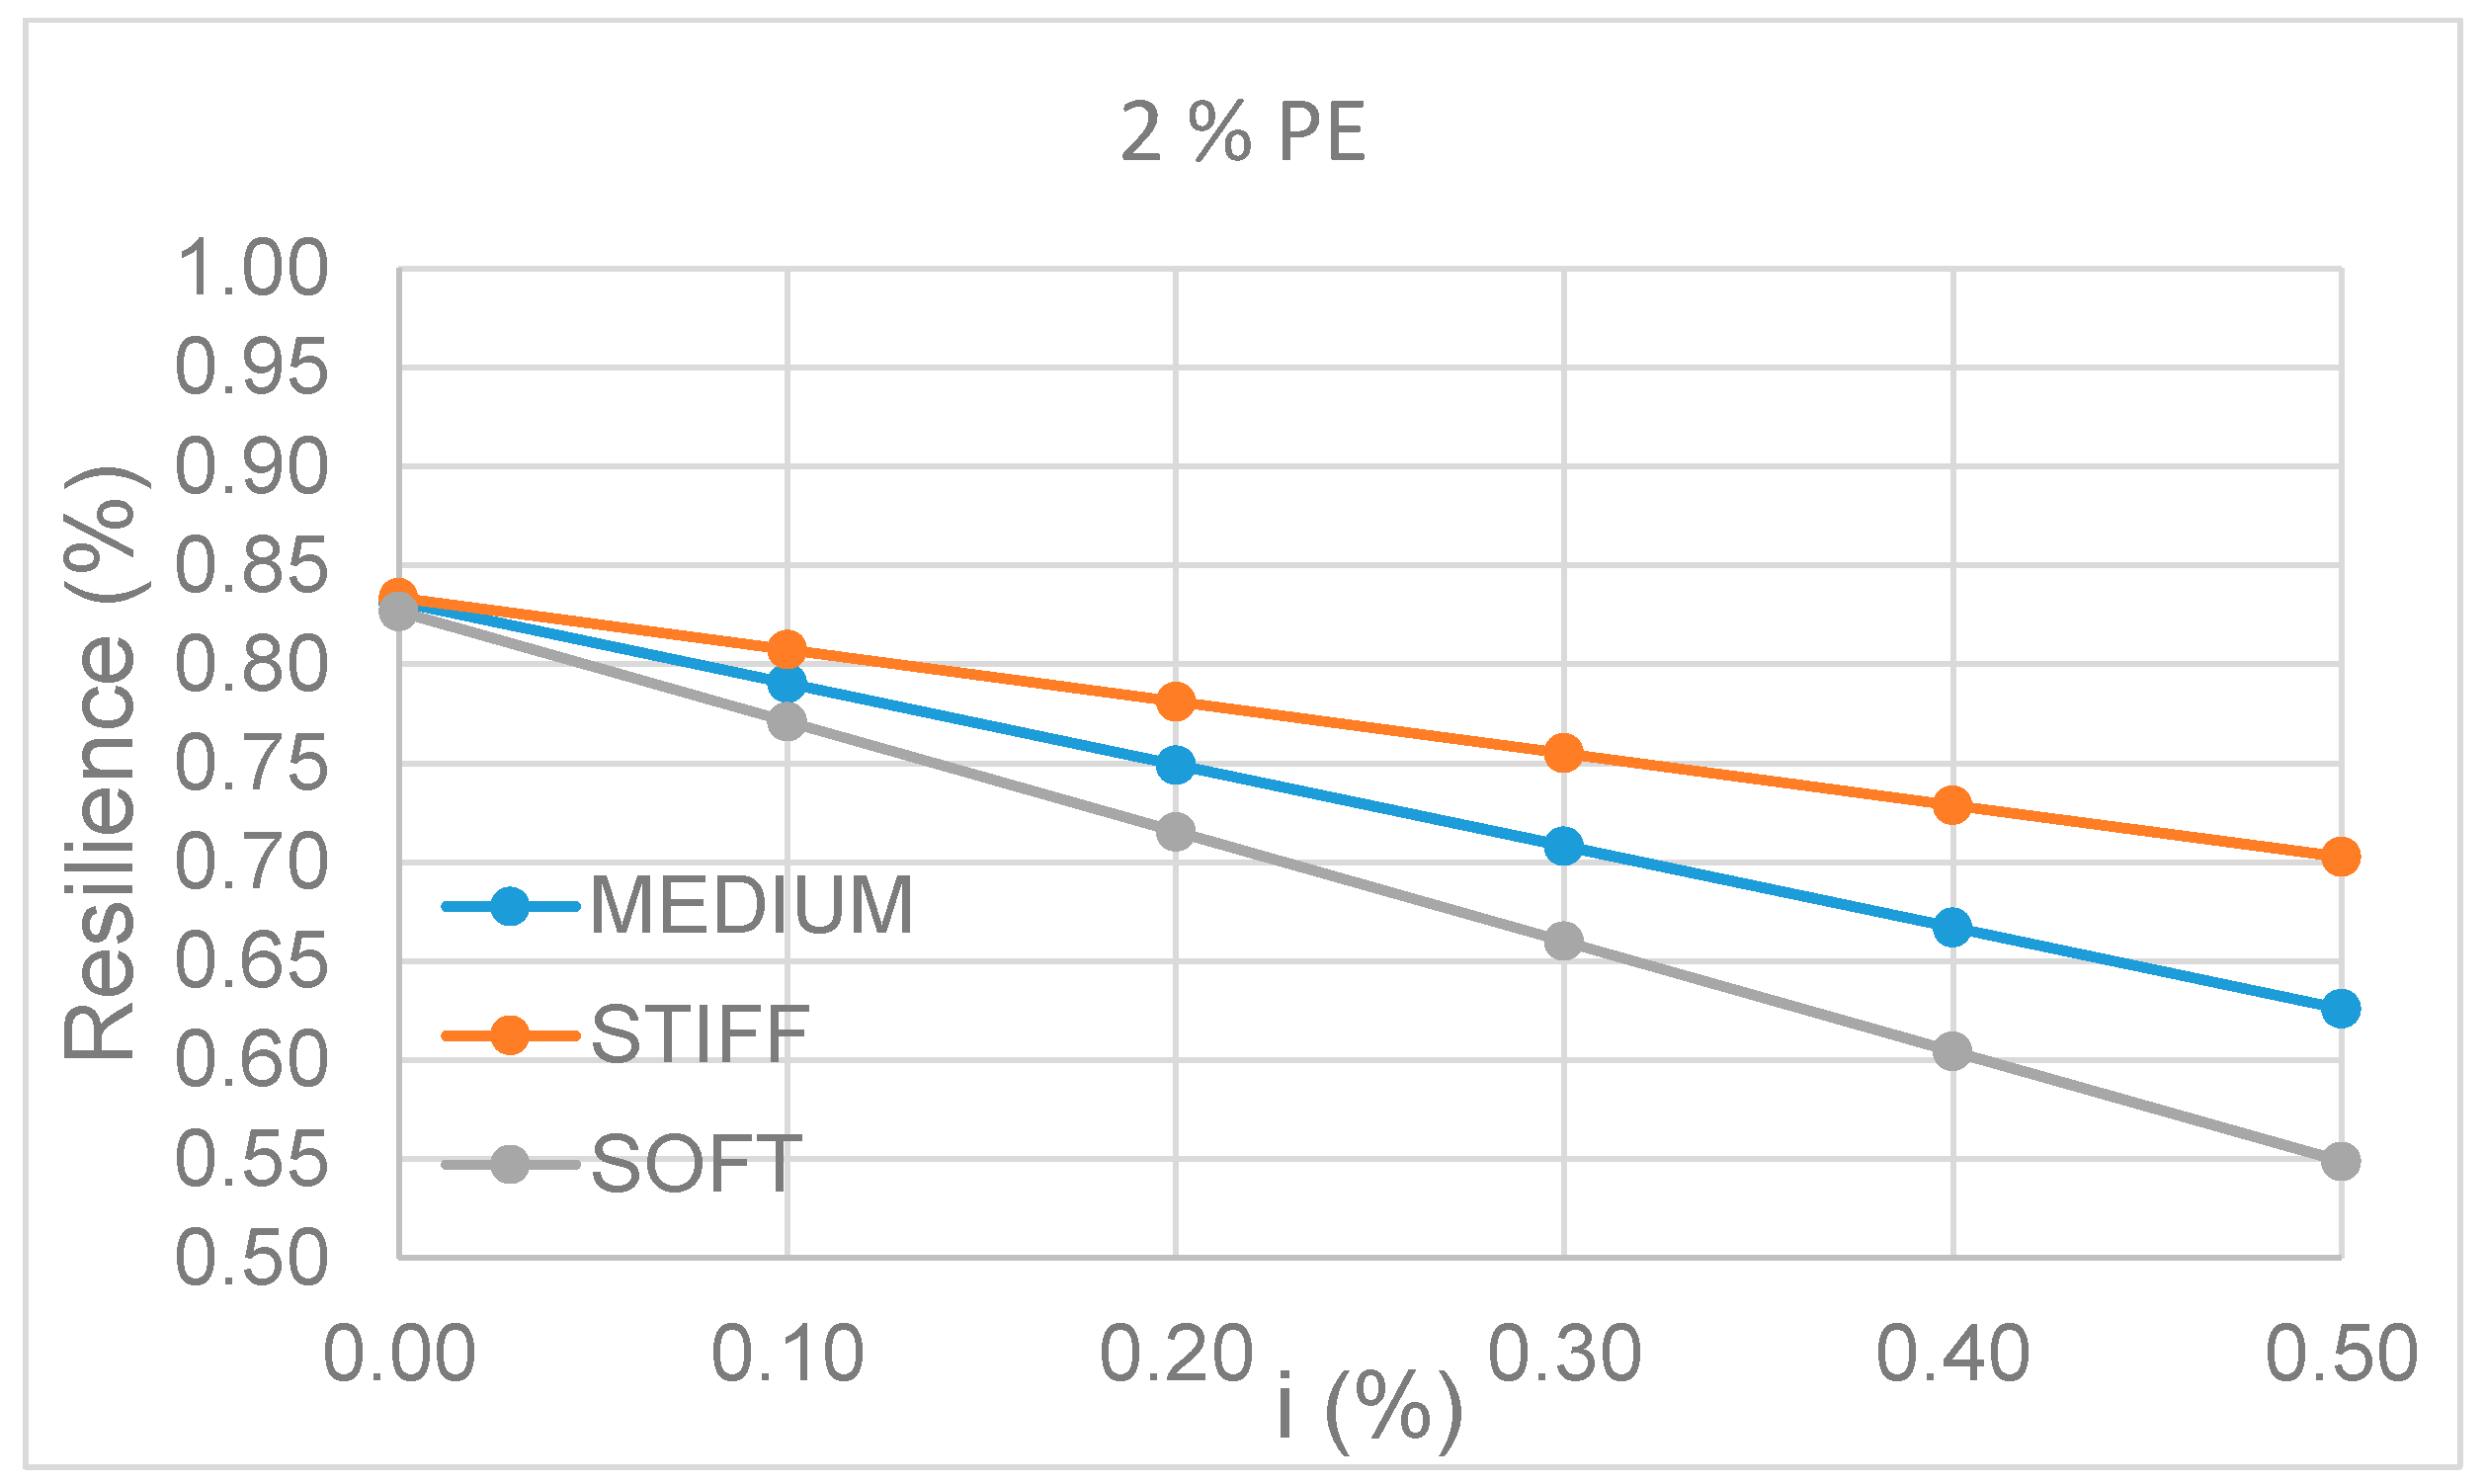
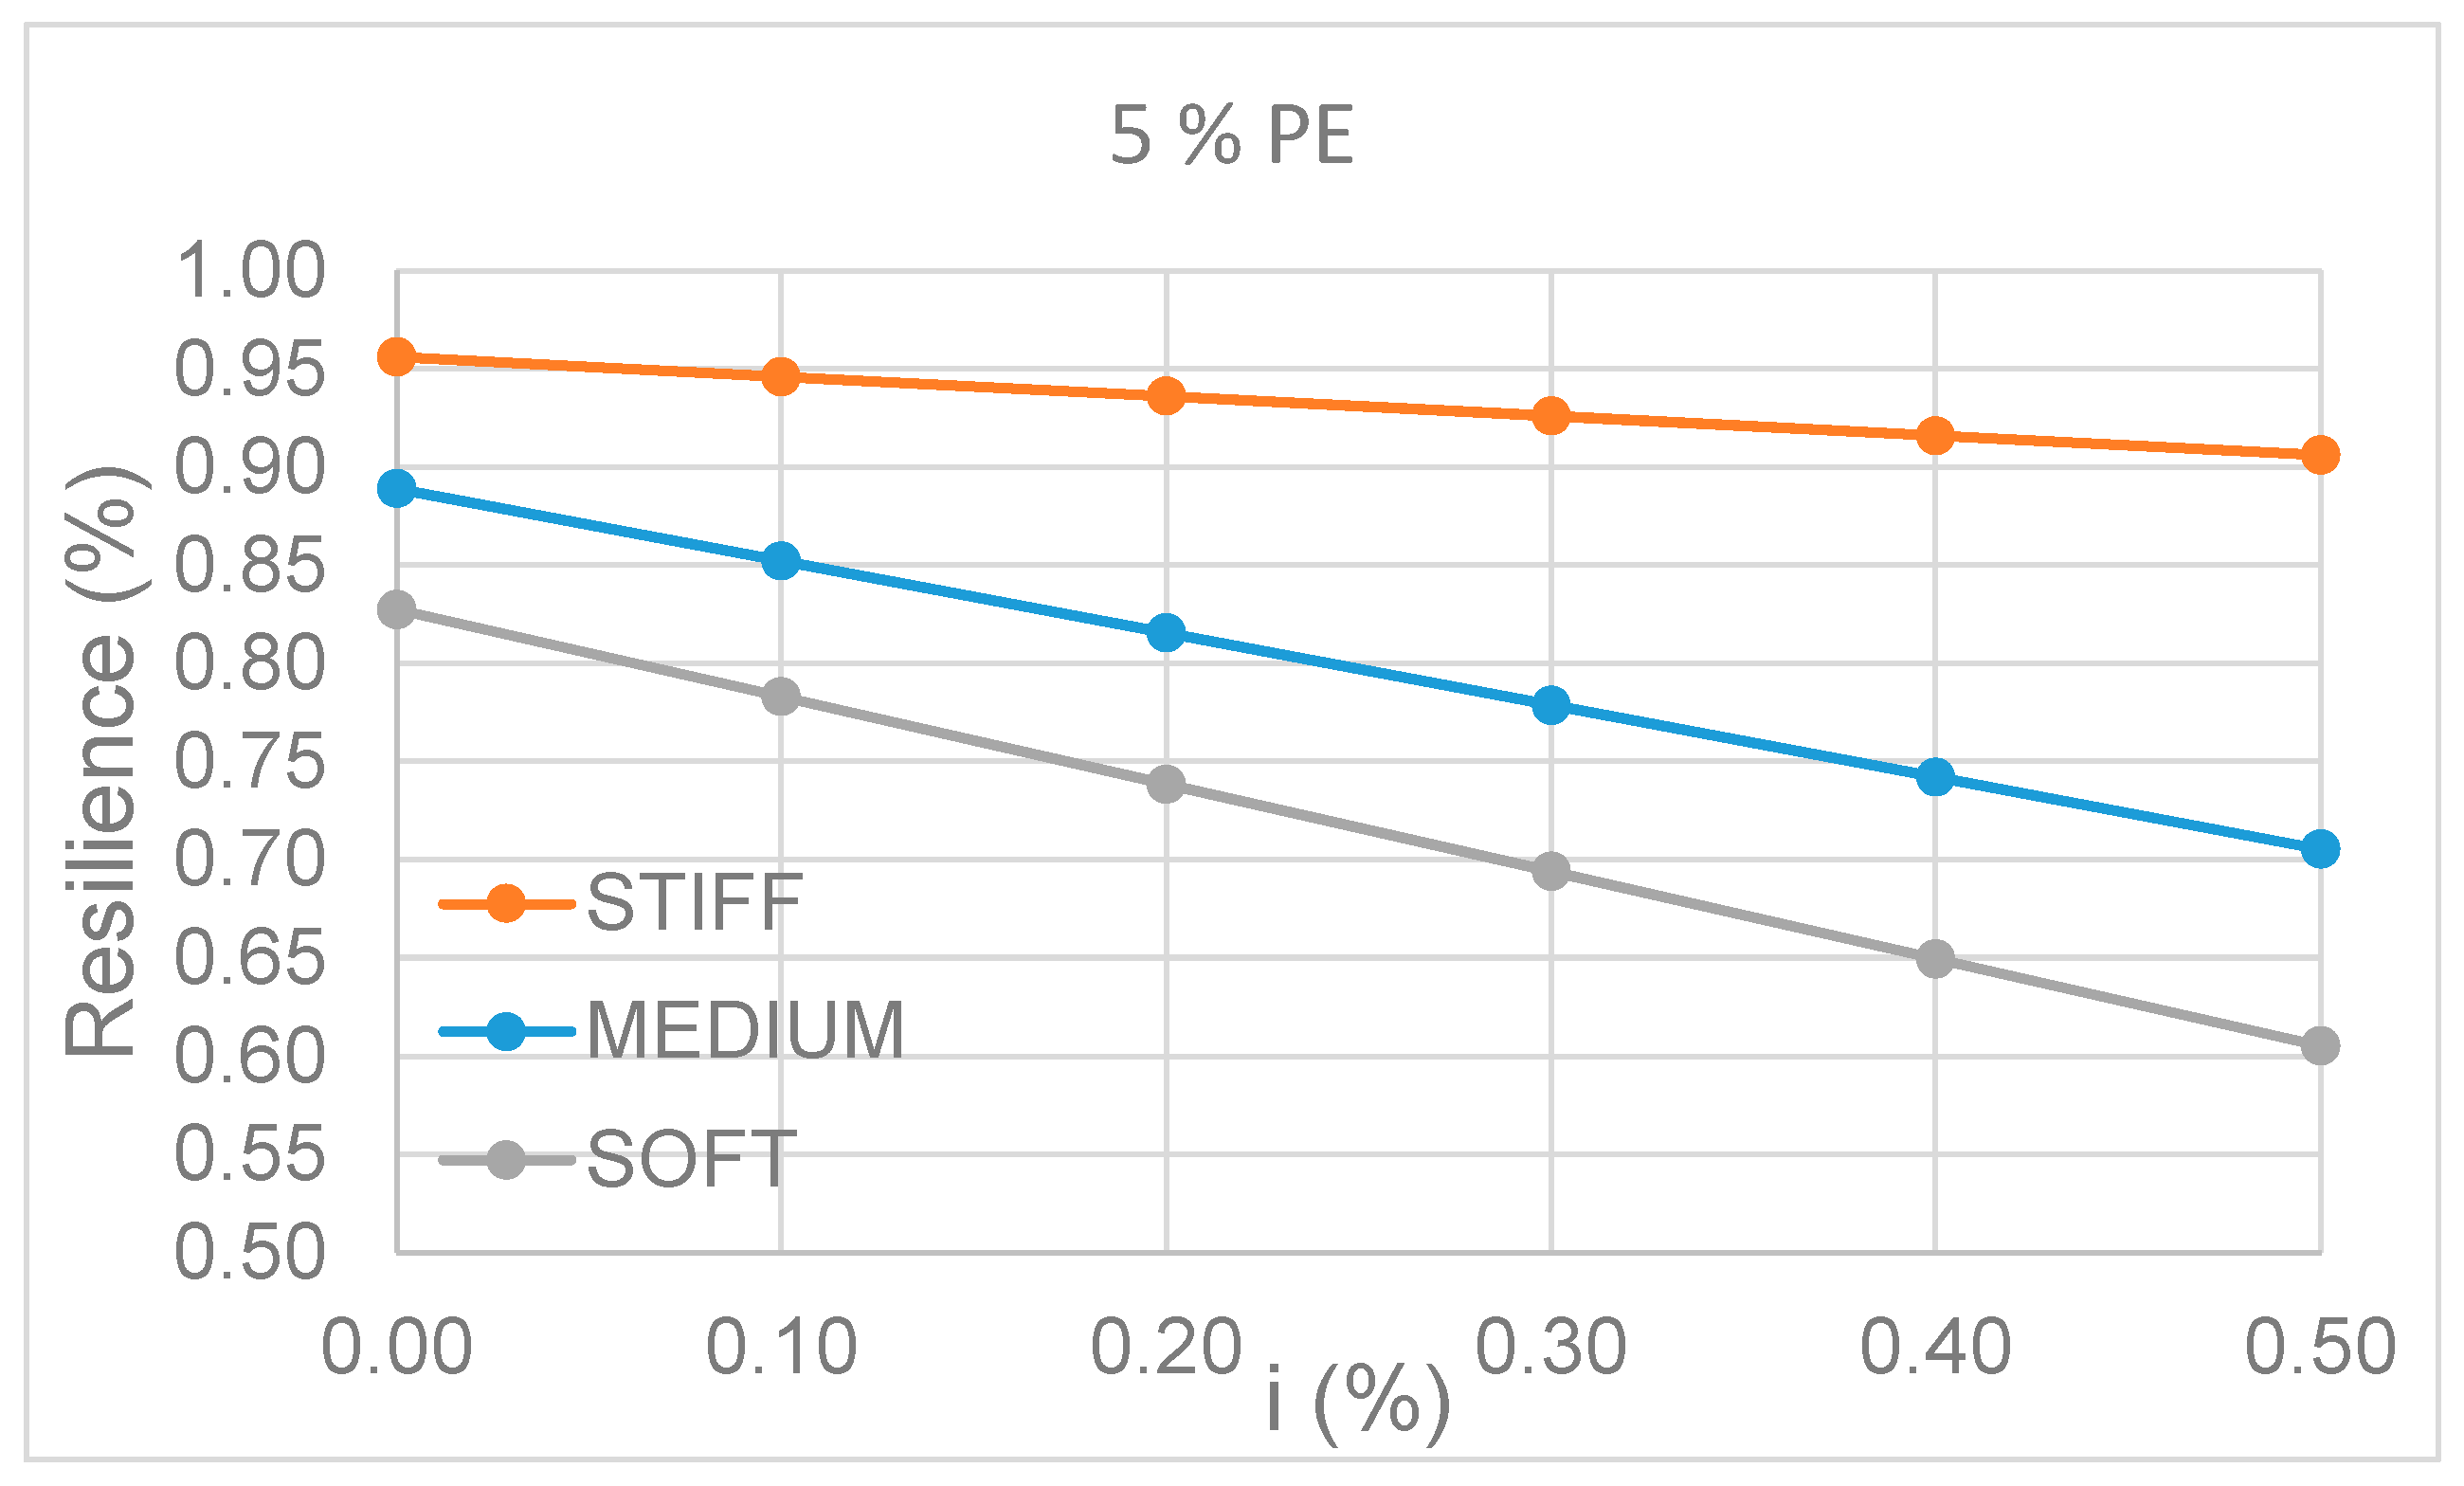
The results of the analyses in terms of resilience are shown in Figure 9, Figure 10 and Figure 11 that compare the three selected soil conditions in order to assess the role of soil deformability on the quantification of resilience of the whole system. As shown in Figure 8, the results are conditioned by the increased effects of RCRs mainly at high intensities when foundation repair is triggered and significant costs accumulate. This is particularly true when the calculation includes direct losses only (i = 0) and particularly at the 2%-in-50 year exceeding probability (Figure 9). It is worth noticing that indirect losses reduce the values of resilience that is significantly affected by soil deformability. However, this level of seismic hazard is extremely severe. When a 5%-in-50 year level is considered (Figure 10), it is possible to see (even more clearly) that considering SSI is detrimental to the benchmark bridge, with significant reductions of resilience occurring.
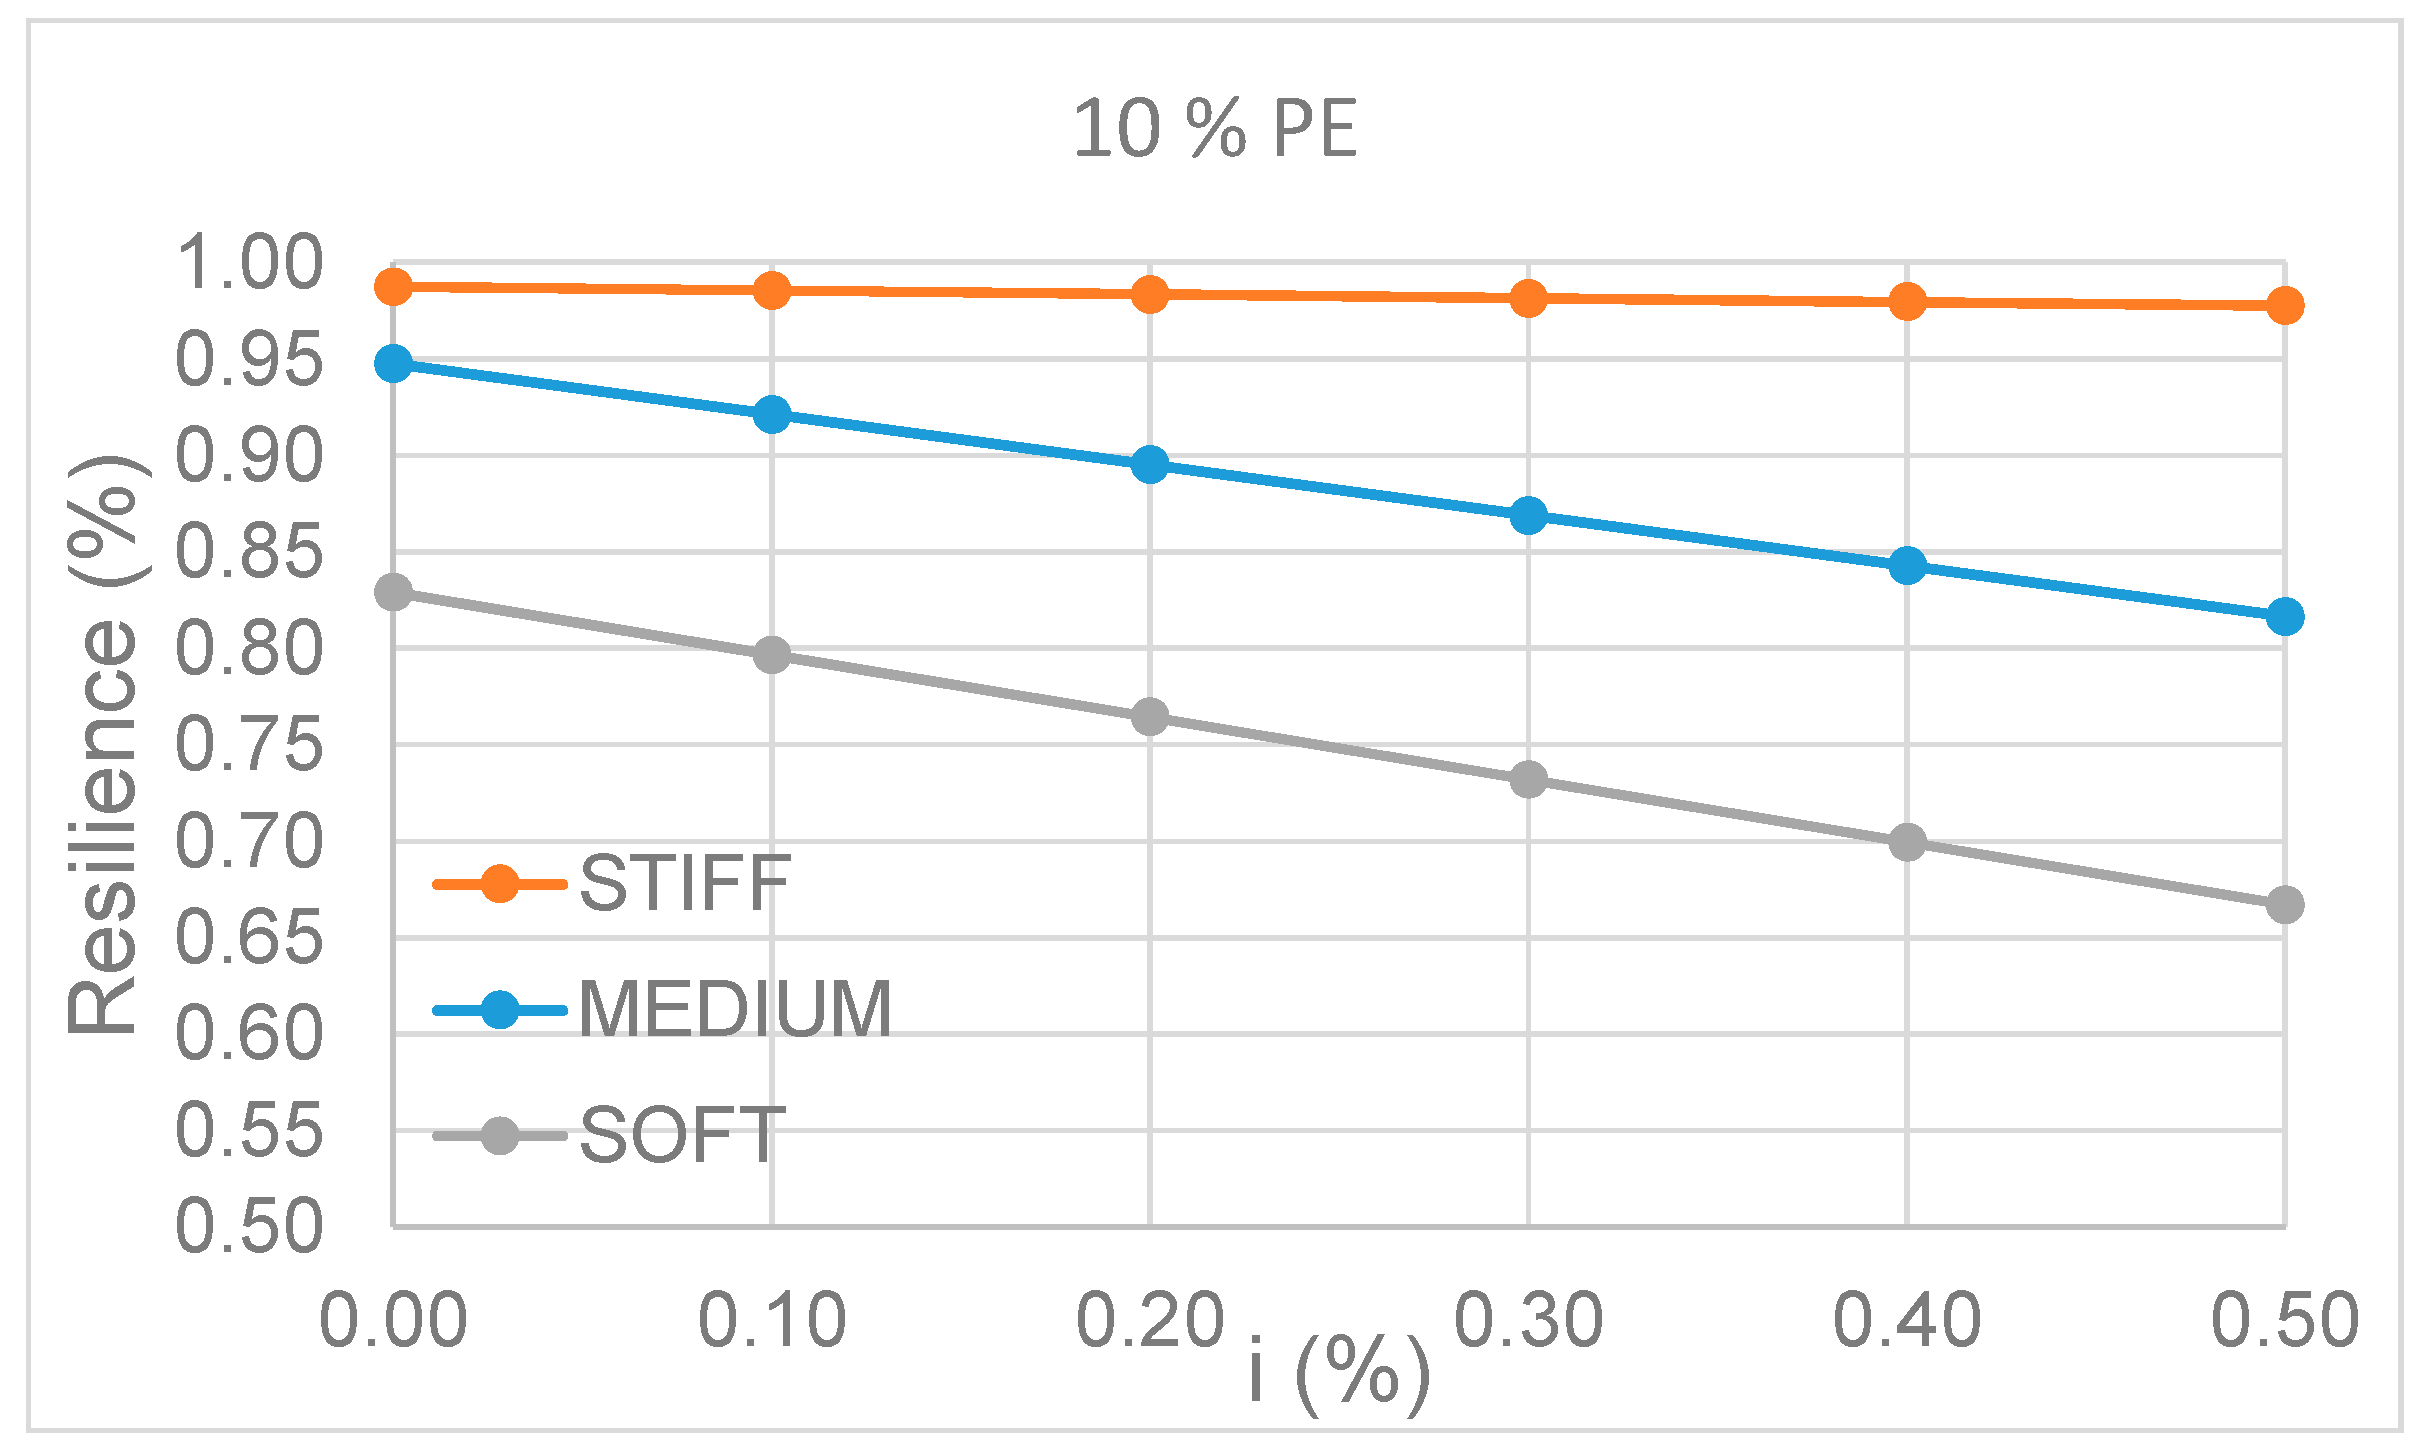
If the most frequent event (10%-in-50 year level) is considered (Figure 11), resilience is close to unity (100%, Table 4, Table 5 and Table 6) and fairly insensitive to indirect losses for STIFF condition. This means that neglecting the contribution of soil deformability may be too conservative and estimating SSI is necessary to assess realistically the values of resilience. Figure 11 also confirms the importance of soil deformability even for lower severity of seismic condition, for example noticing the significant difference in resilience between MEDIUM and SOFT soil conditions.
Table 4, Table 7 and Table 8 show the results for i = 0.5 and various value of β (0.8, 1 and 1.1), in order to assess the effects on resilience of various levels of recovery the pre-earthquake functionality. It is worth noting that only STIFF soil allows high values of resilience (almost 100%), while even with improvement procedures (β = 1.1), the weak soils show small values of resilience, confirming the significant role of SSI in the assessment of resilience.
Overall, the presented framework assesses the importance of SSI by proposing easier-to-read findings and for a wider range of stakeholders than those resulted by simply considering structural performance. In this regard, the results can be of interest for multi-sectorial actors, such as bridge owners, transportation authorities and public administrators, allowing interdisciplinary applications, such as the assessment of recovery techniques and solutions and/or new easy-to-use decision-making approaches.
7. Conclusions

Quantification of resilience for bridges is generally limited to behaviour of the superstructure without considering the role of SSI. This paper contributes to this issue by combining a coupled bridge-foundation-ground numerical model with the application of a resilience-based approach. The case study consists of a two-span ordinary standard bridge founded on three different soil scenarios ranging from a stiff to weak soil layer. The recovery model is based on the application of a power model that may quantify the recovered functionality after the event. The loss model is assessed by performing the PBEE framework to calculate the total repair costs and repair times. The paper demonstrates that soil deformability is detrimental and the weakest soil results in the smallest values of resilience by presenting readable findings for a wide range of different stakeholders, particularly for bridge decision-makers.

Funding

This research received no external funding.

Conflicts of Interest

The authors declare no conflict of interest.

References

  1. Andrić, J.M.; Lu, D.-G. Fuzzy methods for prediction of seismic resilience of bridges. Int. J. Disaster Risk Reduct. 2017, 22, 458–468. [Google Scholar] [CrossRef]
  2. Argyroudis, S.A.; Mitoulis, S.A.; Winter, M.G.; Kaynia, A.M. Fragility of transport assets exposed to multiple hazards: State-of-the-art review toward infrastructural resilience. Reliab. Eng. Syst. Saf. 2019, 191, 106567. [Google Scholar] [CrossRef]
  3. Argyroudis, S.A.; Mitoulis, S.A.; Hofer, L.; Zanini, M.A.; Tubaldi, E.; Frangopol, D.M. Resilience assessment framework for critical infrastructure in a multi-hazard environment: Case study on transport assets. Sci. Total Environ. 2020, 714, 136854. [Google Scholar] [CrossRef] [PubMed]
  4. Caverzan, A.; Solomos, G. Review on resilience in literature and standards for critical built-infrastructure. 2014. In European Commission–Joint Research Centre-Institute for the Protection and Security of the Citizen, Scientific and Technical Research Series; Publications Office of the European Union: Luxembourg, 2014; ISSN 1831-9424. ISBN 978-92-79-45055-6. [Google Scholar]
  5. Ranjbar, P.R.; Naderpour, H. Probabilistic evaluation of seismic resilience for typical vital buildings in terms of vulnerability curves. Structures 2020, 23, 314–323. [Google Scholar] [CrossRef]
  6. Decò, A.; Bocchini, P.; Frangopol, D.M. A probabilistic approach for the prediction of seismic resilience of bridges. Earthq. Eng. Struct. Dyn. 2013, 42, 1469–1487. [Google Scholar] [CrossRef]
  7. Saydam, D.; Frangopol, D.M.; Dong, Y. Assessment of risk using bridge element condition ratings. J. Infrastruct. Syst. 2013, 19, 252–265. [Google Scholar] [CrossRef]
  8. Meyer, V.; Becker, N.; Markantonis, V.; Schwarze, R.; van den Bergh, J.C.J.M.; Bouwer, L.M.; Bubeck, P.; Ciavola, P.; Genovese, E.; Green, C.; et al. Assessing the costs of natural hazards–state of the art and knowledge gaps. Nat. Hazards Earth Syst. Sci. 2013, 13, 1351–1373. [Google Scholar] [CrossRef]
  9. Forcellini, D. A new methodology to assess indirect losses in bridges subjected to multiple hazards. Innov. Infrastruct. Solut. 2019, 4, 1–9. [Google Scholar] [CrossRef]
  10. Hazus, M.H. Multi-Hazard Loss Estimation Methodology: Earthquake Model Hazus-MH MR5 Technical Manual; Federal Emergency Management Agency: Washington, DC, USA, 2011.
  11. Bocchini, P.; Frangopol, D.M. Restoration of bridge networks after an earthquake: Multicriteria intervention optimization. Earthq. Spectra 2012, 28, 427–455. [Google Scholar] [CrossRef]
  12. Werner, S.D.; Taylor, C.E.; Cho, S.; Lavoie, J.P.; Huyck, C.K.; Eitzel, C.; Chung, H.; Eguchi, R.T. REDARDS 2: Methodology and Software for Seismic Risk Analysis of Highway Systems; Report No. MCEER-06-SP08, MCEER; University of Buffalo: Buffalo, NY, USA, 2006. [Google Scholar]
  13. NIST-CORE. Center for Risk-Based Community Resilience Planning. 2015. Available online: https//resilience.colostate.edu/index.shtml (accessed on 22 October 2020).
  14. Gidaris, I.; Padgett, J.E.; Barbosa, A.R.; Chen, S.; Cox, D.; Webb, B.; Cerato, A. Multiple-hazard fragility and restoration models of highway bridges for regional risk and resilience assessment in the United States: State-of-the-art review. J. Struct. Eng. 2017, 143, 04016188. [Google Scholar] [CrossRef]
  15. Echevarria, A.; Zaghi, A.E.; Christenson, R.; Accorsi, M. CFFT bridge columns for multi hazard resilience. J. Struct. Eng. 2016, 142–151. [Google Scholar]
  16. Zhou, Y.; Banerjee, S.; Shinozuka, M. Socio-economic effect of seismic retrofit of bridges for highway transportation networks: A pilot study. Struct. Infrastruct. Eng. 2010, 6, 145–157. [Google Scholar] [CrossRef]
  17. Chang, S.E.; Shinozuka, M. Measuring improvements in the disaster resilience of communities. Earthq. Spectra 2004, 20, 739–755. [Google Scholar] [CrossRef]
  18. Chang, S.E.; Svekla, W.D.; Shinozuka, M. Linking infrastructure and urban economy: Simulation of water-disruption impacts in earthquakes. Environ. Plan. B Plan. Des. 2002, 29, 281–302. [Google Scholar] [CrossRef]
  19. Miles, S.B.; Chang, S.E. ResilUS: A community based disaster resilience model. Cartogr. Geogr. Inf. Sci. 2011, 38, 36–51. [Google Scholar] [CrossRef]
  20. Minaie, E.; Moon, F. Practical and simplified approach for quantifying bridge resilience. J. Infrastruct. Syst. 2017, 23, 04017016. [Google Scholar] [CrossRef]
  21. Chandrasekaran, S.; Banerjee, S. Retrofit optimization for resilience enhancement of bridges under multihazard scenario. J. Struct. Eng. 2016, 142, C4015012. [Google Scholar] [CrossRef]
  22. Dong, Y.; Frangopol, D.M. Probabilistic time-dependent multihazard life-cycle assessment and resilience of bridges considering climate change. J. Perform. Constr. Facil. 2016, 30, 04016034. [Google Scholar] [CrossRef]
  23. Forcellini, D. Cost assessment of isolation technique applied to a benchmark bridge with soil structure interaction. Bull. Earthq. Eng. 2016, 15, 51–69. [Google Scholar] [CrossRef]
  24. Forcellini, D. Seismic resilience of isolated bridge configurations with soil–structure interaction. Innov. Infrastruct. Solut. 2017, 2, 2. [Google Scholar] [CrossRef]
  25. Caltrans Seismic Design Criteria Version 1.3; California Department of Transportation: Sacramento, CA, USA, 2003.
  26. Mazzoni, S.; McKenna, F.; Scott, M.H.; Fenves, G.L. Open System for Earthquake Engineering Simulation, User Command-Language Manual; OpenSees Version 2.0; Pacific Earthquake Engineering Research Center, University of California: Berkeley, CA, USA, 2009; Available online: http://opensees.berkeley.edu/OpenSees/manuals/usermanual (accessed on 22 October 2020).
  27. Lu, J.; Elgamal, A.; Yang, Z. OpenSeesPL: 3D Lateral Pile-Ground Interaction, User Manual, Beta 1.0. (2011). Available online: http://soilquake.net/openseespl/ (accessed on 22 October 2020).
  28. Forcellini, D. Seismic assessment of a benchmark based isolated ordinary building with soil structure interaction. Bull. Earthq. Eng. 2017, 16, 2021–2042. [Google Scholar] [CrossRef]
  29. Forcellini, D. Numerical simulations of liquefaction on an ordinary building during Italian (20 May 2012) earthquake. Bull. Earthq. Eng. 2019, 17, 4797–4823. [Google Scholar] [CrossRef]
  30. Forcellini, D. Soil-structure interaction analyses of shallow-founded structures on a potential-liquefiable soil deposit. Soil Dyn. Earthq. Eng. 2020, 133, 106108. [Google Scholar] [CrossRef]
  31. Lysmer, J.; Kuhlemeyer, R.L. Finite dynamic model for infinite media. J. Eng. Mech. Div. 1969, 95, 859–878. [Google Scholar]
  32. Yang, Z.; Elgamal, A.; Parra, E. A computational model for cyclic mobility and associated shear deformation. J. Geotech. Geoenviron. Eng. 2003, 129, 1119–1127. [Google Scholar] [CrossRef]
  33. Zelaschi, C.; De Angelis, G.; Giardi, F.; Forcellini, D.; Monteiro, R.; Papadrakakis, M. Performance based earthquake engineering approach applied to bridges in a road network. In Proceedings of the 5th International Conference on Computational Methods in Structural Dynamics and Earthquake Engineering Methods in Structural Dynamics and Earthquake Engineering (ECCOMAS), Crete Island, Greece, 25–27 May 2015; pp. 900–910. [Google Scholar]
  34. Mackie, K.; Wong, J.-M.; Stojadinovic, B. Bridge damage and loss scenarios calibrated by schematic design and cost estimation of repairs. Earthq. Spectra 2011, 27, 1127–1145. [Google Scholar] [CrossRef]
  35. Mackie, K.; Lu, J.; Elgamal, A. Performance-based earthquake assessment of bridge systems including ground-foundation interaction. Soil Dyn. Earthq. Eng. 2012, 42, 184–196. [Google Scholar] [CrossRef]
  36. Hackl, J.; Adey, B.T.; Lethanh, N. Determination of near-optimal restoration programs for transportation networks following natural hazard events using simulated annealing. Comput. Aided Civ. Infrastruct. Eng. 2018, 33, 618–637. [Google Scholar] [CrossRef]
Figure 1. Finite Element Model.
Infrastructures 05 00090 g001
Figure 2. Benchmark bridge.
Infrastructures 05 00090 g002
Figure 3. Backbone curves.
Infrastructures 05 00090 g003
Figure 4. Moment-curvature relationship of the column.
Infrastructures 05 00090 g004
Figure 5. Vertical plan.
Infrastructures 05 00090 g005
Figure 6. Proposed framework: (1) calculated by applying the performance-based earthquake engineering (PBEE) methodology; (2): recovery functions proposed in the present paper (parameters (a): β = 1; α =1; (b): β = 0.7; α = 0.85; (c): β = 0.5; α = 0.75).
Infrastructures 05 00090 g006
Figure 7. RT for the selected soils.
Infrastructures 05 00090 g007
Figure 8. Repair cost ratio (RCR) for the selected soils.
Infrastructures 05 00090 g008
Figure 9. The 2% probability of exceedance in 50% (α = 1, β =1).
Infrastructures 05 00090 g009
Figure 10. The 5% probability of exceedance in 50% (α = 1, β =1).
Infrastructures 05 00090 g010
Figure 11. The 10% probability of exceedance in 50% (α = 1, β =1).
Infrastructures 05 00090 g011
Table 1. Pressure-Independent MultiYield (PIMY) model: soil parameters.
StiffMediumSoft
Mass density (kN/m3)181513
Shear Modulus (MPa)1506013
Bulk Modulus (MPa)75030065
Cohesion (kPa)753718
Shear wave velocity (cm/s)430200100
Table 2. Repair time (RT) (CWD: crew working days).
Probability of ExceedanceStiffMediumSoft
50%4.052.464.8
10%20.073.589.0
2%52.282.3111.1
Table 3. RCR (%).
Table 3. RCR (%).
Probability of ExceedanceStiffMediumSoft
50%2.510.534.2
10%8.822.234.5
2%33.333.734.7
Table 4. Resilience i = 0.5, α = 1, β = 1.
Probability of ExceedanceStiffMediumSoft
50%0.9780.8170.667
10%0.9060.7050.605
2%0.7030.6260.549
Table 5. Resilience i = 0.3, α = 1, β = 1.
Probability of ExceedanceStiffMediumSoft
50%0.9820.8690.732
10%0.9260.7790.694
2%0.7550.7080.660
Table 6. Resilience i = 0.1, α = 1, β = 1.
Probability of ExceedanceStiffMediumSoft
50%0.9860.9210.797
10%0.9460.8520.783
2%0.8070.7900.771
Table 7. Resilience i = 0.5, α = 1, β = 0.8.
Probability of ExceedanceStiffMediumSoft
50%0.8780.7170.567
10%0.8060.6050.505
2%0.6030.5260.449
Table 8. Resilience i = 0.5, α = 1, β = 1.1.
Probability of ExceedanceStiffMediumSoft
50%0.9990.8670.717
10%0.9560.7550.655
2%0.7530.6760.599
Publisher’s Note: MDPI stays neutral with regard to jurisdictional claims in published maps and institutional affiliations.