


Abstract
The use of reclaimed asphalt pavement (RAP) has been increasing due to its economic benefits and environmental sustainability. Adding RAP materials introduces age-hardened binder, which tends to increase the rutting resistance but decrease cracking resistance. This study aims to evaluate the effects of various RAP contents and binder additives on asphalt performance using the Hamburg wheel tracking test, the Semi-Circular Bending-Illinois Flexibility Index Test (SCB-IFIT) and the Indirect Tensile Asphalt Cracking Test (IDEAL-CT). Asphalt mixtures with RAP contents of 0%, 20%, 30%, 40%, and 50% were prepared using two different binder additives of Zero-M polymer cool mix asphalt additive (PCMA) and Anova vegetable oil-based rejuvenator. Based on the Hamburg test results, the rutting resistance significantly increased by adding 20% RAP but did not increase the rutting resistance any further when RAP increased from 20% to 50%. However, the increase in RAP content exhibited a negative impact on cracking resistance by lowering Flexibility Index (FI) based on the SCB-IF test by 50% or more and CT Index (CTindex) based on IDEAL-CT test by 60% or more. For each RAP content, asphalt mixtures incorporating two different additives were tested: (1) Zero-M additive at a dosage rate of 10% of the total binder with mixing/compaction temperature of 110 °C and (2) Anova additive at a dosage rate of 5% of the RAP binder with mixing/compaction temperature of 135 °C. Compared to the control specimens without additive, asphalt mixtures with Zero-M additive increased FI and CTindex by 50% except CTindex of 30% RAP mix. Zero-M additive increased the rut depth from 3 mm to 10 mm for 20% and 30% RAP mixes but, for 40% and 50% RAP contents, the rutting was less than 5 mm after 20,000 repetitions. Anova rejuvenator did not increase FI and CTindex of 30% and 50% RAP mixes but increased FI and CTindex by 50% for 40% RAP mix. Anova additive did not increase the rutting of the control mix. The SCB-IFIT test results exhibited an average coefficient of variation (COV) of 0.25 whereas the IDEAL-CT test results had a COV of 0.20. The IDEAL-CT test, with its simpler preparation process and more consistent results, is recommended as the preferred test procedure over the SCB-IFIT test.
1. Introduction
As part of a global effort to more effectively use the earth’s resources, the transportation industry has come up with an innovative solution to recycle aged existing asphalt pavements. In recent years, the use of reclaimed asphalt pavement (RAP) materials in new pavement construction has been increasing. In addition to being a more effective use of resources, using RAP in new pavement construction has many other advantages. First, the use of RAP materials significantly reduces the carbon footprint of the project. Using 100% RAP has been found to reduce CO2 emissions by as much as 35% compared to those of pavements using virgin materials [1]. In the US, by utilizing RAP materials, total CO2 emissions were reduced by 2.7 million metric tons in one year [2].
Another significant advantage of using RAP materials is the cost savings. When RAP is used in new construction, the contractor can significantly reduce the amount of binder and virgin aggregate needed. NAPA’s 2022 Industry Survey showed a cost saving of $4.6 billion in just binder and aggregate alone. In addition, $5.7 billion in gate fees for disposing of materials into landfills was saved.
However, the main limitation of using RAP materials is that it lowers cracking resistance. Because RAP materials include binder that has been age-hardened, the asphalt mixtures with RAP materials become stiffer and more prone to cracking, particularly at freezing temperatures with frequent freeze–thaw cycles. Another problem with using RAP materials is the variability in aggregate gradation. Even after the old pavement has been milled, the aged binder will still be holding crushed aggregates together. If not adequately fractionated, RAP materials could negatively affect the gradation requirements.
Recycling additives can enhance asphalt mixtures with high RAP content in terms of cracking resistance while not adversely impacting the asphalt mixtures’ permanent deformation [3]. First objective of this study is to evaluate the effects of various RAP contents and recycling additives on asphalt performance using the Hamburg wheel tracking test, the Semi-Circular Bending-Illinois Flexibility Index Test (SCB-IFIT) and the Indirect Tensile Asphalt Cracking Test (IDEAL-CT). The second objective of this study is to compare the latter two cracking tests (SCB-IFIT and IDEAL-CT) that are uniquely different in testing protocols and evaluate the consistency and correlation between their test results.
2. Background
While efforts to reuse old asphalt pavement materials within roads did not start until 1974, the recycling of pavement can be traced back to as early as 1915 [4]. Led by the Interstate 15 project in Nevada in 1974, the Federal Highway Administration (FHWA) began sponsoring various RAP projects. Between 1976 and 1982, over 40 states implemented roadway projects involving the use of reclaimed asphalt. Since 1982, a major emphasis has been placed on implementing reclaimed asphalt back into our pavement. According to the National Asphalt Pavement Association (NAPA), more than 93% of reclaimed material from old asphalt pavements is being reused in new pavement construction. In NAPA’s asphalt pavement industry survey, NAPA reported 98.1 million tons of RAP materials were used in 2022, which is a 75.2% increase from the amount used in 2009 [2]. However, currently, AASHTO has no uniform standard practice for assessing the component materials, their proportions, or their combination in binder blends or mixtures with high RAP mixtures [5].
Throughout many studies on reclaimed asphalt pavement materials, the primary performance issue in new pavements with RAP materials has been the decreased cracking resistance. A study performed on the fatigue cracking performance of asphalt mixtures with RAP materials showed that as the percentage of RAP in the mix increased, the pavement became more prone to cracking and had an increased cumulative rate of fatigue damage [6]. The study also concluded that using a RAP concentration of over 30% could damage the pavement with excessive non-load-associated transverse cracking in colder climates. In addition, increasing the quantity of RAP materials decreased the fracture energy of the mix [7].
With asphalt binder being a naturally occurring organic hydrocarbon, it is susceptible to chemical oxidation, which causes changes in the asphalt’s viscoelastic and adhesive properties over time [8]. Combining the effects of oxidation with continuous loading and exposure to frequent freeze–thaw cycles, asphalt pavement over time experiences age-hardening of its binder. While the addition of aged binder is not favorable for cracking resistance, it does have some positive impacts on the new pavement. By increasing the asphalt binder replacement by 1% with a RAP binder, the aging rate of the new pavement will slightly decrease [8]. The study suggests that while having low flexibility, aged binder is less likely to be aged further, decreasing the overall aging of the virgin binder blended with a RAP binder. As well as improving the aging of the new pavement, the increased stiffness of the aged binder is generally associated with greater resistance to rutting.
To examine asphalt pavements’ resistance to cracking, many different tests and performance indicators have been developed. The SCB-IFIT Test is a simple test performed at room temperature that yields a load-versus-displacement curve of a semi-circular asphalt pavement sample. With the fracture energy and post-peak slope obtained from the test data, a parameter known as the flexibility index (FI) is calculated. The flexibility index is a parameter that indicates cracking resistance, with an FI greater than or equal to 8 typically indicating good performance [9]. Aged asphalt samples had larger post-peak slopes, indicating a more rapid and brittle crack growth than non-aged samples [8]. However, the SCB-IFIT test and FI parameter can sometimes yield mixed results, giving the FI value a high coefficient of variation of 25.8% [10].
Another room temperature test used for testing crack resistance is the IDEAL-CT test. Like the I-FIT test, the IDEAL-CT test yields a load-versus-displacement curve, fracture energy, and a calculated performance indicator known as the cracking tolerance index (CT index). The main difference in the IDEAL-CT test is that it records crack propagation data using a full cylindrical asphalt sample instead of cutting into two semi-circular samples. A recent study on the IDEAL-CT test’s sensitivity to RAP materials showed a significant reduction in the CT index for asphalt mixtures using just 20% RAP materials compared to those without [6].
Past studies reported that the increase in RAP content within a pavement led to an increase in rutting resistance but a decrease in cracking resistance. The flexibility index values of mixtures with a foaming additive decreased from 8.4, 6.7, and 4.4 as RAP content increased from 29%, 39%, and 48% RAP, respectively [11]. Based on the asphalt pavement analyzer (APA) wheel tracking test, both 30% RAP to HMA and 30%, 40%, and 50% RAP to WMA decreased the rut depth. RAP materials can increase the rutting resistance of both HMA and WMA but at a higher level for WMA. For balanced and durable high RAP mixtures, it was recommended that higher effective asphalt content, softer virgin binder, recycling additive and lower effective binder from RAP should be considered [5].
The first motivation for our study is to identify the effect of RAP materials up to 50% on the rutting and cracking performance in the laboratory. The second motivation is to determine the effects of rejuvenator and warm mix asphalt (WMA) additive on the high RAP mixes and how they impact the characteristics of high RAP mixes. The third motivation is to compare two common testing protocols, SCB-IFIT and IDEAL-CT, and recommend which protocol is appropriate for evaluating the impacts of recycling and WMA additives on the cracking potential of high RAP mixes.
3. Materials and Mix Design
3.1. Asphalt Mixtures
In this study, a fixed dosage of 5% asphalt of binder grade PG 58-28S was used at 160 °C. This 5% total asphalt includes virgin asphalt, binder replacements (Zero-M or Anova), and aged asphalt from the RAP materials. Aggregates and RAP materials were heated to 110 °C for the Zero-M mix and 135 °C for the control HMA and Anova mix. After mixing, asphalt mixtures were conditioned to 110 °C for the Zero-M mix and 135 °C for the control HMA and Anova mix for two hours in the oven and compacted for 50 gyrations.
3.2. Reclaimed Asphalt Pavement
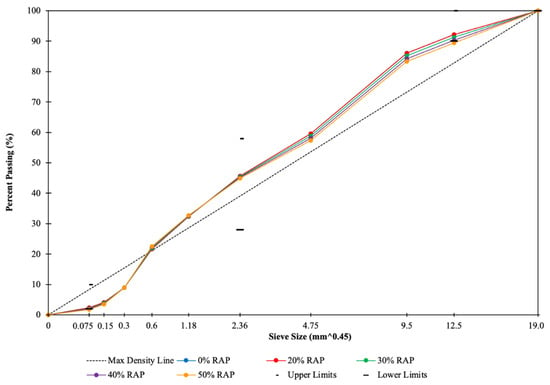
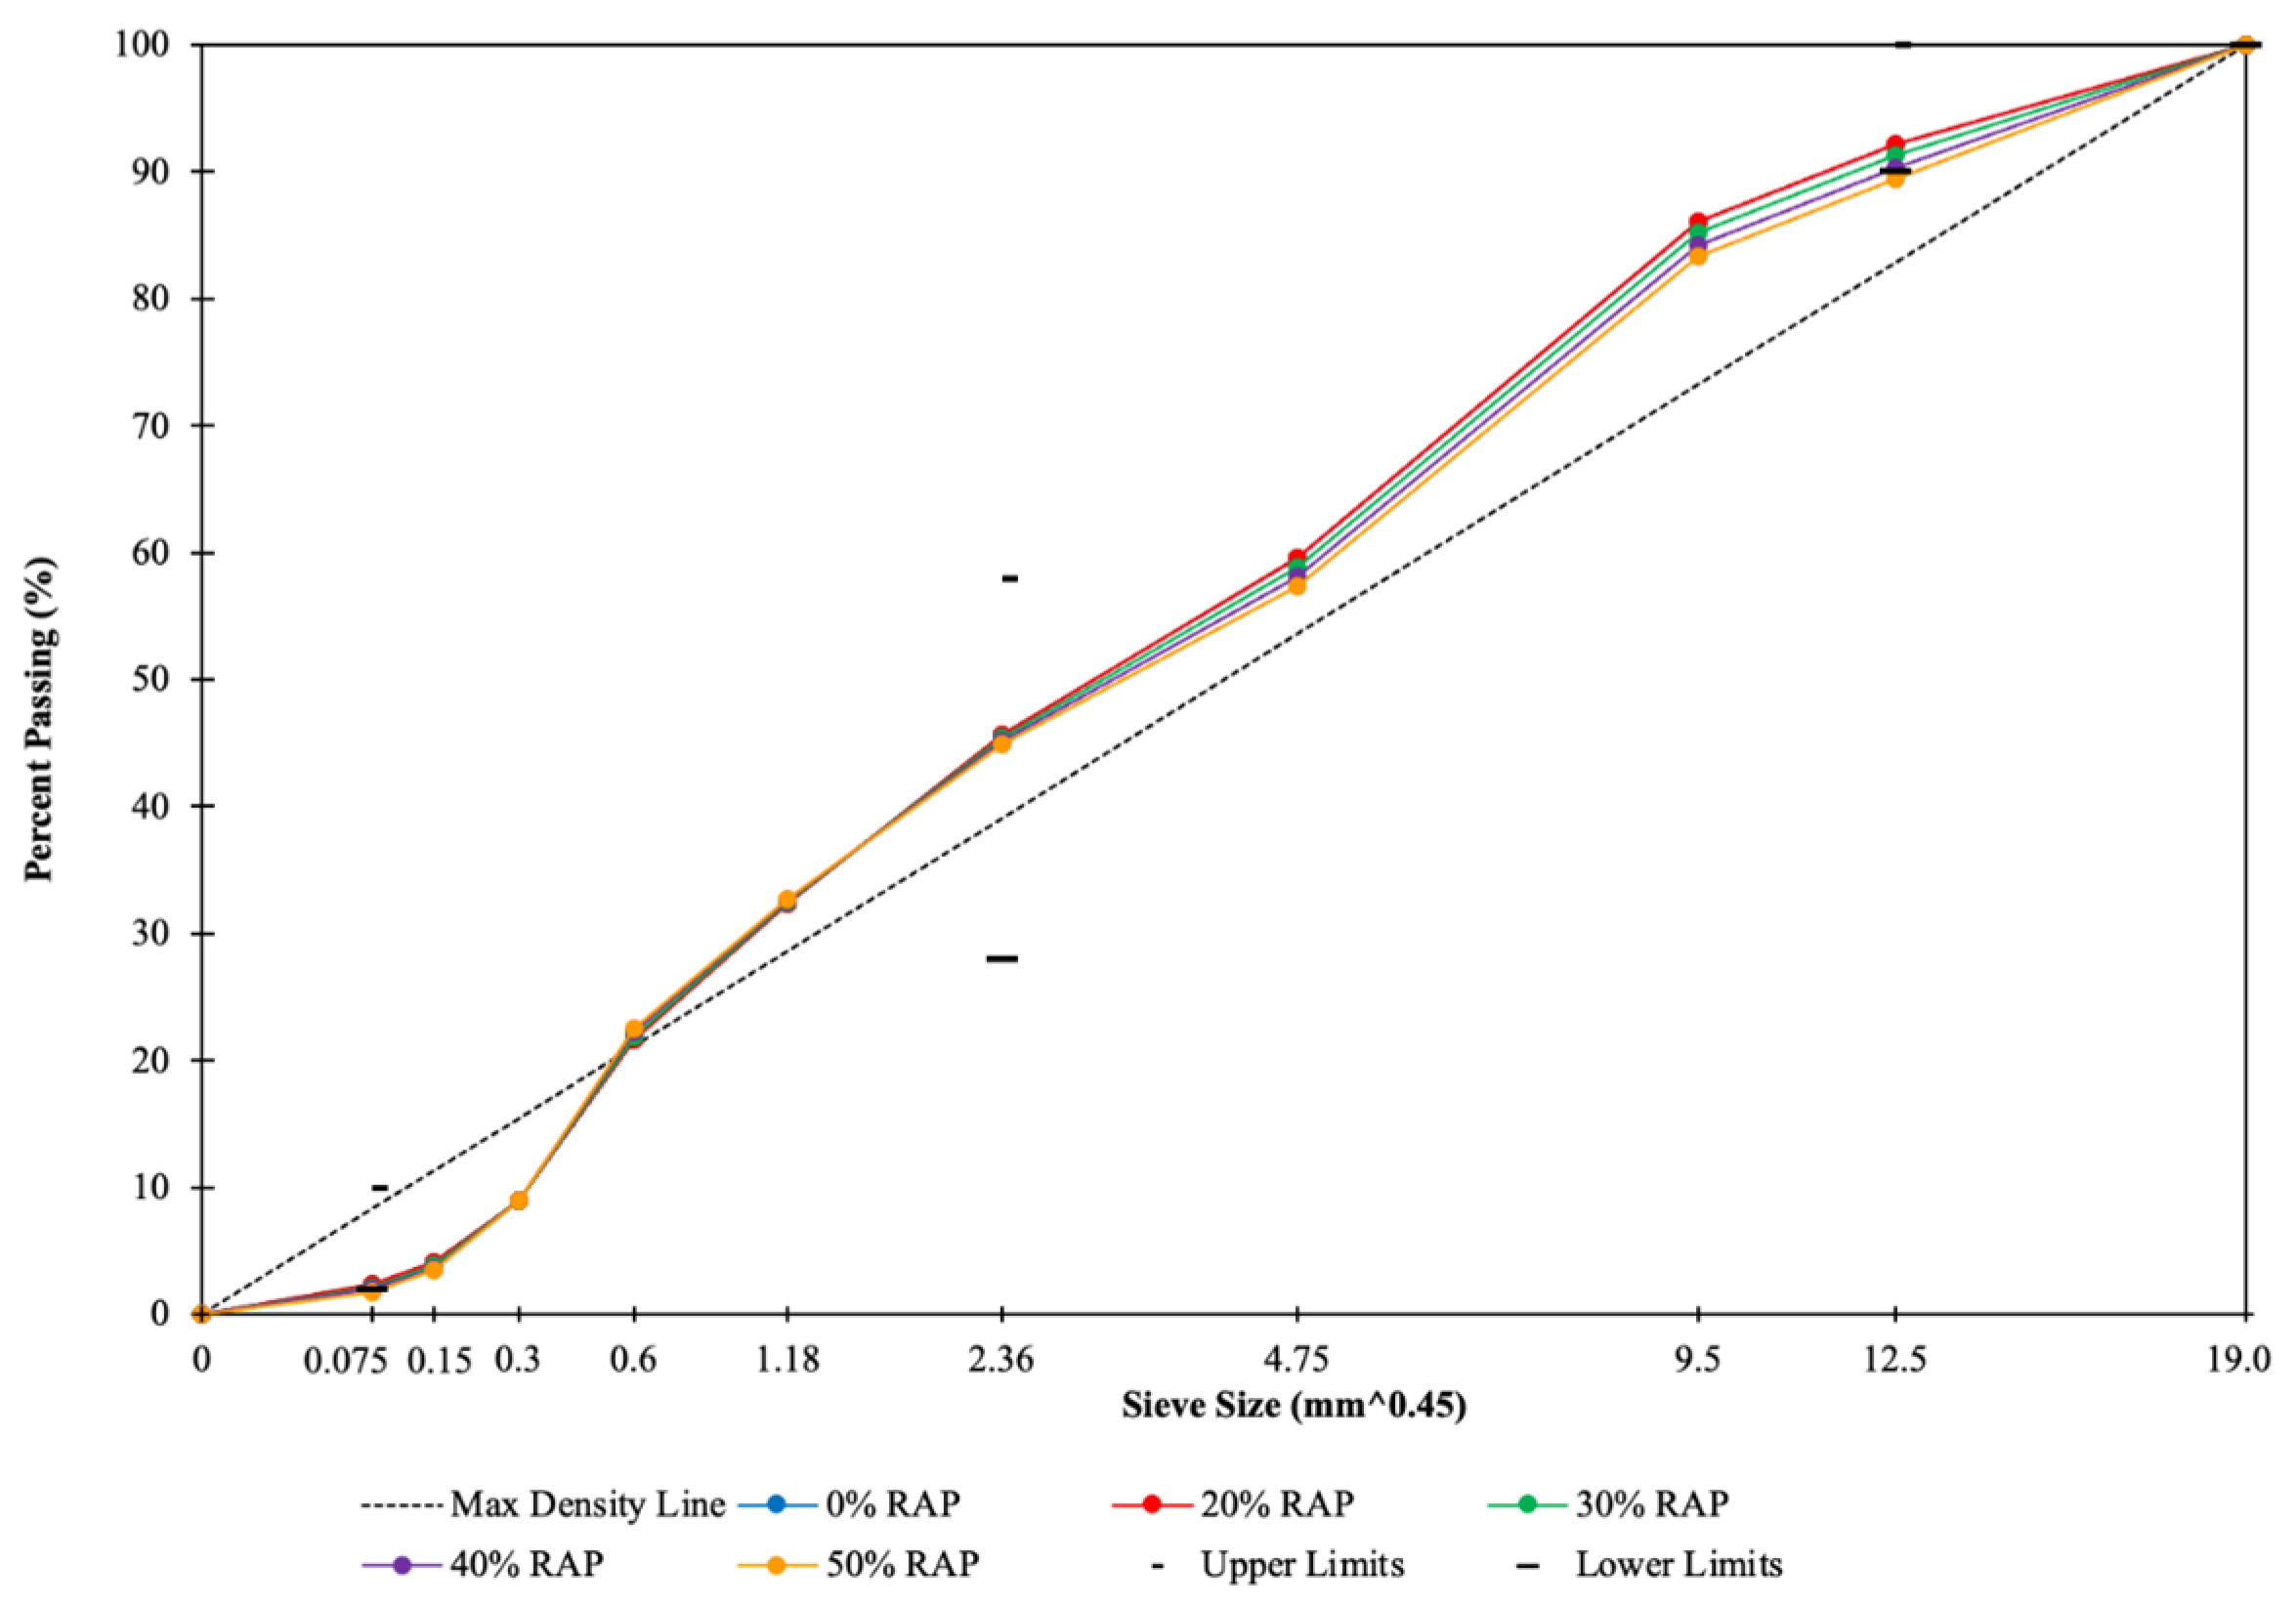
The main objective of this study is to evaluate the effectiveness of rejuvenators for higher Reclaimed Asphalt Pavement (RAP) contents up to 50%. In this study, the sieved RAP materials were burnt off, and a gradation of extracted aggregates for each individual RAP size was determined [12]. The resulting extracted aggregate gradation and asphalt content for RAP materials retained on each sieve are summarized in Table 1. For example, as can be seen from Table 1, RAP materials retained on sieve 4.75 mm are composed of 66.4% extracted aggregates retained on sieve 4.75 mm (see the row “4.75 mm” under column “4.75 mm”), 11.1% extracted aggregates retained on sieve 2.36 mm, and 4.3% extracted aggregates retained on sieve 1.18 mm, etc. Gradations of aggregates with varying RAP contents from 20% to 50% are shown in Figure 1. As can be seen from Figure 1, aggregate gradations for different RAP contents are very similar.
Table 1.
Sieve-size-separated RAP material composition analysis.
Figure 1.
Consistent gradation of extracted aggregates with various RAP contents.
3.3. Zero-M Cool Mix Additive
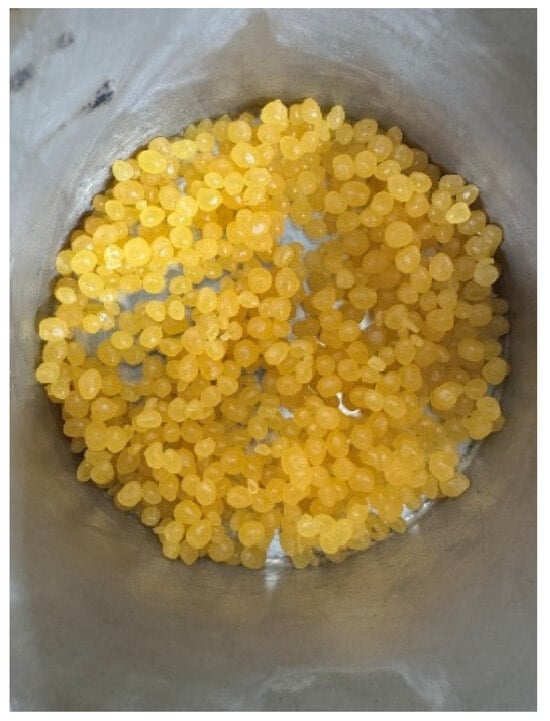
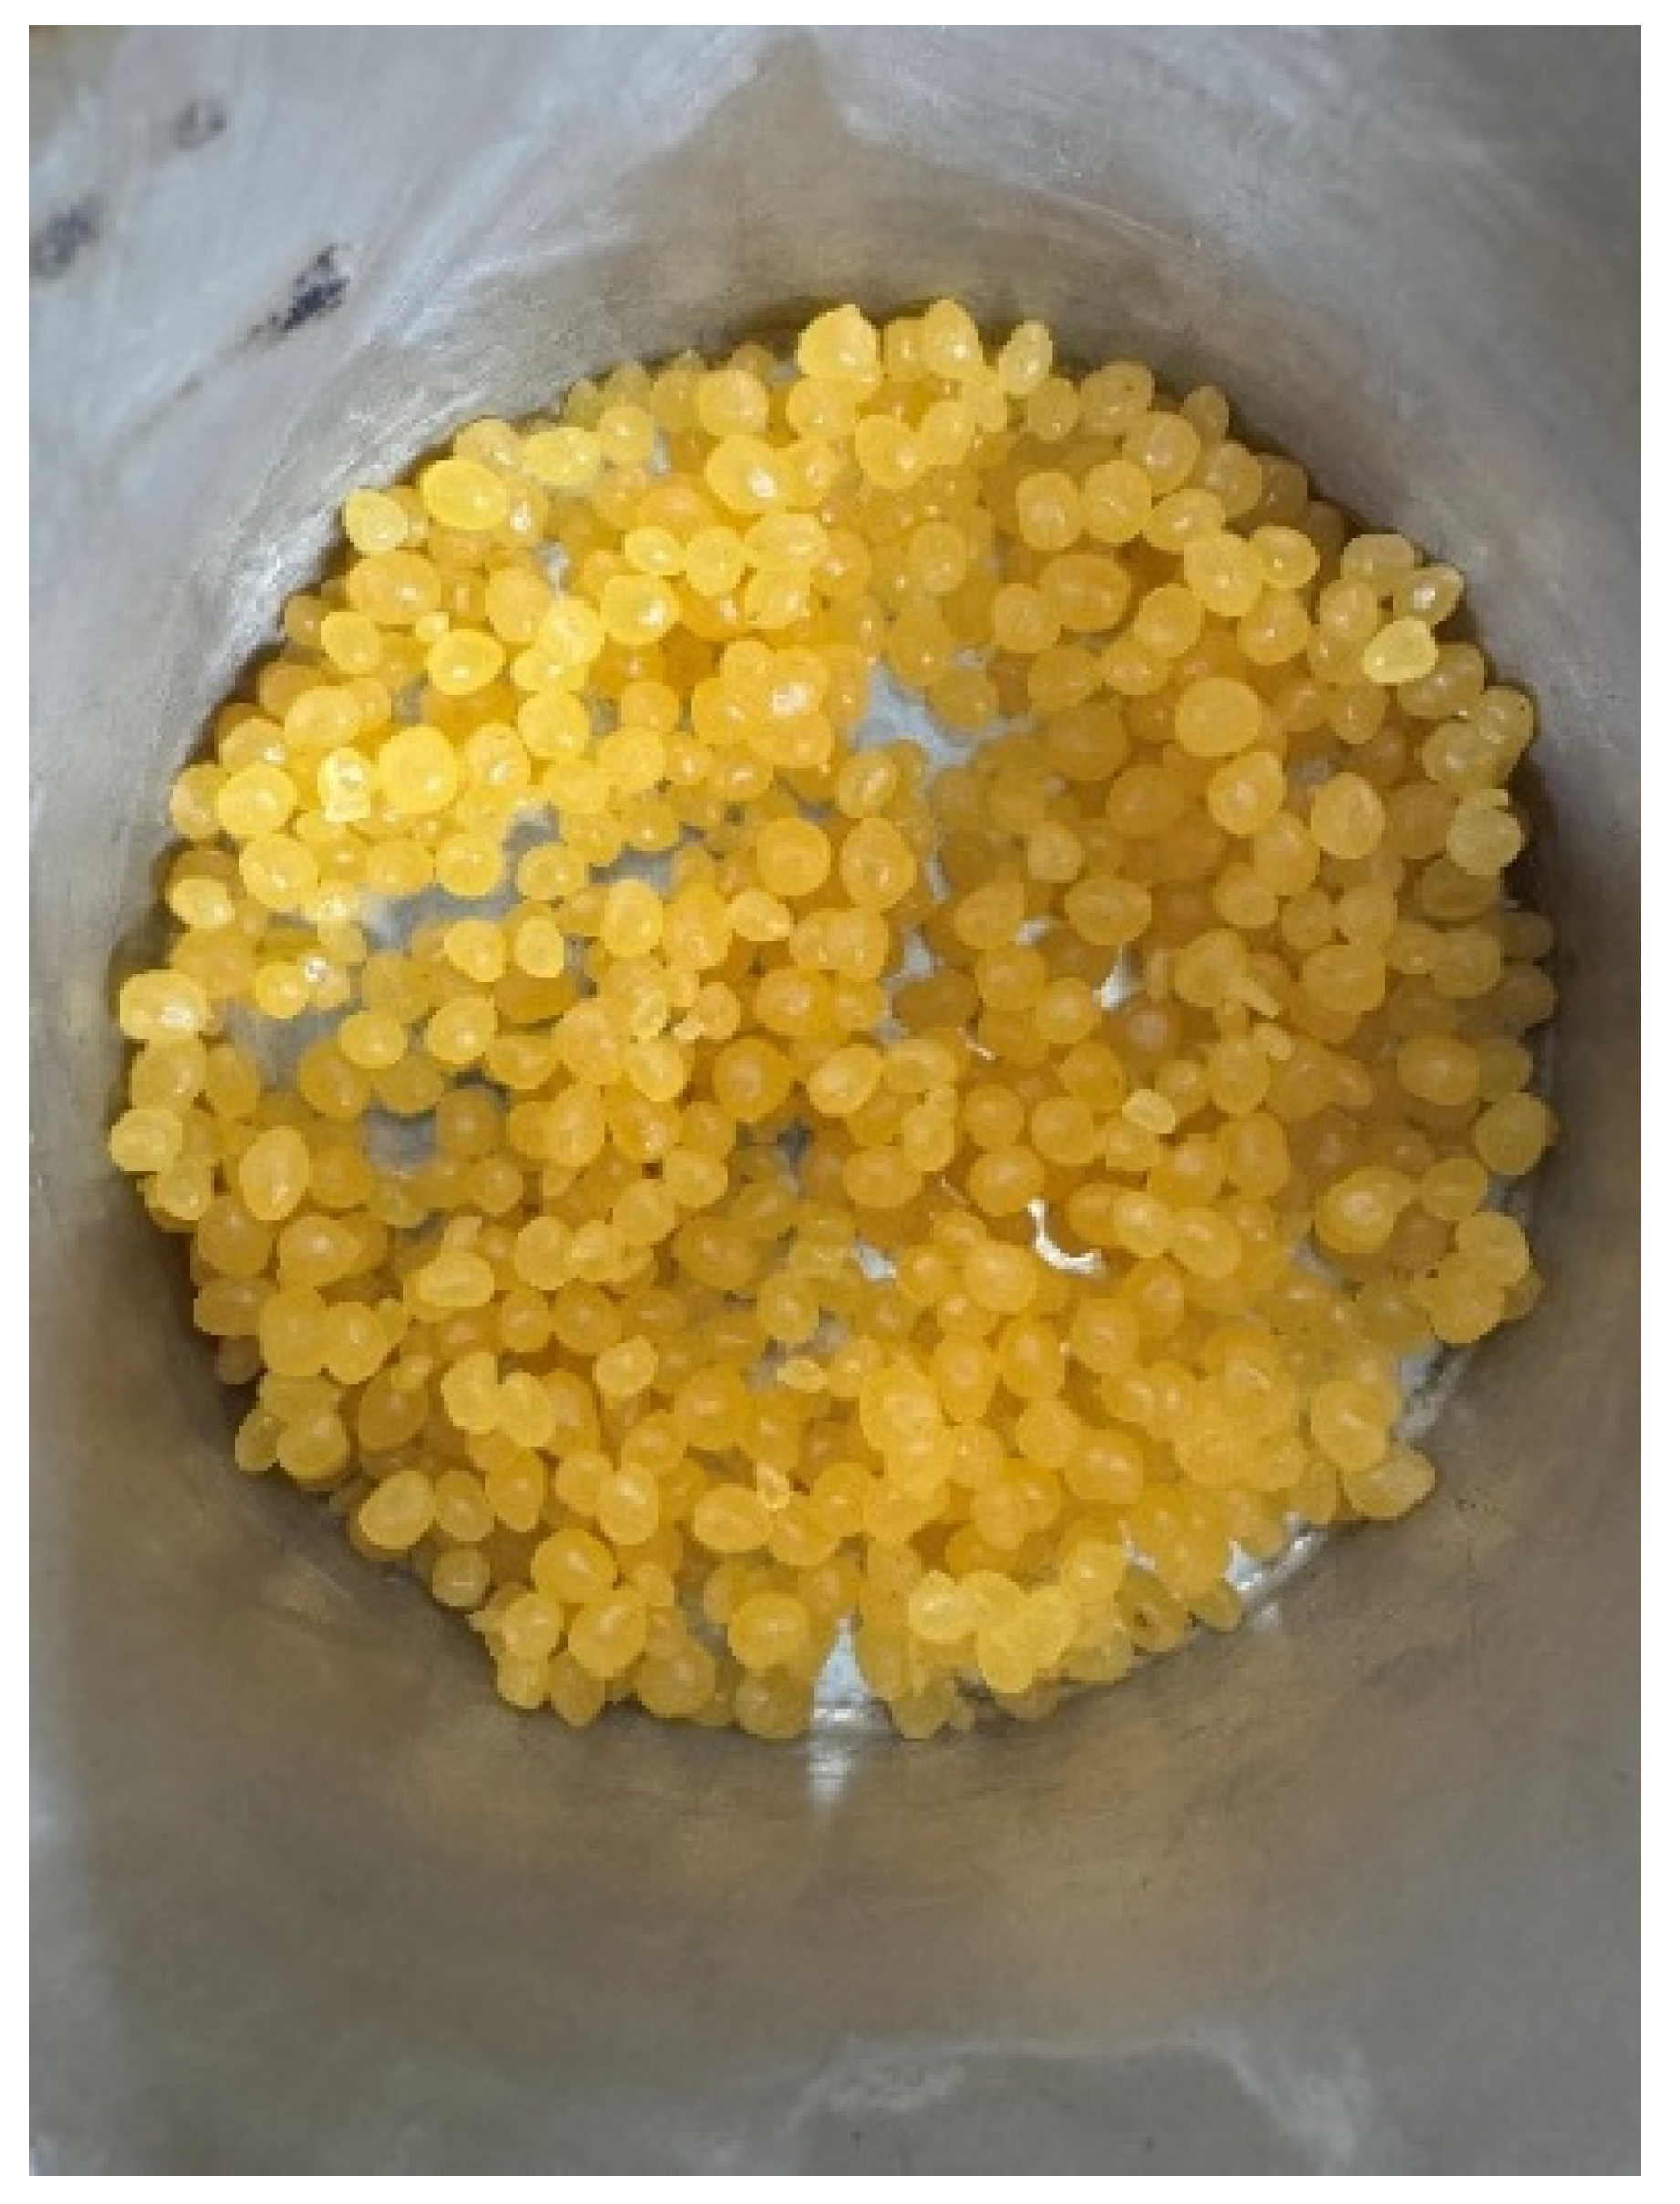
As shown in Figure 2, Zero-M is a polymer cool mix additive (PCMA) which is designed to reduce the mixing and compaction temperatures of asphalt mixes. The additive is manufactured through the gelation process of SBS polymer and includes a thermoplastic copolymer, process oil, polybutene, and adhesive resin [13]. Table 2 shows the fundamental test results of the Zero-M additive. In this study, the dosage rate of the Zero-M additive was 10% of the total binder for aggregates heated at 110 °C.
Figure 2.
Zero-M cool mix additive.
Table 2.
Test results of Zero-M additive [12].
3.4. Anova Rejuvenator
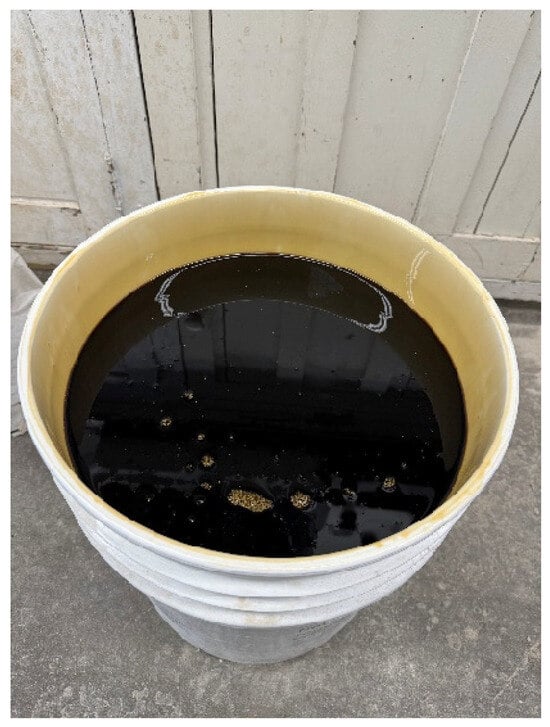
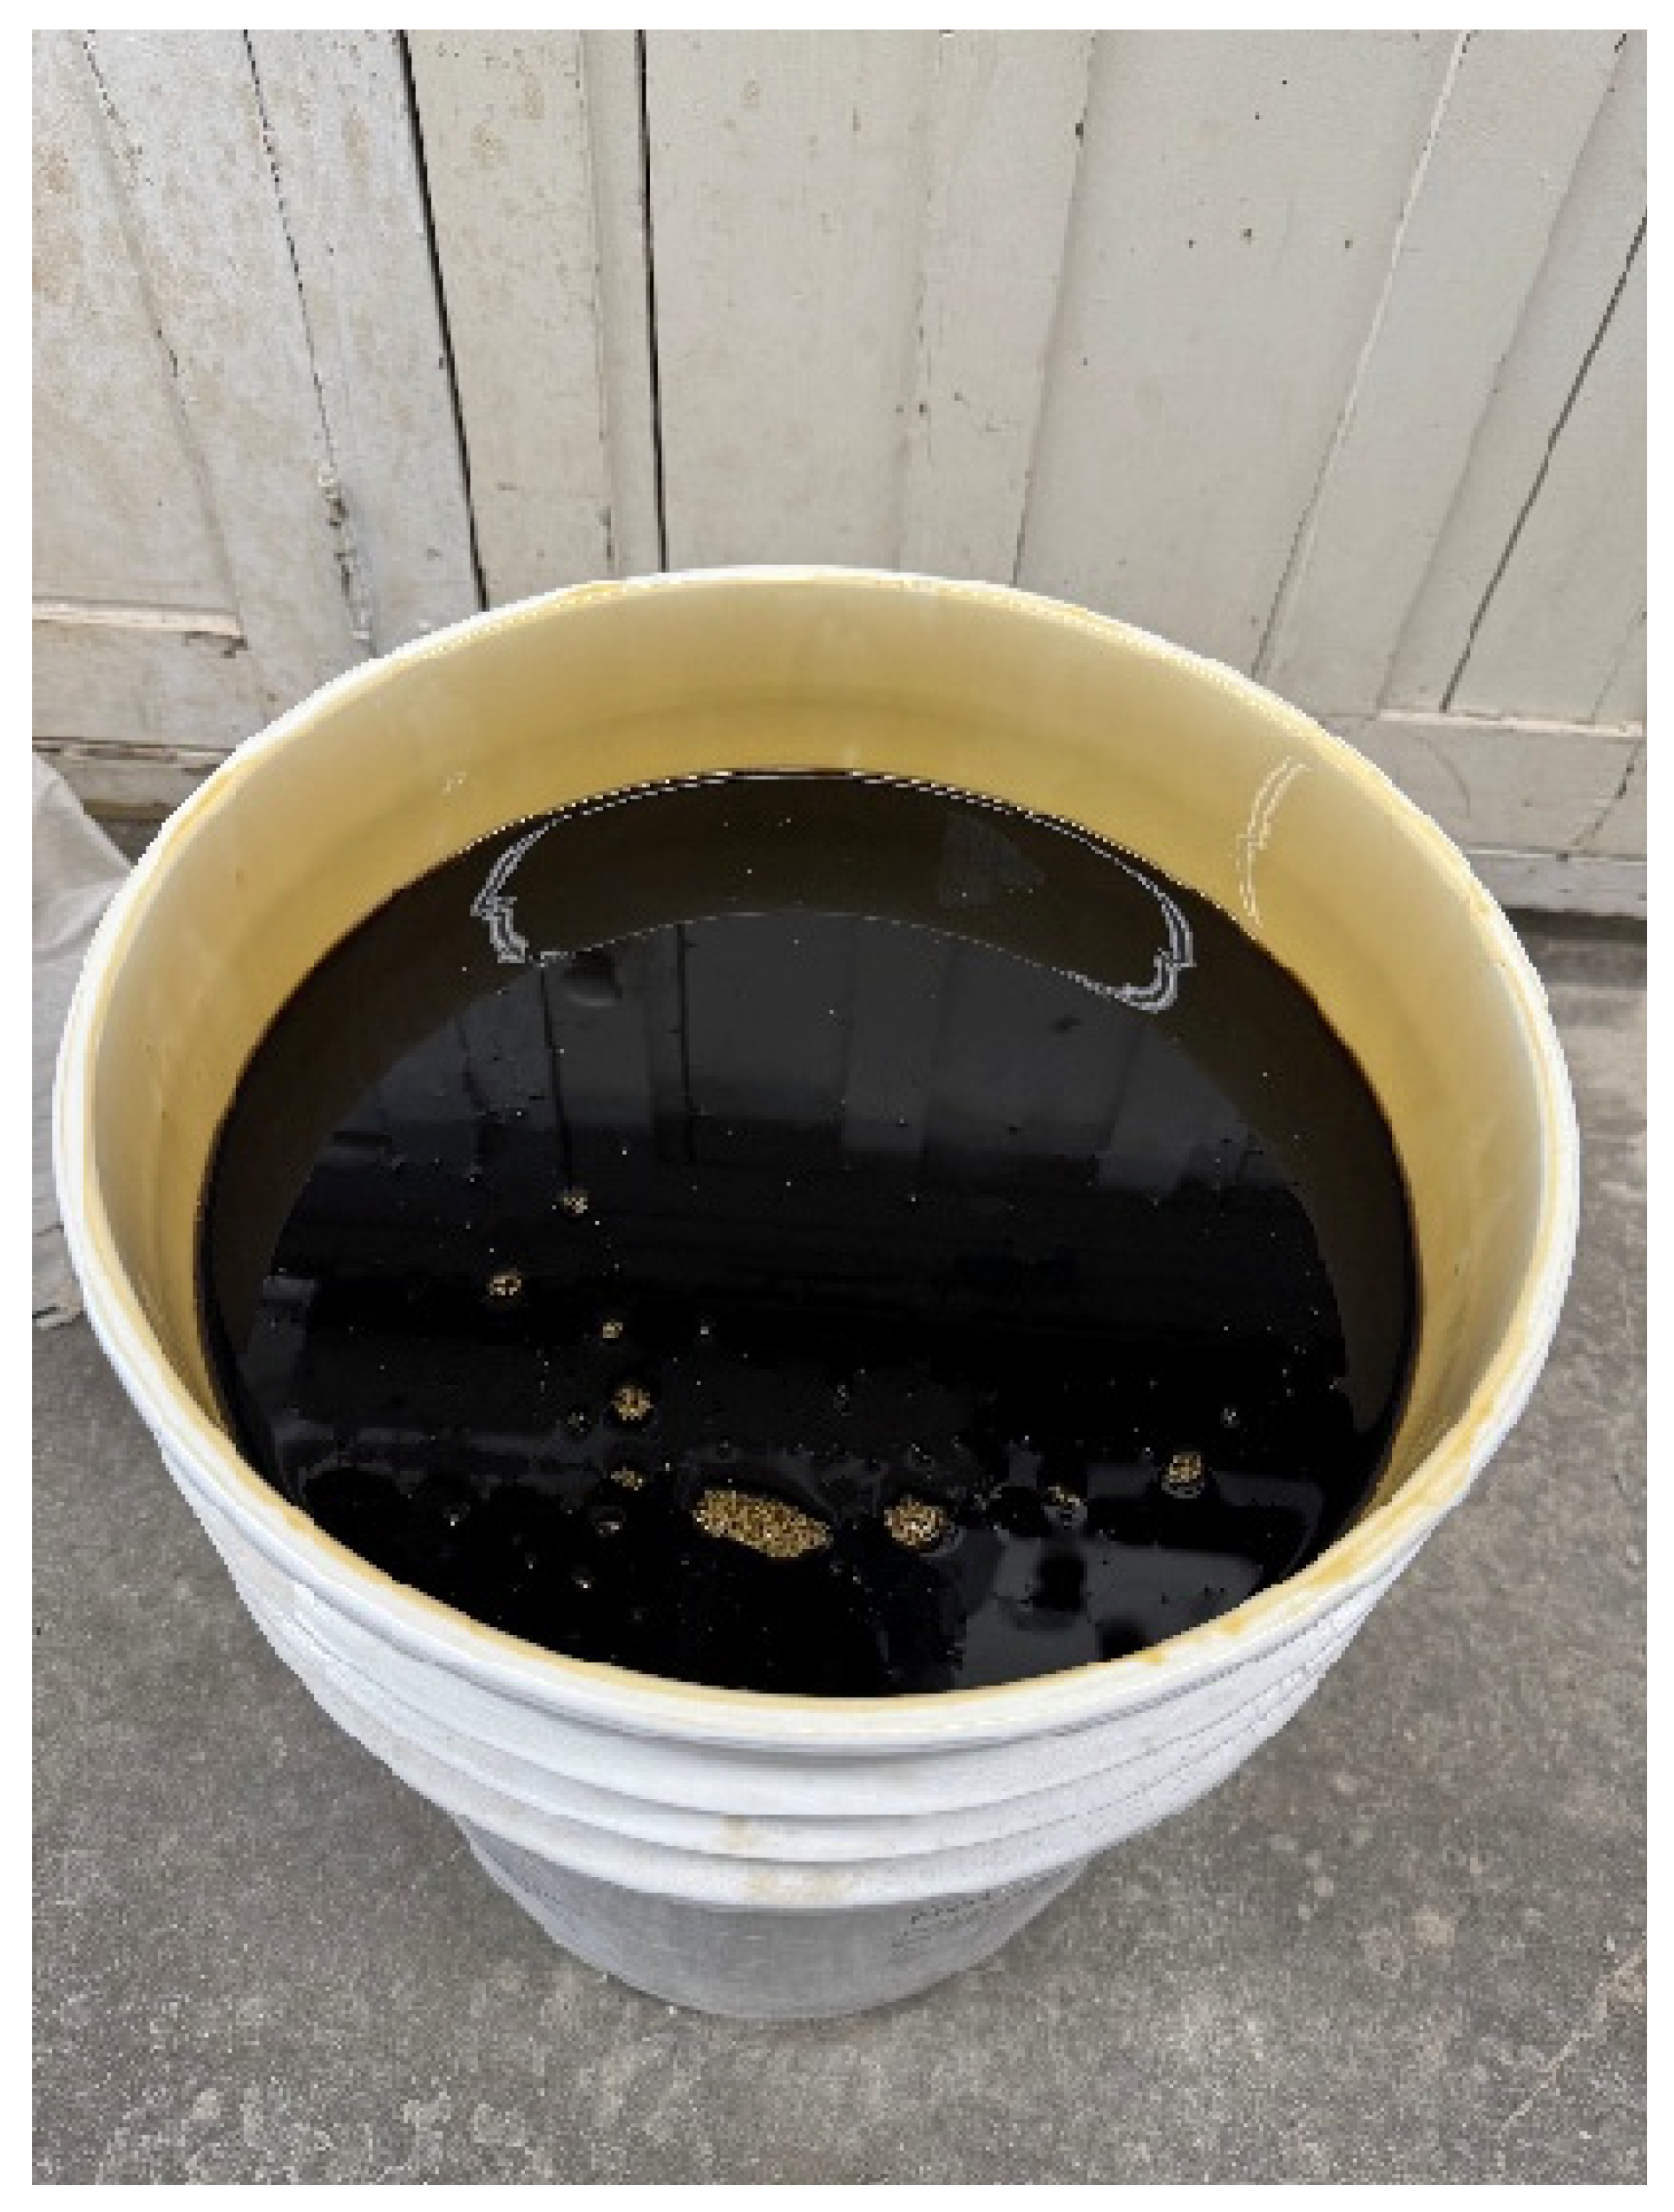
As shown in Figure 3, Anova is a rejuvenator primarily made from modified vegetable oil. Its goal is to improve asphalt mixes with high levels of recycled asphalt. Designed to reactivate aged bitumen, the rejuvenator aims to enhance the performance, durability, and aging resistance of high RAP asphalt pavement [14]. The properties of the Anova rejuvenator are listed in Table 3. Aggregates were heated to 135 °C, which is a typical temperature for HMA mix design in the laboratory. In consideration of the dosage rates ranging between 4.1% and 4.8% for PG58S asphalt grade in Table 4, to ensure a sufficient additive amount for this study, the dosage rate of Anova was determined as 5% of the RAP binder.
Figure 3.
Anova rejuvenator.
Table 3.
Typical properties of the Anova rejuvenator [14].
Table 4.
Anova rejuvenator dosage guide [15].
3.5. Mix Design Process
The inclusion of RAP materials in the asphalt mix significantly increases the complexity of the asphalt mix design. Throughout the study, each asphalt mix sample was composed of 95% aggregates and 5% binder, regardless of the RAP content or binder additives. Using the target mix gradation for the total mix and the desired RAP percentage, the virgin aggregate weights were determined for each sieve size. Next, the RAP aggregate weights for each sieve size were determined. After determining the aggregate weights, the amount of aged binder in the RAP materials was calculated. Once the quantity of binder in the RAP materials was determined, it was subtracted from the total binder amount. The amounts of binder additive of Zero-M and Anova were then determined based on their respective dosage rates. The amounts of these additives were counted towards a total binder content and thus reduced the amount of virgin asphalt added.
Using the RAP gradation in Table 1 and the Solver optimization function in Excel, the RAP materials required from each sieve size bucket were determined. After determining the aggregate weights, the amount of aged binder in the RAP materials was calculated. Once the quantity of binder in the RAP materials was determined through the burn-off test, it was subtracted from the amount of binder needed to reach the 5% threshold of the total mix. Lastly, the amount of binder additive (Zero-M or Anova) was determined based on their respective dosage rates. These additives were included in the 5% binder and thus reduced the amount of virgin asphalt needed.
4. Test Results and Discussions
For each mix design, three Hamburg tests, three IDEAL-CT Tests, and eleven SCB-IFIT Tests were performed. A total of 152 test specimens of five different amounts of RAP materials (0%, 20%, 30%, 40% and 50%) with no additive, Zero-M additive and Anova additive were prepared. At least three specimens for each combination of four levels of RAP materials and two additives (Zero-M and Anova) plus control specimens were tested using each of three test protocols (SCB-IFIT, IDEAL-CT and Hamburg).
4.1. SCB-IFIT Test Results
The Illinois test method AASHTO TP124 (SCB-IFIT) tests specimens in the semicircular bend geometry, which is a half disk with a notch parallel to the direction of load application [16]. It aims to design a faster way of testing at room temperature [17] The loading rate should be 50 mm/min. Although the testing software automatically generates a Flexibility Index (FI), it was verified using the following equation. To calculate the FI, first the fracture energy () for each specimen is calculated as:
where
work of fracture (J) (area under the curve)
specimen radius (150 mm)
notch length (15 mm)
specimen thickness (50 mm)
Notch width should be 2.25 mm or less. After calculating the fracture energy, the following equation is used to calculate the FI for each specimen:
where
post-peak slope at the inflection point (kN/mm)
0.1 (unit conversion for a lab-compacted specimen)
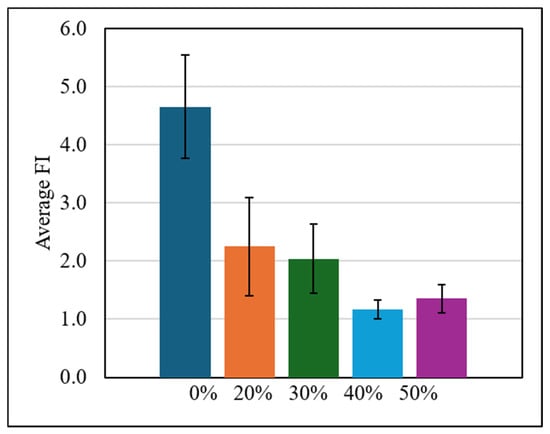
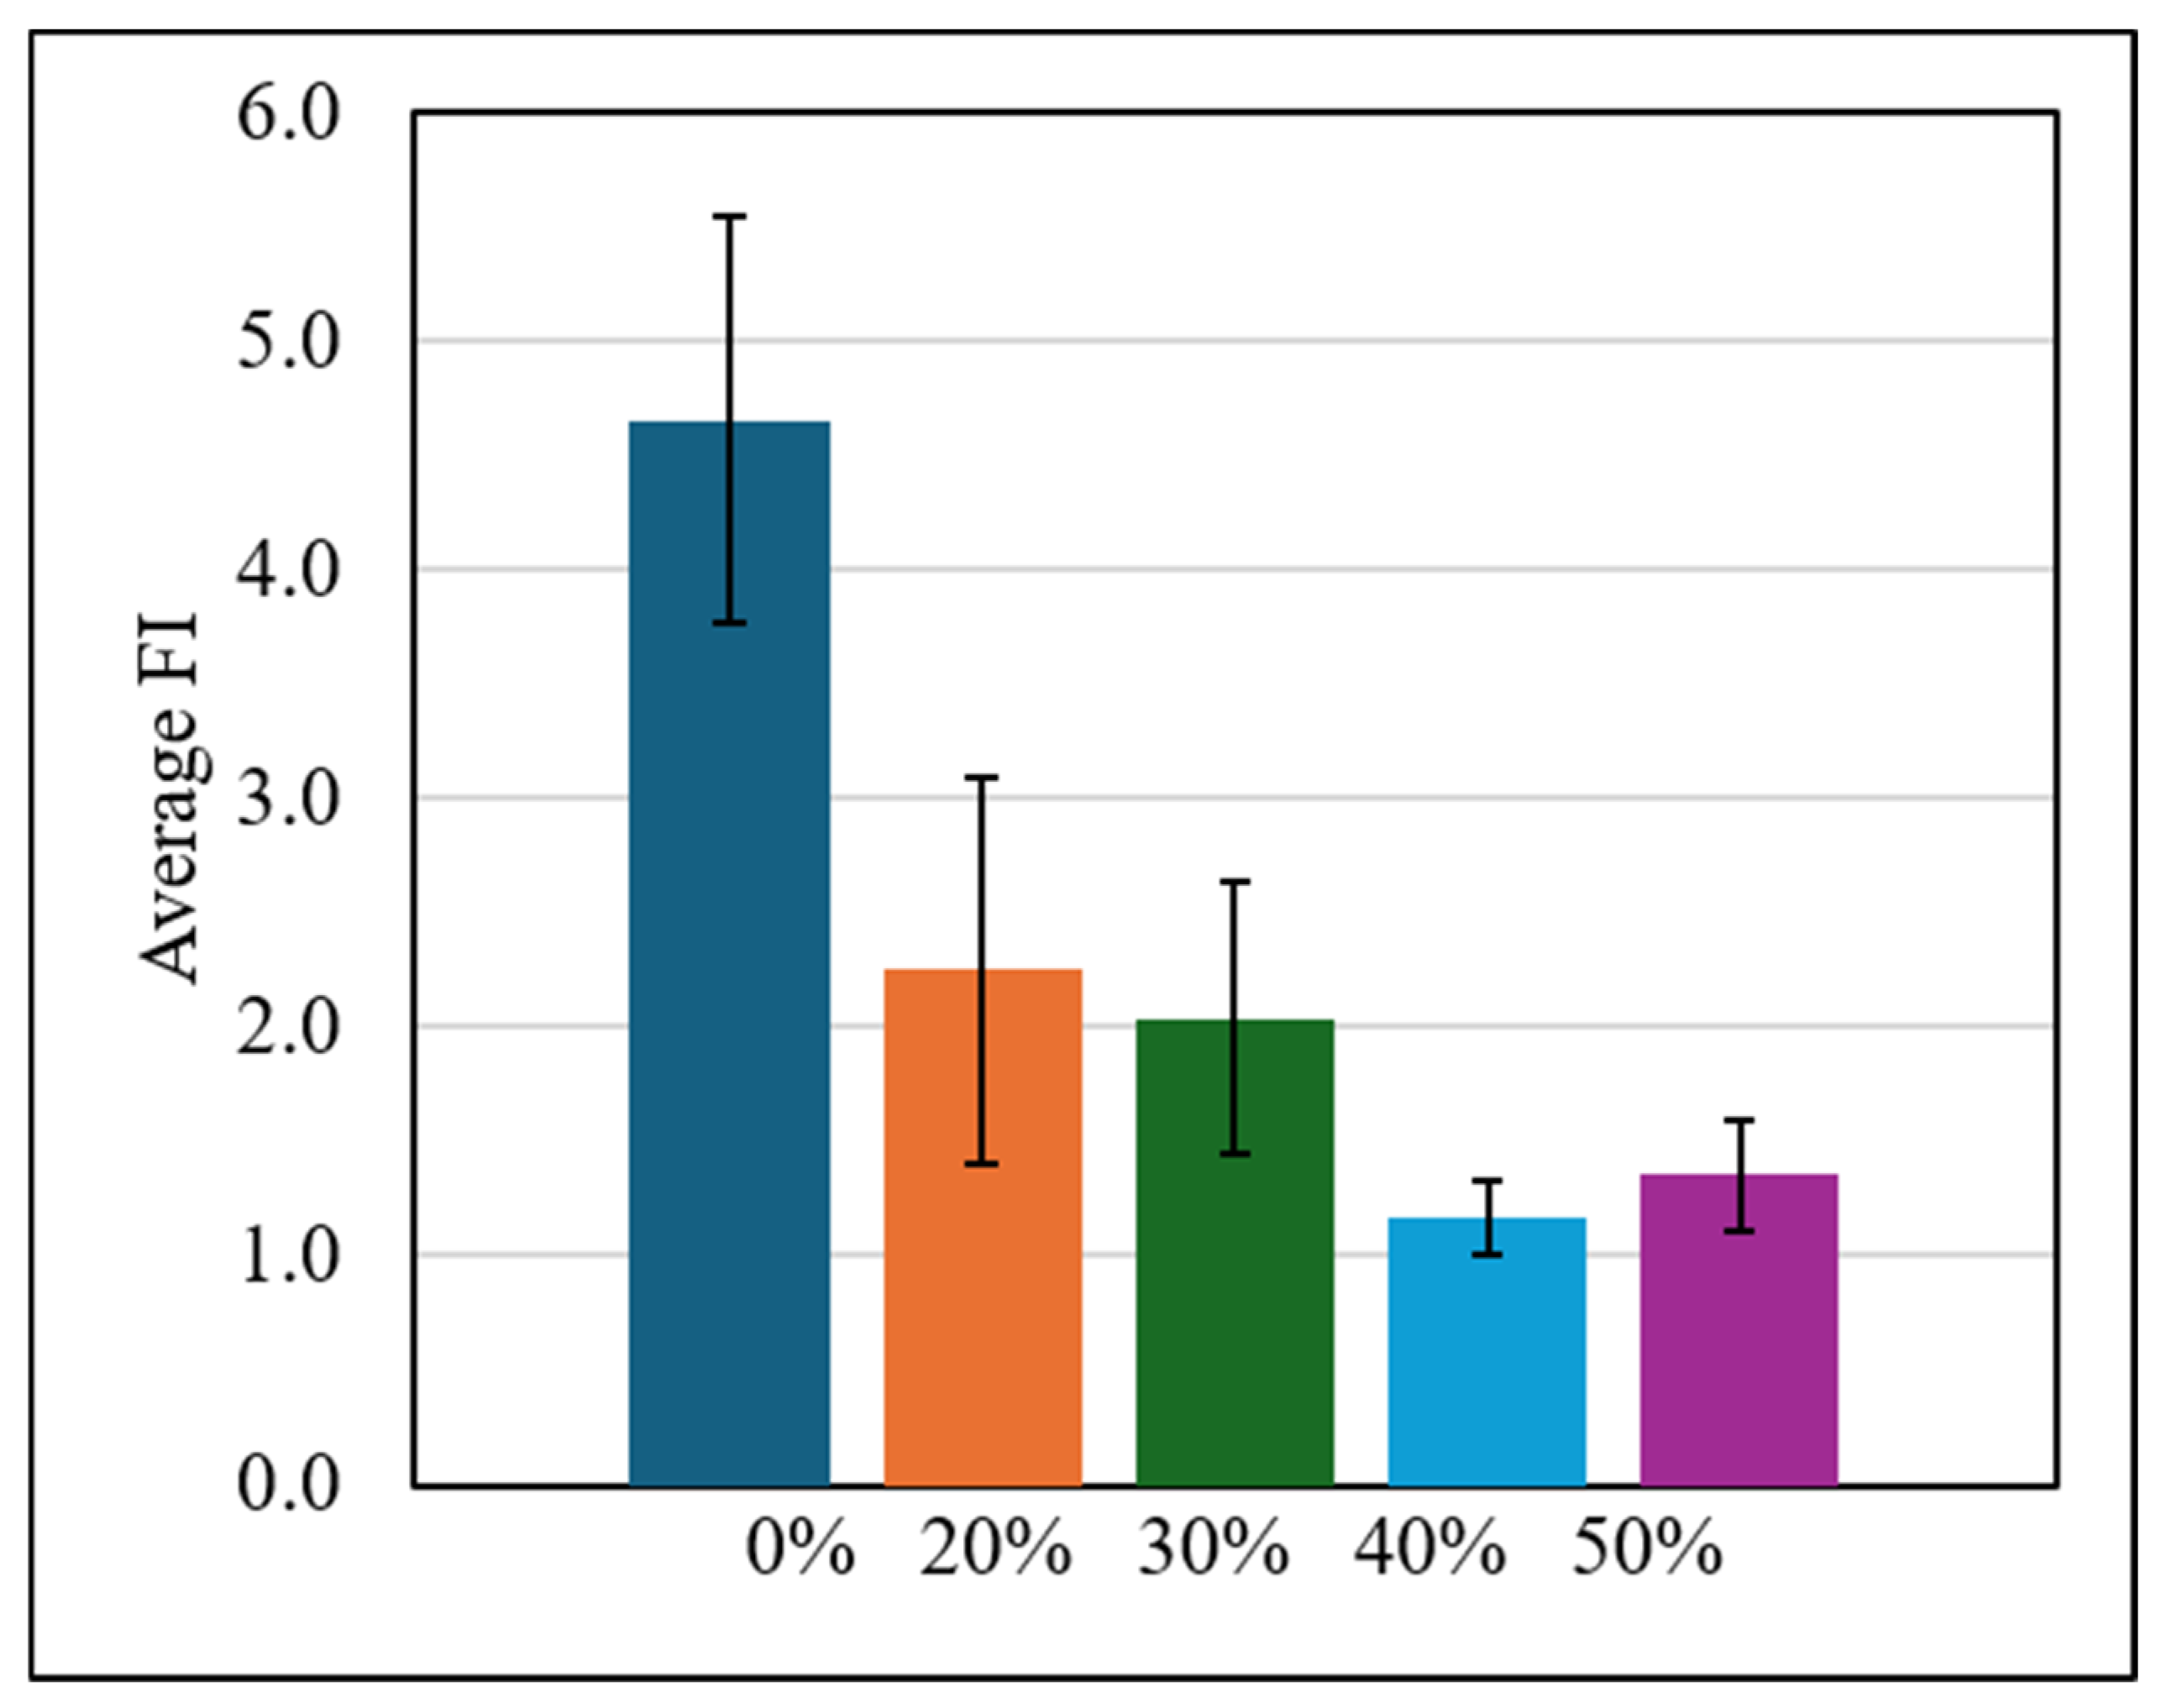
The average FI values of the control mixtures with five RAP contents (0%, 20%, 30%, 40% and 50%) are shown in Figure 4 with an error bar indicating the standard deviation. As expected, as the amount of RAP content increased, the FI value decreased. This result indicates that the addition of higher amounts of RAP materials significantly lowers cracking resistance compared to specimens with 0% RAP. It should be noted that the FI value of 50% RAP slightly increased compared to 40% RAP but remained significantly lower than 30% RAP. At the low FI value, it is expected to see a small fluctuation in test results.
Figure 4.
FI values of the control mixes with different RAP contents.
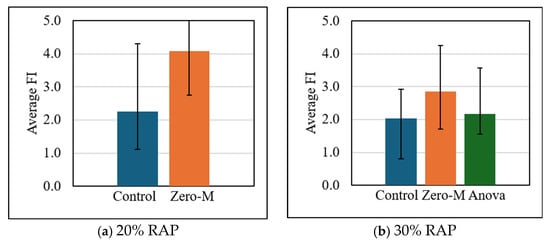
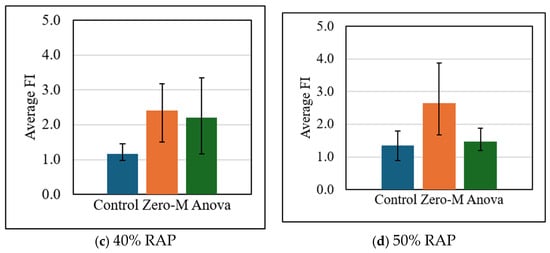
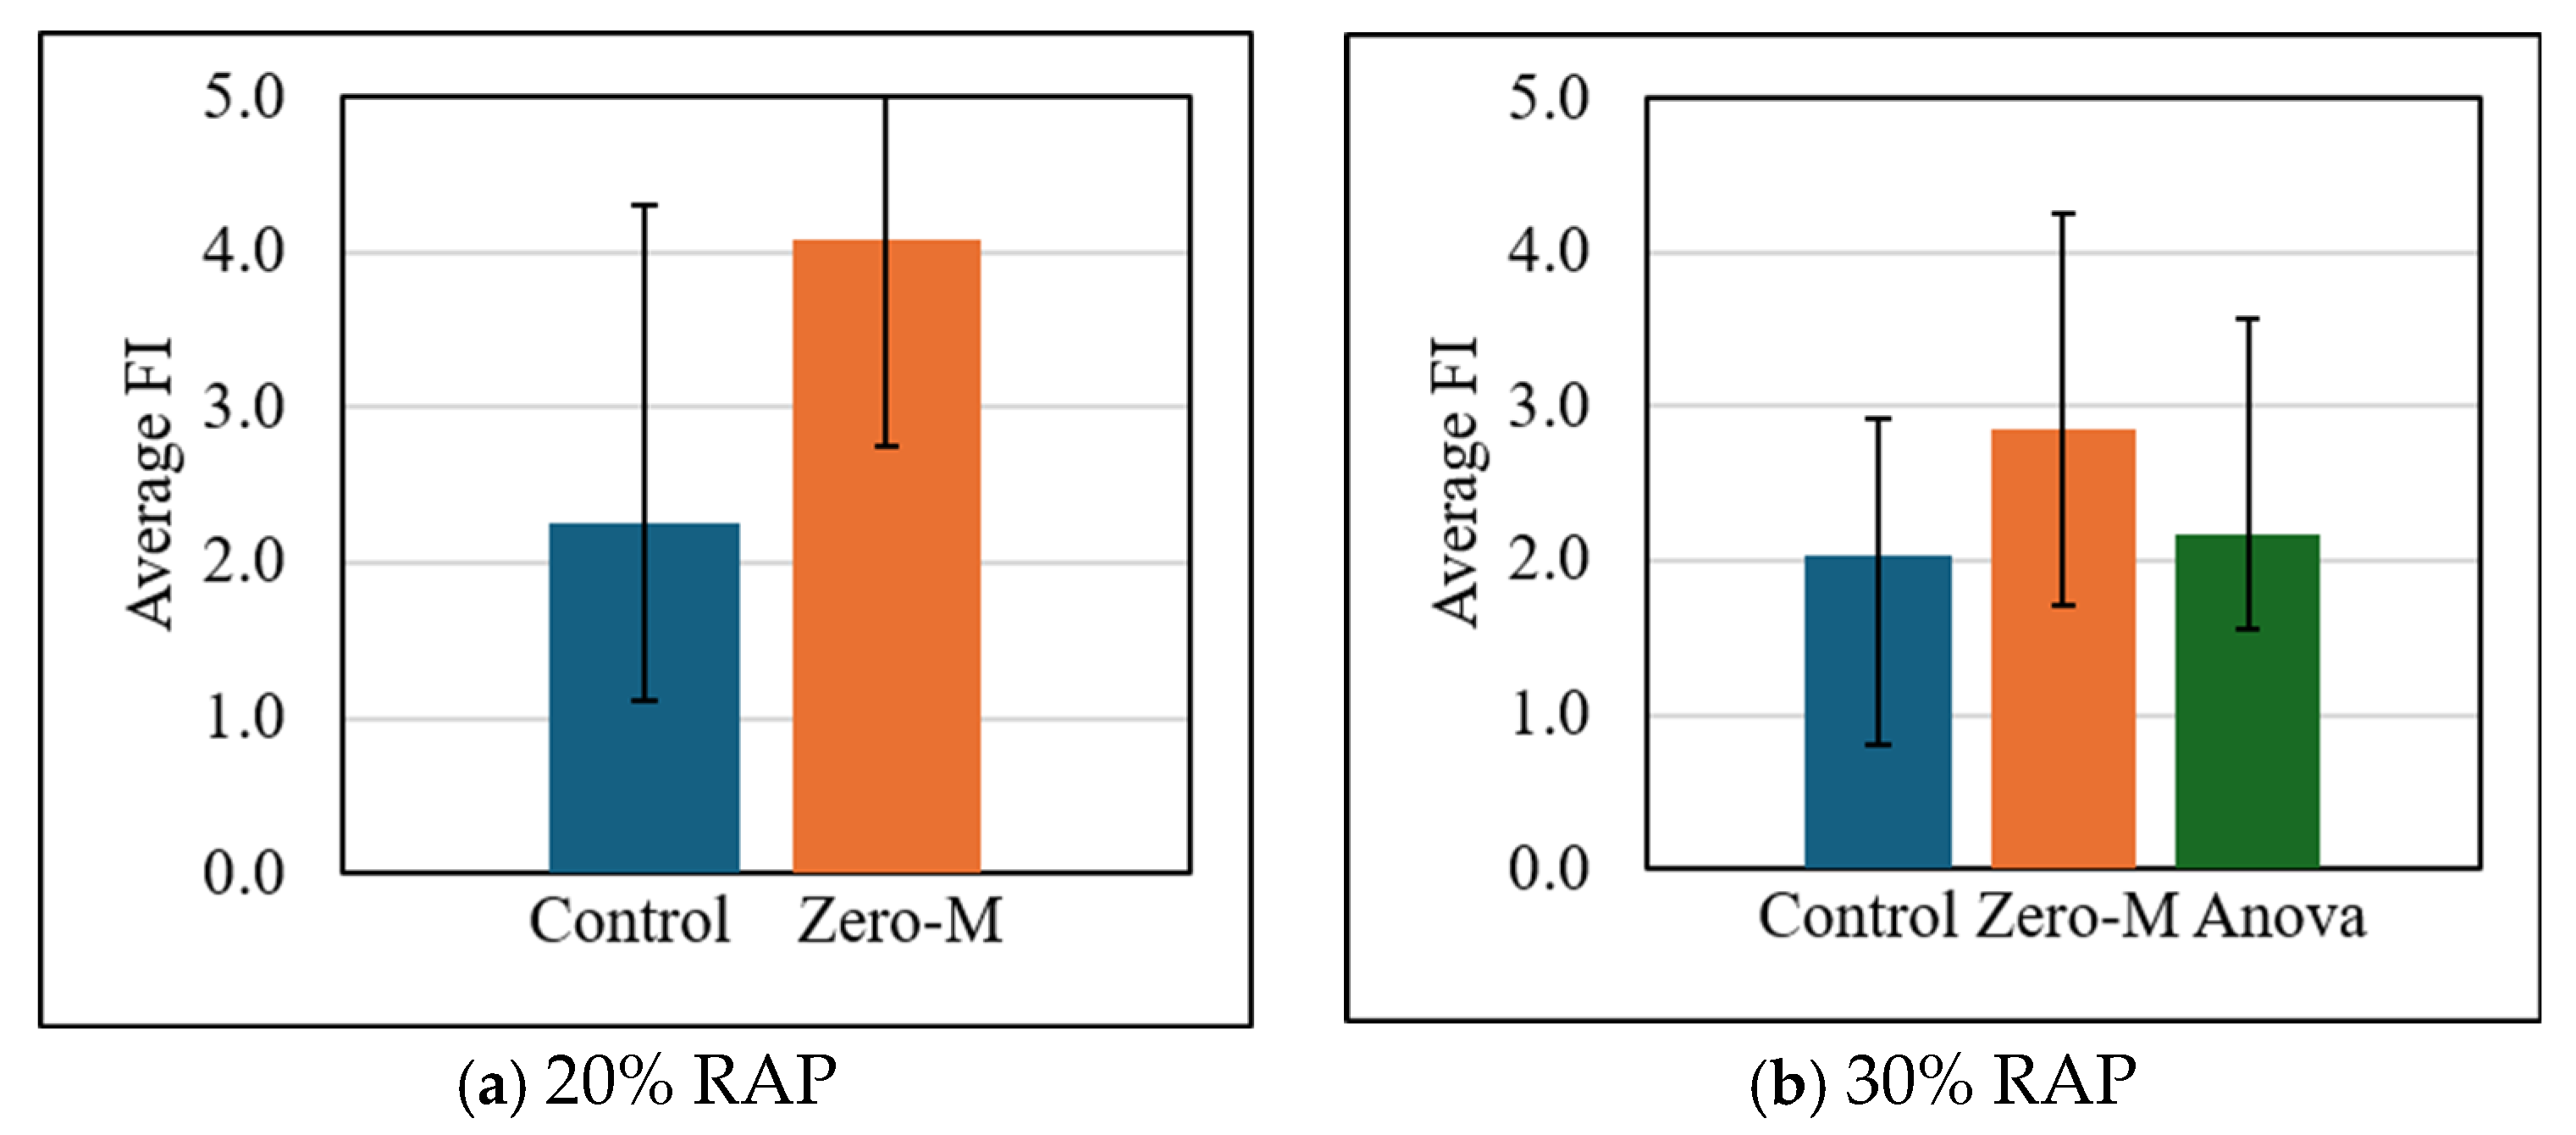
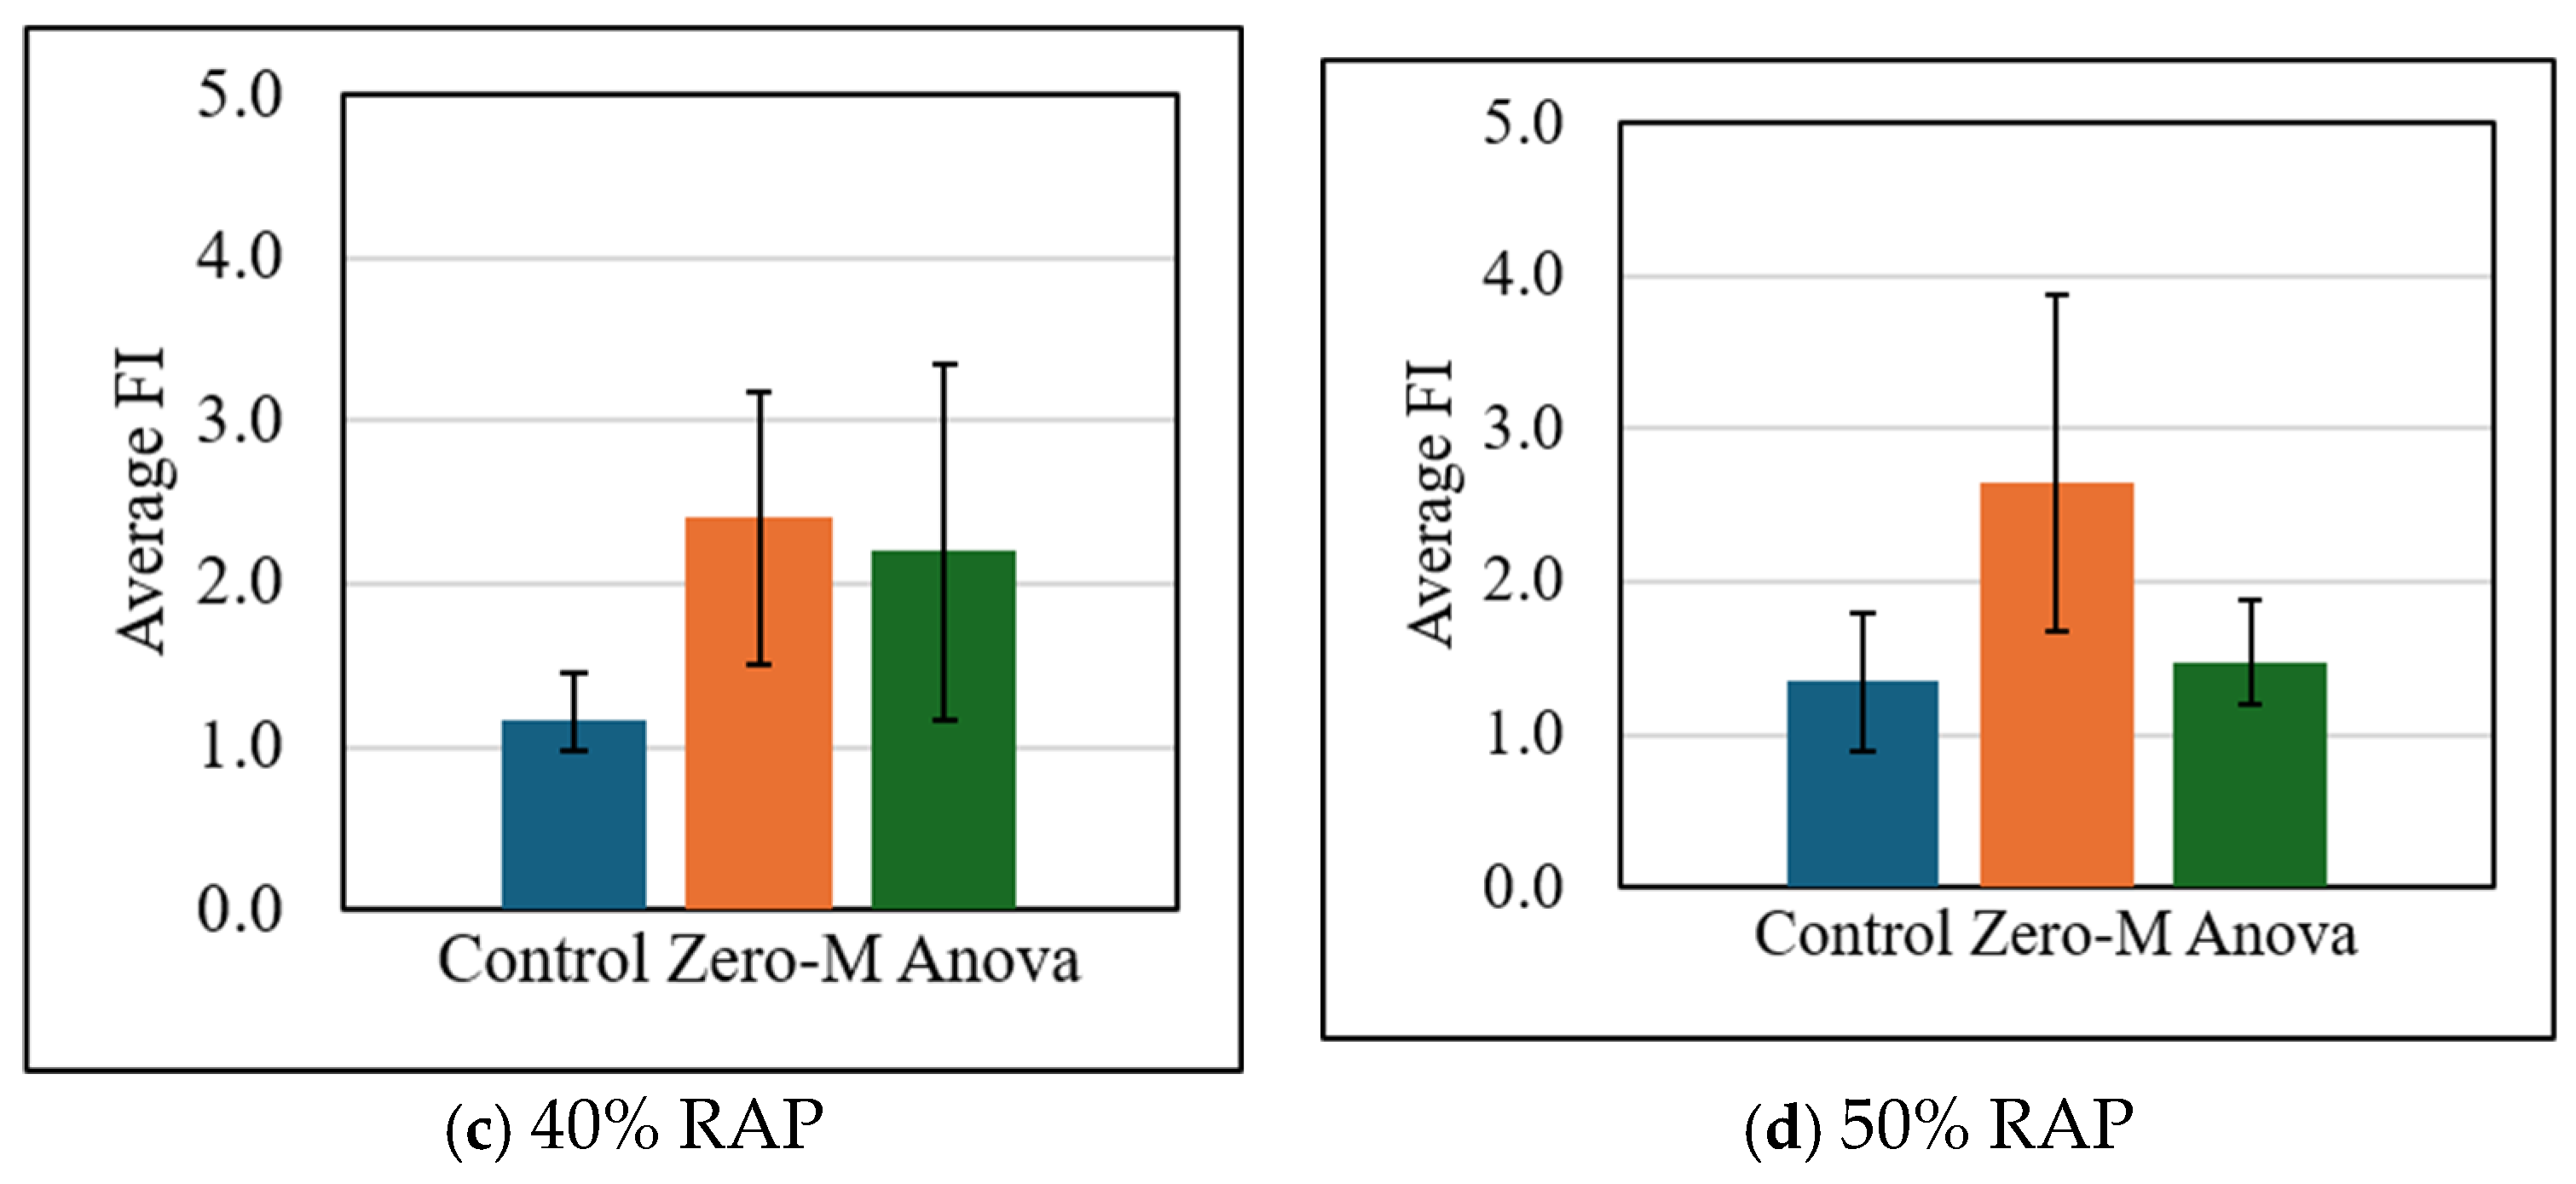
The average FI values of the control mix and two additives with 20%, 30%, 40% and 50% RAP materials are shown in Figure 5. For all RAP contents, both additives improved cracking resistance, where the Zero-M additive improved cracking resistance significantly more than the Anova additive, especially for 50% RAP content. It should be noted that the Anova additive improved cracking resistance for asphalt mixtures with 40% RAP materials, whereas it slightly improved those with 30% and 50% RAP materials.
Figure 5.
FI values of mixes (control, Zero-M, Anova) with different RAP contents.
4.2. IDEAL-CT Test Results
Although the testing software automatically generates a Crack Tolerance (CT) Index, it was verified using the following equations. To calculate the CT index, first the post-peak slope () is calculated as:
where
85% of the peak load (N)
65% of the peak load (N)
the displacement at 85% of the post-peak load (m)
the displacement at 65% of the post-peak load (m)
For each specimen, after determining the post-peak slope, the CT index is calculated using the following equation:
where
failure energy ()
the displacement at 75% of the post-peak load (mm)
specimen diameter (mm)
specimen thickness (mm)
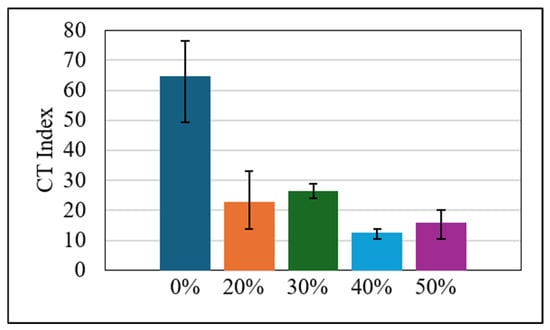
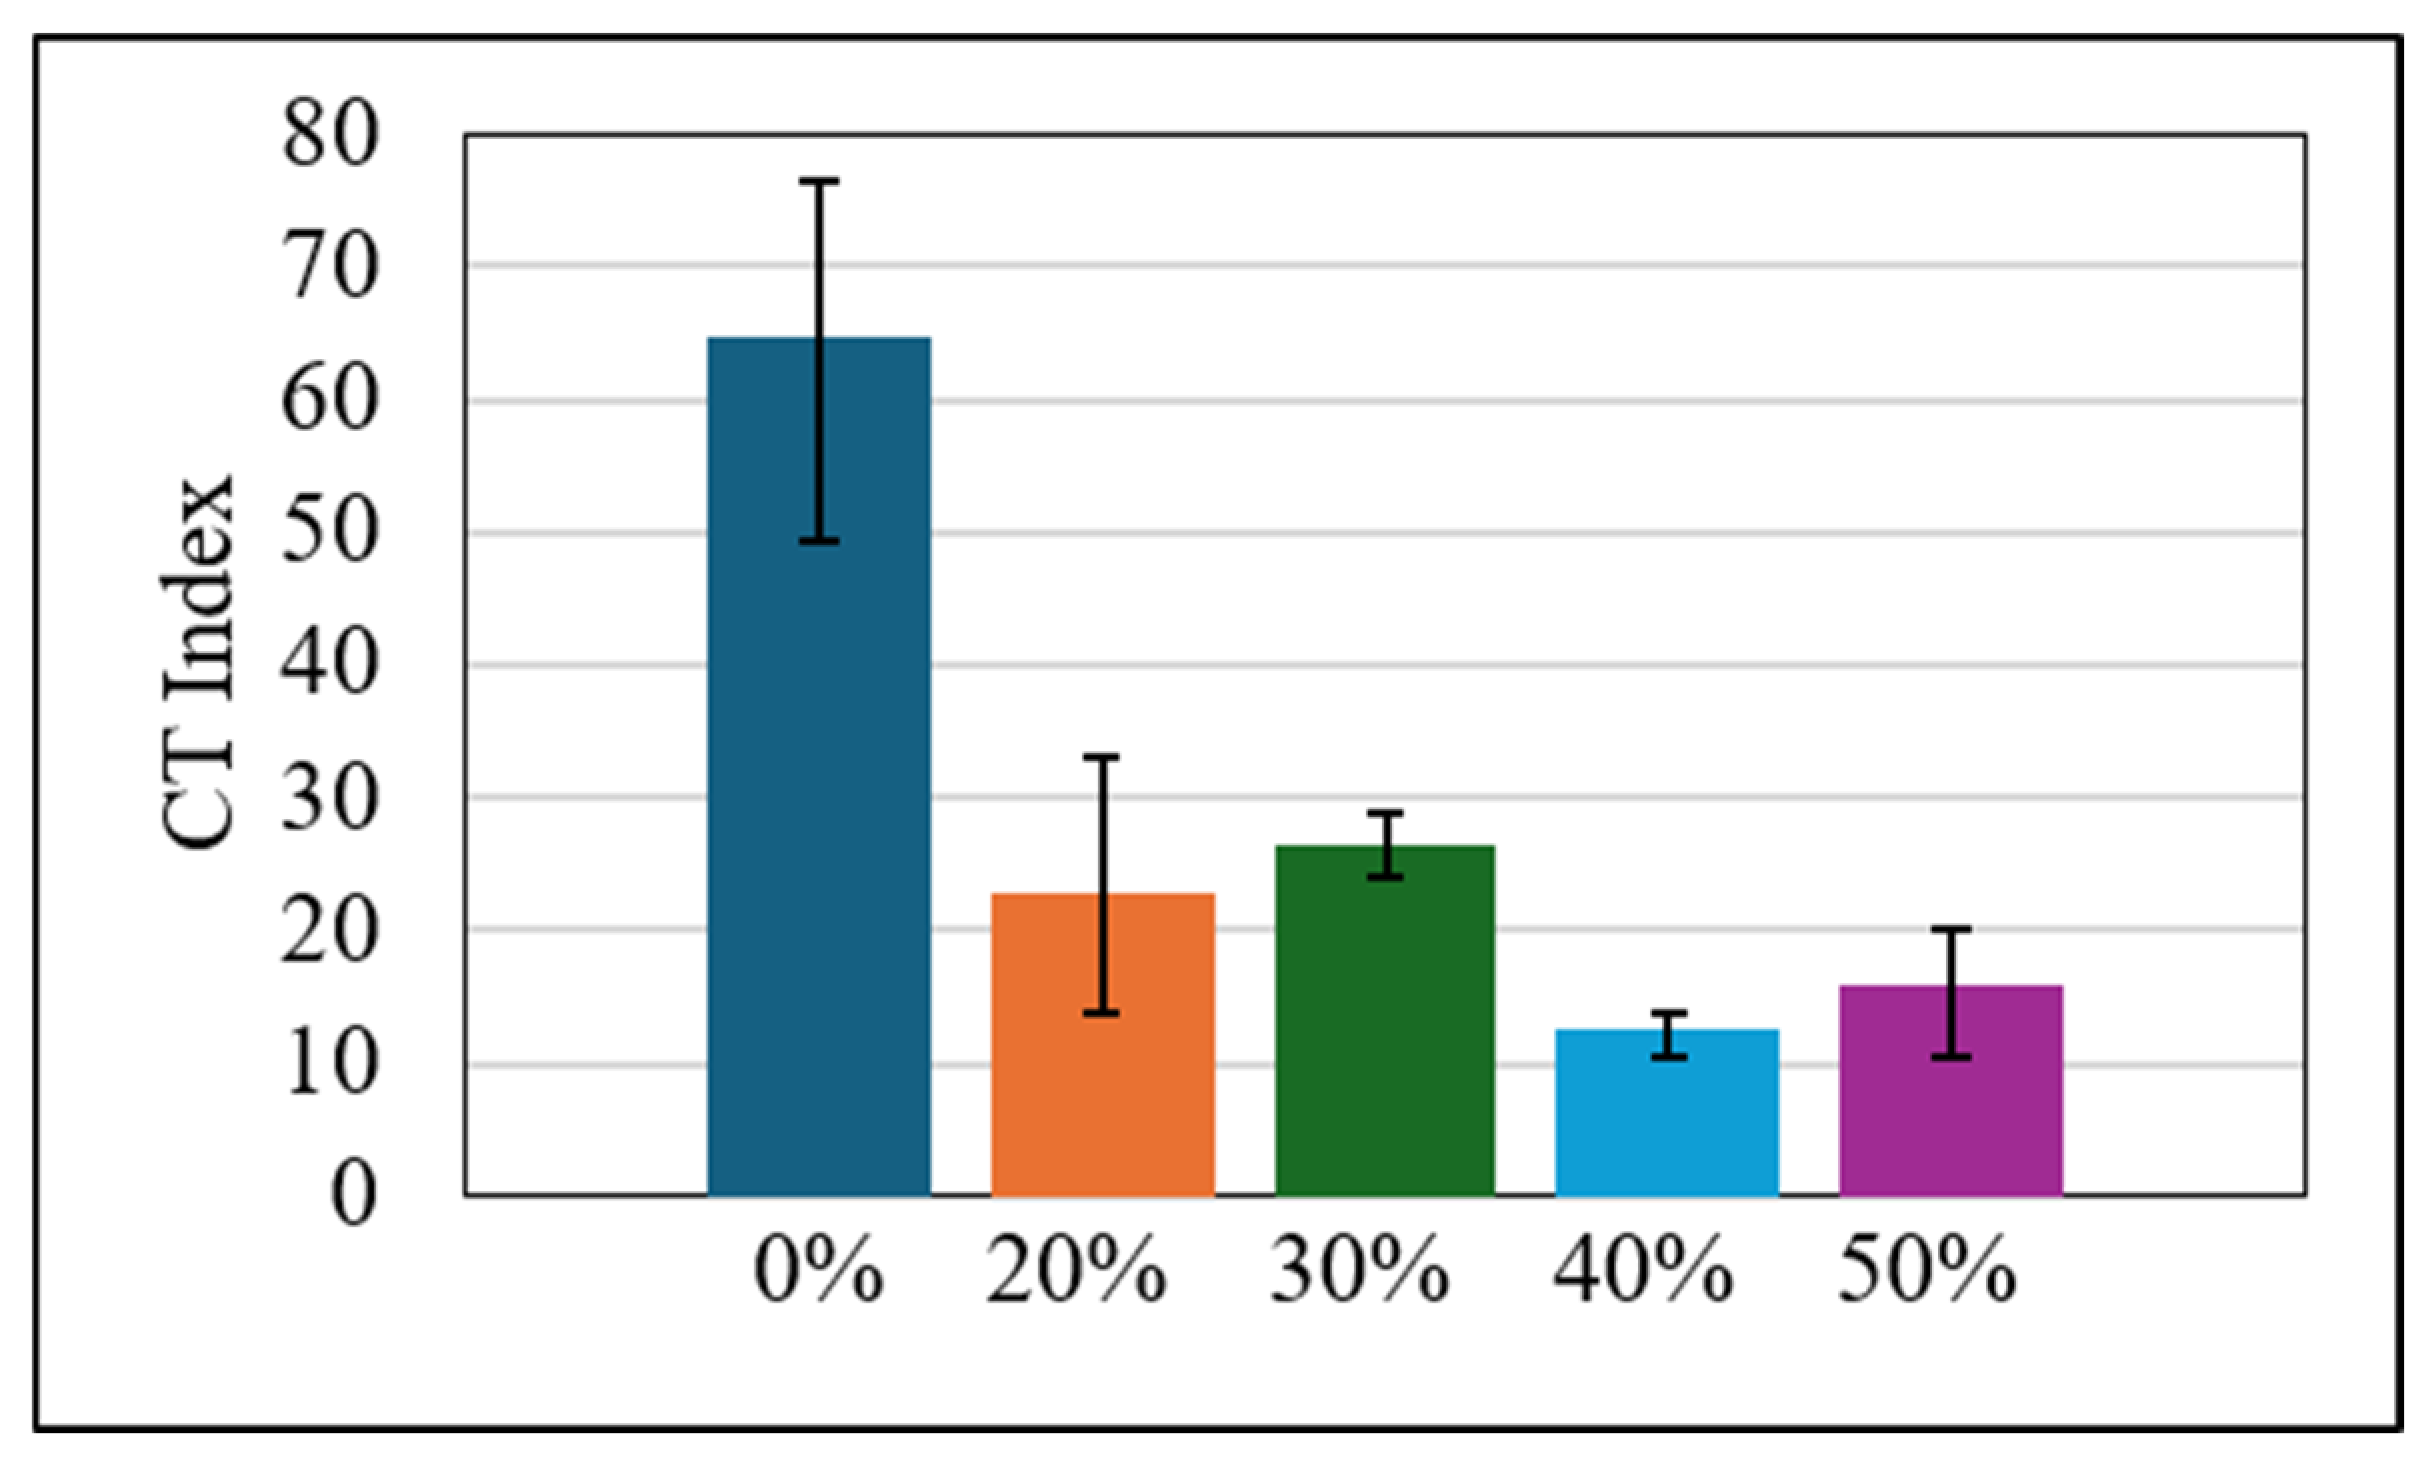
The average CT indices of the control mixtures with five RAP contents (0%, 20%, 30%, 40% and 50%) are shown in Figure 6 with an error bar indicating the standard deviation. Similar to the SCB-IFIT test results, as the amount of RAP content in the specimen increased, the CT index decreased. This result indicates that the addition of higher amounts of RAP materials significantly lowers the cracking resistance compared to specimens with 0% RAP.
Figure 6.
CT indices of the control mixtures with different RAP contents.
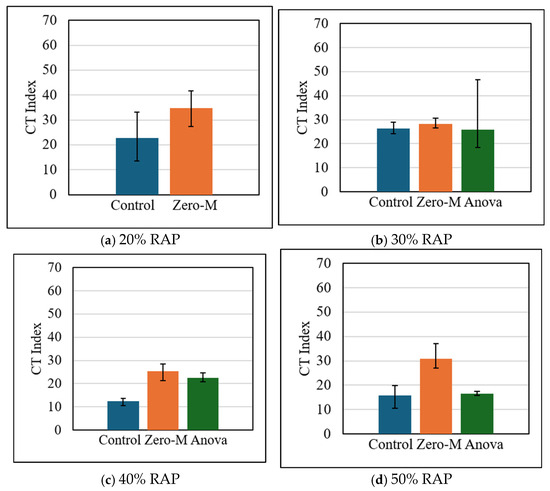
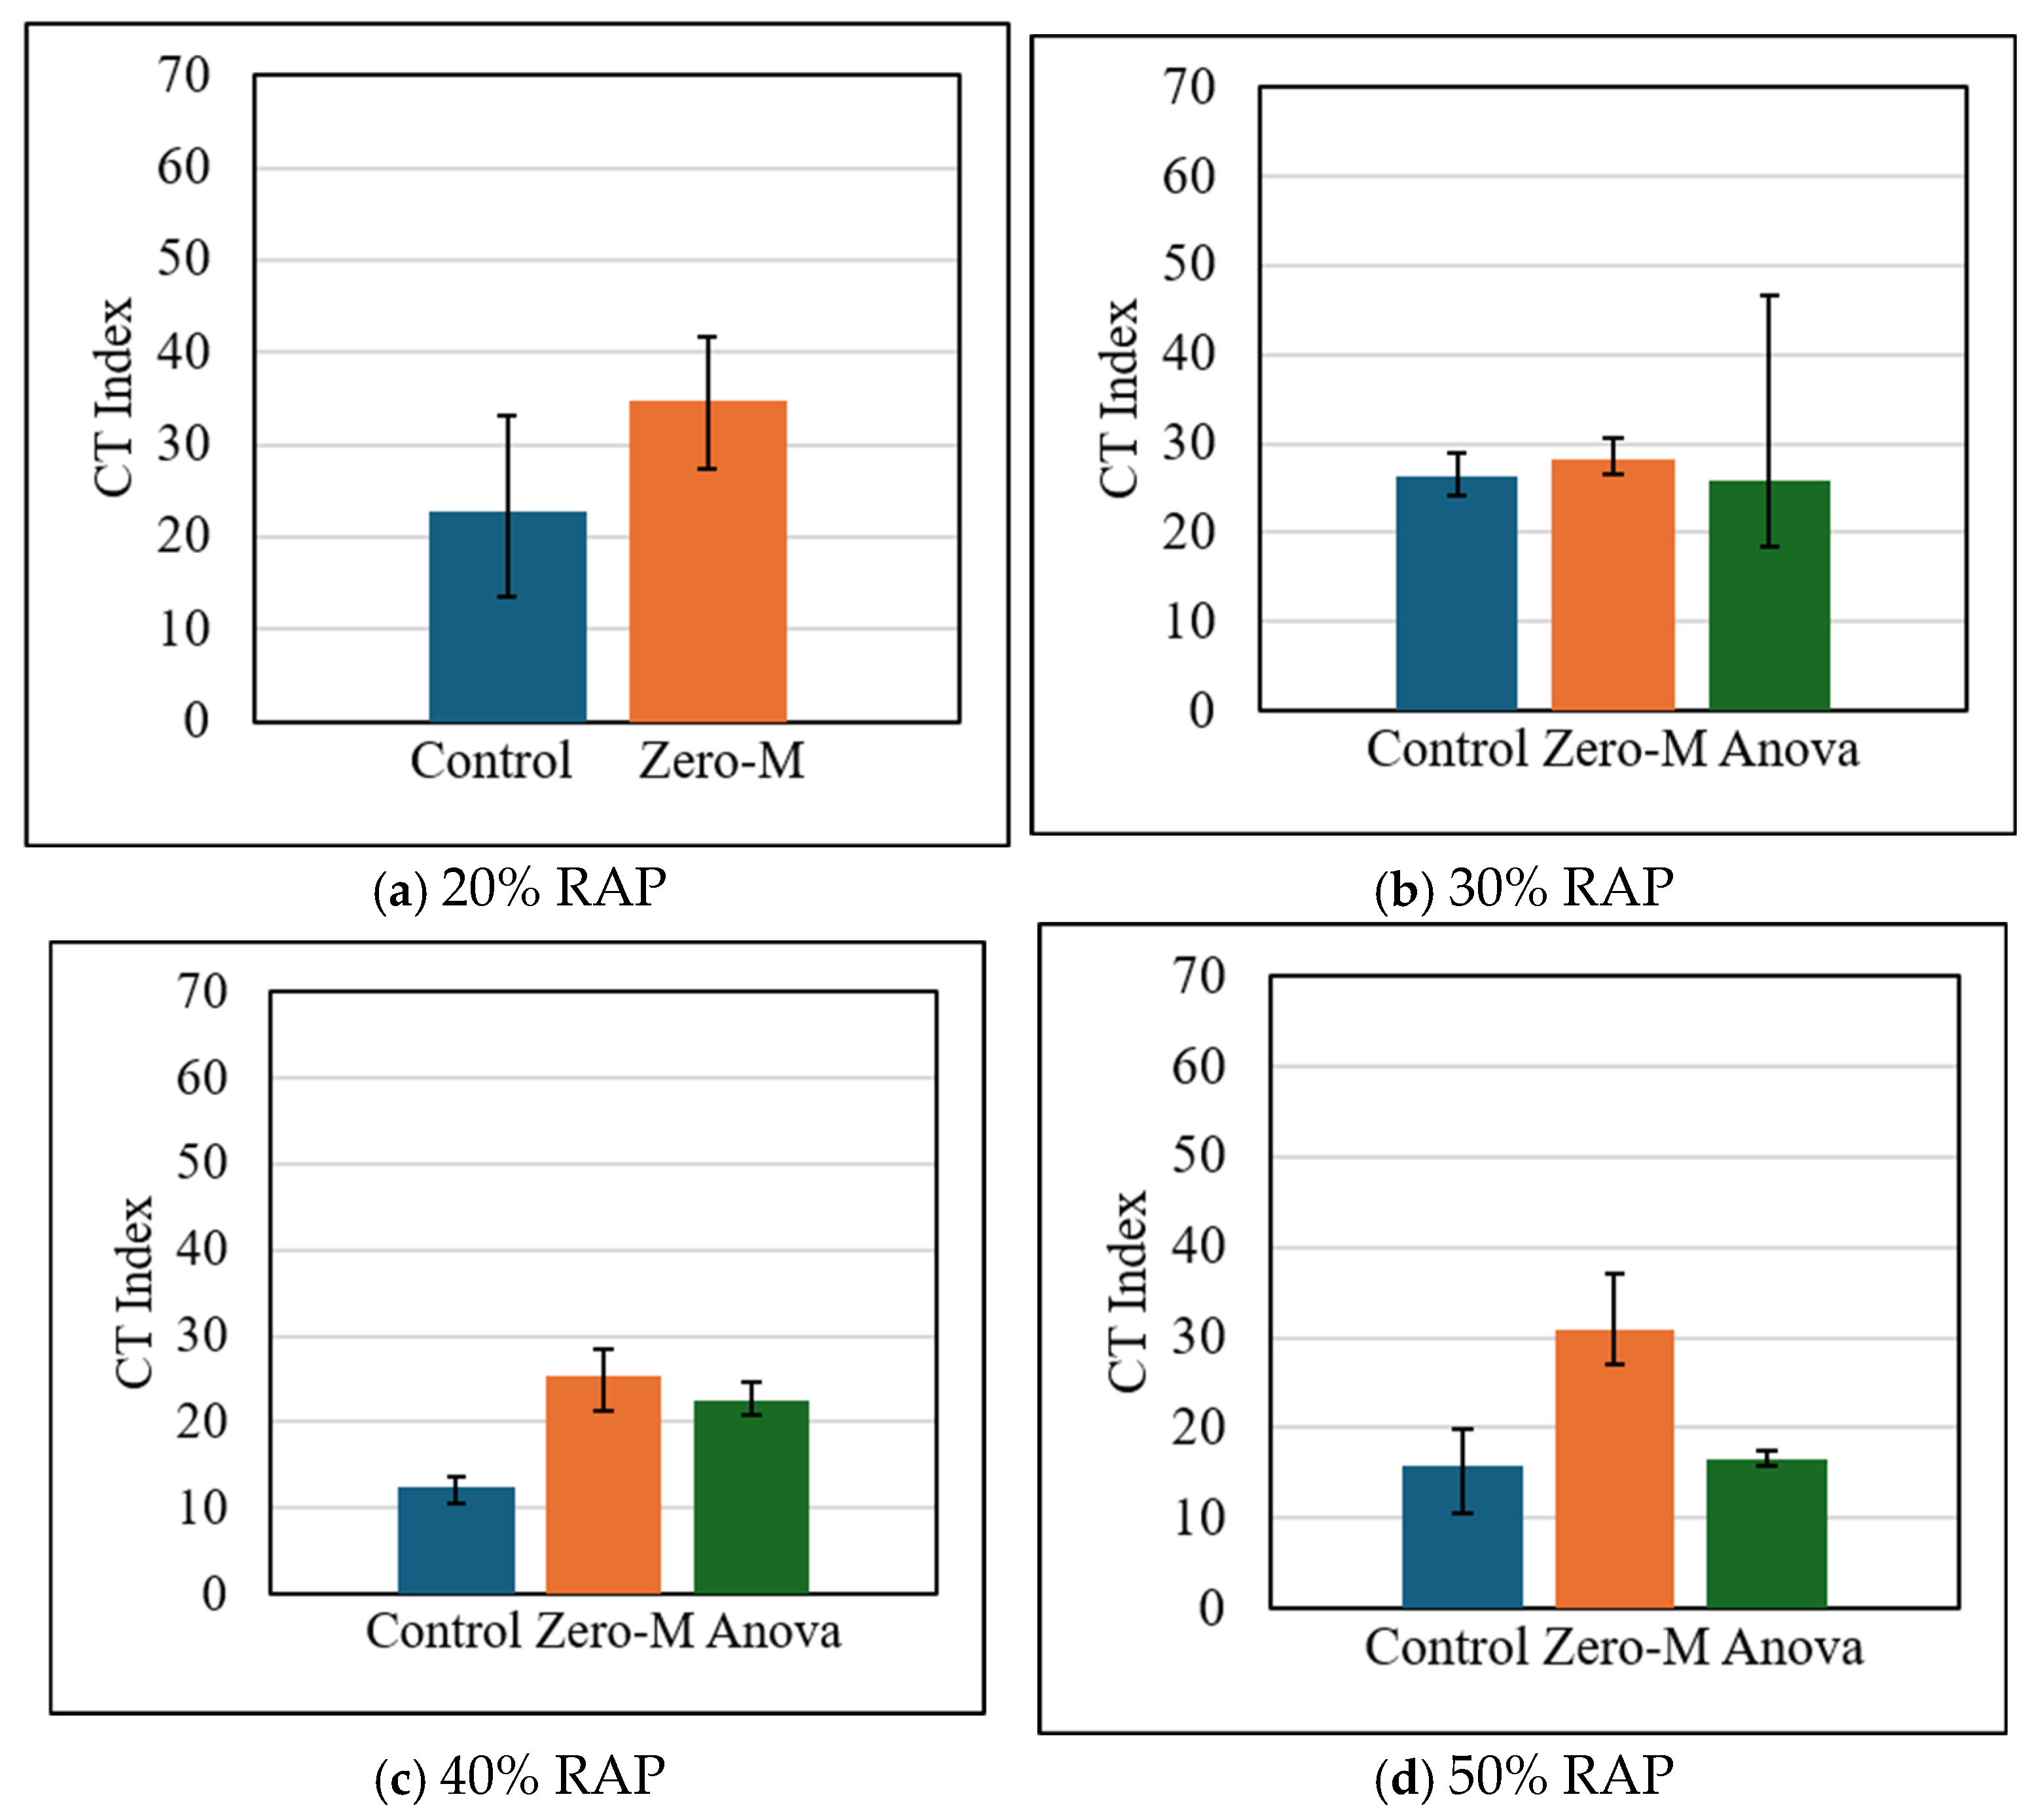
The average CT indices of the control mix and two additives with 20%, 30%, 40% and 50% RAP materials are shown in Figure 7. For all RAP contents except 30% RAP, Zero-M additive significantly improved cracking resistance. However, similar to the results from SCB-IFIT tests, the Anova additive improved cracking resistance for the mixtures with 40% RAP materials while slightly improving those with 50% but did not improve those with 30% RAP materials. These results indicate the IDEAL-CT test protocol produced a similar trend as the SCB-IFIT test protocol.
Figure 7.
CT indices of mixes (control, Zero-M, Anova) with different RAP contents.
4.3. Hamburg Wheel Tracking Test Results
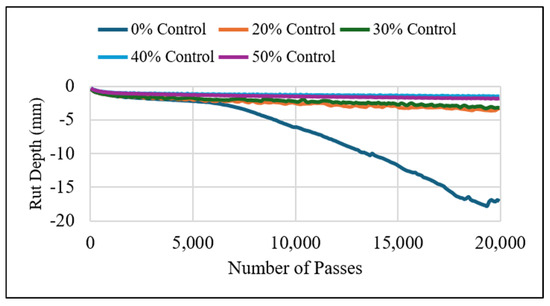
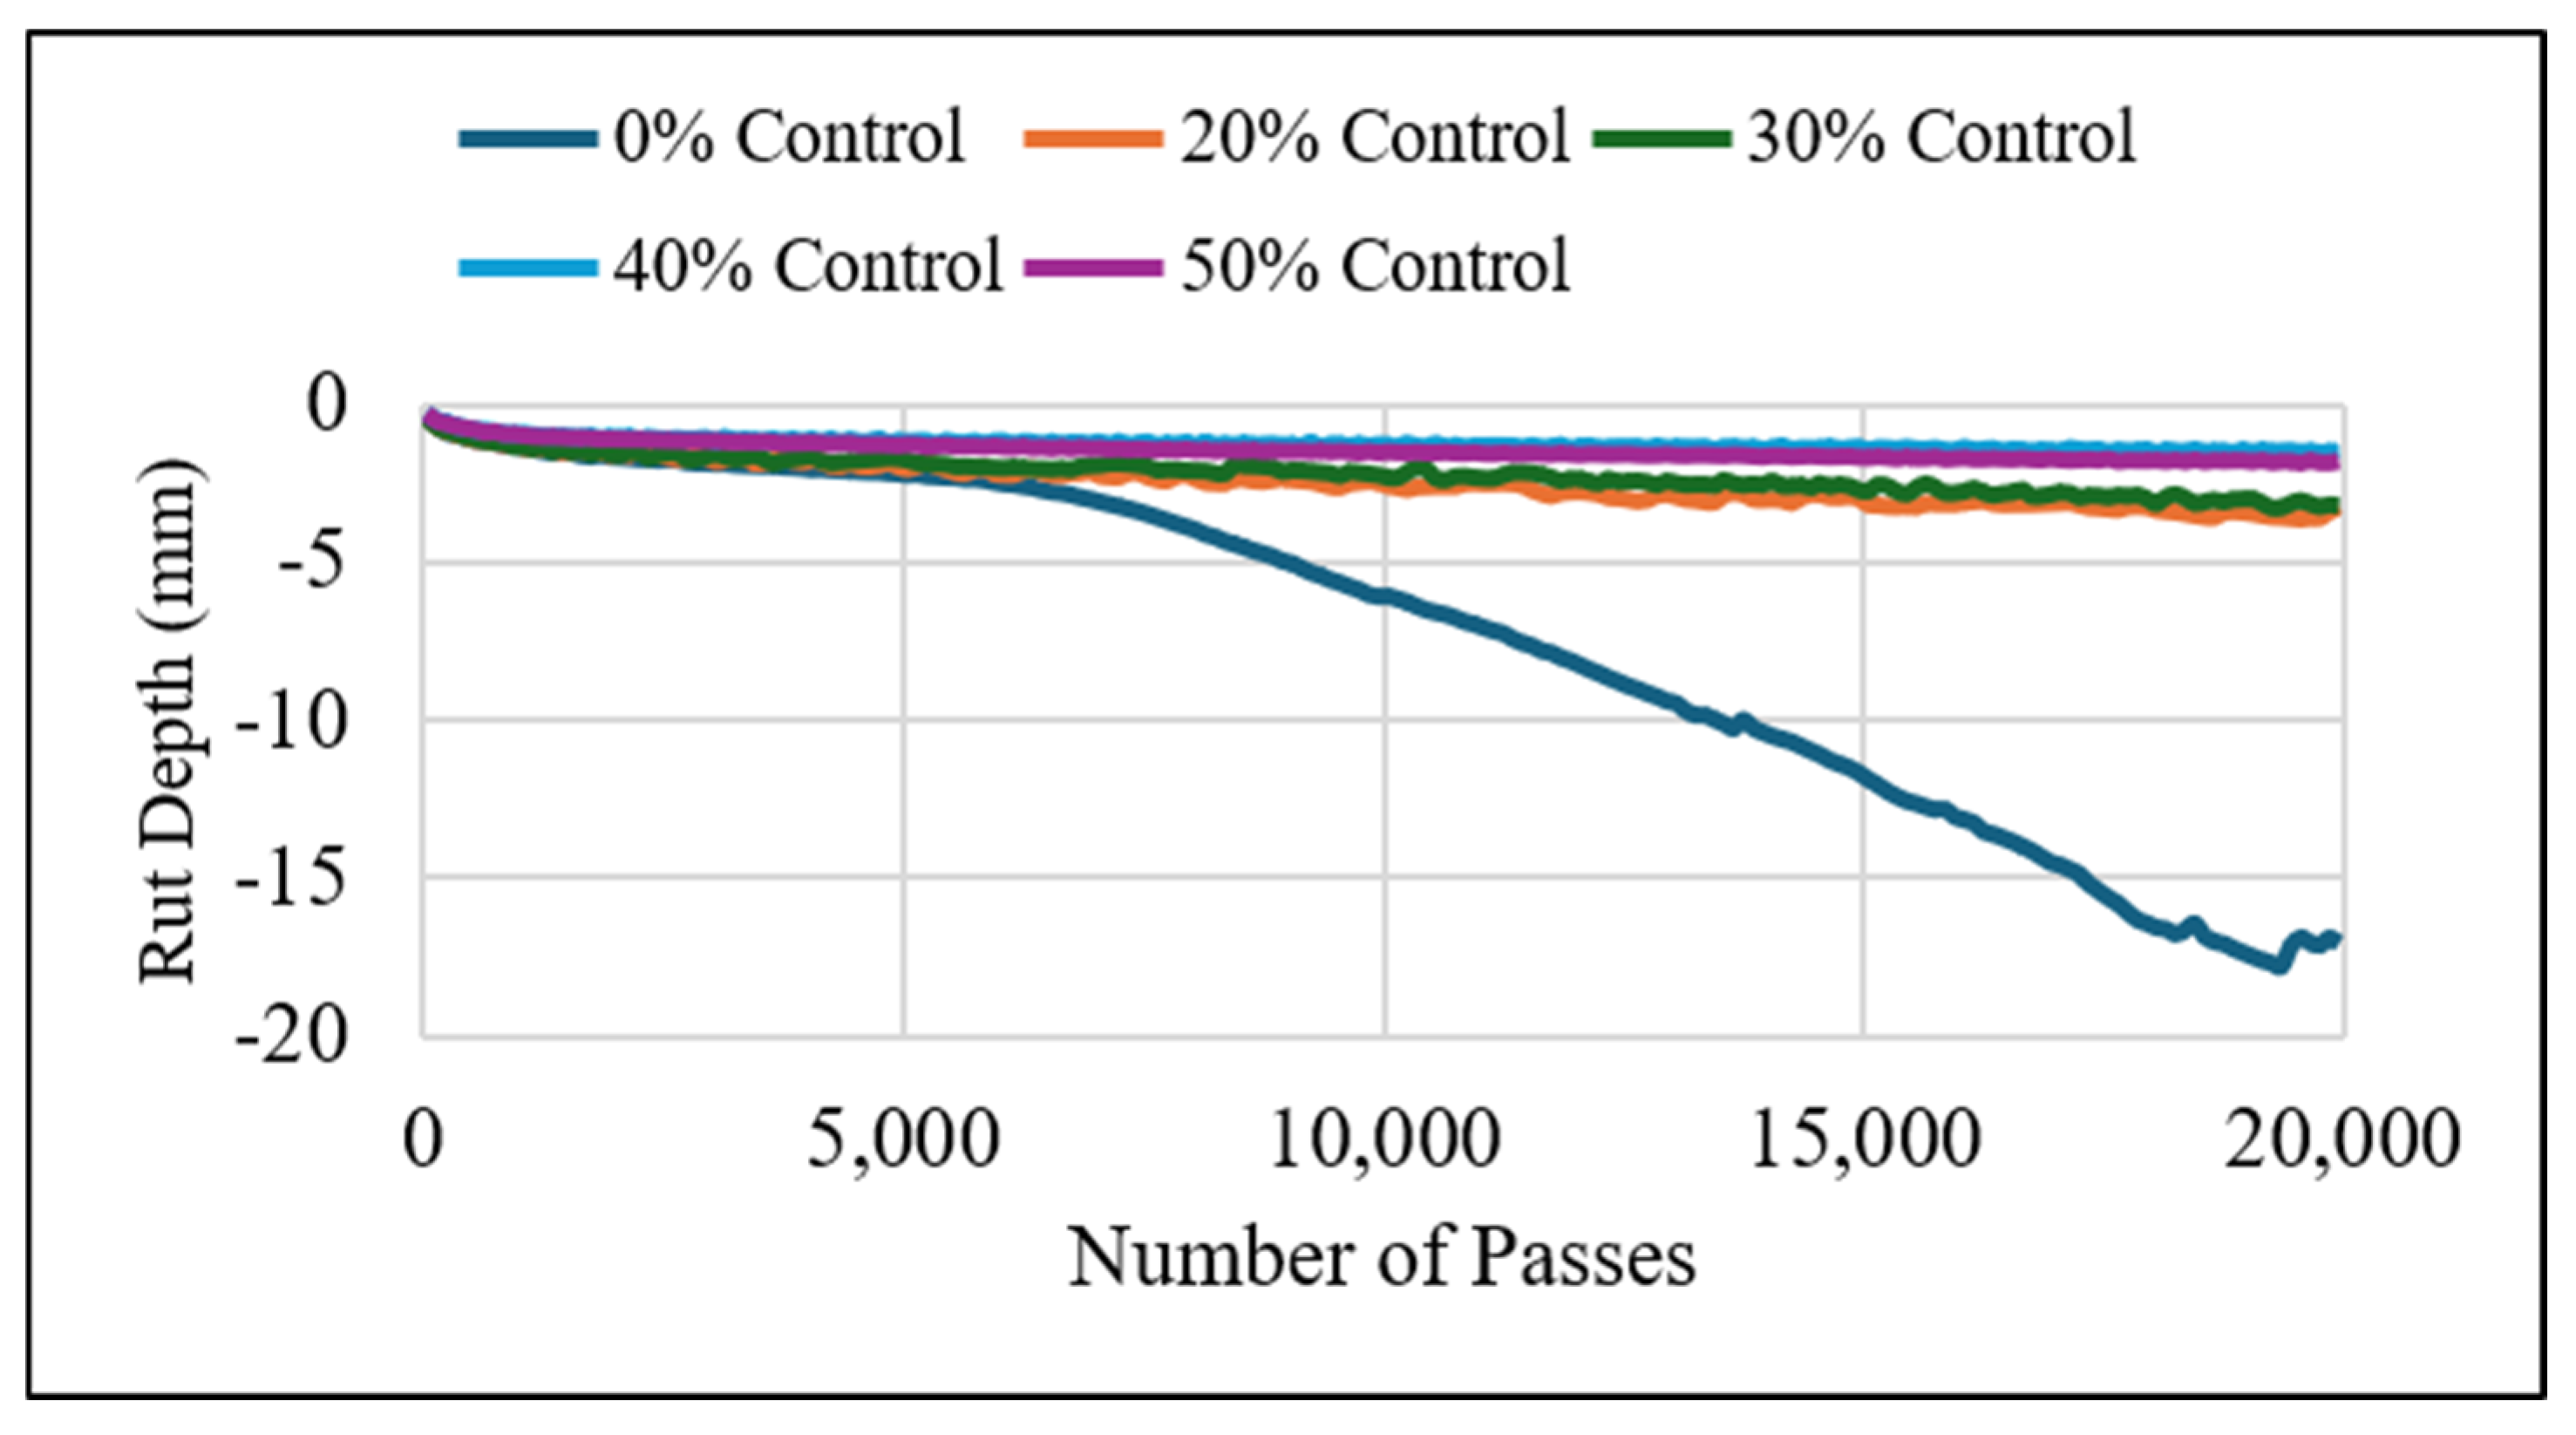
The Hamburg wheel tracking test was performed three times for each combination of RAP content and additive. As shown in Figure 8, the average rut depths developed in the control mixtures with five different RAP contents (0%, 20%, 30%, 40% and 50%) are plotted against 20,000 passes. Contrary to both SCM-IFIT and IDEAL-CT test results, the amount of RAP content was beneficial in reducing the rut depth. This result indicates the addition of higher amounts of RAP materials improved the rutting resistance compared to specimens with 0% RAP.
Figure 8.
Comparison of rut depth vs. number of passes for control specimens.
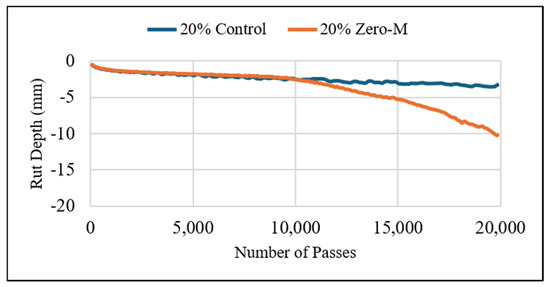
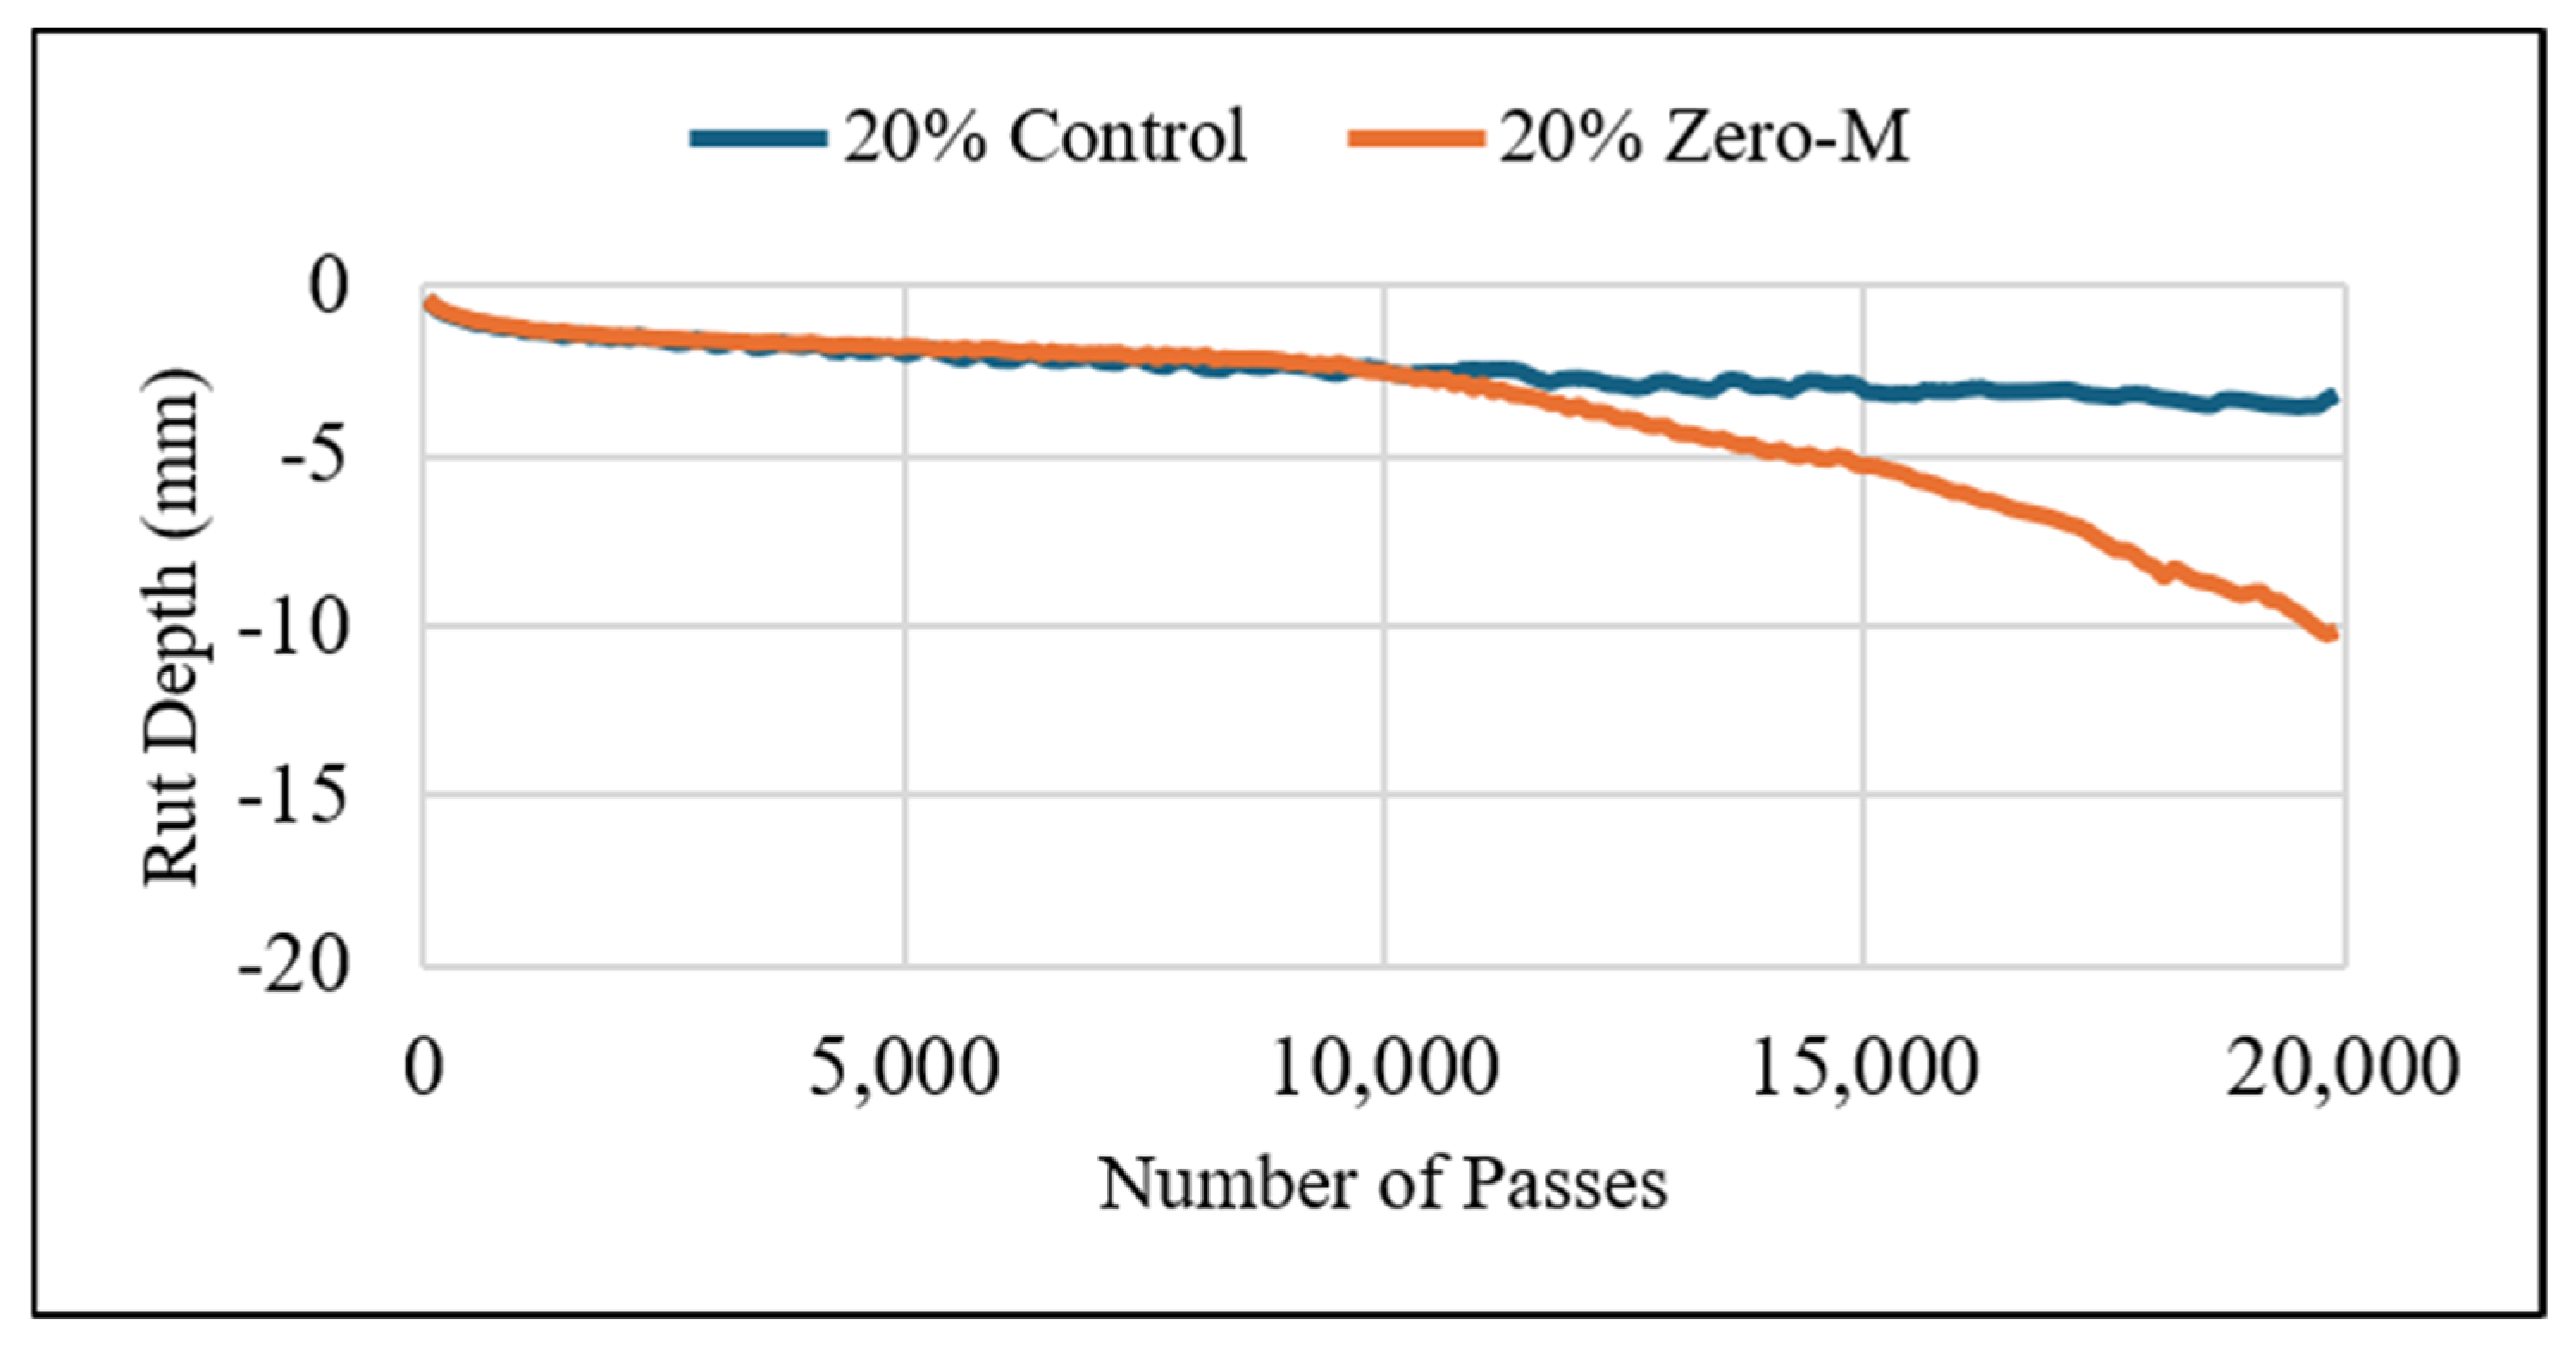
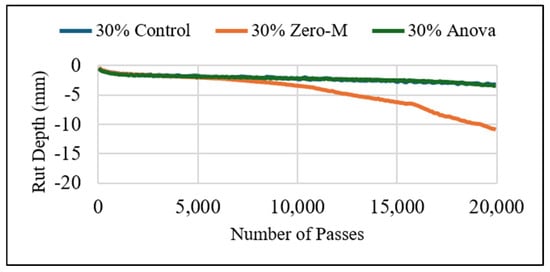
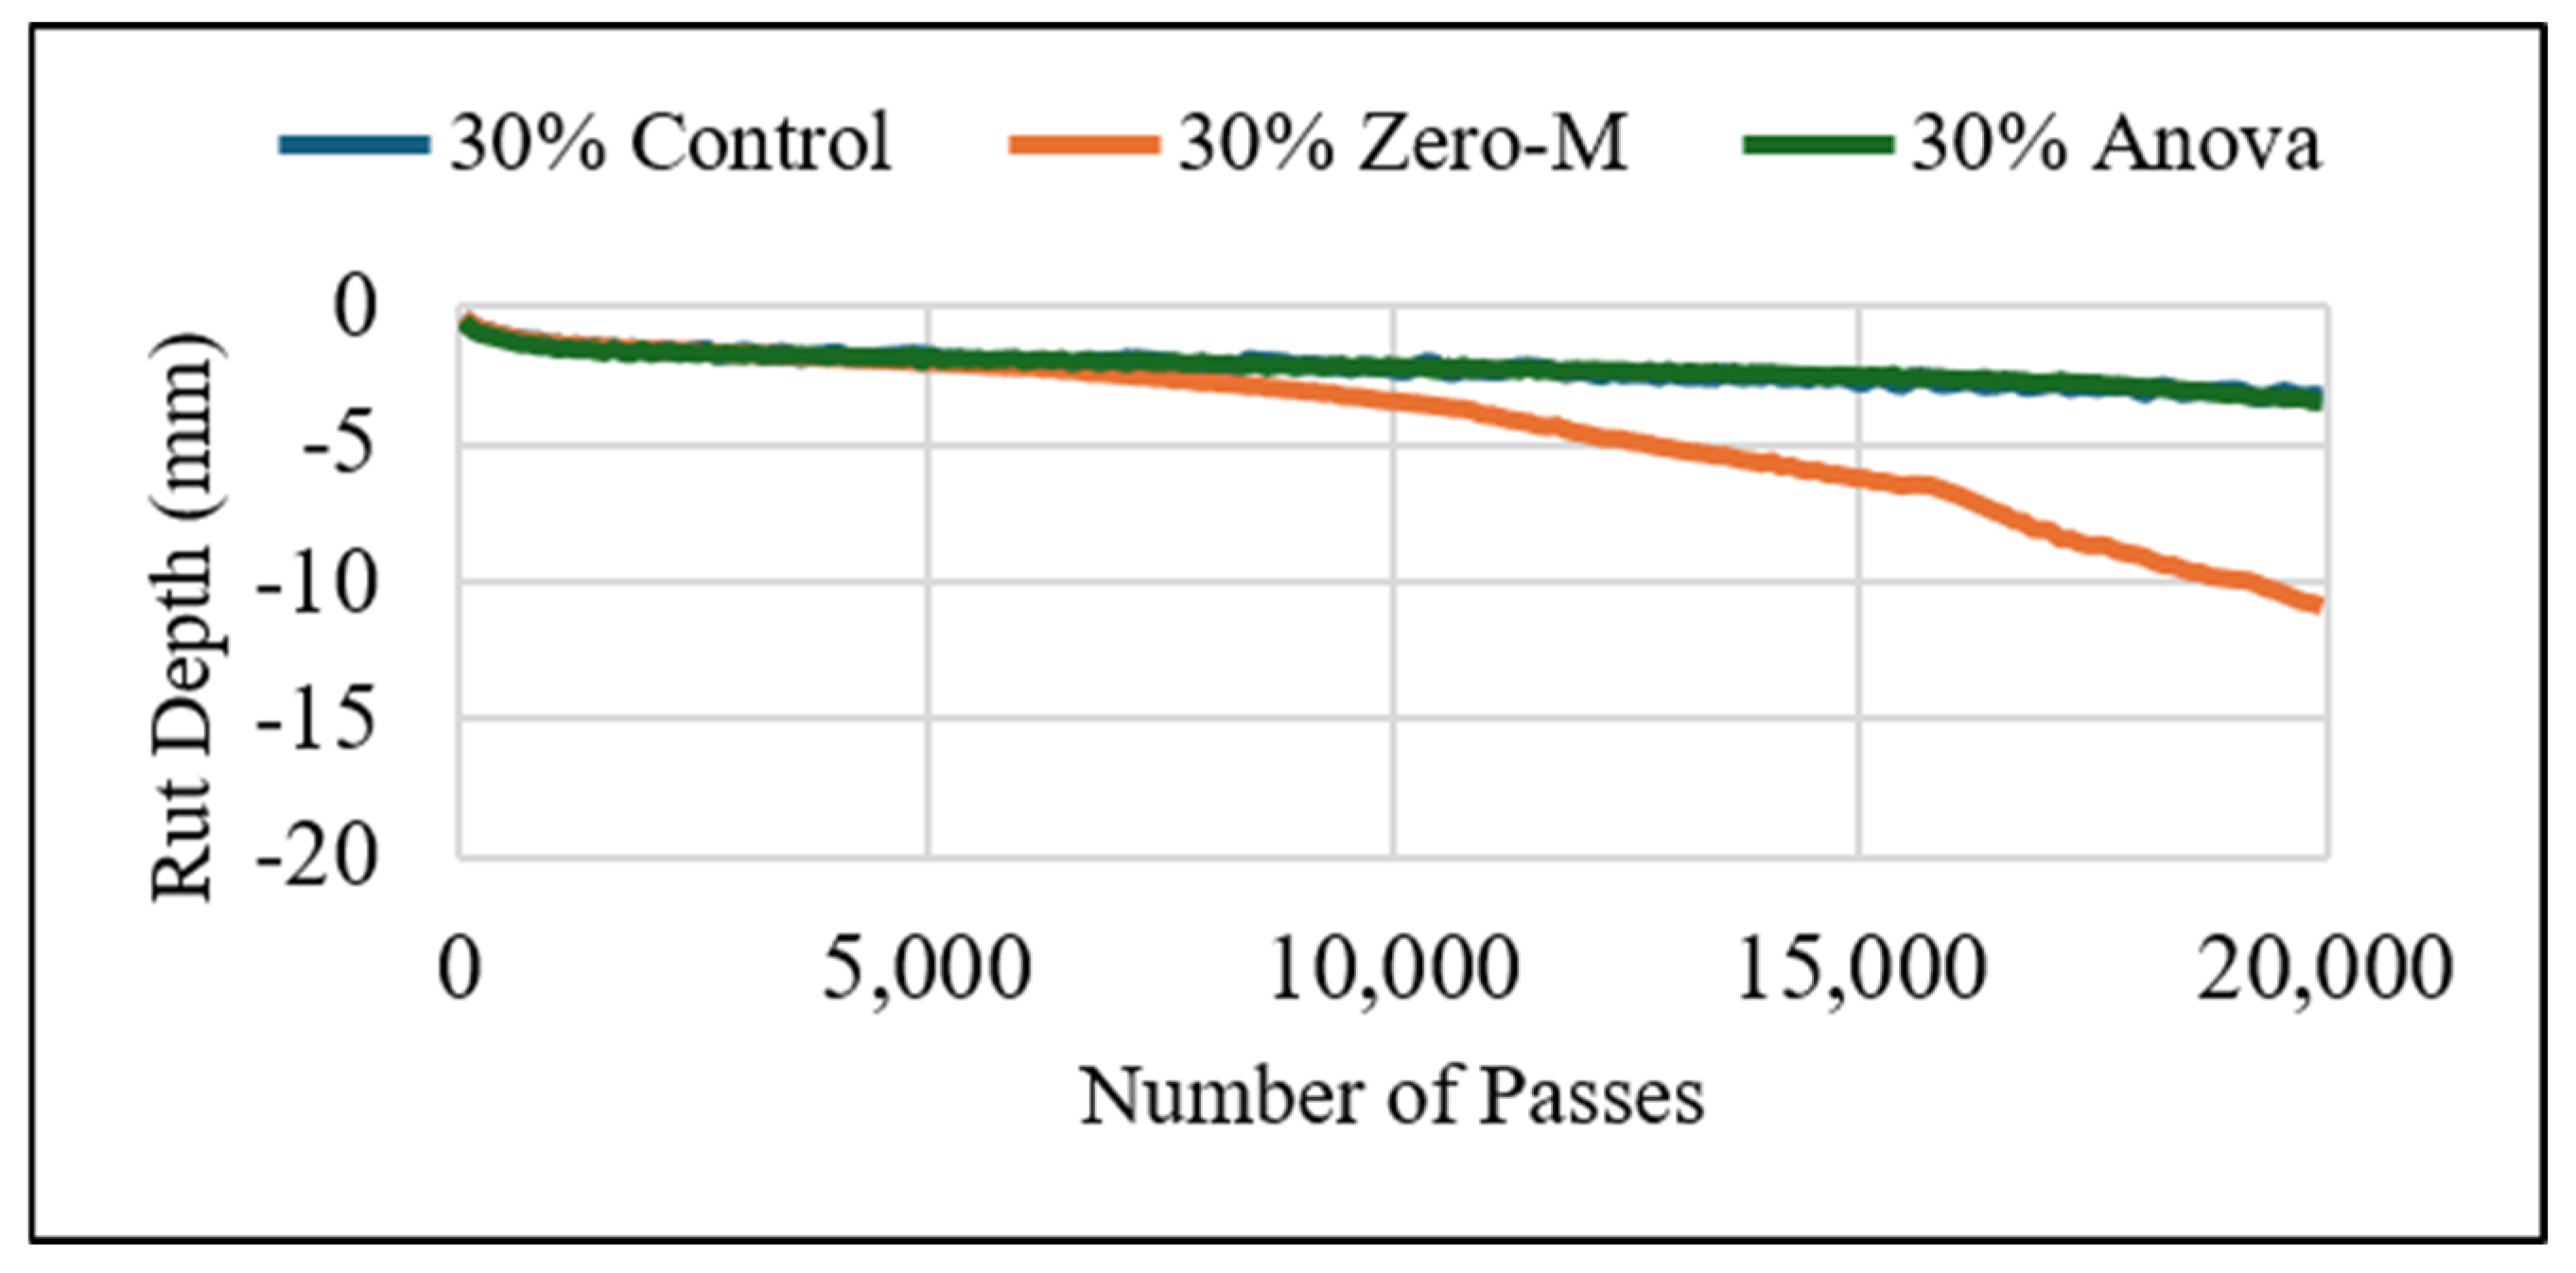
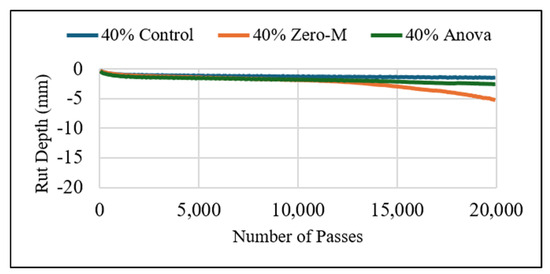
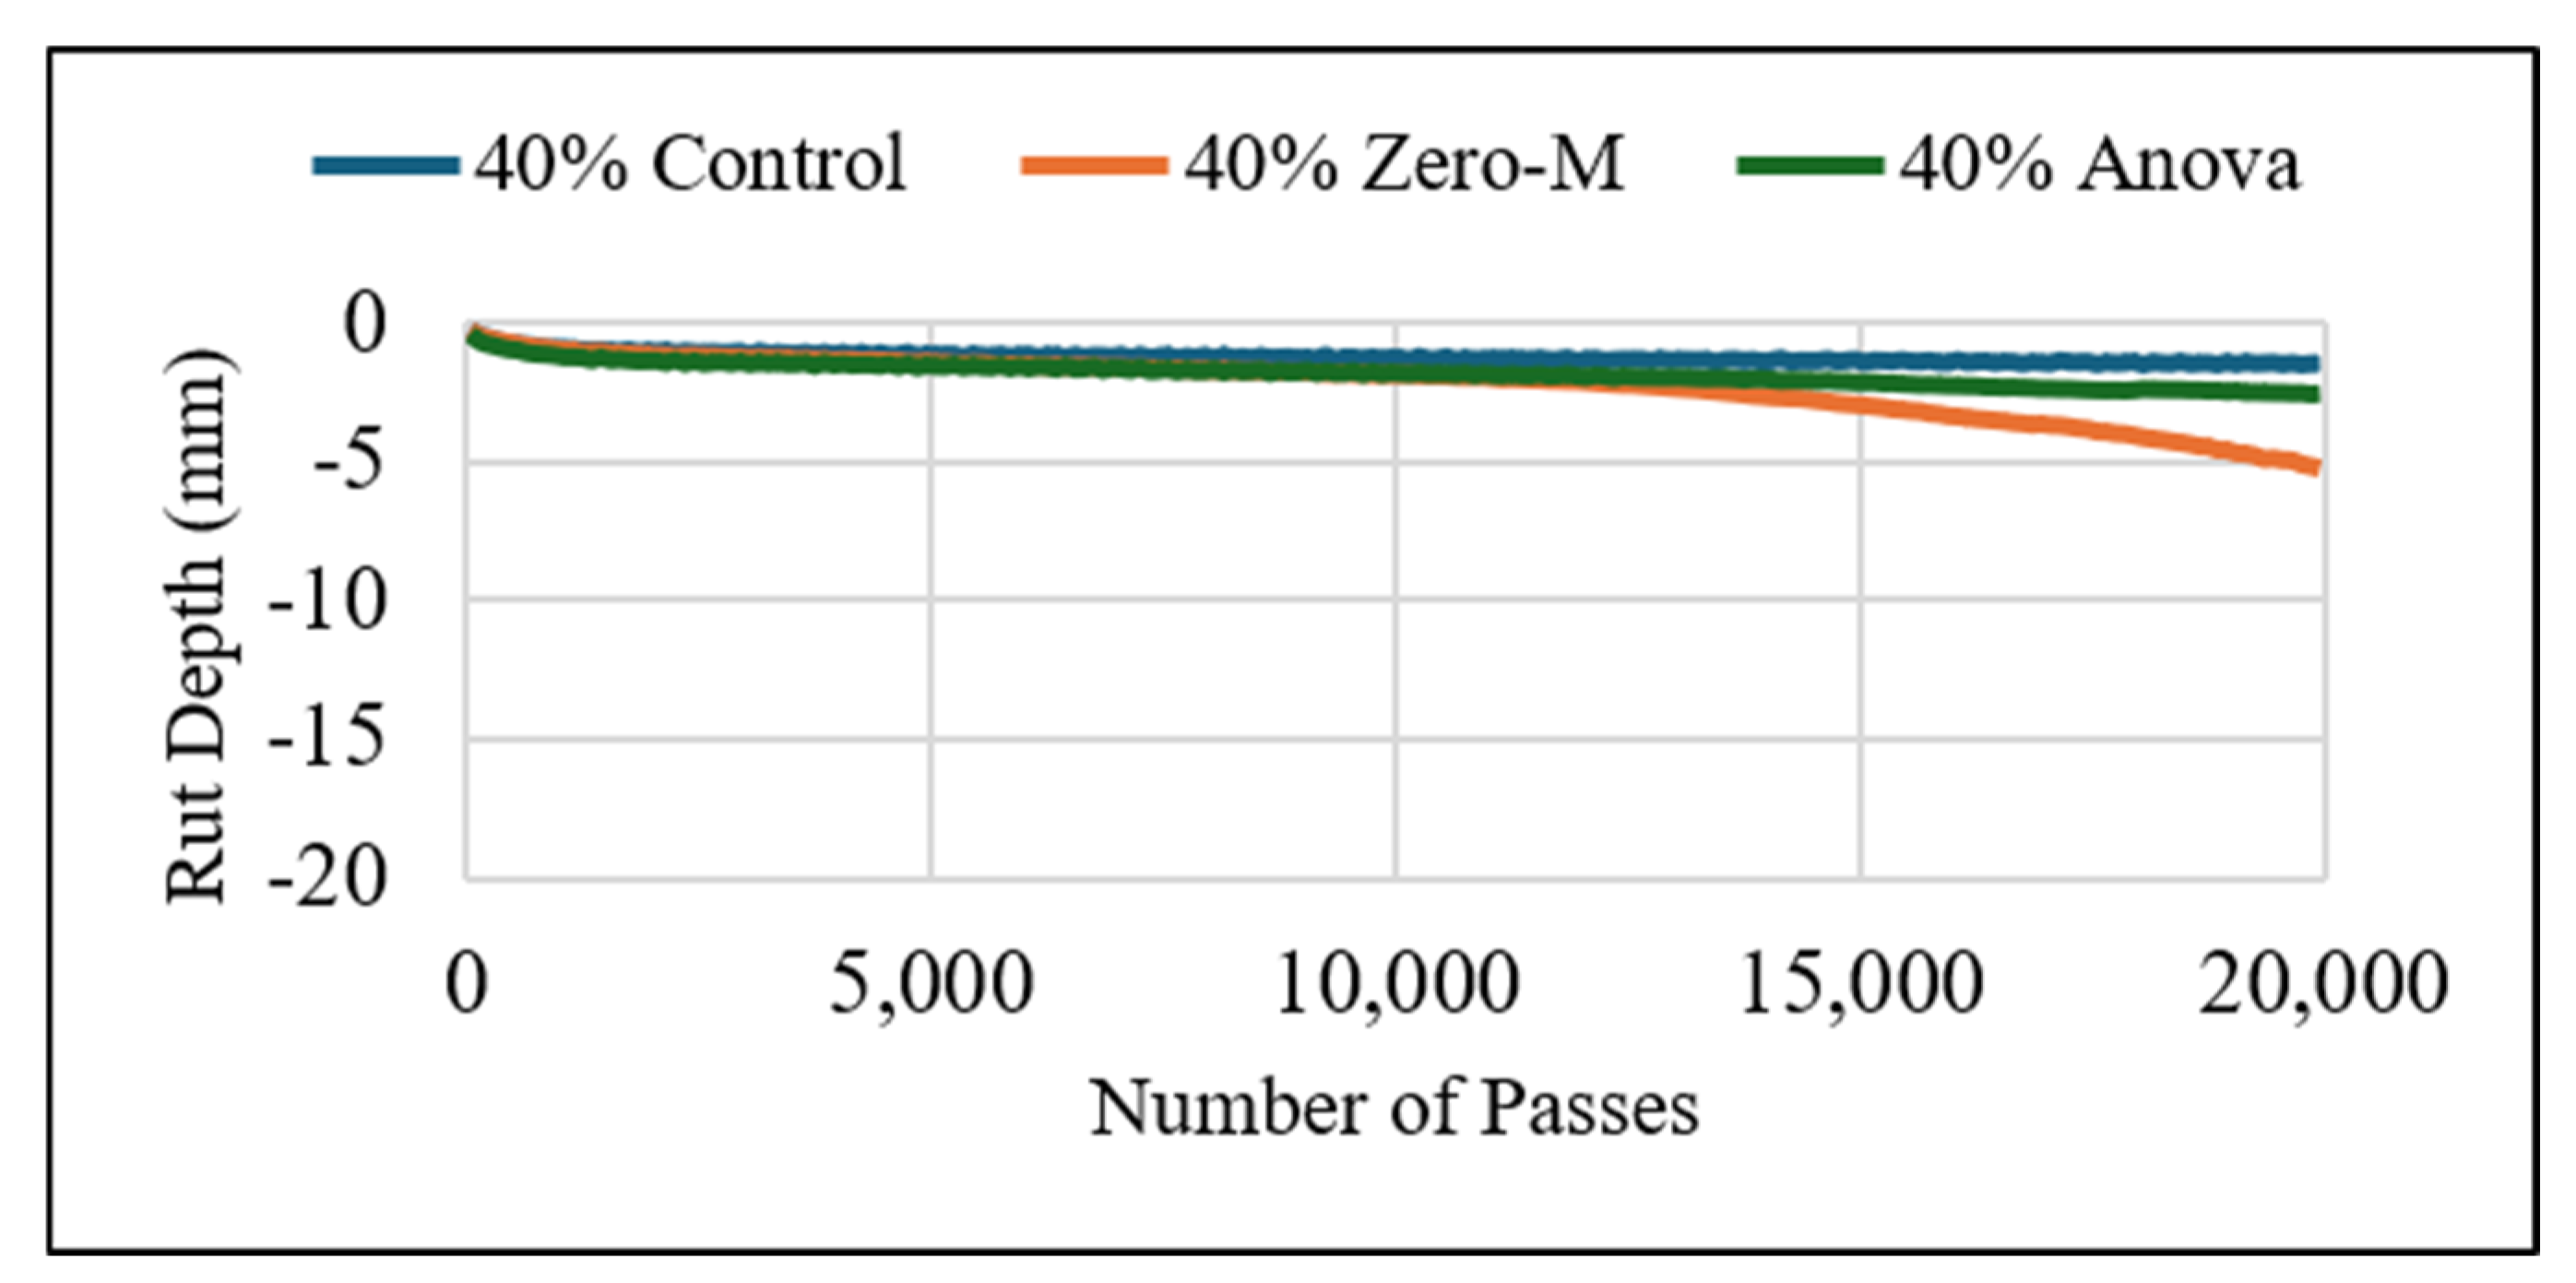
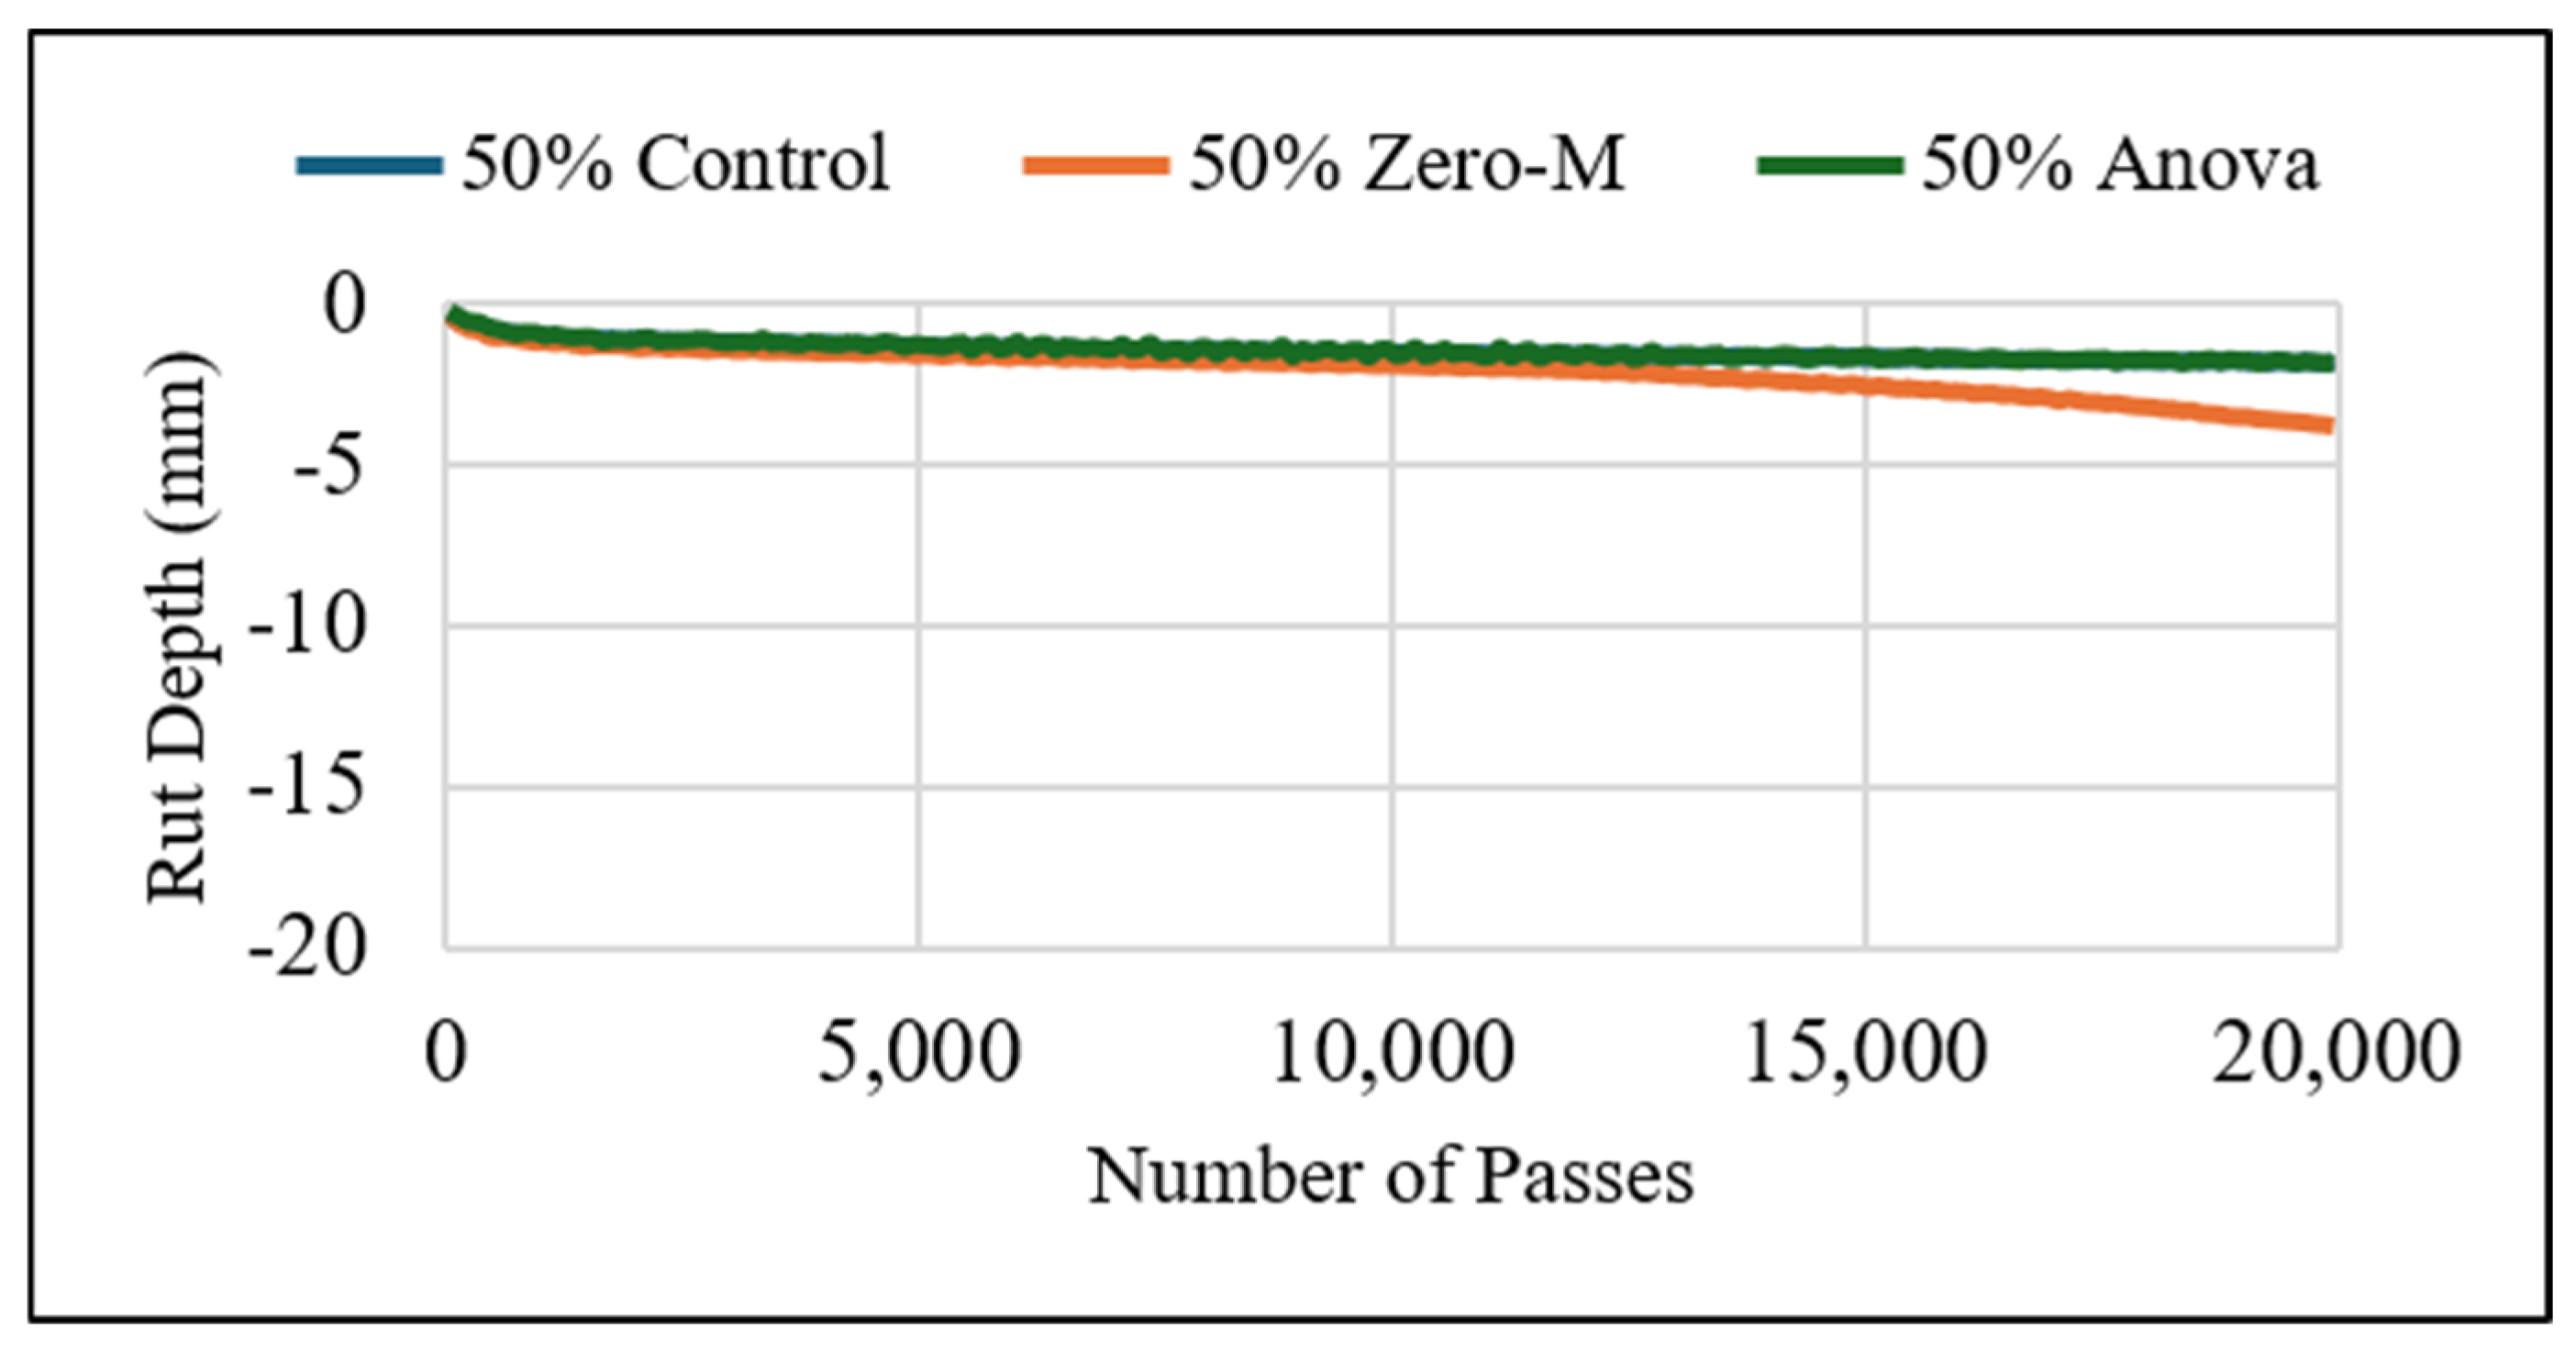
The average rut depths of the control mixtures and two additives with 20%, 30%, 40% and 50% RAP materials are shown in Figure 9, Figure 10, Figure 11 and Figure 12, respectively. For all RAP contents, compared to the control mixtures, the Anova additive exhibited a similar level but the Zero-M additive significantly increased the rut depth. It can be postulated that the Zero-M additive softens the RAP materials, which led to the increased rut depth.
Figure 9.
Plot of rut depth of mixtures with 20% RAP over number of passes.
Figure 10.
Plot of rut depth of mixtures with 30% RAP over number of passes.
Figure 11.
Plot of Rut Depth of Mixtures with 40% RAP over Number of Passes.
Figure 12.
Plot of rut depth of mixtures with 50% RAP over number of passes.
5. Comparison of SCB-IFIT and IDEAL-CT Test Results
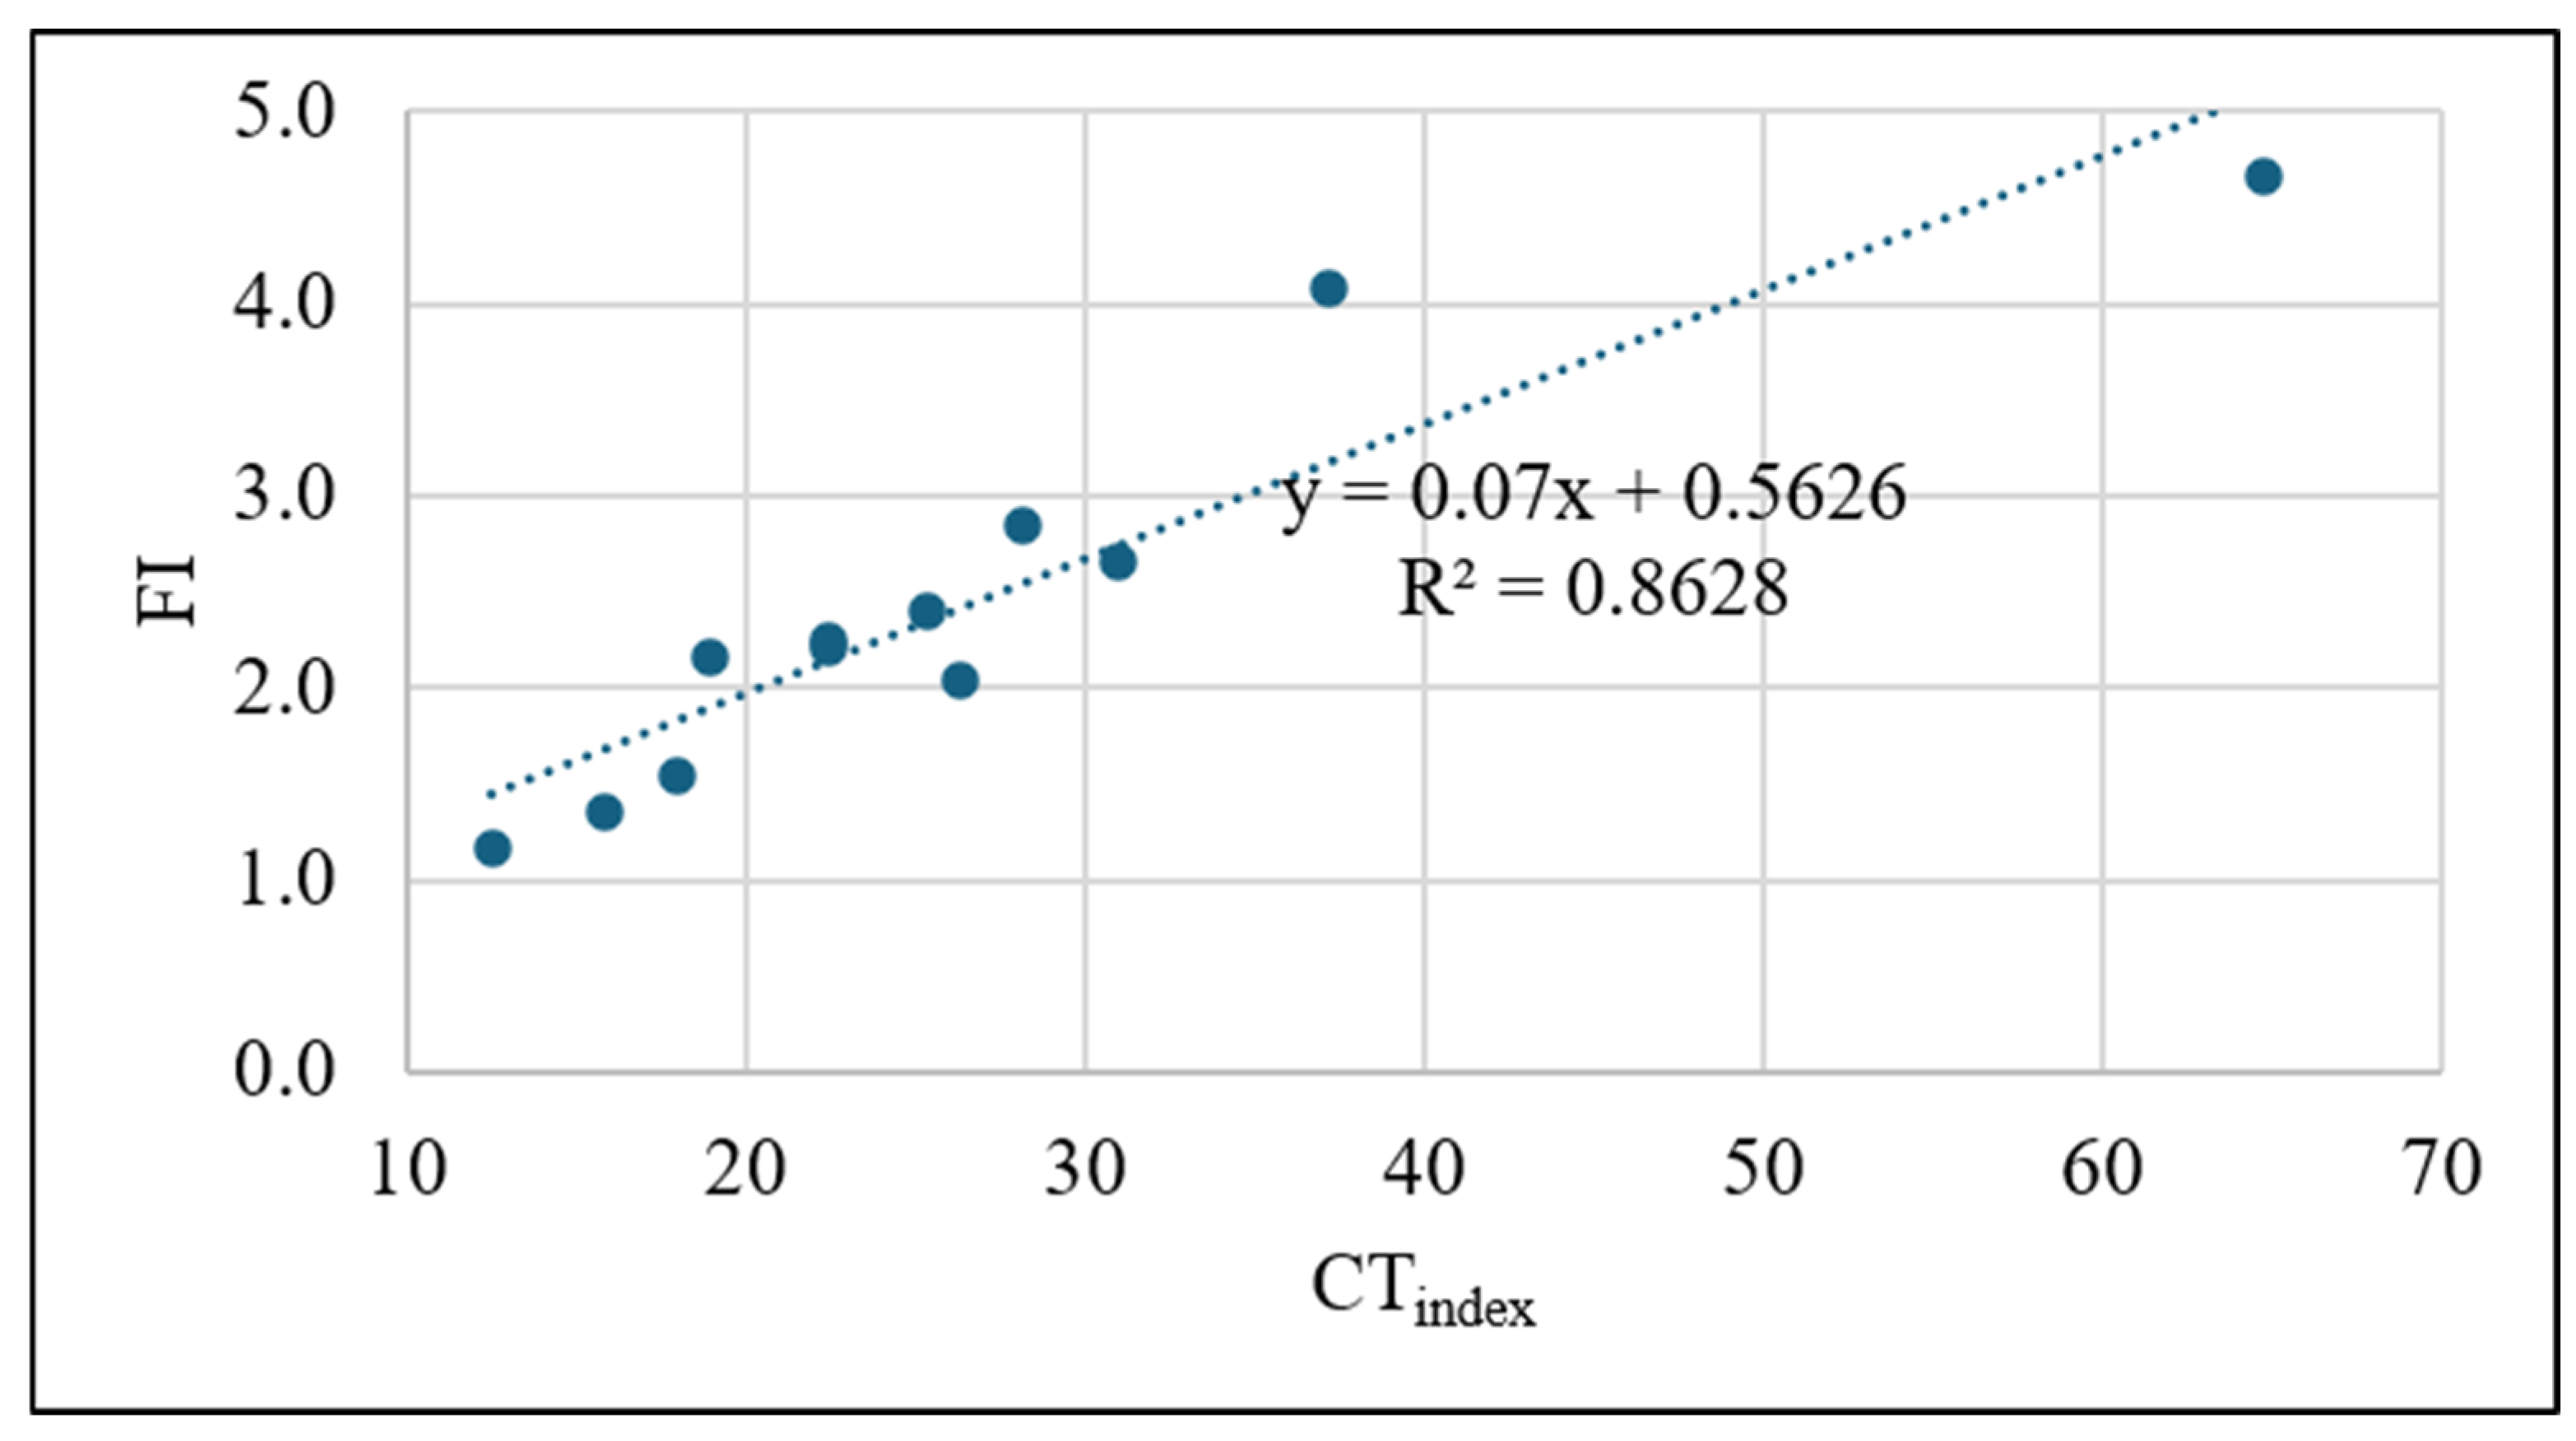
It was previously reported that the FI value and the CT index exhibited a positive Pearson coefficient of 0.562 [10]. As shown in Figure 13, FI values from the SCB-IFIT test are plotted against CT indices from the IDEAL-CT test. As can be seen from Figure 13, there is a significant correlation (R2 value of 0.86) between the CT indices and FI values, which is significantly higher than 0.562 [10].
Figure 13.
Significant correlation between CT indices and FI values.
To determine the consistencies of the results from SCB-IFIT and IDEAL-CT tests, the coefficient of variation (COV) for each set of data was calculated using the following equation:
where
the sample standard deviation
the average
The COV is a measure of variability, which is a normalized standard deviation. First, to compare the consistency of SCB-IFIT data against that of IDEAL-CT data, the COV of FI values and the COV of CT indices were computed for each category. The average value of all COV values for each test protocol was then calculated. The COV of FI values and the COV of CT indices for each category are summarized in Table 5 and Table 6, respectively. Our study result is identical to [10], which reported the average COV value of FI values as 25% with a range from 10% to 45%.
Table 5.
Coefficient of variation in FI values for each of all samples tested.
Table 6.
Coefficient of variation in CT indices for each of all samples tested.
Overall, as can be seen from the above tables, the COV of CT indices is significantly lower than the COV of FI values. Therefore, due to its low COV value with a high correlation with the SCB-IFIT test and a simple specimen preparation procedure, it is recommended that IDEAL-CT should be adopted as a standard cracking test protocol.
6. Summary and Conclusions
This paper discusses the laboratory evaluation of (1) Zero-M additive (dosage rate of 10% of total binder) added at the aggregate temperature of 110 °C and (2) Anova additive (dosage rate of 5% of RAP binder) added at the aggregate temperature of 135 °C with RAP materials up to 50%. Asphalt mixtures with 0%, 20%, 30%, 40%, and 50% RAP materials with no additive, Zero-M and Anova additives were evaluated for both rutting and cracking. To identify the effect of these two additives (Zero-M and Anova) on the rutting and cracking potential of the asphalt mixtures up to 50% RAP materials, the Hamburg wheel tracking test and SCB-IFIT and IDEAL-CT tests were performed.
Overall, as the RAP contents are increased, the rutting resistance increased, but the cracking resistance decreased. Based on the Hamburg test results, the rutting resistance significantly increased by adding 20% RAP but did not increase the rutting resistance any further when RAP increased from 20% to 50%. However, the increase in RAP content exhibited a negative impact on cracking resistance by lowering the Flexibility Index (FI) based on the SCB-IF test by 50% or more and the CT Index (CTindex) based on the IDEAL-CT test by 60% or more.
In our study, Zero-M additive at a dosage rate of 10% significantly increased cracking resistance but significantly decreased rutting resistance. Compared to the control specimens without additive, Zero-M additive increased FI and CTindex by 50 percent except for the CTindex of the 30% RAP mix. However, Zero-M additive increased the rut depth from 3 mm to 10 mm for both 20% and 30% RAP mixes after 20,000 repetitions but for 40% and 50% RAP contents, the rutting was less than 5 mm.
Previously, Anova additive was shown to significantly improve the cracking resistance of the pavement [18]. However, in this study, Anova rejuvenator did not increase FI and CTindex of 30% and 50% RAP mixes but increased FI and CTindex of 40% RAP by 50 percent. The main difference between this study and that of [18] is that they used a dosage rate of 3% of the total binder content for the Anova, whereas our study used a dosage rate of 5% of the RAP asphalt content, which is significantly less than the dosage rate adopted by [18]. Overall, Anova additive produced a similar level of rutting as the rutting of the control mix. It can be concluded that Anova additive with a dosage rate of 5% of the RAP binder exhibited less pronounced effects on both cracking and rutting resistances.
There was a significant correlation (R2 value of 0.86) between the CT indices and FI values. However, the Coefficient of Variation (COV) of CT indices was significantly lower than that of FI values. In addition, the test sample preparation procedure of IDEAL-CT is simpler than that of SCB-IFIT. Therefore, due to its low COV value with a high correlation with the SCB-IFIT test and a simple specimen preparation procedure, it is recommended that IDEAL-CT be adopted for evaluating additives that can lower the cracking potential of high RAP asphalt mixtures.
7. Future Studies
Based on the findings from the study, the following topics may be worth pursuing in the future:
- Based on the test results of having minimal effect on rutting and cracking performance, it is recommended that a higher dosage rate should be considered for the Anova rejuvenator. For example, for 40% RAP, our dosage rate of 5% of RAP binder is equivalent to 1.8% of the total binder. In the future, the dosage rate should be increased to 10% of RAP binder content (3.6% of the total binder content), which is closer to 3% of the total binder, which was adopted in the previous study [18].
- Based on the test results of improving cracking resistance while lowering rutting resistance, it is recommended that a lower dosage rate should be considered for Zero-M additive. By reducing the dosage rate from 10% to 5% of the total binder, Zero-M additive would still improve cracking resistance (not as much as the 10% dosage rate) while improving rutting resistance compared to the 10% dosage rate.
- Based on the test results of not improving cracking resistance and rutting resistance at 50% RAP content, it is recommended to build test sections of asphalt mixes with 35% RAP content with Zero-M cool mix additive, Anova rejuvenator and soft binder.
Author Contributions
Study conception and Design: H.L. Formal Analysis: H.L. Data collection: C.H. and G.G. Analysis and Interpretation of Results: H.L. and C.H. Validation: H.L. and G.G. Draft manuscript preparation: C.H. Writing—Review and Editing: H.L. and G.G. All authors have read and agreed to the published version of the manuscript.
Funding
This research received funding from the Iowa Highway Research Board and the Iowa Department of Transportation (IHRB Project TR-770).
Data Availability Statement
The original contributions presented in this study are included in the article. Further inquiries can be directed to the corresponding author.
Acknowledgments
The authors would like to thank the financial support provided by the Iowa Highway Research Board and the members of the Technical Advisory Committee for their guidance throughout the project.
Disclaimer Notice
The contents of this paper reflect the views of the authors, who are responsible for the facts and the accuracy of the information presented herein. The opinions, findings, and conclusions expressed in this paper are those of the authors and not necessarily those of the sponsors. The sponsors assume no liability for the contents or use of the information contained in this document.
Conflicts of Interest
The authors declare no conflicts of interest.
References
- Zaumanis, M.; Mallick, R.B.; Frank, R. 100% hot mix asphalt recycling: Challenges and benefits. Transp. Res. Procedia 2016, 14, 3493–3502. [Google Scholar] [CrossRef] [Scilit]
- National Asphalt Pavement Association. Asphalt Pavement Industry Survey on Recycled Materials and Warm-Mix Asphalt Usage 2022; National Asphalt Pavement Association: Greenbelt, MD, USA, 2024. [Google Scholar]
- Mohammad, L.N.; Elnaml, I.A. Use of Innovative Recycling Agents for Improving the Sustainability and Durability of Asphalt Pavement; FHWA/LA. 25/716; Louisiana Transportation Research Center: Baton Rouge, LA, USA, 2025.
- U.S. Department of Transportation FHWA. User Guidelines for Waste and Byproduct Materials in Pavement Construction. 2016. Available online: https://www.fhwa.dot.gov/publications/research/infrastructure/structures/97148/rap132.cfm#:~:text=Although%20some%20form%20of%20pavement,1974%20in%20Nevada%20and%20Texas (accessed on 1 March 2025).
- Martin, A.E.; Mercado, E.A.; Gil, J.M.; Kim, Y.R.; Kommidi, S.R.; Tran, N.; Yin, F.; Moraes, R.; Rodezno, C.; Verma, M.; et al. Capturing the Durability of High Recycled Binder Ratio Asphalt Mixtures; NCHRP Research Report 1130; TRB: Washington, DC, USA, 2024. [Google Scholar]
- Zhou, Z.; Gu, X.; Jiang, J.; Ni, F.; Jiang, Y. Fatigue cracking performance evaluation of laboratory-produced polymer modified asphalt mixture containing reclaimed asphalt pavement material. Constr. Build. Mater. 2019, 216, 379–389. [Google Scholar] [CrossRef] [Scilit]
- Wang, J.; Qin, Y.; Xu, J.; Zeng, W.; Zhang, Y.; Wang, W.; Wang, P. Crack resistance investigation of mixtures with reclaimed SBS modified asphalt pavement using the SCB and DSCT tests. Constr. Build. Mater. 2020, 265, 120365. [Google Scholar] [CrossRef] [Scilit]
- Zhu, Z.; Singhvi, P.; Espinoza-Luque, A.F.; Ozer, H.; Al-Qadi, I.L. Influence of mix design parameters on asphalt concrete aging rate using I-FIT specimens. Constr. Build. Mater. 2019, 200, 181–187. [Google Scholar] [CrossRef] [Scilit]
- Batioja-Alvarez, D.; Lee, J.; Haddock, J.E. Understanding the Illinois Flexibility Index Test (I-FIT) Using Indiana Asphalt Mixtures. Transp. Res. Rec. J. 2018, 2673, 337–346. [Google Scholar]
- Alkuime, H.; Tousif, F.; Kassem, E.; Bayomy, F.M.S. Review and evaluation of intermediate temperature monotonic cracking performance assessment testing standards and indicators for asphalt mixes. Constr. Build. Mater. 2020, 263, 120121. [Google Scholar] [CrossRef] [Scilit]
- Mogawer, W.S.; Stuart, K.; Austerman, A.J.; Soliman, A.A. Investigating the Performances of Plant-Produced High-Reclaimed Asphalt Pavement Content Warm Mix Asphalts, 28th ed.; Transportation Research Board: Washington, DC, USA, 2018; Volume 2672, pp. 130–142. [Google Scholar]
- Shannon, C.; Mokhtari, A.; Lee, H.; Tang, S.; Williams, C.; Schram, S. Effects of High Reclaimed Asphalt-Pavement Content on the Binder Grade, Fatigue Performance, Fractionation Process, and Mix Design. J. Mater. Civ. Eng. 2017, 29, 04016218. [Google Scholar] [CrossRef] [Scilit]
- Lee, H.; Nguyen, L.N.; Sturlini, E.; Kim, Y.I. Cool Mix Asphalt—Redefining Warm Mix Asphalt with Implementations in Korea, Italy and Vietnam. Infrastructures 2025, 10, 24. [Google Scholar] [CrossRef] [Scilit]
- Cargill. Cargill Anova® 1815 Rejuvenator; Cargill: Wayzata, MN, USA, 2022. [Google Scholar]
- Cargill. Anova Rejuvenator Dosage Guide; Cargill: Wayzata, MN, USA, 2024. [Google Scholar]
- AASHTO T 393-22; Standard Method of Test for Determining the Fracture Potential of Asphalt Mixtures Using the Illinois Flexibility Index Test (I-FIT). American Association of State Highway and Transportation Officials: Washington, DC, USA, 2020.
- Meng, Y.; Kong, W.; Gou, G.; Deng, S.; Hu, Y.; Chen, J.; Fan, L. A review on evaluation of crack resistance of asphalt mixture by semi-circular bending test. J. Road Eng. 2023, 3, 87–97. [Google Scholar] [CrossRef] [Scilit]
- West, R.; Powell, R.; Timm, D.; Tran, N.; Yin, F.; Moore, N.; Harman, T.; Bowers, B.; Vargas, A.; Rodezno, C.; et al. Phase VIII (2021–2024) NCAT Test Track Findings (Vol. 24–01); National Center for Asphalt Technology: Auburn, AL, USA, 2024. [Google Scholar]

Disclaimer/Publisher’s Note: The statements, opinions and data contained in all publications are solely those of the individual author(s) and contributor(s) and not of MDPI and/or the editor(s). MDPI and/or the editor(s) disclaim responsibility for any injury to people or property resulting from any ideas, methods, instructions or products referred to in the content. |
© 2026 by the authors. Licensee MDPI, Basel, Switzerland. This article is an open access article distributed under the terms and conditions of the Creative Commons Attribution (CC BY) license.