


Abstract
Masonry tunnels built between late 19th and early 20th century constitute a widespread asset of the existing infrastructure network and currently require systematic condition assessment, monitoring, and maintenance interventions. Despite some existing regulatory frameworks, performing detailed assessments on tunnels with masonry linings remains a difficult task due to the significant uncertainties and the complex behavior of masonry. To address this gap, this work proposes a Simplified Approach (SA) for the structural assessment of masonry tunnels. A formulation adapted from classic static methods is proposed for the rapid assessment of the structural capacity of masonry linings. The proposed approach was applied and evaluated through a well-documented case study, in which the actual stress states were obtained with on-site measurements, that were employed to calibrate the model parameters by means of best fitting. The SA was employed to conduct a detailed stress verification along the entire lining, demonstrating its effectiveness as a calibrated tool for the large-scale safety assessment of historical tunnels, for the identification of critical sections that may require subsequent non-linear Finite Element Method analysis for Ultimate Limit State verification.
1. Introduction
The aging of critical infrastructure represents a major global challenge, especially in Europe, where a large portion of the transport network was developed during the industrial expansions of the nineteenth and early twentieth centuries. Masonry tunnels built during this period constitute a significant portion of the existing infrastructure network and now require systematic condition assessment, monitoring, and maintenance interventions. In fact, extended exposure of these structures to environmental and operational stresses frequently led to progressive degradation of the properties of the materials [1]. Commonly observed degradation phenomena include water leakage, which facilitates the deterioration of mortar joints and the formation of saline or calcareous crusts. Additionally, these chemical processes are frequently accompanied by mechanical problems, such as spalling of brick portions and the development of complex crack patterns. Structural instability is often driven by an increase in external pressure [2], which can be triggered by several factors, including hydrostatic loads from water infiltration, the influence of nearby modern excavations in urban contexts [3], seismic events [4], or long-term creep and squeezing deformations of the surrounding rock mass [1,2]. This is particularly true for older tunnels in masonry, which have reached their service life, but are still often part of complex infrastructure systems and are still active, which management is a multifaceted problem. For example, the Rhaetian Railway (RhB) in Switzerland oversees more than hundred tunnels from this era [5]. Similarly, in Italy, the high density of historical tunnels, particularly within the complex country orography, has contributed to the development of rigorous safety protocols [6,7,8,9]. To address these challenges for road tunnels, Italy introduced the 2022 Guidelines for the Risk Classification and Management, Safety Assessment, and Monitoring of Existing Tunnels [10]. This regulatory framework adopts a multilevel approach, in which the different levels do not represent maintenance classes, but progressive stages of knowledge, investigation, and structural assessment. The procedure starts from census information and visual inspections and then moves toward more detailed analyses according to the outcomes of the previous stages, the detected criticalities, and the strategic relevance of the infrastructure:
- Level 0 to Level 2 concern the collection of census and document information, visual inspections, and the definition of an “Attention Class” based on hazard, vulnerability, and exposure parameters.
- Level 3 is a preliminary structural assessment designed to identify potential structural criticalities and degradation phenomena through simplified analytical models, historical data, and available investigation results.
- Level 4 is a more detailed evaluation with advanced numerical modeling (e.g., Finite Element Method or Discrete Element Method) to simulate the mechanical behavior of the lining and its interaction with the surrounding ground.
For Level 4 assessments, structural safety is typically evaluated with advanced numerical modeling, such as the Finite Element Method (FEM) or the Discrete Element Method (DEM) [1,3,11]. These modeling approaches allow for a detailed simulation of the interaction between the masonry lining and the surrounding ground. However, they are subjected to significant uncertainties, which usually derives from the inherent variability of geotechnical parameters, complex hydrogeological conditions, and the mechanical properties of aged historical masonry [11,12]. Additionally, factors such as the viscosity of both the rock and the masonry, as well as the uncertainty related to construction stages, further complicate the analysis [1,2,13]. Consequently, to achieve reliable results, these models often require complex nonlinear analyses and rigorous calibration based on in situ stress measurements, typically performed via flat-jack tests.
Several modeling strategies are currently available for the advanced assessment of masonry arched or vaulted structures. They can be classified into continuum, discontinuum, macro-element, and homogenized strategies, and they differ in terms of levels of accuracy achieved, computational cost, or the required input data [14,15]. Equilibrium-based methods, such as limit analysis and thrust-line or thrust-network approaches, provide efficient tools for assessing masonry arches and vaults under the assumptions of negligible tensile strength and compressive force transfer within the structural geometry [16,17,18]. Discontinuum approaches, including DEM and related discrete macro-element formulations, are instead particularly suitable for reproducing cracks opening along the joints, rocking, sliding, and local separation mechanisms in arches and vaults [19,20]. These approaches can also account for the influence of masonry pattern and block arrangement, which may affect load-transfer mechanisms and the static response of vaulted masonry structures [21]. However, their application to large historical masonry structures generally requires detailed knowledge of block arrangement, joint properties, contact laws, boundary conditions, and soil–structure interaction, which are often unavailable during preliminary assessments [14,15]. Therefore, the proposed Simplified Approach is not intended to replace these advanced methods, but to provide a rapid calibrated screening procedure for Level 3 assessment, aimed at identifying critical cross-sections where these advanced methods should subsequently be used for more in-depth analyses (Level 4).
During Level 3 (Expedient Verification), the application of such models is computationally and economically demanding and is often impractical and time-consuming. A single tunnel may require the analysis of dozens, or even hundreds, of cross-sections, making the modeling effort disproportionate to the available preliminary data and the associated uncertainties. Moreover, in current practice, theoretical assessments based purely on these standard cross-sections often prove unreliable because they cannot account for the long-term equilibrium and site-specific heterogeneity that have developed over decades of service. Additionally, a Level 3 evaluation method specifically designed for masonry linings is still missing. To address this gap, the present work proposes a Simplified Approach (SA) for the assessment of tunnels with masonry linings. This method is developed starting from the historical static principles and adapting them into a modern framework for a tailored rapid verification (requested by Level 3). The SA serves as an efficient screening tool to determine whether a more rigorous Level 4 assessment is necessary and to guide the preliminary design of reinforcement interventions. By integrating site-specific experimental data, this work demonstrates how revisiting empirical knowledge from the early twentieth-century can provide a robust tool for the large-scale management of aging masonry infrastructure.
In this paper, after reviewing the evolution of the historical calculation methods originally developed to design masonry tunnel linings, a modernized formulation is proposed for assessing the structural response of existing masonry linings. This procedure is based on an adaptation of historical analytical approaches [22,23], which are reformulated for assessment purposes and updated to account for modern safety requirements and site-specific experimental data. The novelty of the work lies in extending the historical formulations to the complete lining system, including the invert arch. Although the vault and sidewalls were treated by adapting the original historical procedures, an ad hoc solution was introduced for the invert arch. In addition, the governing load parameters were calibrated based on in situ stress measurements, allowing the model to reflect the actual structural conditions of the tunnel. The resulting stress state was then used for a preliminary Serviceability-Level assessment aimed at identifying the sections that require more refined and computationally advanced Ultimate Limit State analyses. The proposed method was calibrated and assessed through a well-documented case study, in which the actual stress states were measured by using flat-jack tests across six distinct cross-sections. This large dataset enabled the calibration of the primary model parameters, highlighting their spatial variability and uncertainty along the tunnel alignment. Finally, the proposed method was used to perform a detailed stress verification along the lining, showing its potential as a calibrated screening tool for the large-scale safety assessment of historical tunnels.
The study shows that revisiting and calibrating historical design methods can help bridge the gap between empirical knowledge of the twentieth-century and modern safety requirements, providing a first tool for large-scale management of masonry tunnels.
2. Historical Methods Used to Design Masonry Tunnel Linings
Despite existing rigorous regulatory frameworks [10], performing detailed assessments of historical masonry tunnels remains complex due to significant uncertainties. In fact, for infrastructures built in the early 20th century, original design documentation is often scarce or entirely lost. Furthermore, construction practices of that period frequently relied on an adaptive approach: lining thickness and masonry types were modified during excavation to suit varying geotechnical conditions (e.g., different soils, presence of water, etc.), rather than strictly following a standardized blueprint. The historical design of masonry tunnels evolved alongside two interconnected issues: (i) the definition of the geotechnical thrust (the effective load acting on the structure) and (ii) the verification of the structural stability of the lining itself, which was governed by the principles of graphical statics and the theory of the arch-thrust line. The transition was marked by a shift in the approach to the ground, which was no longer viewed merely as a static weight, but was recognized as a complex medium that redistributes stress through soil arching and plastic equilibrium. However, determining the actual loads acting on a lining remains one of the most challenging problems in geomechanics. In fact, the magnitude and direction of forces depend on rock quality, sensitivity to weathering, and heterogeneous subsurface conditions including faults, folds, and sliding planes.
The late 19th century established a conceptual divide between geotechnical load evaluation and structural equilibrium. In particular, theories developed following a dual evolution between the quantification of the geotechnical thrust, and the verification of the structural response of the lining. In the late 19th century, a divide emerged between external load evaluation and internal structural equilibrium. Culmann (1866) [24] applied graphical statics to solve the geotechnical problem; using Poncelet’s theory, he determined the thrust applied by a sliding soil wedge in shallow ground with no cohesion. Conversely, Curioni (1877) [25] shifted the focus to the lining stability. By modeling the ground as a pseudo-fluid, whose density reflects the plastic state of the material, and incorporating the masonry’s self-weight into the equilibrium equations, he established a fundamental structural criterion by using the funicular polygon: the thrust line must remain within the central third (the core) of the masonry cross-section to ensure a state of total compression and prevent cracking.
As tunnel depths and geotechnical complexities increased, authors realized that the entire lithostatic column does not rest on the structure due to the arching effect. Heim (1878) [26] introduced the distinction between hydrostatic “mountain pressure” (Gebirgsdruck) and localized “rock pressure” (Felsdruck) caused by excavation-induced relaxation. This led Ritter (1879) [27] to formalize the “loading body” concept, a parabolic volume of soil that detaches from the mass to rest directly on the lining. Then, Gröeger (1881) [28] refined this for practical applications. This theory found experimental validation in the work of Engesser (1882) [29] and Janssen (1895) [30], who demonstrated the arching effect: vertical pressure stabilizes once a critical height is reached, effectively “decoupling” the tunnel from the total overburden.
At the turn of the century, the focus turned to the rock mass’s internal stress state. Kirsch (1898) [31] provided the first elastic framework for circular openings, demonstrating that stress concentrations could reach three times the uniform lithostatic state (), explaining the phenomena of rockburst. Kommerell (1912) [32] moved towards a displacement-based approach, linking the load to the measured crown subsidence (a), and generalizing a method for evaluating the height of the loading body acting on the lining of the tunnel. He theorized that the load stabilizes when the volumetric expansion of the fragmented rock fills the voids of the initial subsidence created by excavation. The maximum height (h) of the equivalent loading body is determined by the relationship , where the total pressure acting on the masonry depends on the measured crown displacement and the characteristic expansion percentage of the specific soil or rock type. Kommerell’s theory was criticized by Corini [33] and Giovannini (1936) [34] for its sensitivity to the stiffness of the temporary supports, making the resulting load calculations and lining thickness largely arbitrary. Giovannini in particular, warned against Kommerell’s mathematical formulations, noting that in rock masses, measured subsidence often leads to exaggerated theoretical loads that are not empirically observed [34]. Despite these critics, Kommerell’s method represented a first attempt to link theoretical design to empirical site data [35].
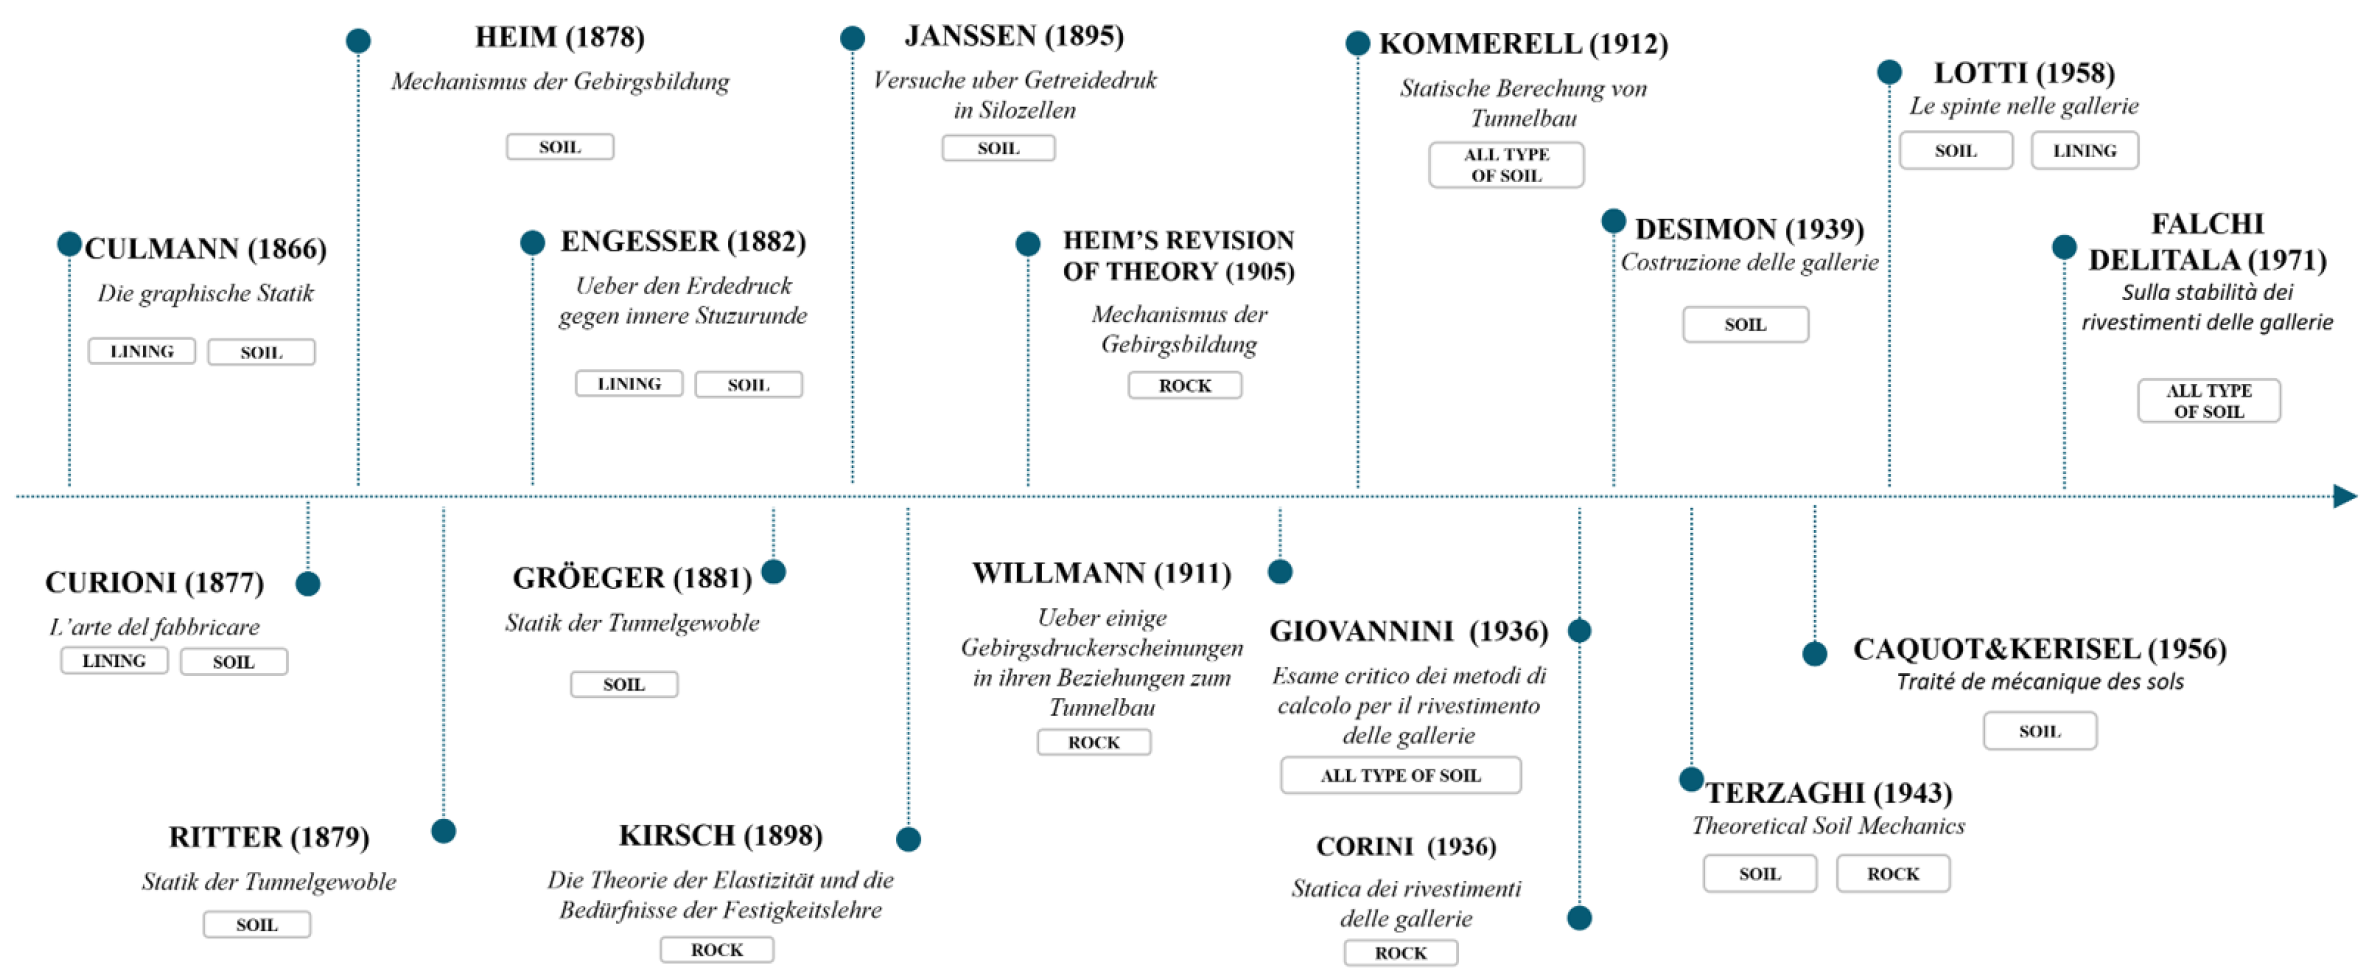
In Italy, an evolution toward modern geotechnics was marked by Desimon [22], who modeled the detached mass as an isolated elliptical nucleus strictly governed by friction and self-weight. This trajectory of improving empirical–analytical models eventually culminated with the work of Terzaghi [36], who established a definitive framework for computing pressures in sandy soils and subsequently proposed the widely adopted Rock Load Classification [36,37]. Terzaghi’s Rock Load Classification standardized the equivalent loading body heights for various rock masses, providing the empirical–analytical method that defined tunnel design before the widespread adoption of modern numerical methods. Mid-20th-century advancements by Caquot and Kérisel [38] proposed refined expressions for estimating tangential and radial pressures, introducing a crucial distinction between the behaviors of cohesive and cohesionless soils under plastic conditions. In parallel, technical critiques by authors such as Lotti [39], emphasized that the reliability of these formulations is inherently tied to the quality of soil parameters. He argued that, while historical models offer acceptable estimates, the central role of experimental data, specifically cohesion and friction angles derived from in situ tests, remains fundamental for an accurate safety assessment of the lining. Finally, Falchi Delitala [23] categorized these methodologies by soil type, acknowledging that while Ritter and Kommerell laid the groundwork, modern precision requires rigorous definition of geotechnical parameters through on-site testing. Historical masonry tunnel design should, therefore, be interpreted as a combination of both analytical and observational process rather than as a purely empirical practice. For the design, engineers used the graphical-static and analytical methods available at the time to estimate ground thrusts, verify the position of the thrust line, and define preliminary lining thicknesses (as documented for instance in Curioni’s works [25]). During excavation, however, the design was frequently adjusted in response to observed ground conditions. The behavior of temporary timber or masonry supports, the occurrence of convergence or local instability, groundwater ingress, and variations in the geological formation provided essential information that could lead to modifications in the lining thickness, material, or construction sequence. This adaptive procedure was particularly important in complex geological contexts, where the actual load on the lining could differ significantly from the theoretical assumptions adopted in the preliminary calculations. The overview of the authors and theories here discussed (resumed in Figure 1) reflects the prevailing technical and theoretical landscape in Italy between the late 19th and early 20th centuries. It is worth noting that Italy’s complex orography led to the early development of an extensive network of underground infrastructure, making Italy one of the countries with the highest density of tunnels in the world [40,41]. Consequently, the Italian school of engineering of the period played a fundamental role in refining tunnel design, successfully integrating Central European theories (such as those of Ritter and Kommerell) with original analytical advances (e.g., Curioni, Desimon, and Giovannini) specifically adapted to the country’s diverse and often challenging geotechnical conditions.
Figure 1.
Timeline of the various theoretical methods developed and used to assess the loads acting on tunnels.
3. Simplified Approach
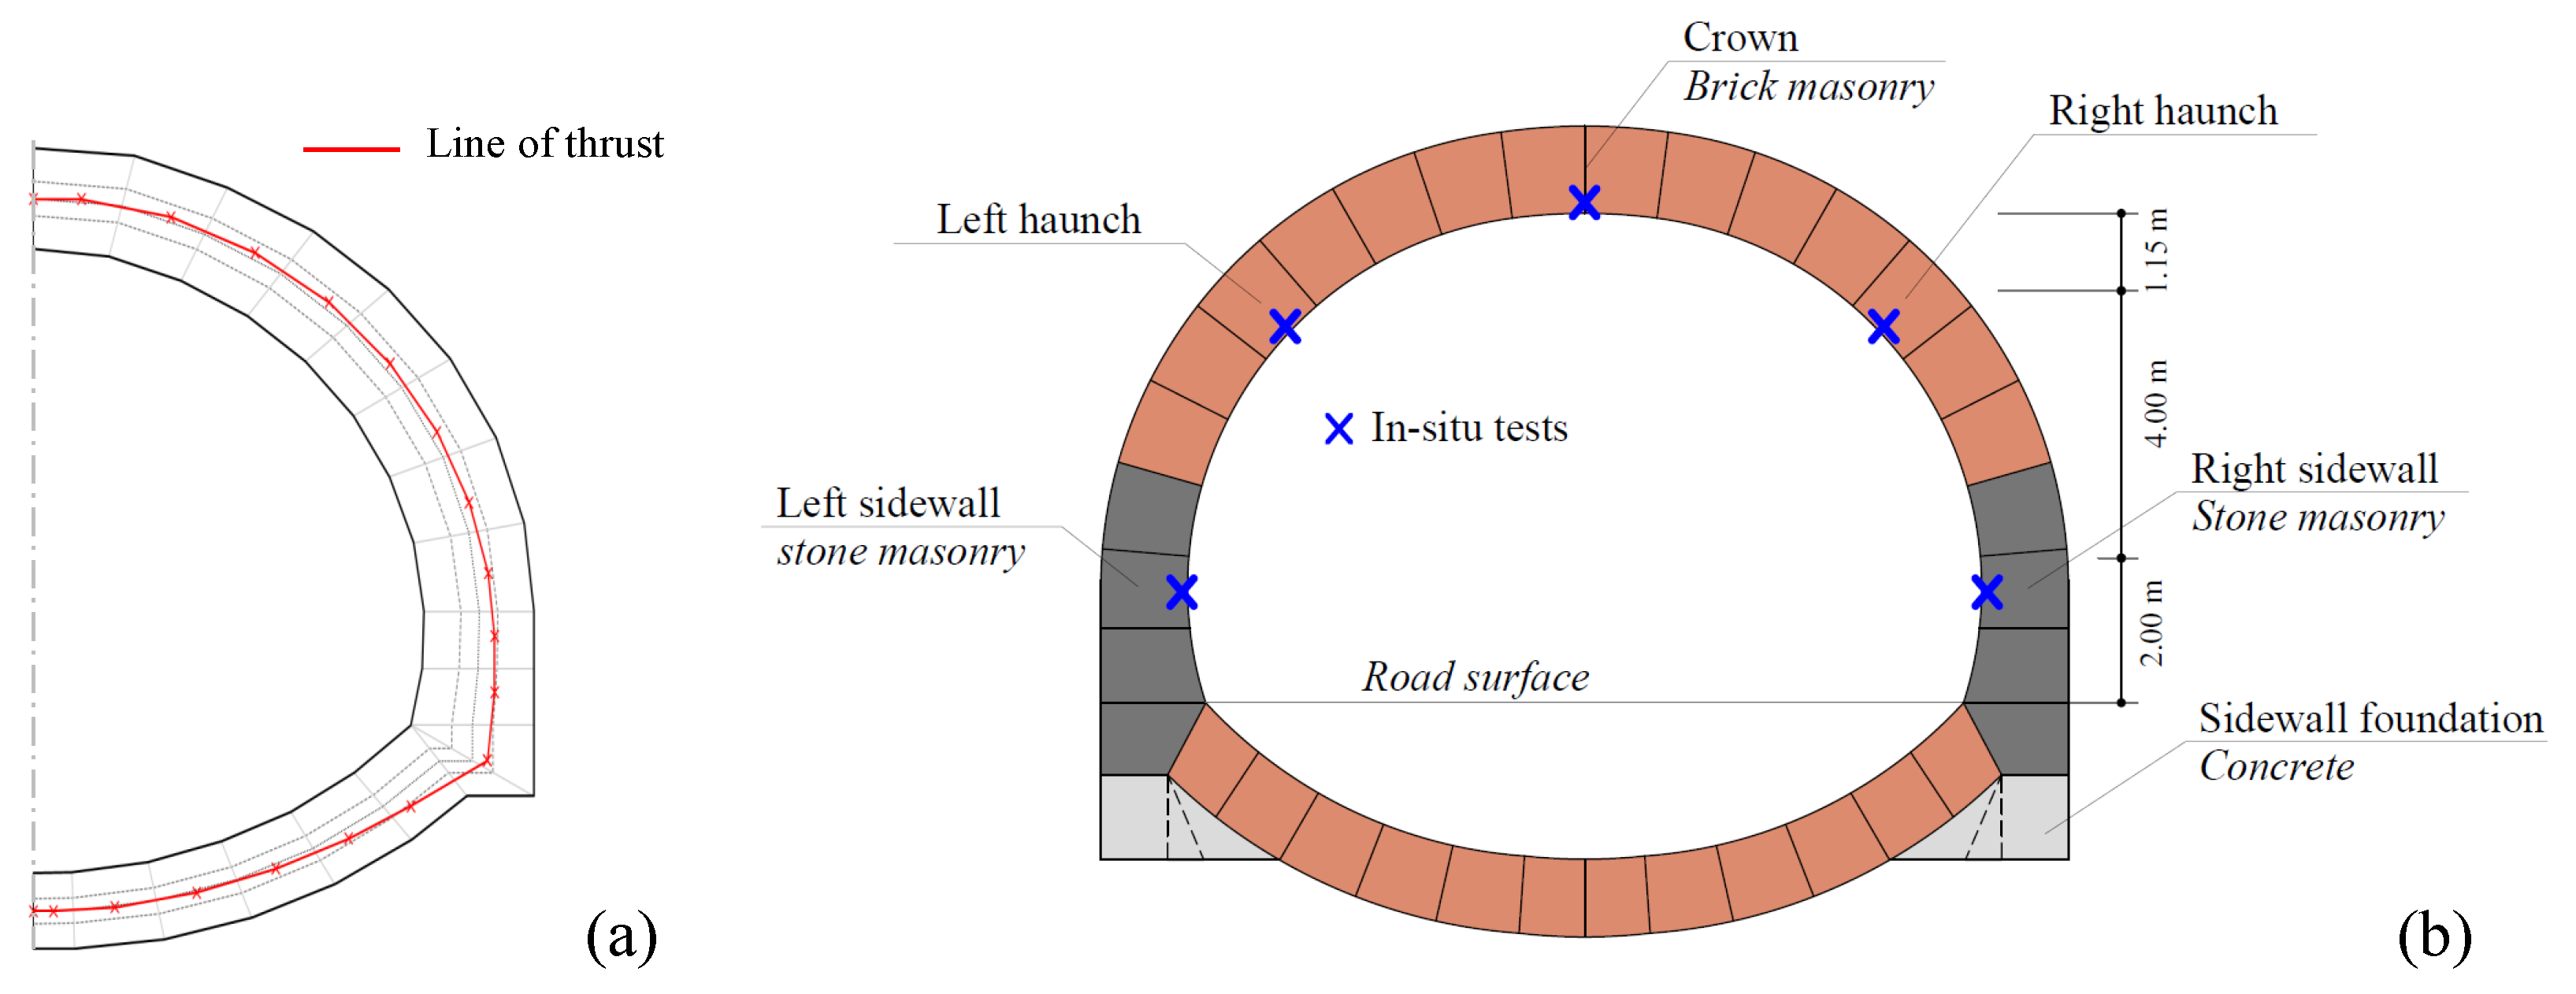
To evaluate the structural condition of the historical lining, this study presents a Simplified Approach (SA) [42] based on the design method originally proposed by Desimon in 1939 [43,44]. Built upon the work of Giovannini (1936) [34] and refined by Falchi and Delitala [23], this methodology employs the principle of virtual work to determine the line of thrust and the consequent stress distribution in the lining. Through a combined graphical and analytical approach, the historical procedure is applied to the lining profile from the constrained crown down to the base of the sidewall (Figure 2a). Subsequently, the invert arch is analyzed using an ad hoc equilibrium-based procedure proposed in the present section.
Figure 2.
Construction of the thrust line (in red) within the lining (a); in situ tests position (b).
It is important to highlight that the proposed Simplified Approach is intended to be a fast procedure for preliminary large-scale assessment. Once the lining geometry and the material and geotechnical properties are available, the analysis of a single cross-section of the tunnel requires a negligible computational effort, as the method is based on analytical equilibrium equations and does not require nonlinear modelling of the soil–structure interaction. In its current implementation, the procedure can be run in a spreadsheet environment, making it particularly suitable for the rapid analysis of multiple cross-sections along a tunnel and for identifying those requiring more detailed Level 4 numerical assessment.
The method is governed by the following core assumptions:
- The geometry, loads, and boundary conditions are assumed to be symmetric, which allows the analysis of a half-arch. This assumption should be interpreted as a first-level modeling hypothesis consistent with the simplified nature of the proposed approach and with the assumptions commonly adopted in historical design methods for ordinary tunnel sections.
- The ground is considered homogeneous, and the lining may consist of two different materials.
- The ground is subject to a lateral failure mechanism, where a wedge slides along a failure plane defined by the friction angle , resulting in a load-bearing solid separated from the rock mass.
- Shear stresses at the soil-lining interface are considered negligible.
- The masonry is assumed to have zero tensile strength. Consequently, if the line of thrust deviates from the middle third of the cross-section but remains within the thickness of the lining, the section undergoes partialization.
The proposed procedure is therefore intended for sections that can be reasonably represented by a symmetric scheme. In the case significant asymmetries are detected (e.g., relevant lateral deformation, asymmetric lining thickness, localized bulging, etc.), they should be considered warning indicators and the section should be analyzed through more detailed methods (Level 4) able to account for asymmetric geometry, loading, and boundary conditions.
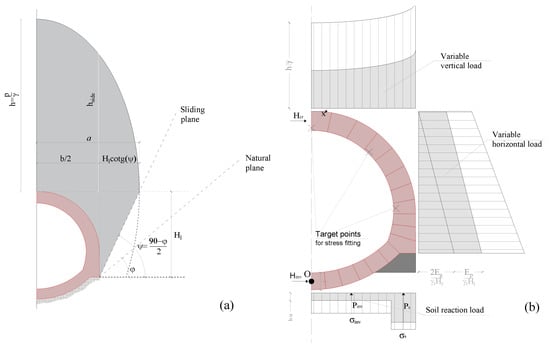
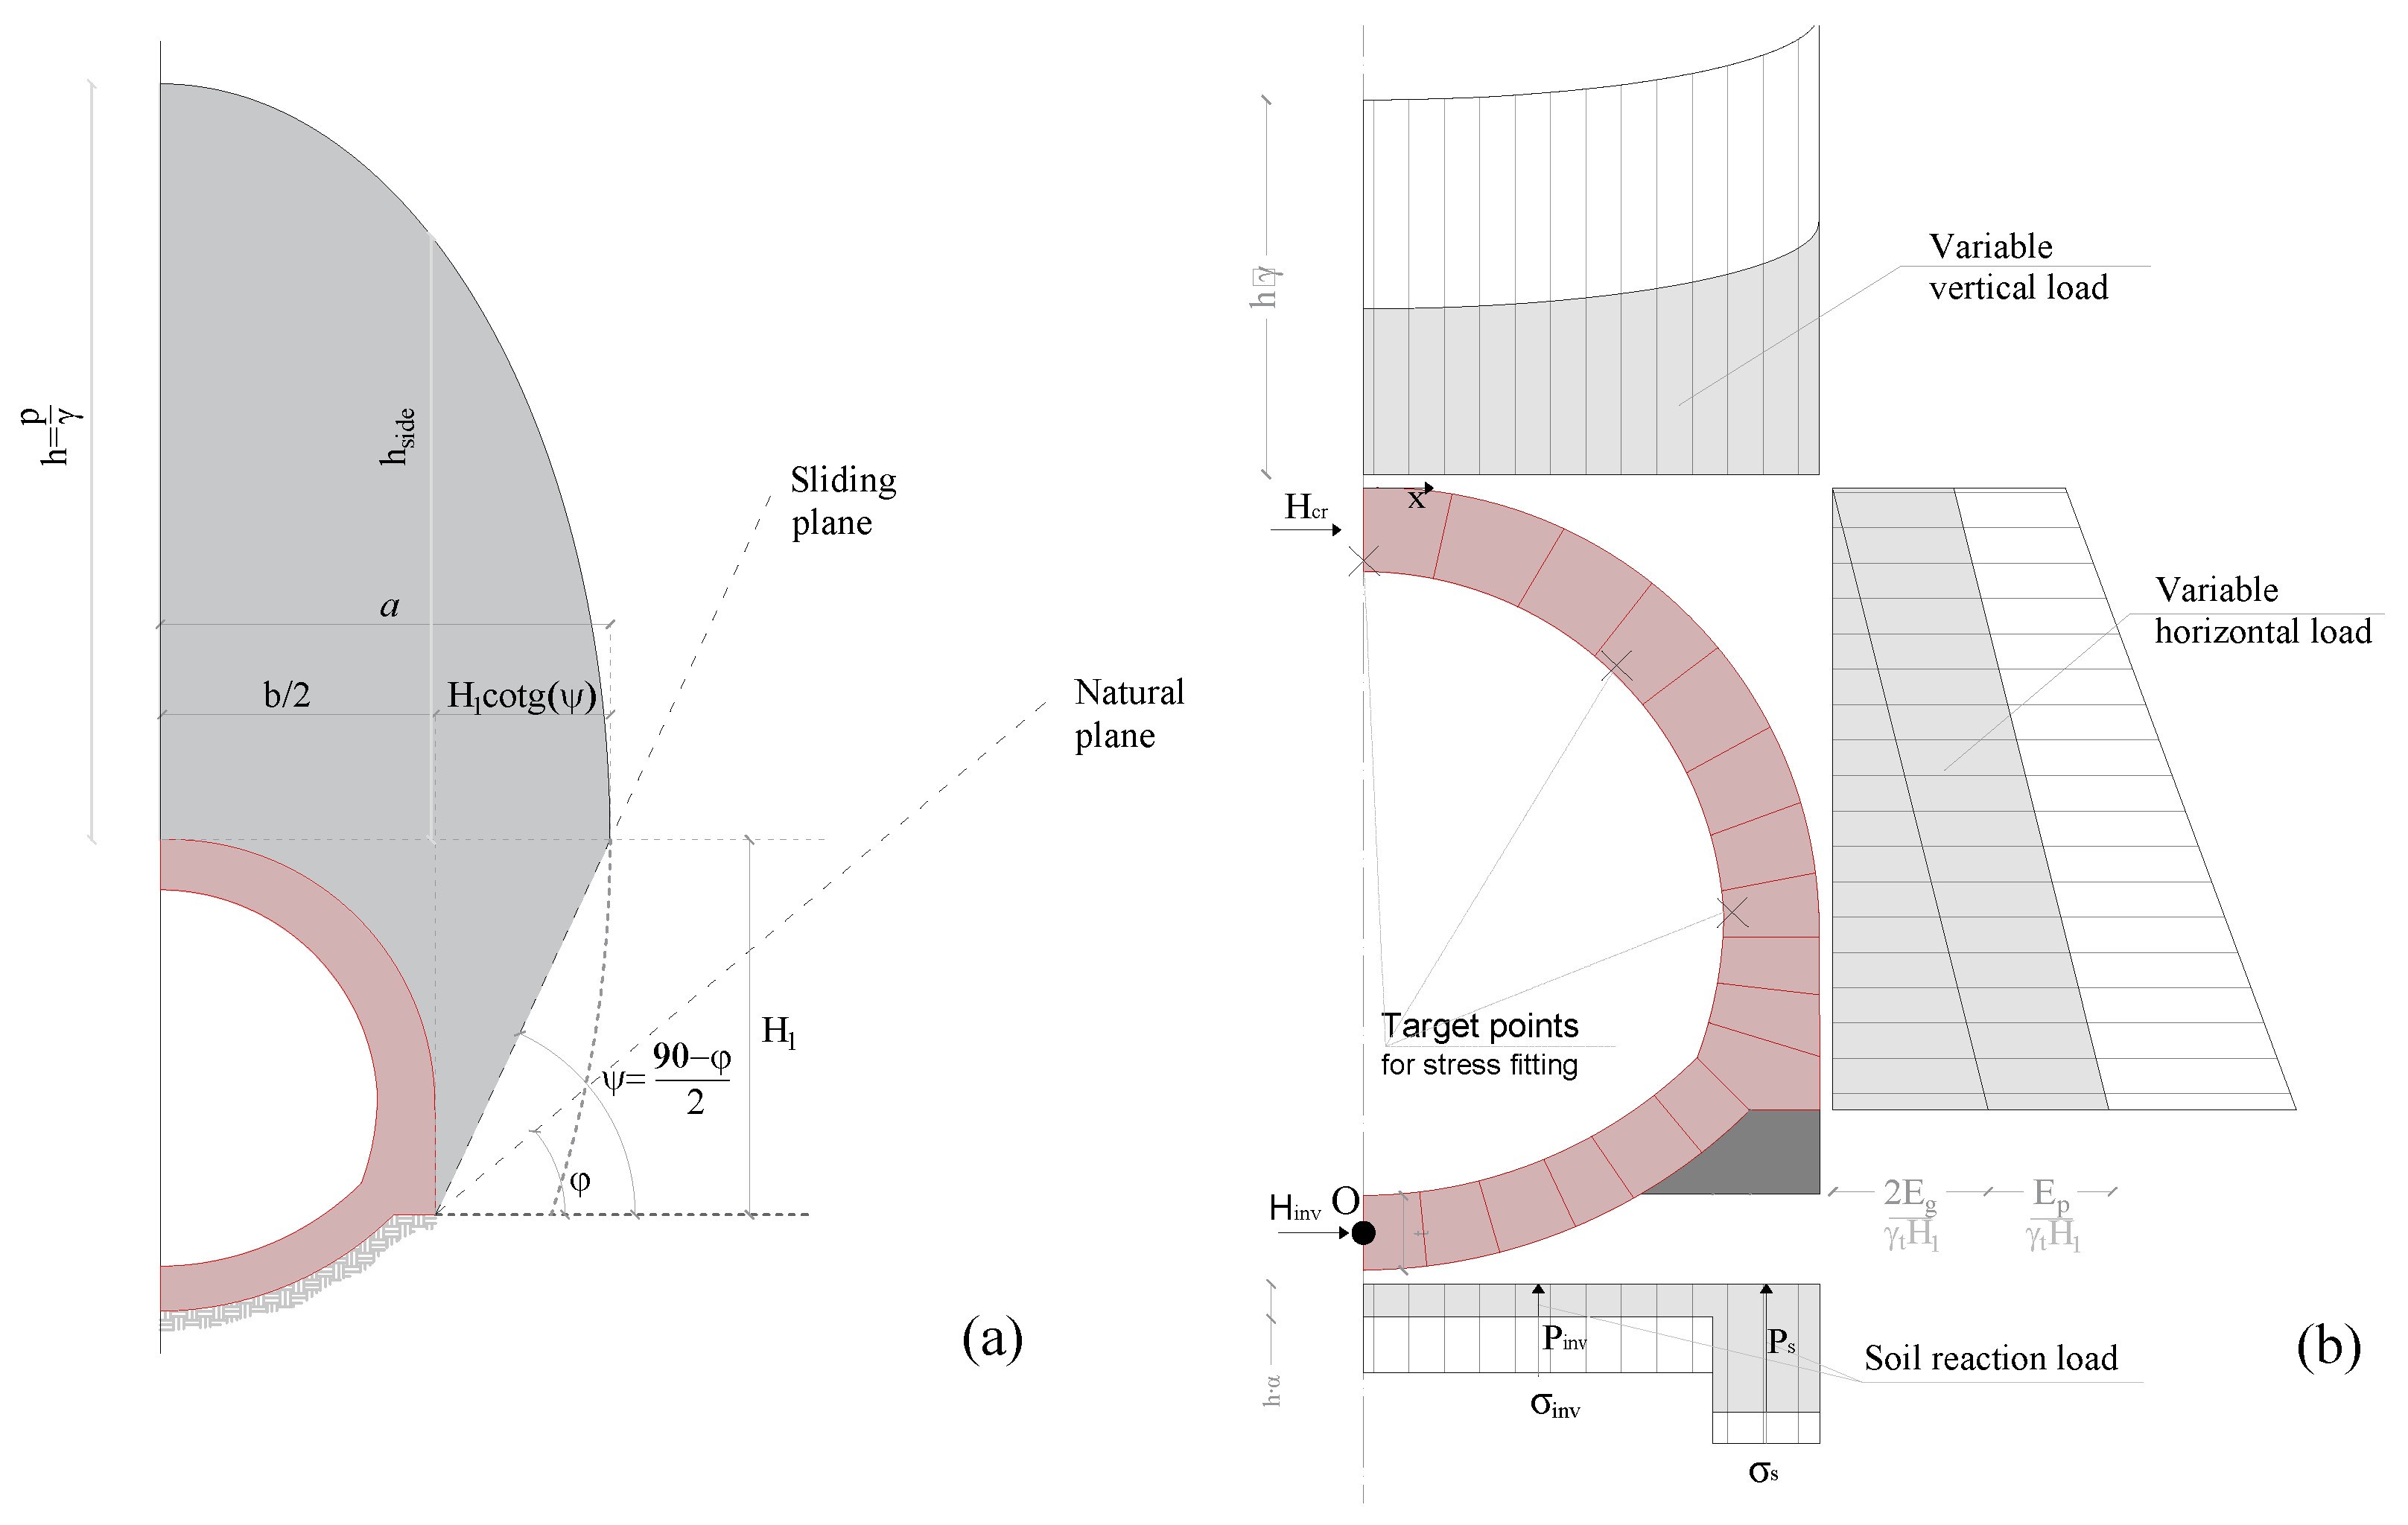
The lining is discretized into N trapezoidal segments (voussoirs) of area . Specifically, n represents the number of voussoirs forming the upper statically indeterminate arch, whereas the remaining voussoirs constitute the lower invert arch. The total vertical load acting on the tunnel () consists of the weight of the lining itself () and the weight of the overlying soil () of specific weight . The ground load follows a semi-elliptical profile with a vertical semi-axis [32] as shown in Figure 3a. The horizontal semi-axis a is determined by adding the half-width of the tunnel () to the horizontal distance defined by the intersection of the sliding plane with the horizontal tangent at the crown. This distance depends on the angle that the failure plane forms with the horizontal; for significant soil depths, is typically assumed as . a could be defined as follows [22]:
Figure 3.
Equivalent load model and soil failure mechanism (a); Simplified approaches to pressures and forces (b).
For each segment at coordinate (defined as the horizontal distance from the symmetry axis of the tunnel to the midpoint of the extrados of the voussoir), the total vertical load ( with ) acting on the arch from the crown to the base of the sidewall (Figure 3b) is calculated as:
Horizontal thrusts (Figure 3b) are derived by defining the sliding plane using Culmann’s method [24] and applying graphical statics [22]. The contributions of both the self-weight of the soil and the superimposed load induced by the upper load ellipse are determined, according to [22] as follows:
where is the height of the detached ground mass in .
In soils with low friction angles (typically ), Desimon [22] observed that the theoretical line of thrust deviates significantly from the middle third of the lining. This condition suggests a potential lack of stability due to the outward rotation of the sidewalls. To account for the stabilizing effect of the ground, which provides passive resistance and lateral confinement, an amplification factor is applied to the total active horizontal forces as follows:
According to Falchi Delitala [23] and Desimon [22], the amplification coefficient f depends on the angle , as indicated in Table 1.
Table 1.
Theoretical values for coefficient f as a function of according to [22,23].
The arch and pier form a structure that is fixed at the base and constrained by symmetry at the crown. The two statically indeterminate variables at the crown (horizontal force and moment ) are calculated using the principle of virtual work through the Ellipse of Elasticity theory [23]. The elementary elastic weights are defined as
are applied at the centroids of the respective segments rather than at the antipoles of the partial ellipses. The redundancy is resolved by identifying the system’s elastic center (G), which acts as the origin for the hyperstatic unknowns: the crown thrust () and the moment (). These values are derived by imposing that the relative rotations and displacements at the symmetry axis (crown) are zero, using the following formulations:
where is the static moment produced by external loads on the i-th voussoir, represents the elementary elastic weights, and is the vertical distance from the segment’s centroid to the elastic center.
The resulting line of thrust is initialized at the crown and its position is defined by two specific eccentricities: , representing the offset relative to the elastic center G, and , which defines the physical offset of the thrust force relative to the geometric centroid of the crown section.
From this starting point, the construction of the thrust line proceeds downwards along the lining, segment by segment, upon a specific voussoir where the cumulative horizontal resultant of the applied loads exactly balances the crown thrust ().
After resolving the upper system, analysis of the invert arch is conducted by applying global translational and rotational equilibrium equations to the entire structure. The horizontal thrust in the invert () can be calculated as the difference between the sum of horizontal loads minus .
Furthermore, vertical translational equilibrium requires the appropriate transfer of loads to the ground. To account for the interaction with the ground, a redistribution coefficient () is introduced. This coefficient distributes the total vertical load () between the pier foundations and the invert:
- Pier Reaction (): The ground reaction acting beneath the pier foundations is defined as a fraction of the total vertical load: .
- Invert Reaction (): The remaining load, supplemented by the self-weight of the invert masonry (), is supported by the ground beneath the lower arch: .
The unknown redistribution coefficient is determined by imposing the rotational equilibrium of the half-lining around pole O (Figure 3b), located at the invert crown (where the eccentricity is assumed to be zero). The equilibrium equation is formulated as:
where and represent the respective lever arms of the reactions relative to pole O. Solving for , allows for the definition of the ground’s reactive pressure distribution ( and ). These reactions enable the construction of the force polygon and the subsequent tracing of the line of thrust across the entire lining section.
4. Procedure for Safety Assessment
4.1. State of Stress
Once the thrust line is determined, its eccentricity e is calculated along the lining. Then, the stress state is computed by distinguishing between uncracked and cracked states which are identified as a function of the eccentricity e of the thrust line.
Assuming linear-elastic behavior of masonry, where the thrust line remains within the kern (), the section is fully compressed, i.e., uncracked, and the maximum compressive stress is calculated as:
where b is the base of the section, t is the thickness, is the cross-sectional area and is the section modulus.
Historical design methods were typically based on the assumption that masonry sections remain uncracked. However, it has been observed that enforcing this constraint during the assessment of existing structures is often overly restrictive. Consequently, a moderate degree of section partialization is here accepted. In particular, for eccentricities exceeding the middle third (), the masonry is assumed to have zero tensile strength and partialization, i.e., cracking, occurs. With the hypothesis of elastic behavior of masonry in compression and no tensile strength, the stress distribution is modeled as a triangular block in equilibrium with the axial load, resulting in a peak stress of:
It should be noted that the Principle of Virtual Work used to solve the arch (Equation (7)) assumes a linear-elastic flexural stiffness based on the uncracked section. The occurrence of partialized sections (cracking) introduces a local reduction in stiffness, which deviates from the model’s assumptions. In this case, the stiffness should be updated and the solution should be searched iteratively. However, within this simplified framework, such effects are considered negligible provided the eccentricity only slightly exceeds the kern () and the affected regions are limited in extent. Specifically, an eccentricity limit of is considered acceptable for this assessment; within this range, the section is only moderately partialized and maintains a stable structural response, as the peak compressive stresses remain relatively insensitive to minor fluctuations in the eccentricity value. In this simplified framework, partialization is accounted for only in the stress verification and is not iteratively included in the hyperstatic solution through a reduced flexural stiffness . Therefore, the method is considered applicable only for moderate partialization, here limited to ; otherwise, a nonlinear analysis is required.
It is important to note that important partialization of the section with cracking at the intrados of the lining may still cause deconfinement and potential detachment of the bricks.
4.2. Allowable Compressive Stress
Once the compressive stresses acting on the lining are determined, they are compared against the allowable stresses (), following the traditional Allowable Stress Design (ASD) philosophy. The proposed approach is therefore intended as a Serviceability Limit State (SLS) assessment rather than an Ultimate Limit State (ULS) verification. Its primary objective is to evaluate whether the current stress state leads to extensive cracking or crushing along the lining’s development.
If the conditions for this simplified assessment are not met (eccentricity exceeds the threshold , or if stress exceeds the allowable limit , the verification is considered unsatisfied and a comprehensive analysis is required, for example via FEM, to determine the real safety margin of the structure.
The historical methods used to design tunnel linings also limited eccentricity to , i.e., no partialization, and the maximum stress to an admissible value derived from bridge engineering. For instance, in tunnel design examples, Desimon [22] suggests an admissible stress of 1–3 MPa for masonry in solid clay bricks, regardless of mortar and brick properties. If higher stresses are present, he recommends using stone masonry with a compressive strength reaching 7–10 MPa, or masonry made with concrete units.
Today, for the assessment of existing infrastructures, it is more appropriate to determine the allowable stress based on the effective masonry compressive strength (), which accounts for the interaction between units and mortar. While Eurocode 6 [45] does not explicitly provide allowable stress values, the American standard TMS 402 [46] defines the allowable compressive stress for masonry in pure compression as . Given that compressive cracking in masonry typically begins at stress levels between and [47], the threshold is considered significantly conservative for tunnels. In the present study, an allowable limit of was adopted. This choice reflects the predominantly flexural nature of the stress distribution in the arch lining, where the confinement provided by the non-uniform stress gradient allows for a slightly higher threshold compared to pure axial compression, while still maintaining an adequate safety margin against the onset of visible cracking.
This value was not intended to represent a design strength or an ultimate capacity, but rather a conservative serviceability threshold for limiting undesirable compressive damage and visible cracking in the existing lining.
4.3. Compressive Strength of Tunnel Masonry
The masonry used in tunnel linings differs from that commonly found in conventional buildings, as it is typically much thicker, with lining thicknesses that may reach 1–2 m, and is often characterized by relatively thick mortar bed joints. In the arch region, these joints may reach thicknesses of 20–30 mm or more, especially toward the extrados, where they accommodate the curvature required by the masonry geometry. In addition, masonry is often saturated with water [7]. Numerous methods have been proposed for estimating the strength of existing masonry. This study proposes estimating the strength based on that of its components: bricks and mortar. The compressive strength of the bricks, , can be determined through laboratory tests on cubic specimens extracted directly from the lining [48,49]. As for the mortar, its strength, , can be assessed using in situ techniques, such as penetrometric tests, or laboratory procedures, such as Double Punch Test (DPT) on samples taken from bed joints [50].
Once these parameters have been defined, the compressive strength of masonry can be determined by means of tables, such as Tab. C8.5.I of the Italian Code [51] for existing masonry of different types, or by empirical expressions. For example, the formulation specified in Eurocode 6 [45] gives:
where is the characteristic compressive strength of masonry, is the normalized compressive strength of the masonry units, is the mortar compressive strength, K is a coefficient depending on the type of units and mortar, and takes into account the presence of mortar joints parallel to the face of the wall, i.e., multi-wythe brickwork [45].
The normalized compressive strength of the units is evaluated according to EN 772-1 [49] as where is the measured compressive strength of the specimens, is a shape factor accounting for specimen geometry, and is a conditioning moisture factor ( for dry specimens).
Equation (11) provides a characteristic strength. In the absence of direct experimental data on the masonry assembly, the mean compressive strength can be derived from the characteristic strength using the relation , where the conversion factor is assumed to be according to [45].
The compressive strength of the tunnel masonry lining, , is therefore computed as:
where the coefficient accounts for the moisture content: for dry masonry and in the presence of high humidity or water seepage, a condition common in historical tunnels, although more refined formulations are possible [52,53]. The coefficient accounts for the influence of mortar joints that exceed the standard thickness of 10–12 mm, significantly reducing the overall strength of the masonry [54]. For bed joints in the range of 20–25 mm and solid clay bricks with a height of 55–60 mm, according to [54] the factor is taken as 0.85.
It should be emphasized that the aforementioned formulation is strictly applicable when the masonry exhibits monolithic behavior with properly bonded courses. This assumption is validated through a preliminary inspection phase, combining on-site endoscopies with the analysis of original design drawings and construction photos. It must be noted that if the investigations reveal a lack of transverse connection, such as in the case of ring-separated arches, the structural response significantly diverges from the monolithic model. Given that this study aims at providing a rapid and simplified screening procedure, the assessment of such complex, non-monolithic configurations requires specific, in-depth investigations that fall beyond the scope of this paper.
5. Application to a Case Study
The proposed Simplified Approach was applied to a historical road tunnel located in Italy, built during the 1930s [42,43,44]. The available historical documentation was integrated with a comprehensive experimental campaign in order to establish complete knowledge of the structural state. Video-endoscopic inspections were first utilized to identify the internal stratigraphy and construction typology, revealing that the structure is not uniform along its alignment. These investigations showed that the tunnel was built using stone masonry for the piers, stone or brick masonry for the arch, and bricks masonry for the invert. Furthermore, endoscopy allowed for the measurement of the effective lining thicknesses across different sections.
5.1. Geotechnical Conditions
The geognostic characterization was conducted by integrating data from surveys performed along both the study tunnel and the adjacent one, treating the ground as a uniform medium despite the inherent uncertainties. The formation is primarily an argillitic matrix characterized by a tectonized environment with numerous faults and significant groundwater circulation. The geotechnical parameters adopted for the calculations, which were derived from the statistical processing of the geognostic surveys, were discussed in [7,8]: these consist of a density () of , an internal friction angle () of , and a cohesion (c) of . The deformability of the ground is defined by a Young’s modulus () of , while the earth pressure coefficient at rest () is assumed equal to 1. This set of parameters represents the critical loading conditions for the masonry structure.
5.2. Lining Geometry and Phased Construction Influence
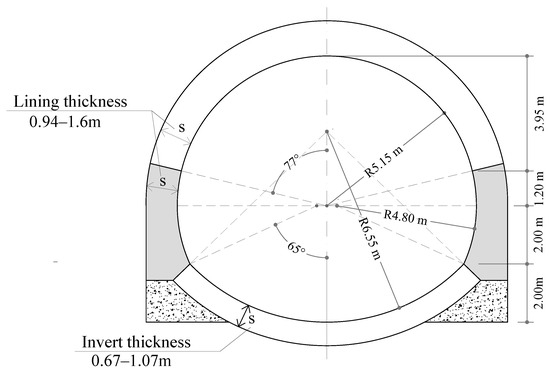
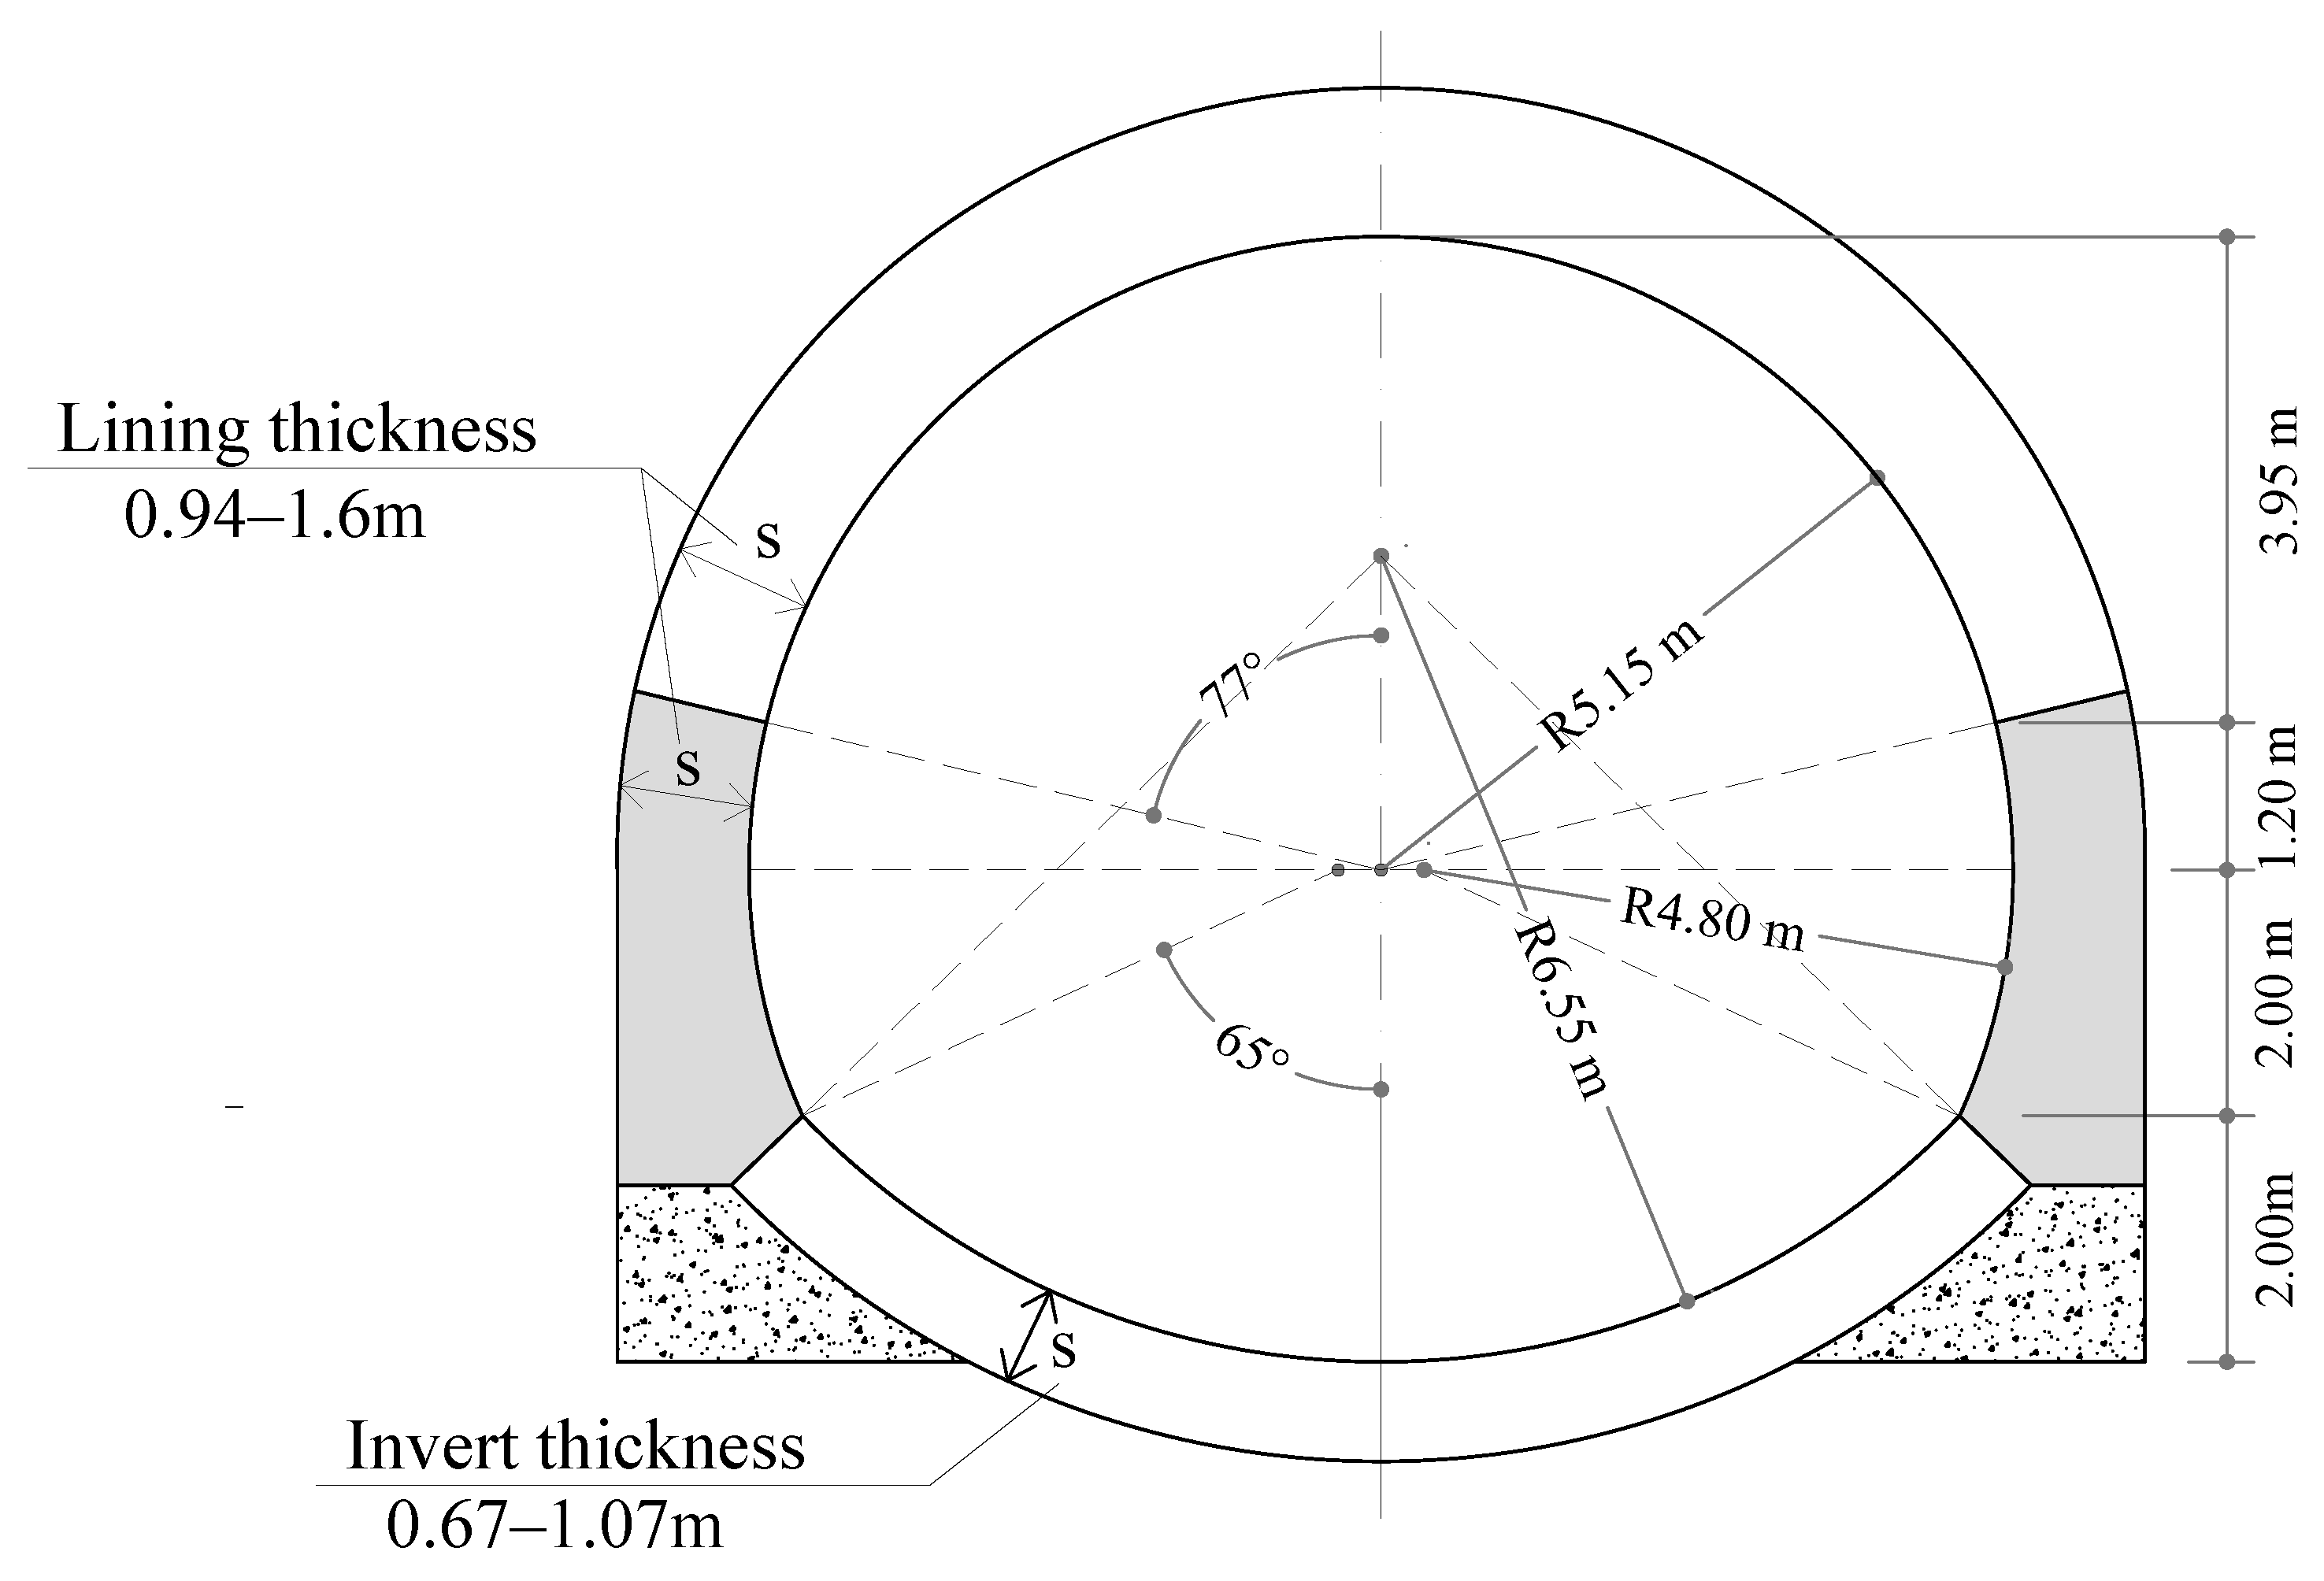
As shown in Figure 4, the tunnel features a nearly circular crown and vertical piers supported by a continuous brick masonry invert. The internal section spans approximately 10 m in width with a clearance height of 7 m, while the lining thickness ranges from 0.94 m to 1.60 m in the arch and between 0.67 m and 1.07 m in the invert. These dimensions were progressively adapted during construction to counterbalance the specific thrust levels and ground conditions encountered at different sections of the infrastructure [22].
Figure 4.
Tunnel cross section reporting the main geometries features.
This longitudinal variability is the result of a complex interaction between changes in the geotechnical properties of the weathered claystone and the specific phased excavation sequence adopted. As the geological conditions changed along the alignment, the design was modified to counterbalance localized increases in ground thrust. Furthermore, the use of the Belgian method, a partial-section excavation technique characterized by a crown-first attack, played a crucial role in defining the final structural state. The masonry vault was built on temporary supports before the subsequent enlargement of the section and the construction of the sidewalls. This multi-step approach prevented the simultaneous activation of the tunnel ring, contributing to an uneven distribution of the stresses within the lining. The finalization of the lining, through the construction of the invert arch, ensured the overall stability of the tunnel, creating a structural system capable of withstanding the high-pressure conditions of the claystone.
5.3. In Situ Characterization and Mechanical Properties of the Masonry
To quantify the mechanical behavior of the lining, single and double flat-jack tests were performed to assess the in situ stress state and determine the masonry’s elastic modulus. In addition, compressive tests on masonry units and drill tests on mortar joints were carried out to characterize the materials. The main experimental results are summarized in Table 2, including the number of tests, the minimum, maximum, and mean values, and the coefficient of variation (CV). The approximate locations where the tests were performed are shown in Figure 2b. The test results, especially those related to the Young’s moduli, show significant scatter. In addition to carrying out a larger number of tests, which should be performed with particular care, Bayesian updating could be adopted by using prior information from tables of typical material properties for the relevant masonry typology [51], or from values measured in similar tunnels, for example along the same railway line or route.
Table 2.
Mechanical properties obtained from experimental tests. Test acronyms: DFJ = double flat-jack test; CT = compressive test; DT = drill test.
Due to the inherent heterogeneity of the materials along the lining, the average values of mechanical properties were adopted for simplicity. An average elastic modulus () of 6450 MPa was determined for clay brick masonry, and 17,000 MPa for stone masonry. These values were reduced by to account for the confinement effect arising from the limited thickness of the flat-jacks compared to the thickness of the masonry lining [55], leading to the adoption of an elastic modulus of 4800 MPa for clay bricks masonry and 12,700 MPa for stone masonry. The single flat-jack campaign provided essential data regarding the in situ stress state.
Given the average compressive strength of the bricks MPa, the average mortar strength MPa, and the shape factor with a constant the base masonry strength is calculated as MPa. After accounting for the environmental and geometric corrective factors previously discussed, the mean compressive strength is MPa and the allowable stress for the assessment is MPa.
Regarding the stone masonry of the sidewall, the mechanical properties were evaluated using the same corrective factors as for the brickwork, but with a constant , as suggested for dimensioned natural stone units [45]. Given the measured strengths for the units ( MPa) and mortar ( MPa), the resulting masonry compressive strength is MPa, with a corresponding allowable stress MPa.
6. Validation and Discussion of the Results
6.1. Best Fitting of Load Parameters
The stress state in the tunnel lining was investigated using the Simplified Approach, translating from theoretical design assumptions to a calibrated model reflecting the current structural state.
Historically, the load height and the amplification factor f were determined based on empirical design practices and verified during construction by means of thrusts measured on temporary supports. Specifically, was often estimated as a function of the tunnel span and the ground quality, while f was set to a standard value varying between 0 and 0.8 to account for lateral confinement (e.g., and f = 0.8 for loosened claystone). However, applying these standard theoretical estimates (e.g., m and ) to existing historical structures typically results in calculated stress levels that are significantly higher than those measured experimentally. This discrepancy highlights the inadequacy of using original design loads for the assessment of old tunnels that have reached a long-term equilibrium with the surrounding rock mass. To address this problem, an inverse analysis was performed using an optimization procedure based on the Least Squares Method. This approach treats and f as variables, minimizing the error between the stresses calculated by the analytical SA model and the actual stresses measured in situ via flat-jack tests. The proposed methodology was applied to six sections of the case study reconstructed through endoscopy and measured laser scanner geometry. The two input variables and f were iteratively adjusted up to the best fitting by following the Nelder–Mead algorithm [56]. The objective function was defined as the sum of squared errors (SSE) obtained as difference between the stresses computed by the analytical SA model and those measured in situ by flat-jack tests. A key constraint in the fitting procedure is having at least two in situ stress measurements for each analyzed section. This requirement ensured a robust calibration process, providing a sufficient number of data points to reliably determine the optimized governing parameters in the various investigated locations.
6.2. State of Stress in the Tunnel Lining
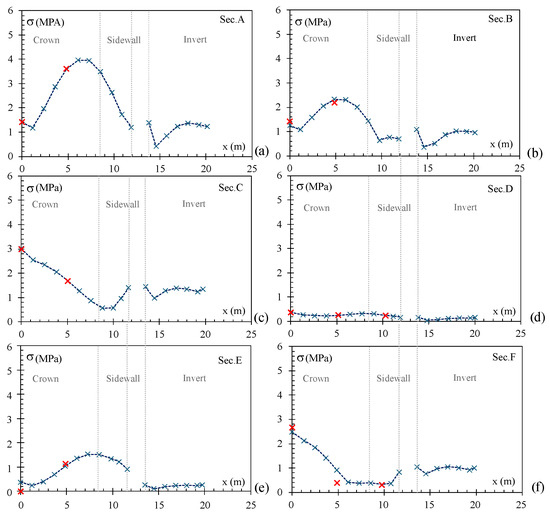
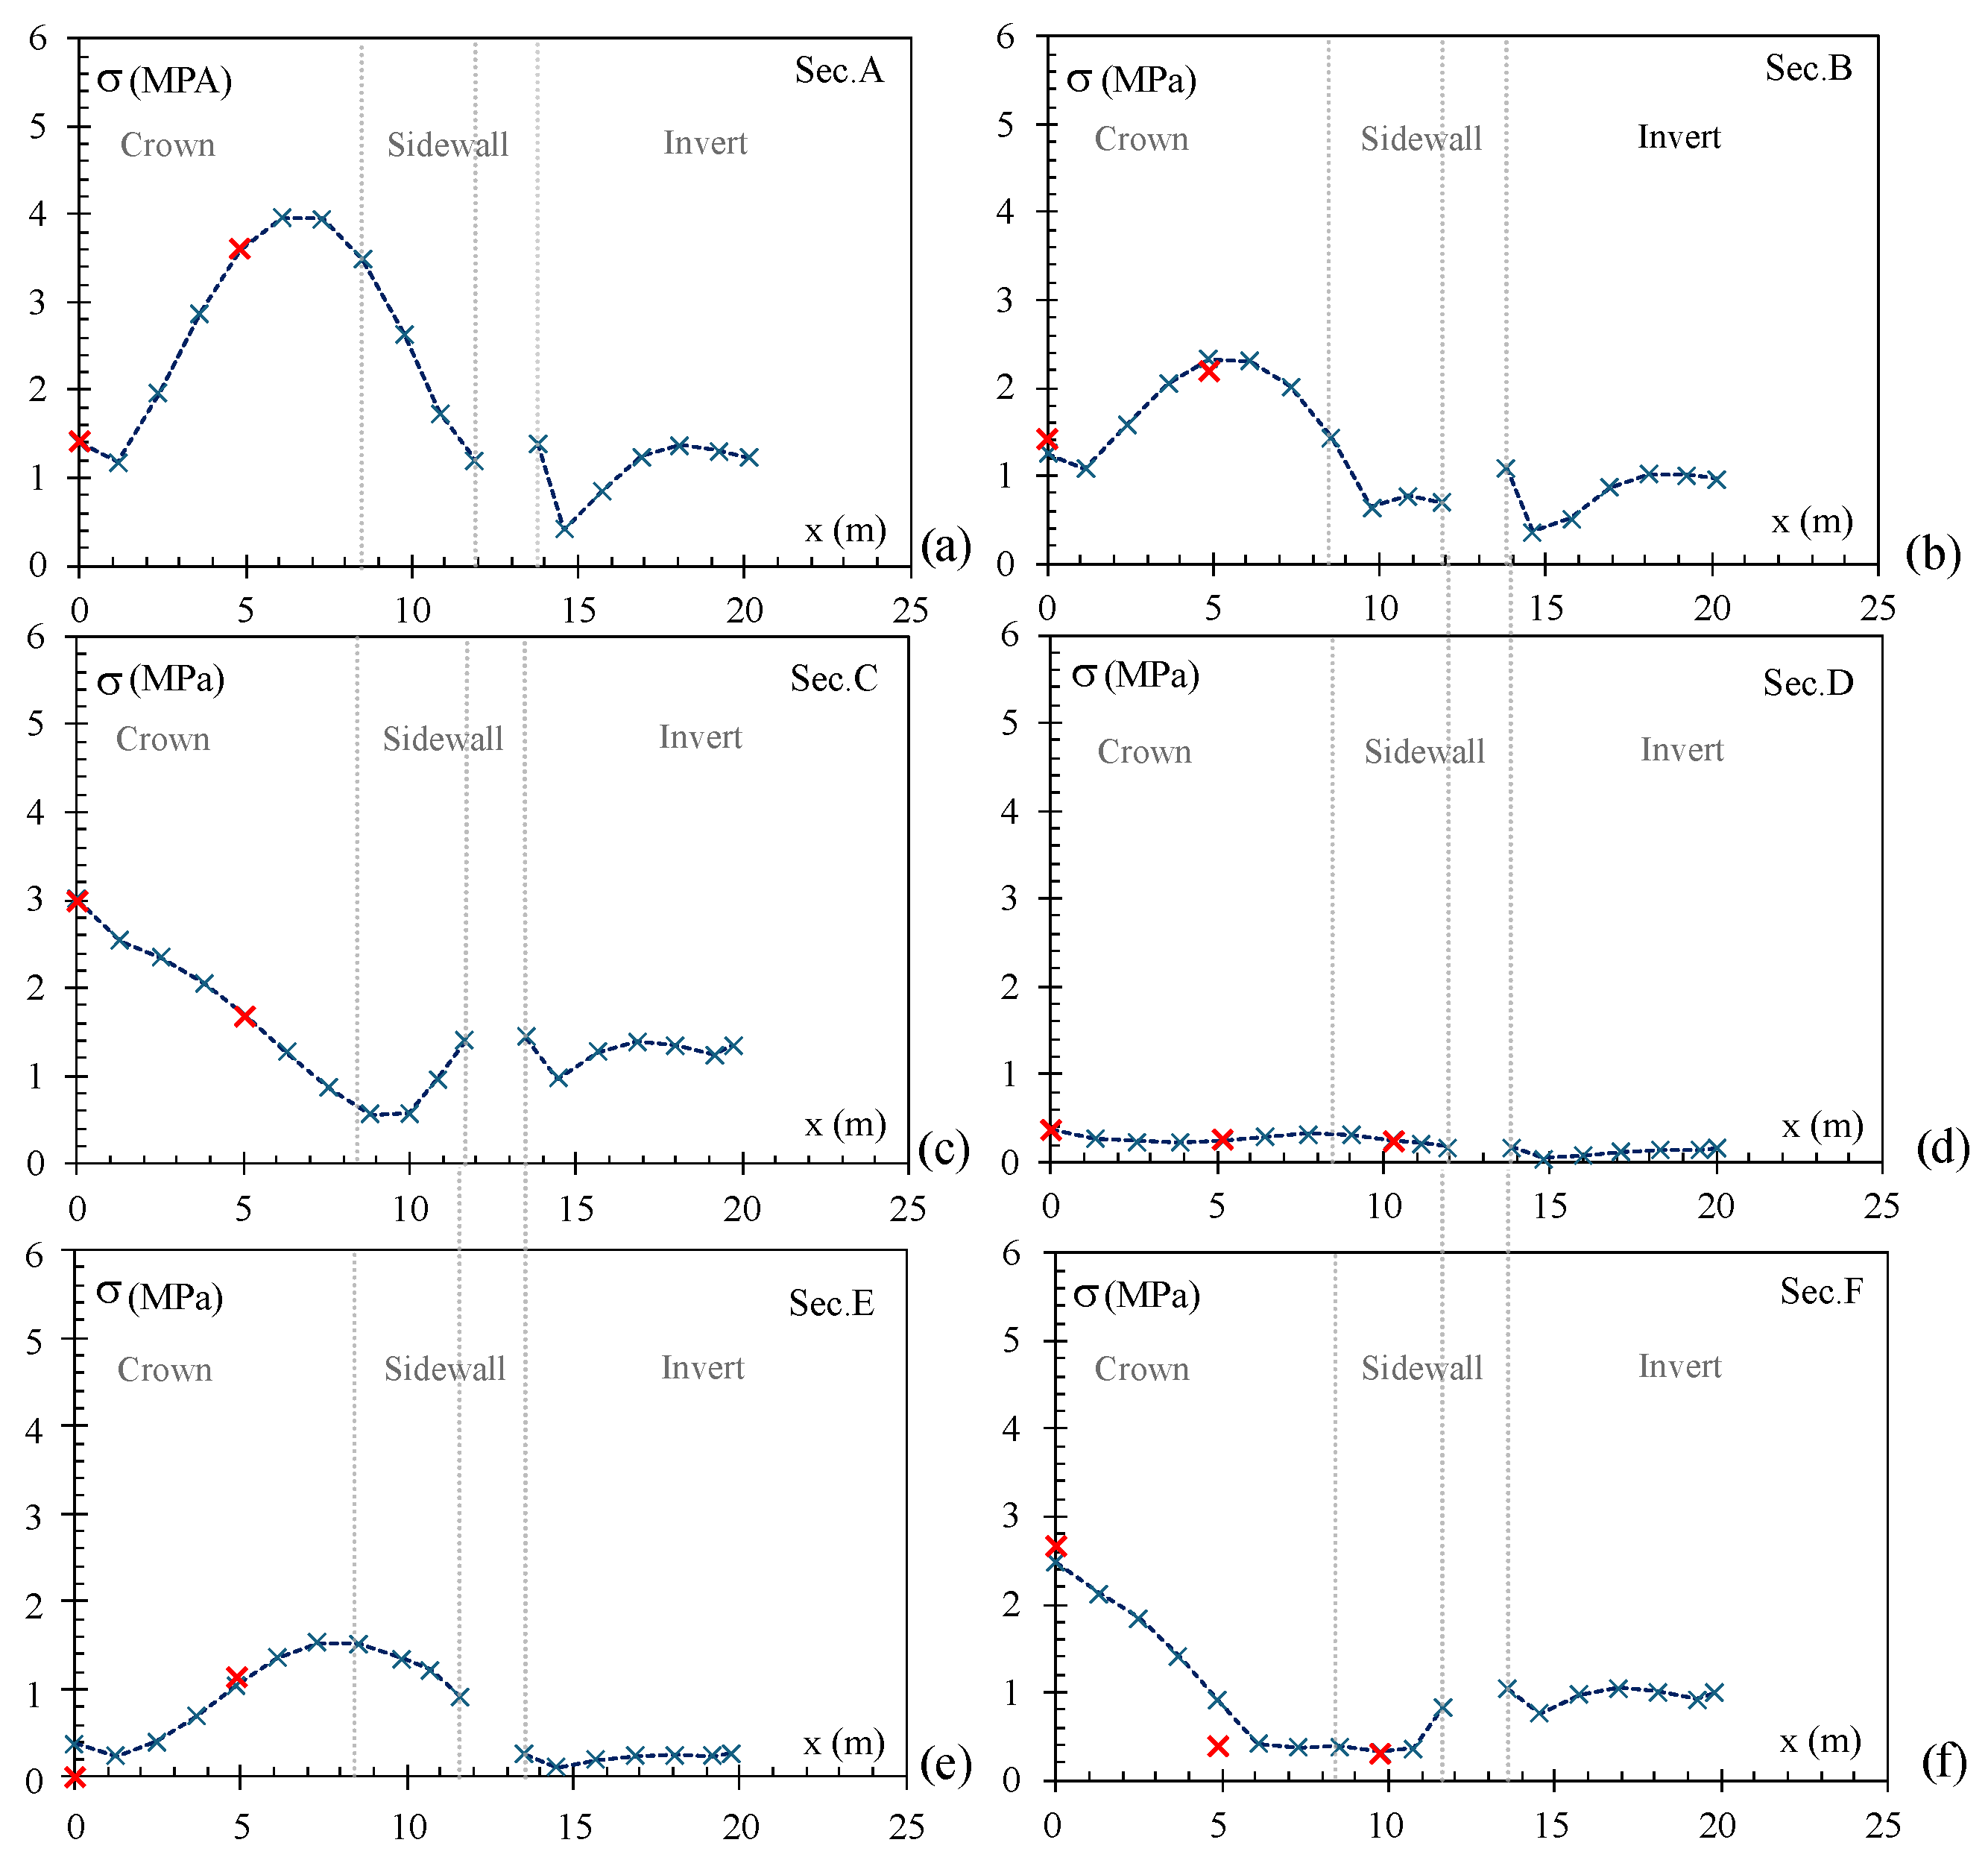
Figure 5 presents the results of the fitting analysis. The blue curve represents the stress distribution within the lining at a depth of 15 cm from the intrados—corresponding to the measurement depth of the flat-jacks—plotted against the position x along the tunnel profile (from the crown, through the arch and sidewall, down to the invert). The red crosses denote the local stresses recorded by the flat-jacks. Overall, the proposed approach yields an good fit to the in situ stress state across all studied configurations.
Figure 5.
Fitted stress profiles along the tunnel lining for sections A–F: (a) section A, (b) section B, (c) section C, (d) section D, (e) section E, and (f) section F. Dotted vertical lines separate Crown, Sidewall and Invert. Red crosses represent experimental stress measured by double flat-jacks.
The fitting results are presented in Table 3 which summarizes the post-fitting values for and f for each section, as well as the theoretical counterpart according to [22,23]. The same table shows the Sum of Squared Errors SSE, the coefficient of determination , and the normalized chi-square error indicator values for the analyzed cross-sections. The obtained and values indicate a satisfactory calibration for the intended purpose of the model. Notably, the calibrated parameters reveal a clear correlation with the structural response of the lining: acts primarily as a scaling factor governing the overall stress magnitude, whereas the coefficient f dictates the shape of the stress distribution, with higher values driving pronounced stress concentrations. Calibrated values f that exceed the theoretical range in Table 3 do not necessarily indicate unrealistic passive pressure, but reflect the inverse identification of an equivalent load configuration capable of reproducing the measured stress state. Since two model parameters are calibrated for each section, the fitting indicators and should be interpreted with caution, especially for sections where the number of available flat-jack measurements is limited. The calibration is therefore not intended as a statistical validation in a strict predictive sense but as an inverse identification of equivalent load parameters consistent with the measured stress state.
Table 3.
Fitting parameters and f, sum of square error , coefficient of determination , and values for the analyzed cross-sections.
Based on the results of fitting, the analyzed sections can be subdivided into three distinct behavioral trends. The first trend (sections A, B, and E in Figure 5a,b,e) exhibits lower stresses at the keystone and higher stresses toward the haunches and upper sidewall. Within this group, Sections A and B are subjected to significant overall loads and exhibit strong stress gradients. This is reflected in the highest values (23.5 m and 16.3 m, respectively) and high f coefficients (2.24 and 2.13). Conversely, Section E shares a similar stress-trend but is subjected to a much lower load; consequently, its stress profile is significantly flattened, which is accurately captured by a lower (5.1 m) and a drastically reduced f (0.54).
Meanwhile, in Sections C and F (Figure 5c,f), where the stress in the keystone is higher than in the haunches, the general trend is quite different. Specifically, maintaining a high f-factor () while varying the height effectively reverses the stress pattern observed in Sections A, B, and E, shifting the peak stresses toward the keystone. Furthermore, a direct dependence between the parameter and the maximum stress at the crown emerges: an increase in corresponds to a proportional increase in the crown’s compressive stress. This is clearly demonstrated by comparing Section C and Section F, where the higher value in Section C (14.6 m) dictates a greater overall load and higher crown stress than in Section F (7.5 m).
Section D (Figure 5d) is characterized by uniformly low stress values throughout the entire profile. This absence of significant load and stress gradients is perfectly captured by minimal values for both (1.9 m) and f (0.11).
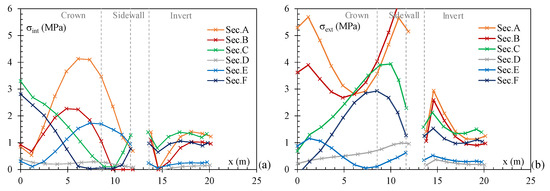
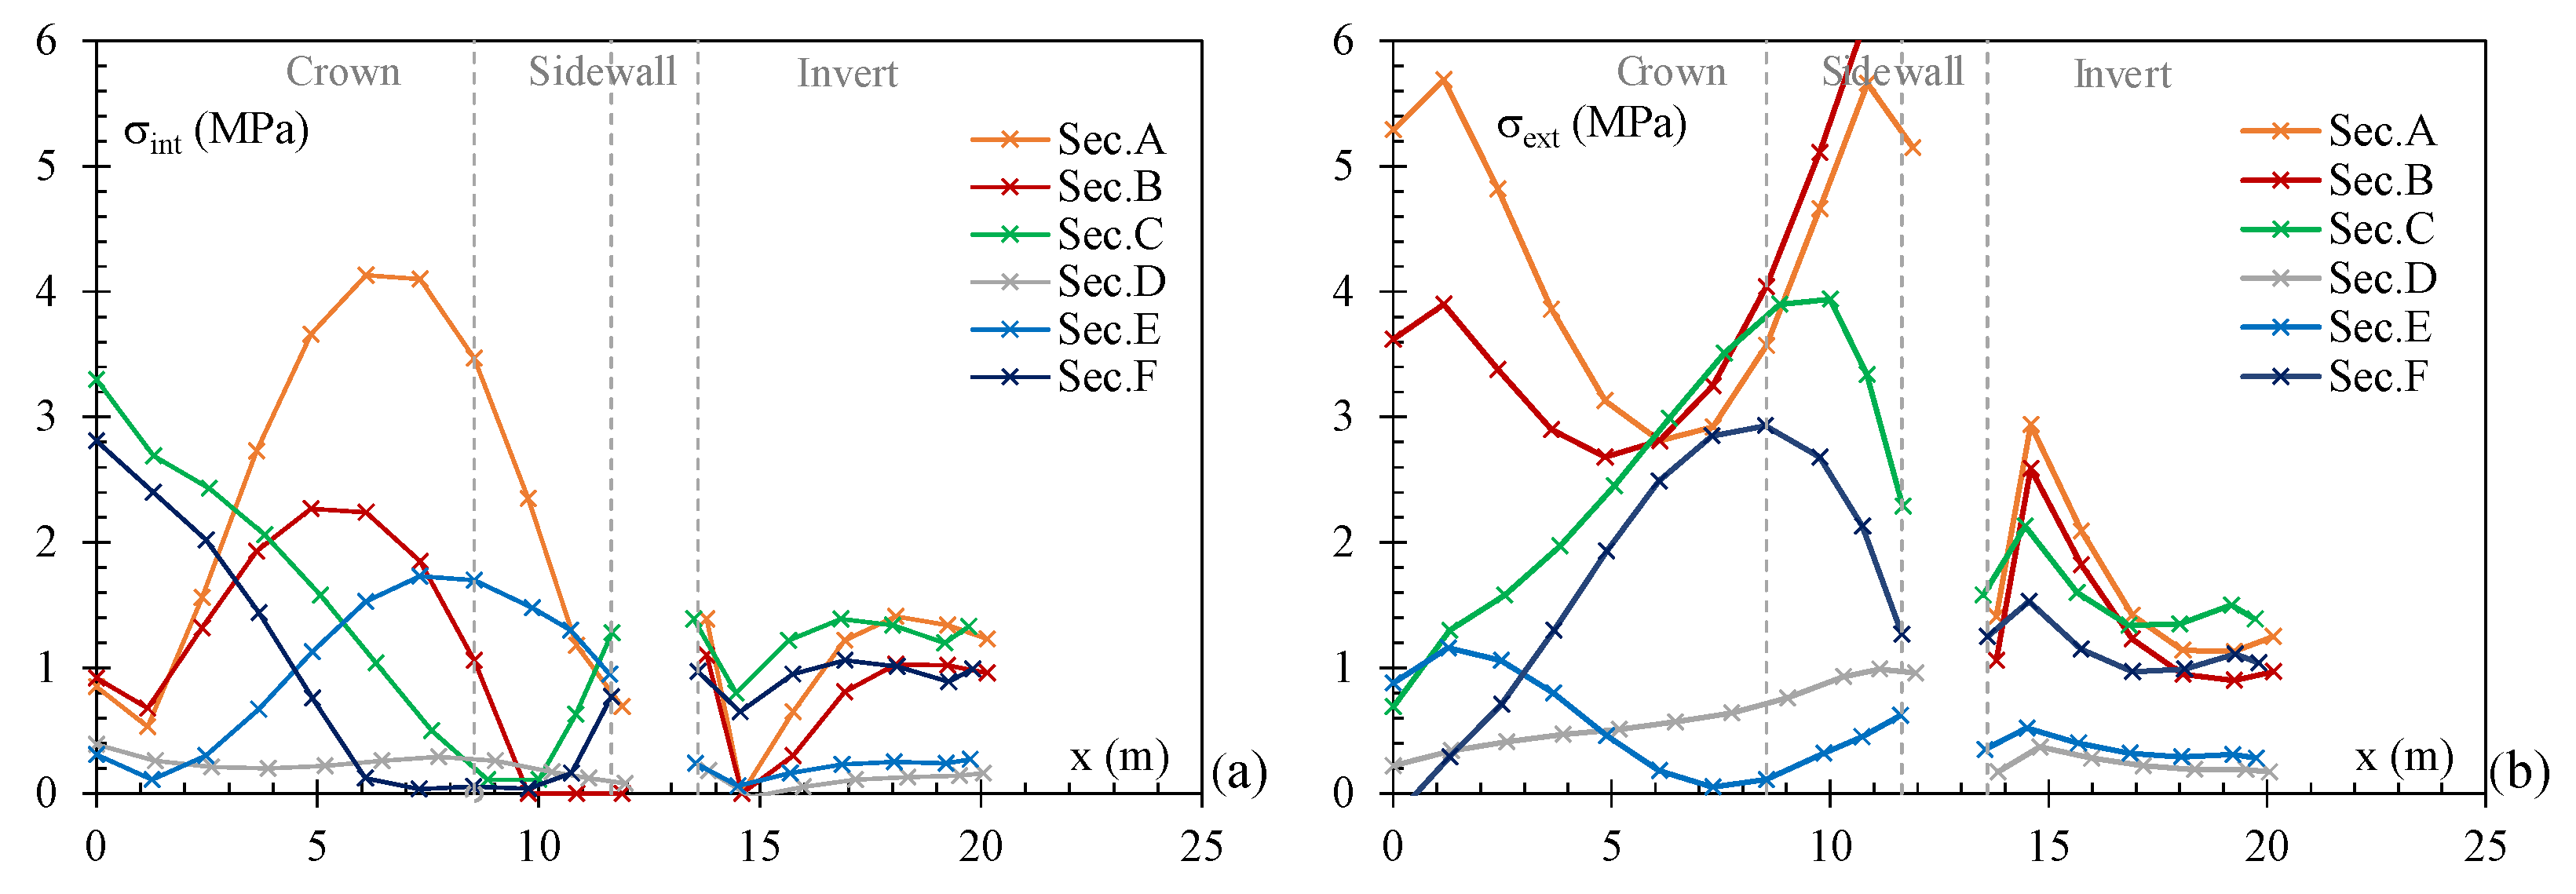
Figure 6 illustrates the stress distributions in the intrados and in the extrados along the tunnel profile (from the crown, through the arch and sidewall, down to the invert) for the analyzed sections. The stress results at the intrados (Figure 6a) exhibit behavioral trends analogous to those previously shown in Figure 5. Similar stress distributions on the upper surface can be seen in Figure 6b. Sections A, B, and E, are characterized by high stresses along the lining. The intrados stress is concentrated at the lower haunches and upper sidewall (reaching up to 4 MPa in Section A as shown in Figure 6a), while the extrados exhibits coupled peaks at the crown (up to 5.3 MPa) and the lower sidewall (up to 5.7 MPa in Figure 6b). Section E mirrors this exact pattern (Figure 6a), albeit at a much lower magnitude (stresses below 1.2 MPa). Notably, the intrados stress peaks at the sidewalls do not pose a critical threat, as their stone masonry construction inherently provides a higher compressive strength than the brick arch.
Figure 6.
Intrados (a) and extrados (b) stresses along the tunnel lining for the analyzed cross-sections of the tunnel.
Conversely, the extrados stress profile of Sections C and F exhibits a reversed stress pattern. The entire compressive load is carried by the arch at the intrados, leaving the sidewalls largely unstressed. Consequently, the extrados profile shows relatively low stresses at the crown, with load peaks shifting toward the upper sidewall (ranging between 2.9 and 3.9 MPa).
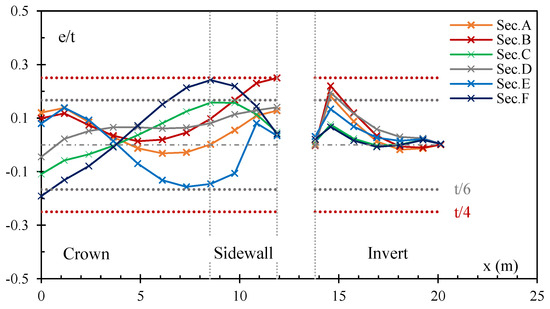
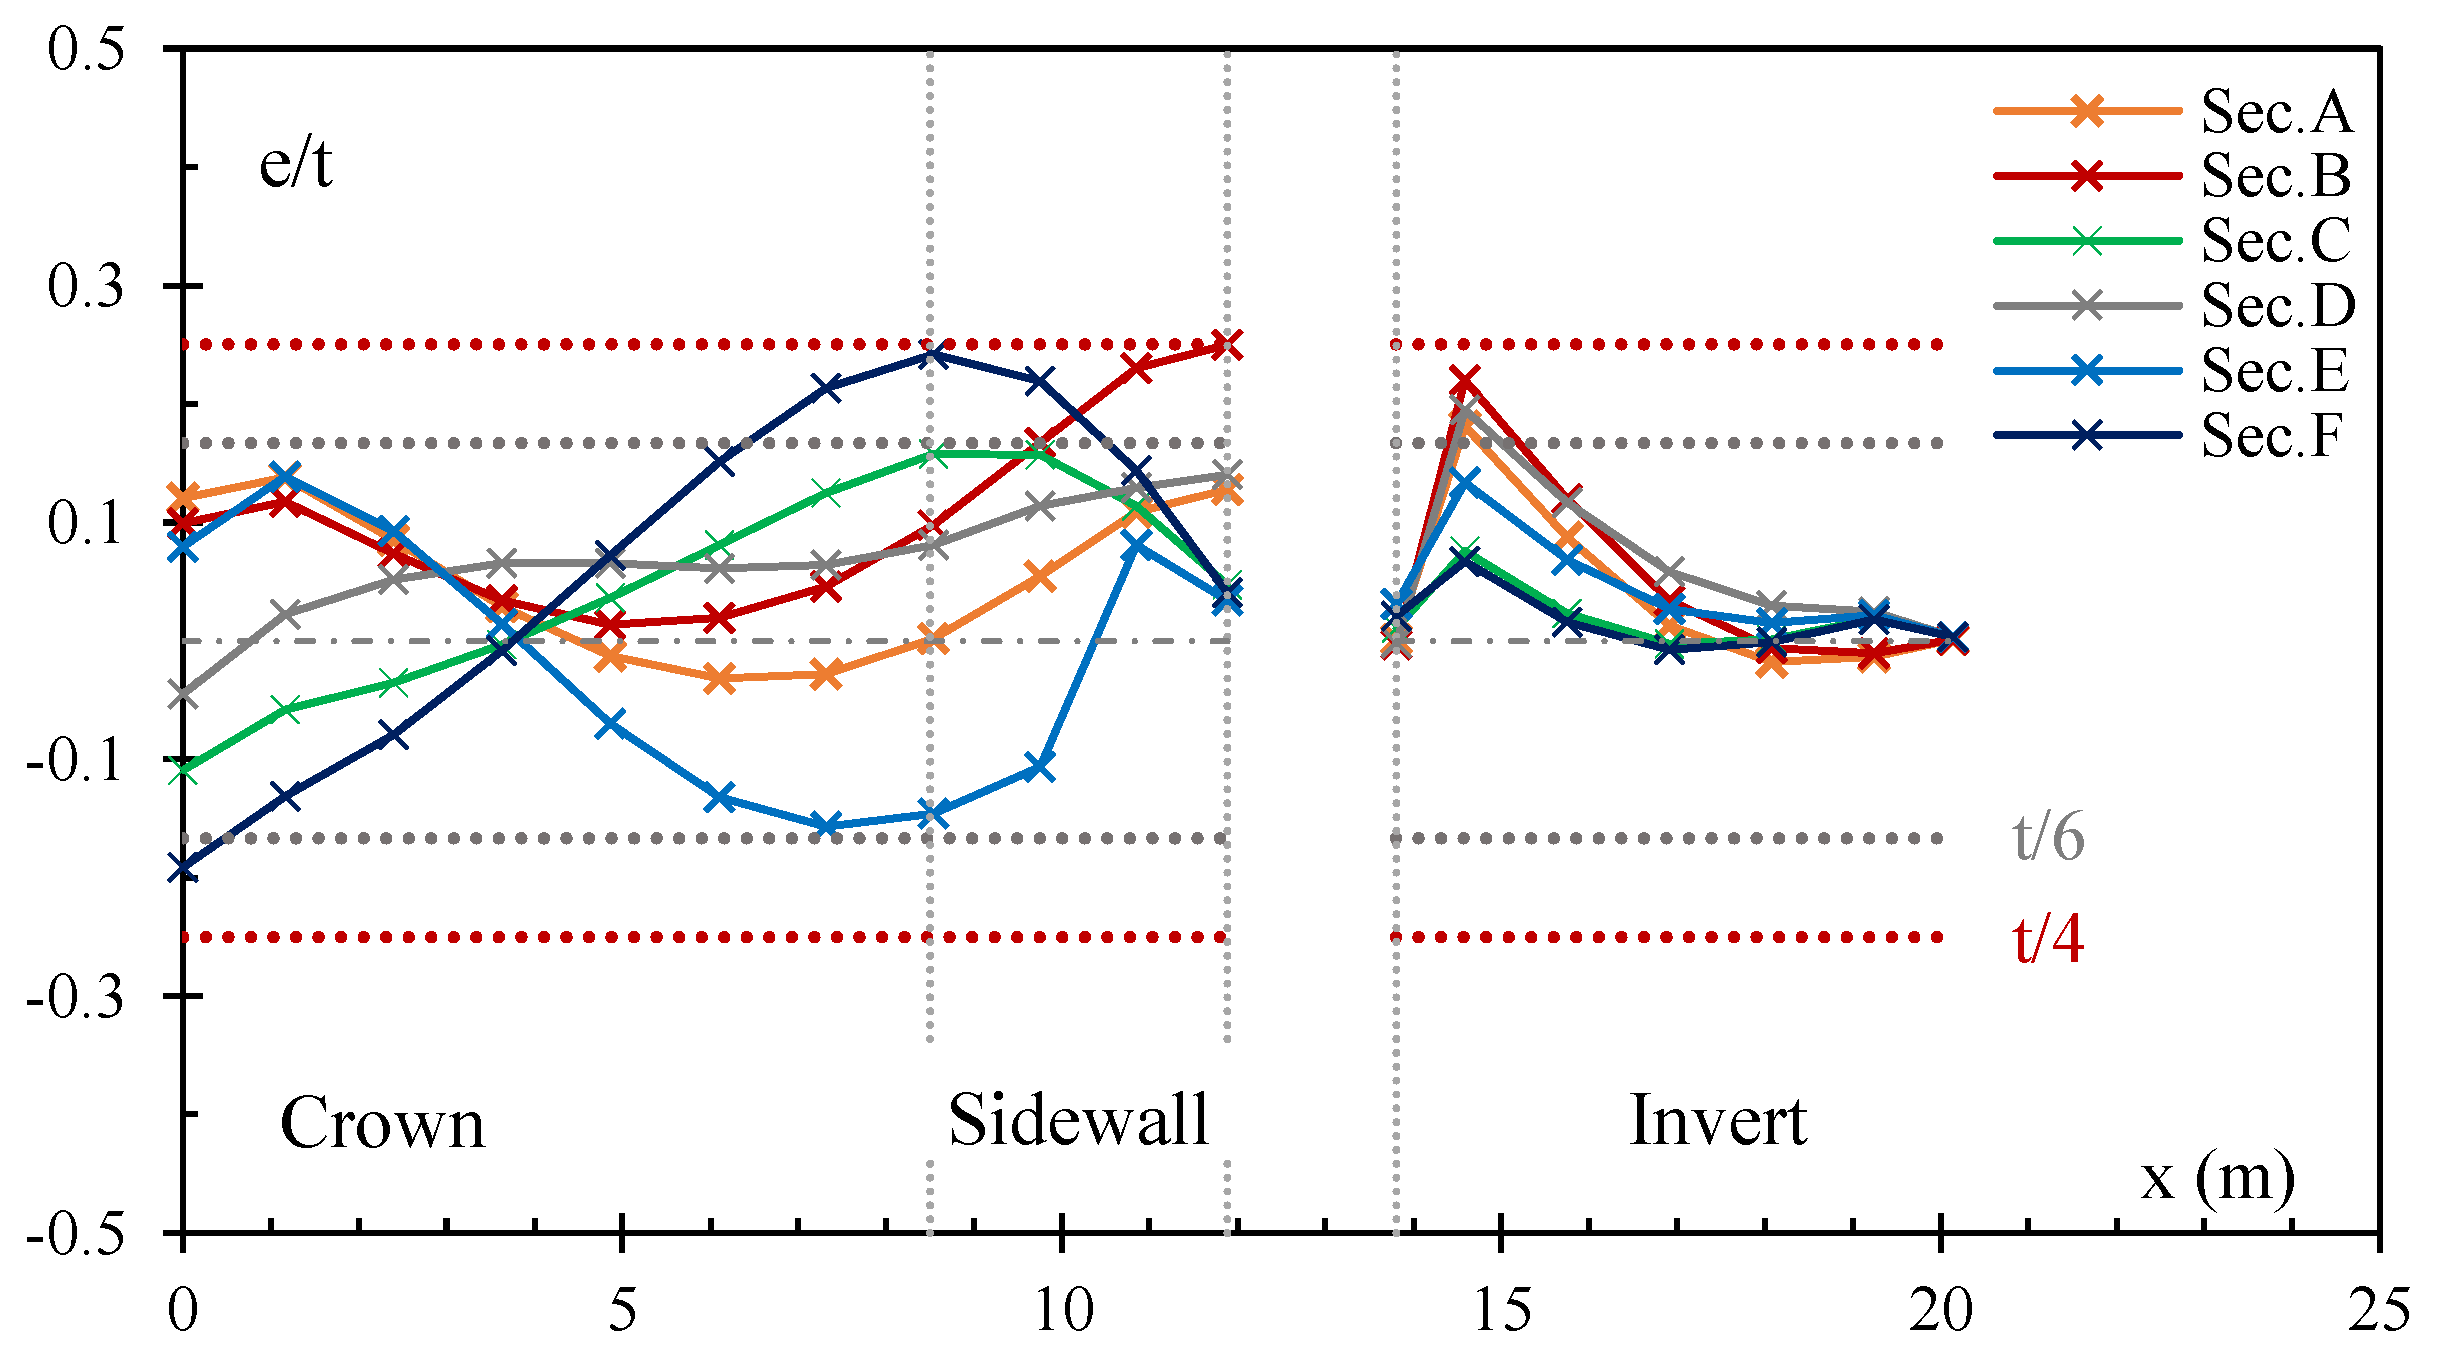
Figure 7 shows how the normalized eccentricity () varies along the tunnel lining (from the crown, through the arch and sidewall, down to the invert) for the analyzed cross-sections. The analysis reveals that Sections A, C, D and E generally remain within the middle third along their entire profile, indicating a fully compressed state.
Figure 7.
Eccentricity along the tunnel lining for the analyzed cross-sections of the tunnel.
Conversely, the other sections experience localized partialization in specific regions. Section B exceeds the threshold of , reaching a limit of at the sidewall. Section F exhibits the most pronounced partialization, falling outside the middle third at two distinct locations: at the crown (falling below ) and at the upper sidewall (exceeding ). Finally, across all investigated sections, the eccentricity in the invert region remains largely within or very close to the middle third, ensuring a predominantly fully compressed condition at the base of the tunnel.
Direct comparison between the stress results at the intrados (Figure 6a) and those evaluated at the fitting depth of 15 cm in Figure 5 shows how the intrados stress follows a similar patterns to that obtained at the fitting depth, whereas the stress at the extrados may differ significantly. This difference is related to the lining thickness and to the eccentricity resulting from the analysis, as shown in Figure 7.
A comparison of measured and calculated stress states highlights significant spatial variability in loading conditions along the tunnel. The discrepancies in stress distribution can be attributed to several interacting factors, including local fluctuations in soil properties, inherent irregularities in construction history—such as localized variations in lining thickness—the sequence of construction stages, the effectiveness of temporary propping, and the quality of the filling between the lining and the ground. Furthermore, the elevated and f values in some sections (A, B, C, and F) may also be explained by water pressure, which was omitted in the numerical model because of the lack of data.
6.3. Safety Assessment
For the serviceability limit state assessment, the computed stresses were compared with the admissible compressive stresses (), which are 2.1 MPa for solid clay brick masonry and 7.5 MPa for stone masonry (Section 4.2). The analysis shows that is never exceeded in sections D and E. On the contrary, stresses in the brick masonry of sections A, B, C, and F exceed the admissible values.
It can be observed that is typically exceeded in two distinct ways. In the first case (sections A and B), is reached or exceeded at the keystone extrados (4–5.8 MPa) and at the upper arch–sidewall interface (4–4.2 MPa). The compressive strength is also exceeded at the interface between the invert and the sidewall (2.6–3 MPa). However, it should be noted that a concrete foundation block is present in this area and the stress state is not well represented by the simplified model. A second case is observed in sections C and F, where stresses reach 2.8–3.3 MPa at the keystone and 2.9–3.6 MPa at the sidewall-upper arch extrados interface.
It can be seen that stresses exceed the admissible value in several sections. This can be explained by observing that the admissible stress adopted of 2.1 MPa for good quality brick masonry is significantly lower than the value used by the original designers [22] to dimension the solid clay brick masonry linings (3 MPa). To increase the admissible stress a more accurate evaluation of the masonry strength is likely required, better accounting for corrective factors related to moisture effects and thickness of mortar joints. Moreover, the expression appears conservative compared to historical design values. Exceedance of this limit does not necessarily imply insufficient ultimate capacity, but identifies sections requiring more refined investigation using more refined approaches.
It should be noted that high stresses do not necessarily correspond to visible defects in the tunnel sections. For example, sections A and B show no evidence of cracking, but only superficial moisture. In contrast, cracks are observed in sections E and F, in particular at the interface between the sidewall and the haunches, and mainly on one side of the section. These cracks are also associated with superficial moisture. This suggests that in these structures, asymmetric loads could be more critical than high, symmetric stress states.
7. Conclusions
This paper introduces a general simplified procedure for the rapid structural assessment of existing masonry tunnel linings. The objective is to address the current lack of a rapid evaluation method (Level 3) specifically designed for masonry linings. The proposed procedure, called Simplified Approach (SA), revisits and adapts historical design methods by Desimon [22] and Falchi Delitala [23], within a modern assessment-oriented framework. The SA combines graphical statics and the Principle of Virtual Work to determine the thrust line and the corresponding stress state in the lining. While the historical formulation is adapted to assess the vault and sidewalls, an ad hoc equilibrium-based procedure is introduced for the invert arch, allowing the complete lining system to be analyzed.
A key feature of the SA is the calibration of the governing load parameters, namely the height of the loading body () and the horizontal thrust amplification factor (f), against in situ stress measurements. This calibration allows the SA to move from historical design assumptions to an assessment procedure capable of reflecting the actual stress state of existing tunnel linings. The SA is therefore not limited to a specific case study, but can be applied to masonry tunnels with symmetric loading and geometry conditions, provided that suitable information on geometry, materials, ground conditions, and in situ stress measurements is available.
The SA was applied to an existing masonry tunnel built in the 1930s. The comparison between calculated stresses and flat-jack measurements showed that the calibrated model was able to reproduce the main stress trends observed in the investigated sections. The results also highlighted that the actual stress state of historical masonry tunnels may differ significantly from that predicted by original design assumptions. These differences may be attributed to construction irregularities, geometrical variations, long-term stress redistribution, changes in the geomechanical properties of the surrounding ground, and the influence of construction stages.
It should be emphasized that the proposed method performs a serviceability-oriented verification. The calculated stress state is compared to an allowable compressive stress defined from the compressive strength of the masonry, with the aim of limiting undesirable cracking, local crushing, and possible detachment of the masonry units during service conditions. Therefore, exceeding this threshold should not be interpreted as a direct indication of collapse, but as a warning condition requiring more refined investigation.
The SA is intended as a first-level screening tool for the large-scale assessment of existing masonry tunnels. Compared with nonlinear FEM or DEM analyzes, the SA does not require detailed constitutive laws, joint contact properties, mesh sensitivity studies, or staged excavation simulations. Once the geometry, material properties, geotechnical information, and calibration data are available, the procedure can be applied with limited computational effort to several cross-sections along a tunnel alignment. This makes it suitable for preliminary assessments (Level 3 according to [10]), aimed at identifying the sections that require more refined investigations (Level 4 according to [10]).
The main limitations of the method are related to its simplified assumptions. In particular, the SA does not explicitly account for nonlinear masonry behavior, progressive cracking, construction-stage effects, asymmetric loading conditions, or complex soil–structure interaction. Therefore, sections showing these features should be further investigated using advanced numerical models. Within these limits, the proposed method provides a practical and mechanically transparent tool for the preliminary assessment and large-scale management of historical masonry tunnel infrastructure.
Future developments will focus on comparing the proposed Simplified Approach with two- and three-dimensional nonlinear FEM or DEM models, with particular attention to construction-stage effects and soil–structure interaction. The application of the procedure to a broader set of masonry tunnels will also be necessary to further assess its robustness, range of applicability, and transferability to different structural typologies and regulatory contexts.
Funding
This research received no external funding.
Data Availability Statement
The raw data supporting the conclusions of this article will be made available by the authors on request.
Acknowledgments
During the preparation of this manuscript/study, the author used Gemini 3.5 Flash (free version), DeepL Translate (free version), and Grammarly Pro for the purposes of improving the readability, grammar, and academic expression of the manuscript. After using this tool/service, the author reviewed and edited the output and takes full responsibility for the content of this publication.
Conflicts of Interest
The author declares no conflicts of interest.
References
- Idris, J.; Verdel, T.; Al-Heib, M. Numerical modelling and mechanical behaviour analysis of ancient tunnel masonry structures. Tunn. Undergr. Space Technol. 2008, 23, 251–263. [Google Scholar] [CrossRef] [Scilit]
- Chiu, Y.C.; Wang, T.T.; Huang, T.H. Investigating continual damage of a nineteenth century masonry tunnel. Proc. Inst. Civ. Eng.-Forensic Eng. 2014, 167, 109–118. [Google Scholar] [CrossRef] [Scilit]
- Moreno Regan, O.; Bourgeois, E.; Douroux, J. On the stability of underground masonry vaults: The case of the mairie d’ivry station of the Paris Metro. Int. J. Archit. Herit. 2023, 17, 190–211. [Google Scholar] [CrossRef] [Scilit]
- Hosseini, Y.; Karami Mohammadi, R.; Yang, T.Y. Seismic Vulnerability Assessment and Prioritization of Masonry Railway Tunnels: A Case Study. Infrastructures 2025, 10, 254. [Google Scholar] [CrossRef] [Scilit]
- Grossauer, K.; Modetta, F.; Tanner, U. The “Standard Tunnel Construction Method” of Rhaetian Railways: Die „Normalbauweise Tunnel” der Rhätischen Bahn. Geomech. Tunn. 2017, 10, 542–550. [Google Scholar] [CrossRef] [Scilit]
- Fava, A.; Ghidoli, M.; Carli, L.; Galvanin, P. Refitting strategies for Italian historical railway tunnels. In Tunnels and Underground Cities. Engineering and Innovation Meet Archaeology, Architecture and Art; CRC Press: Boca Raton, FL, USA, 2019; pp. 2071–2080. [Google Scholar]
- Alessio, C.; Attianese, G.; Chiaia, B.M.; Coïsson, E.; Ferrari, L.; Ferretti, D.; Pittalis, R.; Zanazzi, E. Structural safety of existing masonry-tunnel-linings: A methodology derived from existing buildings approaches. Procedia Struct. Integr. 2024, 62, 1120–1127. [Google Scholar] [CrossRef] [Scilit]
- Alessio, C.; Pittalis, R.; Attianese, G.; Chiaia, B.; Ferretti, D.; Zanazzi, E.; Ferrari, L.; Coisson, E. Conservative rehabilitation interventions of masonry highway tunnels along the historic Genoa Po Valley Motorway in Genoa (Italy). In Proceedings of the Tunnelling for a Better Life: Proceedings of the ITA-AITES World Tunnel Congress (WTC 2024); CRC Press: Boca Raton, FL, USA, 2024; pp. 3312–3319. Available online: https://hdl.handle.net/11578/364376 (accessed on 3 July 2026).
- Dal Piaz, G.V.; Argentieri, A. 150 years of plans, geological survey and drilling for the Fréjus to Mont Blanc tunnels across the Alpine chain: An historical review. Ital. J. Geosci. 2021, 140, 169–204. [Google Scholar] [CrossRef] [Scilit]
- CSLP. Linee Guida per la Classificazione e Gestione del Rischio, la Valutazione Della Sicurezza ed il Monitoraggio Delle Gallerie Esistenti; Technical Report; Ministero delle Infrastrutture e dei Trasporti, Consiglio Superiore dei Lavori Pubblici (CSLP): Rome, Italy, 2022. [Google Scholar]
- Kamel, T.; Limam, A.; Silvani, C. Modeling the degradation of old subway galleries using a continuum approach. Tunn. Undergr. Space Technol. 2015, 48, 77–93. [Google Scholar] [CrossRef] [Scilit]
- Idris, J.; Al-Heib, M.; Verdel, T. Numerical modelling of masonry joints degradation in built tunnels. Tunn. Undergr. Space Technol. 2009, 24, 617–626. [Google Scholar] [CrossRef] [Scilit]
- Behnen, G.; Nevrly, T.; Fischer, O. Soil-structure interaction in tunnel lining analyses. Geotechnik 2015, 38, 96–106. [Google Scholar] [CrossRef] [Scilit]
- Roca, P.; Cervera, M.; Gariup, G.; Pela’, L. Structural analysis of masonry historical constructions. Classical and advanced approaches. Arch. Comput. Methods Eng. 2010, 17, 299–325. [Google Scholar] [CrossRef] [Scilit]
- D’altri, A.M.; Sarhosis, V.; Milani, G.; Rots, J.; Cattari, S.; Lagomarsino, S.; Sacco, E.; Tralli, A.; Castellazzi, G.; De Miranda, S. Modeling Strategies for the Computational Analysis of Unreinforced Masonry Structures: Review and Classification: AM D’Altri et al. Arch. Comput. Methods Eng. 2020, 27, 1153–1185. [Google Scholar] [CrossRef] [Scilit]
- Heyman, J. The Stone Skeleton: Structural Engineering of Masonry Structures; Cambridge University Press: Cambridge, UK, 1995. [Google Scholar]
- Marmo, F.; Rosati, L. Reformulation and extension of the thrust network analysis. Comput. Struct. 2017, 182, 104–118. [Google Scholar] [CrossRef] [Scilit]
- Maia Avelino, R.; Van Mele, T.; Block, P. Thrust network analysis for masonry assessment. In Discrete Computational Mechanics of Masonry Structures; Springer: Berlin/Heidelberg, Germany, 2023; pp. 165–188. [Google Scholar]
- Lemos, J.V. Discrete element modeling of masonry structures. Int. J. Archit. Herit. 2007, 1, 190–213. [Google Scholar] [CrossRef] [Scilit]
- Cannizzaro, F.; Pantò, B.; Caddemi, S.; Caliò, I. A Discrete Macro-Element Method (DMEM) for the nonlinear structural assessment of masonry arches. Eng. Struct. 2018, 168, 243–256. [Google Scholar] [CrossRef] [Scilit]
- Boni, C.; Ferretti, D.; Lenticchia, E. Effects of brick pattern on the static behavior of masonry vaults. Int. J. Archit. Herit. 2022, 16, 1199–1219. [Google Scholar] [CrossRef] [Scilit]
- Desimon, V. Costruzione Delle Gallerie; Ulrico Hoepli: Milan, Italy, 1939. [Google Scholar]
- Falchi Delitala, G. Calcolo Dei Rivestimenti Delle Gallerie; A. P. E.-Arti Poligrafiche Editoriali: Genova, Italy, 1971. [Google Scholar]
- Culmann, K. Die Graphische Statik; Meyer & Zeller: Zürich, Switzerland, 1866. [Google Scholar]
- Curioni, G. L’arte Del Fabbricare; Augusto Federico Negro: Torino, Italy, 1872. [Google Scholar]
- Heim, A. Mechanismus Der Gebirgsbildung; Benno Schwabe: Basel, Switzerland, 1878. [Google Scholar]
- Ritter, W. Statik Der Tunnelgewölbe; Springer: Berlin/Heidelberg, Germany, 1879. [Google Scholar]
- Gröeger, J. Statik der Tunnelgewölbe. In Druckreichem Gebirge; H. Dominicus: Prague, Czech Republic, 1881. [Google Scholar]
- Engesser, F. Über den Erddruck gegen innere Stützwände (Tunnelwände). Dtsch. Bauztg. 1882, 36, 397–416. [Google Scholar]
- Janssen, H.A. Versuche über Getreidedruck in Silozellen. Z. Ver. Dtsch. Ing. 1895, 39, 1045–1049. [Google Scholar]
- Kirsch, E.G. Die Theorie der Elastizität und die Bedürfnisse der Festigkeitslehre. Z. Ver. Dtsch. Ing. 1898, 42, 797–807. [Google Scholar]
- Kommerell, O. Statische Berechnung Von Tunnelmauerwerk; Wilhelm Ernst & Sohn: Berlin, Germay, 1912. [Google Scholar]
- Corini, F. Statica Dei Rivestimenti Delle Gallerie; Rivista tecnica delle ferrovie Italiane: Roma, Italy, 1936. [Google Scholar]
- Giovannini, M. Esame critico dei metodi di calcolo per il rivestimento delle gallerie. L’ingegnere 1936, 3, 121–138. [Google Scholar]
- Steiner, W.; Einstein, H.H. Improved Design of Tunnel Supports: Volume 5-Empirical Methods in Rock Tunneling–Review 782 and Recommendations; Technical Report; Urban Mass Transportation Administration: Washington, DC, USA, 1980. [Google Scholar] [CrossRef] [PubMed]
- Terzaghi, K. Theoretical Soil Mechanics; John Wiley & Sons: New York, NY, USA, 1943. [Google Scholar]
- Proctor, R.V.; White, T.L. Rock Tunneling with Steel Supports; Terzaghi, K., Ed.; Commercial Shearing and Stamping Co.: Youngstown, OH, USA, 1946. [Google Scholar]
- Caquot, A.; Kérisel, J. Traité de Mécanique Des Sols; Gauthier-Villars: Paris, France, 1956. [Google Scholar]
- Lotti, C. Spinta delle terre sulle opere e gallerie. Riv. Geotec. Ital. 1958, 4, 209–214. [Google Scholar]
- Lunardi, P. Design and Construction of Tunnels: Analysis of Controlled Deformation in Rocks and Soils (ADECO-RS); Springer: Berlin/Heidelberg, Germany, 2008. [Google Scholar] [CrossRef] [Scilit]
- Società Italiana Gallerie (SIG). The Italian Art of Tunnelling 2024; Monografia Pubblicata in Occasione del 50° Anniversario SIG/ITA; Società Italiana Gallerie: Milano, Italy, 2024. [Google Scholar]
- Vescovi, M.; Sorrentino, G.; Baccolini, L.; Culotta, M.; Gazzola, S.; Chiaia, B.; Ferretti, D.; Lenticchia, E. Two-tiered approach for the structural assessment of old masonry tunnel linings. Proceedings of FABRE26 Conference. Procedia Struct. Integr. 2026; in press.
- Sorrentino, G.; Borghi, A.; Vescovi, M.; Baccolini, L.; Culotta, M.; Gazzola, S.; Chiaia, B.; Ferretti, D.; Lenticchia, E. A comparison of arch-thrust line methods used in the past for designing masonry tunnel linings. Proceedings of FABRE26 Conference. Procedia Struct. Integr. 2026; in press.
- Sorrentino, G.; Chiaia, B.; Lenticchia, E.; Vescovi, M.; Ferretti, D.; Baccolini, L.; Culotta, M.; Gazzola, S. Traditional and modern approaches for the structural safety of masonry-tunnel-linings. In Proceedings of the Tunnelling for a Better Life: Proceedings of the ITA-AITES World Tunnel Congress (WTC 2026); CRC Press: Boca Raton, FL, USA, 2026. [Google Scholar]
- EN 1996-1-1 (Eurocode 6); Design of Masonry Structures: Part 1-1: General Rules for Reinforced and Unreinforced Masonry Structures. European Committee for Standardization: Brussels, Belgium, 2022.
- TMS 402/602-22; Building Code Requirements and Specification for Masonry Structures. The Masonry Society: Longmont, CO, USA, 2022.
- Kaushik, H.B.; Rai, D.C.; Jain, S.K. Stress-strain characteristics of clay brick masonry under uniaxial compression. J. Mater. Civ. Eng. ASCE 2007, 19, 728–739. [Google Scholar] [CrossRef] [Scilit]
- Cabané, A.; Pelà, L.; Roca, P. Anisotropy and compressive strength evaluation of solid fired clay bricks by testing small specimens. Constr. Build. Mater. 2022, 344, 128195. [Google Scholar] [CrossRef] [Scilit]
- EN 772-1:2011+A1; Methods of Test for Masonry Units—Part 1: Determination of Compressive Strength. CEN: Brussels, Belgium, 2015.
- Cabané, A.; Pelà, L.; Roca, P. Laboratory and in-situ mechanical characterisation of masonry components by comparing destructive and minor destructive testing techniques. Constr. Build. Mater. 2024, 411, 134474. [Google Scholar]
- CSLLPP. Istruzioni per L’applicazione Dell’ «Aggiornamento Delle “Norme Tecniche per Le Costruzioni”» di cui al Decreto Ministeriale 17 Gennaio 2018, Circolare 21/01/2019 N. 7 C.S.LL.PP.; CSLLPP: Rome, Italy, 2019. [Google Scholar]
- Matysek, P.; Witkowski, M. Moisture impact on compressive strength and deformability of brick masonry. Sci. Rep. 2026, 16, 5147. [Google Scholar] [CrossRef] [Scilit] [PubMed]
- Sathiparan, N.; Rumeshkumar, U. Effect of moisture condition on mechanical behavior of low strength brick masonry. J. Build. Eng. 2018, 17, 23–31. [Google Scholar] [CrossRef] [Scilit]
- Hendry, A.W.; Sinha, B.P.; Davies, S.R. Design of Masonry Structures; CRC Press: Boca Raton, FL, USA, 2017. [Google Scholar]
- Alecci, V.; Ayala, A.; De Stefano, M.; Marra, A.; Nudo, R.; Stipo, G. Influence of the masonry wall thickness on the outcomes of double flat-jack test: Experimental and numerical investigation. Constr. Build. Mater. 2021, 285, 122912. [Google Scholar] [CrossRef] [Scilit]
- Singer, S.; Nelder, J.A. Nelder–Mead algorithm. Scholarpedia 2009, 4, 2928. [Google Scholar] [CrossRef] [Scilit]

Disclaimer/Publisher’s Note: The statements, opinions and data contained in all publications are solely those of the individual author(s) and contributor(s) and not of MDPI and/or the editor(s). MDPI and/or the editor(s) disclaim responsibility for any injury to people or property resulting from any ideas, methods, instructions or products referred to in the content. |
© 2026 by the author. Licensee MDPI, Basel, Switzerland. This article is an open access article distributed under the terms and conditions of the Creative Commons Attribution (CC BY) license.